Cambridge A Level Geography 9696 — 2016 Oct/Nov Paper 1 · Variant 3
9696/13/O/N/16 · 100 marks · ≈113 min
The question paper and its mark scheme, free to read here and free to download. This is Cambridge’s own paper, exactly as it was sat.
Question paper8 pages



Mark scheme15 pages
Answers below. Sit the paper first if you are practising.



Paper as text
Question paper, page 1
This document consists of 5 printed pages, 3 blank pages and 2 Inserts. DC (ST) 113757/2 © UCLES 2016 [Turn over Cambridge International Examinations Cambridge International Advanced Subsidiary and Advanced Level * 2 3 8 1 8 1 3 5 8 0 * GEOGRAPHY 9696/13 Paper 1 Core Geography October/November 2016 3 hours No Additional Materials are required. READ THESE INSTRUCTIONS FIRST An answer booklet is provided inside this question paper. You should follow the instructions on the front cover of the answer booklet. If you need additional answer paper ask the invigilator for a continuation booklet. Section A Answer five questions. Section B Answer one question. Section C Answer one question. Sketch maps and diagrams should be drawn whenever they serve to illustrate an answer. All the Figures and the Table referred to in the questions are contained in the Insert. The number of marks is given in brackets [ ] at the end of each question or part question.
Question paper, page 2
2 9696/13/O/N/16 © UCLES 2016 Section A Answer five questions from this section. All questions carry 10 marks. Hydrology and fluvial geomorphology 1 Fig. 1 shows some components of the hydrological cycle for a forested area and an urban area. (a) Describe the main differences in the flows between the forested area and the urban area shown in Fig. 1. [4] (b) Explain the differences you identified in (a). [6] Atmosphere and weather 2 Fig. 2 shows the pattern of temperatures for an urban area. (a) Describe the pattern of temperatures shown in Fig. 2. [4] (b) Suggest reasons for the pattern you identified in (a). [6] Rocks and weathering 3 Fig. 3 shows some processes and features of mass movements. (a) Identify: (i) mass movement A; [1] (ii) mass movement B; [1] (iii) mass movement C; [1] (iv) feature D. [1] (b) Briefly explain how human activities can both increase and decrease mass movements on slopes. [6]
Question paper, page 3
3 9696/13/O/N/16 © UCLES 2016 [Turn over Population 4 Fig. 4 shows, for the USA in 2012, the age structure of the Native American population and the age structure of the total population. (a) Identify the largest age group amongst the Native American population. [1] (b) Compare the age structure of the Native American population with that of the total population, supporting your response with data from Fig. 4. [5] (c) Suggest how periods of higher birth rates in a country may be explained. [4] Migration 5 Fig. 5 shows remittance inflows to Kenya, an LEDC in Africa, 1975–2012. (a) State the total remittance inflow to Kenya in 1999 shown in Fig. 5. [1] (b) Compare the trends in remittance inflows for 1975–90 and 2003–12, supporting your response with data from Fig. 5. [4] (c) Explain some of the negative impacts on LEDCs of emigration. [5] Population / Migration / Settlement dynamics 6 Table 1 shows predictions of the top 5 cities in the world in 2025 using 5 different measures. (a) State the predictions for New York in Table 1. [2] (b) Using evidence from Table 1, will Tokyo or Shanghai be the world’s top city in 2025? [3] (c) Suggest reasons why the top 5 cities in terms of population under 15 years of age are all predicted to be in LEDCs and NICs. [5]
Question paper, page 4
4 9696/13/O/N/16 © UCLES 2016 Section B: The Physical Core Answer one question from this section. All questions carry 25 marks. Hydrology and fluvial geomorphology 7 (a) (i) Define the fluvial terms abrasion and saltation. [4] (ii) Describe turbulent flow and briefly explain how it occurs in a river channel. [3] (b) With the aid of diagrams, explain the formation of waterfalls and deltas. [8] (c) ‘Meanders are the result of helicoidal flow.’ How far do you agree? [10] Atmosphere and weather 8 (a) (i) Define the atmospheric terms high pressure and orographic uplift of air. [4] (ii) Briefly explain how atmospheric pressure influences wind direction and strength. [3] (b) Explain how fog and temperature inversions are affected by local energy budgets. [8] (c) ‘The only climatic impact of human activity is global warming.’ How far do you agree with this statement? [10] Rocks and weathering 9 (a) (i) Define the terms sea floor spreading and island arcs. [4] (ii) Briefly explain the process of subduction. [3] (b) For either granite or limestone, explain how physical structure and chemical composition of the rock influences its weathering. [8] (c) ‘Volcanic activity occurs at all tectonic plate margins.’ How far do you agree? [10]
Question paper, page 5
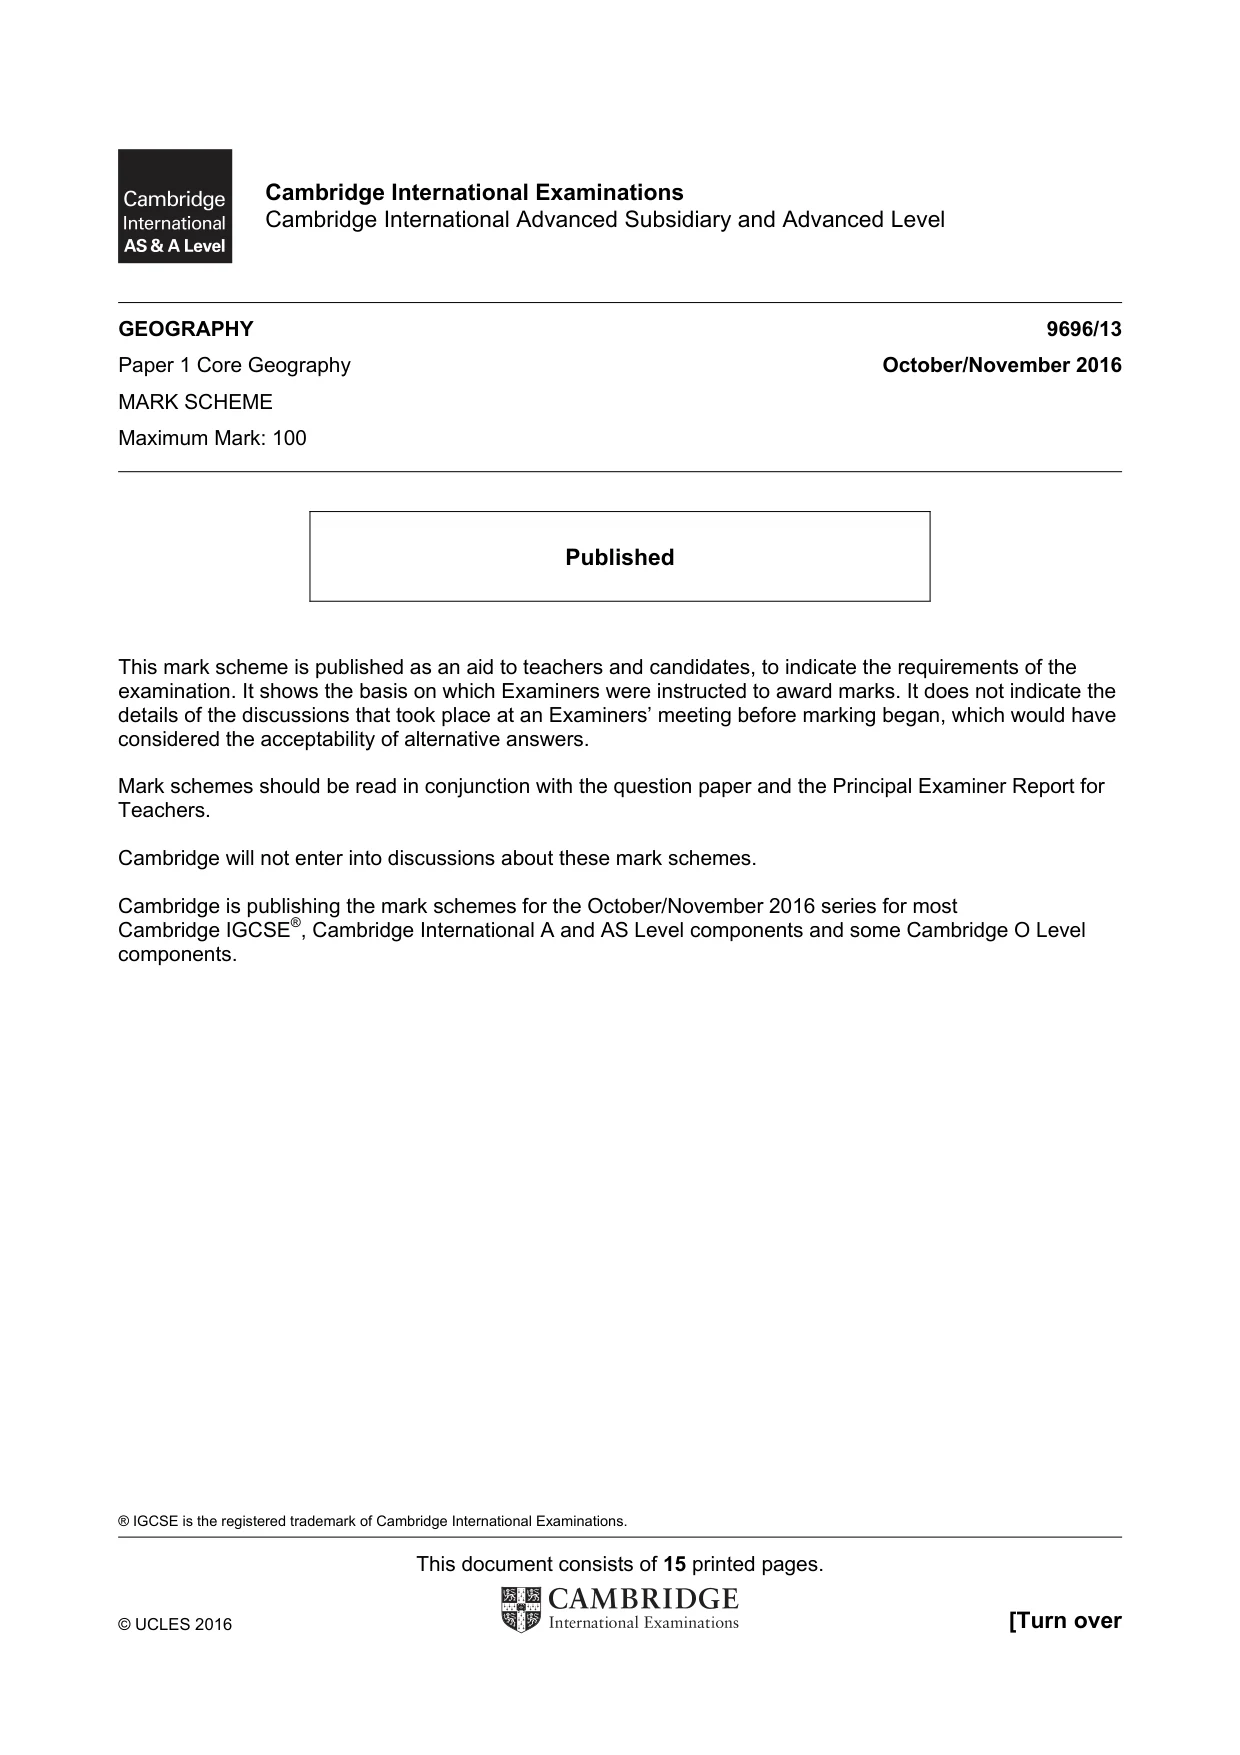
5 9696/13/O/N/16 © UCLES 2016 Section C: The Human Core Answer one question from this section. All questions carry 25 marks. Population 10 For one country’s population policy on natural increase: (a) explain why the government introduced a population policy; [7] (b) describe government attempts at managing natural increase; [8] (c) assess the success of the attempts you described in (b). [10] Population / Migration / Settlement dynamics 11 (a) (i) Define the terms push factor and pull factor and give an example of each. [4] (ii) Briefly explain how constraints may affect migration. [3] (b) Outline the causes and impacts of migration within urban settlements (intra-urban migration). [8] (c) Assess the impacts of rural-urban migration on the rural source areas. [10] Settlement dynamics 12 (a) Define the term spatial competition and explain how spatial competition occurs within urban settlements. [7] (b) With reference to one or more urban settlements, describe how and explain why the location of retailing has changed. [8] (c) Explain why it is difficult for urban authorities to manage shanty towns (squatter settlements). [10]
Question paper, page 6
6 9696/13/O/N/16 © UCLES 2016 BLANK PAGE
Question paper, page 7
7 9696/13/O/N/16 © UCLES 2016 BLANK PAGE
Question paper, page 8
8 9696/13/O/N/16 © UCLES 2016 BLANK PAGE Permission to reproduce items where third-party owned material protected by copyright is included has been sought and cleared where possible. Every reasonable effort has been made by the publisher (UCLES) to trace copyright holders, but if any items requiring clearance have unwittingly been included, the publisher will be pleased to make amends at the earliest possible opportunity. To avoid the issue of disclosure of answer-related information to candidates, all copyright acknowledgements are reproduced online in the Cambridge International Examinations Copyright Acknowledgements Booklet. This is produced for each series of examinations and is freely available to download at www.cie.org.uk after the live examination series. Cambridge International Examinations is part of the Cambridge Assessment Group. Cambridge Assessment is the brand name of University of Cambridge Local Examinations Syndicate (UCLES), which is itself a department of the University of Cambridge.
Mark scheme, page 1
® IGCSE is the registered trademark of Cambridge International Examinations. This document consists of 15 printed pages. © UCLES 2016 [Turn over Cambridge International Examinations Cambridge International Advanced Subsidiary and Advanced Level GEOGRAPHY 9696/13 Paper 1 Core Geography October/November 2016 MARK SCHEME Maximum Mark: 100 Published This mark scheme is published as an aid to teachers and candidates, to indicate the requirements of the examination. It shows the basis on which Examiners were instructed to award marks. It does not indicate the details of the discussions that took place at an Examiners’ meeting before marking began, which would have considered the acceptability of alternative answers. Mark schemes should be read in conjunction with the question paper and the Principal Examiner Report for Teachers. Cambridge will not enter into discussions about these mark schemes. Cambridge is publishing the mark schemes for the October/November 2016 series for most Cambridge IGCSE®, Cambridge International A and AS Level components and some Cambridge O Level components.
Mark scheme, page 2
Page 2 Mark Scheme Syllabus Paper Cambridge International AS/A Level – October/November 2016 9696 13 © UCLES 2016 Section A Hydrology and fluvial geomorphology 1 Fig. 1 shows some components of the hydrological cycle for a forested area and an urban area. (a) Describe the main differences in the flows between the forested area and the urban area shown in Fig. 1. [4] Precipitation amounts are the same but all the other flows vary. The main contrast is a fairly ‘normal’ set of flows for the rural slope but with all subsurface flows curtailed for the urban slope. Most of the water in the urban area flows over the surface with reduced transpiration. Four sensible points are all that is required such as: For urban: • less evapotranspiration • more overland flow • less percolation • less through flow • less groundwater flow • more water diverted through drains For rural, the above list will be reversed. Any four for full marks. (b) Explain the differences you identified in (a). [6] Explanation will be the basic difference in land use, especially vegetation or lack of it, and impermeable or permeable surfaces. Good answers will need to describe and explain the rural and urban factors with a balanced treatment. References to three differences for 6 marks. Atmosphere and weather 2 Fig. 2 shows the pattern of temperatures for an urban area. (a) Describe the pattern of temperatures shown in Fig. 2. [4] There needs to be use of the numerical data. If no data, then maximum 3 marks. The core area of high temperature corresponding to the highest density of buildings should be pointed out, and then the elongated extension of the built up area. The main points that might be considered are: • high density, high temperature • sudden change of temperature on left • gradual temperature transition on the right (elongated pattern) Use of data: 1 mark.
Mark scheme, page 3
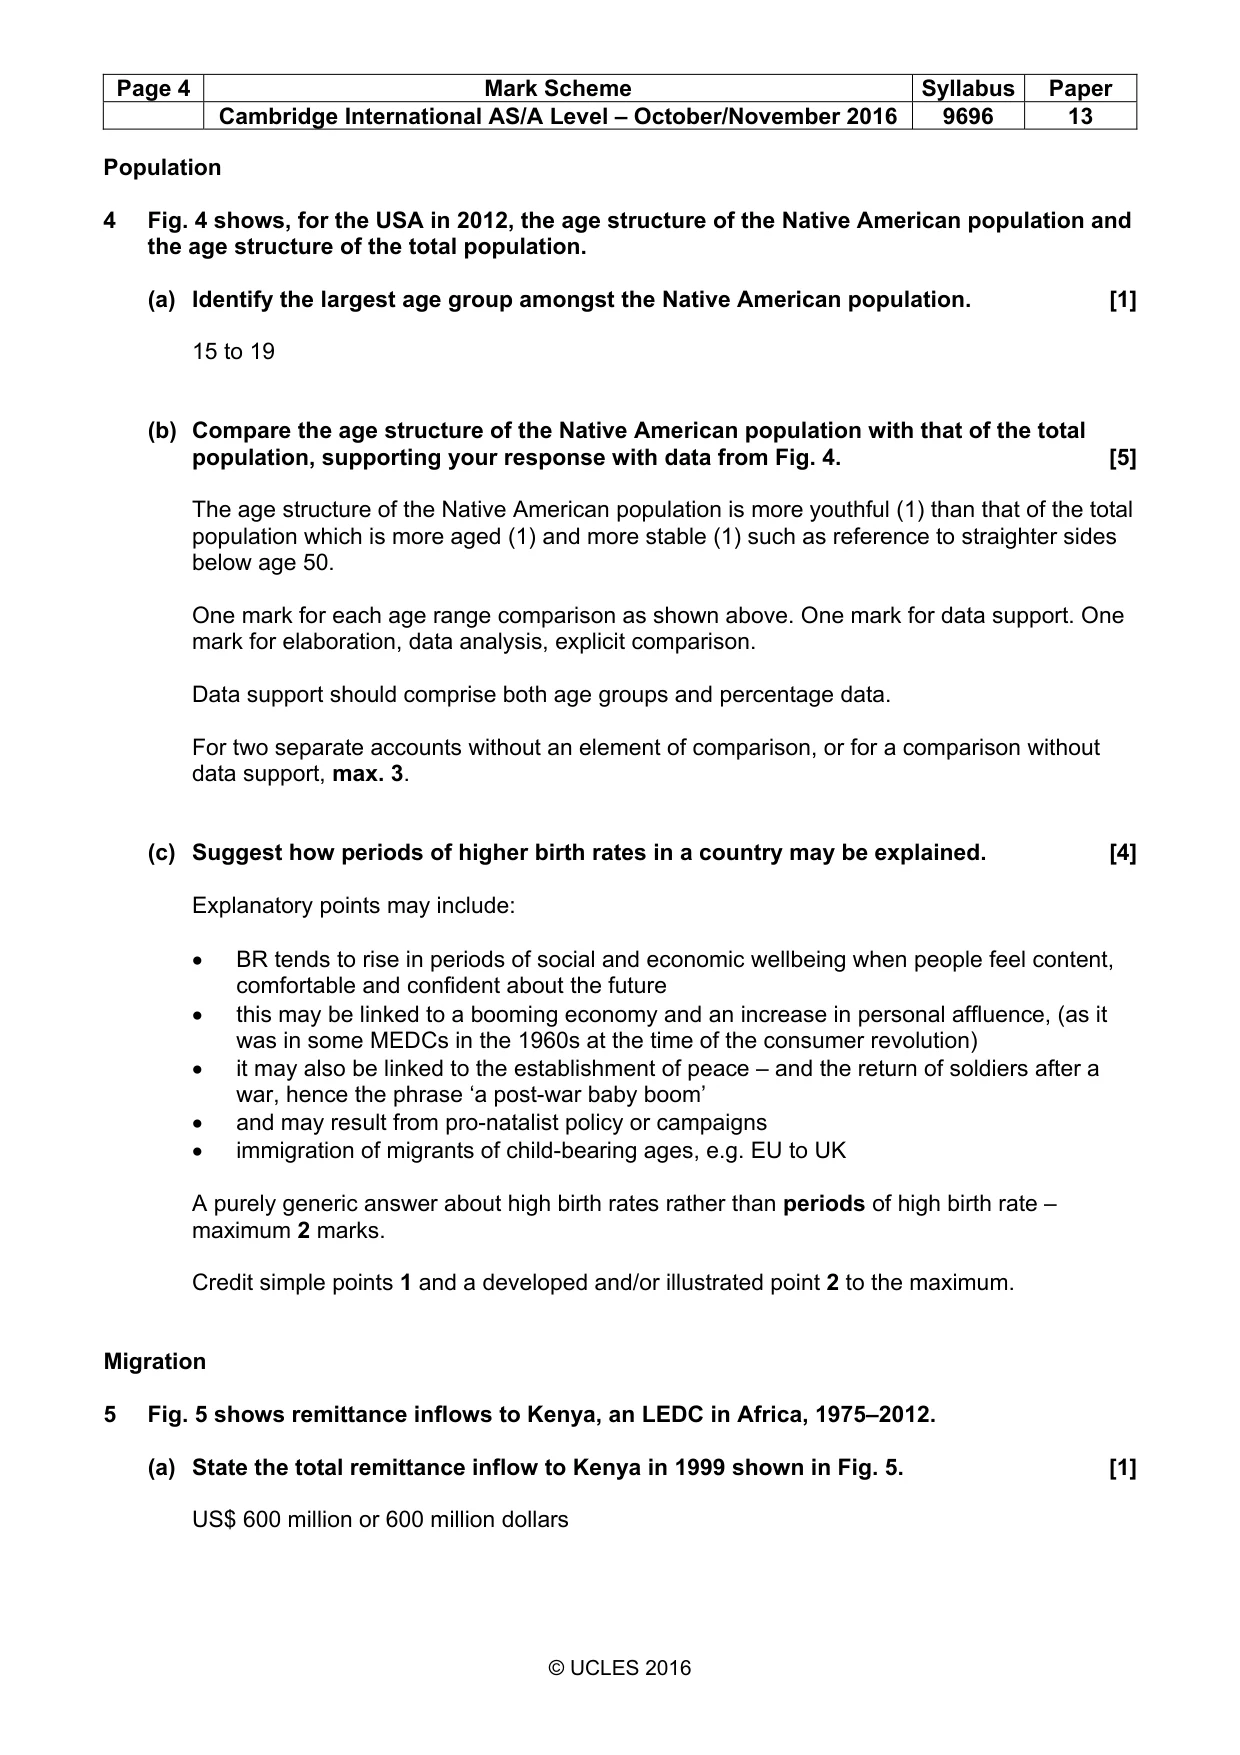
Page 3 Mark Scheme Syllabus Paper Cambridge International AS/A Level – October/November 2016 9696 13 © UCLES 2016 (b) Suggest reasons for the pattern you identified in (a). [6] This is the classic urban heat island and will be explained in the usual way. A couple of high rise buildings extend the zone of higher temperatures. Better candidates might note the chimney as being significant but it is not essential for a good answer. Thus the albedo effect, absorption by dark surface and re-radiation at night, protection from wind, as well as anthropogenic heat production should be mentioned. A purely generic answer not related to the figure – maximum 4 marks. A reference to global warming should not be credited. Rocks and weathering 3 Fig. 3 shows some processes and features of mass movements. (a) Identify: (i) mass movement A; [1] rock fall / rock slide (ii) mass movement B; [1] debris flow / mud flow (iii) mass movement C; [1] slump, rotational slip / slide (iv) feature D. [1] scar, back scarp, slip plane, free face, cliff face (b) Briefly explain how human activities can both increase and decrease mass movements on slopes. [6] Increase may be from deforestation, building on slopes, slope foot excavation such as cuttings or quarrying, cut and fill for roads along slopes, cultivation and grazing. Candidates might digress into soil erosion, slope wash, etc., especially when mentioning deforestation. This is not mass movement. Decrease may be the simple opposite of some of these factors and will indicate the weaker responses. Positive measures might be terracing, contour ploughing, planning controls, drainage pinning, rock bolts, fencing. Explanation is required but the command word is ‘briefly’, so do not expect lengthy explanations. Ideally, marks should be 3/3 but can be 2/4 or 4/2 depending on the respective balance.
Mark scheme, page 4
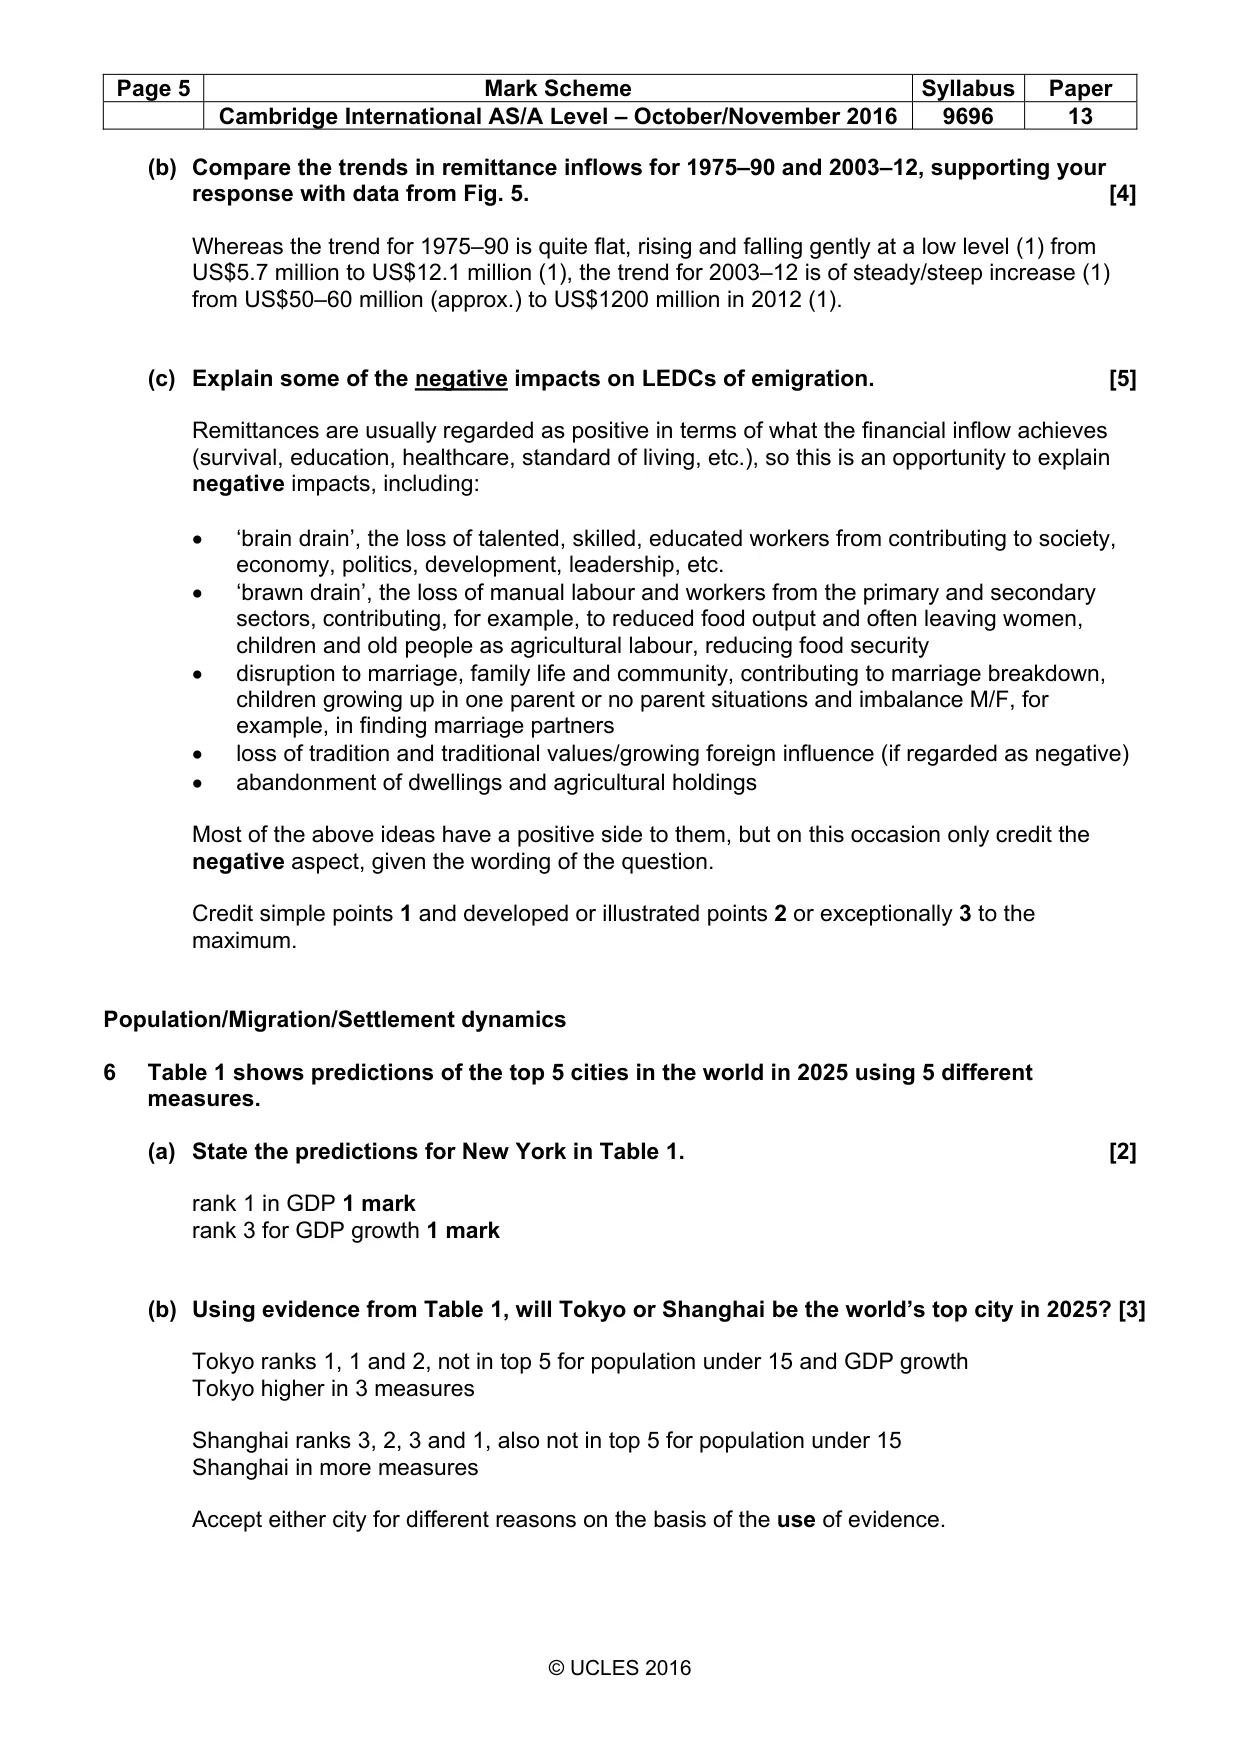
Page 4 Mark Scheme Syllabus Paper Cambridge International AS/A Level – October/November 2016 9696 13 © UCLES 2016 Population 4 Fig. 4 shows, for the USA in 2012, the age structure of the Native American population and the age structure of the total population. (a) Identify the largest age group amongst the Native American population. [1] 15 to 19 (b) Compare the age structure of the Native American population with that of the total population, supporting your response with data from Fig. 4. [5] The age structure of the Native American population is more youthful (1) than that of the total population which is more aged (1) and more stable (1) such as reference to straighter sides below age 50. One mark for each age range comparison as shown above. One mark for data support. One mark for elaboration, data analysis, explicit comparison. Data support should comprise both age groups and percentage data. For two separate accounts without an element of comparison, or for a comparison without data support, max. 3. (c) Suggest how periods of higher birth rates in a country may be explained. [4] Explanatory points may include: • BR tends to rise in periods of social and economic wellbeing when people feel content, comfortable and confident about the future • this may be linked to a booming economy and an increase in personal affluence, (as it was in some MEDCs in the 1960s at the time of the consumer revolution) • it may also be linked to the establishment of peace – and the return of soldiers after a war, hence the phrase ‘a post-war baby boom’ • and may result from pro-natalist policy or campaigns • immigration of migrants of child-bearing ages, e.g. EU to UK A purely generic answer about high birth rates rather than periods of high birth rate – maximum 2 marks. Credit simple points 1 and a developed and/or illustrated point 2 to the maximum. Migration 5 Fig. 5 shows remittance inflows to Kenya, an LEDC in Africa, 1975–2012. (a) State the total remittance inflow to Kenya in 1999 shown in Fig. 5. [1] US$ 600 million or 600 million dollars
Mark scheme, page 5
Page 5 Mark Scheme Syllabus Paper Cambridge International AS/A Level – October/November 2016 9696 13 © UCLES 2016 (b) Compare the trends in remittance inflows for 1975–90 and 2003–12, supporting your response with data from Fig. 5. [4] Whereas the trend for 1975–90 is quite flat, rising and falling gently at a low level (1) from US$5.7 million to US$12.1 million (1), the trend for 2003–12 is of steady/steep increase (1) from US$50–60 million (approx.) to US$1200 million in 2012 (1). (c) Explain some of the negative impacts on LEDCs of emigration. [5] Remittances are usually regarded as positive in terms of what the financial inflow achieves (survival, education, healthcare, standard of living, etc.), so this is an opportunity to explain negative impacts, including: • ‘brain drain’, the loss of talented, skilled, educated workers from contributing to society, economy, politics, development, leadership, etc. • ‘brawn drain’, the loss of manual labour and workers from the primary and secondary sectors, contributing, for example, to reduced food output and often leaving women, children and old people as agricultural labour, reducing food security • disruption to marriage, family life and community, contributing to marriage breakdown, children growing up in one parent or no parent situations and imbalance M/F, for example, in finding marriage partners • loss of tradition and traditional values/growing foreign influence (if regarded as negative) • abandonment of dwellings and agricultural holdings Most of the above ideas have a positive side to them, but on this occasion only credit the negative aspect, given the wording of the question. Credit simple points 1 and developed or illustrated points 2 or exceptionally 3 to the maximum. Population/Migration/Settlement dynamics 6 Table 1 shows predictions of the top 5 cities in the world in 2025 using 5 different measures. (a) State the predictions for New York in Table 1. [2] rank 1 in GDP 1 mark rank 3 for GDP growth 1 mark (b) Using evidence from Table 1, will Tokyo or Shanghai be the world’s top city in 2025? [3] Tokyo ranks 1, 1 and 2, not in top 5 for population under 15 and GDP growth Tokyo higher in 3 measures Shanghai ranks 3, 2, 3 and 1, also not in top 5 for population under 15 Shanghai in more measures Accept either city for different reasons on the basis of the use of evidence.
Mark scheme, page 6
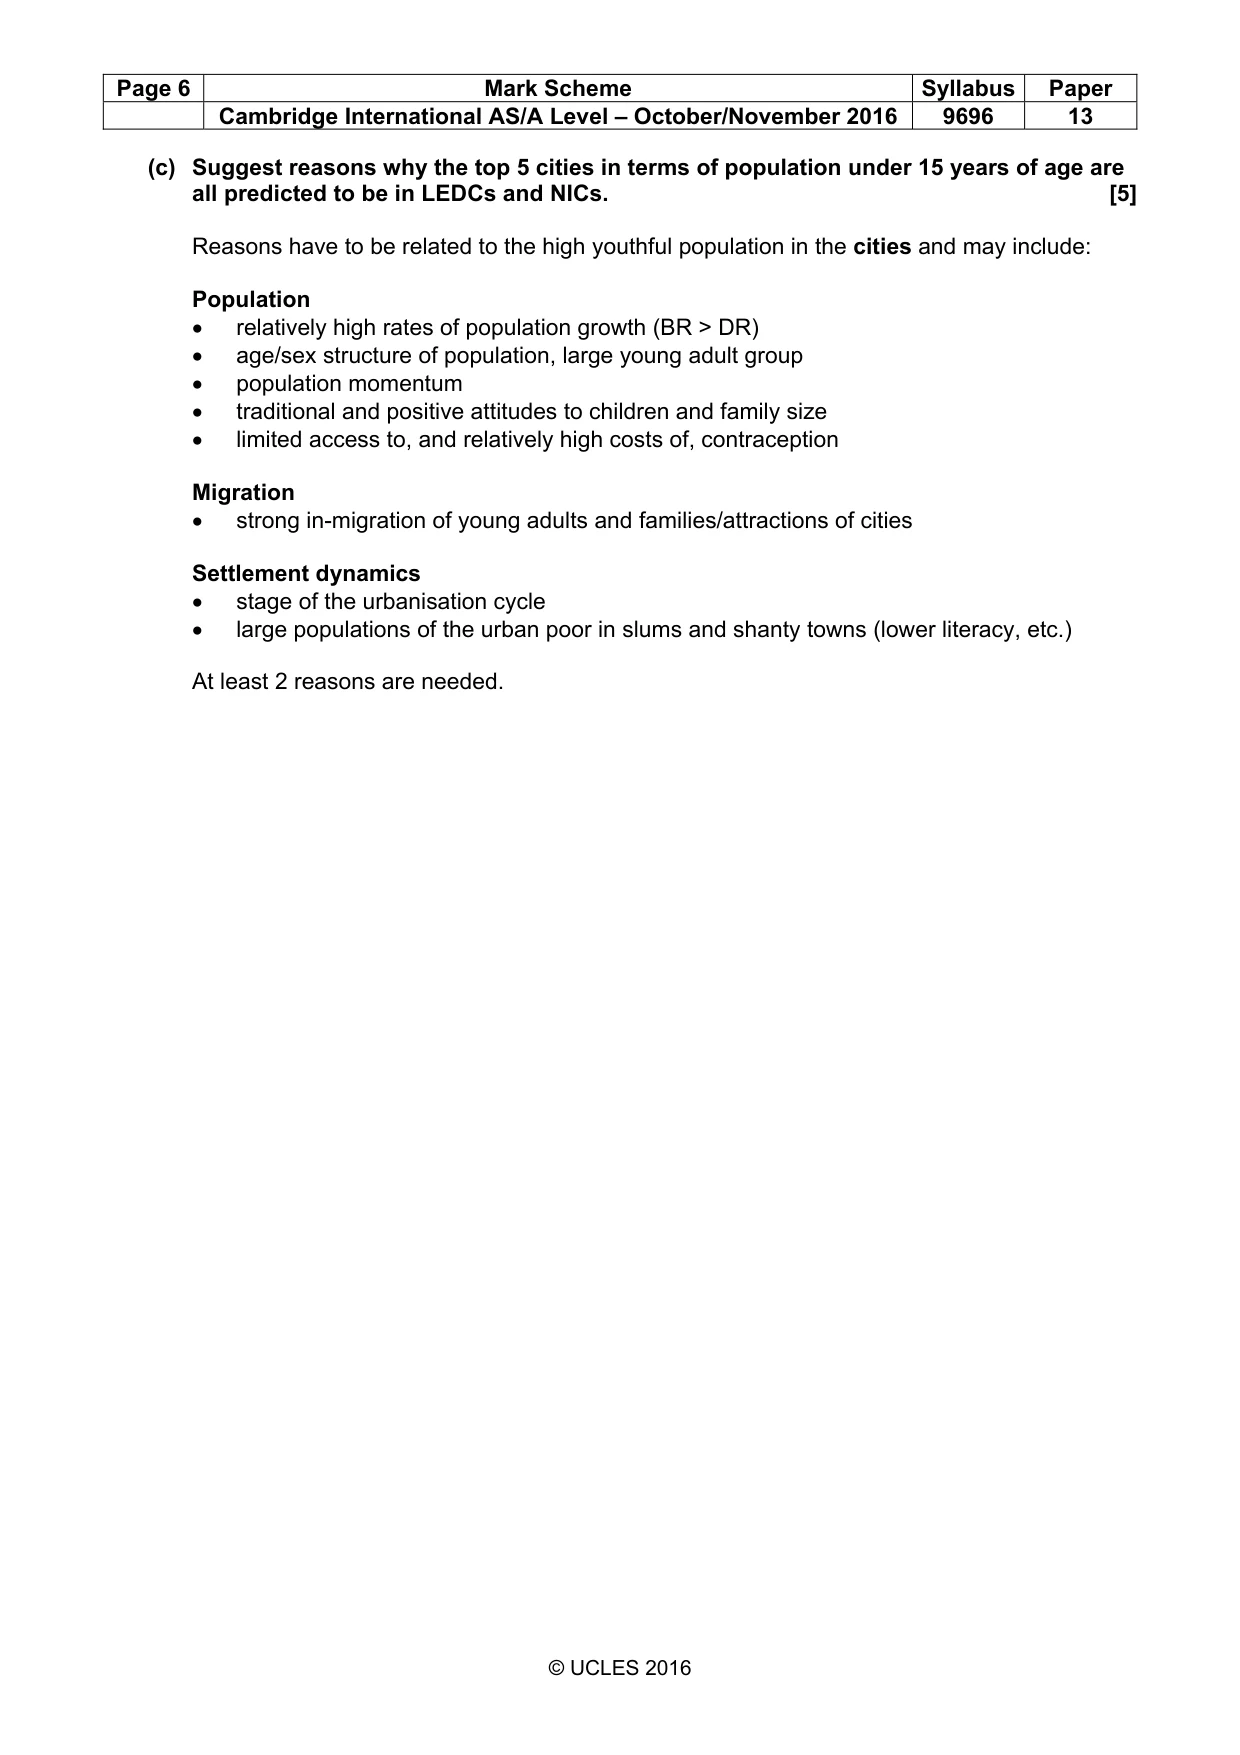
Page 6 Mark Scheme Syllabus Paper Cambridge International AS/A Level – October/November 2016 9696 13 © UCLES 2016 (c) Suggest reasons why the top 5 cities in terms of population under 15 years of age are all predicted to be in LEDCs and NICs. [5] Reasons have to be related to the high youthful population in the cities and may include: Population • relatively high rates of population growth (BR > DR) • age/sex structure of population, large young adult group • population momentum • traditional and positive attitudes to children and family size • limited access to, and relatively high costs of, contraception Migration • strong in-migration of young adults and families/attractions of cities Settlement dynamics • stage of the urbanisation cycle • large populations of the urban poor in slums and shanty towns (lower literacy, etc.) At least 2 reasons are needed.
Mark scheme, page 7
Page 7 Mark Scheme Syllabus Paper Cambridge International AS/A Level – October/November 2016 9696 13 © UCLES 2016 Section B: The Physical Core Hydrology and fluvial geomorphology 7 (a) (i) Define the fluvial terms abrasion and saltation. [4] Abrasion is erosion (1) by the collision and/or scraping action of transported load against the banks and bed of the river channel (1). This is not to be confused with attrition. Saltation is a transport process (1) with the ‘hopping’ motion (temporary lifting) of load (1). (ii) Describe turbulent flow and briefly explain how it occurs in a river channel. [3] Turbulent flow is an irregular flow such as eddies as a result of bed roughness and high velocities. Mark 1/2 or 2/1 for description/explanation. (b) With the aid of diagrams, explain the formation of waterfalls and deltas. [8] A diagram of a delta should show either a river entering a lake or the sea with distributaries or branching channels, or a sectional diagram indicating topset, foreset and bottomset beds. Explanation will be in terms of a lessening in velocity on entering the water body leading to a reduced competence. For good marks, there needs to be mention of flocculation to enable clay sized particles to be deposited. Answers might indicate topset, foreset and bottomset beds, but this is not essential and may depend on the diagram used. The problem with explaining how waterfalls develop is that answers usually begin with a diagram of the waterfall already formed. Very rarely do answers explain how the waterfall develops in the first place. This is largely because changes of base level and knickpoint development are not now in the syllabus. Explanation of waterfalls is easier when knickpoint recession can be written about. Some candidates will write about this but it cannot be expected. Thus, explanation will tend to be in terms of alternating strength and resistance of the rock bands, the production of plunge pool and undercutting. This is where cavitation becomes important and it is really the only place where cavitation is important. Mark 4/4 for waterfalls/deltas, reserving up to 2 marks for each diagram.
Mark scheme, page 8
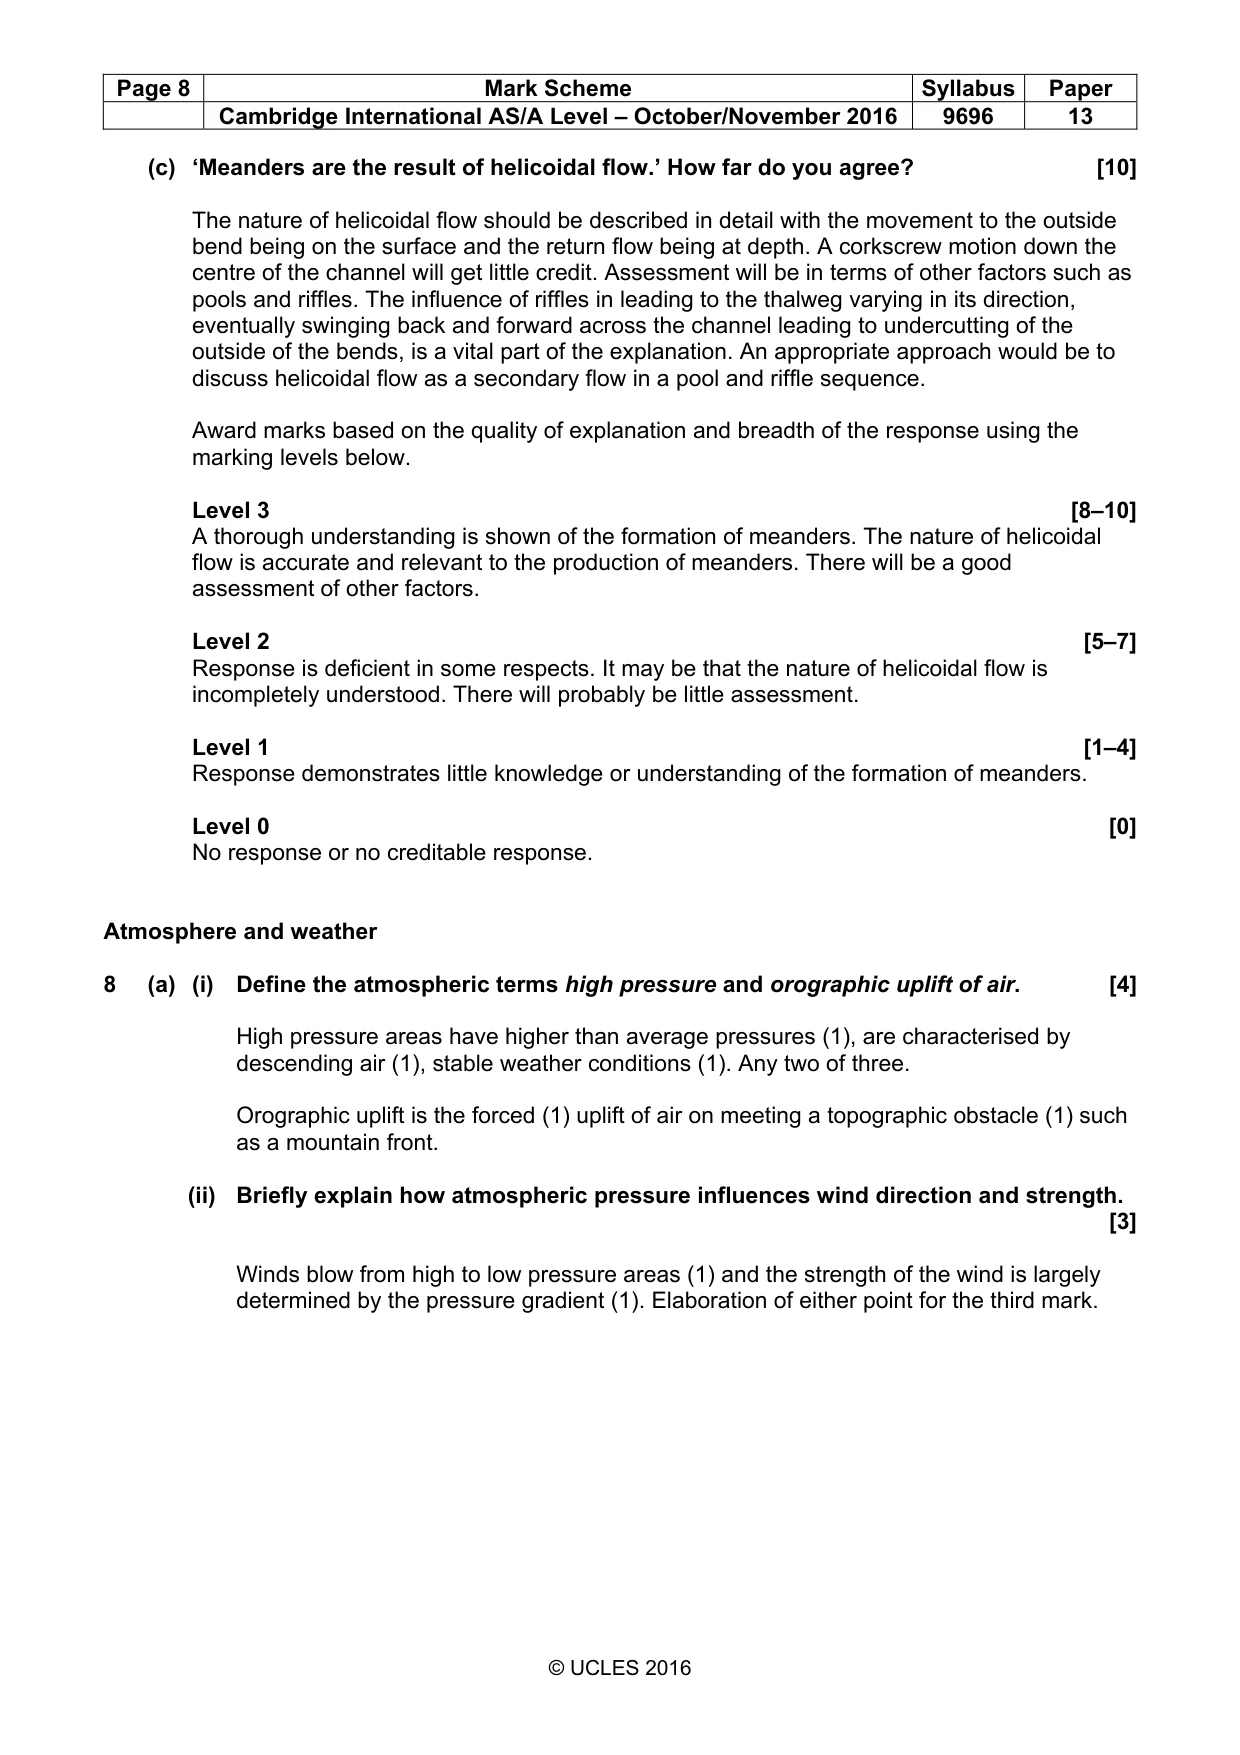
Page 8 Mark Scheme Syllabus Paper Cambridge International AS/A Level – October/November 2016 9696 13 © UCLES 2016 (c) ‘Meanders are the result of helicoidal flow.’ How far do you agree? [10] The nature of helicoidal flow should be described in detail with the movement to the outside bend being on the surface and the return flow being at depth. A corkscrew motion down the centre of the channel will get little credit. Assessment will be in terms of other factors such as pools and riffles. The influence of riffles in leading to the thalweg varying in its direction, eventually swinging back and forward across the channel leading to undercutting of the outside of the bends, is a vital part of the explanation. An appropriate approach would be to discuss helicoidal flow as a secondary flow in a pool and riffle sequence. Award marks based on the quality of explanation and breadth of the response using the marking levels below. Level 3 [8–10] A thorough understanding is shown of the formation of meanders. The nature of helicoidal flow is accurate and relevant to the production of meanders. There will be a good assessment of other factors. Level 2 [5–7] Response is deficient in some respects. It may be that the nature of helicoidal flow is incompletely understood. There will probably be little assessment. Level 1 [1–4] Response demonstrates little knowledge or understanding of the formation of meanders. Level 0 [0] No response or no creditable response. Atmosphere and weather 8 (a) (i) Define the atmospheric terms high pressure and orographic uplift of air. [4] High pressure areas have higher than average pressures (1), are characterised by descending air (1), stable weather conditions (1). Any two of three. Orographic uplift is the forced (1) uplift of air on meeting a topographic obstacle (1) such as a mountain front. (ii) Briefly explain how atmospheric pressure influences wind direction and strength. [3] Winds blow from high to low pressure areas (1) and the strength of the wind is largely determined by the pressure gradient (1). Elaboration of either point for the third mark.
Mark scheme, page 9
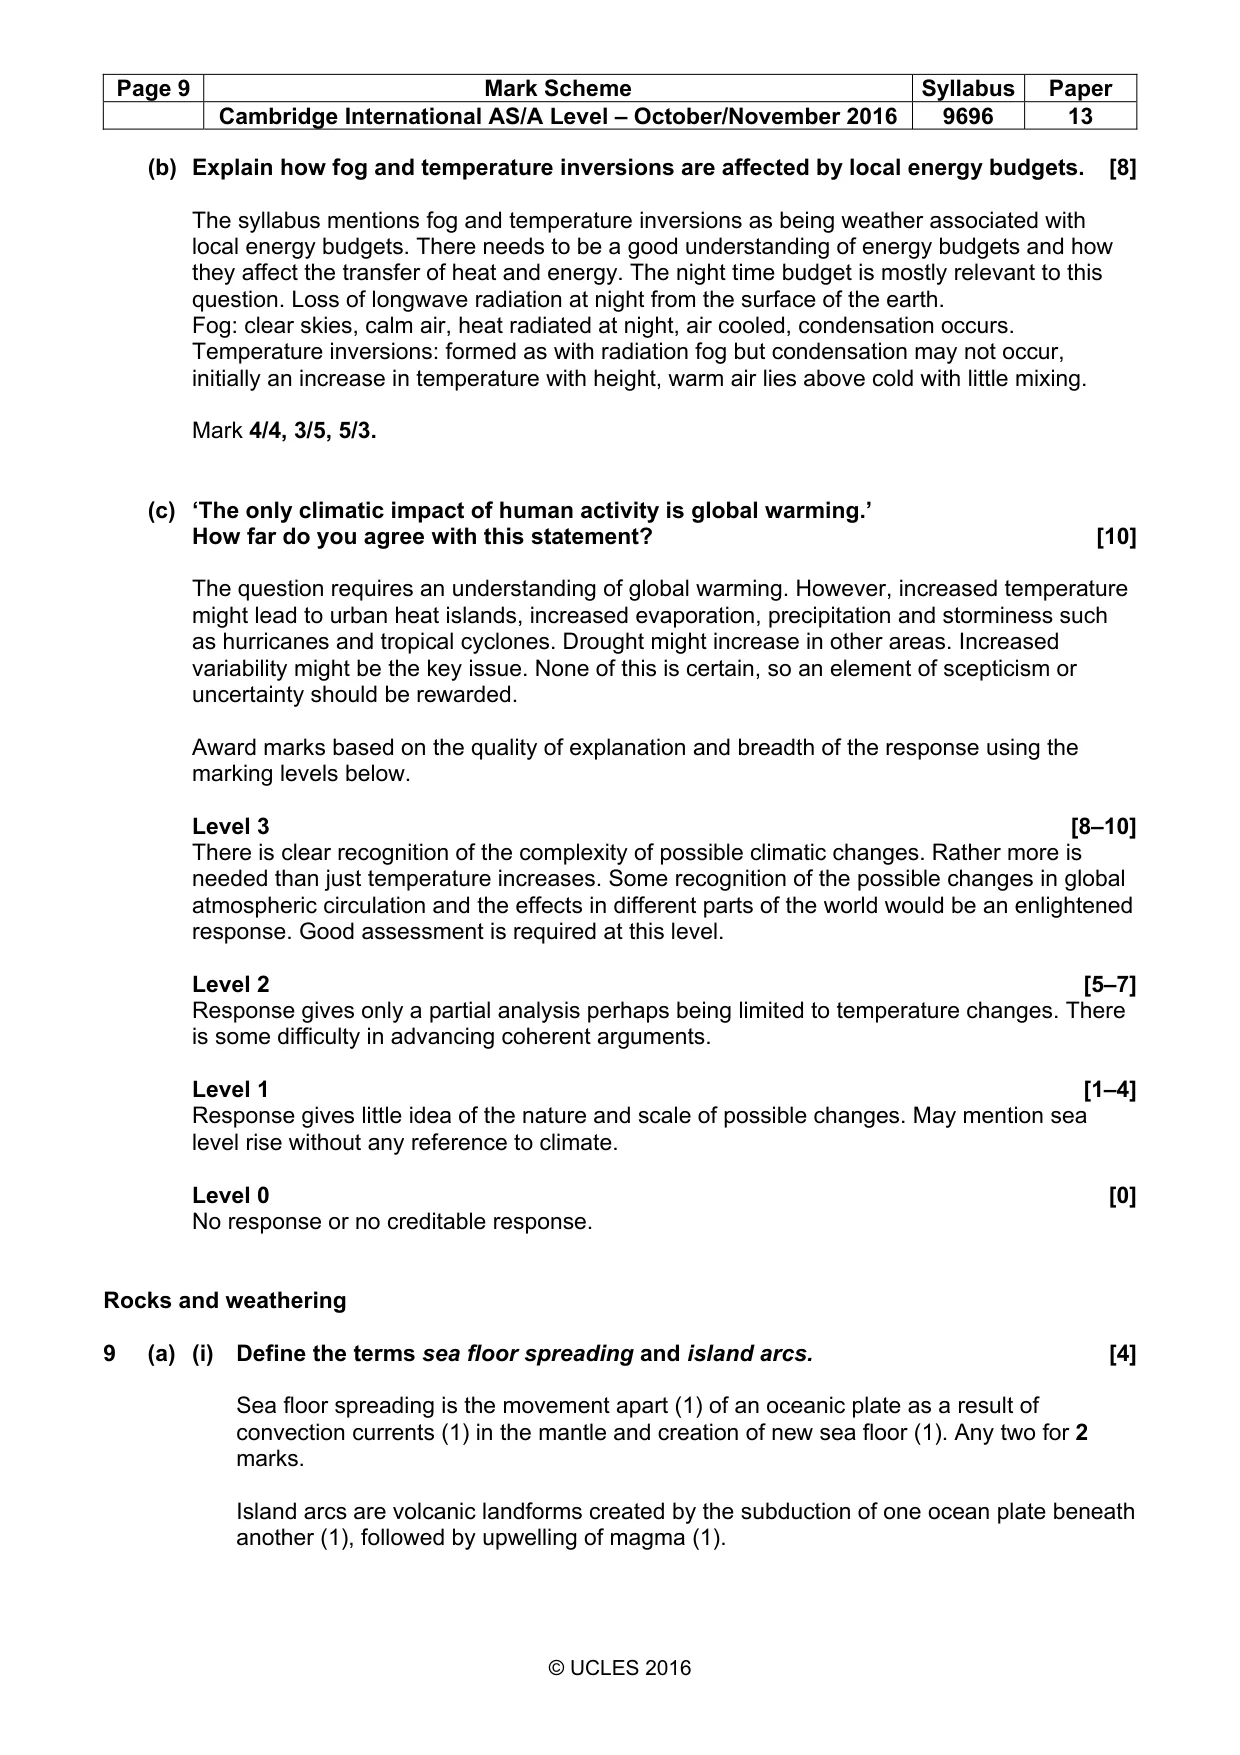
Page 9 Mark Scheme Syllabus Paper Cambridge International AS/A Level – October/November 2016 9696 13 © UCLES 2016 (b) Explain how fog and temperature inversions are affected by local energy budgets. [8] The syllabus mentions fog and temperature inversions as being weather associated with local energy budgets. There needs to be a good understanding of energy budgets and how they affect the transfer of heat and energy. The night time budget is mostly relevant to this question. Loss of longwave radiation at night from the surface of the earth. Fog: clear skies, calm air, heat radiated at night, air cooled, condensation occurs. Temperature inversions: formed as with radiation fog but condensation may not occur, initially an increase in temperature with height, warm air lies above cold with little mixing. Mark 4/4, 3/5, 5/3. (c) ‘The only climatic impact of human activity is global warming.’ How far do you agree with this statement? [10] The question requires an understanding of global warming. However, increased temperature might lead to urban heat islands, increased evaporation, precipitation and storminess such as hurricanes and tropical cyclones. Drought might increase in other areas. Increased variability might be the key issue. None of this is certain, so an element of scepticism or uncertainty should be rewarded. Award marks based on the quality of explanation and breadth of the response using the marking levels below. Level 3 [8–10] There is clear recognition of the complexity of possible climatic changes. Rather more is needed than just temperature increases. Some recognition of the possible changes in global atmospheric circulation and the effects in different parts of the world would be an enlightened response. Good assessment is required at this level. Level 2 [5–7] Response gives only a partial analysis perhaps being limited to temperature changes. There is some difficulty in advancing coherent arguments. Level 1 [1–4] Response gives little idea of the nature and scale of possible changes. May mention sea level rise without any reference to climate. Level 0 [0] No response or no creditable response. Rocks and weathering 9 (a) (i) Define the terms sea floor spreading and island arcs. [4] Sea floor spreading is the movement apart (1) of an oceanic plate as a result of convection currents (1) in the mantle and creation of new sea floor (1). Any two for 2 marks. Island arcs are volcanic landforms created by the subduction of one ocean plate beneath another (1), followed by upwelling of magma (1).
Mark scheme, page 10
Page 10 Mark Scheme Syllabus Paper Cambridge International AS/A Level – October/November 2016 9696 13 © UCLES 2016 (ii) Briefly explain the process of subduction. [3] The key is the movement of the tectonic plates by convection currents (1) and the forcing of the denser plate below the less dense (1), usually continental plate along a sloping junction known as the Benioff zone with melting of the subducted plate (1). (b) For either granite or limestone, explain how physical structure and chemical composition of the rock influences its weathering. [8] Both chemical and physical weathering should be mentioned. For both rock types, the joints in the rock will aid the processes of both physical and chemical weathering. For granite, the main minerals, quartz, feldspar and mica, will govern chemical weathering, usually hydrolysis. Quartz is virtually inert, but feldspar and mica, especially feldspar because of its molecular and chemical make-up, are susceptible to chemical weathering, especially hydrolysis. The end product is usually kaolin clay. The different colours of the minerals, especially black mica, will affect heat absorption and therefore insolation weathering. Freeze-thaw is also a relevant physical process. Relief of pressure and unloading is especially applicable to granite. For limestone, carbonation, the reaction of calcium carbonate (CaCO3) with acidulated water (H2CO3) to produce a soluble hydrogen carbonate, is the main process. Candidates might mention biological weathering, such as growth of tree roots in joints, for the weathering of both rock types.
Mark scheme, page 11
Page 11 Mark Scheme Syllabus Paper Cambridge International AS/A Level – October/November 2016 9696 13 © UCLES 2016 (c) ‘Volcanic activity occurs at all tectonic plate margins.’ How far do you agree? [10] Volcanoes can be formed at either divergent or convergent plate margins but not at collision margins between two continental plates or at conservative margins. Explanation for this difference will be in terms of the nature of the plates (density, thickness) and whether subduction occurs. At divergent margins, upwelling of magma will produce volcanic landforms. The more astute candidates may even write about basaltic lava and its influence on the types of volcanoes produced. Where ocean plates meet a continental plate or two ocean plates meet, subduction will occur with melting at the Benioff zone to produce magma which then may force its way to the surface. Where two ocean plates meet, volcanic arcs may be produced. Where an ocean and continental plate meet, the basaltic magma will be altered by the more acidic rocks of the continent producing more explosive volcanic landforms. But do not expect such detail for good marks. However, the role of convection currents is needed for good marks. Much credit can be obtained with good diagrams. Award marks based on the quality of explanation and breadth of the response using the marking levels below. Level 3 [8–10] Expect a thorough coverage of volcanic activity at all types of plate margins and some assessment with examples. Level 2 [5–7] Response gives a somewhat unbalanced approach with an incomplete coverage of plate boundaries. Level 1 [1–4] Response will be very limited and demonstrate poor understanding of the processes at plate boundaries. Level 0 [0] No response or no creditable response.
Mark scheme, page 12
Page 12 Mark Scheme Syllabus Paper Cambridge International AS/A Level – October/November 2016 9696 13 © UCLES 2016 Section C: The Human Core Population 10 For one country’s population policy on natural increase: (Any case study may be used, anti-natalist or pro-natalist.) (a) explain why the government introduced a population policy; [7] The explanation may be in any dimension (social, economic, environmental, political) or timescale. In support, credit well clear identification of reasons or factors and evidence, detail or data from the country. Good accounts may be realistic, show familiarity with the material and be clearly demographic rather than, say, generally developmental. (b) describe government attempts at managing natural increase; [8] Credit well detail of attempts such as what, when, where, why, how, by whom and any country detail beyond the name. The attempts may be in one phase of policy or more (as in China’s wan xi shao and ‘one child’). If offered, credit the acknowledgement that death rate matters as well as birth rate in terms of managing natural increase and population growth. (c) assess the success of the attempts you described in (b). [10] If candidates plan their answer carefully, part (b) sets them up to assess without the need to repeat material. Better candidates may compare the relative success or failure of different attempts. Assessment may cover how far aims were achieved, identify varying success spatially or between groups of people and/or identify constraints and unforeseen circumstances. Credit data in support, e.g. BR or NIR, and any remaining challenges. Candidates will probably: Level 3 [8–10] Provide an effective assessment of success, well supported from the chosen country. Recognise the dynamism and complexity of the country’s demography and/or identify the role of other factors or constraints. Level 2 [5–7] Show satisfactory knowledge and understanding of the chosen attempts in a reasonable response which may be good in parts. Assessment is present, but limited in depth and/or detail. For one attempt, max. 6. Level 1 [1–4] Make only a few basic descriptive points. Offer little or no assessment of success. Fragments and notes remain in this level. Level 0 [0] No response or no creditable response.
Mark scheme, page 13
Page 13 Mark Scheme Syllabus Paper Cambridge International AS/A Level – October/November 2016 9696 13 © UCLES 2016 Population/Migration/Settlement dynamics 11 (a) (i) Define the terms push factor and pull factor and give an example of each. [4] A push factor works in a person’s current location to propel, influence or force them to move (1) for an example, such as poverty or conflict (1). A pull factor operates in a potential destination to attract, influence or draw a migrant (1) for an example, such as job availability or close family (1). (ii) Briefly explain how constraints may affect migration. [3] Constraints work to limit, impede or slow down migration (1). The syllabus lists distance, cost and national borders but other factors might be valid such as language, culture, etc. (2). (b) Outline the causes and impacts of migration within urban settlements (intra-urban migration). [8] Movements within towns and cities are diverse. Causes may include: • life cycle • change in job or economic circumstances • housing availability or forced relocation on housing clearance • moving to be near other people/family • improved services (education/health) • crime and other social issues Impacts are similarly varied and may be at any scale from the individual to the town or city. Responses may be in terms of cost/benefit; problems/solutions, etc. Impacts might be positive or negative. For a response on causes (or impacts) only, max. 5.
Mark scheme, page 14
Page 14 Mark Scheme Syllabus Paper Cambridge International AS/A Level – October/November 2016 9696 13 © UCLES 2016 (c) Assess the impacts of rural-urban migration on the rural source areas. [10] Context may be LEDC or MEDC. Impacts may be demographic, social, economic, environmental or political. Impacts may be positive or negative. Candidates will probably: Level 3 [8–10] Make an effective assessment of impacts in two or more dimensions, identifying both positive and negative elements. Integrate exemplar content and secure conceptual understanding. Level 2 [5–7] Provide a sound response which may be good in parts, but which is limited through lack of detailed knowledge, restricted understanding of impacts or partial assessment. May be wholly positive or negative. Level 1 [1–4] Provide an answer which is largely descriptive and which may be general or somewhat faulty. At the top of the level it may offer a simple assessment. Have the knowledge or time to make only a basic or note-form response. Level 0 [0] No response or no creditable response. Settlement dynamics 12 (a) Define the term spatial competition and explain how spatial competition occurs within urban settlements. [7] The term spatial competition is the contest by functions for urban locations (2). Different functions or land uses compete for the spaces they desire. Urban space is limited, especially central space. The most desirable spaces are usually seen as the CBD and route junctions for accessibility. Least desirable are peripheral locations and those with negative externalities, such as marshy or polluted land. Candidates may use the concept of bid-rent or simply explain how the use of the land goes to the highest bidder. Spatial competition may be distorted by local factors, e.g. corruption or personal influence, and by planning decisions. Explanation: 5 marks. (b) With reference to one or more urban settlements, describe how and explain why the location of retailing has changed. [8] Clearly much depends on the chosen example(s), such that there are no right or wrong answers. The description is likely to cover how retailing has become more diverse in location, e.g. suburban shopping centres and out-of-town retail parks. Within the CBD, locations for retailing may have changed, perhaps with outwards movement or clustering, e.g. of clothing shops. In MEDCs, the contraction of retailing may be included. The explanation may be example-specific, but expect factors such as spatial competition and the need for expansion, profitability and access for deliveries and customers. For a good description and explanation without example(s), maximum 5.
Mark scheme, page 15
Page 15 Mark Scheme Syllabus Paper Cambridge International AS/A Level – October/November 2016 9696 13 © UCLES 2016 (c) Explain why it is difficult for urban authorities to manage shanty towns (squatter settlements). [10] The difficulty results from multiple, dynamic and interactive reasons (social, economic, environmental and political). It includes issues of scale, growth and expansion, finance, governance, conflict of interests, etc. Candidates will probably: Level 3 [8–10] Develop a perceptive explanation of the difficulties in two or more dimensions (social, economic, environmental, political) with strong understanding of the urban context and some detail in exemplar support. Level 2 [5–7] Make a satisfactory but limited response, which may be generic in the explanation developed with an insecure focus on difficulty. Level 1 [1–4] Make a few basic points about shanty towns/squatter settlement which may be more descriptive of character than explanatory of difficulty. Notes and fragments remain in this level. Level 0 [0] No response or no creditable response.
What you needed in this session
Cambridge’s own grade thresholds for 2016 Oct/Nov, Paper 1 · Variant 3. A higher threshold means an easier paper — the bar moves with how the cohort did.