Cambridge A Level Geography 9696 — 2016 Oct/Nov Paper 1 · Variant 2
9696/12/O/N/16 · 100 marks · ≈113 min
The question paper and its mark scheme, free to read here and free to download. This is Cambridge’s own paper, exactly as it was sat.
Question paper8 pages



Mark scheme16 pages
Answers below. Sit the paper first if you are practising.
Paper as text
Question paper, page 1
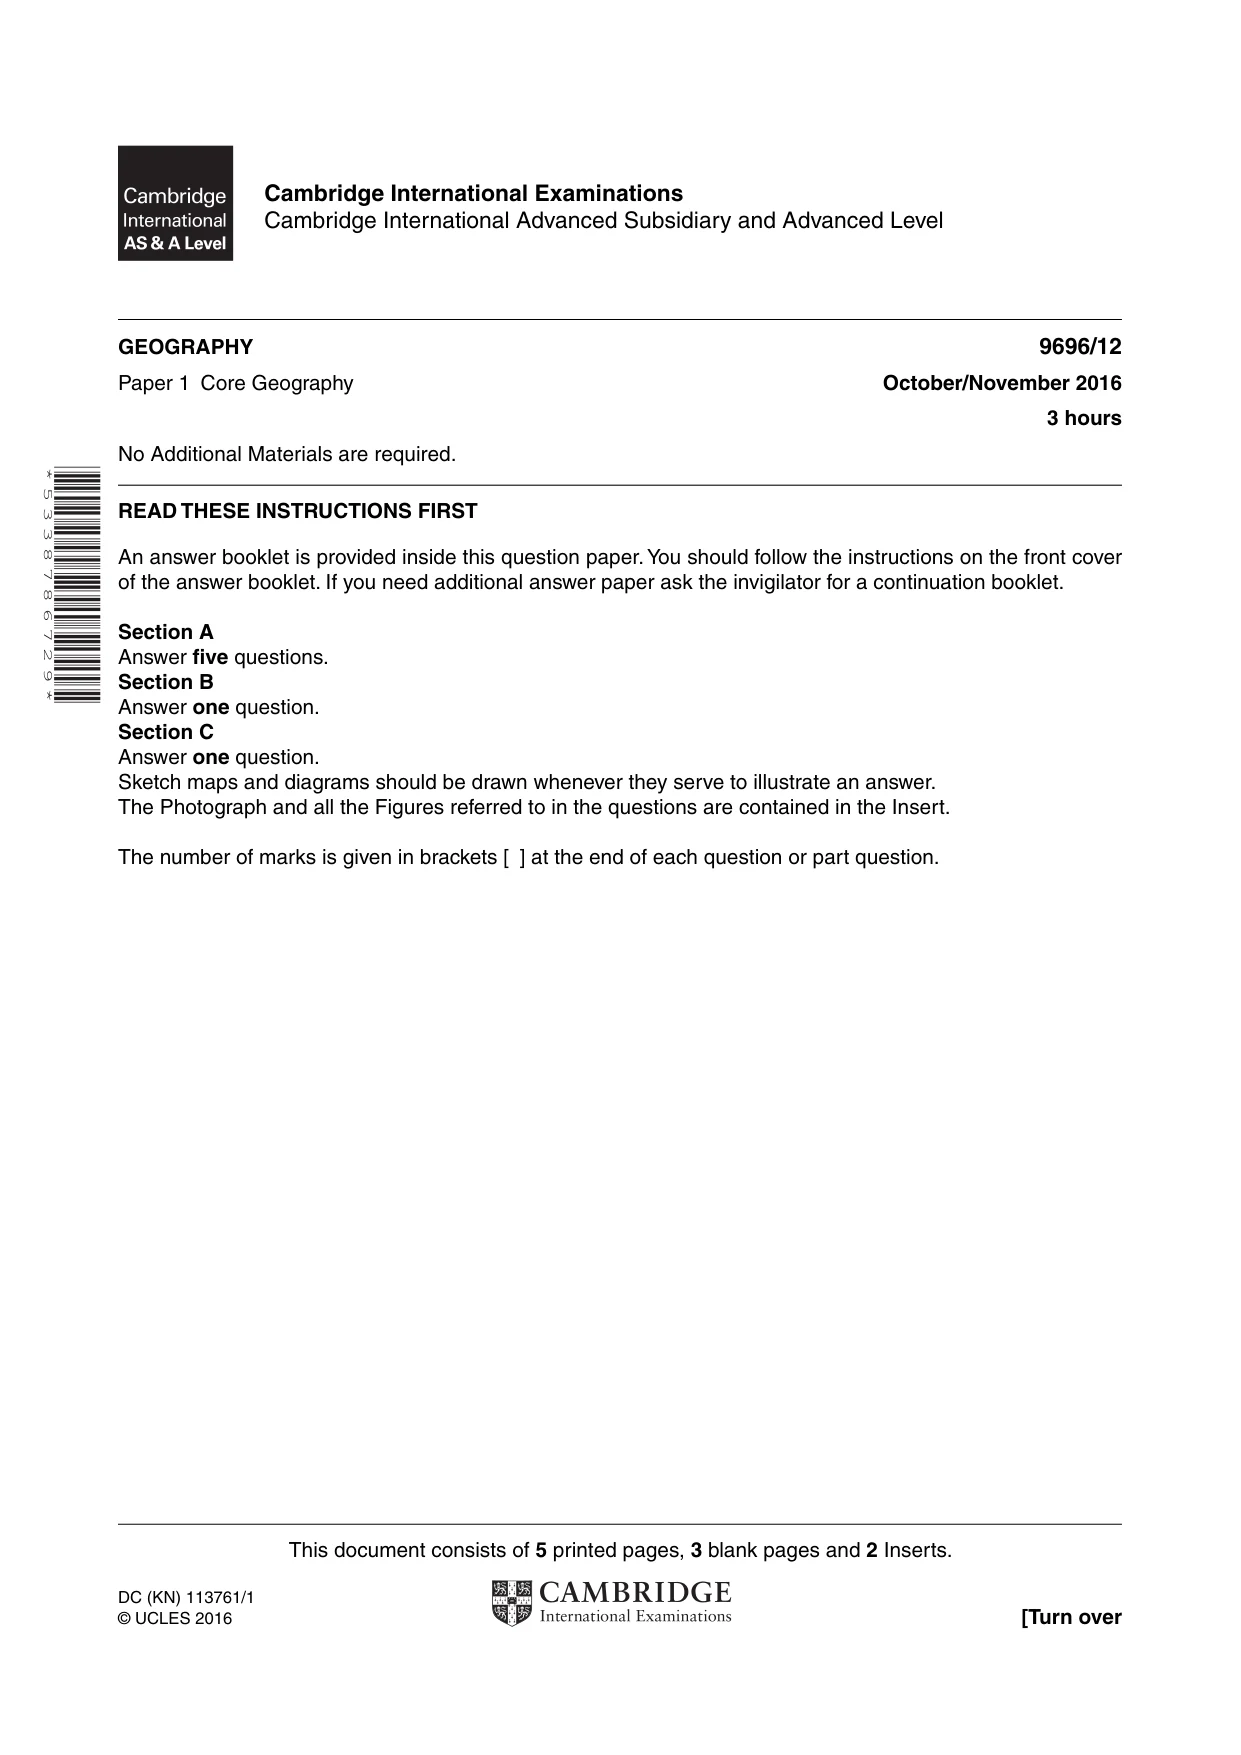
This document consists of 5 printed pages, 3 blank pages and 2 Inserts. DC (KN) 113761/1 © UCLES 2016 [Turn over Cambridge International Examinations Cambridge International Advanced Subsidiary and Advanced Level * 5 3 3 8 7 8 6 7 2 9 * GEOGRAPHY 9696/12 Paper 1 Core Geography October/November 2016 3 hours No Additional Materials are required. READ THESE INSTRUCTIONS FIRST An answer booklet is provided inside this question paper. You should follow the instructions on the front cover of the answer booklet. If you need additional answer paper ask the invigilator for a continuation booklet. Section A Answer five questions. Section B Answer one question. Section C Answer one question. Sketch maps and diagrams should be drawn whenever they serve to illustrate an answer. The Photograph and all the Figures referred to in the questions are contained in the Insert. The number of marks is given in brackets [ ] at the end of each question or part question.
Question paper, page 2
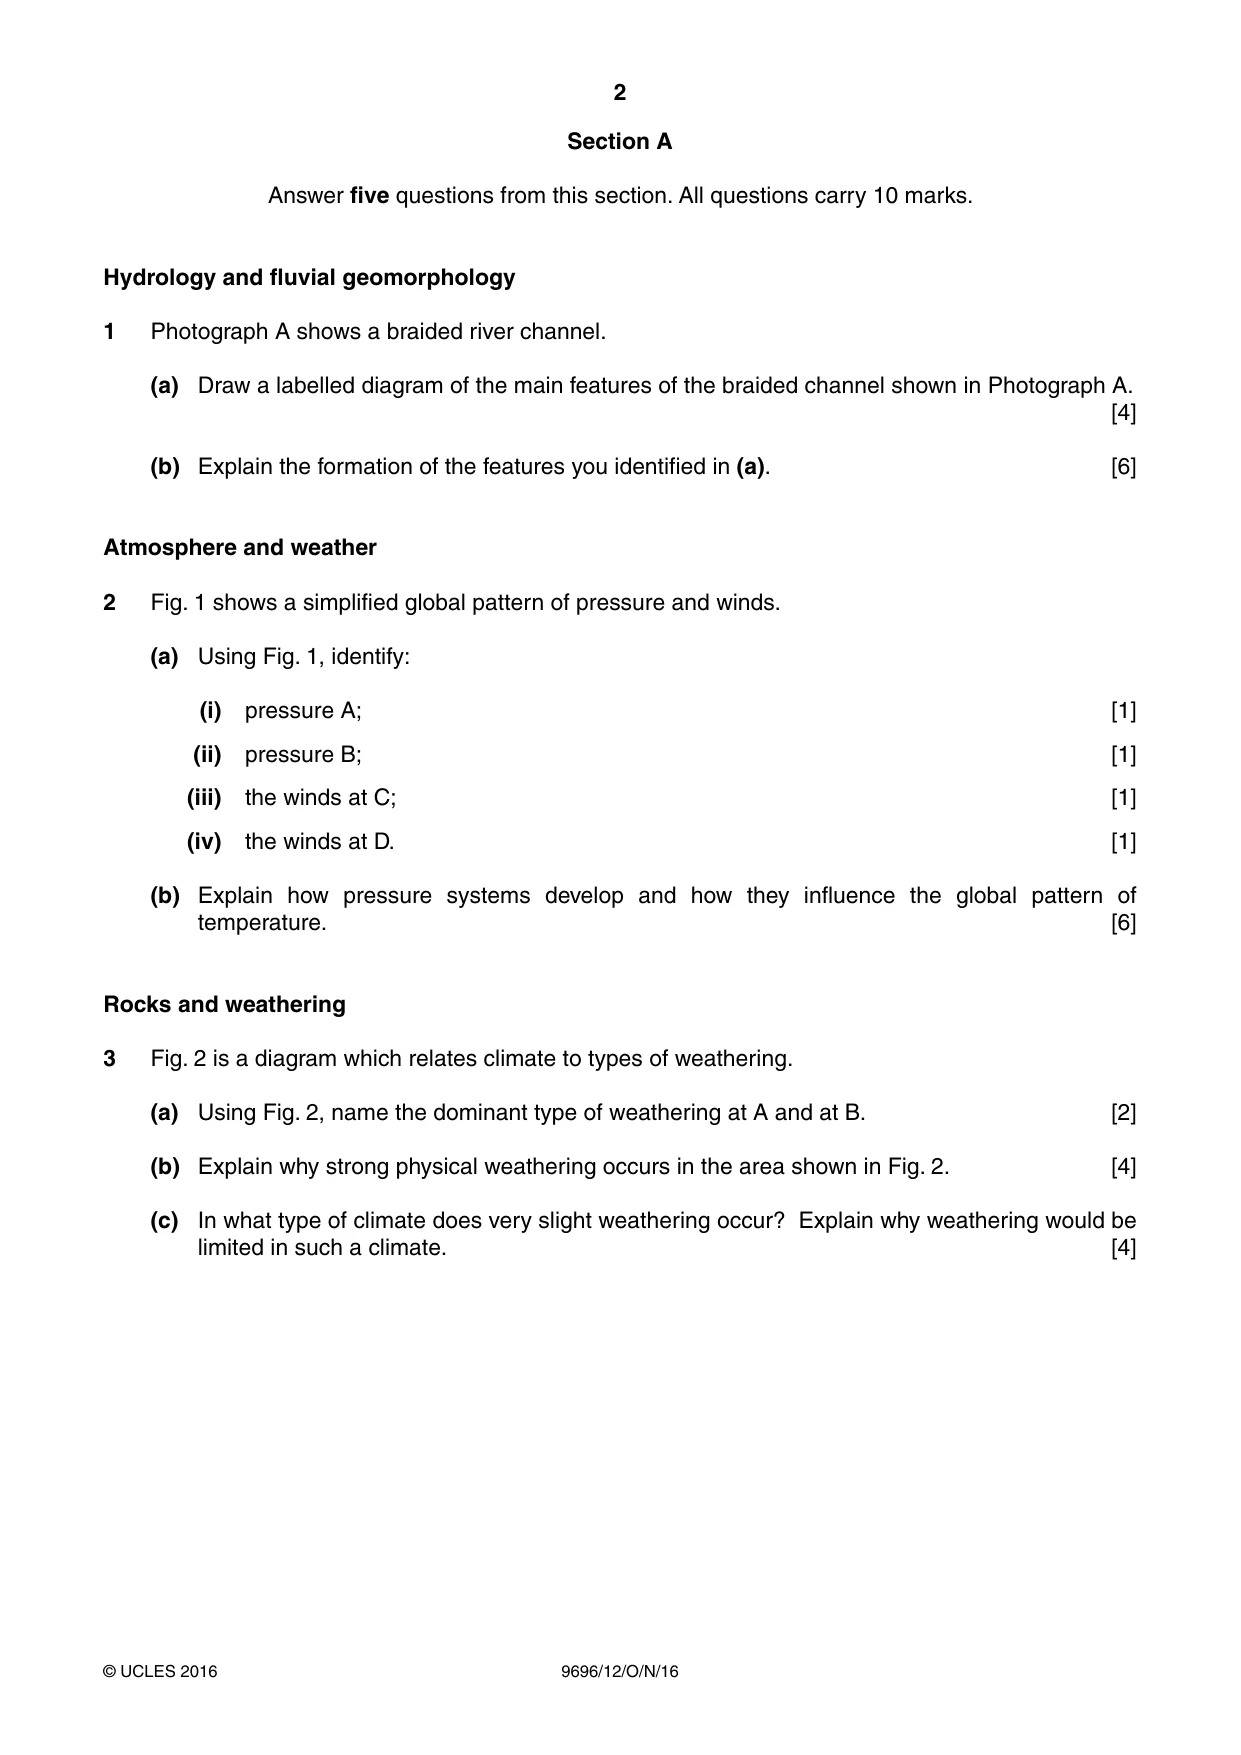
2 9696/12/O/N/16 © UCLES 2016 Section A Answer five questions from this section. All questions carry 10 marks. Hydrology and fluvial geomorphology 1 Photograph A shows a braided river channel. (a) Draw a labelled diagram of the main features of the braided channel shown in Photograph A. [4] (b) Explain the formation of the features you identified in (a). [6] Atmosphere and weather 2 Fig. 1 shows a simplified global pattern of pressure and winds. (a) Using Fig. 1, identify: (i) pressure A; [1] (ii) pressure B; [1] (iii) the winds at C; [1] (iv) the winds at D. [1] (b) Explain how pressure systems develop and how they influence the global pattern of temperature. [6] Rocks and weathering 3 Fig. 2 is a diagram which relates climate to types of weathering. (a) Using Fig. 2, name the dominant type of weathering at A and at B. [2] (b) Explain why strong physical weathering occurs in the area shown in Fig. 2. [4] (c) In what type of climate does very slight weathering occur? Explain why weathering would be limited in such a climate. [4]
Question paper, page 3
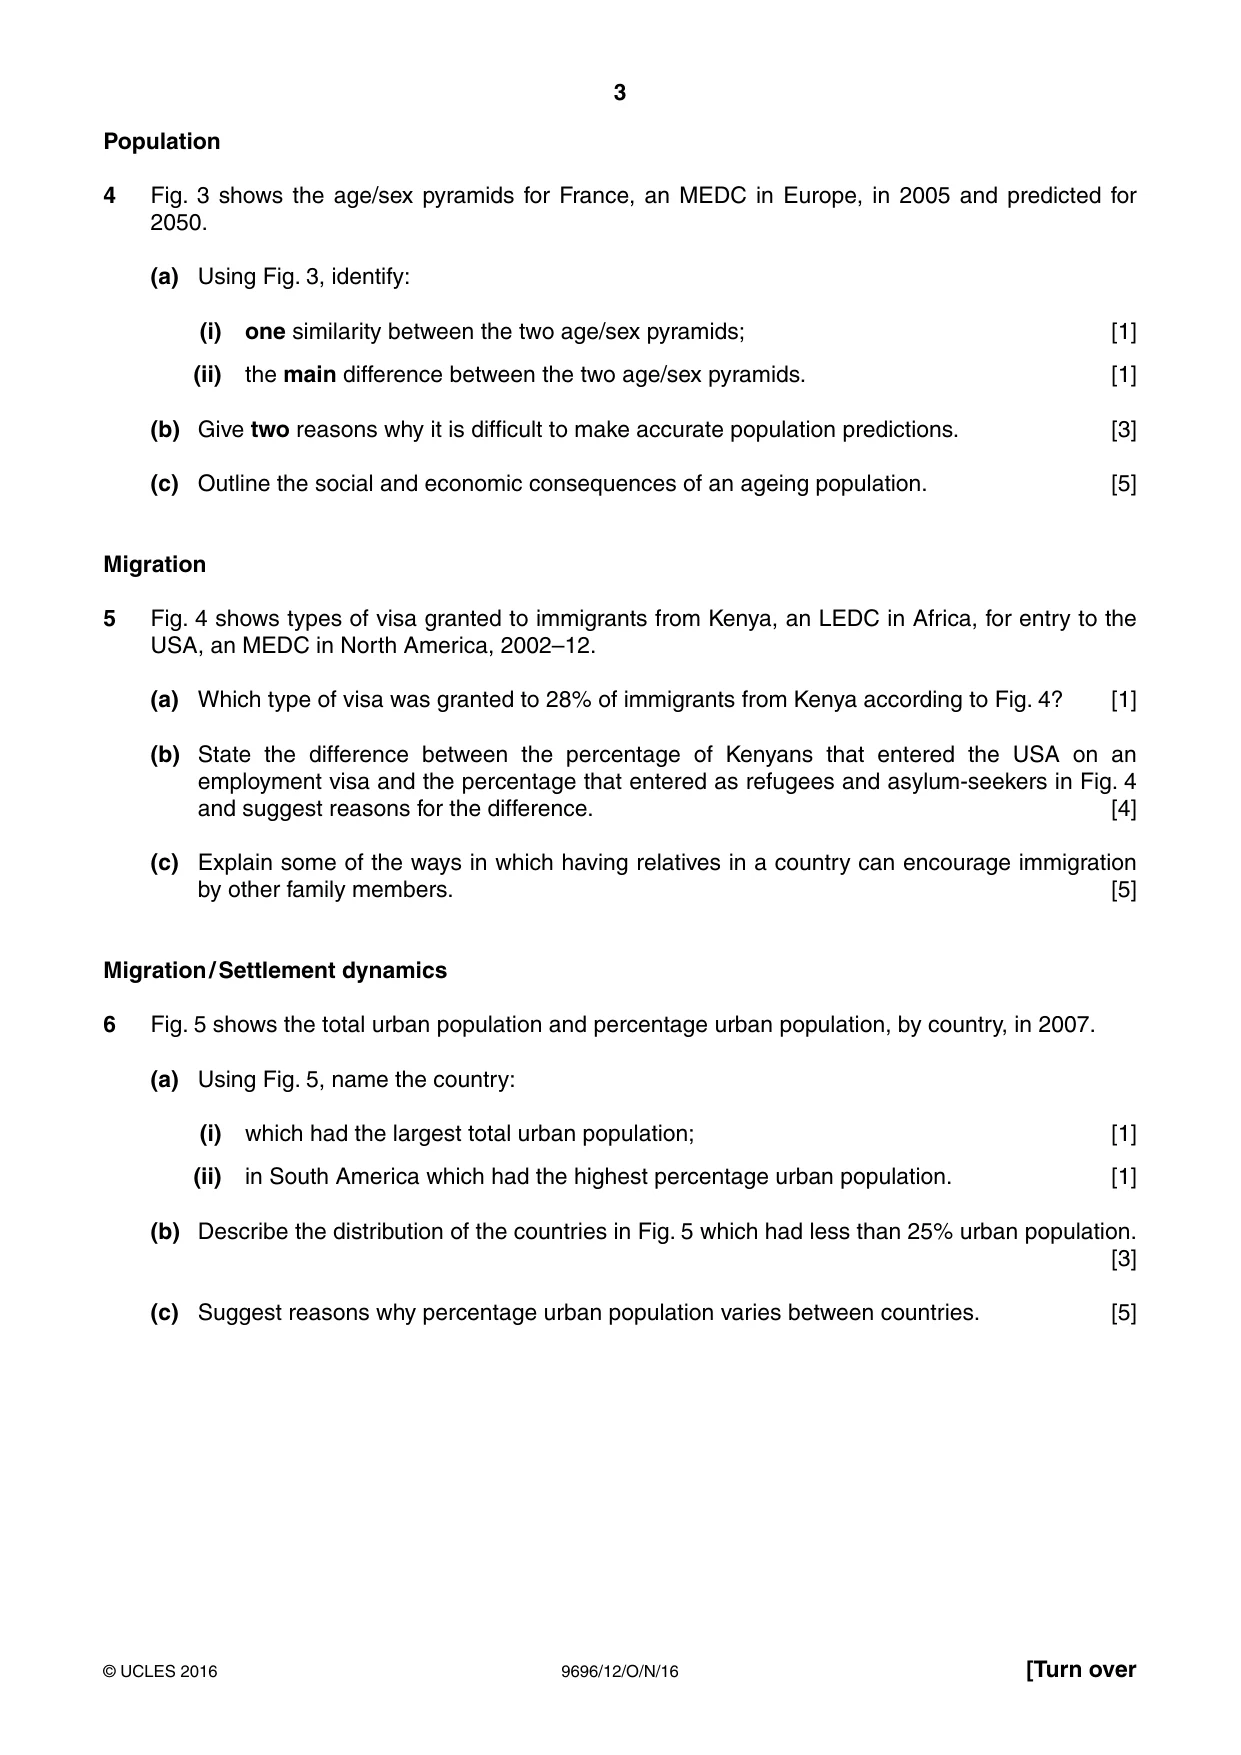
3 9696/12/O/N/16 © UCLES 2016 [Turn over Population 4 Fig. 3 shows the age/sex pyramids for France, an MEDC in Europe, in 2005 and predicted for 2050. (a) Using Fig. 3, identify: (i) one similarity between the two age/sex pyramids; [1] (ii) the main difference between the two age/sex pyramids. [1] (b) Give two reasons why it is difficult to make accurate population predictions. [3] (c) Outline the social and economic consequences of an ageing population. [5] Migration 5 Fig. 4 shows types of visa granted to immigrants from Kenya, an LEDC in Africa, for entry to the USA, an MEDC in North America, 2002–12. (a) Which type of visa was granted to 28% of immigrants from Kenya according to Fig. 4? [1] (b) State the difference between the percentage of Kenyans that entered the USA on an employment visa and the percentage that entered as refugees and asylum-seekers in Fig. 4 and suggest reasons for the difference. [4] (c) Explain some of the ways in which having relatives in a country can encourage immigration by other family members. [5] Migration / Settlement dynamics 6 Fig. 5 shows the total urban population and percentage urban population, by country, in 2007. (a) Using Fig. 5, name the country: (i) which had the largest total urban population; [1] (ii) in South America which had the highest percentage urban population. [1] (b) Describe the distribution of the countries in Fig. 5 which had less than 25% urban population. [3] (c) Suggest reasons why percentage urban population varies between countries. [5]
Question paper, page 4
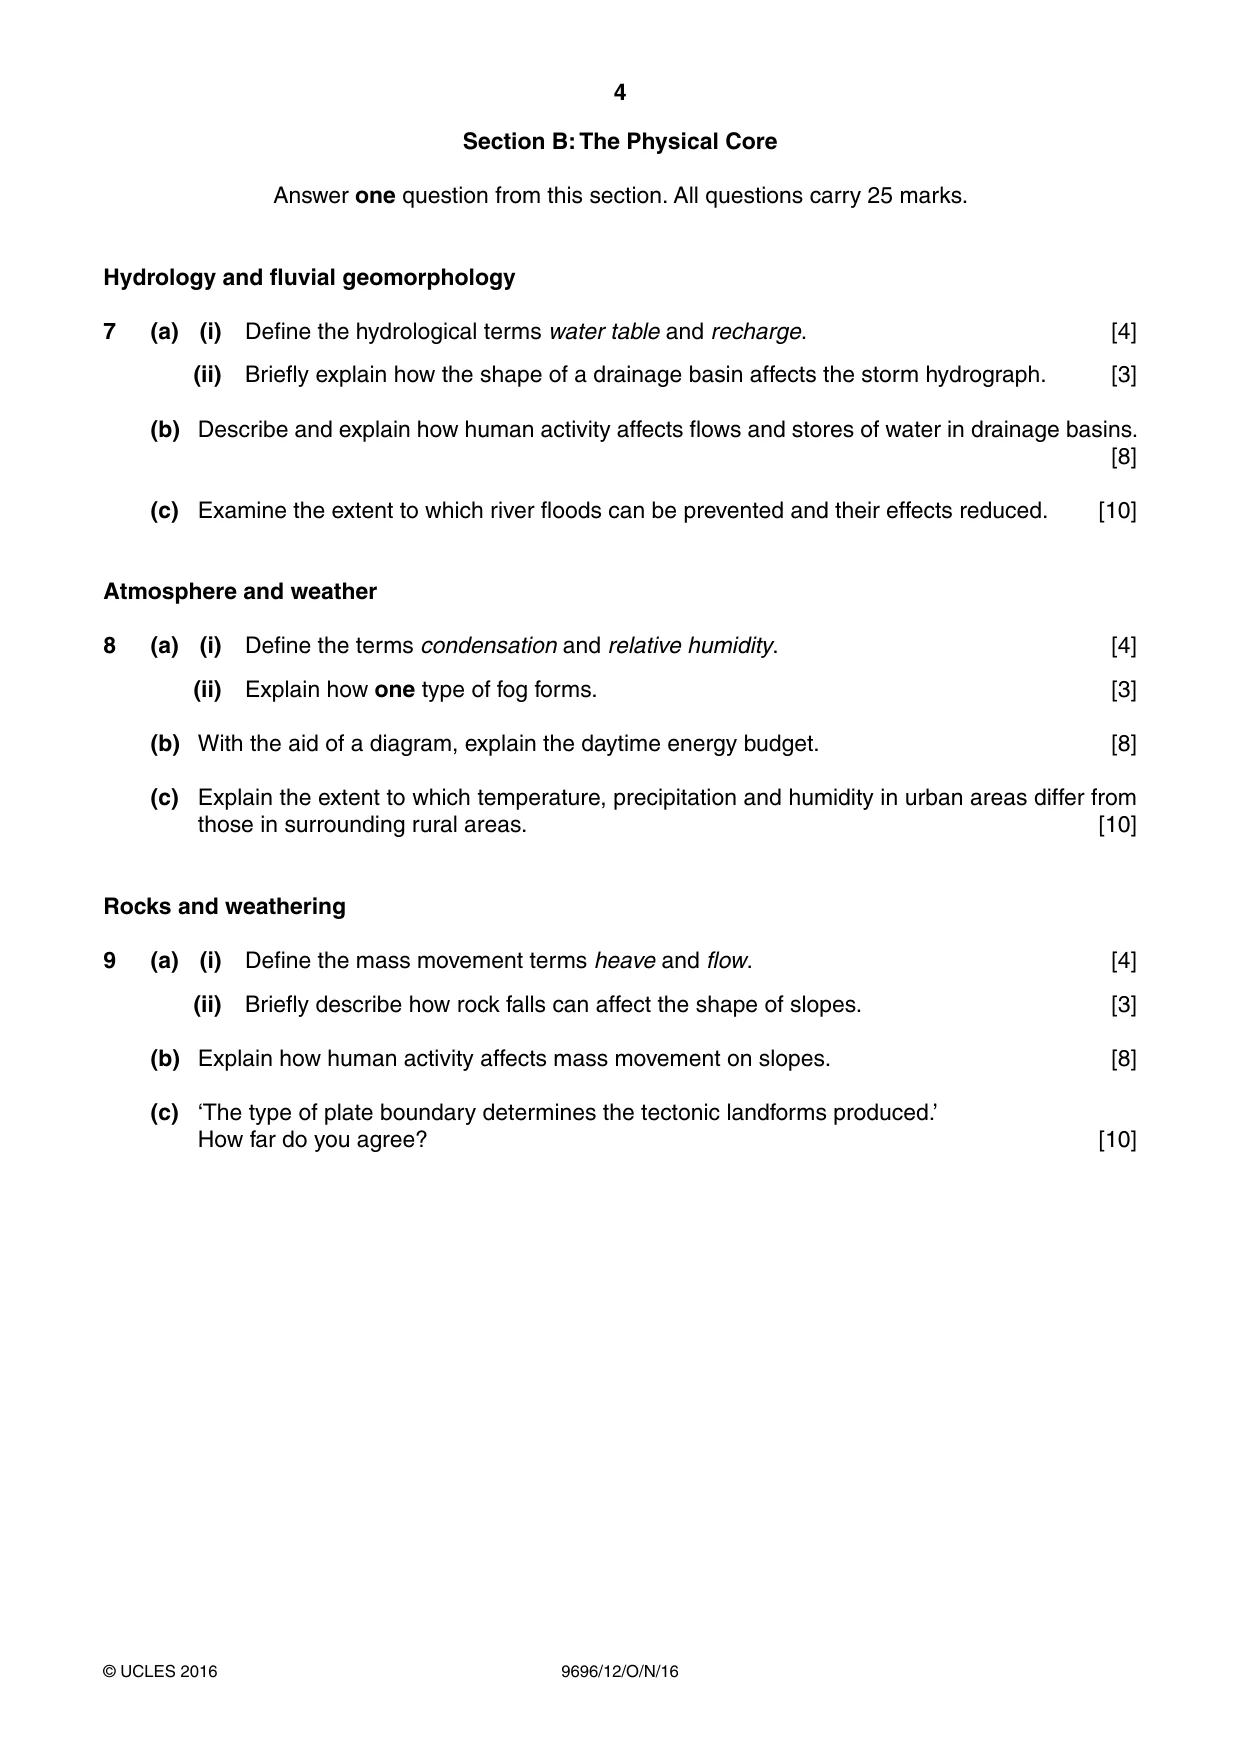
4 9696/12/O/N/16 © UCLES 2016 Section B: The Physical Core Answer one question from this section. All questions carry 25 marks. Hydrology and fluvial geomorphology 7 (a) (i) Define the hydrological terms water table and recharge. [4] (ii) Briefly explain how the shape of a drainage basin affects the storm hydrograph. [3] (b) Describe and explain how human activity affects flows and stores of water in drainage basins. [8] (c) Examine the extent to which river floods can be prevented and their effects reduced. [10] Atmosphere and weather 8 (a) (i) Define the terms condensation and relative humidity. [4] (ii) Explain how one type of fog forms. [3] (b) With the aid of a diagram, explain the daytime energy budget. [8] (c) Explain the extent to which temperature, precipitation and humidity in urban areas differ from those in surrounding rural areas. [10] Rocks and weathering 9 (a) (i) Define the mass movement terms heave and flow. [4] (ii) Briefly describe how rock falls can affect the shape of slopes. [3] (b) Explain how human activity affects mass movement on slopes. [8] (c) ‘The type of plate boundary determines the tectonic landforms produced.’ How far do you agree? [10]
Question paper, page 5
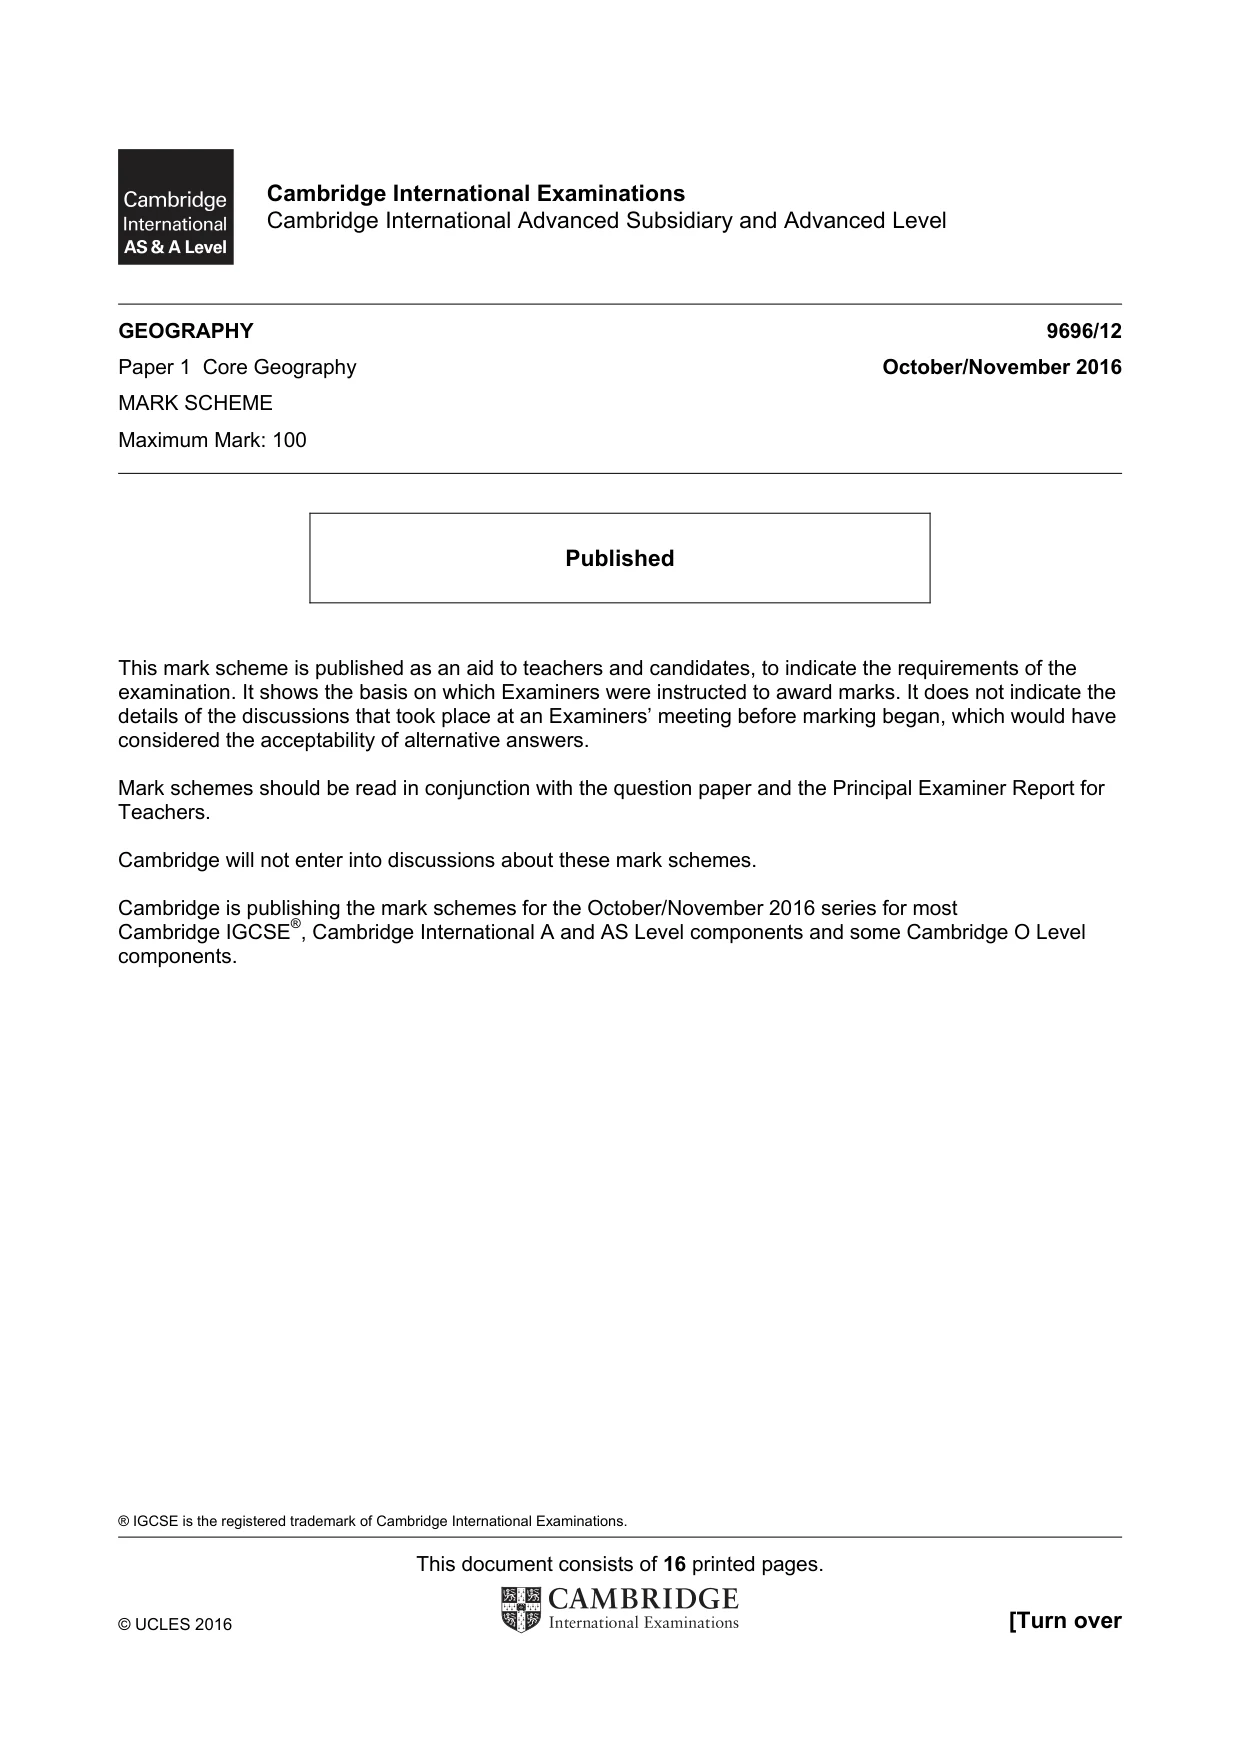
5 9696/12/O/N/16 © UCLES 2016 Section C: The Human Core Answer one question from this section. All questions carry 25 marks. Population 10 Fig. 6 shows the demographic transition model. (a) Describe and briefly explain trends in the birth rate and death rate in Stage 2. [7] (b) With the help of an example, explain how government action may contribute to the decreasing birth rate in Stage 3. [8] (c) To what extent does the demographic transition model help to explain future population trends? [10] Migration / Settlement dynamics 11 (a) (i) Give the meaning of the term internal migration. [3] (ii) Describe two types of internal migration. [4] (b) Describe, and explain the role of, push factors and pull factors in internal migration. [8] (c) Assess the impacts of migration on rural settlement in either MEDCs or LEDCs. [10] Settlement dynamics 12 For one example of a shanty town or squatter settlement in an LEDC: (a) describe its location and character; [7] (b) suggest reasons for its problems; [8] (c) assess the extent to which attempts to improve the shanty town or squatter settlement have been successful. [10]
Question paper, page 6
6 9696/12/O/N/16 © UCLES 2016 BLANK PAGE
Question paper, page 7
7 9696/12/O/N/16 © UCLES 2016 BLANK PAGE
Question paper, page 8
8 9696/12/O/N/16 © UCLES 2016 BLANK PAGE Permission to reproduce items where third-party owned material protected by copyright is included has been sought and cleared where possible. Every reasonable effort has been made by the publisher (UCLES) to trace copyright holders, but if any items requiring clearance have unwittingly been included, the publisher will be pleased to make amends at the earliest possible opportunity. To avoid the issue of disclosure of answer-related information to candidates, all copyright acknowledgements are reproduced online in the Cambridge International Examinations Copyright Acknowledgements Booklet. This is produced for each series of examinations and is freely available to download at www.cie.org.uk after the live examination series. Cambridge International Examinations is part of the Cambridge Assessment Group. Cambridge Assessment is the brand name of University of Cambridge Local Examinations Syndicate (UCLES), which is itself a department of the University of Cambridge.
Mark scheme, page 1
® IGCSE is the registered trademark of Cambridge International Examinations. This document consists of 16 printed pages. © UCLES 2016 [Turn over Cambridge International Examinations Cambridge International Advanced Subsidiary and Advanced Level GEOGRAPHY 9696/12 Paper 1 Core Geography October/November 2016 MARK SCHEME Maximum Mark: 100 Published This mark scheme is published as an aid to teachers and candidates, to indicate the requirements of the examination. It shows the basis on which Examiners were instructed to award marks. It does not indicate the details of the discussions that took place at an Examiners’ meeting before marking began, which would have considered the acceptability of alternative answers. Mark schemes should be read in conjunction with the question paper and the Principal Examiner Report for Teachers. Cambridge will not enter into discussions about these mark schemes. Cambridge is publishing the mark schemes for the October/November 2016 series for most Cambridge IGCSE®, Cambridge International A and AS Level components and some Cambridge O Level components.
Mark scheme, page 2
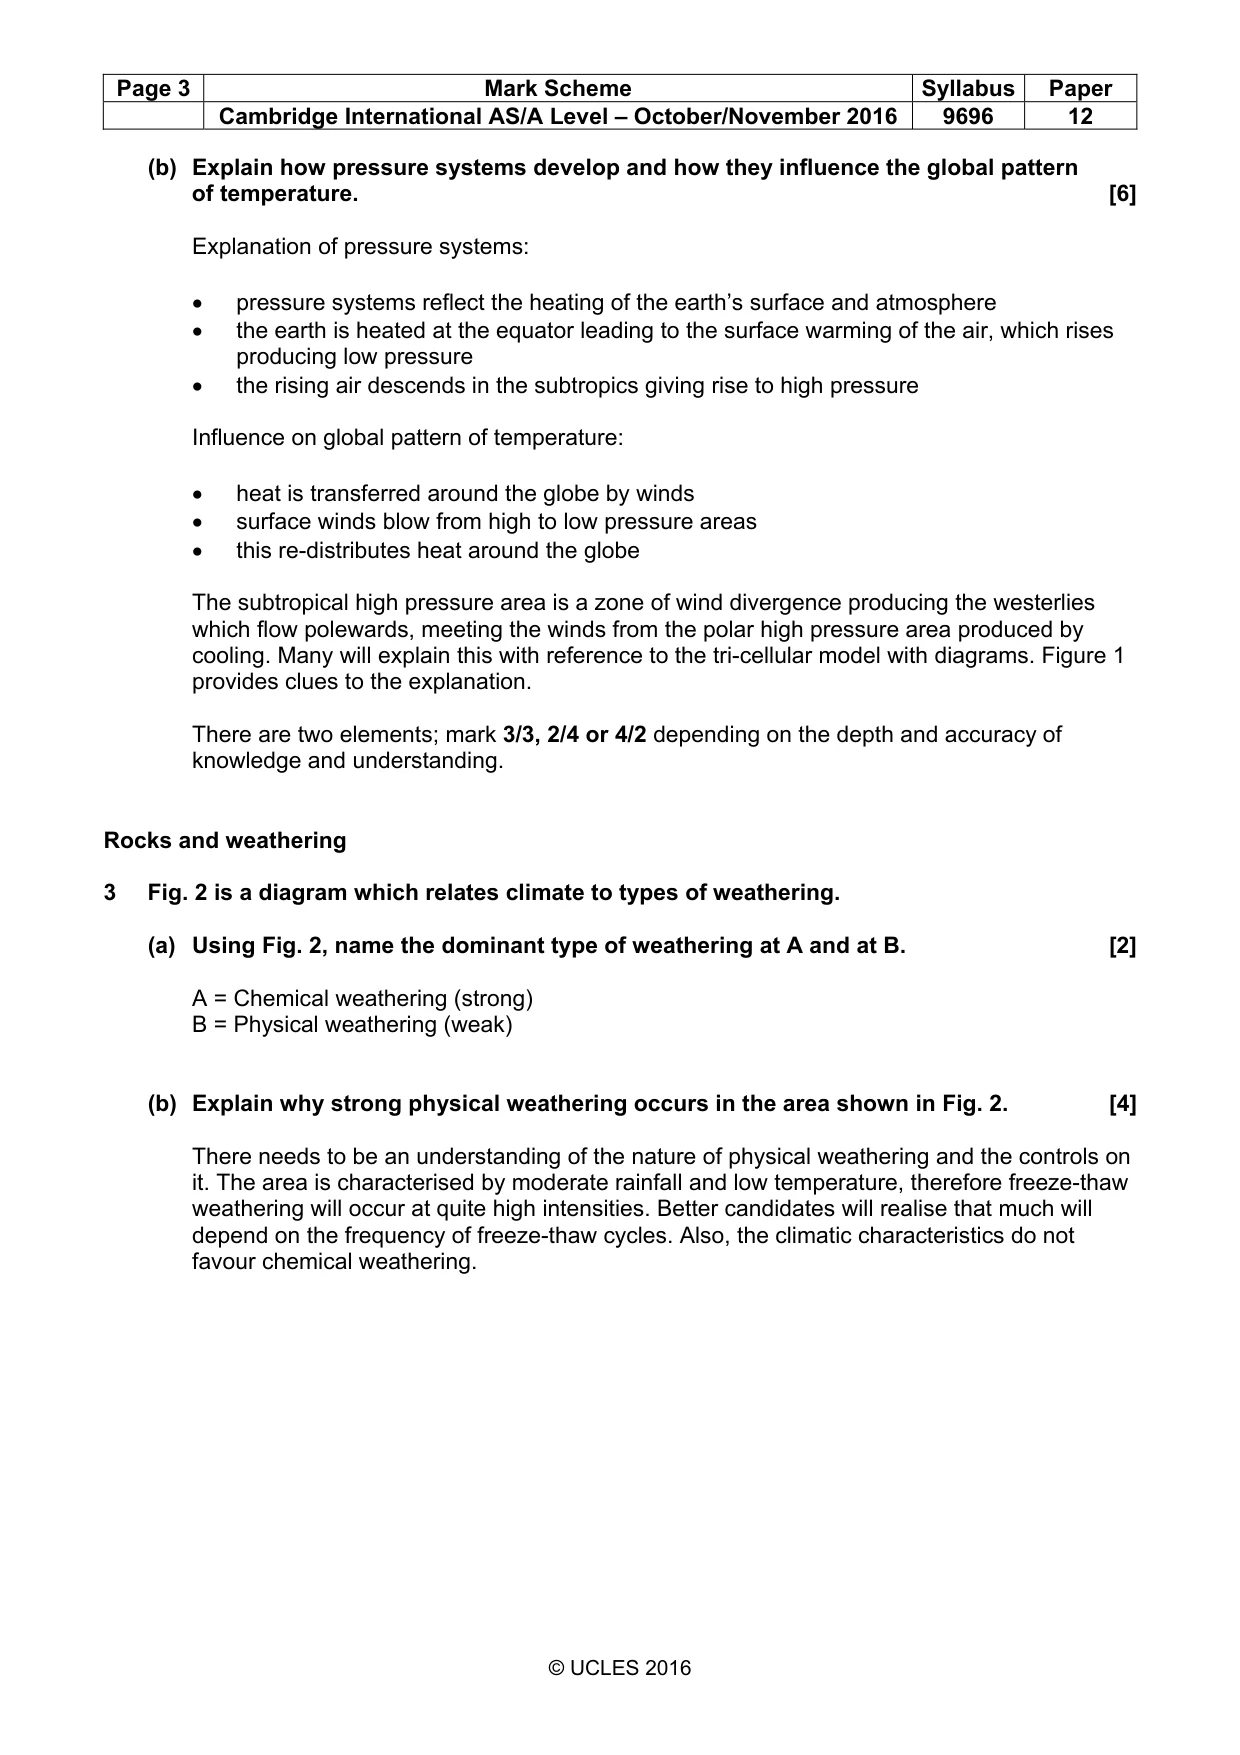
Page 2 Mark Scheme Syllabus Paper Cambridge International AS/A Level – October/November 2016 9696 12 © UCLES 2016 Section A Hydrology and fluvial geomorphology 1 Photograph A shows a braided river channel. (a) Draw a labelled diagram of the main features of the braided channel shown in Photograph A. [4] Features which could be expected and labelled are: • islands/eyots (vegetated or not) • sand banks • several river channels Knowledge of braided rivers should enable the diagram to be relatively realistic. The diagram does not have to perfectly match the photograph but should not be an idealised/theoretical braided channel. Allow 2 marks for the diagram and 2 marks for the labelling. (b) Explain the formation of the features you identified in (a). [6] The key elements in explaining the features of a braided river are: • the large amount of debris of different sizes to be moved • fluctuations in discharge • sudden change in slope leading to loss of energy It is the fluctuations in discharge and river energy which are crucial, although many candidates will write about fluctuations in velocity. Over time some of the islands (eyots) become stabilised by vegetation and can then influence the changing nature of the channels. Atmosphere and weather 2 Fig. 1 shows a simplified global pattern of pressure and winds. (a) Using Fig. 1, identify: (i) pressure A; [1] low (equatorial/tropical) (ii) pressure B; [1] low (subpolar/polar) (iii) the winds at C; [1] trades / easterlies / northeasterlies / southeasterlies (iv) the winds at D. [1] easterlies / northeasterlies / southeasterlies (polar)
Mark scheme, page 3
Page 3 Mark Scheme Syllabus Paper Cambridge International AS/A Level – October/November 2016 9696 12 © UCLES 2016 (b) Explain how pressure systems develop and how they influence the global pattern of temperature. [6] Explanation of pressure systems: • pressure systems reflect the heating of the earth’s surface and atmosphere • the earth is heated at the equator leading to the surface warming of the air, which rises producing low pressure • the rising air descends in the subtropics giving rise to high pressure Influence on global pattern of temperature: • heat is transferred around the globe by winds • surface winds blow from high to low pressure areas • this re-distributes heat around the globe The subtropical high pressure area is a zone of wind divergence producing the westerlies which flow polewards, meeting the winds from the polar high pressure area produced by cooling. Many will explain this with reference to the tri-cellular model with diagrams. Figure 1 provides clues to the explanation. There are two elements; mark 3/3, 2/4 or 4/2 depending on the depth and accuracy of knowledge and understanding. Rocks and weathering 3 Fig. 2 is a diagram which relates climate to types of weathering. (a) Using Fig. 2, name the dominant type of weathering at A and at B. [2] A = Chemical weathering (strong) B = Physical weathering (weak) (b) Explain why strong physical weathering occurs in the area shown in Fig. 2. [4] There needs to be an understanding of the nature of physical weathering and the controls on it. The area is characterised by moderate rainfall and low temperature, therefore freeze-thaw weathering will occur at quite high intensities. Better candidates will realise that much will depend on the frequency of freeze-thaw cycles. Also, the climatic characteristics do not favour chemical weathering.
Mark scheme, page 4
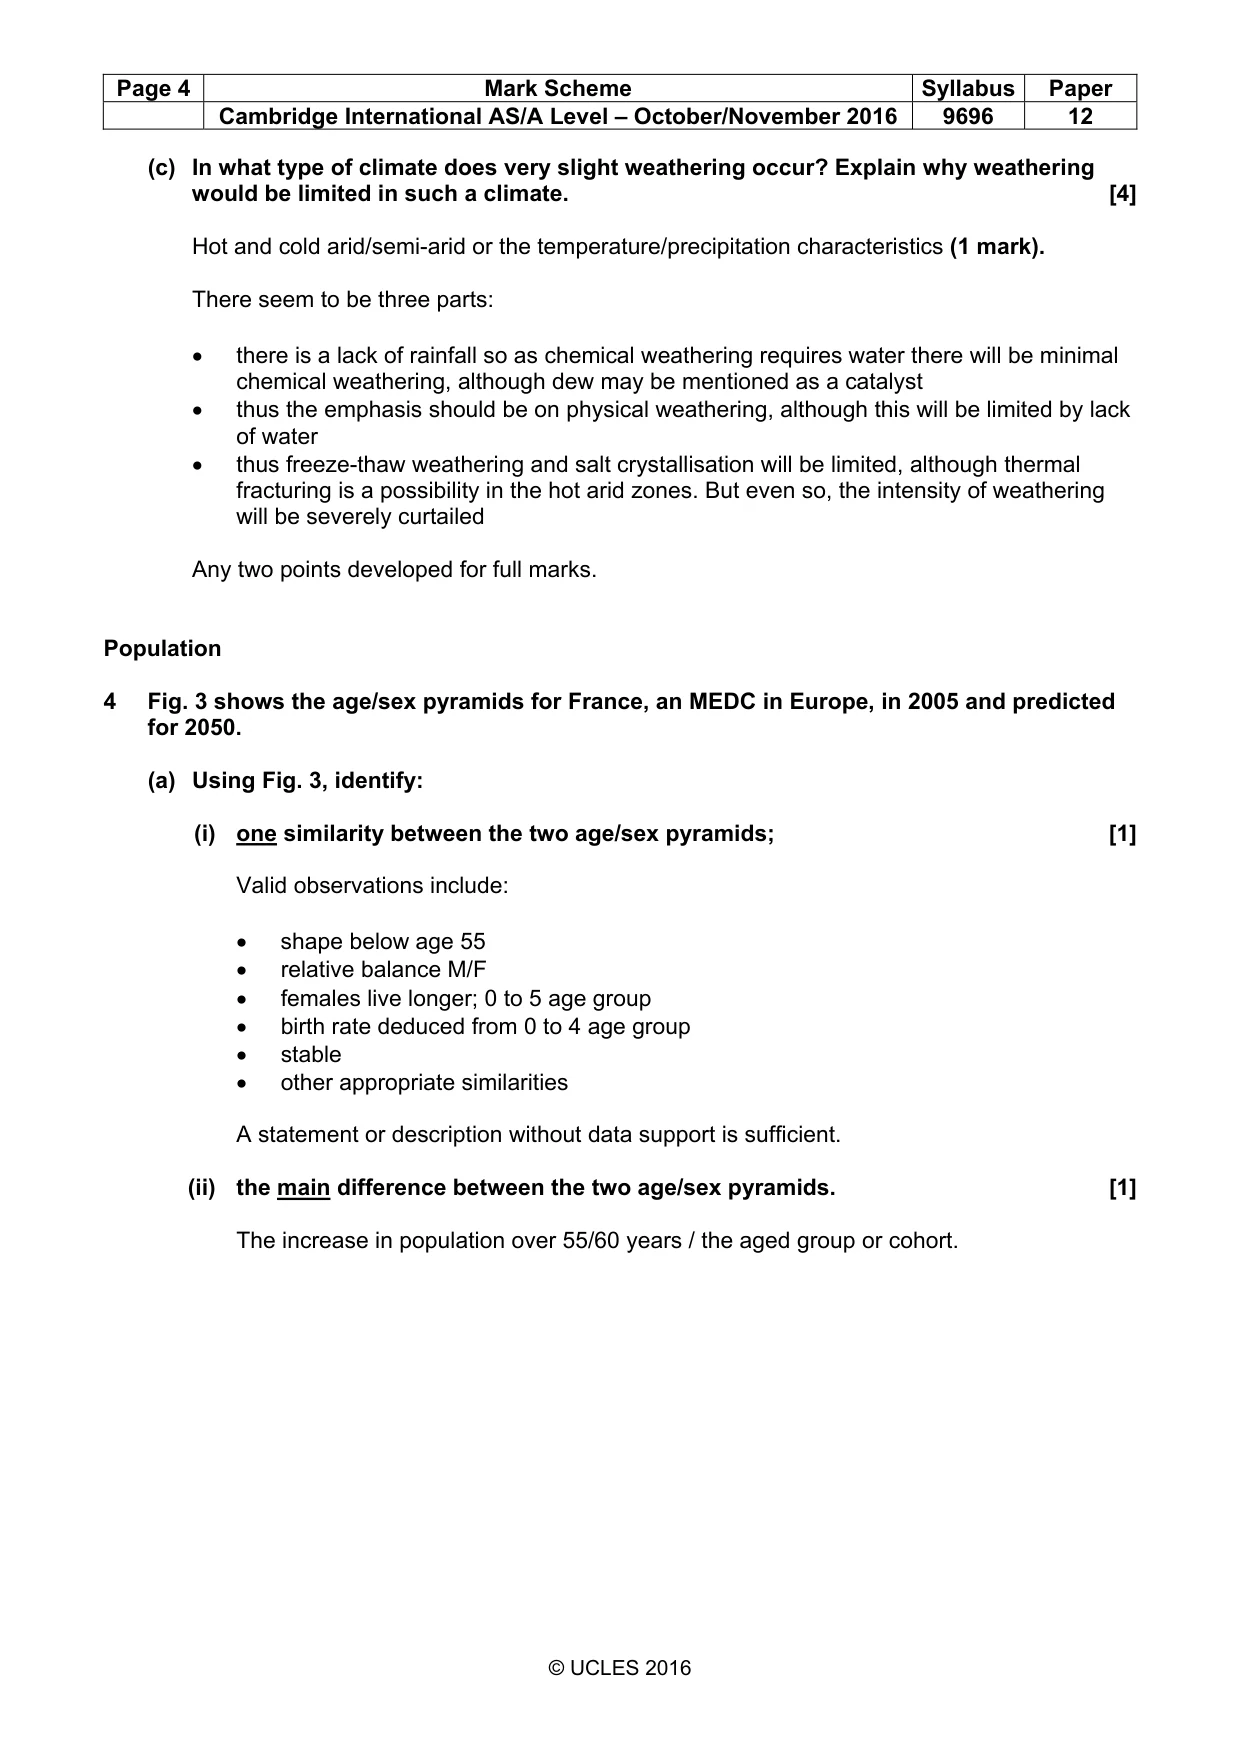
Page 4 Mark Scheme Syllabus Paper Cambridge International AS/A Level – October/November 2016 9696 12 © UCLES 2016 (c) In what type of climate does very slight weathering occur? Explain why weathering would be limited in such a climate. [4] Hot and cold arid/semi-arid or the temperature/precipitation characteristics (1 mark). There seem to be three parts: • there is a lack of rainfall so as chemical weathering requires water there will be minimal chemical weathering, although dew may be mentioned as a catalyst • thus the emphasis should be on physical weathering, although this will be limited by lack of water • thus freeze-thaw weathering and salt crystallisation will be limited, although thermal fracturing is a possibility in the hot arid zones. But even so, the intensity of weathering will be severely curtailed Any two points developed for full marks. Population 4 Fig. 3 shows the age/sex pyramids for France, an MEDC in Europe, in 2005 and predicted for 2050. (a) Using Fig. 3, identify: (i) one similarity between the two age/sex pyramids; [1] Valid observations include: • shape below age 55 • relative balance M/F • females live longer; 0 to 5 age group • birth rate deduced from 0 to 4 age group • stable • other appropriate similarities A statement or description without data support is sufficient. (ii) the main difference between the two age/sex pyramids. [1] The increase in population over 55/60 years / the aged group or cohort.
Mark scheme, page 5
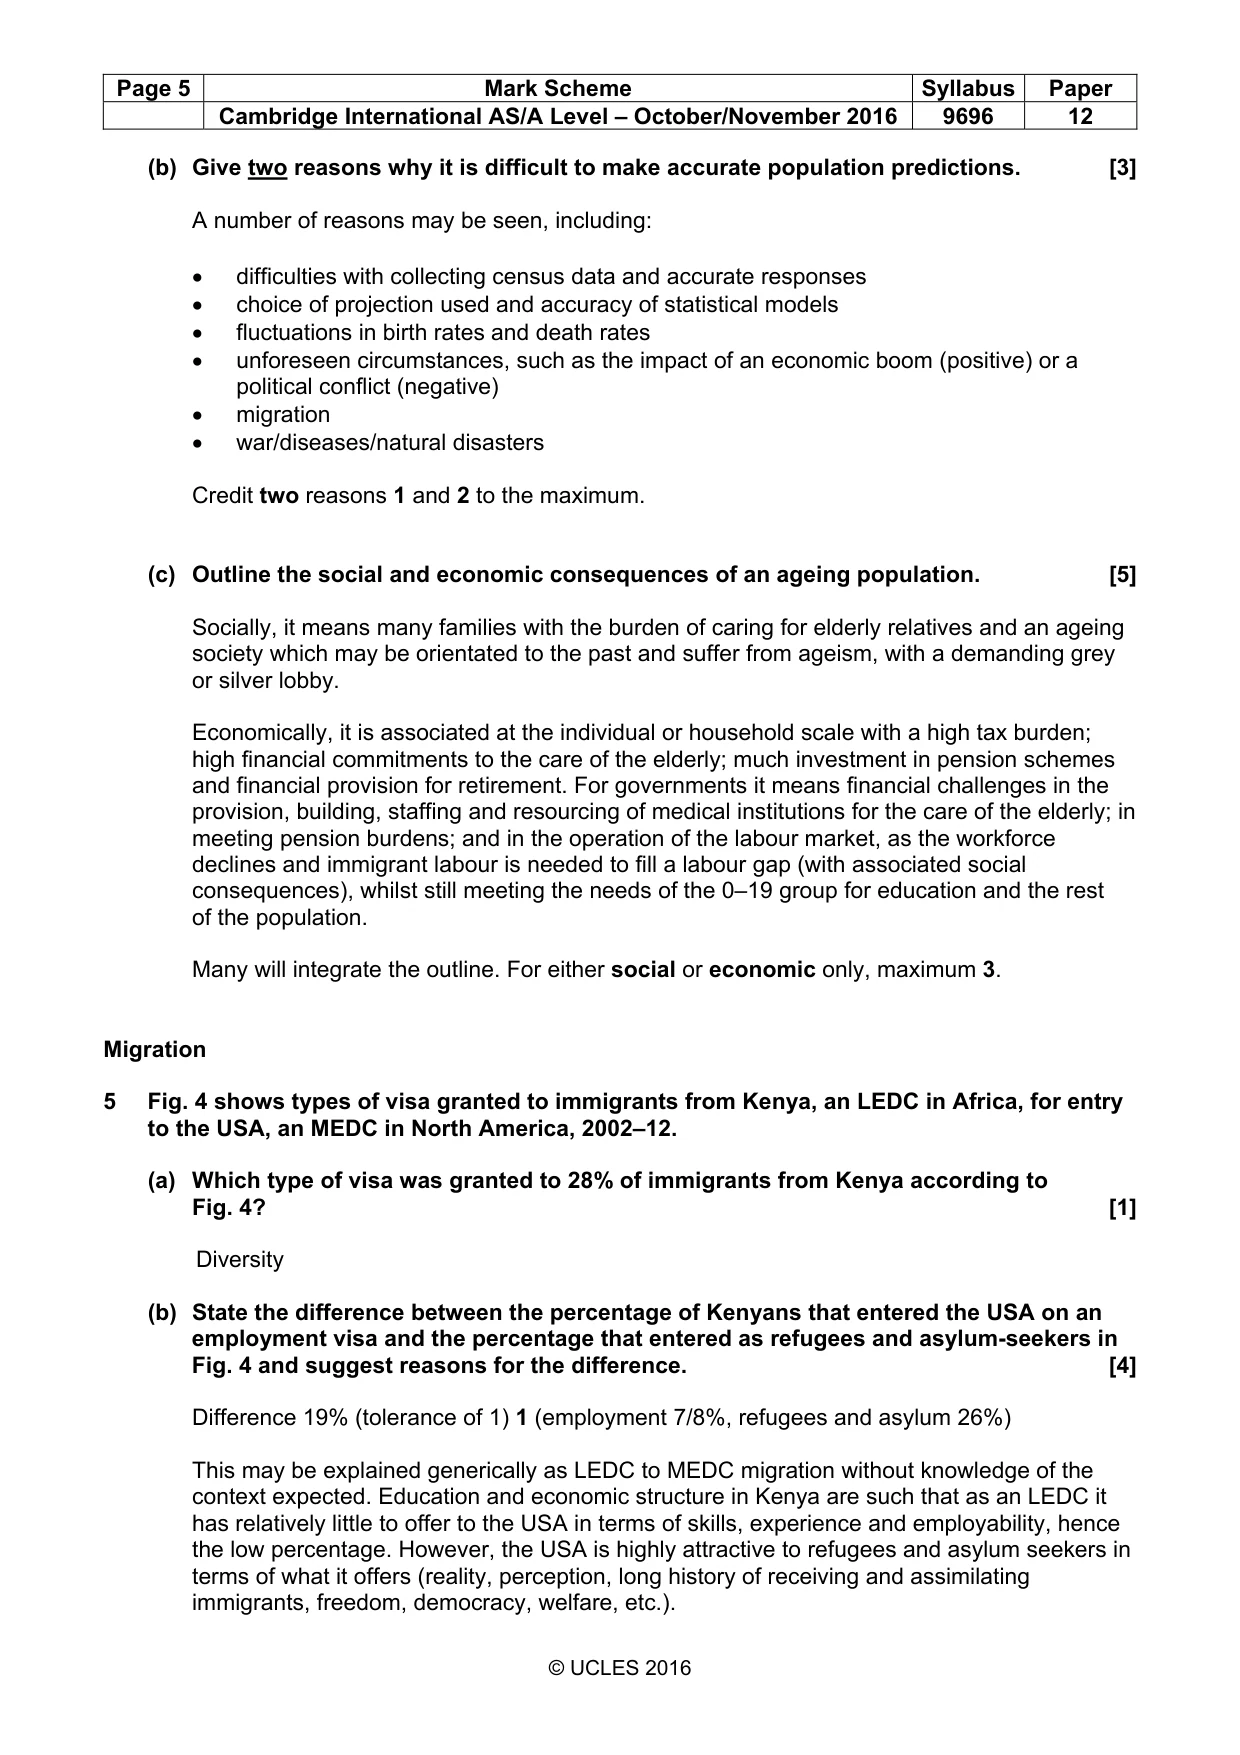
Page 5 Mark Scheme Syllabus Paper Cambridge International AS/A Level – October/November 2016 9696 12 © UCLES 2016 (b) Give two reasons why it is difficult to make accurate population predictions. [3] A number of reasons may be seen, including: • difficulties with collecting census data and accurate responses • choice of projection used and accuracy of statistical models • fluctuations in birth rates and death rates • unforeseen circumstances, such as the impact of an economic boom (positive) or a political conflict (negative) • migration • war/diseases/natural disasters Credit two reasons 1 and 2 to the maximum. (c) Outline the social and economic consequences of an ageing population. [5] Socially, it means many families with the burden of caring for elderly relatives and an ageing society which may be orientated to the past and suffer from ageism, with a demanding grey or silver lobby. Economically, it is associated at the individual or household scale with a high tax burden; high financial commitments to the care of the elderly; much investment in pension schemes and financial provision for retirement. For governments it means financial challenges in the provision, building, staffing and resourcing of medical institutions for the care of the elderly; in meeting pension burdens; and in the operation of the labour market, as the workforce declines and immigrant labour is needed to fill a labour gap (with associated social consequences), whilst still meeting the needs of the 0–19 group for education and the rest of the population. Many will integrate the outline. For either social or economic only, maximum 3. Migration 5 Fig. 4 shows types of visa granted to immigrants from Kenya, an LEDC in Africa, for entry to the USA, an MEDC in North America, 2002–12. (a) Which type of visa was granted to 28% of immigrants from Kenya according to Fig. 4? [1] Diversity (b) State the difference between the percentage of Kenyans that entered the USA on an employment visa and the percentage that entered as refugees and asylum-seekers in Fig. 4 and suggest reasons for the difference. [4] Difference 19% (tolerance of 1) 1 (employment 7/8%, refugees and asylum 26%) This may be explained generically as LEDC to MEDC migration without knowledge of the context expected. Education and economic structure in Kenya are such that as an LEDC it has relatively little to offer to the USA in terms of skills, experience and employability, hence the low percentage. However, the USA is highly attractive to refugees and asylum seekers in terms of what it offers (reality, perception, long history of receiving and assimilating immigrants, freedom, democracy, welfare, etc.).
Mark scheme, page 6
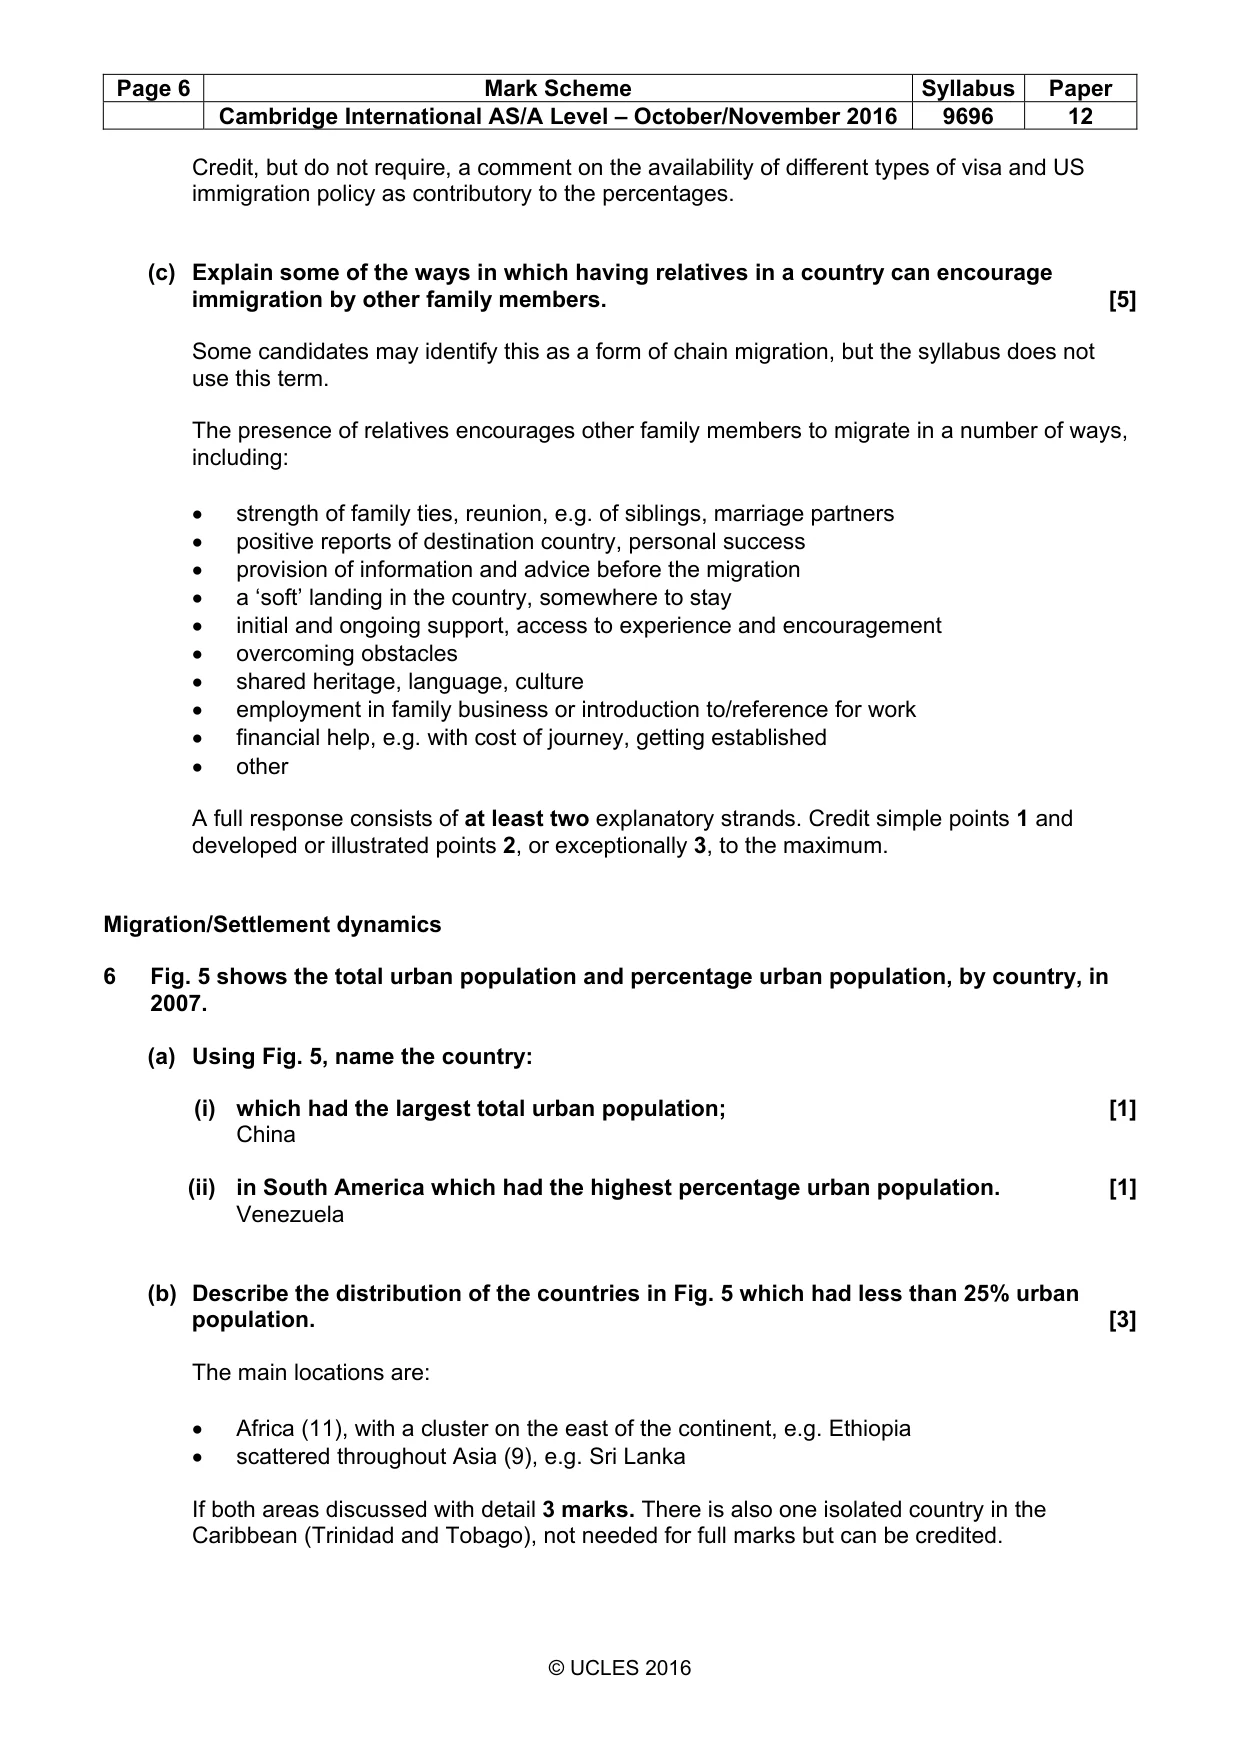
Page 6 Mark Scheme Syllabus Paper Cambridge International AS/A Level – October/November 2016 9696 12 © UCLES 2016 Credit, but do not require, a comment on the availability of different types of visa and US immigration policy as contributory to the percentages. (c) Explain some of the ways in which having relatives in a country can encourage immigration by other family members. [5] Some candidates may identify this as a form of chain migration, but the syllabus does not use this term. The presence of relatives encourages other family members to migrate in a number of ways, including: • strength of family ties, reunion, e.g. of siblings, marriage partners • positive reports of destination country, personal success • provision of information and advice before the migration • a ‘soft’ landing in the country, somewhere to stay • initial and ongoing support, access to experience and encouragement • overcoming obstacles • shared heritage, language, culture • employment in family business or introduction to/reference for work • financial help, e.g. with cost of journey, getting established • other A full response consists of at least two explanatory strands. Credit simple points 1 and developed or illustrated points 2, or exceptionally 3, to the maximum. Migration/Settlement dynamics 6 Fig. 5 shows the total urban population and percentage urban population, by country, in 2007. (a) Using Fig. 5, name the country: (i) which had the largest total urban population; [1] China (ii) in South America which had the highest percentage urban population. [1] Venezuela (b) Describe the distribution of the countries in Fig. 5 which had less than 25% urban population. [3] The main locations are: • Africa (11), with a cluster on the east of the continent, e.g. Ethiopia • scattered throughout Asia (9), e.g. Sri Lanka If both areas discussed with detail 3 marks. There is also one isolated country in the Caribbean (Trinidad and Tobago), not needed for full marks but can be credited.
Mark scheme, page 7
Page 7 Mark Scheme Syllabus Paper Cambridge International AS/A Level – October/November 2016 9696 12 © UCLES 2016 (c) Suggest reasons why percentage urban population varies between countries. [5] Candidates will work from their knowledge and understanding of urbanisation, the process of the concentration of population into towns and cities (urban settlements). The reasons may include: • stage in the urbanisation cycle/history of urbanisation • stage of economic development • nature of economy • role of migration, especially rural-urban migration • policy and planning in some countries • other relevant reasons Mark holistically on overall quality of reasoning provided. Candidates might use the information in Figure 5 but it is not essential.
Mark scheme, page 8
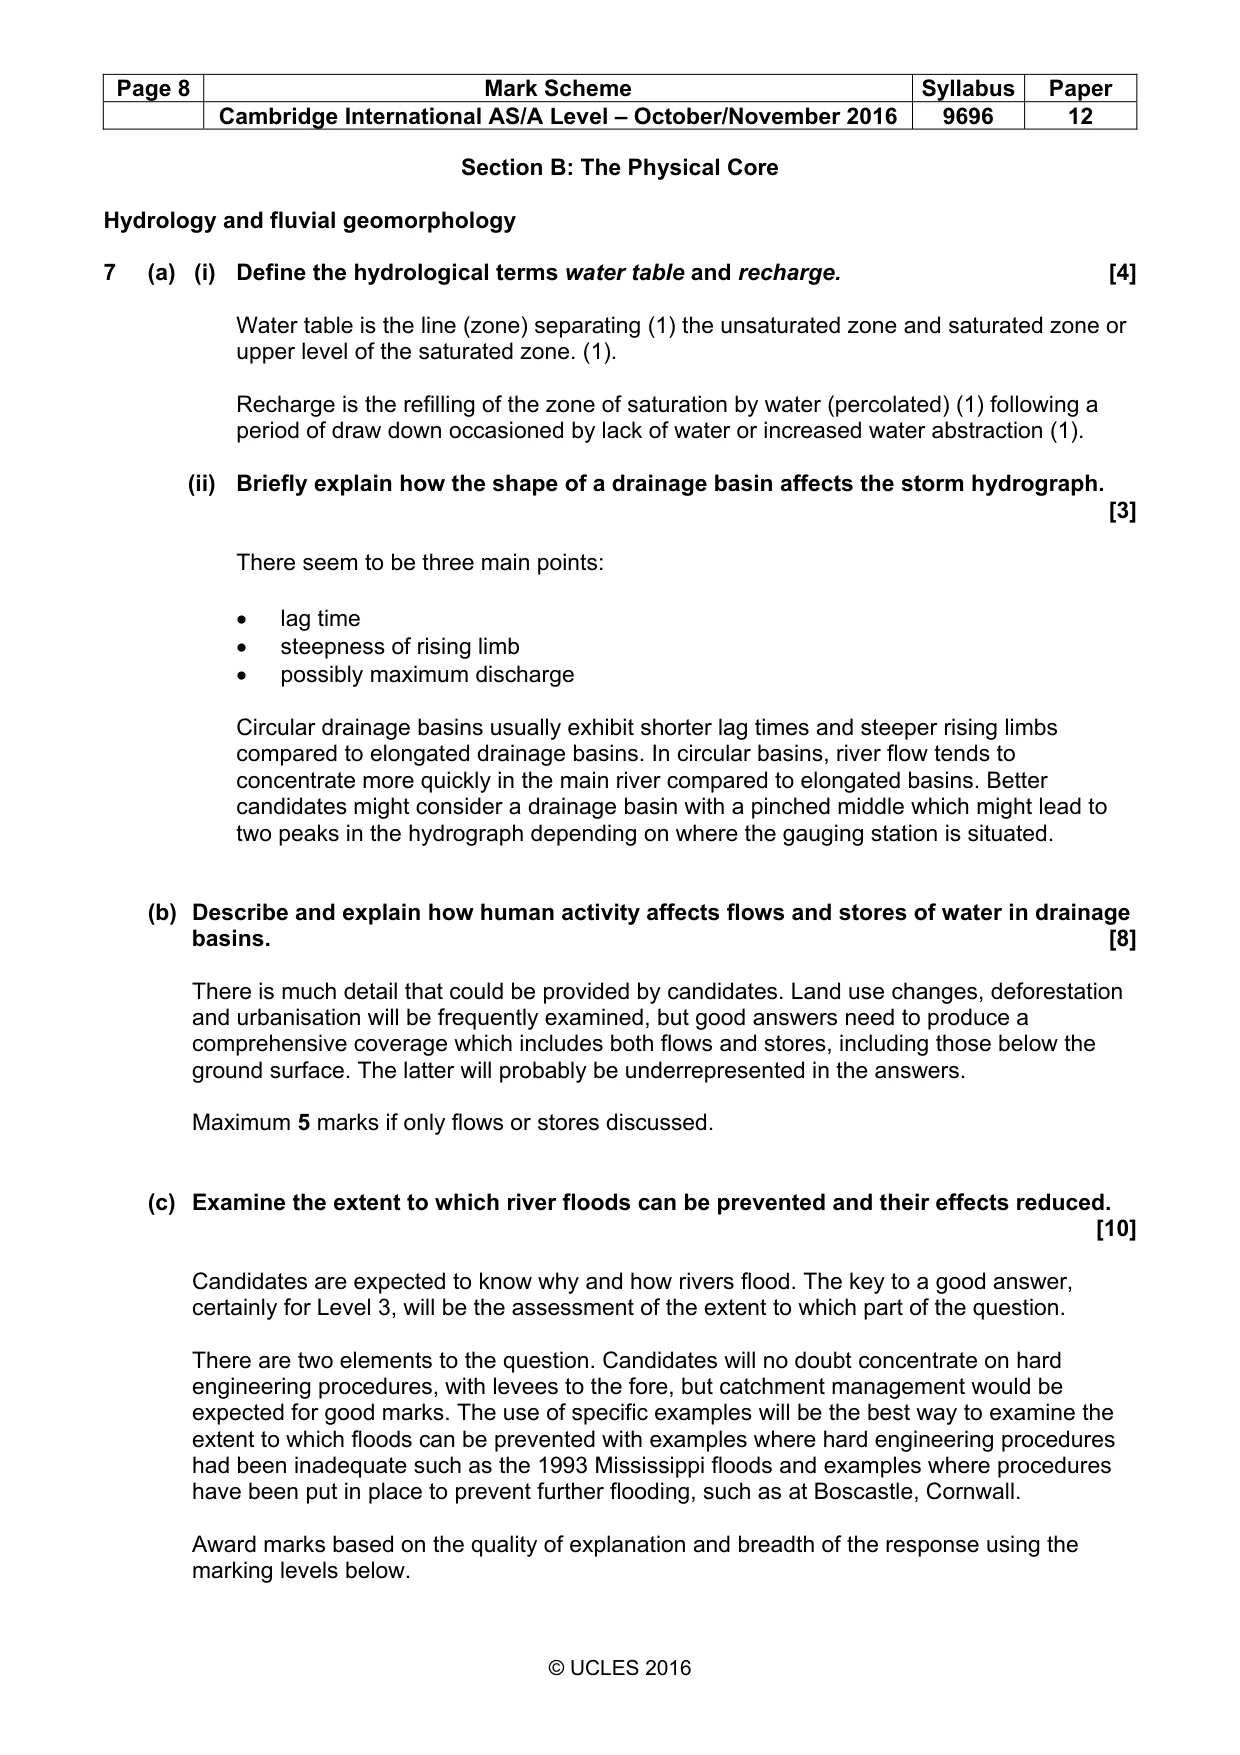
Page 8 Mark Scheme Syllabus Paper Cambridge International AS/A Level – October/November 2016 9696 12 © UCLES 2016 Section B: The Physical Core Hydrology and fluvial geomorphology 7 (a) (i) Define the hydrological terms water table and recharge. [4] Water table is the line (zone) separating (1) the unsaturated zone and saturated zone or upper level of the saturated zone. (1). Recharge is the refilling of the zone of saturation by water (percolated) (1) following a period of draw down occasioned by lack of water or increased water abstraction (1). (ii) Briefly explain how the shape of a drainage basin affects the storm hydrograph. [3] There seem to be three main points: • lag time • steepness of rising limb • possibly maximum discharge Circular drainage basins usually exhibit shorter lag times and steeper rising limbs compared to elongated drainage basins. In circular basins, river flow tends to concentrate more quickly in the main river compared to elongated basins. Better candidates might consider a drainage basin with a pinched middle which might lead to two peaks in the hydrograph depending on where the gauging station is situated. (b) Describe and explain how human activity affects flows and stores of water in drainage basins. [8] There is much detail that could be provided by candidates. Land use changes, deforestation and urbanisation will be frequently examined, but good answers need to produce a comprehensive coverage which includes both flows and stores, including those below the ground surface. The latter will probably be underrepresented in the answers. Maximum 5 marks if only flows or stores discussed. (c) Examine the extent to which river floods can be prevented and their effects reduced. [10] Candidates are expected to know why and how rivers flood. The key to a good answer, certainly for Level 3, will be the assessment of the extent to which part of the question. There are two elements to the question. Candidates will no doubt concentrate on hard engineering procedures, with levees to the fore, but catchment management would be expected for good marks. The use of specific examples will be the best way to examine the extent to which floods can be prevented with examples where hard engineering procedures had been inadequate such as the 1993 Mississippi floods and examples where procedures have been put in place to prevent further flooding, such as at Boscastle, Cornwall. Award marks based on the quality of explanation and breadth of the response using the marking levels below.
Mark scheme, page 9
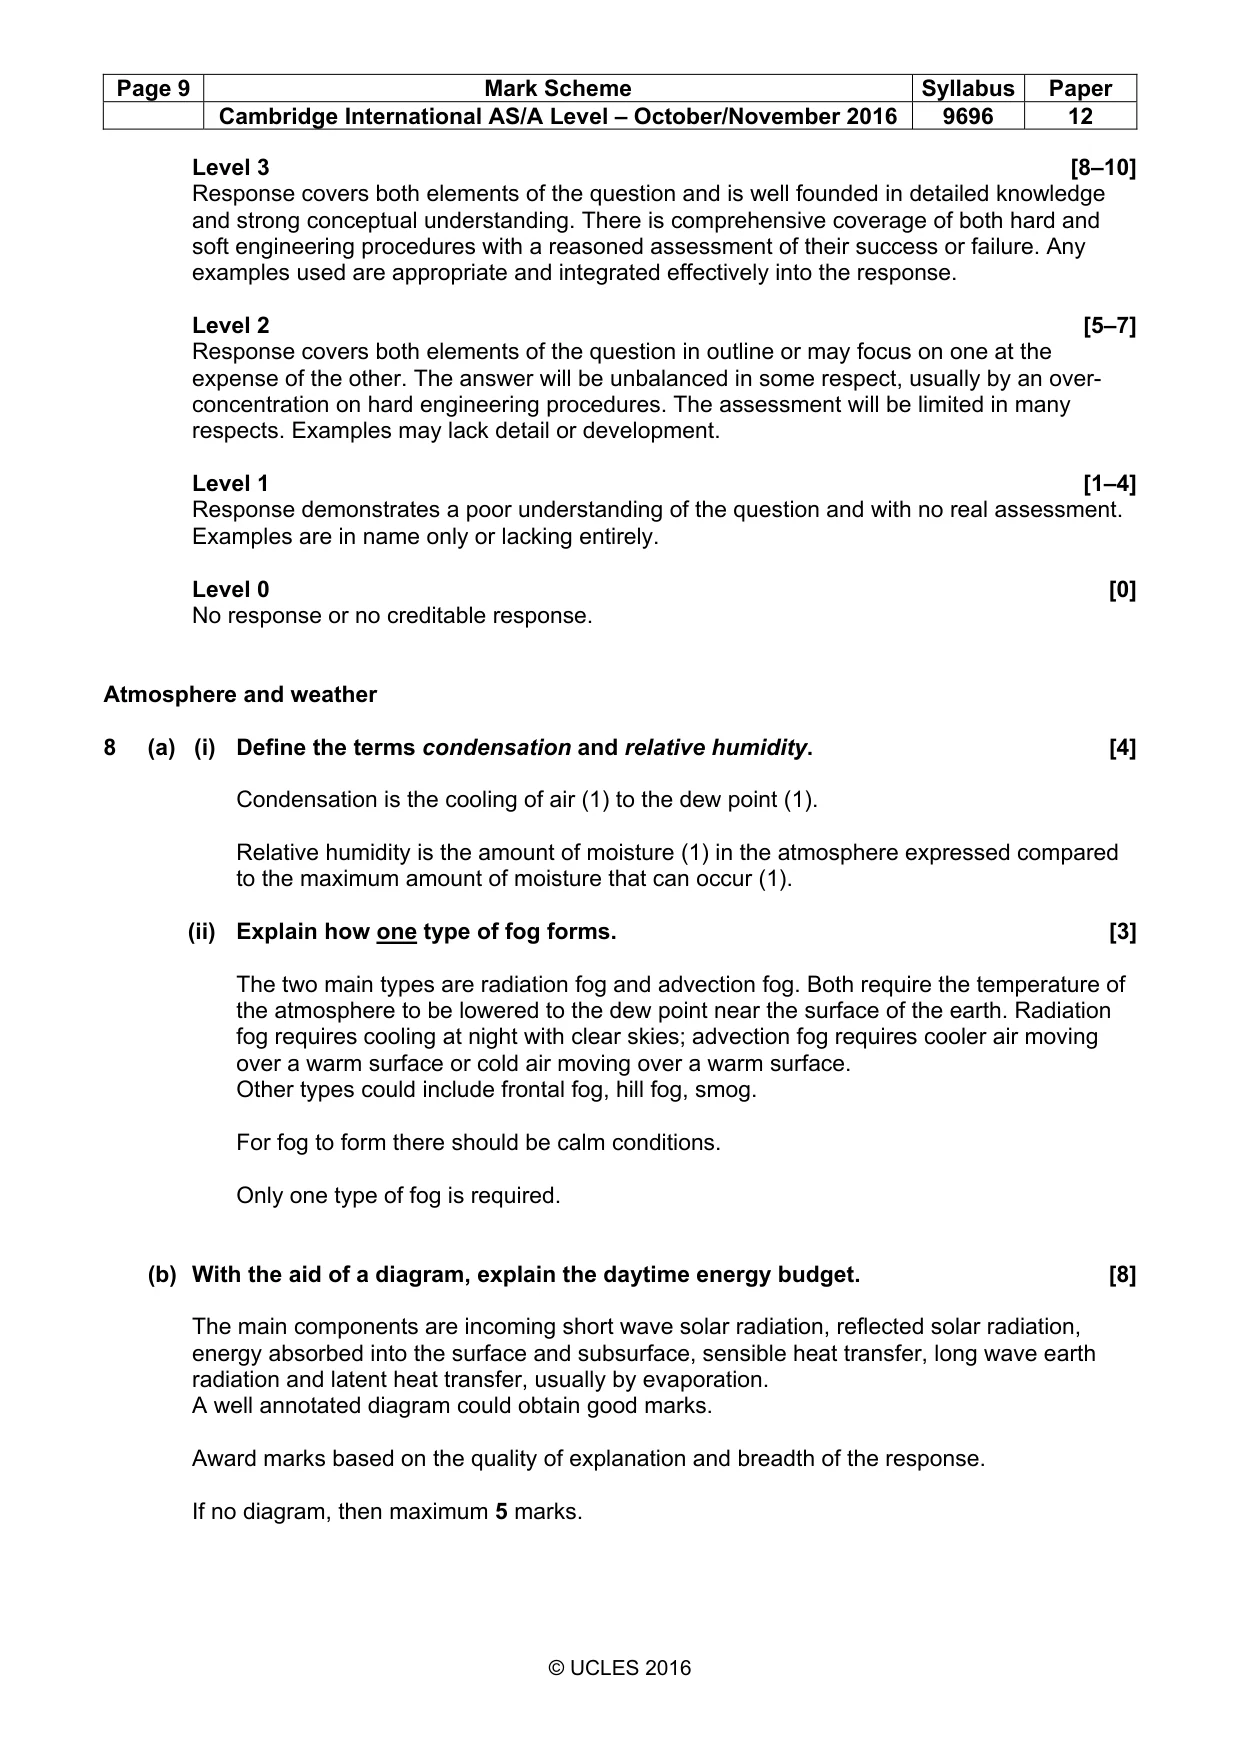
Page 9 Mark Scheme Syllabus Paper Cambridge International AS/A Level – October/November 2016 9696 12 © UCLES 2016 Level 3 [8–10] Response covers both elements of the question and is well founded in detailed knowledge and strong conceptual understanding. There is comprehensive coverage of both hard and soft engineering procedures with a reasoned assessment of their success or failure. Any examples used are appropriate and integrated effectively into the response. Level 2 [5–7] Response covers both elements of the question in outline or may focus on one at the expense of the other. The answer will be unbalanced in some respect, usually by an over- concentration on hard engineering procedures. The assessment will be limited in many respects. Examples may lack detail or development. Level 1 [1–4] Response demonstrates a poor understanding of the question and with no real assessment. Examples are in name only or lacking entirely. Level 0 [0] No response or no creditable response. Atmosphere and weather 8 (a) (i) Define the terms condensation and relative humidity. [4] Condensation is the cooling of air (1) to the dew point (1). Relative humidity is the amount of moisture (1) in the atmosphere expressed compared to the maximum amount of moisture that can occur (1). (ii) Explain how one type of fog forms. [3] The two main types are radiation fog and advection fog. Both require the temperature of the atmosphere to be lowered to the dew point near the surface of the earth. Radiation fog requires cooling at night with clear skies; advection fog requires cooler air moving over a warm surface or cold air moving over a warm surface. Other types could include frontal fog, hill fog, smog. For fog to form there should be calm conditions. Only one type of fog is required. (b) With the aid of a diagram, explain the daytime energy budget. [8] The main components are incoming short wave solar radiation, reflected solar radiation, energy absorbed into the surface and subsurface, sensible heat transfer, long wave earth radiation and latent heat transfer, usually by evaporation. A well annotated diagram could obtain good marks. Award marks based on the quality of explanation and breadth of the response. If no diagram, then maximum 5 marks.
Mark scheme, page 10
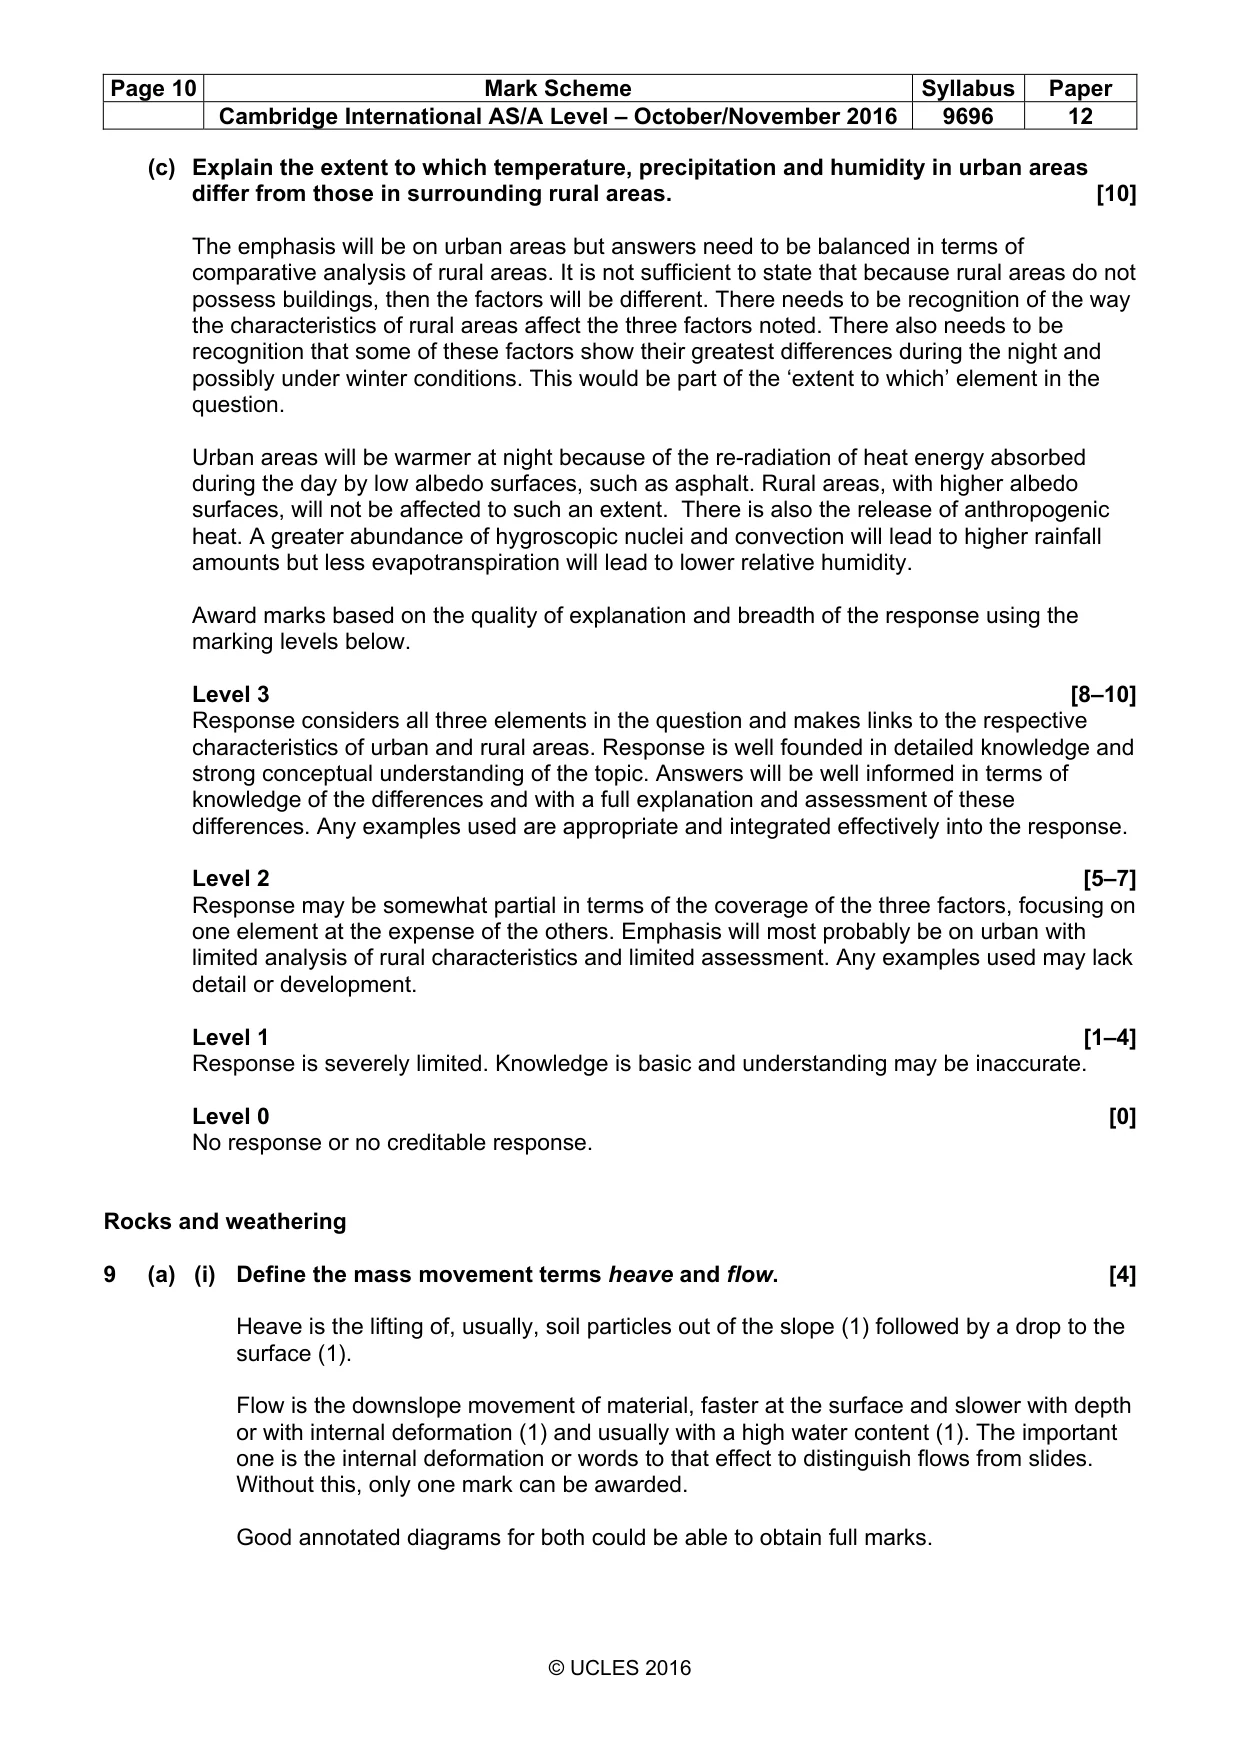
Page 10 Mark Scheme Syllabus Paper Cambridge International AS/A Level – October/November 2016 9696 12 © UCLES 2016 (c) Explain the extent to which temperature, precipitation and humidity in urban areas differ from those in surrounding rural areas. [10] The emphasis will be on urban areas but answers need to be balanced in terms of comparative analysis of rural areas. It is not sufficient to state that because rural areas do not possess buildings, then the factors will be different. There needs to be recognition of the way the characteristics of rural areas affect the three factors noted. There also needs to be recognition that some of these factors show their greatest differences during the night and possibly under winter conditions. This would be part of the ‘extent to which’ element in the question. Urban areas will be warmer at night because of the re-radiation of heat energy absorbed during the day by low albedo surfaces, such as asphalt. Rural areas, with higher albedo surfaces, will not be affected to such an extent. There is also the release of anthropogenic heat. A greater abundance of hygroscopic nuclei and convection will lead to higher rainfall amounts but less evapotranspiration will lead to lower relative humidity. Award marks based on the quality of explanation and breadth of the response using the marking levels below. Level 3 [8–10] Response considers all three elements in the question and makes links to the respective characteristics of urban and rural areas. Response is well founded in detailed knowledge and strong conceptual understanding of the topic. Answers will be well informed in terms of knowledge of the differences and with a full explanation and assessment of these differences. Any examples used are appropriate and integrated effectively into the response. Level 2 [5–7] Response may be somewhat partial in terms of the coverage of the three factors, focusing on one element at the expense of the others. Emphasis will most probably be on urban with limited analysis of rural characteristics and limited assessment. Any examples used may lack detail or development. Level 1 [1–4] Response is severely limited. Knowledge is basic and understanding may be inaccurate. Level 0 [0] No response or no creditable response. Rocks and weathering 9 (a) (i) Define the mass movement terms heave and flow. [4] Heave is the lifting of, usually, soil particles out of the slope (1) followed by a drop to the surface (1). Flow is the downslope movement of material, faster at the surface and slower with depth or with internal deformation (1) and usually with a high water content (1). The important one is the internal deformation or words to that effect to distinguish flows from slides. Without this, only one mark can be awarded. Good annotated diagrams for both could be able to obtain full marks.
Mark scheme, page 11
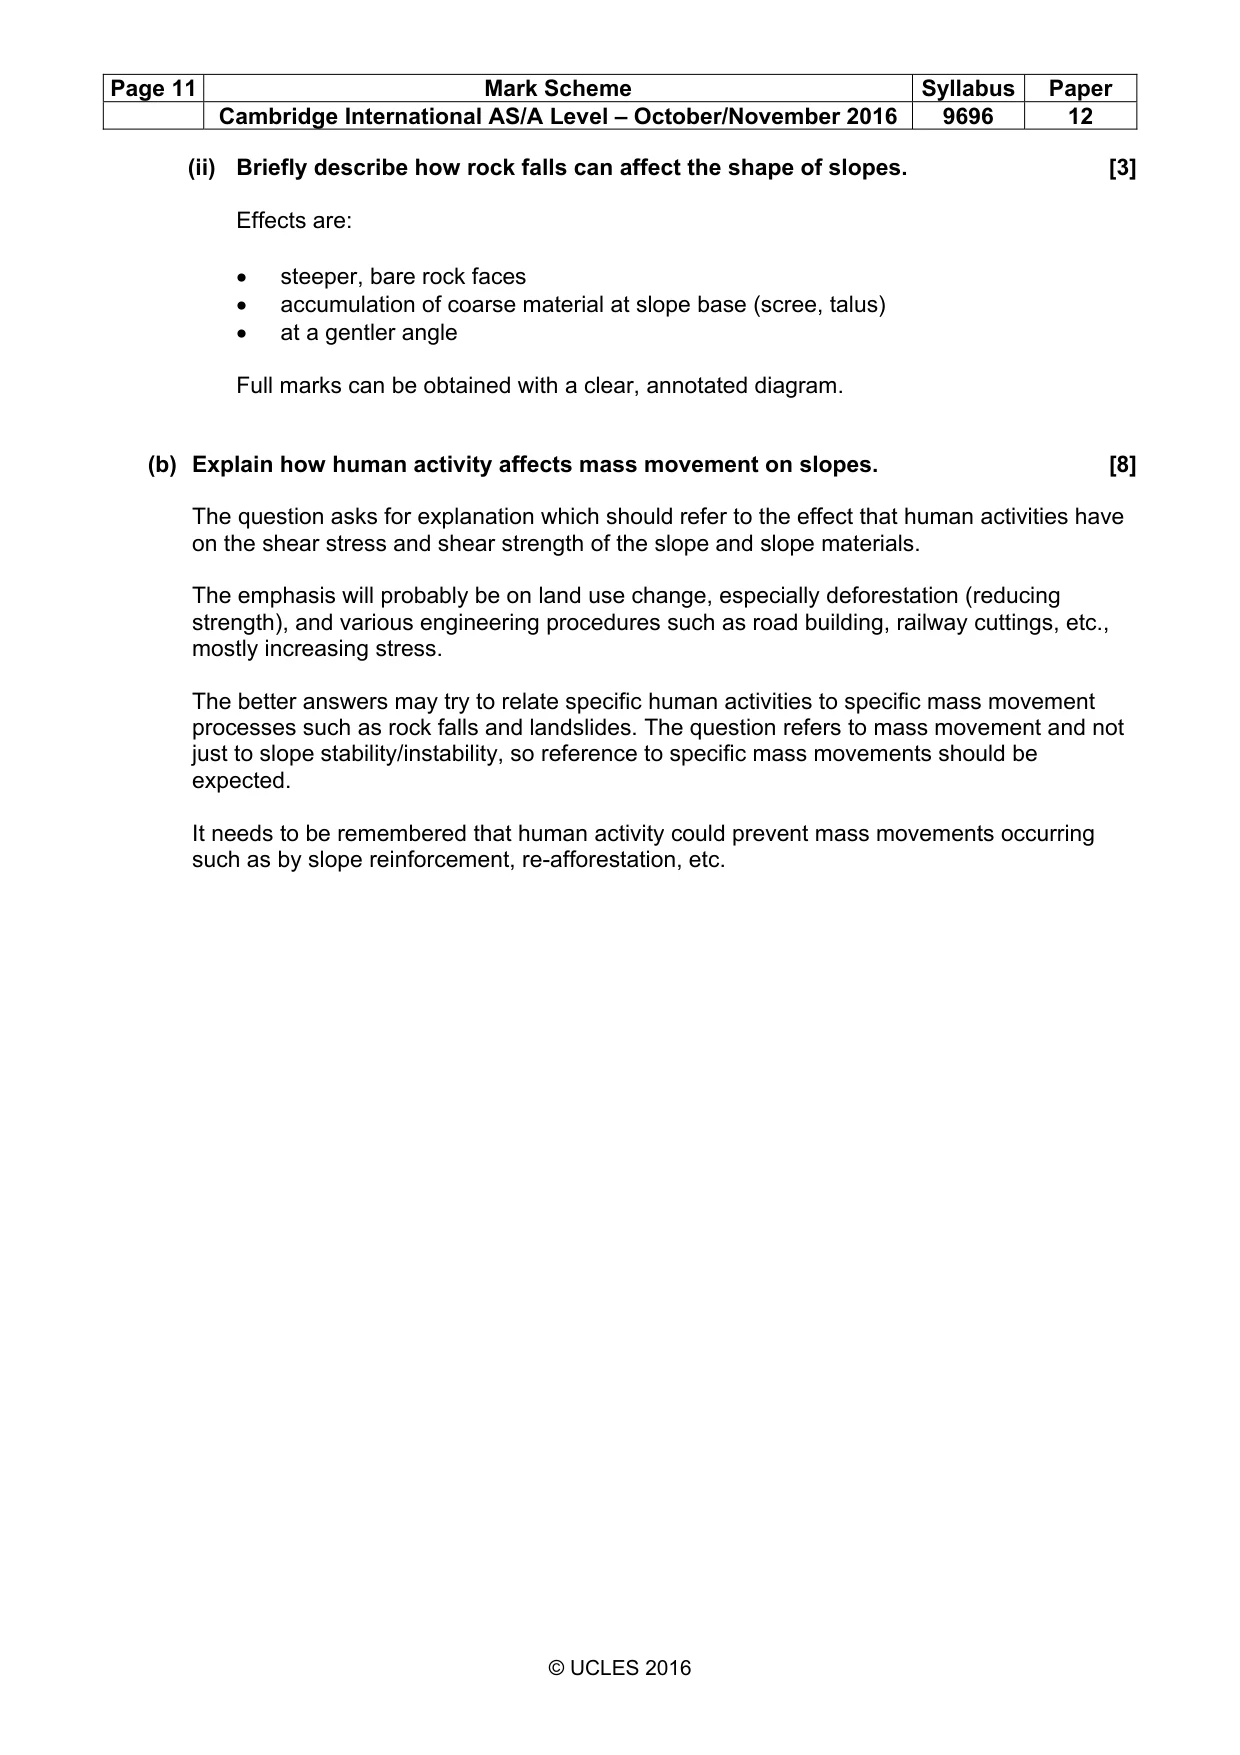
Page 11 Mark Scheme Syllabus Paper Cambridge International AS/A Level – October/November 2016 9696 12 © UCLES 2016 (ii) Briefly describe how rock falls can affect the shape of slopes. [3] Effects are: • steeper, bare rock faces • accumulation of coarse material at slope base (scree, talus) • at a gentler angle Full marks can be obtained with a clear, annotated diagram. (b) Explain how human activity affects mass movement on slopes. [8] The question asks for explanation which should refer to the effect that human activities have on the shear stress and shear strength of the slope and slope materials. The emphasis will probably be on land use change, especially deforestation (reducing strength), and various engineering procedures such as road building, railway cuttings, etc., mostly increasing stress. The better answers may try to relate specific human activities to specific mass movement processes such as rock falls and landslides. The question refers to mass movement and not just to slope stability/instability, so reference to specific mass movements should be expected. It needs to be remembered that human activity could prevent mass movements occurring such as by slope reinforcement, re-afforestation, etc.
Mark scheme, page 12
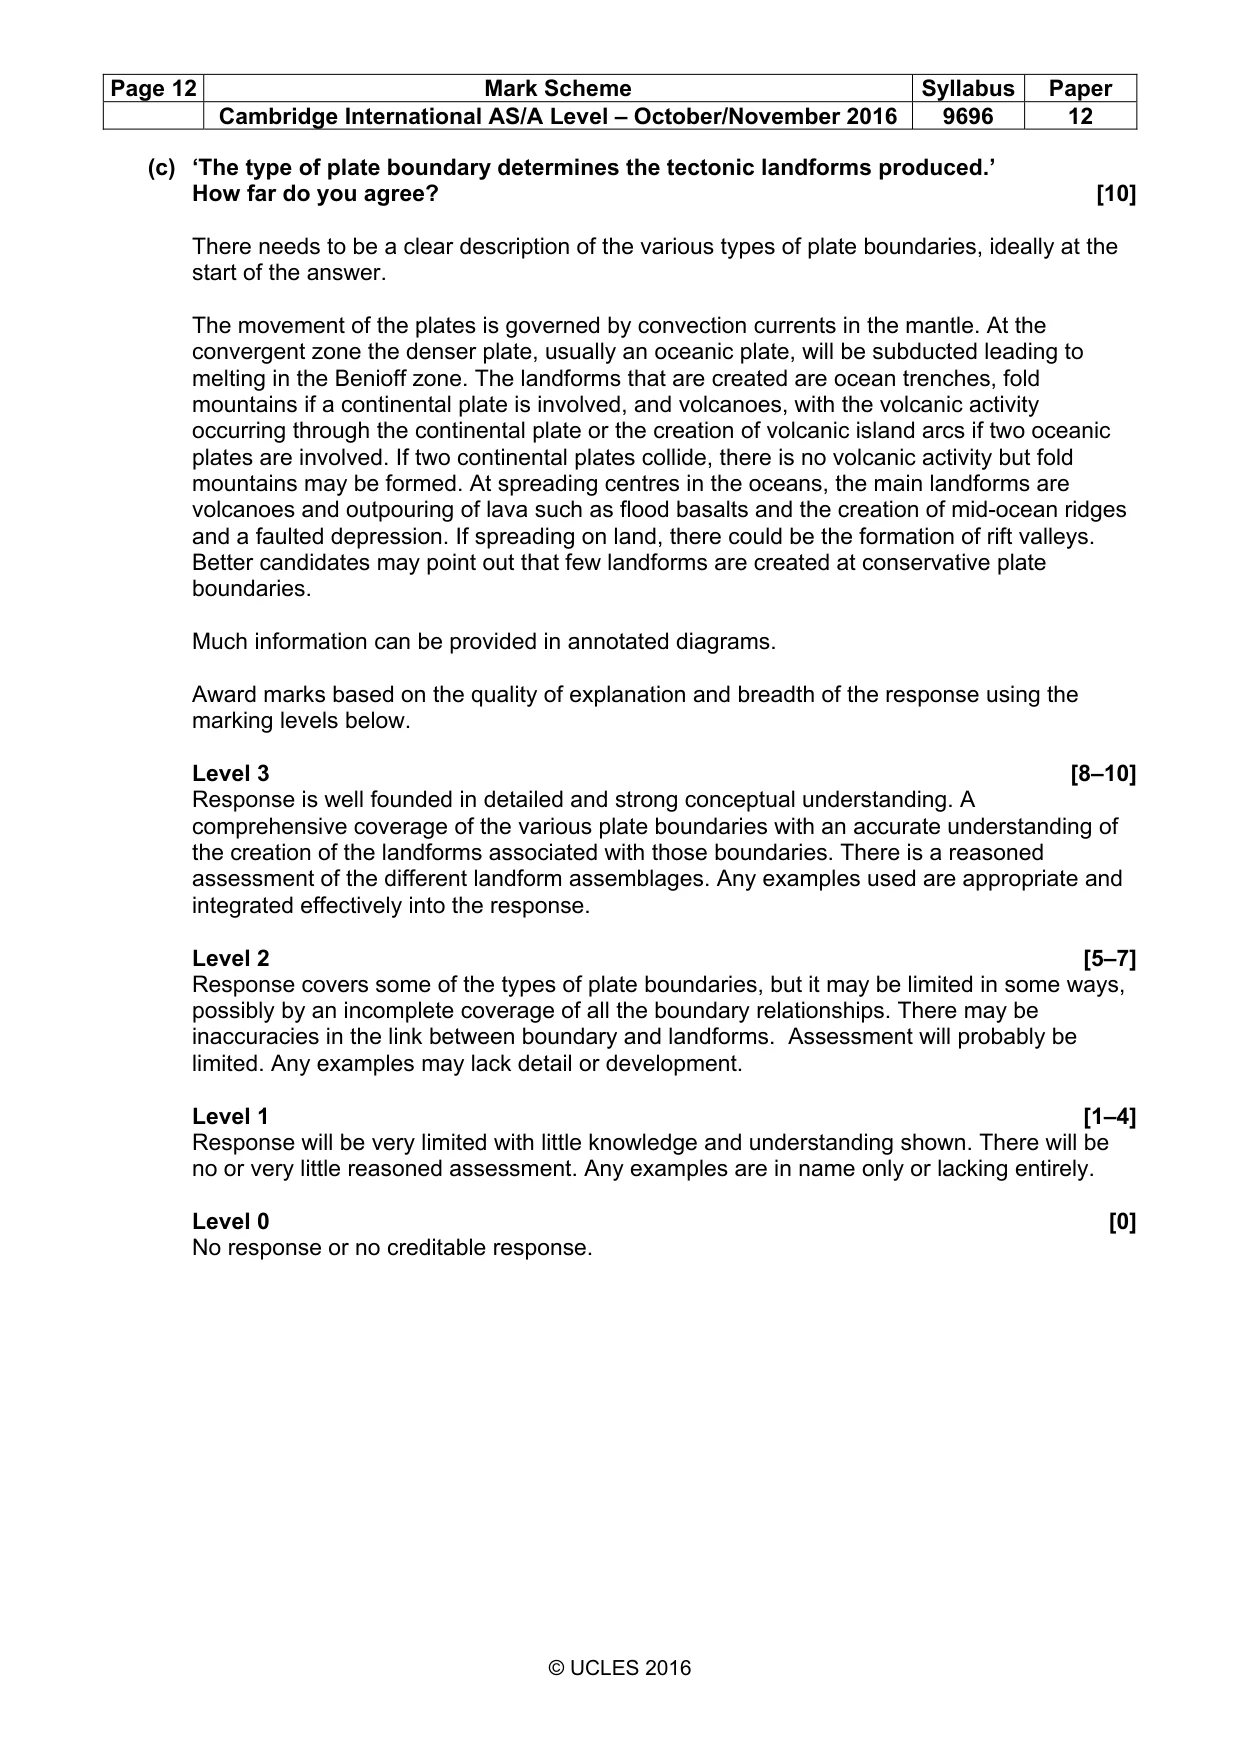
Page 12 Mark Scheme Syllabus Paper Cambridge International AS/A Level – October/November 2016 9696 12 © UCLES 2016 (c) ‘The type of plate boundary determines the tectonic landforms produced.’ How far do you agree? [10] There needs to be a clear description of the various types of plate boundaries, ideally at the start of the answer. The movement of the plates is governed by convection currents in the mantle. At the convergent zone the denser plate, usually an oceanic plate, will be subducted leading to melting in the Benioff zone. The landforms that are created are ocean trenches, fold mountains if a continental plate is involved, and volcanoes, with the volcanic activity occurring through the continental plate or the creation of volcanic island arcs if two oceanic plates are involved. If two continental plates collide, there is no volcanic activity but fold mountains may be formed. At spreading centres in the oceans, the main landforms are volcanoes and outpouring of lava such as flood basalts and the creation of mid-ocean ridges and a faulted depression. If spreading on land, there could be the formation of rift valleys. Better candidates may point out that few landforms are created at conservative plate boundaries. Much information can be provided in annotated diagrams. Award marks based on the quality of explanation and breadth of the response using the marking levels below. Level 3 [8–10] Response is well founded in detailed and strong conceptual understanding. A comprehensive coverage of the various plate boundaries with an accurate understanding of the creation of the landforms associated with those boundaries. There is a reasoned assessment of the different landform assemblages. Any examples used are appropriate and integrated effectively into the response. Level 2 [5–7] Response covers some of the types of plate boundaries, but it may be limited in some ways, possibly by an incomplete coverage of all the boundary relationships. There may be inaccuracies in the link between boundary and landforms. Assessment will probably be limited. Any examples may lack detail or development. Level 1 [1–4] Response will be very limited with little knowledge and understanding shown. There will be no or very little reasoned assessment. Any examples are in name only or lacking entirely. Level 0 [0] No response or no creditable response.
Mark scheme, page 13
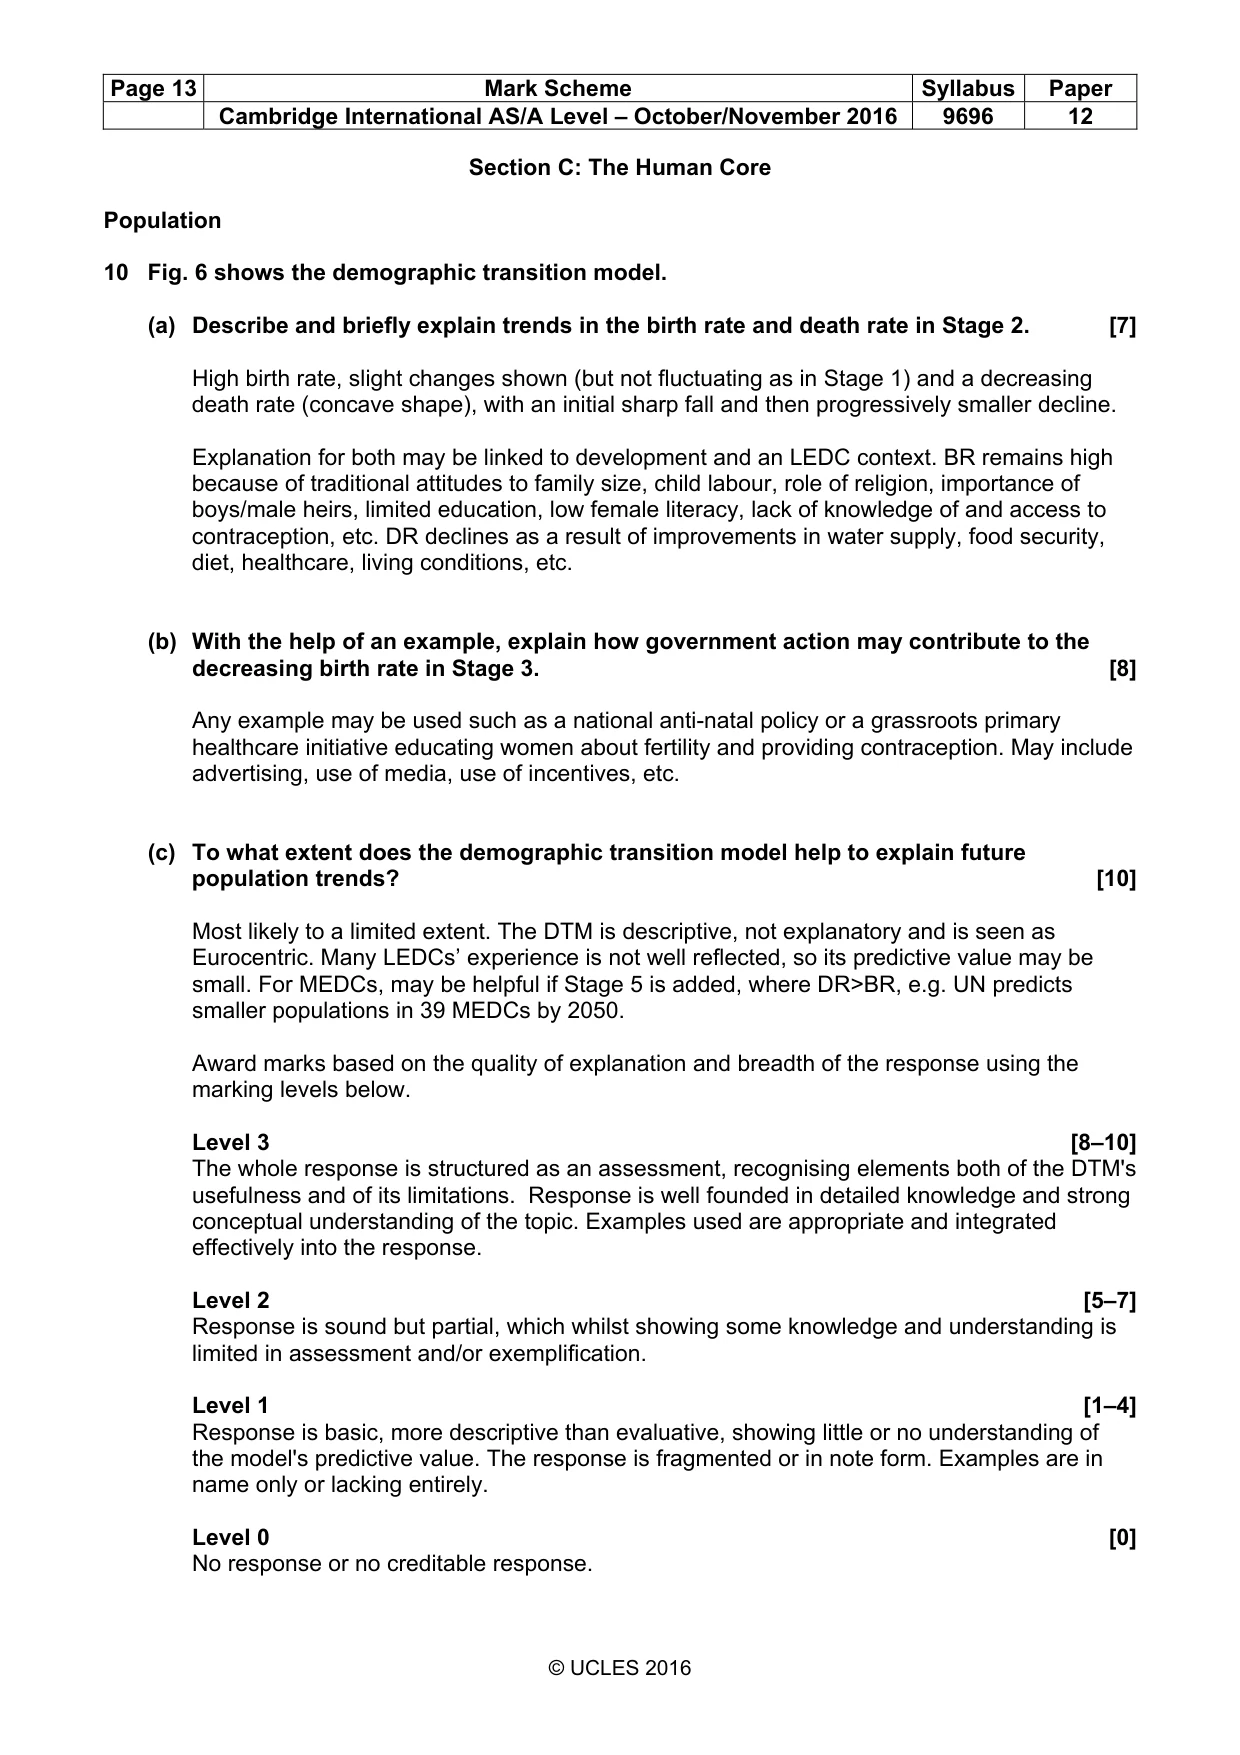
Page 13 Mark Scheme Syllabus Paper Cambridge International AS/A Level – October/November 2016 9696 12 © UCLES 2016 Section C: The Human Core Population 10 Fig. 6 shows the demographic transition model. (a) Describe and briefly explain trends in the birth rate and death rate in Stage 2. [7] High birth rate, slight changes shown (but not fluctuating as in Stage 1) and a decreasing death rate (concave shape), with an initial sharp fall and then progressively smaller decline. Explanation for both may be linked to development and an LEDC context. BR remains high because of traditional attitudes to family size, child labour, role of religion, importance of boys/male heirs, limited education, low female literacy, lack of knowledge of and access to contraception, etc. DR declines as a result of improvements in water supply, food security, diet, healthcare, living conditions, etc. (b) With the help of an example, explain how government action may contribute to the decreasing birth rate in Stage 3. [8] Any example may be used such as a national anti-natal policy or a grassroots primary healthcare initiative educating women about fertility and providing contraception. May include advertising, use of media, use of incentives, etc. (c) To what extent does the demographic transition model help to explain future population trends? [10] Most likely to a limited extent. The DTM is descriptive, not explanatory and is seen as Eurocentric. Many LEDCs’ experience is not well reflected, so its predictive value may be small. For MEDCs, may be helpful if Stage 5 is added, where DR>BR, e.g. UN predicts smaller populations in 39 MEDCs by 2050. Award marks based on the quality of explanation and breadth of the response using the marking levels below. Level 3 [8–10] The whole response is structured as an assessment, recognising elements both of the DTM's usefulness and of its limitations. Response is well founded in detailed knowledge and strong conceptual understanding of the topic. Examples used are appropriate and integrated effectively into the response. Level 2 [5–7] Response is sound but partial, which whilst showing some knowledge and understanding is limited in assessment and/or exemplification. Level 1 [1–4] Response is basic, more descriptive than evaluative, showing little or no understanding of the model's predictive value. The response is fragmented or in note form. Examples are in name only or lacking entirely. Level 0 [0] No response or no creditable response.
Mark scheme, page 14
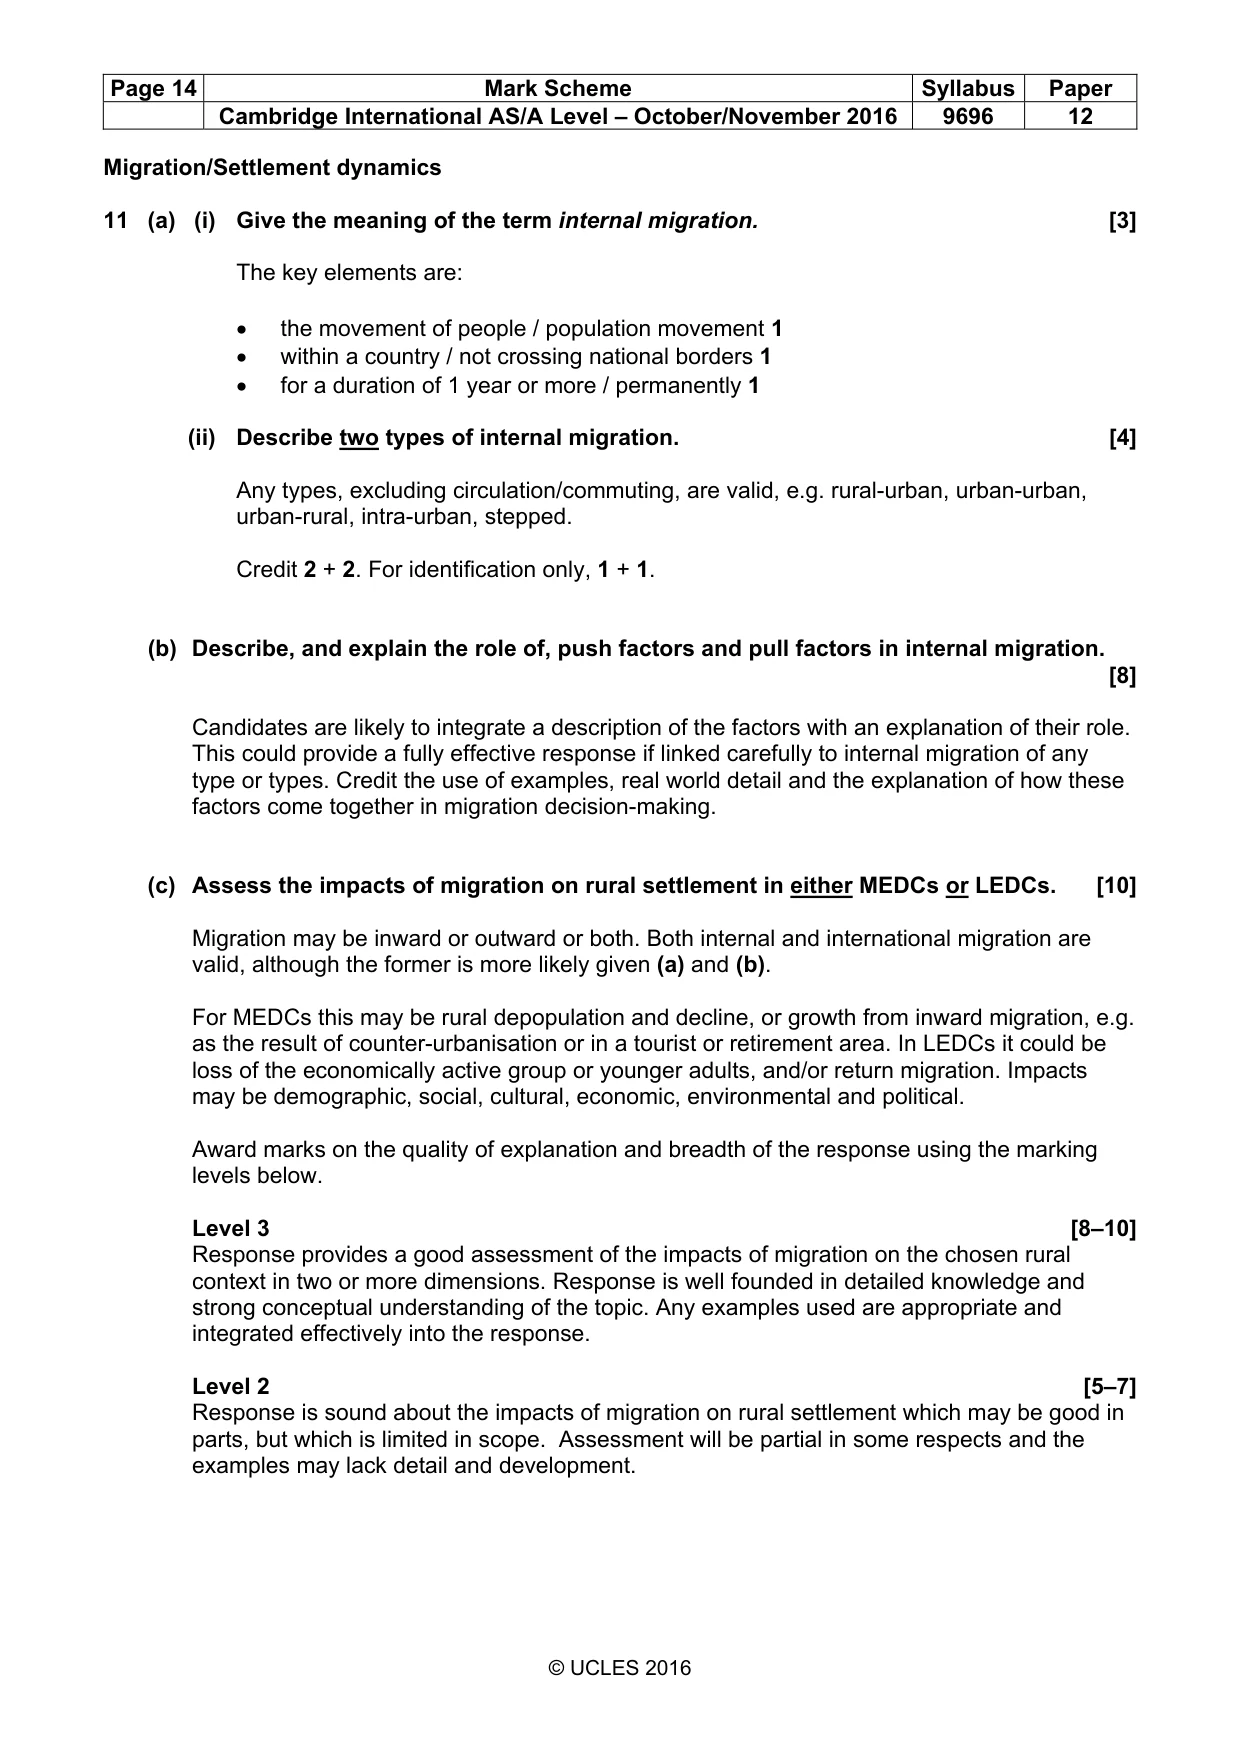
Page 14 Mark Scheme Syllabus Paper Cambridge International AS/A Level – October/November 2016 9696 12 © UCLES 2016 Migration/Settlement dynamics 11 (a) (i) Give the meaning of the term internal migration. [3] The key elements are: • the movement of people / population movement 1 • within a country / not crossing national borders 1 • for a duration of 1 year or more / permanently 1 (ii) Describe two types of internal migration. [4] Any types, excluding circulation/commuting, are valid, e.g. rural-urban, urban-urban, urban-rural, intra-urban, stepped. Credit 2 + 2. For identification only, 1 + 1. (b) Describe, and explain the role of, push factors and pull factors in internal migration. [8] Candidates are likely to integrate a description of the factors with an explanation of their role. This could provide a fully effective response if linked carefully to internal migration of any type or types. Credit the use of examples, real world detail and the explanation of how these factors come together in migration decision-making. (c) Assess the impacts of migration on rural settlement in either MEDCs or LEDCs. [10] Migration may be inward or outward or both. Both internal and international migration are valid, although the former is more likely given (a) and (b). For MEDCs this may be rural depopulation and decline, or growth from inward migration, e.g. as the result of counter-urbanisation or in a tourist or retirement area. In LEDCs it could be loss of the economically active group or younger adults, and/or return migration. Impacts may be demographic, social, cultural, economic, environmental and political. Award marks on the quality of explanation and breadth of the response using the marking levels below. Level 3 [8–10] Response provides a good assessment of the impacts of migration on the chosen rural context in two or more dimensions. Response is well founded in detailed knowledge and strong conceptual understanding of the topic. Any examples used are appropriate and integrated effectively into the response. Level 2 [5–7] Response is sound about the impacts of migration on rural settlement which may be good in parts, but which is limited in scope. Assessment will be partial in some respects and the examples may lack detail and development.
Mark scheme, page 15
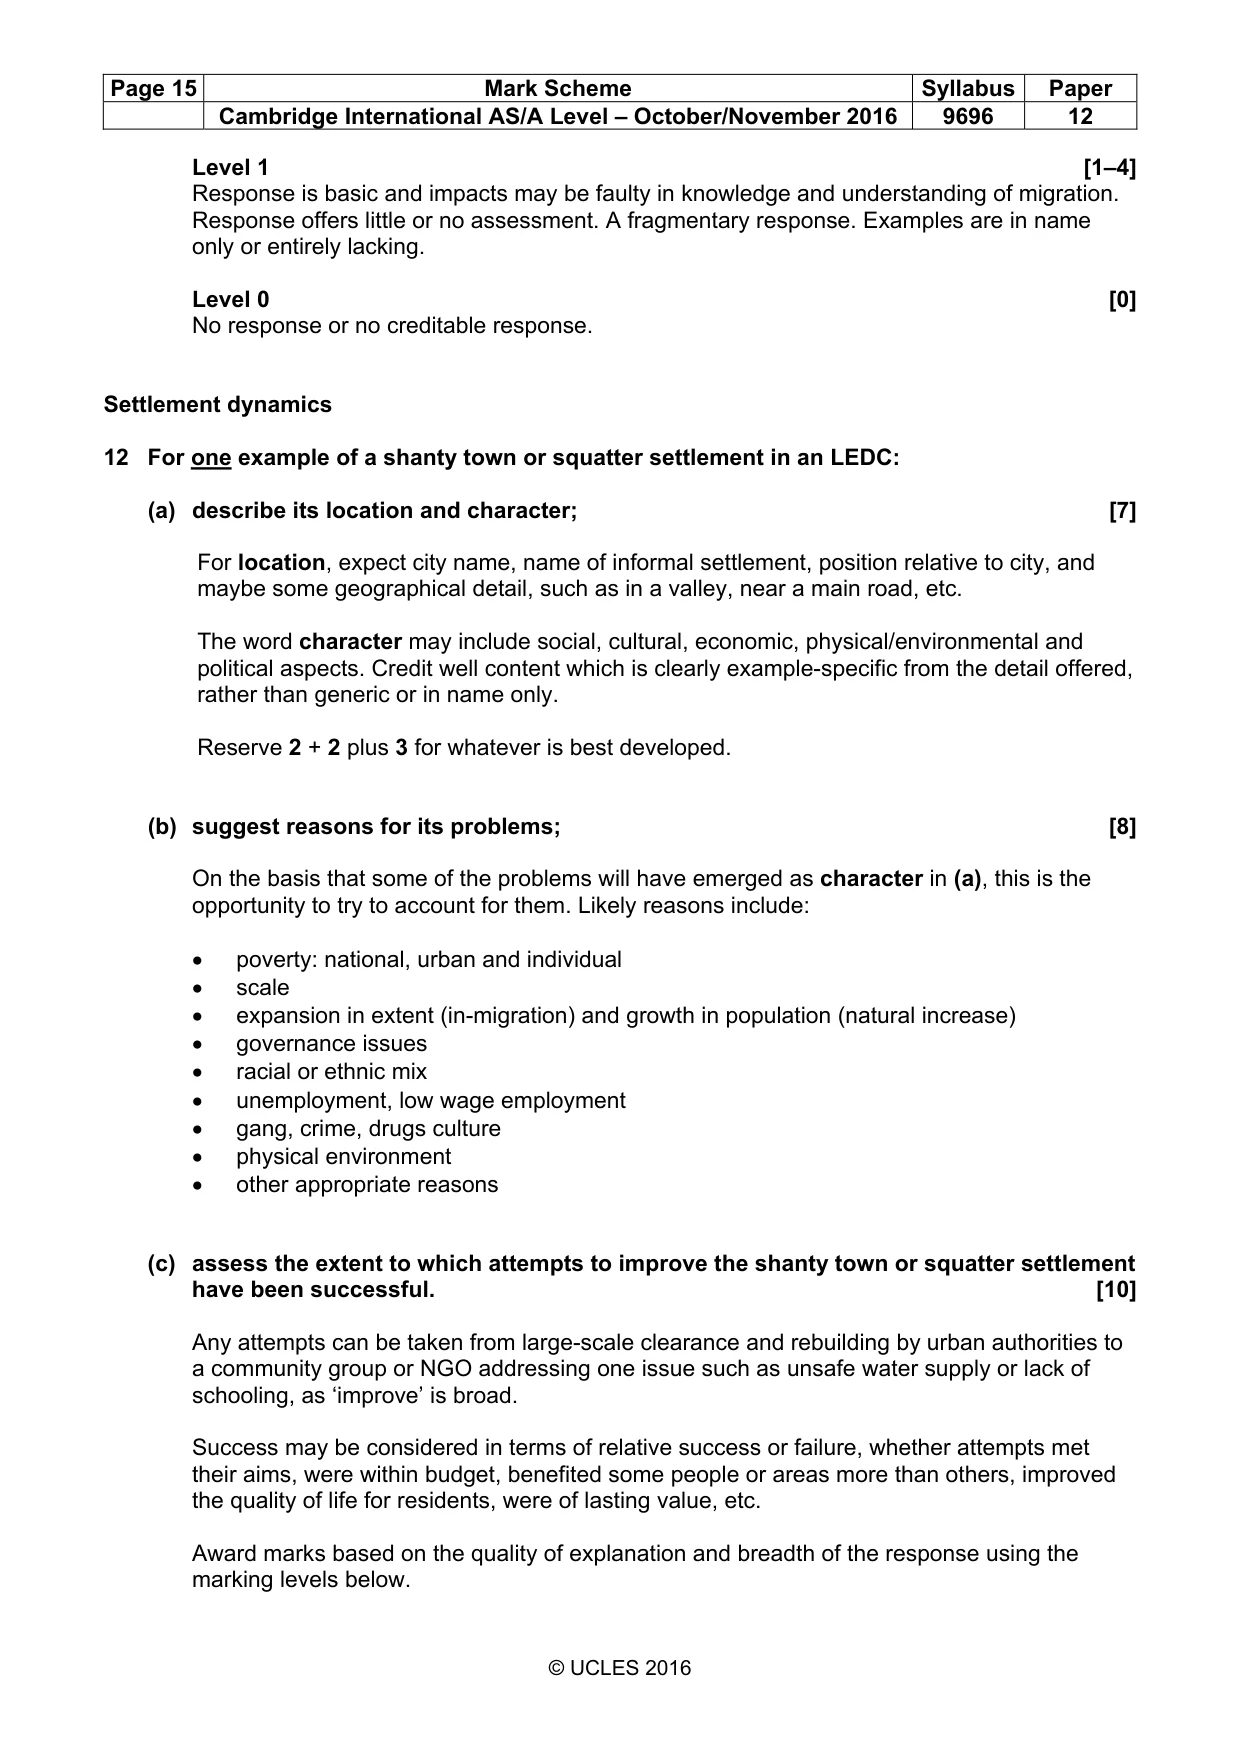
Page 15 Mark Scheme Syllabus Paper Cambridge International AS/A Level – October/November 2016 9696 12 © UCLES 2016 Level 1 [1–4] Response is basic and impacts may be faulty in knowledge and understanding of migration. Response offers little or no assessment. A fragmentary response. Examples are in name only or entirely lacking. Level 0 [0] No response or no creditable response. Settlement dynamics 12 For one example of a shanty town or squatter settlement in an LEDC: (a) describe its location and character; [7] For location, expect city name, name of informal settlement, position relative to city, and maybe some geographical detail, such as in a valley, near a main road, etc. The word character may include social, cultural, economic, physical/environmental and political aspects. Credit well content which is clearly example-specific from the detail offered, rather than generic or in name only. Reserve 2 + 2 plus 3 for whatever is best developed. (b) suggest reasons for its problems; [8] On the basis that some of the problems will have emerged as character in (a), this is the opportunity to try to account for them. Likely reasons include: • poverty: national, urban and individual • scale • expansion in extent (in-migration) and growth in population (natural increase) • governance issues • racial or ethnic mix • unemployment, low wage employment • gang, crime, drugs culture • physical environment • other appropriate reasons (c) assess the extent to which attempts to improve the shanty town or squatter settlement have been successful. [10] Any attempts can be taken from large-scale clearance and rebuilding by urban authorities to a community group or NGO addressing one issue such as unsafe water supply or lack of schooling, as ‘improve’ is broad. Success may be considered in terms of relative success or failure, whether attempts met their aims, were within budget, benefited some people or areas more than others, improved the quality of life for residents, were of lasting value, etc. Award marks based on the quality of explanation and breadth of the response using the marking levels below.
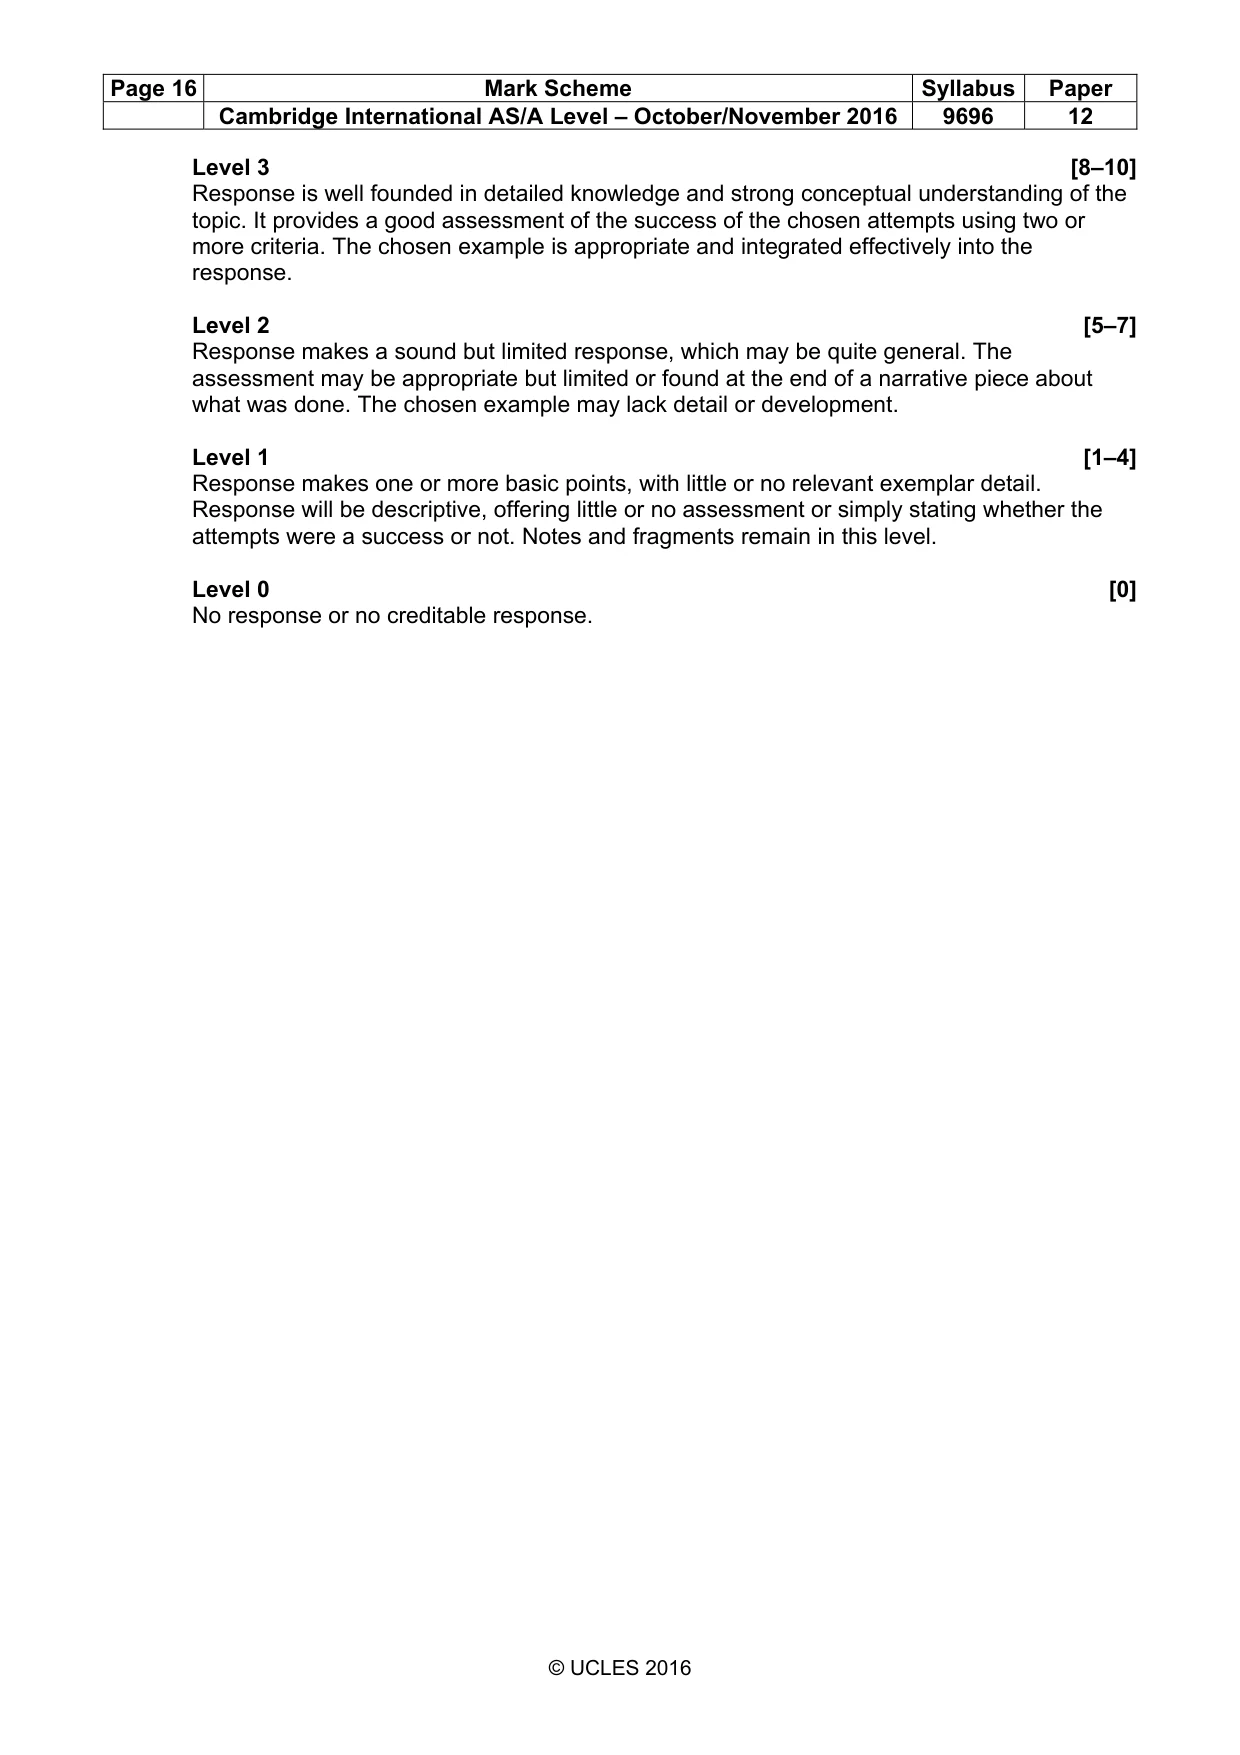
Mark scheme, page 16
Page 16 Mark Scheme Syllabus Paper Cambridge International AS/A Level – October/November 2016 9696 12 © UCLES 2016 Level 3 [8–10] Response is well founded in detailed knowledge and strong conceptual understanding of the topic. It provides a good assessment of the success of the chosen attempts using two or more criteria. The chosen example is appropriate and integrated effectively into the response. Level 2 [5–7] Response makes a sound but limited response, which may be quite general. The assessment may be appropriate but limited or found at the end of a narrative piece about what was done. The chosen example may lack detail or development. Level 1 [1–4] Response makes one or more basic points, with little or no relevant exemplar detail. Response will be descriptive, offering little or no assessment or simply stating whether the attempts were a success or not. Notes and fragments remain in this level. Level 0 [0] No response or no creditable response.
What you needed in this session
Cambridge’s own grade thresholds for 2016 Oct/Nov, Paper 1 · Variant 2. A higher threshold means an easier paper — the bar moves with how the cohort did.