Cambridge A Level Geography 9696 — 2024 May/June Paper 1 · Variant 3
9696/13/M/J/24 · 60 marks · ≈68 min
The question paper and its mark scheme, free to read here and free to download. This is Cambridge’s own paper, exactly as it was sat.
Question paper4 pages

Mark scheme16 pages
Answers below. Sit the paper first if you are practising.
Paper as text
Question paper, page 1
This document has 4 pages. Any blank pages are indicated. [Turn over Cambridge International AS & A Level GEOGRAPHY 9696/13 Paper 1 Core Physical Geography May/June 2024 1 hour 30 minutes You must answer on the enclosed answer booklet. You will need: Answer booklet (enclosed) Insert (enclosed) INSTRUCTIONS ● Answer four questions in total: Section A: answer all questions. Section B: answer one question. ● Follow the instructions on the front cover of the answer booklet. If you need additional answer paper, ask the invigilator for a continuation booklet. ● Sketch maps and diagrams should be drawn whenever they serve to illustrate an answer. INFORMATION ● The total mark for this paper is 60. ● The number of marks for each question or part question is shown in brackets [ ]. ● The insert contains all the resources referred to in the questions. DC (SL) 343638 © UCLES 2024 * 5 5 1 3 0 9 1 2 5 2 *
Question paper, page 2
2 9696/13/M/J/24 © UCLES 2024 Section A Answer all questions in this section. All questions are worth 10 marks. Hydrology and fluvial geomorphology 1 Fig. 1.1 is a photograph which shows a river in Wales. (a) Name feature A shown in Fig. 1.1. [1] (b) Draw a sketch map of the area located at B in Fig. 1.1. Label the main features. [4] (c) Explain the formation of feature C shown in Fig. 1.1. [5] Atmosphere and weather 2 Fig. 2.1 is a satellite image of Hawaii, USA. Fig. 2.2 is a map of Hawaii, USA. (a) Estimate the proportion of cloud cover over Hawaii shown in Fig. 2.1. [1] (b) Describe the pattern of cloud cover shown in Fig. 2.1. [4] (c) Suggest reasons for the pattern of cloud cover shown in Fig. 2.1. [5] Rocks and weathering 3 Fig. 3.1 is a diagram which shows a mass movement classification. (a) (i) Name the type of mass movement found at X in Fig. 3.1. [1] (ii) Identify the type of mass movement shown in Fig. 3.1 which occurs at an intermediate rate of movement and is wet. [1] (b) Using Fig. 3.1, compare the water content and rate of movement for landslide and rockfall. [2] (c) Explain the differences between the mass movement processes of slide and flow. [6]
Question paper, page 3
3 9696/13/M/J/24 © UCLES 2024 Section B Answer one question from this section. All questions are worth 30 marks. Hydrology and fluvial geomorphology 4 (a) (i) Define the hydrological terms percolation and baseflow. [4] (ii) Describe how drainage basin shape affects discharge within drainage basins. [3] (b) Explain how recurrence intervals can be used in the prediction of flood risk. [8] (c) With the aid of a case study, evaluate the attempts to reduce the impact of a recent river flood event. [15] Atmosphere and weather 5 (a) (i) Define the atmospheric terms incoming solar radiation and evaporation. [4] (ii) Describe how land/sea distribution affects the seasonal variation of temperature. [3] (b) Explain the latitudinal pattern of radiation excesses and deficits. [8] (c) With the aid of a case study of an urban area, assess the extent to which human activity affects its climate. [15] Rocks and weathering 6 (a) (i) Define the terms subduction and conservative plate boundary. [4] (ii) Briefly explain the formation of volcanic island arcs. [3] (b) Explain how the strategies of afforestation and grading can be used to reduce mass movements. [8] (c) With the aid of examples, assess the extent to which types of weathering are influenced by climate. [15]
Question paper, page 4
4 9696/13/M/J/24 © UCLES 2024 The boundaries and names shown, the designations used and the presentation of material on any maps contained in this question paper/insert do not imply official endorsement or acceptance by Cambridge Assessment International Education concerning the legal status of any country, territory, or area or any of its authorities, or of the delimitation of its frontiers or boundaries. Permission to reproduce items where third-party owned material protected by copyright is included has been sought and cleared where possible. Every reasonable effort has been made by the publisher (UCLES) to trace copyright holders, but if any items requiring clearance have unwittingly been included, the publisher will be pleased to make amends at the earliest possible opportunity. To avoid the issue of disclosure of answer-related information to candidates, all copyright acknowledgements are reproduced online in the Cambridge Assessment International Education Copyright Acknowledgements Booklet. This is produced for each series of examinations and is freely available to download at www.cambridgeinternational.org after the live examination series. Cambridge Assessment International Education is part of Cambridge Assessment. Cambridge Assessment is the brand name of the University of Cambridge Local Examinations Syndicate (UCLES), which is a department of the University of Cambridge. BLANK PAGE
Mark scheme, page 1
This document consists of 16 printed pages. © Cambridge University Press & Assessment 2024 [Turn over Cambridge International AS & A Level GEOGRAPHY 9696/13 Paper 1 Core Physical Geography May/June 2024 MARK SCHEME Maximum Mark: 60 Published This mark scheme is published as an aid to teachers and candidates, to indicate the requirements of the examination. It shows the basis on which Examiners were instructed to award marks. It does not indicate the details of the discussions that took place at an Examiners’ meeting before marking began, which would have considered the acceptability of alternative answers. Mark schemes should be read in conjunction with the question paper and the Principal Examiner Report for Teachers. Cambridge International will not enter into discussions about these mark schemes. Cambridge International is publishing the mark schemes for the May/June 2024 series for most Cambridge IGCSE, Cambridge International A and AS Level and Cambridge Pre-U components, and some Cambridge O Level components.
Mark scheme, page 2
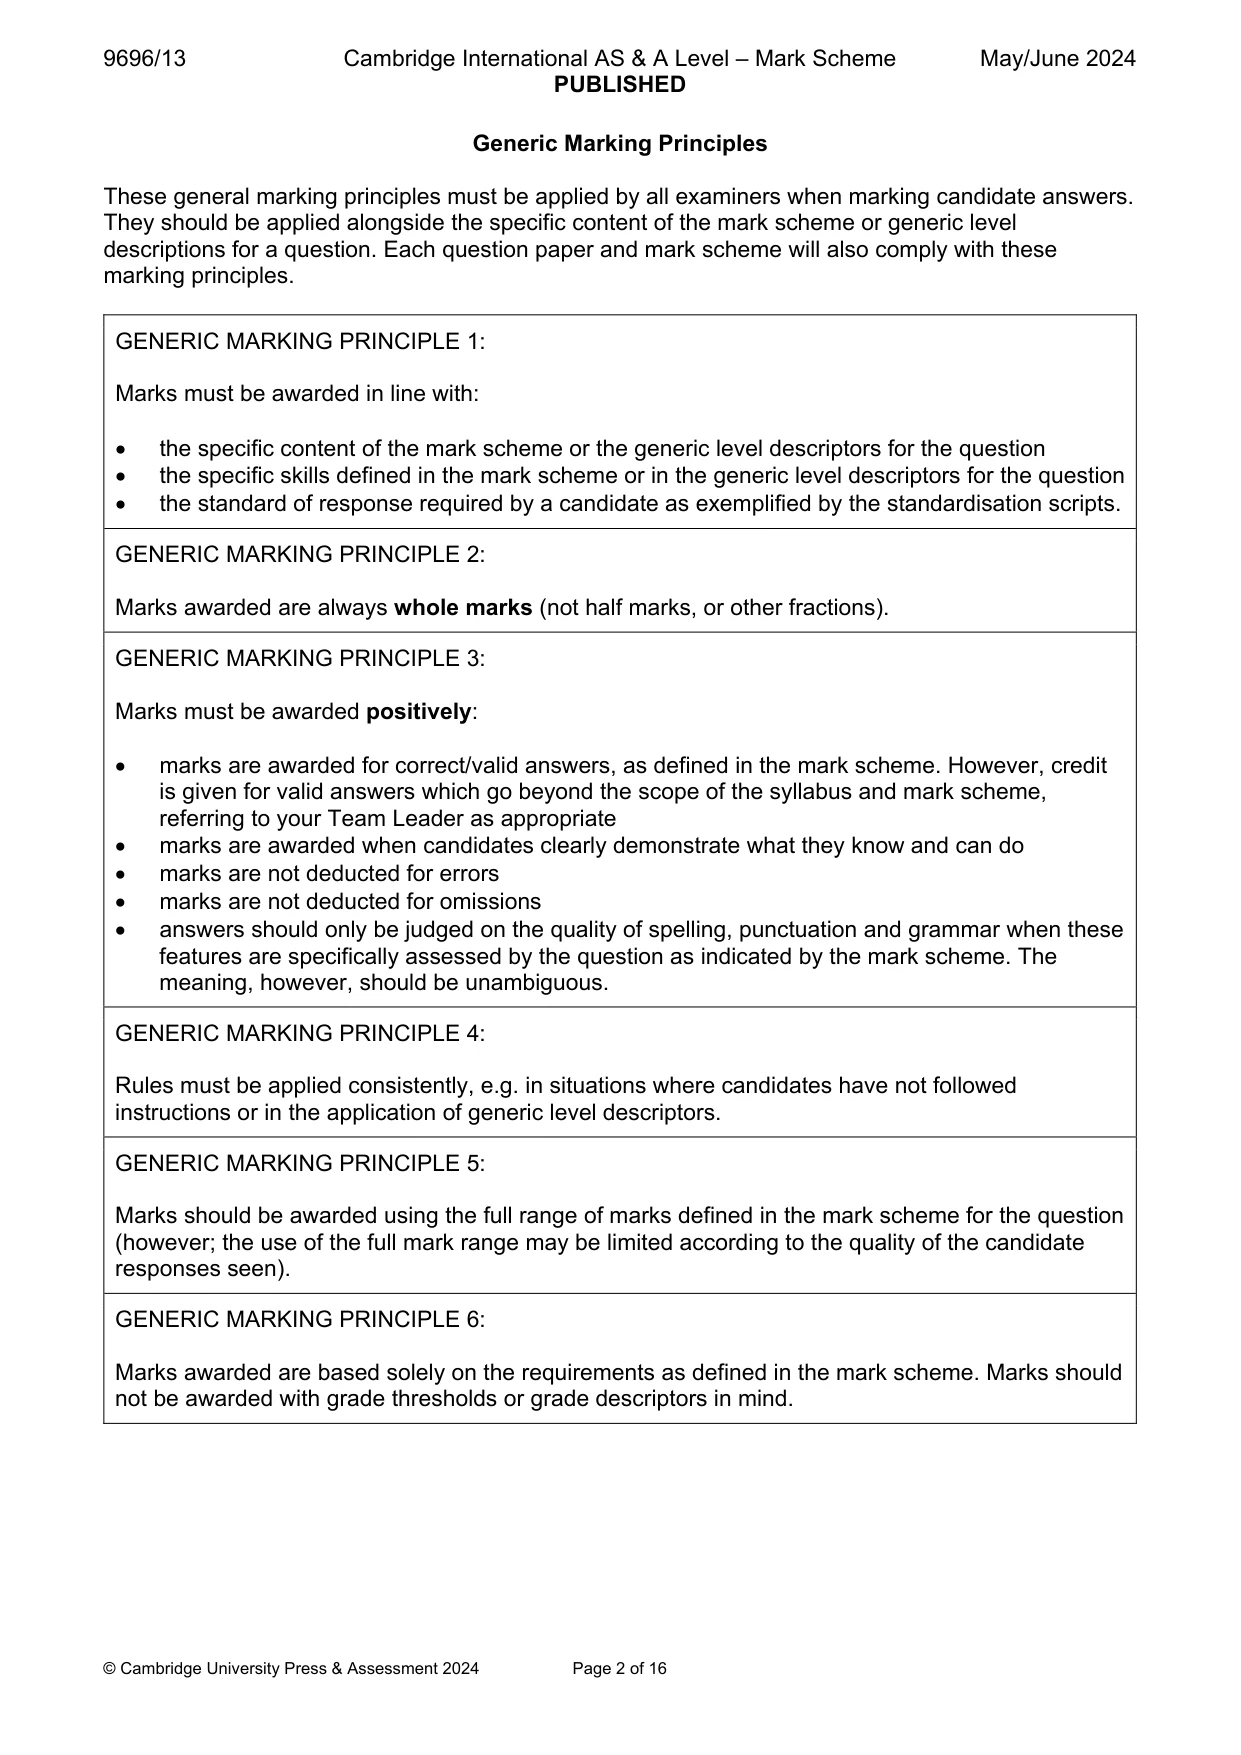
9696/13 Cambridge International AS & A Level – Mark Scheme PUBLISHED May/June 2024 © Cambridge University Press & Assessment 2024 Page 2 of 16 Generic Marking Principles These general marking principles must be applied by all examiners when marking candidate answers. They should be applied alongside the specific content of the mark scheme or generic level descriptions for a question. Each question paper and mark scheme will also comply with these marking principles. GENERIC MARKING PRINCIPLE 1: Marks must be awarded in line with: the specific content of the mark scheme or the generic level descriptors for the question the specific skills defined in the mark scheme or in the generic level descriptors for the question the standard of response required by a candidate as exemplified by the standardisation scripts. GENERIC MARKING PRINCIPLE 2: Marks awarded are always whole marks (not half marks, or other fractions). GENERIC MARKING PRINCIPLE 3: Marks must be awarded positively: marks are awarded for correct/valid answers, as defined in the mark scheme. However, credit is given for valid answers which go beyond the scope of the syllabus and mark scheme, referring to your Team Leader as appropriate marks are awarded when candidates clearly demonstrate what they know and can do marks are not deducted for errors marks are not deducted for omissions answers should only be judged on the quality of spelling, punctuation and grammar when these features are specifically assessed by the question as indicated by the mark scheme. The meaning, however, should be unambiguous. GENERIC MARKING PRINCIPLE 4: Rules must be applied consistently, e.g. in situations where candidates have not followed instructions or in the application of generic level descriptors. GENERIC MARKING PRINCIPLE 5: Marks should be awarded using the full range of marks defined in the mark scheme for the question (however; the use of the full mark range may be limited according to the quality of the candidate responses seen). GENERIC MARKING PRINCIPLE 6: Marks awarded are based solely on the requirements as defined in the mark scheme. Marks should not be awarded with grade thresholds or grade descriptors in mind.
Mark scheme, page 3
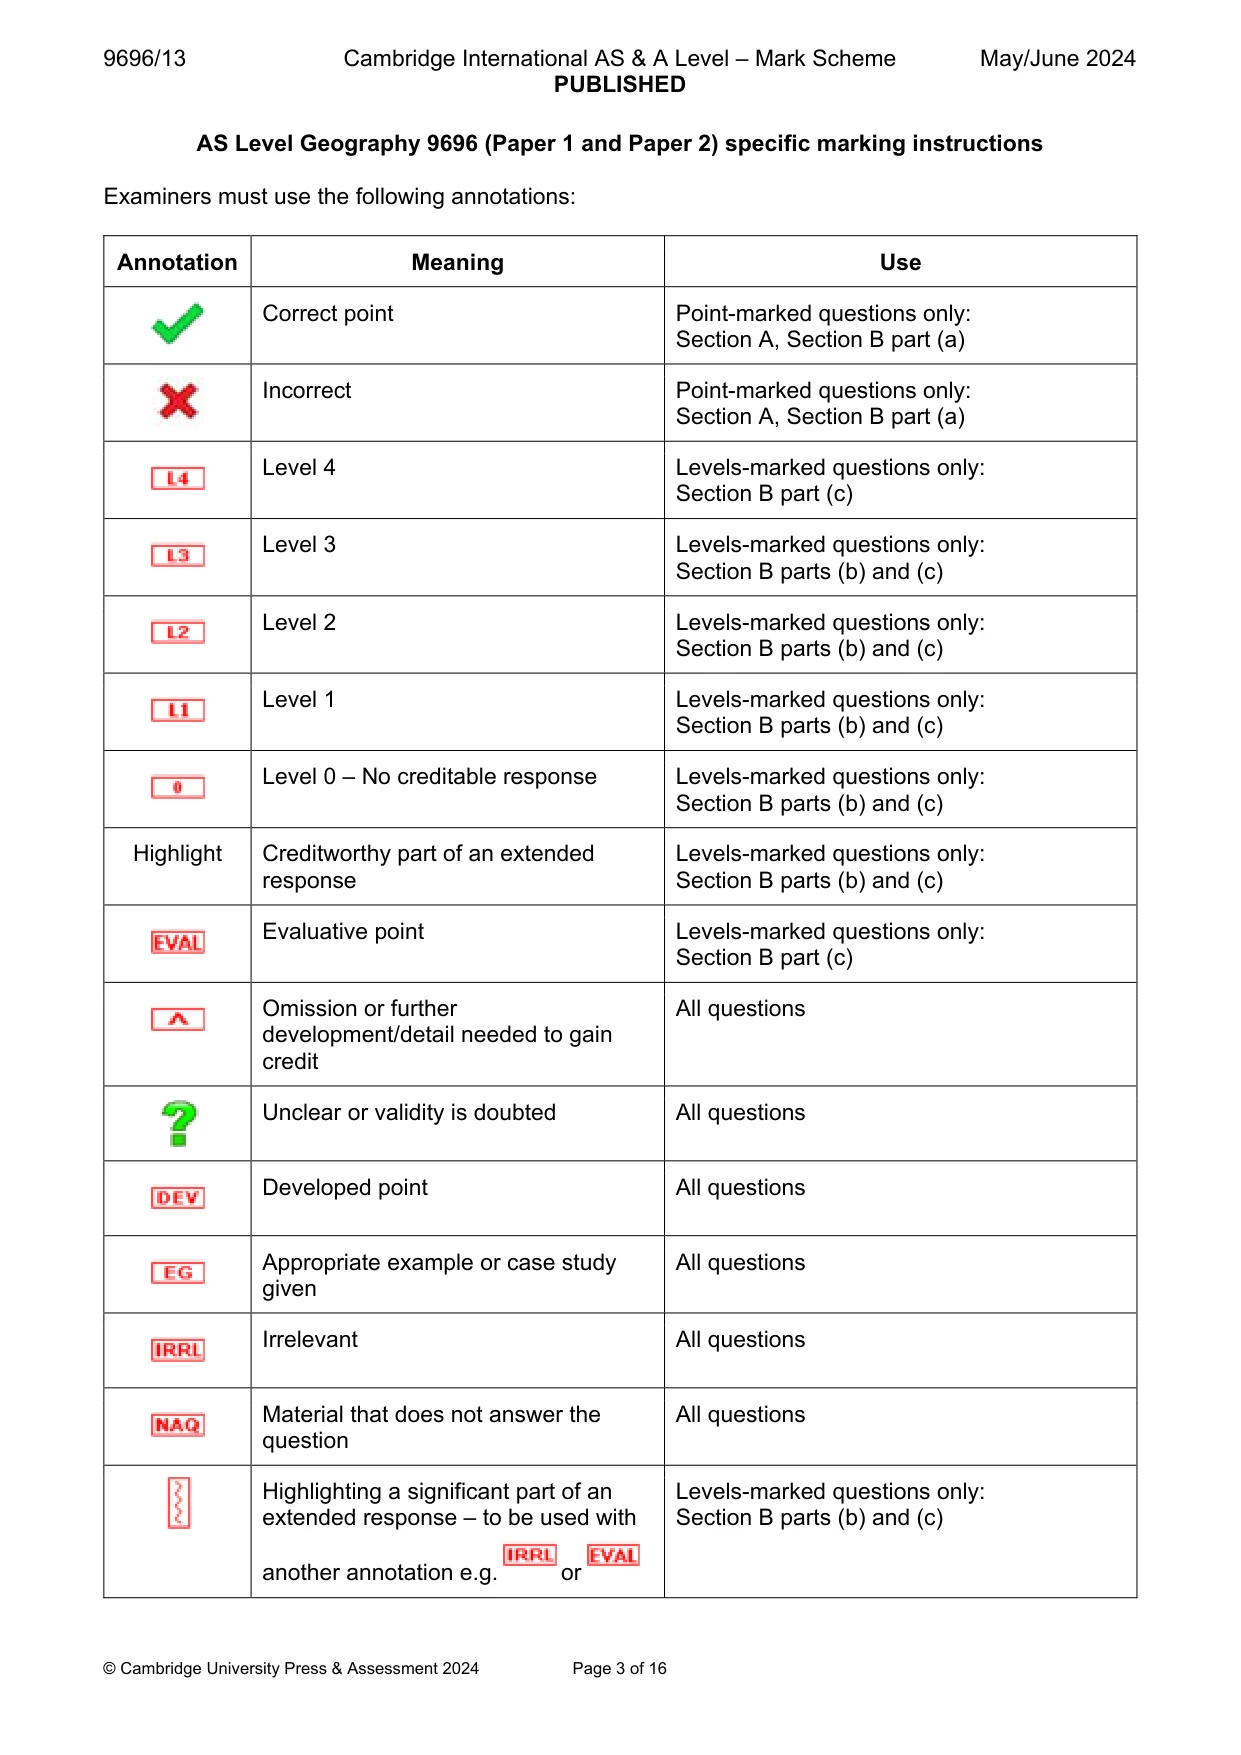
9696/13 Cambridge International AS & A Level – Mark Scheme PUBLISHED May/June 2024 © Cambridge University Press & Assessment 2024 Page 3 of 16 AS Level Geography 9696 (Paper 1 and Paper 2) specific marking instructions Examiners must use the following annotations: Annotation Meaning Use Correct point Point-marked questions only: Section A, Section B part (a) Incorrect Point-marked questions only: Section A, Section B part (a) Level 4 Levels-marked questions only: Section B part (c) Level 3 Levels-marked questions only: Section B parts (b) and (c) Level 2 Levels-marked questions only: Section B parts (b) and (c) Level 1 Levels-marked questions only: Section B parts (b) and (c) Level 0 – No creditable response Levels-marked questions only: Section B parts (b) and (c) Highlight Creditworthy part of an extended response Levels-marked questions only: Section B parts (b) and (c) Evaluative point Levels-marked questions only: Section B part (c) Omission or further development/detail needed to gain credit All questions Unclear or validity is doubted All questions Developed point All questions Appropriate example or case study given All questions Irrelevant All questions Material that does not answer the question All questions Highlighting a significant part of an extended response – to be used with another annotation e.g. or Levels-marked questions only: Section B parts (b) and (c)
Mark scheme, page 4
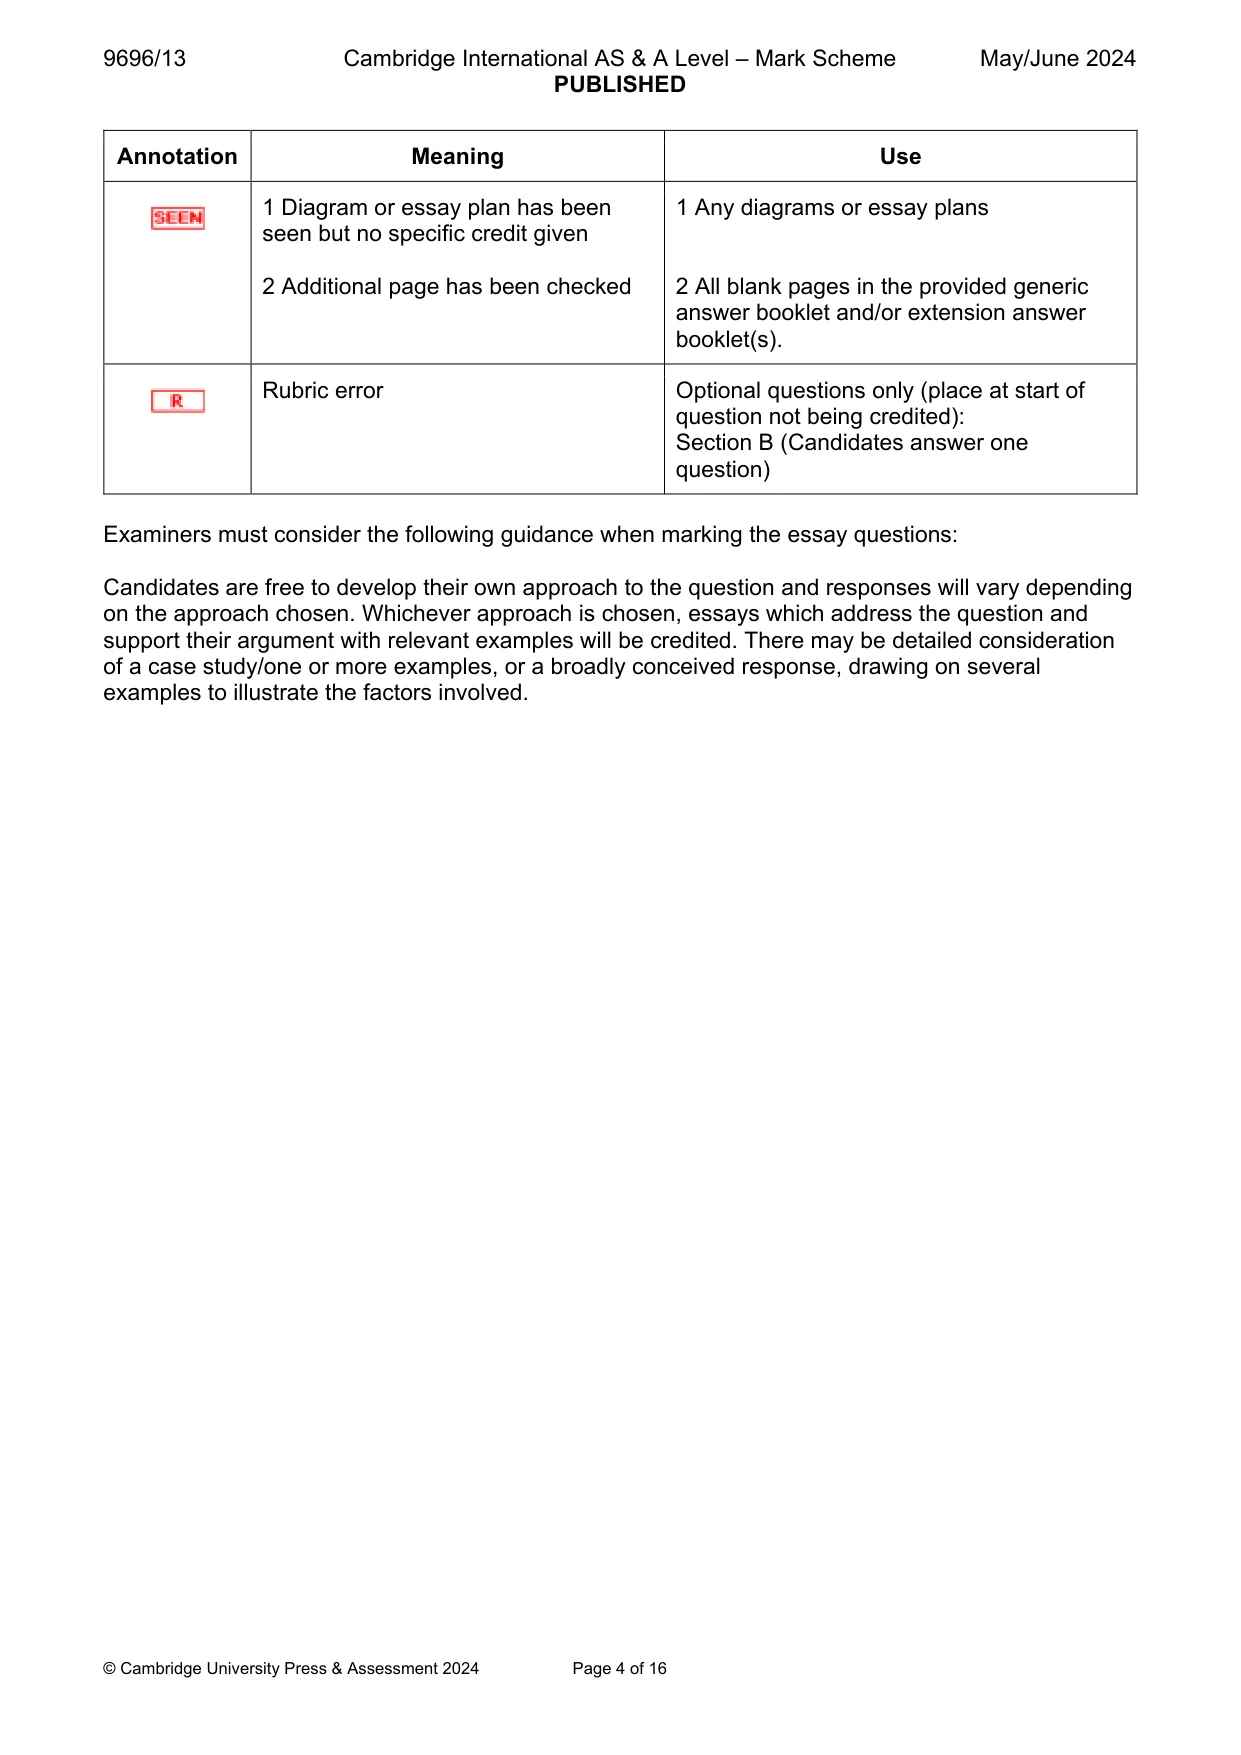
9696/13 Cambridge International AS & A Level – Mark Scheme PUBLISHED May/June 2024 © Cambridge University Press & Assessment 2024 Page 4 of 16 Annotation Meaning Use 1 Diagram or essay plan has been seen but no specific credit given 2 Additional page has been checked 1 Any diagrams or essay plans 2 All blank pages in the provided generic answer booklet and/or extension answer booklet(s). Rubric error Optional questions only (place at start of question not being credited): Section B (Candidates answer one question) Examiners must consider the following guidance when marking the essay questions: Candidates are free to develop their own approach to the question and responses will vary depending on the approach chosen. Whichever approach is chosen, essays which address the question and support their argument with relevant examples will be credited. There may be detailed consideration of a case study/one or more examples, or a broadly conceived response, drawing on several examples to illustrate the factors involved.
Mark scheme, page 5
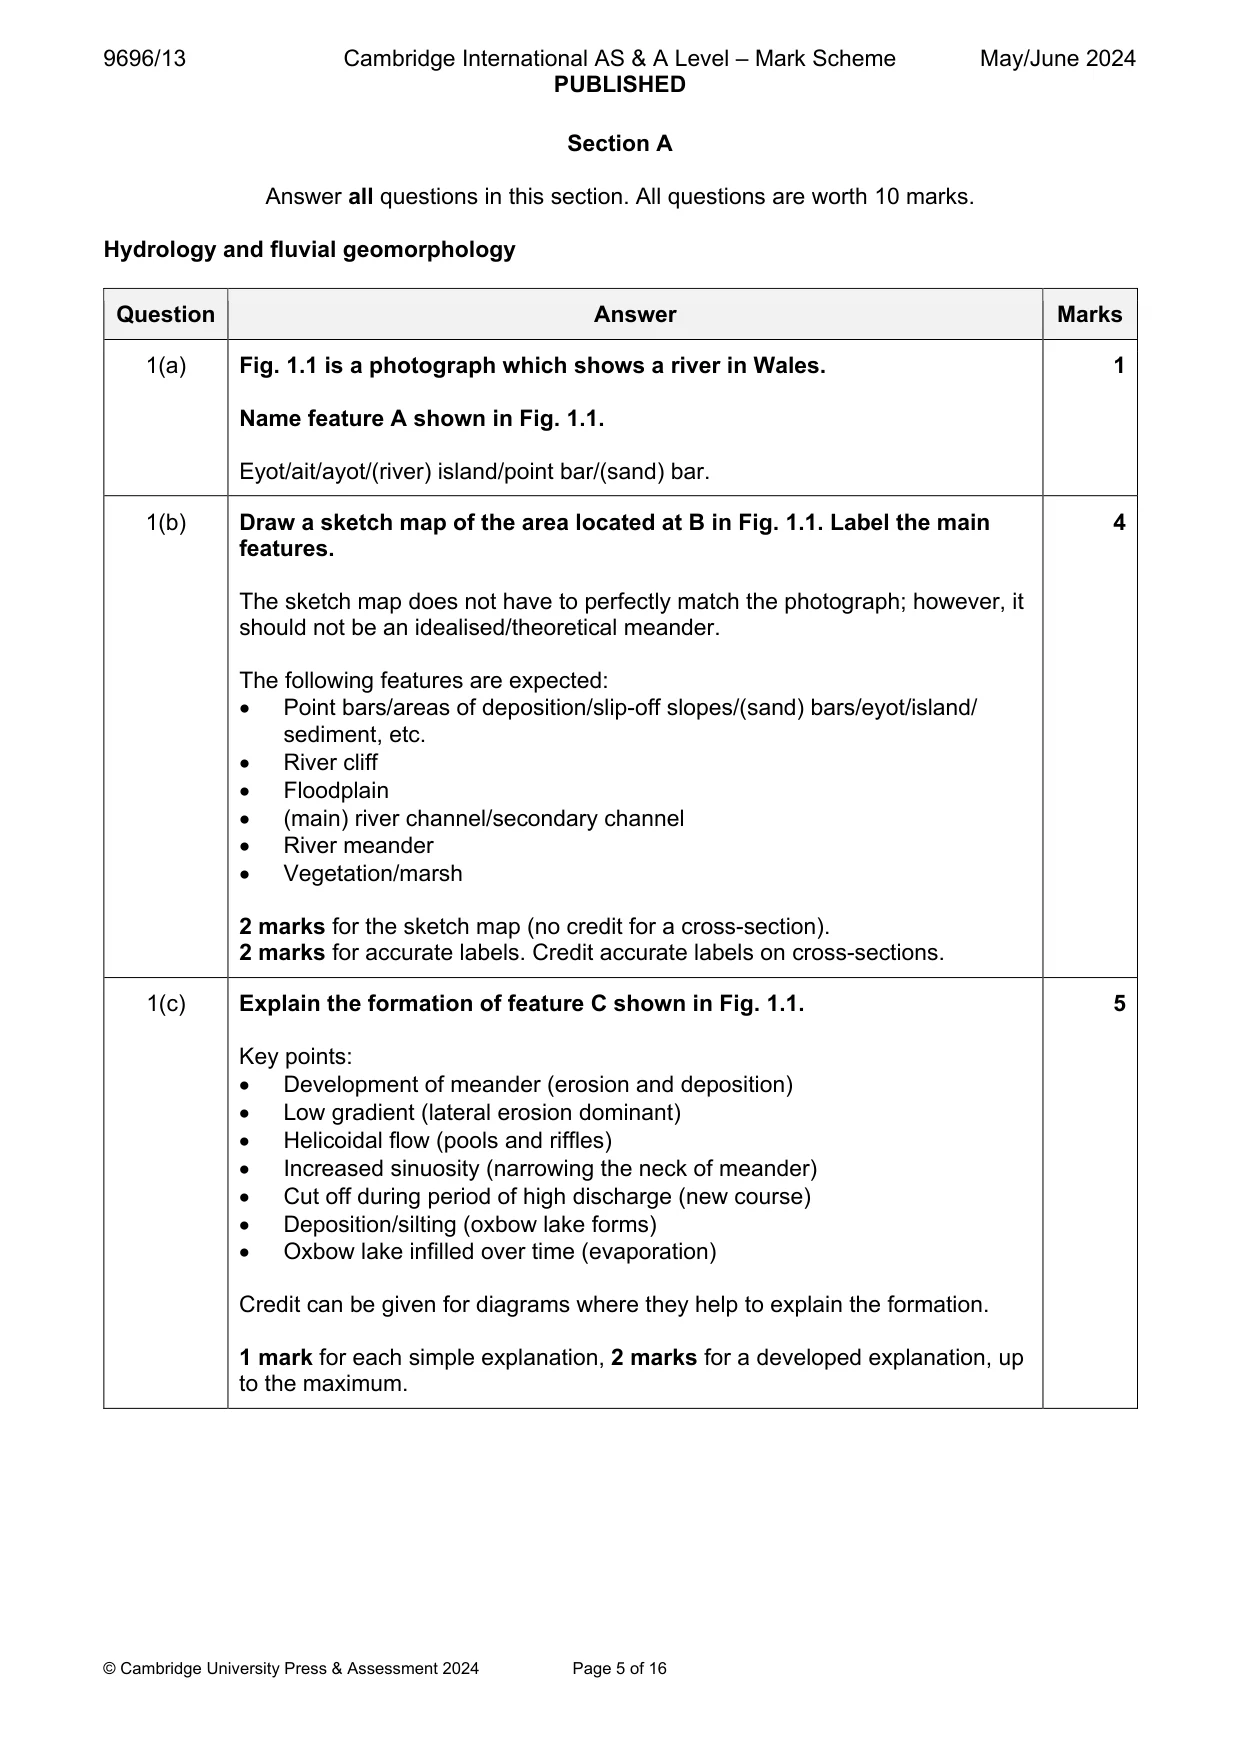
9696/13 Cambridge International AS & A Level – Mark Scheme PUBLISHED May/June 2024 © Cambridge University Press & Assessment 2024 Page 5 of 16 Section A Answer all questions in this section. All questions are worth 10 marks. Hydrology and fluvial geomorphology Question Answer Marks 1(a) Fig. 1.1 is a photograph which shows a river in Wales. Name feature A shown in Fig. 1.1. Eyot/ait/ayot/(river) island/point bar/(sand) bar. 1 1(b) Draw a sketch map of the area located at B in Fig. 1.1. Label the main features. The sketch map does not have to perfectly match the photograph; however, it should not be an idealised/theoretical meander. The following features are expected: Point bars/areas of deposition/slip-off slopes/(sand) bars/eyot/island/ sediment, etc. River cliff Floodplain (main) river channel/secondary channel River meander Vegetation/marsh 2 marks for the sketch map (no credit for a cross-section). 2 marks for accurate labels. Credit accurate labels on cross-sections. 4 1(c) Explain the formation of feature C shown in Fig. 1.1. Key points: Development of meander (erosion and deposition) Low gradient (lateral erosion dominant) Helicoidal flow (pools and riffles) Increased sinuosity (narrowing the neck of meander) Cut off during period of high discharge (new course) Deposition/silting (oxbow lake forms) Oxbow lake infilled over time (evaporation) Credit can be given for diagrams where they help to explain the formation. 1 mark for each simple explanation, 2 marks for a developed explanation, up to the maximum. 5
Mark scheme, page 6
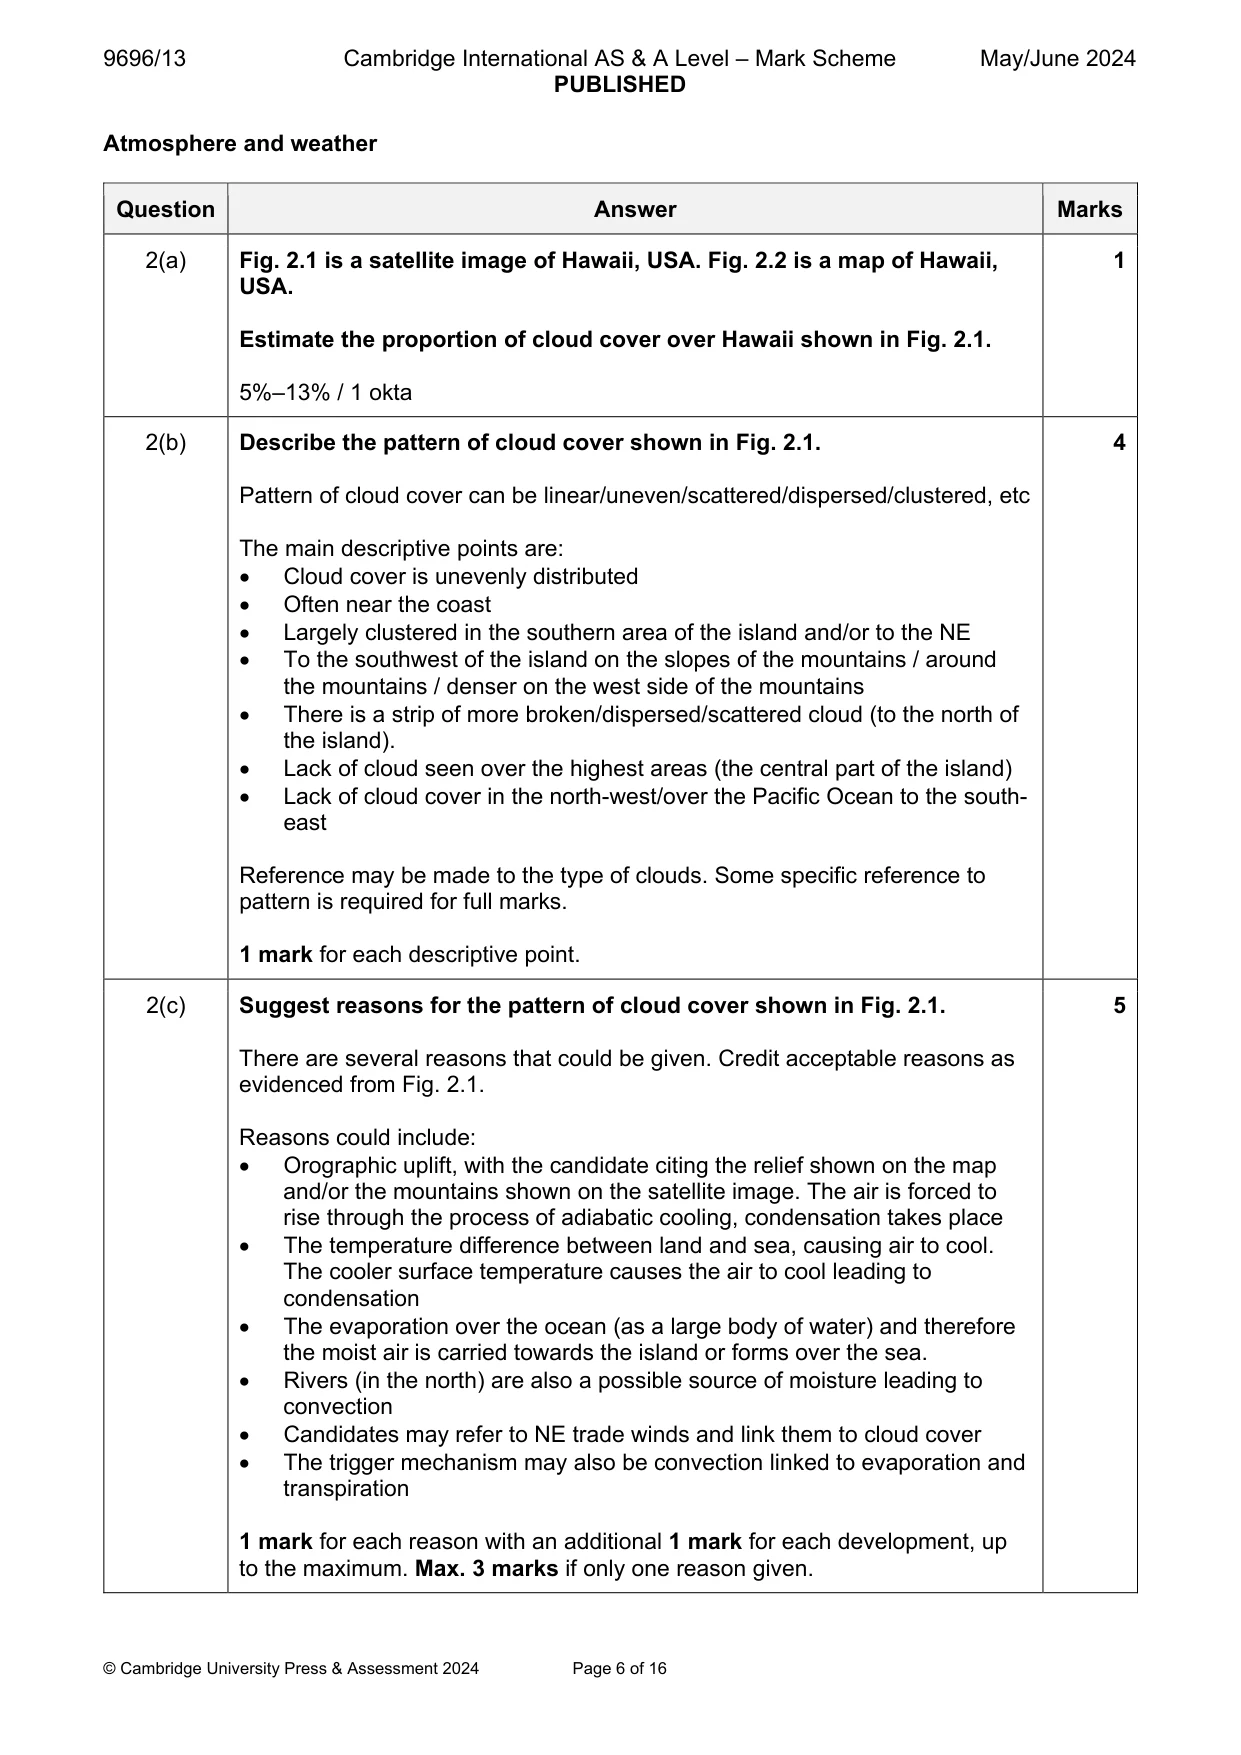
9696/13 Cambridge International AS & A Level – Mark Scheme PUBLISHED May/June 2024 © Cambridge University Press & Assessment 2024 Page 6 of 16 Atmosphere and weather Question Answer Marks 2(a) Fig. 2.1 is a satellite image of Hawaii, USA. Fig. 2.2 is a map of Hawaii, USA. Estimate the proportion of cloud cover over Hawaii shown in Fig. 2.1. 5%–13% / 1 okta 1 2(b) Describe the pattern of cloud cover shown in Fig. 2.1. Pattern of cloud cover can be linear/uneven/scattered/dispersed/clustered, etc The main descriptive points are: Cloud cover is unevenly distributed Often near the coast Largely clustered in the southern area of the island and/or to the NE To the southwest of the island on the slopes of the mountains / around the mountains / denser on the west side of the mountains There is a strip of more broken/dispersed/scattered cloud (to the north of the island). Lack of cloud seen over the highest areas (the central part of the island) Lack of cloud cover in the north-west/over the Pacific Ocean to the south- east Reference may be made to the type of clouds. Some specific reference to pattern is required for full marks. 1 mark for each descriptive point. 4 2(c) Suggest reasons for the pattern of cloud cover shown in Fig. 2.1. There are several reasons that could be given. Credit acceptable reasons as evidenced from Fig. 2.1. Reasons could include: Orographic uplift, with the candidate citing the relief shown on the map and/or the mountains shown on the satellite image. The air is forced to rise through the process of adiabatic cooling, condensation takes place The temperature difference between land and sea, causing air to cool. The cooler surface temperature causes the air to cool leading to condensation The evaporation over the ocean (as a large body of water) and therefore the moist air is carried towards the island or forms over the sea. Rivers (in the north) are also a possible source of moisture leading to convection Candidates may refer to NE trade winds and link them to cloud cover The trigger mechanism may also be convection linked to evaporation and transpiration 1 mark for each reason with an additional 1 mark for each development, up to the maximum. Max. 3 marks if only one reason given. 5
Mark scheme, page 7
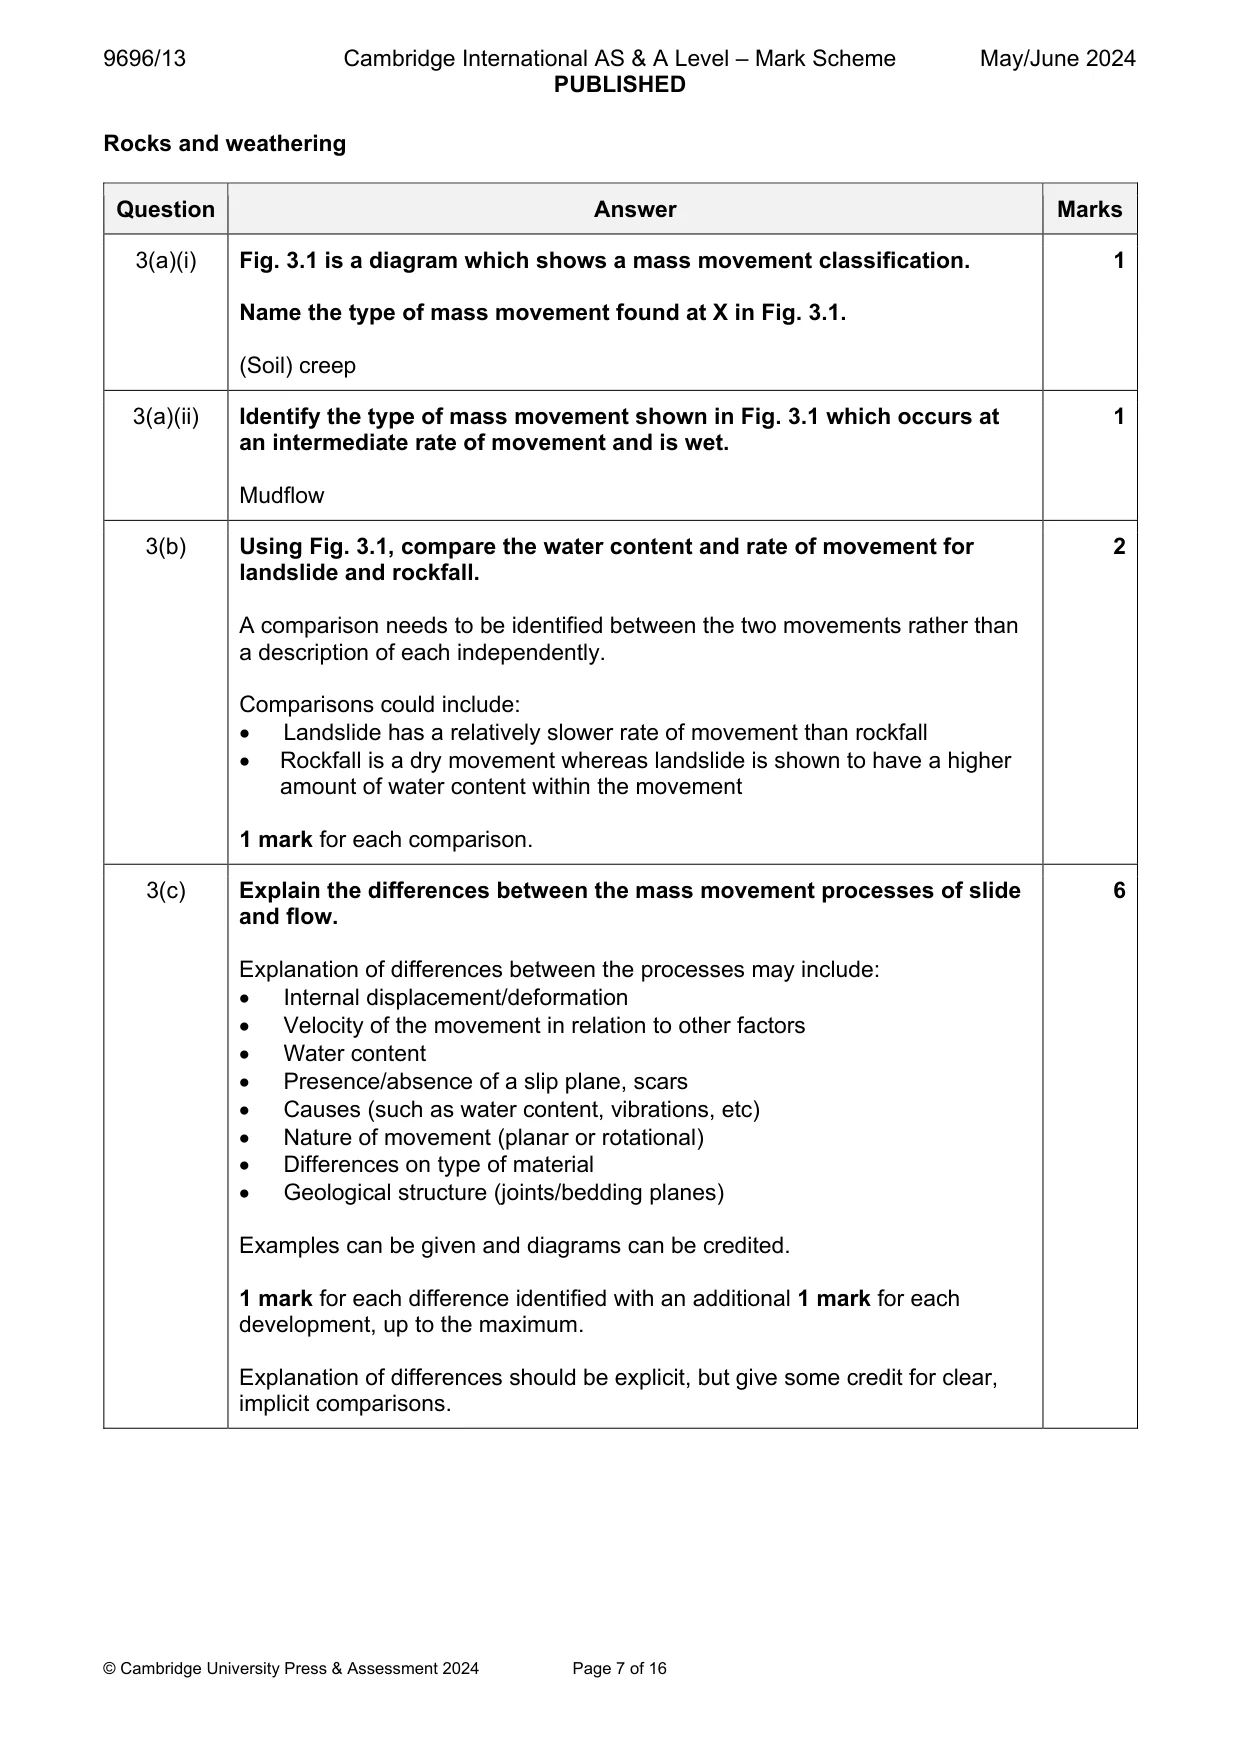
9696/13 Cambridge International AS & A Level – Mark Scheme PUBLISHED May/June 2024 © Cambridge University Press & Assessment 2024 Page 7 of 16 Rocks and weathering Question Answer Marks 3(a)(i) Fig. 3.1 is a diagram which shows a mass movement classification. Name the type of mass movement found at X in Fig. 3.1. (Soil) creep 1 3(a)(ii) Identify the type of mass movement shown in Fig. 3.1 which occurs at an intermediate rate of movement and is wet. Mudflow 1 3(b) Using Fig. 3.1, compare the water content and rate of movement for landslide and rockfall. A comparison needs to be identified between the two movements rather than a description of each independently. Comparisons could include: Landslide has a relatively slower rate of movement than rockfall Rockfall is a dry movement whereas landslide is shown to have a higher amount of water content within the movement 1 mark for each comparison. 2 3(c) Explain the differences between the mass movement processes of slide and flow. Explanation of differences between the processes may include: Internal displacement/deformation Velocity of the movement in relation to other factors Water content Presence/absence of a slip plane, scars Causes (such as water content, vibrations, etc) Nature of movement (planar or rotational) Differences on type of material Geological structure (joints/bedding planes) Examples can be given and diagrams can be credited. 1 mark for each difference identified with an additional 1 mark for each development, up to the maximum. Explanation of differences should be explicit, but give some credit for clear, implicit comparisons. 6
Mark scheme, page 8
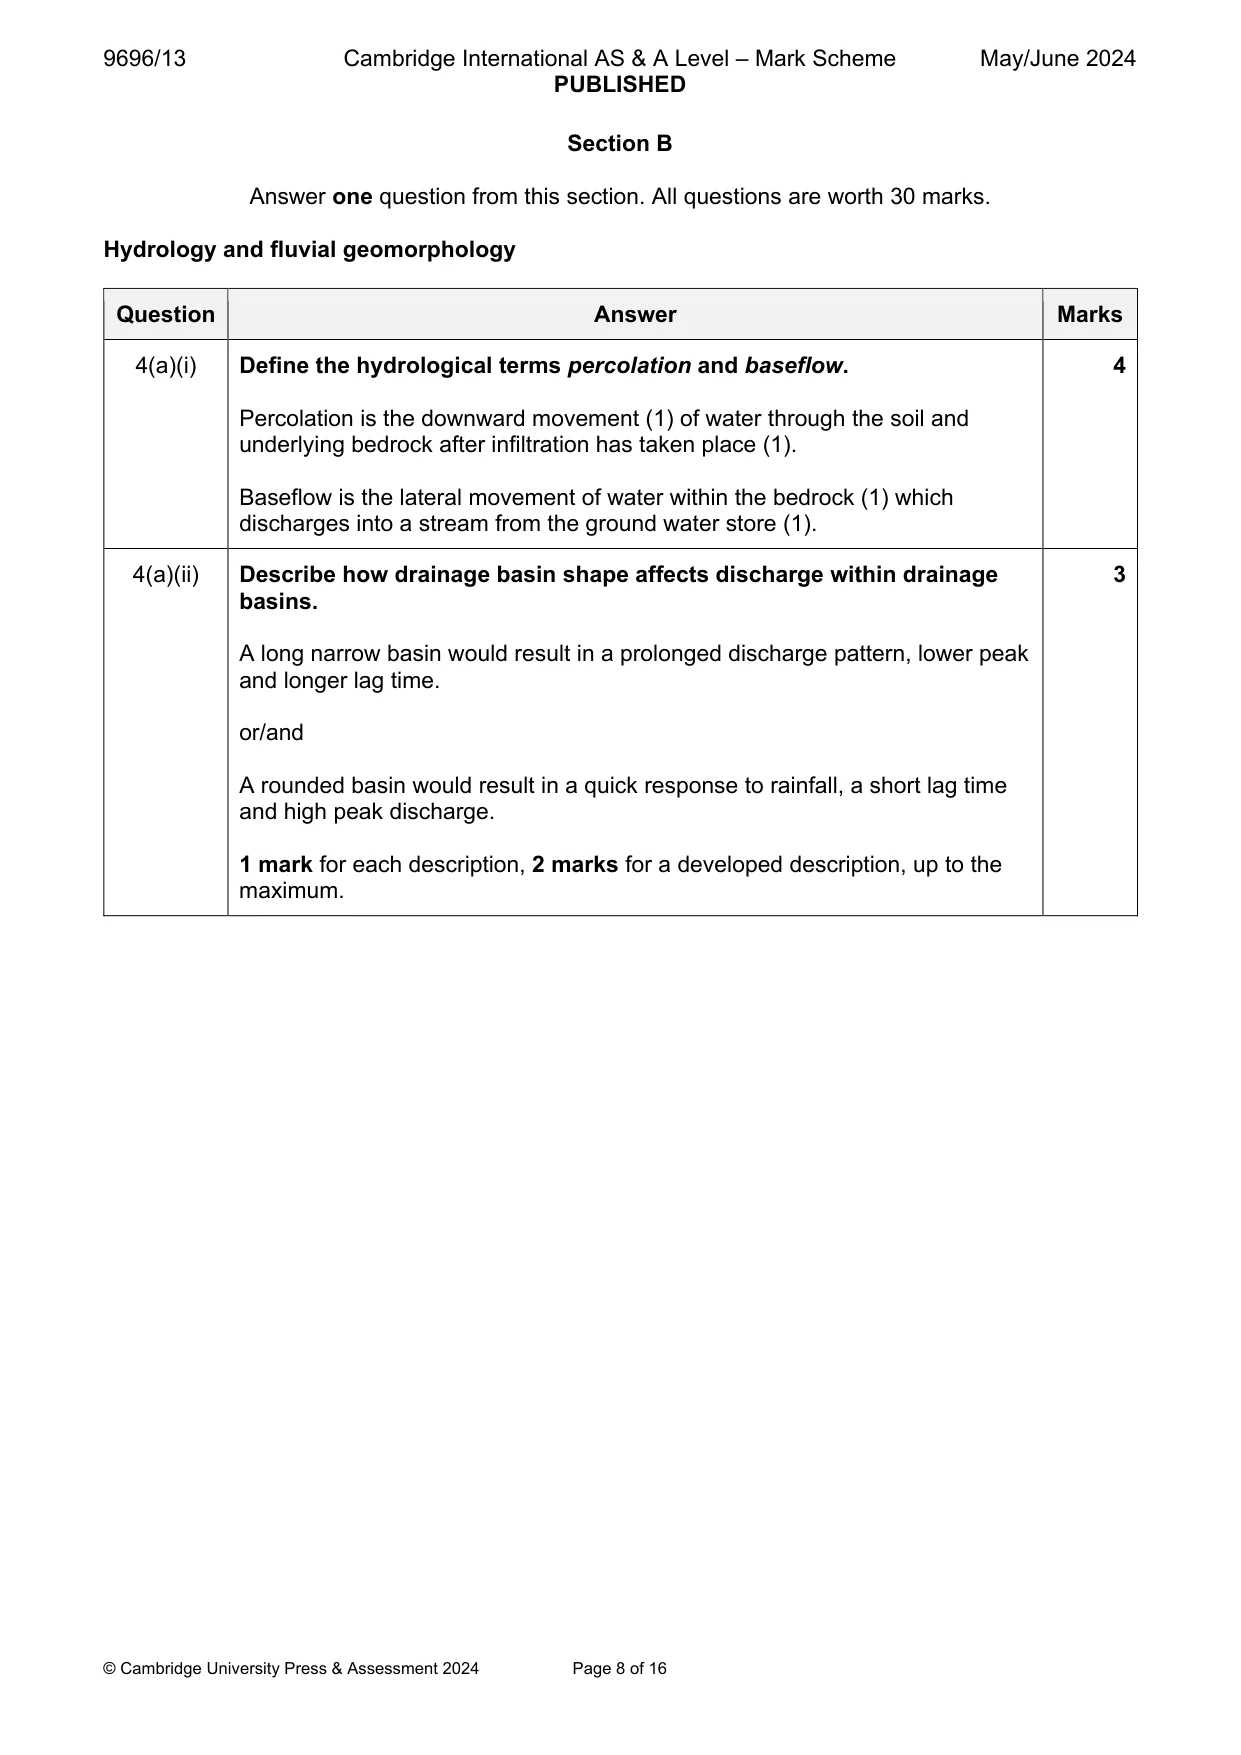
9696/13 Cambridge International AS & A Level – Mark Scheme PUBLISHED May/June 2024 © Cambridge University Press & Assessment 2024 Page 8 of 16 Section B Answer one question from this section. All questions are worth 30 marks. Hydrology and fluvial geomorphology Question Answer Marks 4(a)(i) Define the hydrological terms percolation and baseflow. Percolation is the downward movement (1) of water through the soil and underlying bedrock after infiltration has taken place (1). Baseflow is the lateral movement of water within the bedrock (1) which discharges into a stream from the ground water store (1). 4 4(a)(ii) Describe how drainage basin shape affects discharge within drainage basins. A long narrow basin would result in a prolonged discharge pattern, lower peak and longer lag time. or/and A rounded basin would result in a quick response to rainfall, a short lag time and high peak discharge. 1 mark for each description, 2 marks for a developed description, up to the maximum. 3
Mark scheme, page 9
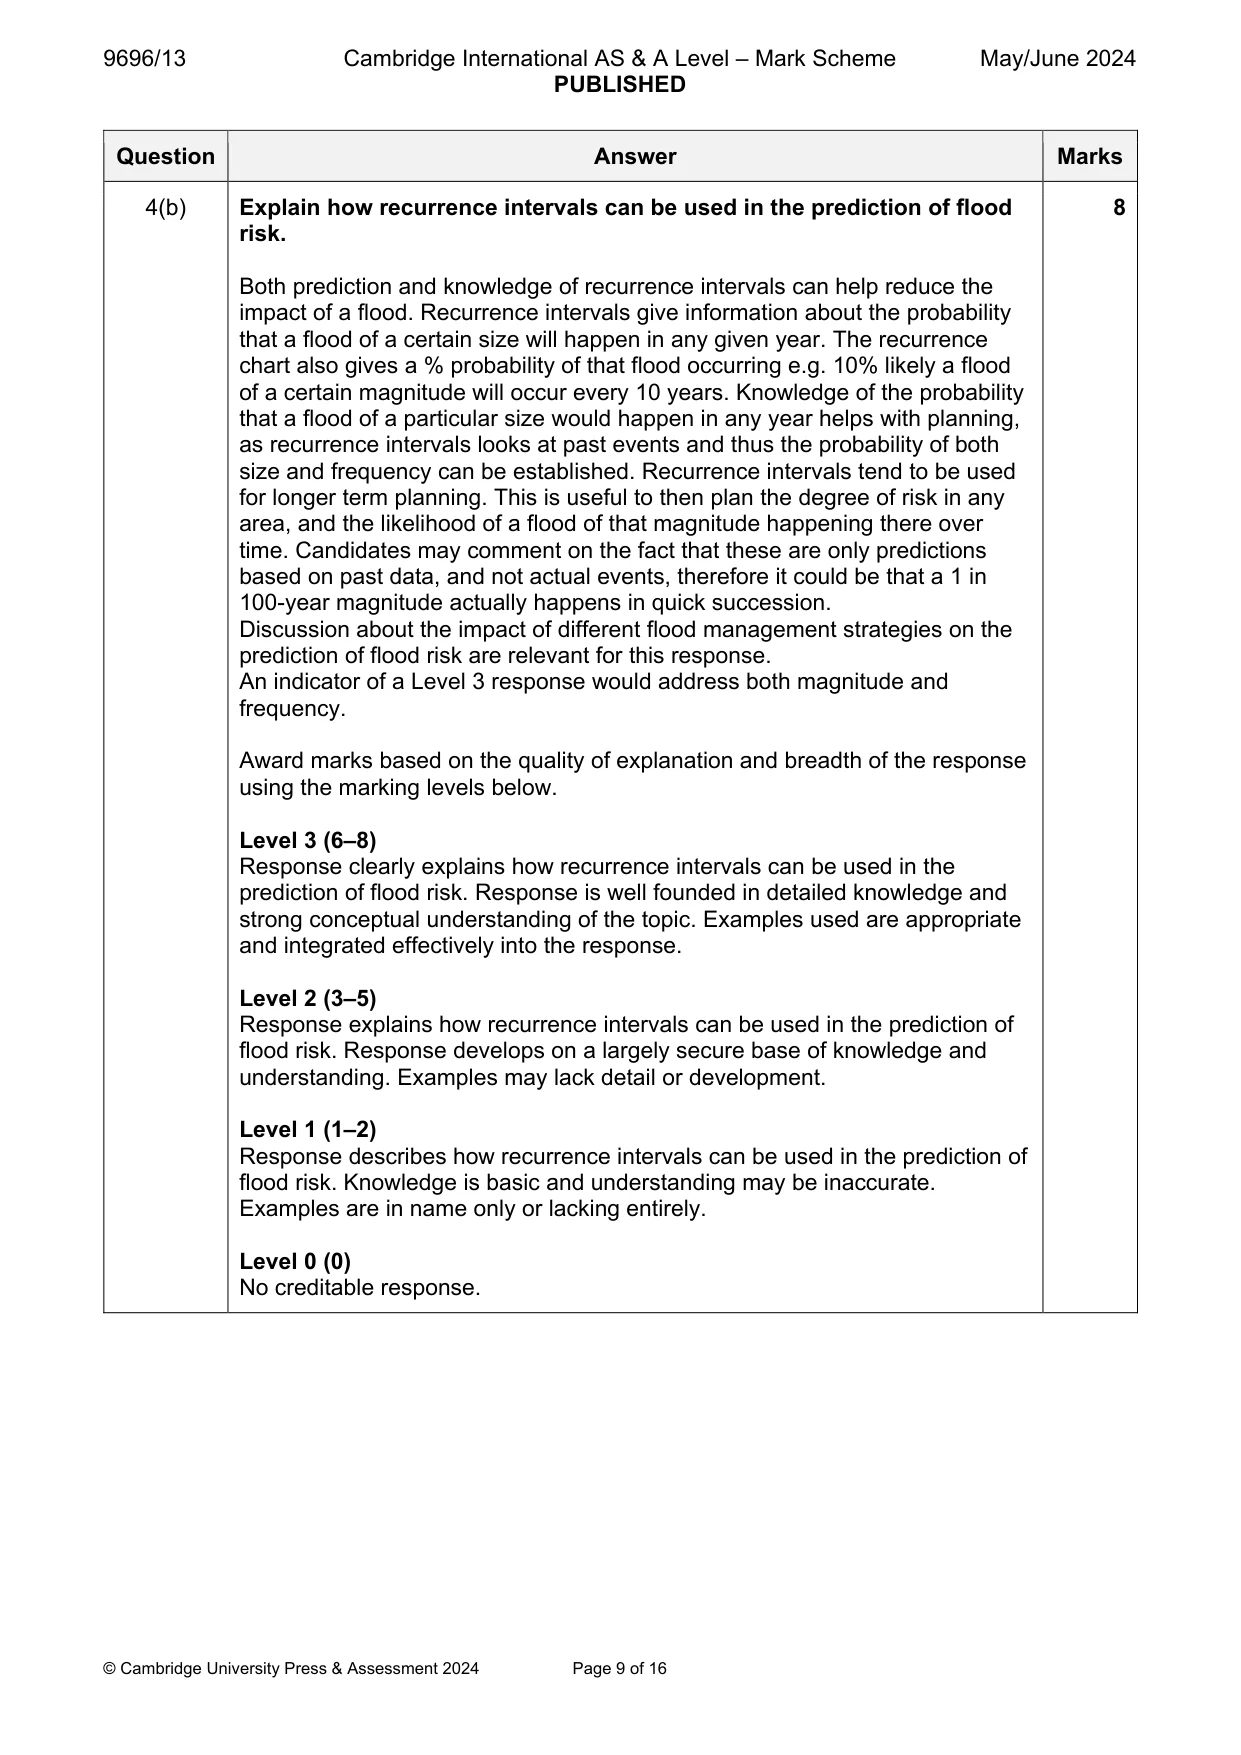
9696/13 Cambridge International AS & A Level – Mark Scheme PUBLISHED May/June 2024 © Cambridge University Press & Assessment 2024 Page 9 of 16 Question Answer Marks 4(b) Explain how recurrence intervals can be used in the prediction of flood risk. Both prediction and knowledge of recurrence intervals can help reduce the impact of a flood. Recurrence intervals give information about the probability that a flood of a certain size will happen in any given year. The recurrence chart also gives a % probability of that flood occurring e.g. 10% likely a flood of a certain magnitude will occur every 10 years. Knowledge of the probability that a flood of a particular size would happen in any year helps with planning, as recurrence intervals looks at past events and thus the probability of both size and frequency can be established. Recurrence intervals tend to be used for longer term planning. This is useful to then plan the degree of risk in any area, and the likelihood of a flood of that magnitude happening there over time. Candidates may comment on the fact that these are only predictions based on past data, and not actual events, therefore it could be that a 1 in 100-year magnitude actually happens in quick succession. Discussion about the impact of different flood management strategies on the prediction of flood risk are relevant for this response. An indicator of a Level 3 response would address both magnitude and frequency. Award marks based on the quality of explanation and breadth of the response using the marking levels below. Level 3 (6–8) Response clearly explains how recurrence intervals can be used in the prediction of flood risk. Response is well founded in detailed knowledge and strong conceptual understanding of the topic. Examples used are appropriate and integrated effectively into the response. Level 2 (3–5) Response explains how recurrence intervals can be used in the prediction of flood risk. Response develops on a largely secure base of knowledge and understanding. Examples may lack detail or development. Level 1 (1–2) Response describes how recurrence intervals can be used in the prediction of flood risk. Knowledge is basic and understanding may be inaccurate. Examples are in name only or lacking entirely. Level 0 (0) No creditable response. 8
Mark scheme, page 10
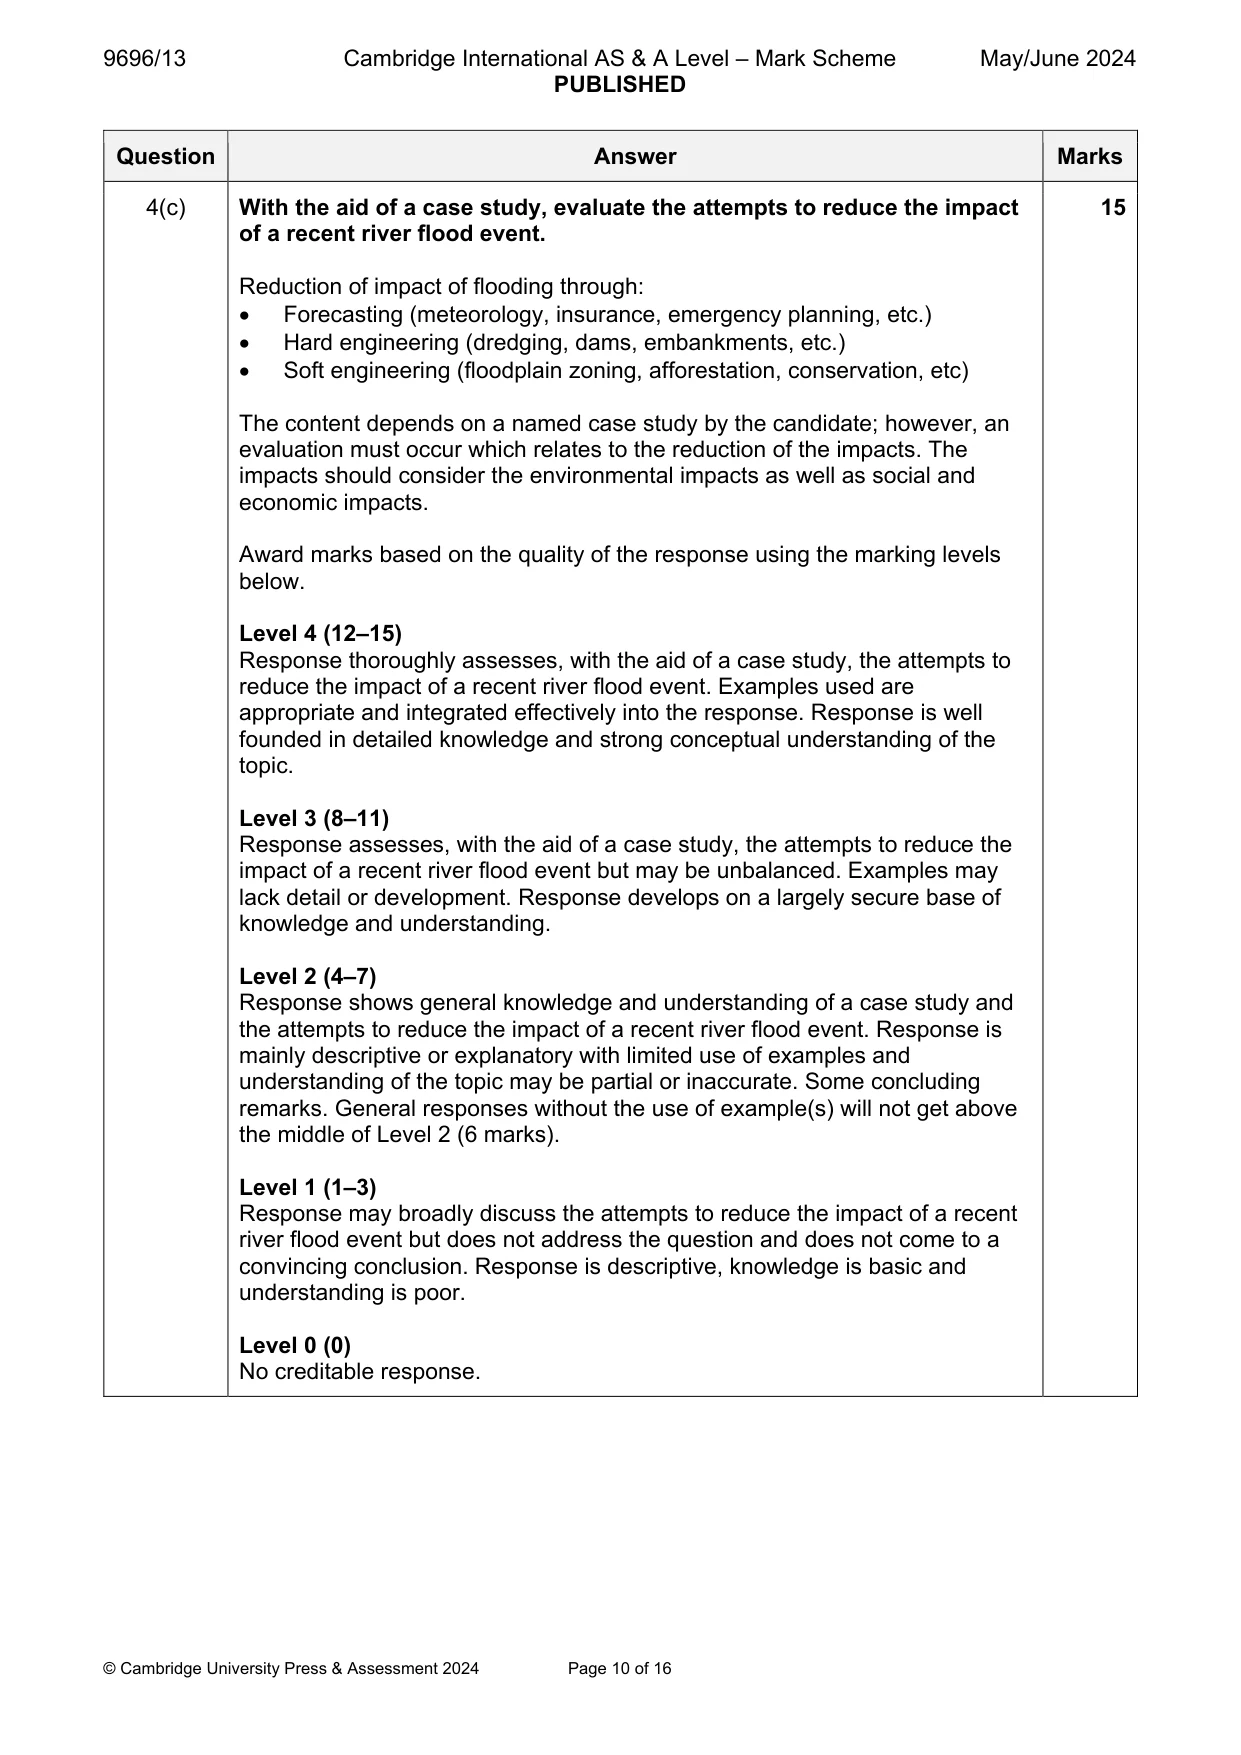
9696/13 Cambridge International AS & A Level – Mark Scheme PUBLISHED May/June 2024 © Cambridge University Press & Assessment 2024 Page 10 of 16 Question Answer Marks 4(c) With the aid of a case study, evaluate the attempts to reduce the impact of a recent river flood event. Reduction of impact of flooding through: Forecasting (meteorology, insurance, emergency planning, etc.) Hard engineering (dredging, dams, embankments, etc.) Soft engineering (floodplain zoning, afforestation, conservation, etc) The content depends on a named case study by the candidate; however, an evaluation must occur which relates to the reduction of the impacts. The impacts should consider the environmental impacts as well as social and economic impacts. Award marks based on the quality of the response using the marking levels below. Level 4 (12–15) Response thoroughly assesses, with the aid of a case study, the attempts to reduce the impact of a recent river flood event. Examples used are appropriate and integrated effectively into the response. Response is well founded in detailed knowledge and strong conceptual understanding of the topic. Level 3 (8–11) Response assesses, with the aid of a case study, the attempts to reduce the impact of a recent river flood event but may be unbalanced. Examples may lack detail or development. Response develops on a largely secure base of knowledge and understanding. Level 2 (4–7) Response shows general knowledge and understanding of a case study and the attempts to reduce the impact of a recent river flood event. Response is mainly descriptive or explanatory with limited use of examples and understanding of the topic may be partial or inaccurate. Some concluding remarks. General responses without the use of example(s) will not get above the middle of Level 2 (6 marks). Level 1 (1–3) Response may broadly discuss the attempts to reduce the impact of a recent river flood event but does not address the question and does not come to a convincing conclusion. Response is descriptive, knowledge is basic and understanding is poor. Level 0 (0) No creditable response. 15
Mark scheme, page 11
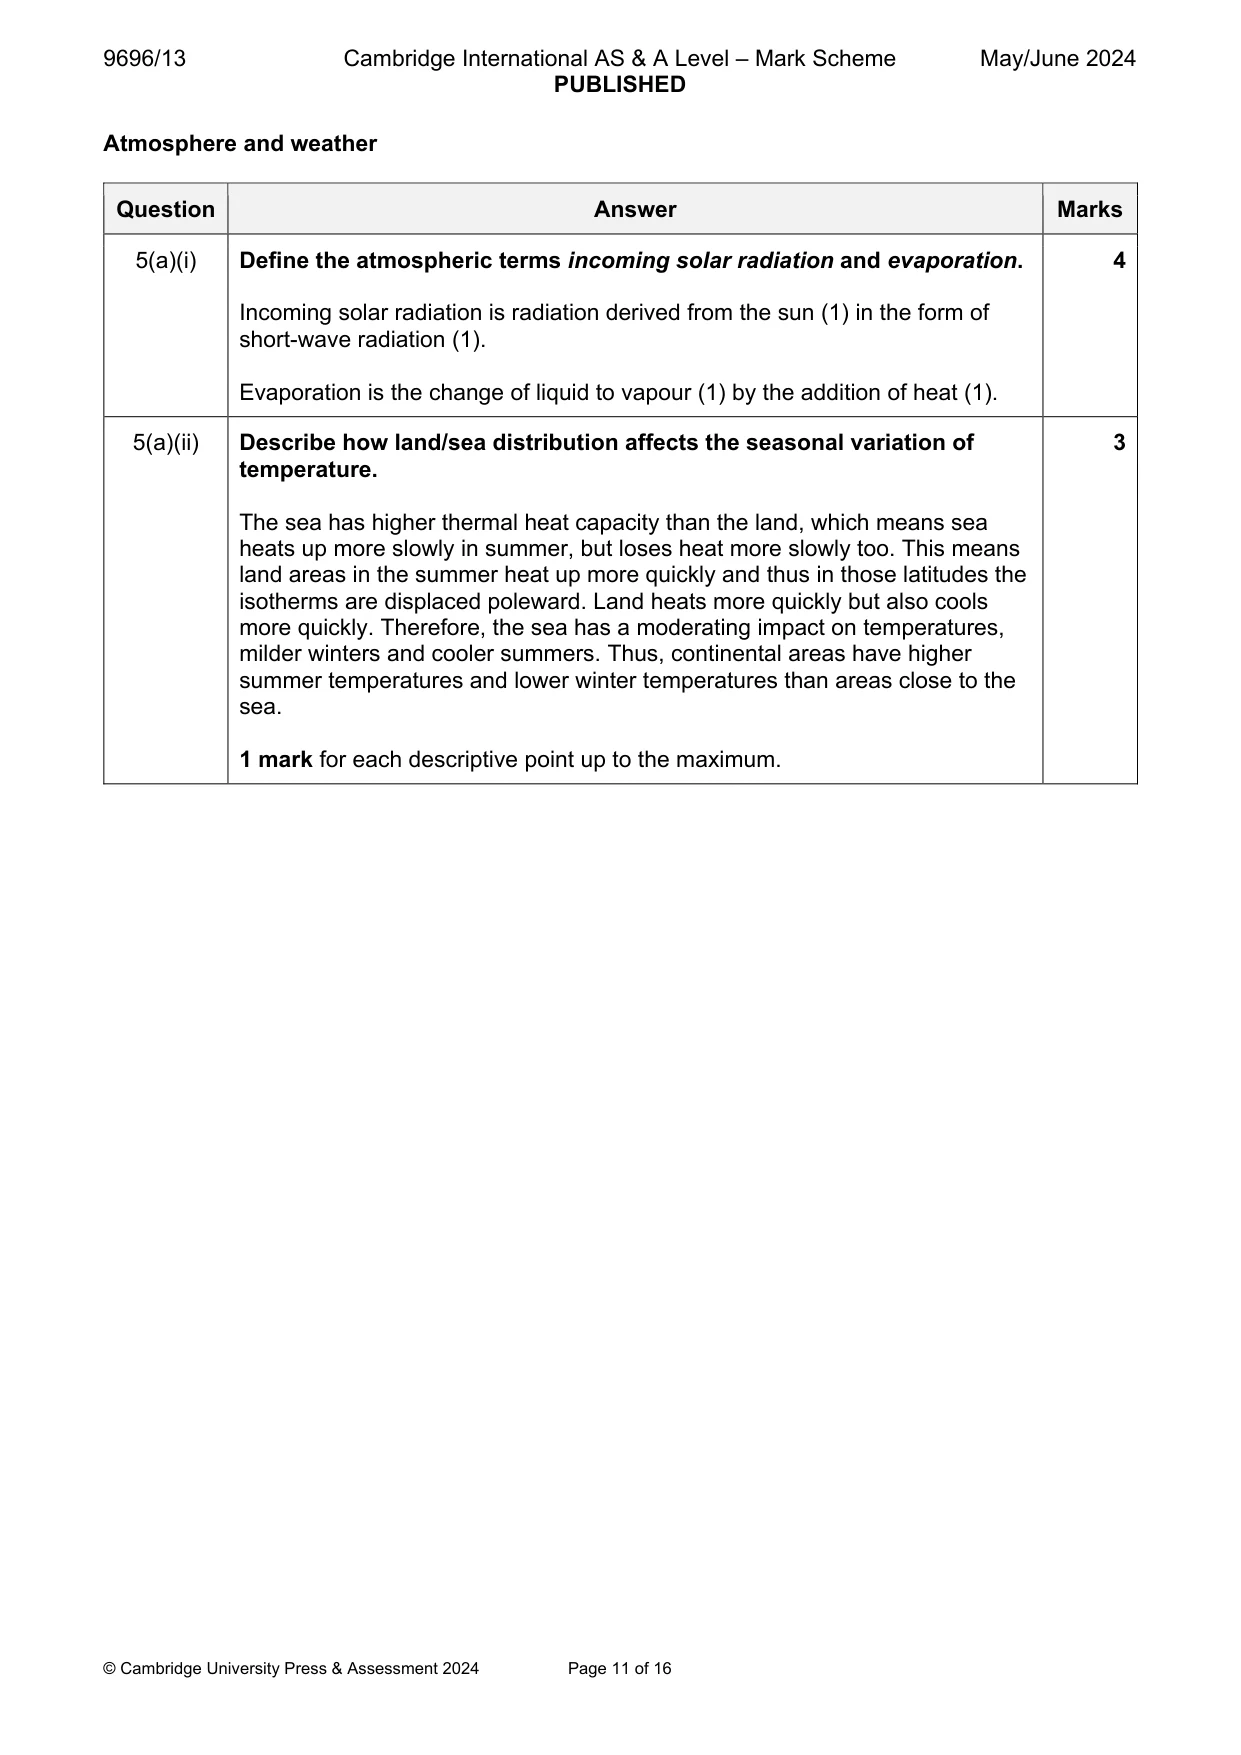
9696/13 Cambridge International AS & A Level – Mark Scheme PUBLISHED May/June 2024 © Cambridge University Press & Assessment 2024 Page 11 of 16 Atmosphere and weather Question Answer Marks 5(a)(i) Define the atmospheric terms incoming solar radiation and evaporation. Incoming solar radiation is radiation derived from the sun (1) in the form of short-wave radiation (1). Evaporation is the change of liquid to vapour (1) by the addition of heat (1). 4 5(a)(ii) Describe how land/sea distribution affects the seasonal variation of temperature. The sea has higher thermal heat capacity than the land, which means sea heats up more slowly in summer, but loses heat more slowly too. This means land areas in the summer heat up more quickly and thus in those latitudes the isotherms are displaced poleward. Land heats more quickly but also cools more quickly. Therefore, the sea has a moderating impact on temperatures, milder winters and cooler summers. Thus, continental areas have higher summer temperatures and lower winter temperatures than areas close to the sea. 1 mark for each descriptive point up to the maximum. 3
Mark scheme, page 12
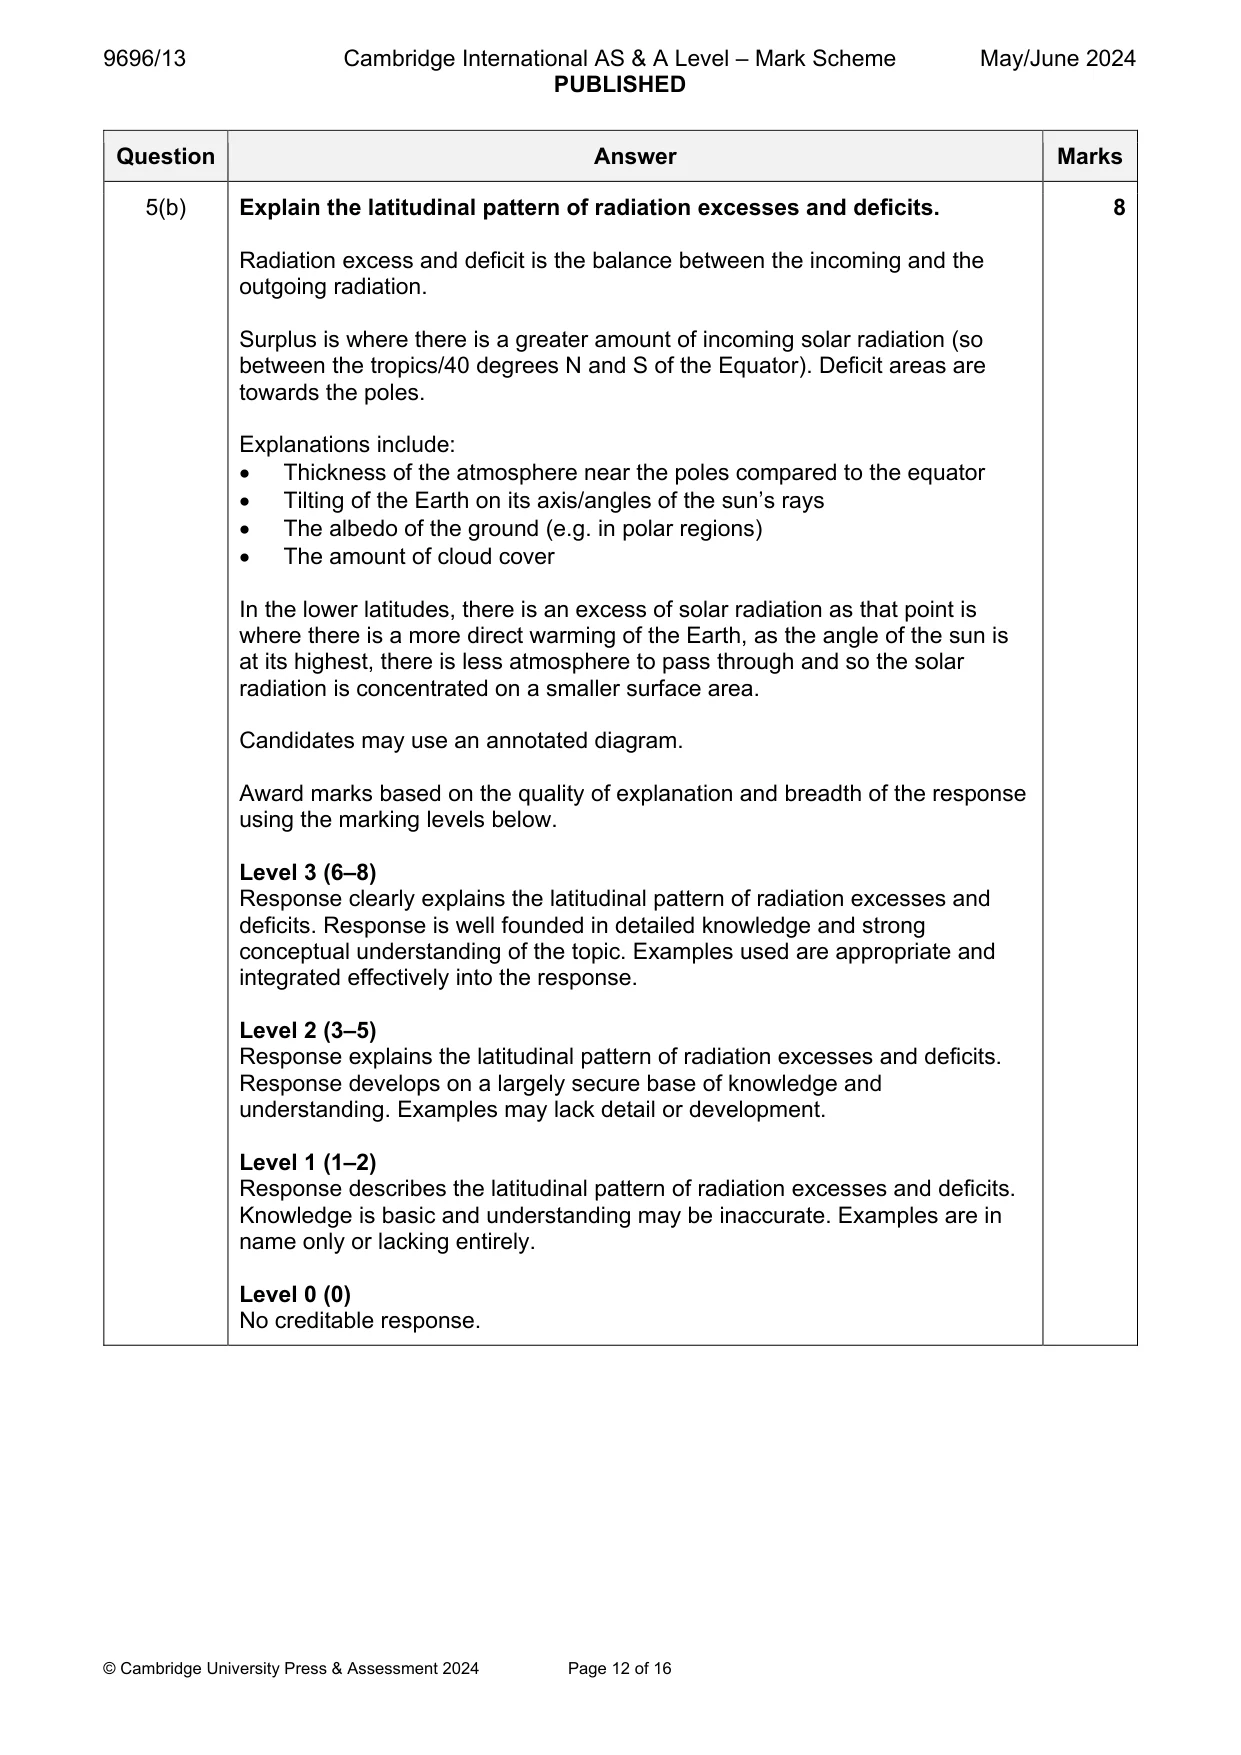
9696/13 Cambridge International AS & A Level – Mark Scheme PUBLISHED May/June 2024 © Cambridge University Press & Assessment 2024 Page 12 of 16 Question Answer Marks 5(b) Explain the latitudinal pattern of radiation excesses and deficits. Radiation excess and deficit is the balance between the incoming and the outgoing radiation. Surplus is where there is a greater amount of incoming solar radiation (so between the tropics/40 degrees N and S of the Equator). Deficit areas are towards the poles. Explanations include: Thickness of the atmosphere near the poles compared to the equator Tilting of the Earth on its axis/angles of the sun’s rays The albedo of the ground (e.g. in polar regions) The amount of cloud cover In the lower latitudes, there is an excess of solar radiation as that point is where there is a more direct warming of the Earth, as the angle of the sun is at its highest, there is less atmosphere to pass through and so the solar radiation is concentrated on a smaller surface area. Candidates may use an annotated diagram. Award marks based on the quality of explanation and breadth of the response using the marking levels below. Level 3 (6–8) Response clearly explains the latitudinal pattern of radiation excesses and deficits. Response is well founded in detailed knowledge and strong conceptual understanding of the topic. Examples used are appropriate and integrated effectively into the response. Level 2 (3–5) Response explains the latitudinal pattern of radiation excesses and deficits. Response develops on a largely secure base of knowledge and understanding. Examples may lack detail or development. Level 1 (1–2) Response describes the latitudinal pattern of radiation excesses and deficits. Knowledge is basic and understanding may be inaccurate. Examples are in name only or lacking entirely. Level 0 (0) No creditable response. 8
Mark scheme, page 13
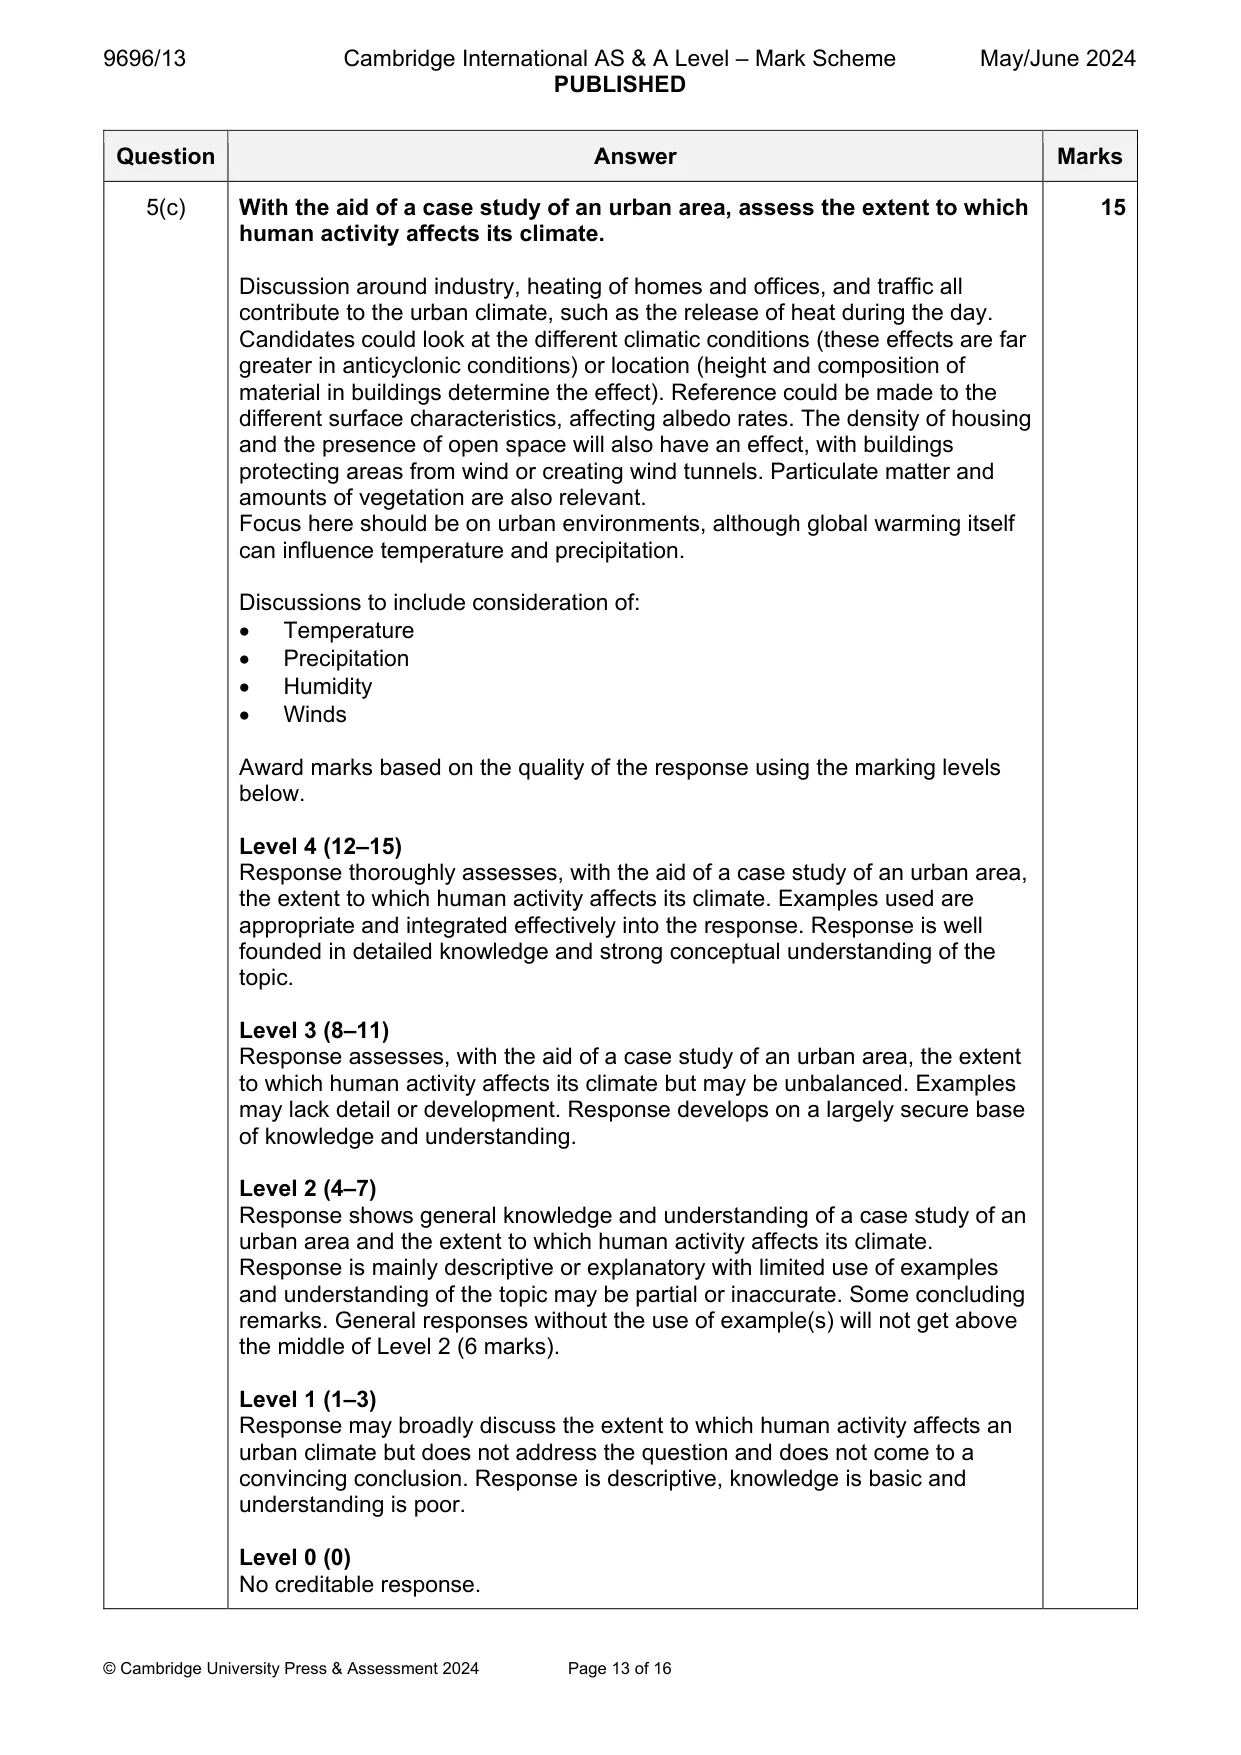
9696/13 Cambridge International AS & A Level – Mark Scheme PUBLISHED May/June 2024 © Cambridge University Press & Assessment 2024 Page 13 of 16 Question Answer Marks 5(c) With the aid of a case study of an urban area, assess the extent to which human activity affects its climate. Discussion around industry, heating of homes and offices, and traffic all contribute to the urban climate, such as the release of heat during the day. Candidates could look at the different climatic conditions (these effects are far greater in anticyclonic conditions) or location (height and composition of material in buildings determine the effect). Reference could be made to the different surface characteristics, affecting albedo rates. The density of housing and the presence of open space will also have an effect, with buildings protecting areas from wind or creating wind tunnels. Particulate matter and amounts of vegetation are also relevant. Focus here should be on urban environments, although global warming itself can influence temperature and precipitation. Discussions to include consideration of: Temperature Precipitation Humidity Winds Award marks based on the quality of the response using the marking levels below. Level 4 (12–15) Response thoroughly assesses, with the aid of a case study of an urban area, the extent to which human activity affects its climate. Examples used are appropriate and integrated effectively into the response. Response is well founded in detailed knowledge and strong conceptual understanding of the topic. Level 3 (8–11) Response assesses, with the aid of a case study of an urban area, the extent to which human activity affects its climate but may be unbalanced. Examples may lack detail or development. Response develops on a largely secure base of knowledge and understanding. Level 2 (4–7) Response shows general knowledge and understanding of a case study of an urban area and the extent to which human activity affects its climate. Response is mainly descriptive or explanatory with limited use of examples and understanding of the topic may be partial or inaccurate. Some concluding remarks. General responses without the use of example(s) will not get above the middle of Level 2 (6 marks). Level 1 (1–3) Response may broadly discuss the extent to which human activity affects an urban climate but does not address the question and does not come to a convincing conclusion. Response is descriptive, knowledge is basic and understanding is poor. Level 0 (0) No creditable response. 15
Mark scheme, page 14
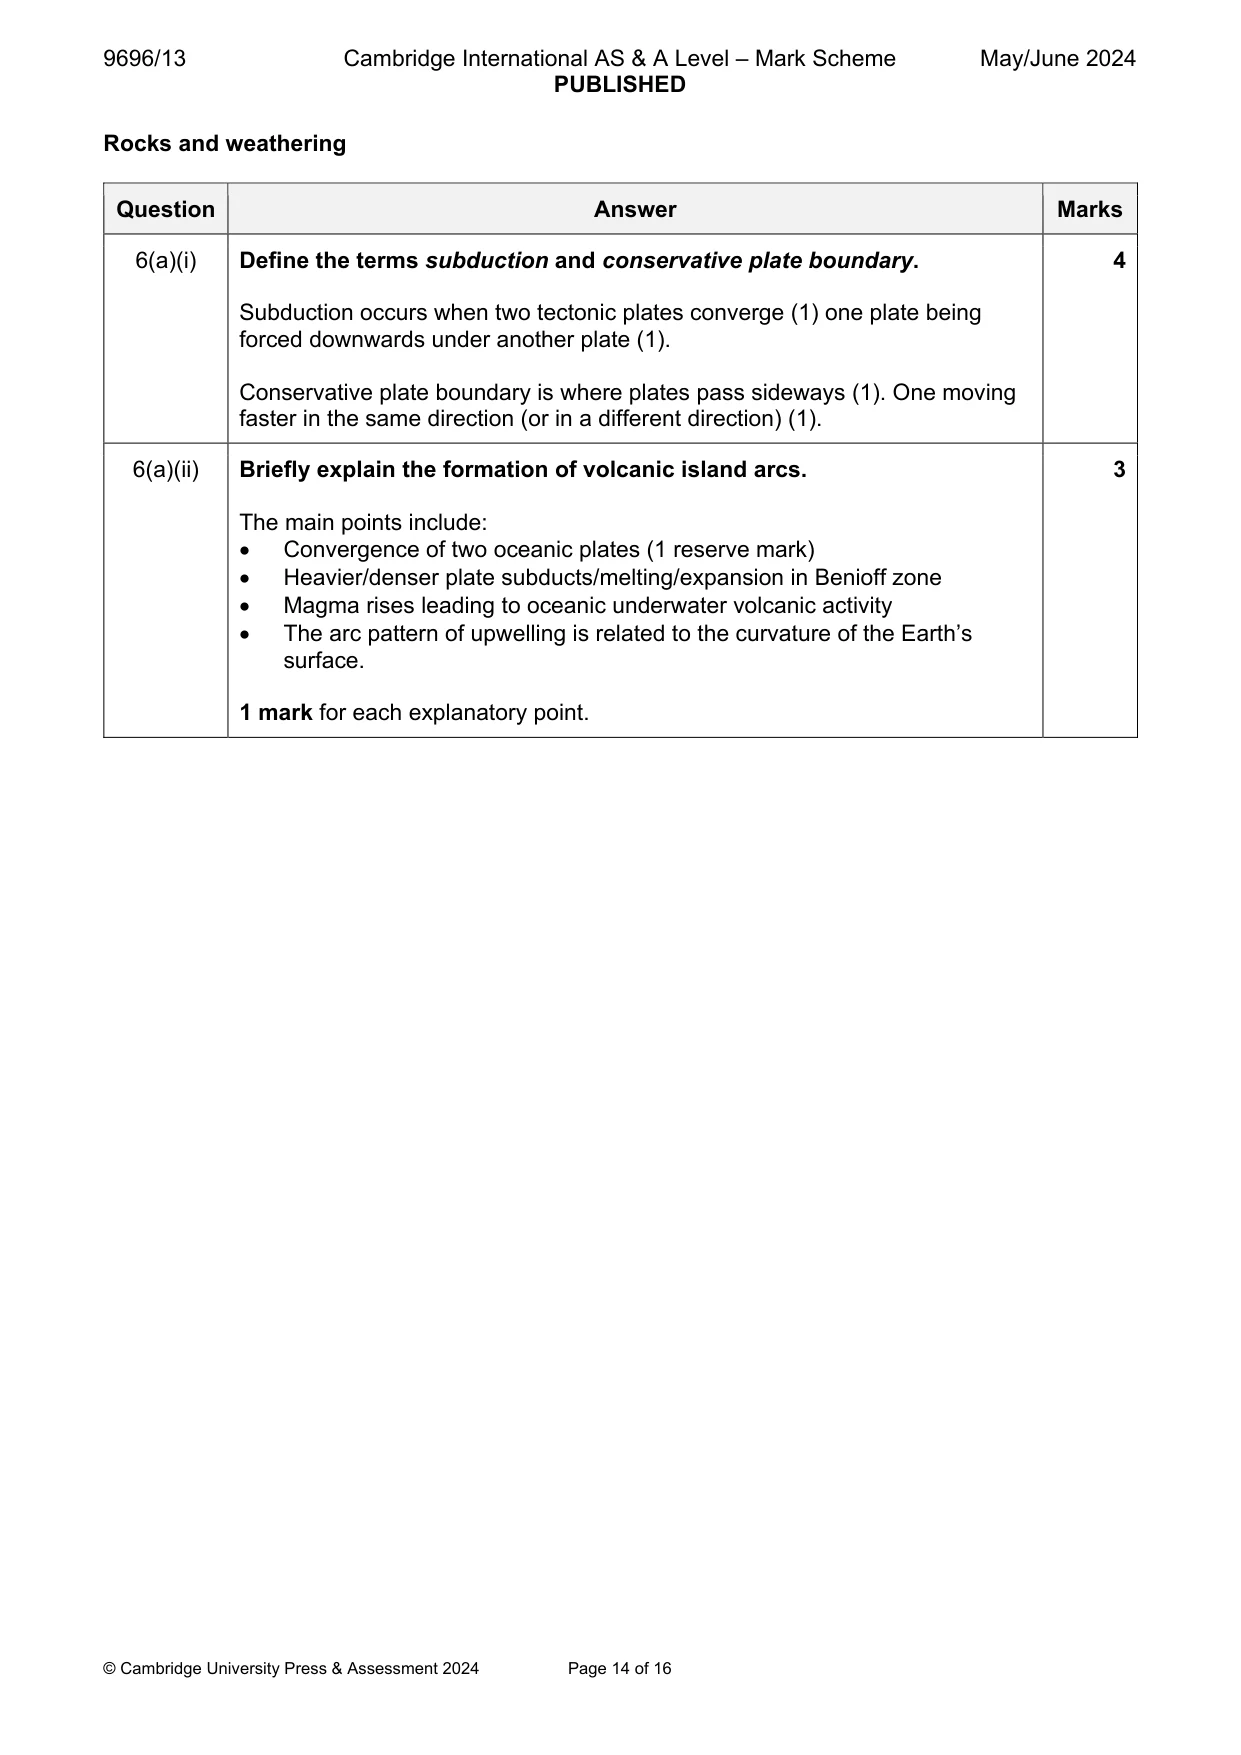
9696/13 Cambridge International AS & A Level – Mark Scheme PUBLISHED May/June 2024 © Cambridge University Press & Assessment 2024 Page 14 of 16 Rocks and weathering Question Answer Marks 6(a)(i) Define the terms subduction and conservative plate boundary. Subduction occurs when two tectonic plates converge (1) one plate being forced downwards under another plate (1). Conservative plate boundary is where plates pass sideways (1). One moving faster in the same direction (or in a different direction) (1). 4 6(a)(ii) Briefly explain the formation of volcanic island arcs. The main points include: Convergence of two oceanic plates (1 reserve mark) Heavier/denser plate subducts/melting/expansion in Benioff zone Magma rises leading to oceanic underwater volcanic activity The arc pattern of upwelling is related to the curvature of the Earth’s surface. 1 mark for each explanatory point. 3
Mark scheme, page 15
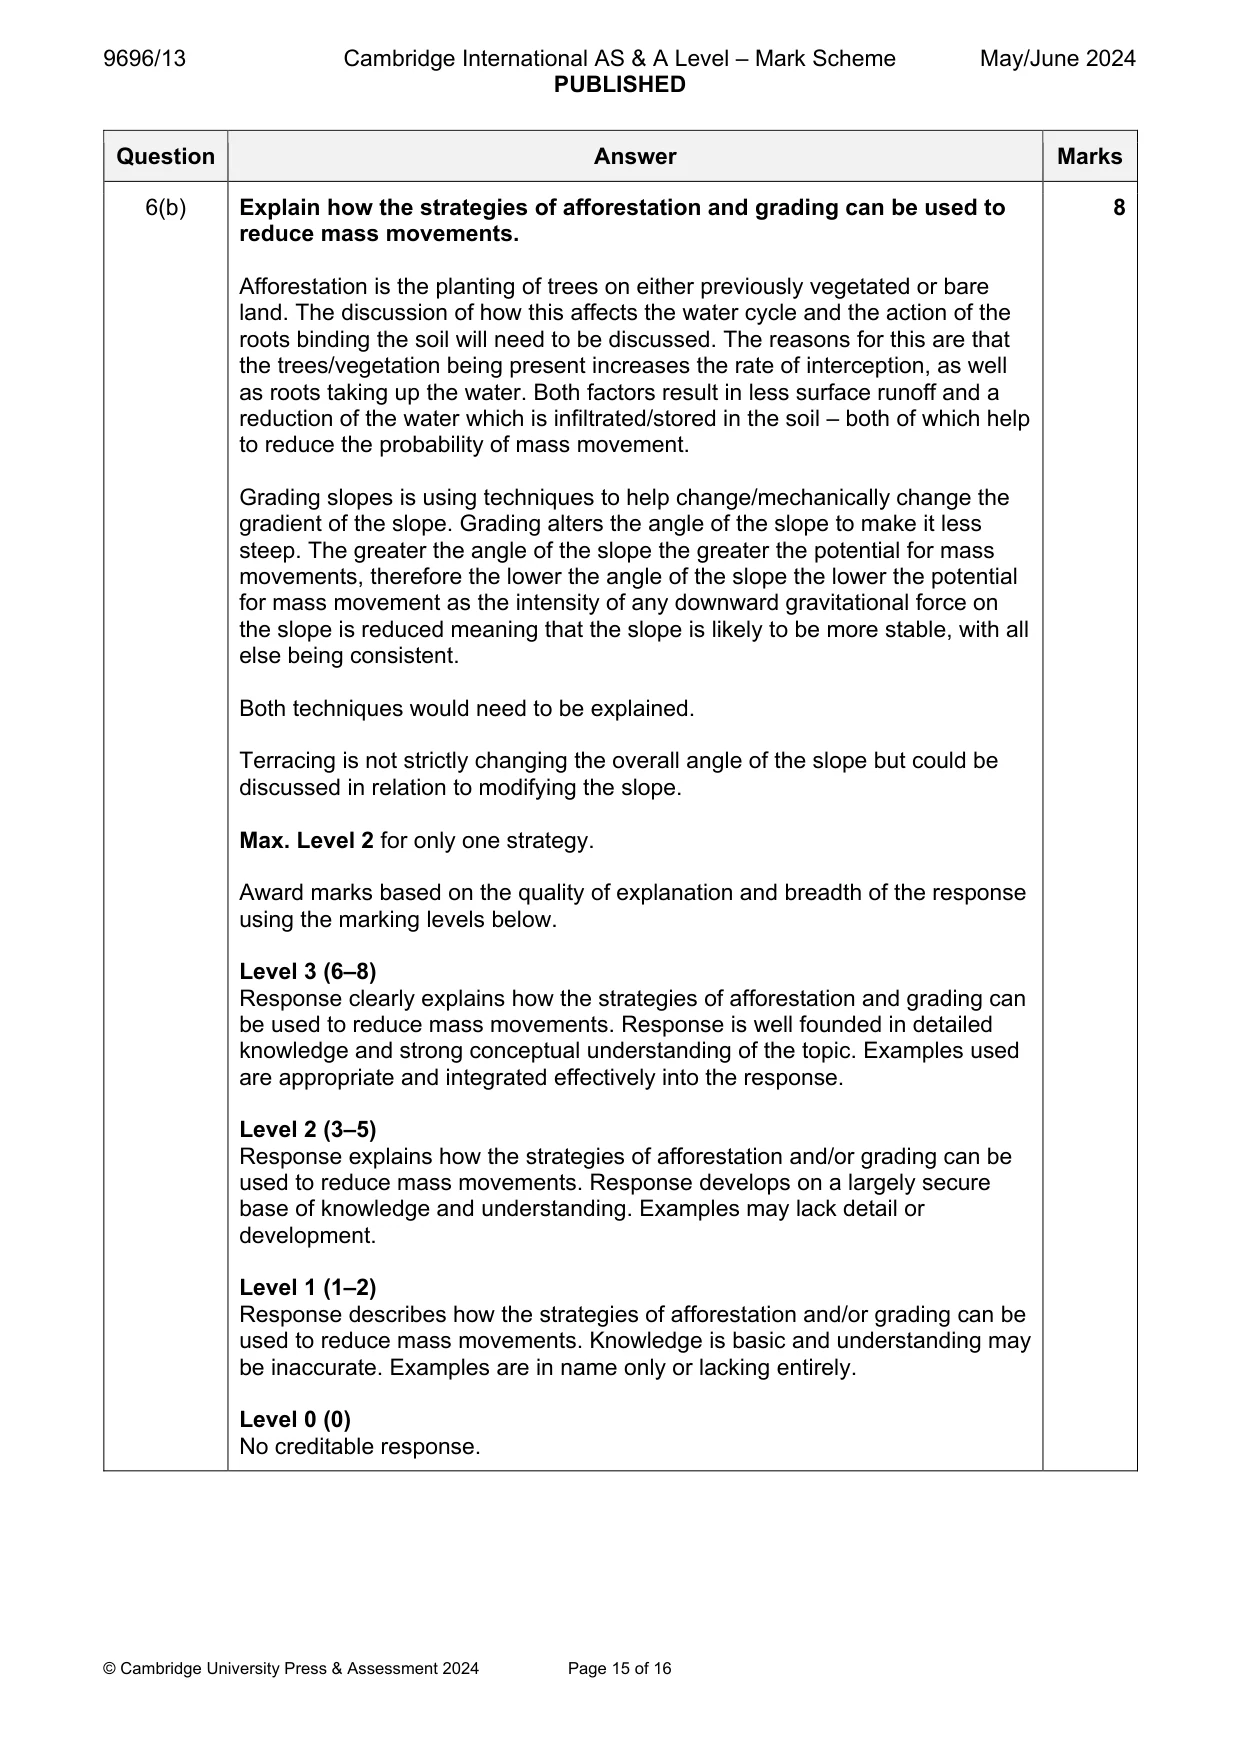
9696/13 Cambridge International AS & A Level – Mark Scheme PUBLISHED May/June 2024 © Cambridge University Press & Assessment 2024 Page 15 of 16 Question Answer Marks 6(b) Explain how the strategies of afforestation and grading can be used to reduce mass movements. Afforestation is the planting of trees on either previously vegetated or bare land. The discussion of how this affects the water cycle and the action of the roots binding the soil will need to be discussed. The reasons for this are that the trees/vegetation being present increases the rate of interception, as well as roots taking up the water. Both factors result in less surface runoff and a reduction of the water which is infiltrated/stored in the soil – both of which help to reduce the probability of mass movement. Grading slopes is using techniques to help change/mechanically change the gradient of the slope. Grading alters the angle of the slope to make it less steep. The greater the angle of the slope the greater the potential for mass movements, therefore the lower the angle of the slope the lower the potential for mass movement as the intensity of any downward gravitational force on the slope is reduced meaning that the slope is likely to be more stable, with all else being consistent. Both techniques would need to be explained. Terracing is not strictly changing the overall angle of the slope but could be discussed in relation to modifying the slope. Max. Level 2 for only one strategy. Award marks based on the quality of explanation and breadth of the response using the marking levels below. Level 3 (6–8) Response clearly explains how the strategies of afforestation and grading can be used to reduce mass movements. Response is well founded in detailed knowledge and strong conceptual understanding of the topic. Examples used are appropriate and integrated effectively into the response. Level 2 (3–5) Response explains how the strategies of afforestation and/or grading can be used to reduce mass movements. Response develops on a largely secure base of knowledge and understanding. Examples may lack detail or development. Level 1 (1–2) Response describes how the strategies of afforestation and/or grading can be used to reduce mass movements. Knowledge is basic and understanding may be inaccurate. Examples are in name only or lacking entirely. Level 0 (0) No creditable response. 8
Mark scheme, page 16
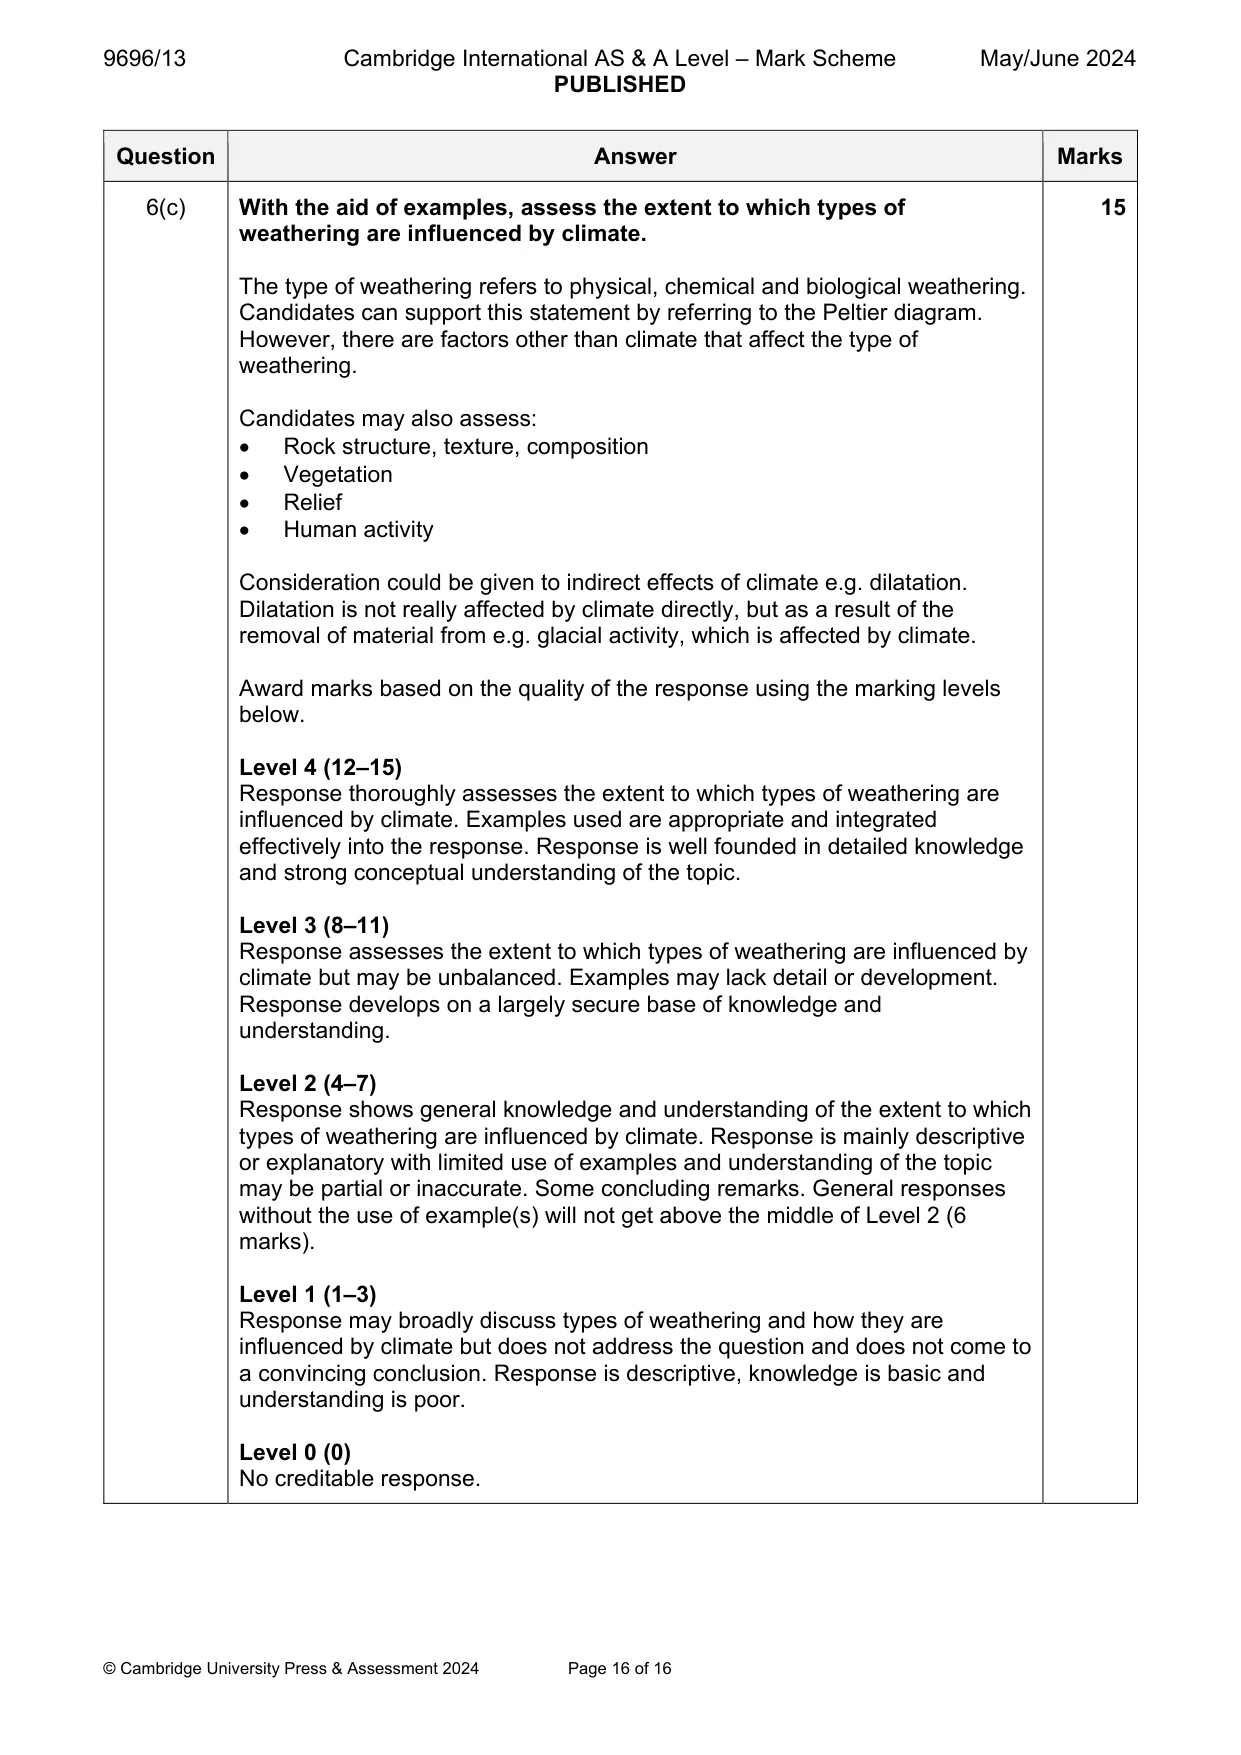
9696/13 Cambridge International AS & A Level – Mark Scheme PUBLISHED May/June 2024 © Cambridge University Press & Assessment 2024 Page 16 of 16 Question Answer Marks 6(c) With the aid of examples, assess the extent to which types of weathering are influenced by climate. The type of weathering refers to physical, chemical and biological weathering. Candidates can support this statement by referring to the Peltier diagram. However, there are factors other than climate that affect the type of weathering. Candidates may also assess: Rock structure, texture, composition Vegetation Relief Human activity Consideration could be given to indirect effects of climate e.g. dilatation. Dilatation is not really affected by climate directly, but as a result of the removal of material from e.g. glacial activity, which is affected by climate. Award marks based on the quality of the response using the marking levels below. Level 4 (12–15) Response thoroughly assesses the extent to which types of weathering are influenced by climate. Examples used are appropriate and integrated effectively into the response. Response is well founded in detailed knowledge and strong conceptual understanding of the topic. Level 3 (8–11) Response assesses the extent to which types of weathering are influenced by climate but may be unbalanced. Examples may lack detail or development. Response develops on a largely secure base of knowledge and understanding. Level 2 (4–7) Response shows general knowledge and understanding of the extent to which types of weathering are influenced by climate. Response is mainly descriptive or explanatory with limited use of examples and understanding of the topic may be partial or inaccurate. Some concluding remarks. General responses without the use of example(s) will not get above the middle of Level 2 (6 marks). Level 1 (1–3) Response may broadly discuss types of weathering and how they are influenced by climate but does not address the question and does not come to a convincing conclusion. Response is descriptive, knowledge is basic and understanding is poor. Level 0 (0) No creditable response. 15
What you needed in this session
Cambridge’s own grade thresholds for 2024 May/June, Paper 1 · Variant 3. A higher threshold means an easier paper — the bar moves with how the cohort did.