Cambridge A Level Geography 9696 — 2016 Oct/Nov Paper 1 · Variant 1
9696/11/O/N/16 · 100 marks · ≈113 min
The question paper and its mark scheme, free to read here and free to download. This is Cambridge’s own paper, exactly as it was sat.
Question paper8 pages



Mark scheme15 pages
Answers below. Sit the paper first if you are practising.


Paper as text
Question paper, page 1
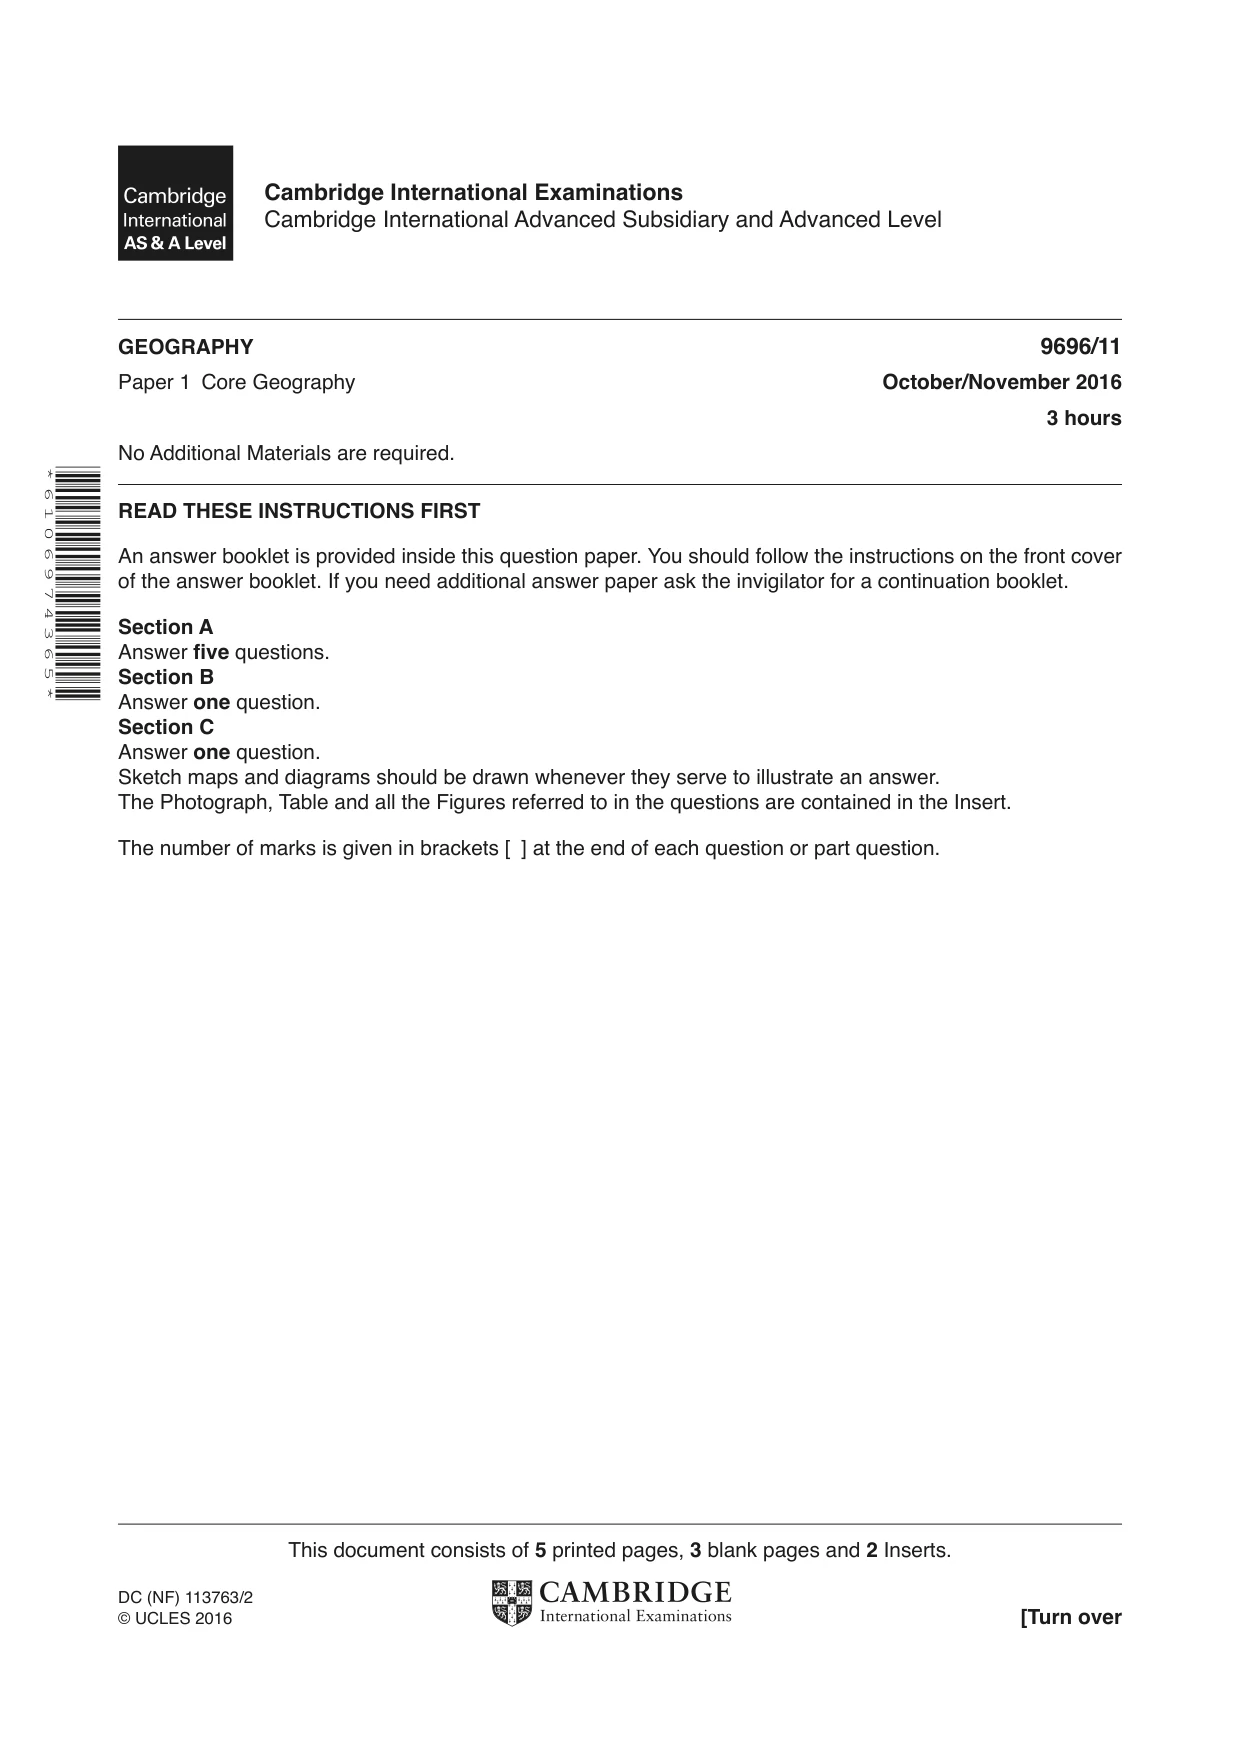
This document consists of 5 printed pages, 3 blank pages and 2 Inserts. DC (NF) 113763/2 © UCLES 2016 [Turn over Cambridge International Examinations Cambridge International Advanced Subsidiary and Advanced Level * 6 1 0 6 9 7 4 3 6 5 * GEOGRAPHY 9696/11 Paper 1 Core Geography October/November 2016 3 hours No Additional Materials are required. READ THESE INSTRUCTIONS FIRST An answer booklet is provided inside this question paper. You should follow the instructions on the front cover of the answer booklet. If you need additional answer paper ask the invigilator for a continuation booklet. Section A Answer five questions. Section B Answer one question. Section C Answer one question. Sketch maps and diagrams should be drawn whenever they serve to illustrate an answer. The Photograph, Table and all the Figures referred to in the questions are contained in the Insert. The number of marks is given in brackets [ ] at the end of each question or part question.
Question paper, page 2
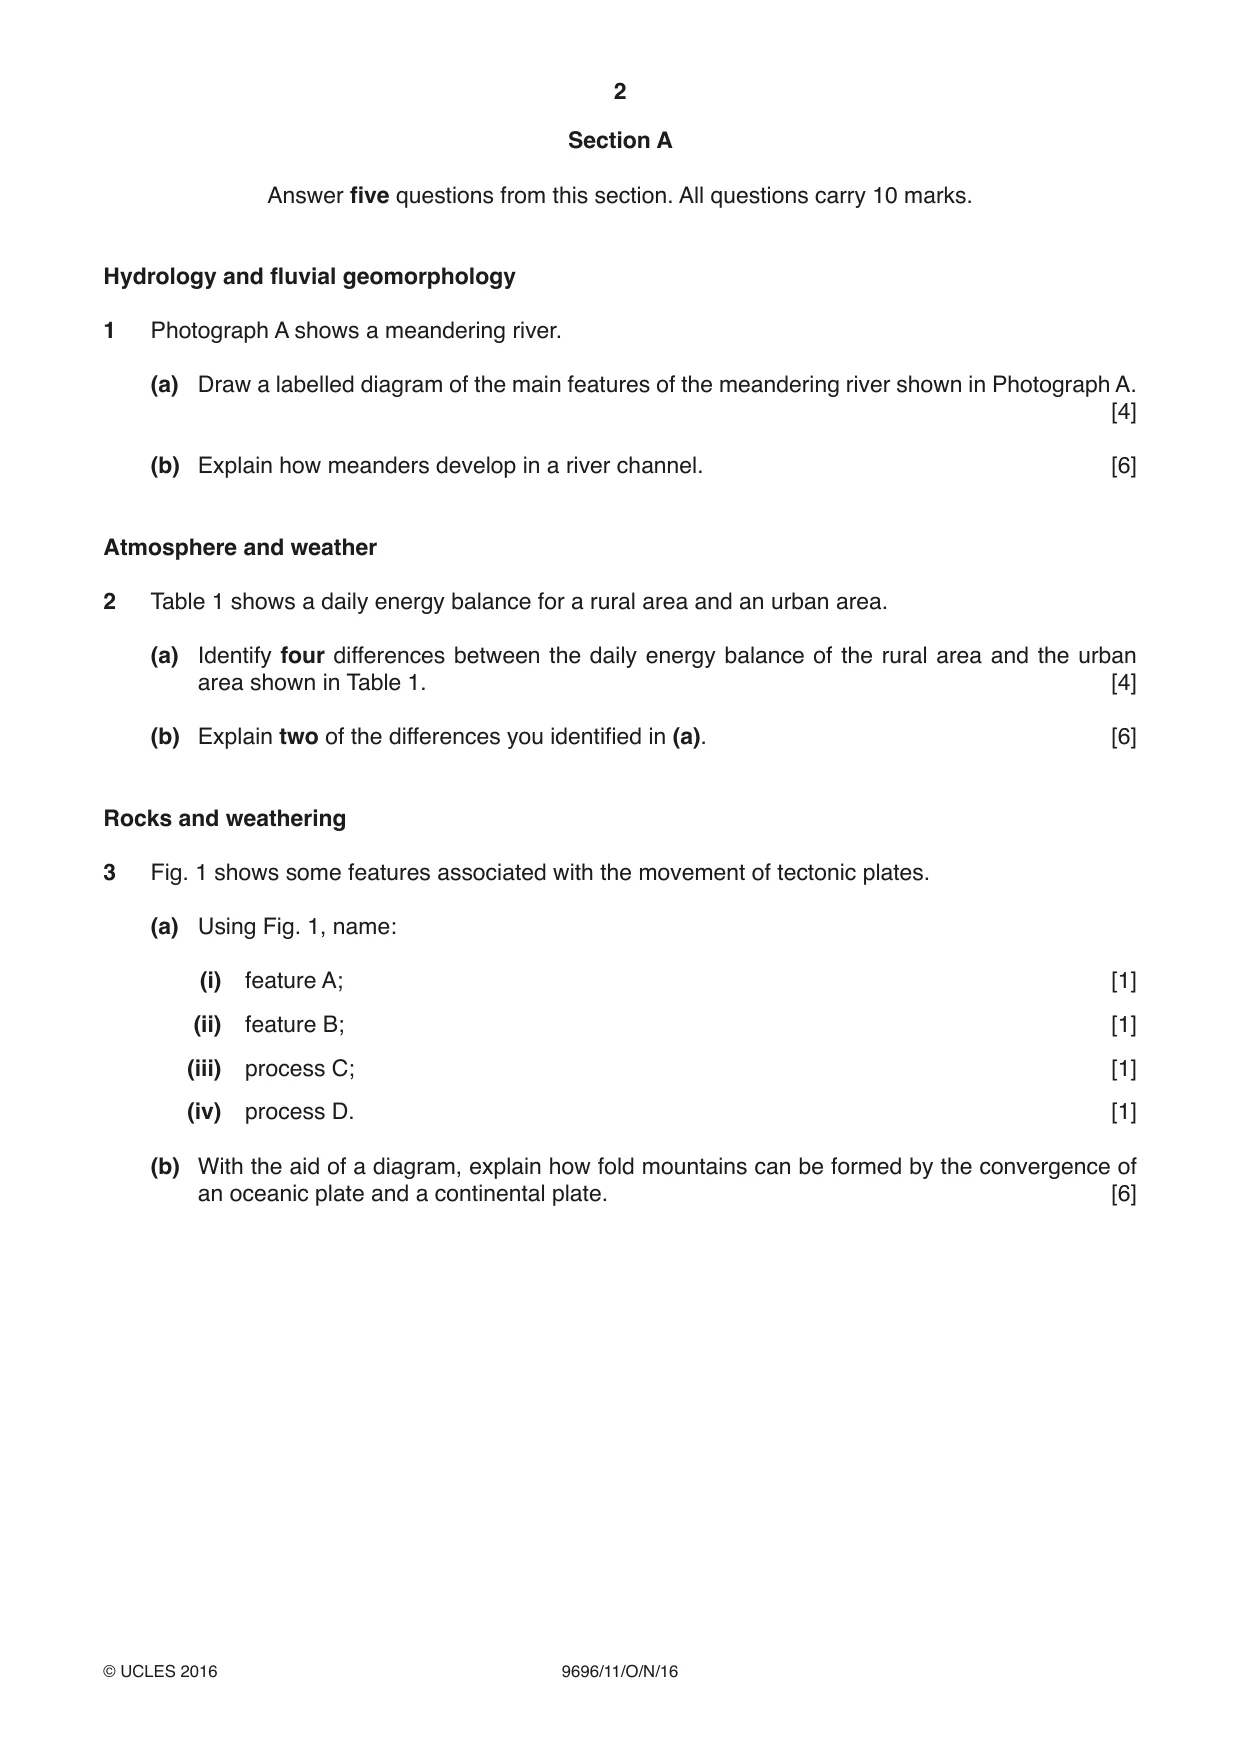
2 9696/11/O/N/16 © UCLES 2016 Section A Answer five questions from this section. All questions carry 10 marks. Hydrology and fluvial geomorphology 1 Photograph A shows a meandering river. (a) Draw a labelled diagram of the main features of the meandering river shown in Photograph A. [4] (b) Explain how meanders develop in a river channel. [6] Atmosphere and weather 2 Table 1 shows a daily energy balance for a rural area and an urban area. (a) Identify four differences between the daily energy balance of the rural area and the urban area shown in Table 1. [4] (b) Explain two of the differences you identified in (a). [6] Rocks and weathering 3 Fig. 1 shows some features associated with the movement of tectonic plates. (a) Using Fig. 1, name: (i) feature A; [1] (ii) feature B; [1] (iii) process C; [1] (iv) process D. [1] (b) With the aid of a diagram, explain how fold mountains can be formed by the convergence of an oceanic plate and a continental plate. [6]
Question paper, page 3
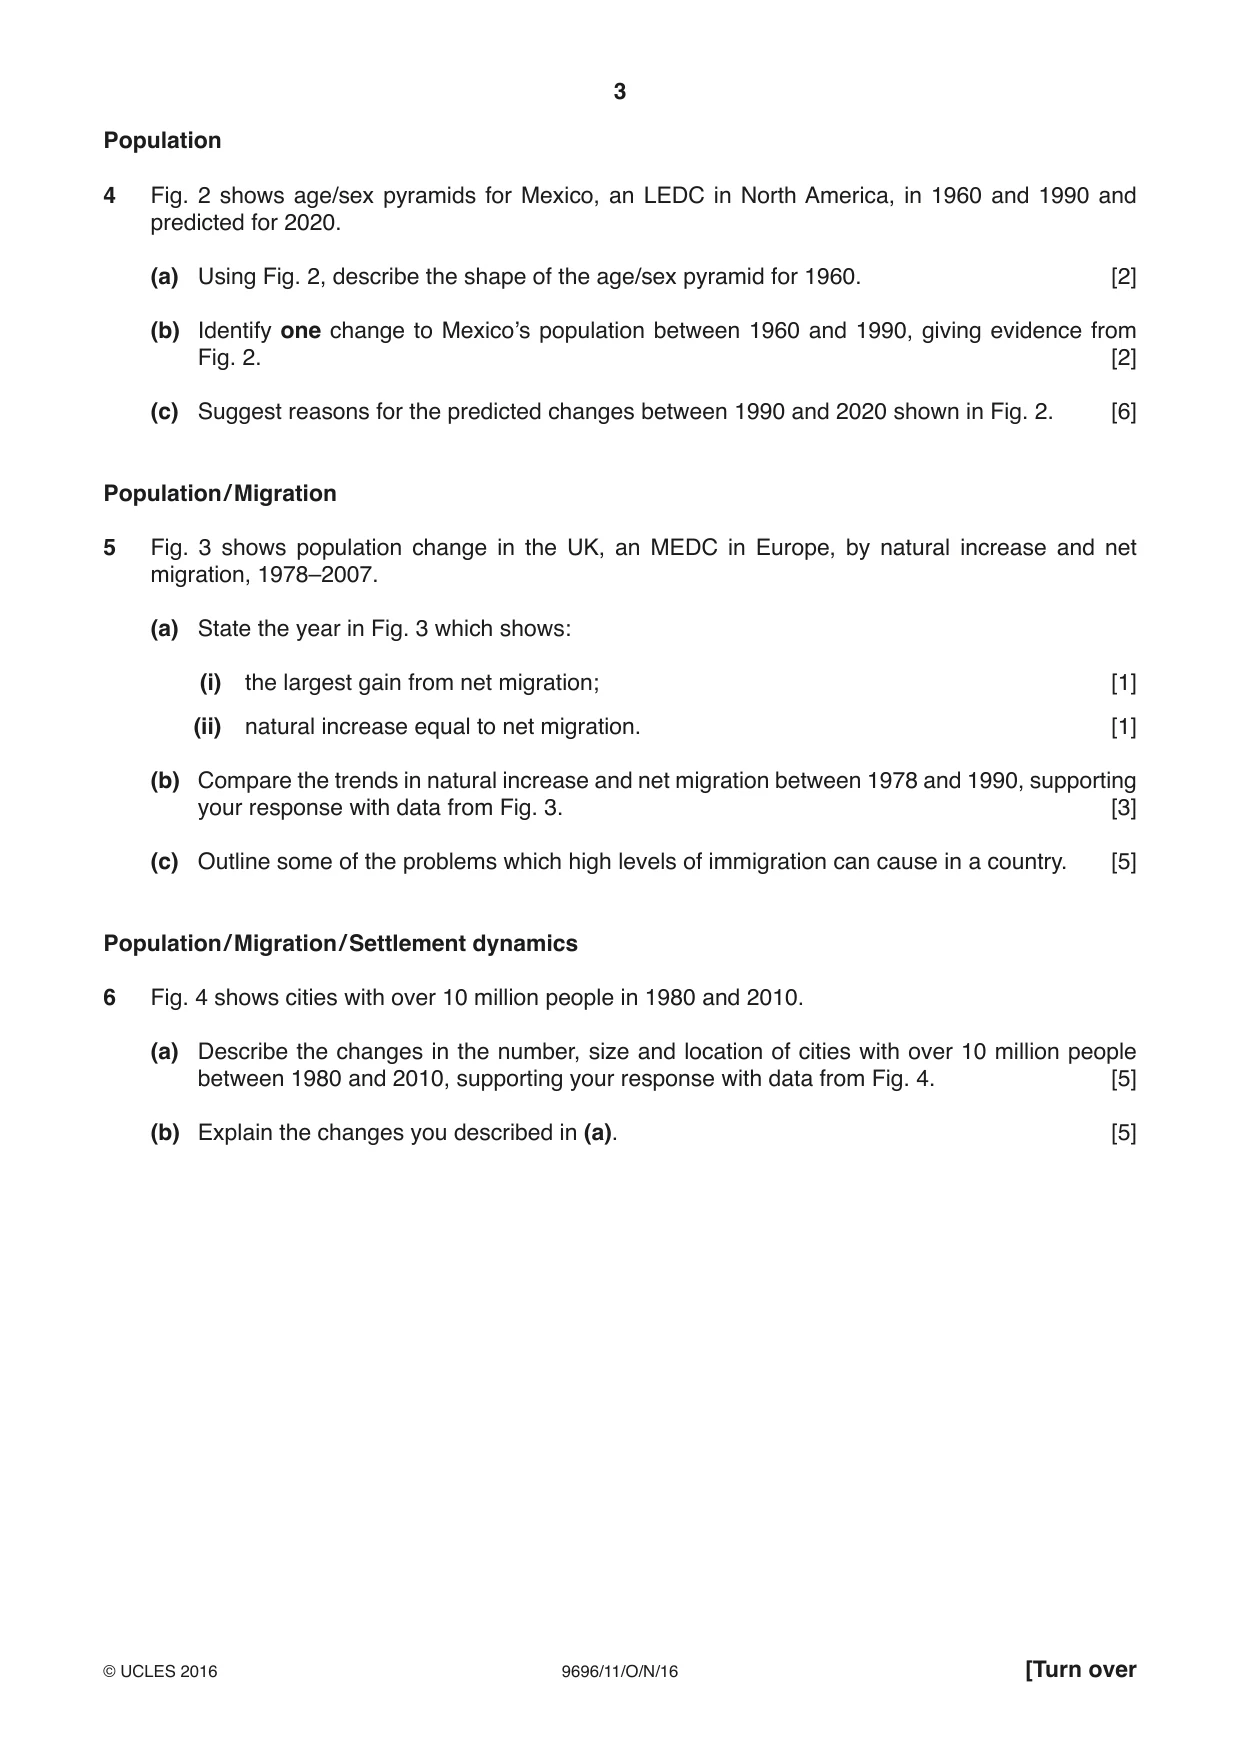
3 9696/11/O/N/16 © UCLES 2016 [Turn over Population 4 Fig. 2 shows age/sex pyramids for Mexico, an LEDC in North America, in 1960 and 1990 and predicted for 2020. (a) Using Fig. 2, describe the shape of the age/sex pyramid for 1960. [2] (b) Identify one change to Mexico’s population between 1960 and 1990, giving evidence from Fig. 2. [2] (c) Suggest reasons for the predicted changes between 1990 and 2020 shown in Fig. 2. [6] Population / Migration 5 Fig. 3 shows population change in the UK, an MEDC in Europe, by natural increase and net migration, 1978–2007. (a) State the year in Fig. 3 which shows: (i) the largest gain from net migration; [1] (ii) natural increase equal to net migration. [1] (b) Compare the trends in natural increase and net migration between 1978 and 1990, supporting your response with data from Fig. 3. [3] (c) Outline some of the problems which high levels of immigration can cause in a country. [5] Population / Migration / Settlement dynamics 6 Fig. 4 shows cities with over 10 million people in 1980 and 2010. (a) Describe the changes in the number, size and location of cities with over 10 million people between 1980 and 2010, supporting your response with data from Fig. 4. [5] (b) Explain the changes you described in (a). [5]
Question paper, page 4
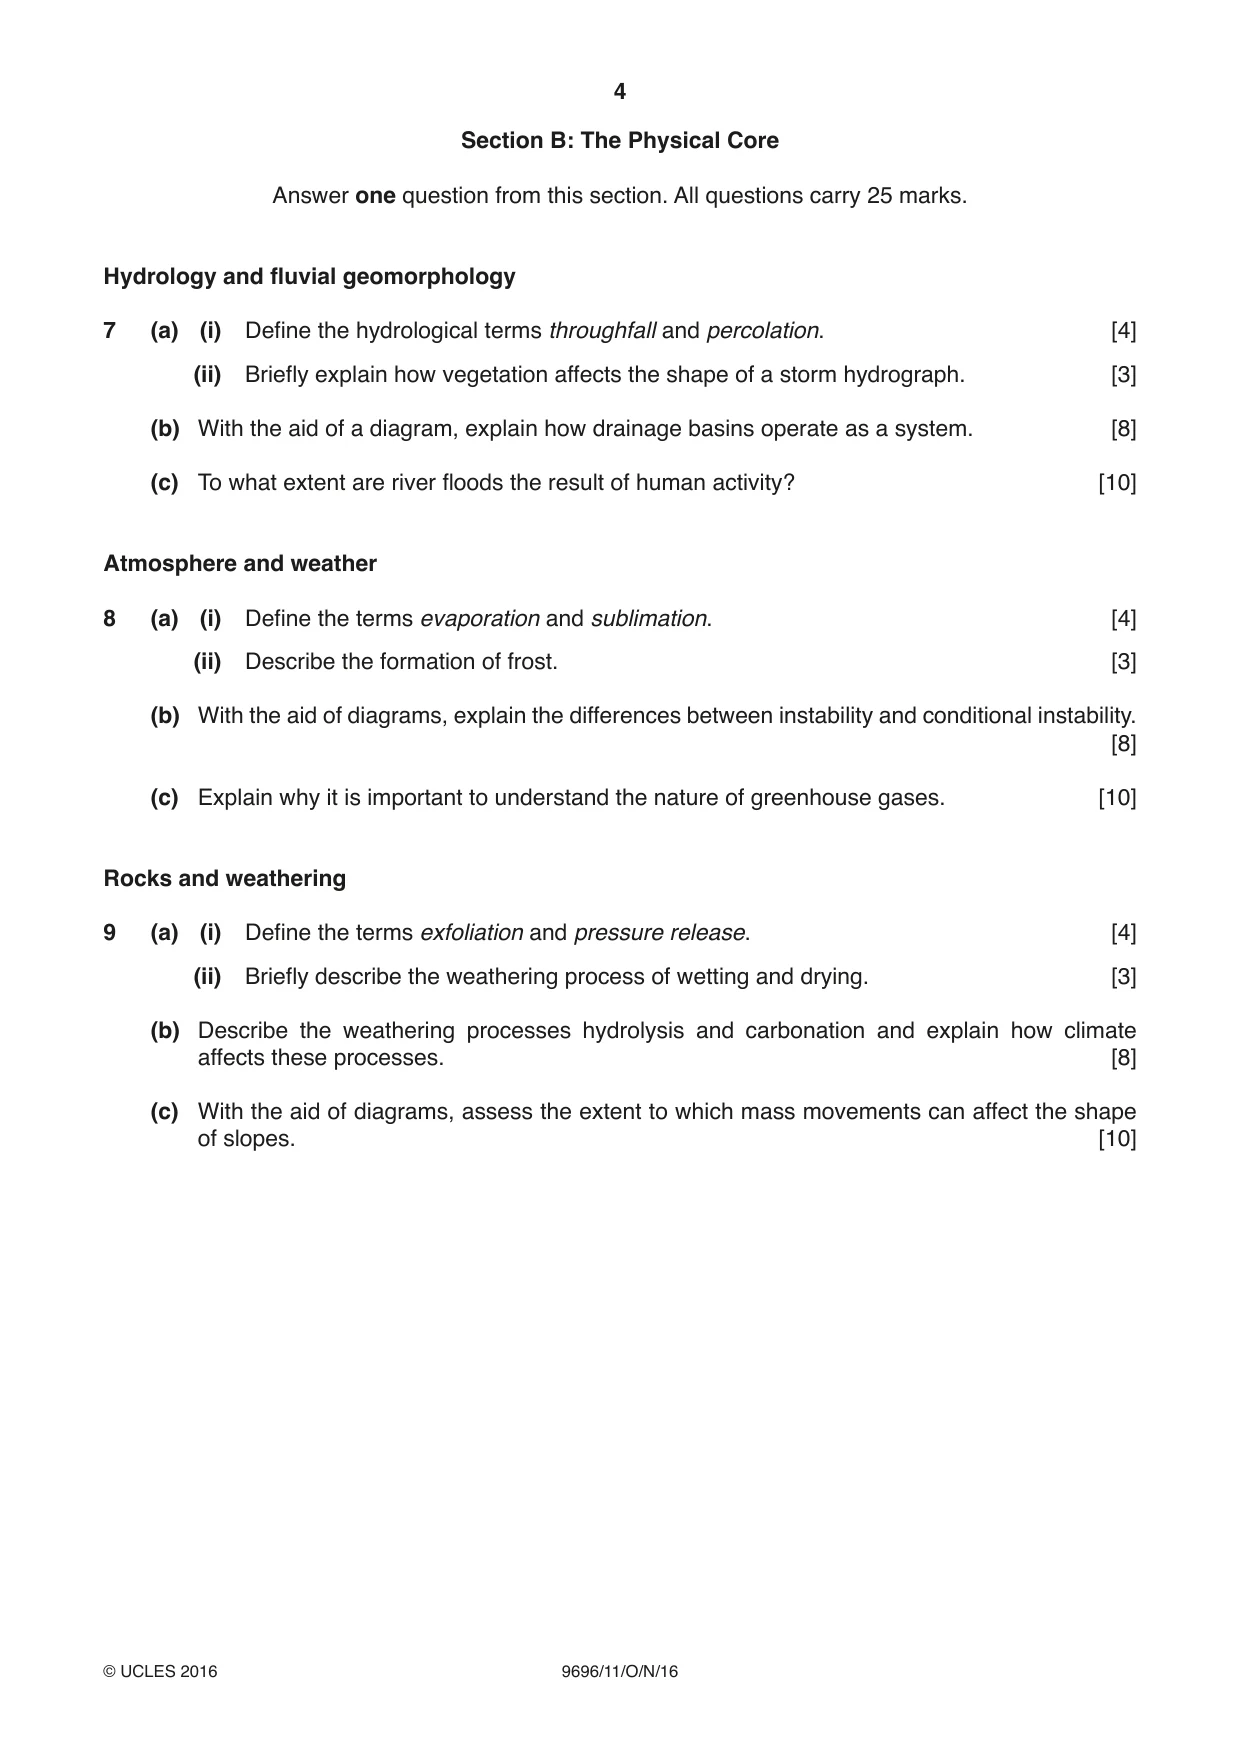
4 9696/11/O/N/16 © UCLES 2016 Section B: The Physical Core Answer one question from this section. All questions carry 25 marks. Hydrology and fluvial geomorphology 7 (a) (i) Define the hydrological terms throughfall and percolation. [4] (ii) Briefly explain how vegetation affects the shape of a storm hydrograph. [3] (b) With the aid of a diagram, explain how drainage basins operate as a system. [8] (c) To what extent are river floods the result of human activity? [10] Atmosphere and weather 8 (a) (i) Define the terms evaporation and sublimation. [4] (ii) Describe the formation of frost. [3] (b) With the aid of diagrams, explain the differences between instability and conditional instability. [8] (c) Explain why it is important to understand the nature of greenhouse gases. [10] Rocks and weathering 9 (a) (i) Define the terms exfoliation and pressure release. [4] (ii) Briefly describe the weathering process of wetting and drying. [3] (b) Describe the weathering processes hydrolysis and carbonation and explain how climate affects these processes. [8] (c) With the aid of diagrams, assess the extent to which mass movements can affect the shape of slopes. [10]
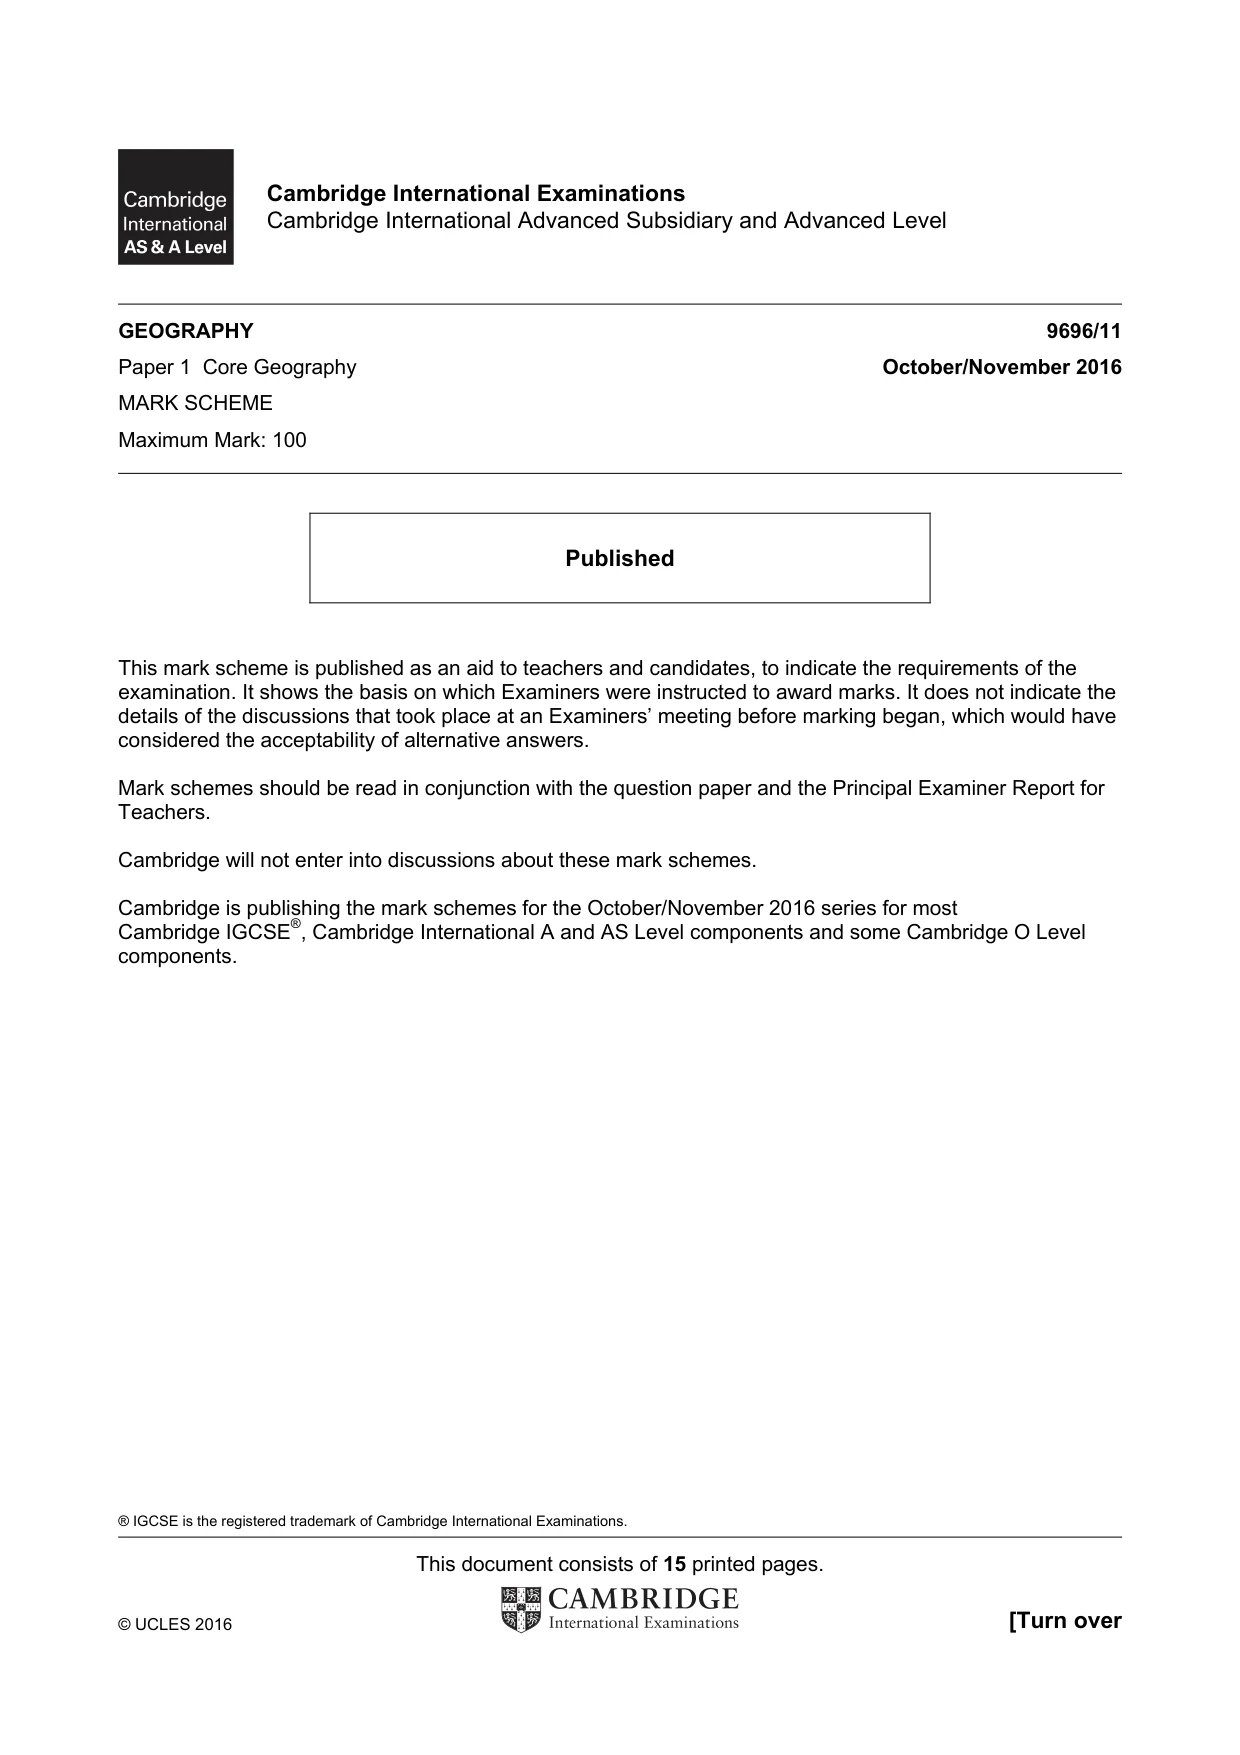
Question paper, page 5
5 9696/11/O/N/16 © UCLES 2016 Section C: The Human Core Answer one question from this section. All questions carry 25 marks. Population 10 (a) (i) Define the population term dependency. [3] (ii) Outline two issues associated with ageing populations. [4] (b) Explain why life expectancy changes over time as countries develop. [8] (c) ‘The demographic transition model is outdated and only applies to MEDCs.’ How far do you agree? [10] Migration 11 (a) Explain how age and family ties affect migration. [7] (b) Describe stepped migration and suggest reasons why it occurs. [8] (c) ‘Deciding to migrate is more about perception than about reality.’ How far do you agree? [10] Settlement dynamics 12 (a) (i) Give the meaning of the term functional zonation in relation to urban land-use. [2] (ii) Draw and label a typical bid-rent diagram for an urban area. [5] (b) With the help of one or more examples, explain why residential segregation occurs within urban areas. [8] (c) Assess the advantages and disadvantages of a central urban location for retailing (shops and stores). [10]
Question paper, page 6
6 9696/11/O/N/16 © UCLES 2016 BLANK PAGE
Question paper, page 7
7 9696/11/O/N/16 © UCLES 2016 BLANK PAGE
Question paper, page 8
8 9696/11/O/N/16 © UCLES 2016 BLANK PAGE Permission to reproduce items where third-party owned material protected by copyright is included has been sought and cleared where possible. Every reasonable effort has been made by the publisher (UCLES) to trace copyright holders, but if any items requiring clearance have unwittingly been included, the publisher will be pleased to make amends at the earliest possible opportunity. To avoid the issue of disclosure of answer-related information to candidates, all copyright acknowledgements are reproduced online in the Cambridge International Examinations Copyright Acknowledgements Booklet. This is produced for each series of examinations and is freely available to download at www.cie.org.uk after the live examination series. Cambridge International Examinations is part of the Cambridge Assessment Group. Cambridge Assessment is the brand name of University of Cambridge Local Examinations Syndicate (UCLES), which is itself a department of the University of Cambridge.
Mark scheme, page 1
® IGCSE is the registered trademark of Cambridge International Examinations. This document consists of 15 printed pages. © UCLES 2016 [Turn over Cambridge International Examinations Cambridge International Advanced Subsidiary and Advanced Level GEOGRAPHY 9696/11 Paper 1 Core Geography October/November 2016 MARK SCHEME Maximum Mark: 100 Published This mark scheme is published as an aid to teachers and candidates, to indicate the requirements of the examination. It shows the basis on which Examiners were instructed to award marks. It does not indicate the details of the discussions that took place at an Examiners’ meeting before marking began, which would have considered the acceptability of alternative answers. Mark schemes should be read in conjunction with the question paper and the Principal Examiner Report for Teachers. Cambridge will not enter into discussions about these mark schemes. Cambridge is publishing the mark schemes for the October/November 2016 series for most Cambridge IGCSE®, Cambridge International A and AS Level components and some Cambridge O Level components.
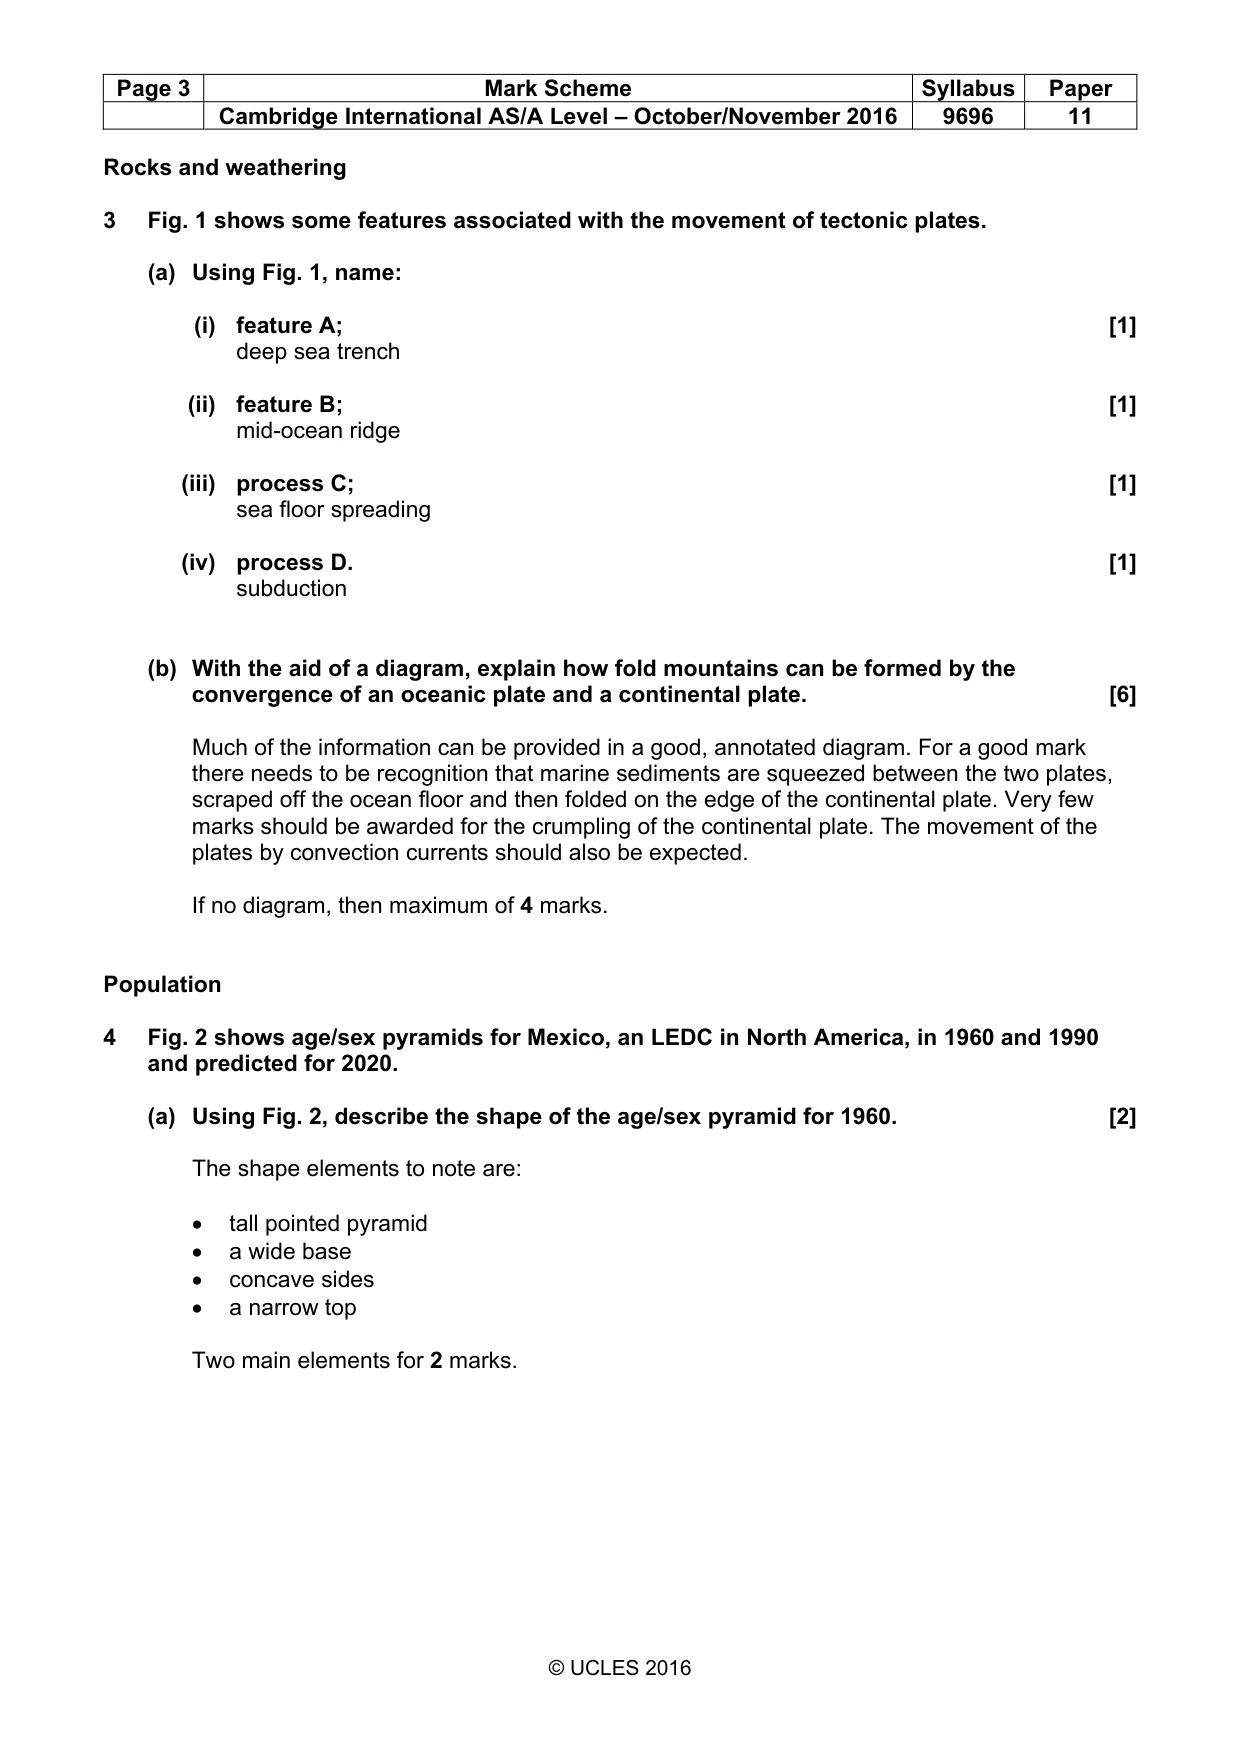
Mark scheme, page 2
Page 2 Mark Scheme Syllabus Paper Cambridge International AS/A Level – October/November 2016 9696 11 © UCLES 2016 Section A Hydrology and fluvial geomorphology 1 Photograph A shows a meandering river. (a) Draw a labelled diagram of the main features of the meandering river shown in Photograph A. [4] Award two marks for the diagram and two marks for appropriate features. One should not expect a too sophisticated sketch, but the important thing is that it should be an attempt to portray the features shown. A ‘theoretical’ diagram of a meandering river should get no credit. Features that should be noted are point bars/slip off slope, river cliffs and probably an oxbow lake. Mark as 2 for diagram and 2 for labelling. (b) Explain how meanders develop in a river channel. [6] The emphasis should be on the formation of pools and riffles which leads the thalweg to swing back and forth and the development of helicoidal flow. This will lead to the undercut river cliff on the outside of the bend with the sand and gravel deposit of the point bar on the inside bend. A good diagram could provide much of the description and explanation. Atmosphere and weather 2 Table 1 shows a daily energy balance for a rural area and an urban area. (a) Identify four differences between the daily energy balance of the rural area and the urban area shown in Table 1. [4] The point to note is that incoming radiation amounts are the same. The main differences are: • outgoing infrared radiation • reflected radiation • latent heat • storage of heat The anthropogenic heat input in the urban area should also be noted. Four differences with the use of actual figures is enough for full marks. (b) Explain two of the differences you identified in (a). [6] Explanation will mostly be based on the different surface albedos between the two areas with the greater storage of heat and re-radiation. The increased latent heat transfer with trees and vegetation is another key point as is the generation of anthropogenic heat. Two of the main differences with good explanations will be sufficient for full marks. Mark 3/3, 2/4 or 4/2.
Mark scheme, page 3
Page 3 Mark Scheme Syllabus Paper Cambridge International AS/A Level – October/November 2016 9696 11 © UCLES 2016 Rocks and weathering 3 Fig. 1 shows some features associated with the movement of tectonic plates. (a) Using Fig. 1, name: (i) feature A; [1] deep sea trench (ii) feature B; [1] mid-ocean ridge (iii) process C; [1] sea floor spreading (iv) process D. [1] subduction (b) With the aid of a diagram, explain how fold mountains can be formed by the convergence of an oceanic plate and a continental plate. [6] Much of the information can be provided in a good, annotated diagram. For a good mark there needs to be recognition that marine sediments are squeezed between the two plates, scraped off the ocean floor and then folded on the edge of the continental plate. Very few marks should be awarded for the crumpling of the continental plate. The movement of the plates by convection currents should also be expected. If no diagram, then maximum of 4 marks. Population 4 Fig. 2 shows age/sex pyramids for Mexico, an LEDC in North America, in 1960 and 1990 and predicted for 2020. (a) Using Fig. 2, describe the shape of the age/sex pyramid for 1960. [2] The shape elements to note are: • tall pointed pyramid • a wide base • concave sides • a narrow top Two main elements for 2 marks.
Mark scheme, page 4
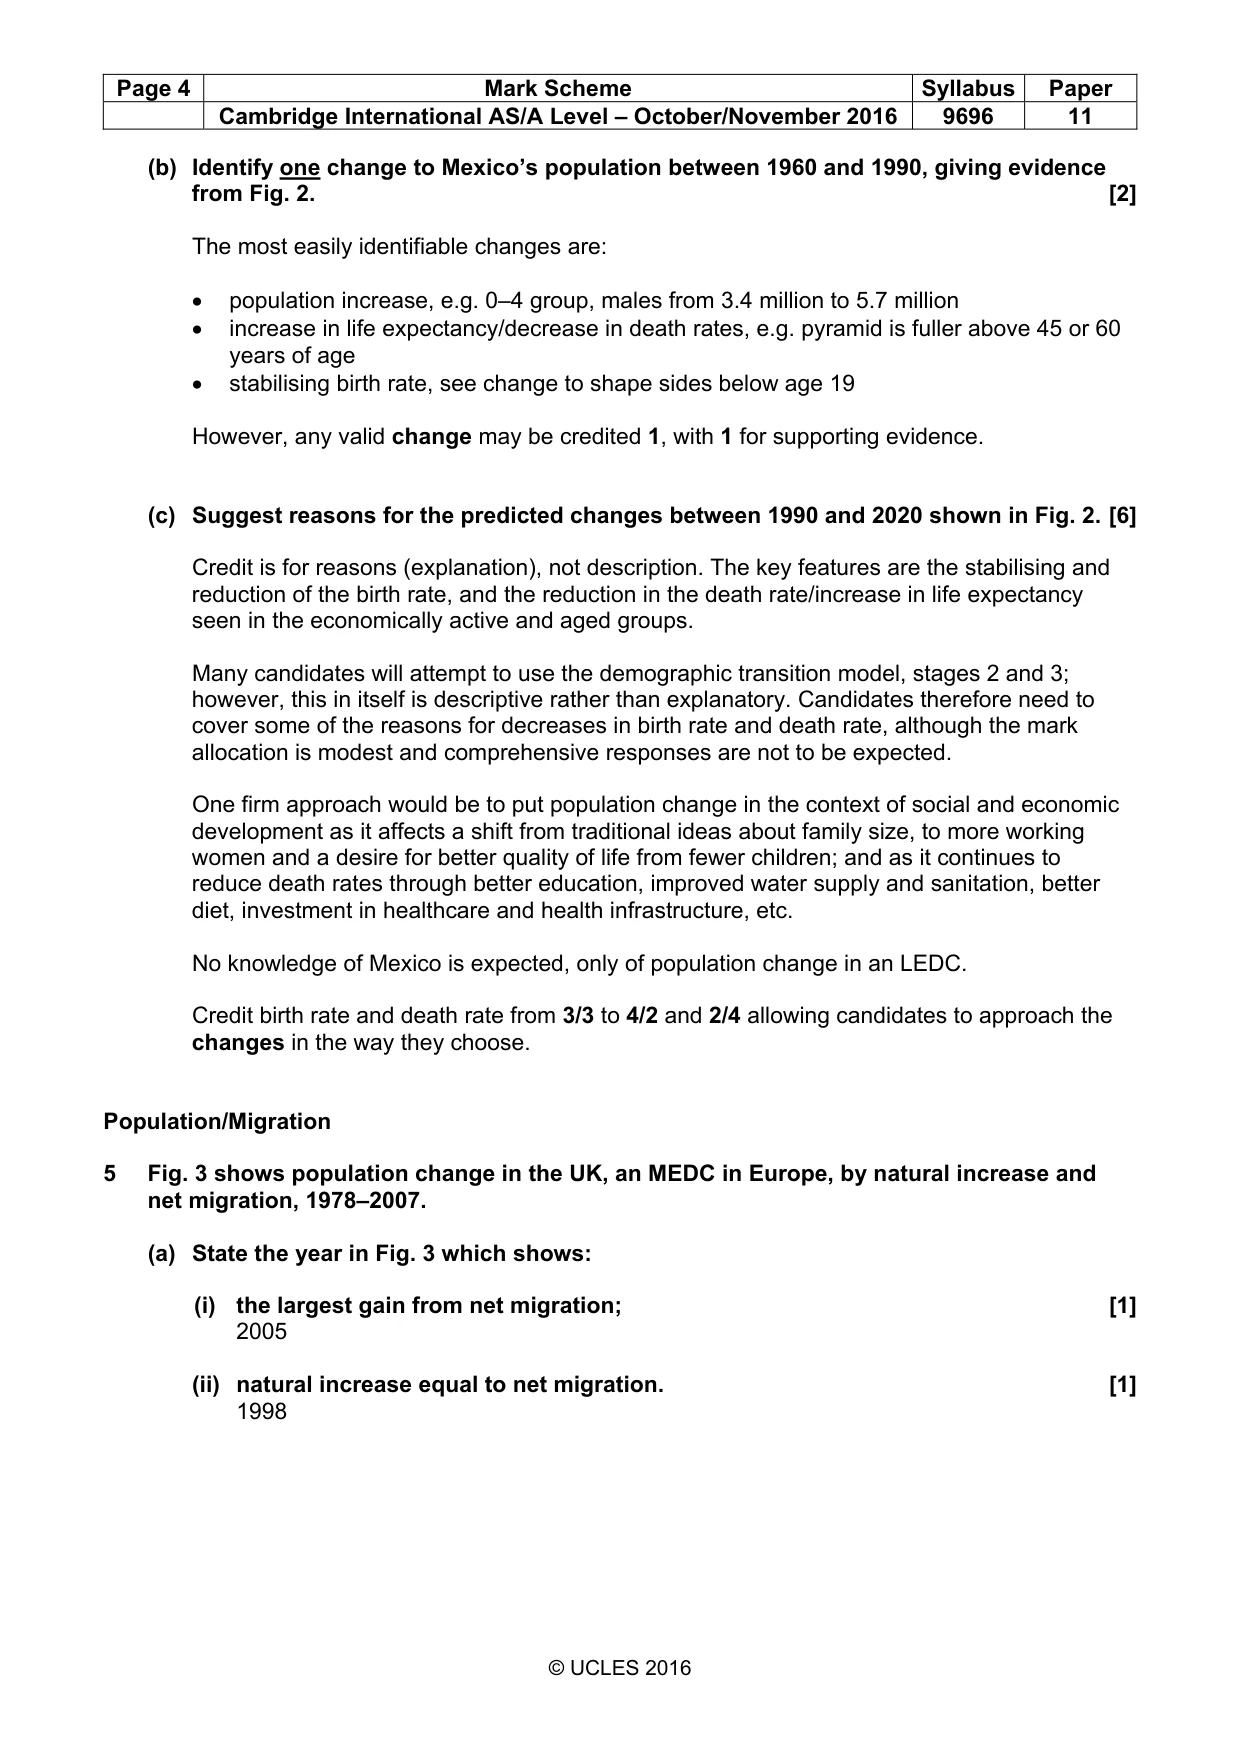
Page 4 Mark Scheme Syllabus Paper Cambridge International AS/A Level – October/November 2016 9696 11 © UCLES 2016 (b) Identify one change to Mexico’s population between 1960 and 1990, giving evidence from Fig. 2. [2] The most easily identifiable changes are: • population increase, e.g. 0–4 group, males from 3.4 million to 5.7 million • increase in life expectancy/decrease in death rates, e.g. pyramid is fuller above 45 or 60 years of age • stabilising birth rate, see change to shape sides below age 19 However, any valid change may be credited 1, with 1 for supporting evidence. (c) Suggest reasons for the predicted changes between 1990 and 2020 shown in Fig. 2. [6] Credit is for reasons (explanation), not description. The key features are the stabilising and reduction of the birth rate, and the reduction in the death rate/increase in life expectancy seen in the economically active and aged groups. Many candidates will attempt to use the demographic transition model, stages 2 and 3; however, this in itself is descriptive rather than explanatory. Candidates therefore need to cover some of the reasons for decreases in birth rate and death rate, although the mark allocation is modest and comprehensive responses are not to be expected. One firm approach would be to put population change in the context of social and economic development as it affects a shift from traditional ideas about family size, to more working women and a desire for better quality of life from fewer children; and as it continues to reduce death rates through better education, improved water supply and sanitation, better diet, investment in healthcare and health infrastructure, etc. No knowledge of Mexico is expected, only of population change in an LEDC. Credit birth rate and death rate from 3/3 to 4/2 and 2/4 allowing candidates to approach the changes in the way they choose. Population/Migration 5 Fig. 3 shows population change in the UK, an MEDC in Europe, by natural increase and net migration, 1978–2007. (a) State the year in Fig. 3 which shows: (i) the largest gain from net migration; [1] 2005 (ii) natural increase equal to net migration. [1] 1998
Mark scheme, page 5
Page 5 Mark Scheme Syllabus Paper Cambridge International AS/A Level – October/November 2016 9696 11 © UCLES 2016 (b) Compare the trends in natural increase and net migration between 1978 and 1990, supporting your response with data from Fig. 3. [3] The trend in natural increase is positive (upward), fluctuating, with a high of approx. 140 000 in 1989, fastest increase 1978 to 1980, whereas the trend in net migration is irregular (up and down, jagged), with modest positive and some large negative changes, e.g. 1980 to 1982 [check on final figure]. Data support may be years and population (thousands). For a descriptive comparison without data support, maximum 2. (c) Outline some of the problems which high levels of immigration can cause in a country. [5] An open question not restricted to an MEDC context, problems may include: • fear amongst nationals about identity, job security, change • stress on provision of housing, work, education, food, welfare, etc. • discrimination / interpersonal violence • loss of social cohesion, racial or religious conflict in communities • economic outflow by remittances • economic burden, e.g. welfare provision (MEDC), caring for refugees • other Credit simple points 1 and developed or illustrated points 2 to the maximum. Population/Migration/Settlement dynamics 6 Fig. 4 shows cities with over 10 million people in 1980 and 2010. (a) Describe the changes in the number, size and location of cities with over 10 million people between 1980 and 2010, supporting your response with data from Fig. 4. [5] number increase from 4 to 21 (over 5 times) (1) size increases, e.g. only Tokyo > 20 million (1980) and > 30 million (2010), one 20 million Delhi (2010); NY, Mexico City and SP all grow, e.g. SP by approx. 8 million people (2) location global/more widespread; increases in existing countries/continents, e.g. to 2 in Japan and 2 in Brazil (2010) from 1 (1980); also in Europe, Middle East, Africa and a strong presence in Asia (2010), especially South Asia (2)
Mark scheme, page 6
Page 6 Mark Scheme Syllabus Paper Cambridge International AS/A Level – October/November 2016 9696 11 © UCLES 2016 (b) Explain the changes you described in (a). [5] An opportunity to deal with the Human Core content holistically, combining reasons which may include: • process of urbanisation • stage of economic development • nature of economy • key role of rural-urban migration • role of international migration • the growth of ‘world cities’ • policy and planning in some countries • other
Mark scheme, page 7
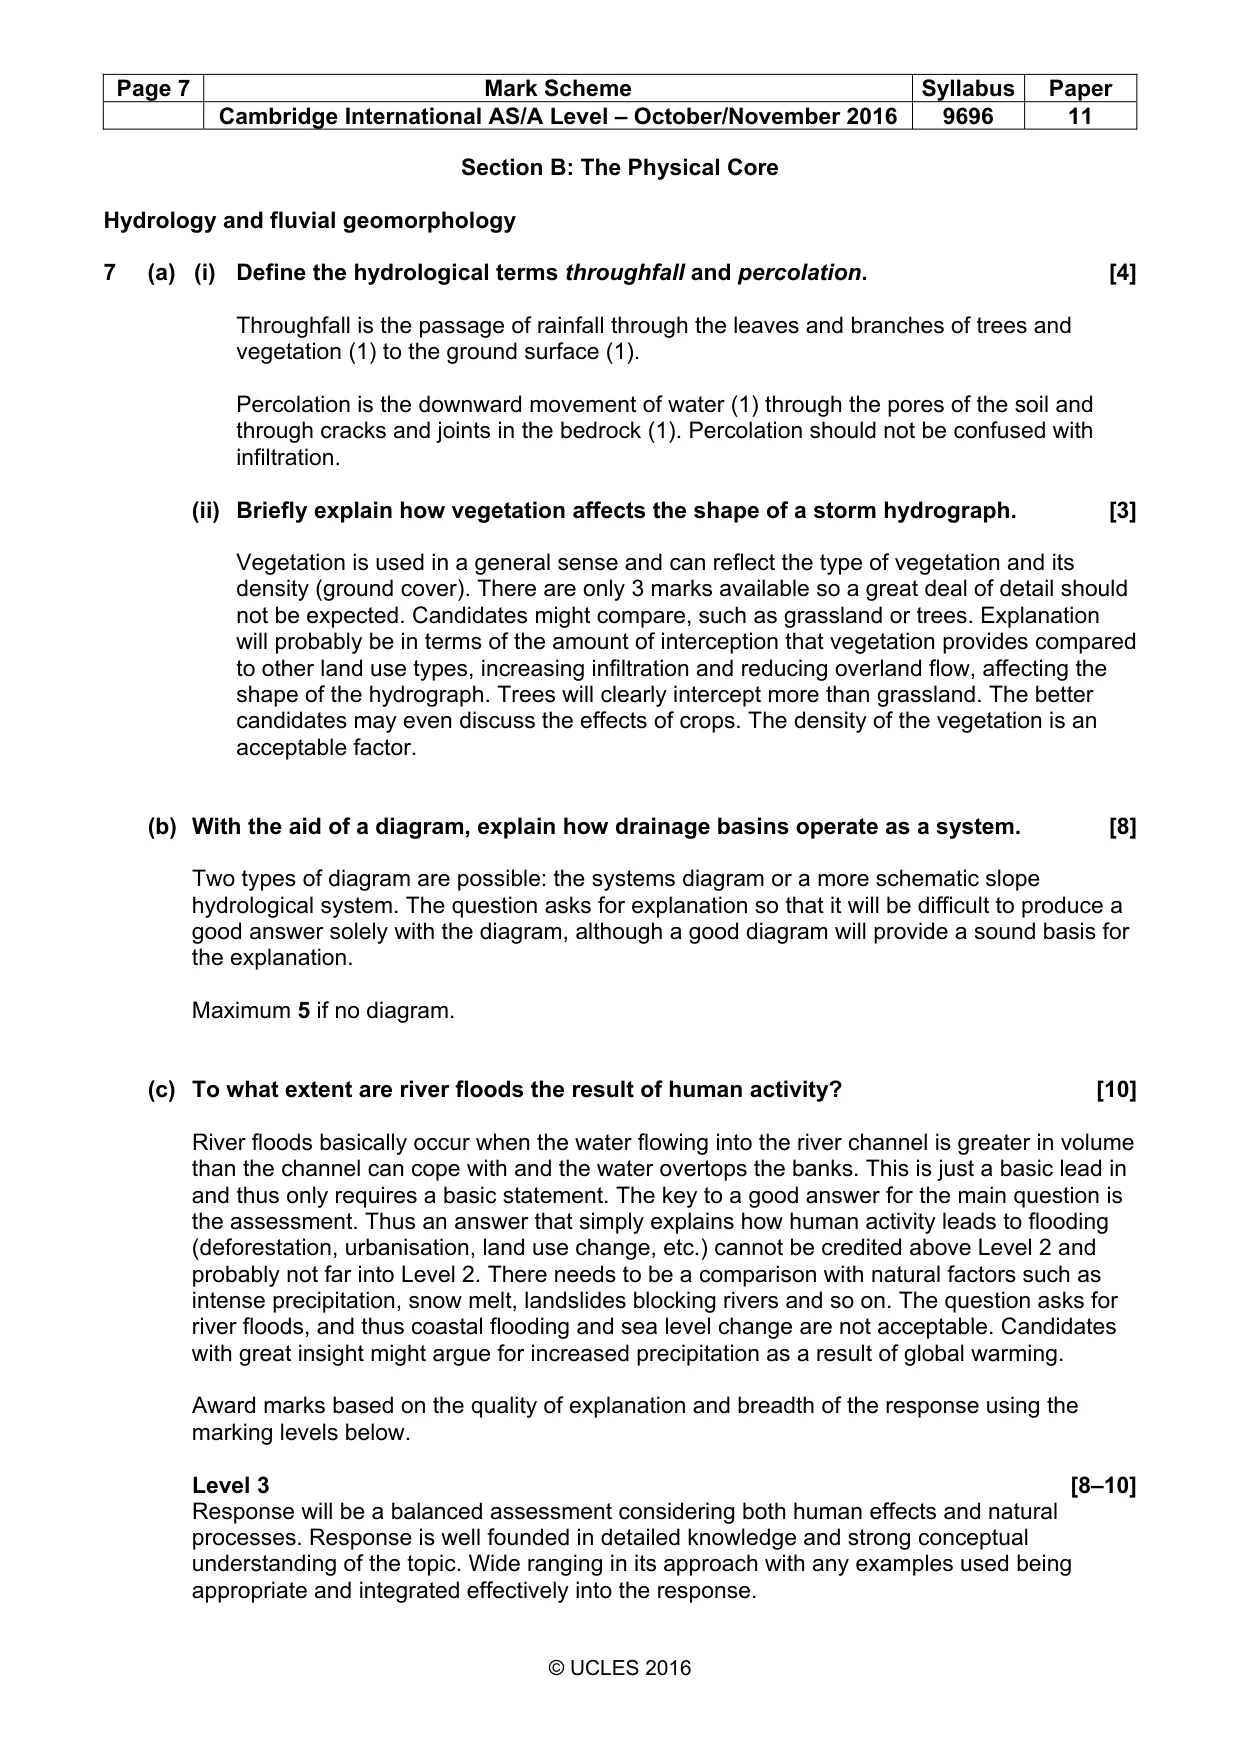
Page 7 Mark Scheme Syllabus Paper Cambridge International AS/A Level – October/November 2016 9696 11 © UCLES 2016 Section B: The Physical Core Hydrology and fluvial geomorphology 7 (a) (i) Define the hydrological terms throughfall and percolation. [4] Throughfall is the passage of rainfall through the leaves and branches of trees and vegetation (1) to the ground surface (1). Percolation is the downward movement of water (1) through the pores of the soil and through cracks and joints in the bedrock (1). Percolation should not be confused with infiltration. (ii) Briefly explain how vegetation affects the shape of a storm hydrograph. [3] Vegetation is used in a general sense and can reflect the type of vegetation and its density (ground cover). There are only 3 marks available so a great deal of detail should not be expected. Candidates might compare, such as grassland or trees. Explanation will probably be in terms of the amount of interception that vegetation provides compared to other land use types, increasing infiltration and reducing overland flow, affecting the shape of the hydrograph. Trees will clearly intercept more than grassland. The better candidates may even discuss the effects of crops. The density of the vegetation is an acceptable factor. (b) With the aid of a diagram, explain how drainage basins operate as a system. [8] Two types of diagram are possible: the systems diagram or a more schematic slope hydrological system. The question asks for explanation so that it will be difficult to produce a good answer solely with the diagram, although a good diagram will provide a sound basis for the explanation. Maximum 5 if no diagram. (c) To what extent are river floods the result of human activity? [10] River floods basically occur when the water flowing into the river channel is greater in volume than the channel can cope with and the water overtops the banks. This is just a basic lead in and thus only requires a basic statement. The key to a good answer for the main question is the assessment. Thus an answer that simply explains how human activity leads to flooding (deforestation, urbanisation, land use change, etc.) cannot be credited above Level 2 and probably not far into Level 2. There needs to be a comparison with natural factors such as intense precipitation, snow melt, landslides blocking rivers and so on. The question asks for river floods, and thus coastal flooding and sea level change are not acceptable. Candidates with great insight might argue for increased precipitation as a result of global warming. Award marks based on the quality of explanation and breadth of the response using the marking levels below. Level 3 [8–10] Response will be a balanced assessment considering both human effects and natural processes. Response is well founded in detailed knowledge and strong conceptual understanding of the topic. Wide ranging in its approach with any examples used being appropriate and integrated effectively into the response.
Mark scheme, page 8
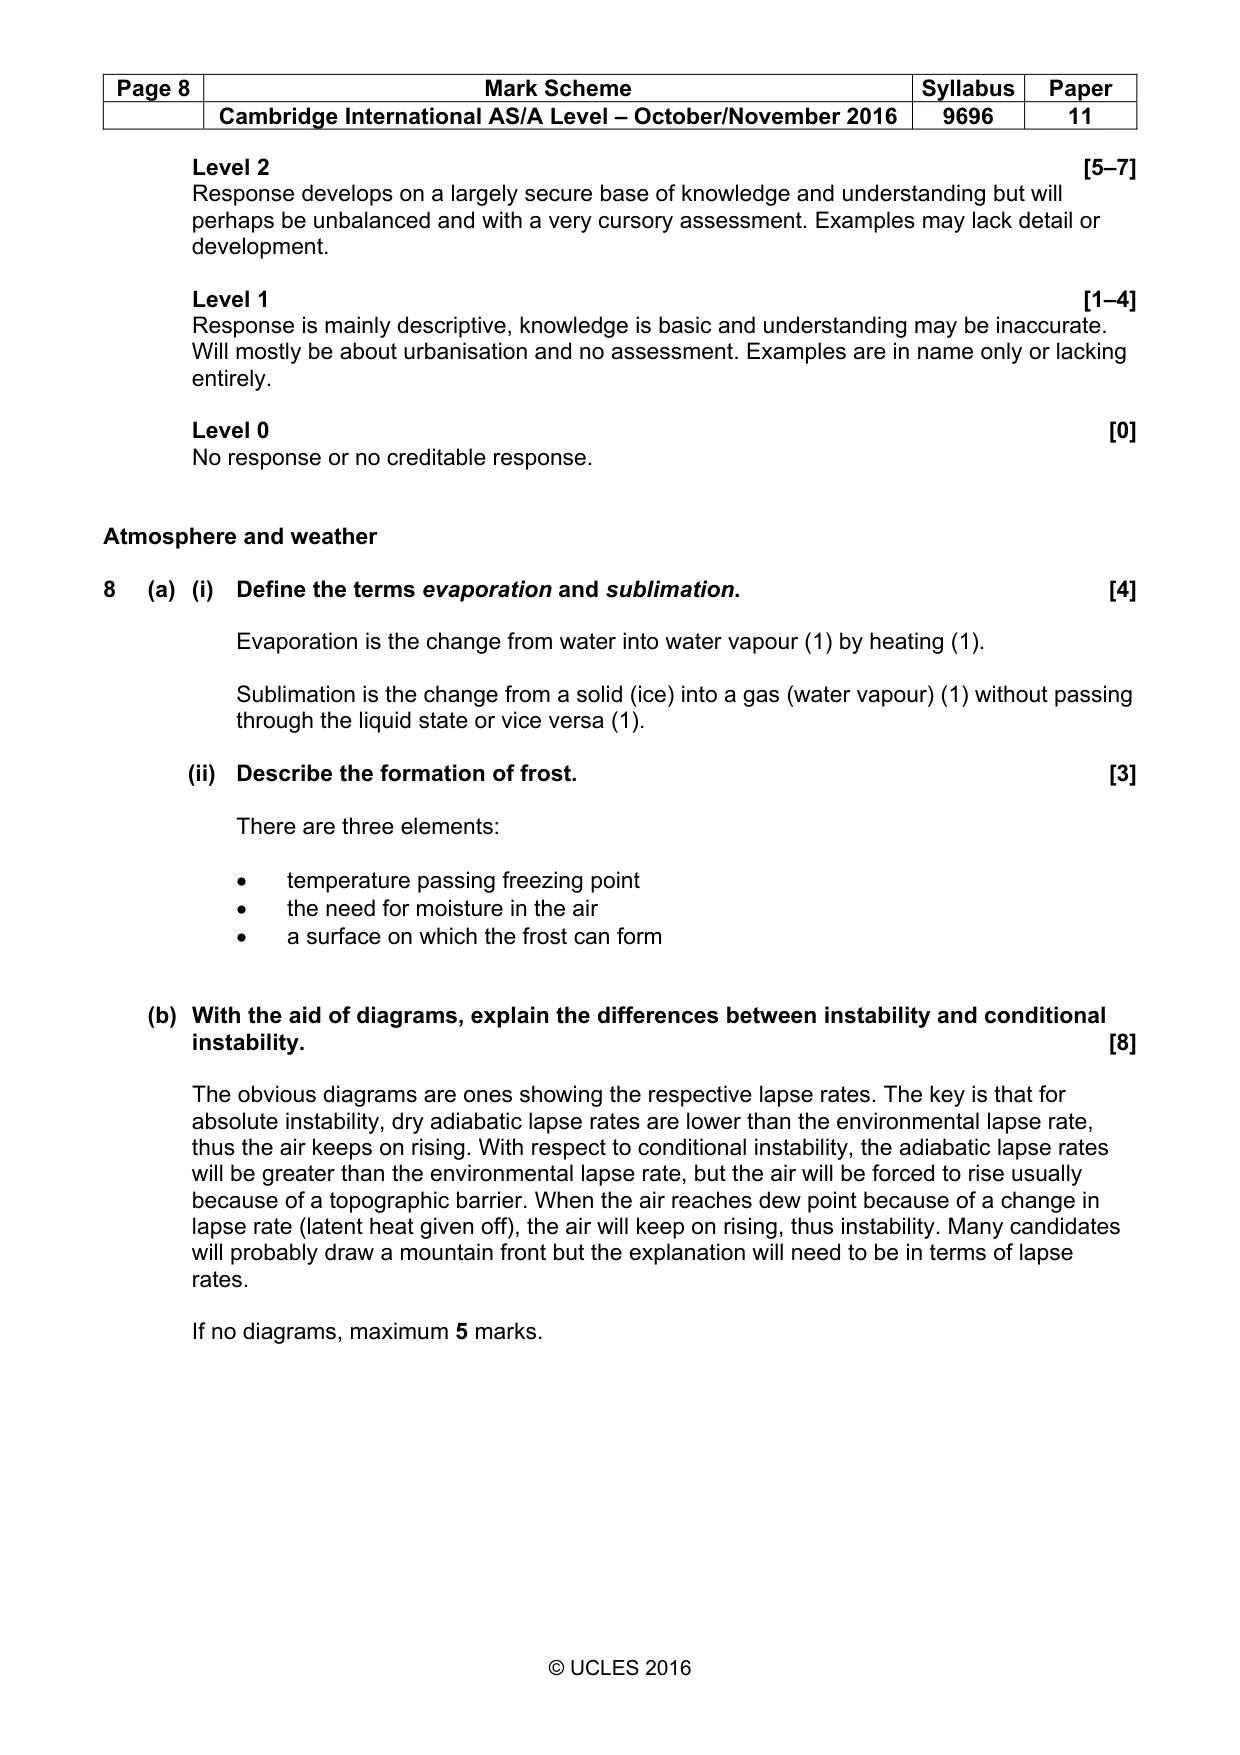
Page 8 Mark Scheme Syllabus Paper Cambridge International AS/A Level – October/November 2016 9696 11 © UCLES 2016 Level 2 [5–7] Response develops on a largely secure base of knowledge and understanding but will perhaps be unbalanced and with a very cursory assessment. Examples may lack detail or development. Level 1 [1–4] Response is mainly descriptive, knowledge is basic and understanding may be inaccurate. Will mostly be about urbanisation and no assessment. Examples are in name only or lacking entirely. Level 0 [0] No response or no creditable response. Atmosphere and weather 8 (a) (i) Define the terms evaporation and sublimation. [4] Evaporation is the change from water into water vapour (1) by heating (1). Sublimation is the change from a solid (ice) into a gas (water vapour) (1) without passing through the liquid state or vice versa (1). (ii) Describe the formation of frost. [3] There are three elements: • temperature passing freezing point • the need for moisture in the air • a surface on which the frost can form (b) With the aid of diagrams, explain the differences between instability and conditional instability. [8] The obvious diagrams are ones showing the respective lapse rates. The key is that for absolute instability, dry adiabatic lapse rates are lower than the environmental lapse rate, thus the air keeps on rising. With respect to conditional instability, the adiabatic lapse rates will be greater than the environmental lapse rate, but the air will be forced to rise usually because of a topographic barrier. When the air reaches dew point because of a change in lapse rate (latent heat given off), the air will keep on rising, thus instability. Many candidates will probably draw a mountain front but the explanation will need to be in terms of lapse rates. If no diagrams, maximum 5 marks.
Mark scheme, page 9
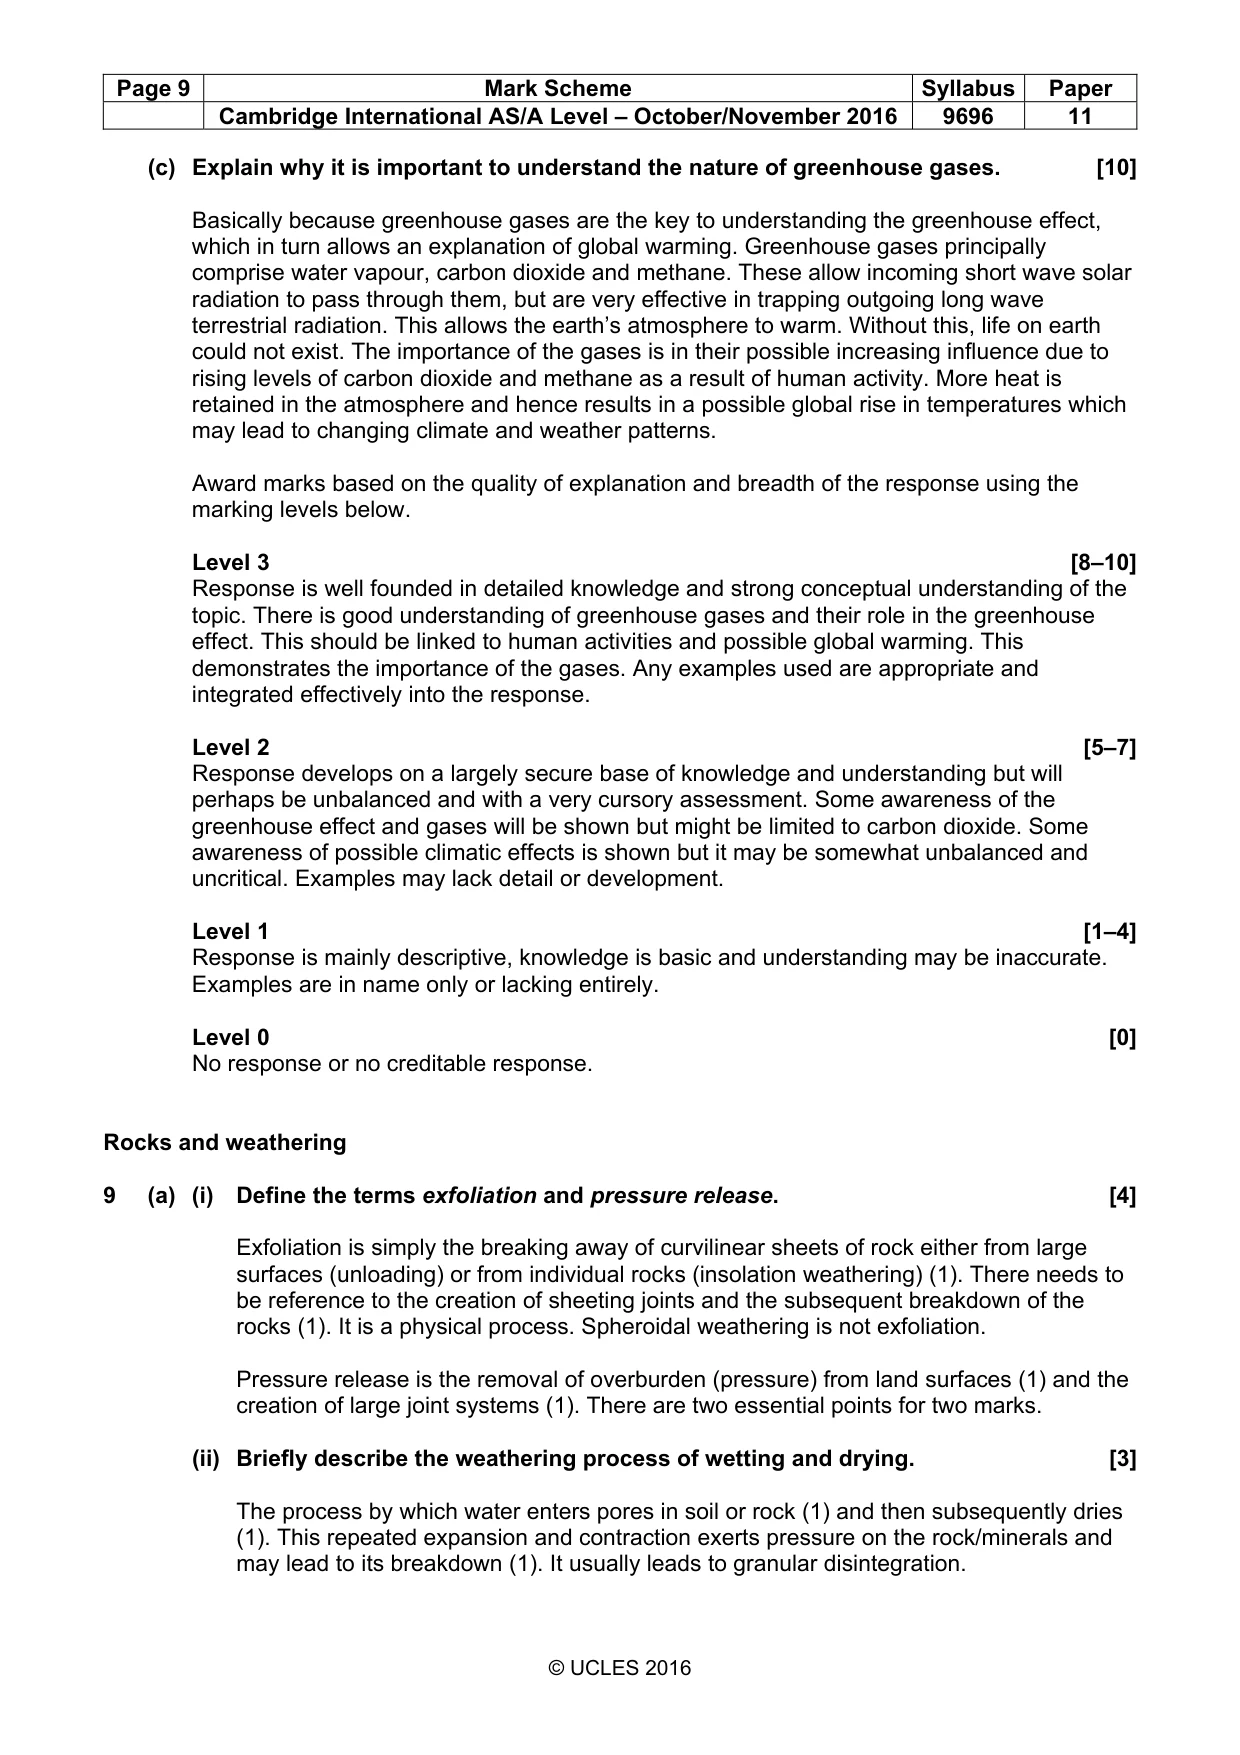
Page 9 Mark Scheme Syllabus Paper Cambridge International AS/A Level – October/November 2016 9696 11 © UCLES 2016 (c) Explain why it is important to understand the nature of greenhouse gases. [10] Basically because greenhouse gases are the key to understanding the greenhouse effect, which in turn allows an explanation of global warming. Greenhouse gases principally comprise water vapour, carbon dioxide and methane. These allow incoming short wave solar radiation to pass through them, but are very effective in trapping outgoing long wave terrestrial radiation. This allows the earth’s atmosphere to warm. Without this, life on earth could not exist. The importance of the gases is in their possible increasing influence due to rising levels of carbon dioxide and methane as a result of human activity. More heat is retained in the atmosphere and hence results in a possible global rise in temperatures which may lead to changing climate and weather patterns. Award marks based on the quality of explanation and breadth of the response using the marking levels below. Level 3 [8–10] Response is well founded in detailed knowledge and strong conceptual understanding of the topic. There is good understanding of greenhouse gases and their role in the greenhouse effect. This should be linked to human activities and possible global warming. This demonstrates the importance of the gases. Any examples used are appropriate and integrated effectively into the response. Level 2 [5–7] Response develops on a largely secure base of knowledge and understanding but will perhaps be unbalanced and with a very cursory assessment. Some awareness of the greenhouse effect and gases will be shown but might be limited to carbon dioxide. Some awareness of possible climatic effects is shown but it may be somewhat unbalanced and uncritical. Examples may lack detail or development. Level 1 [1–4] Response is mainly descriptive, knowledge is basic and understanding may be inaccurate. Examples are in name only or lacking entirely. Level 0 [0] No response or no creditable response. Rocks and weathering 9 (a) (i) Define the terms exfoliation and pressure release. [4] Exfoliation is simply the breaking away of curvilinear sheets of rock either from large surfaces (unloading) or from individual rocks (insolation weathering) (1). There needs to be reference to the creation of sheeting joints and the subsequent breakdown of the rocks (1). It is a physical process. Spheroidal weathering is not exfoliation. Pressure release is the removal of overburden (pressure) from land surfaces (1) and the creation of large joint systems (1). There are two essential points for two marks. (ii) Briefly describe the weathering process of wetting and drying. [3] The process by which water enters pores in soil or rock (1) and then subsequently dries (1). This repeated expansion and contraction exerts pressure on the rock/minerals and may lead to its breakdown (1). It usually leads to granular disintegration.
Mark scheme, page 10
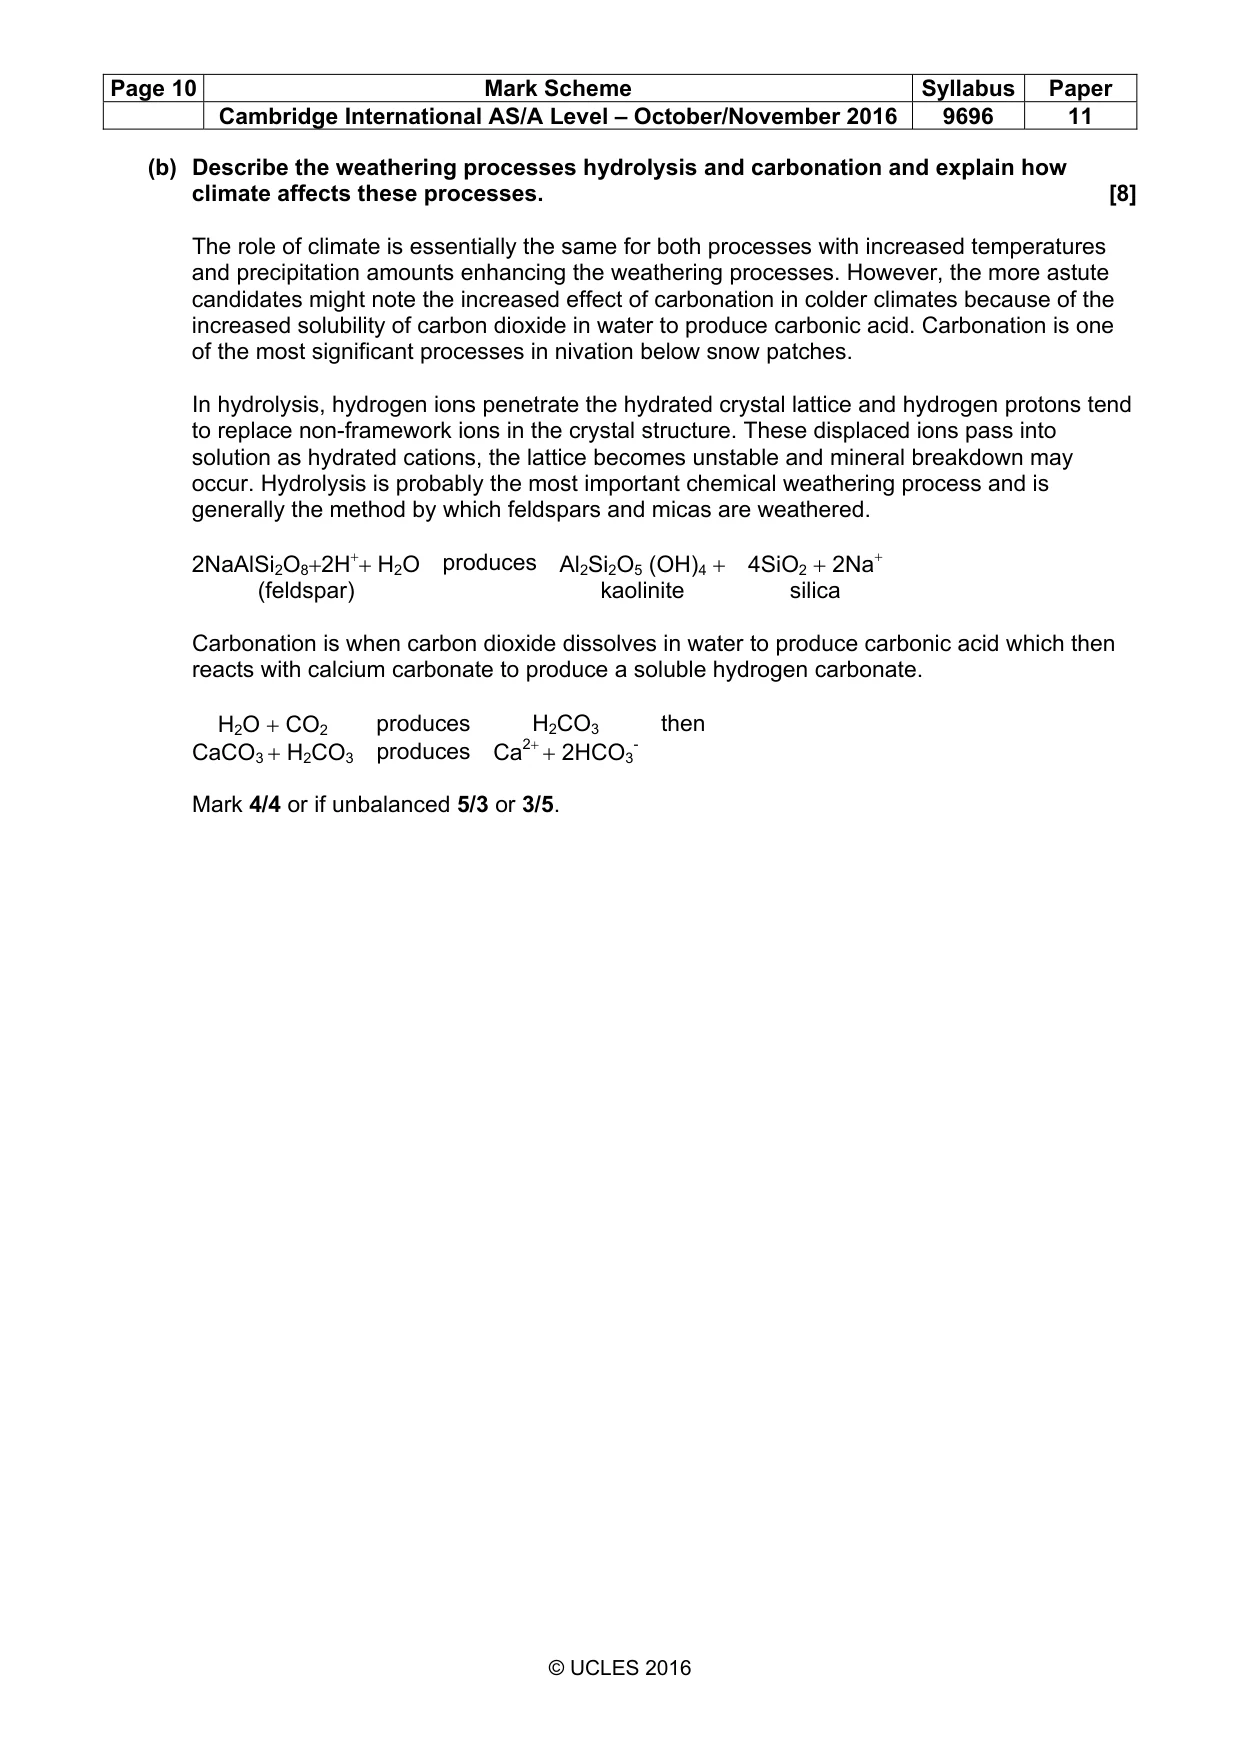
Page 10 Mark Scheme Syllabus Paper Cambridge International AS/A Level – October/November 2016 9696 11 © UCLES 2016 (b) Describe the weathering processes hydrolysis and carbonation and explain how climate affects these processes. [8] The role of climate is essentially the same for both processes with increased temperatures and precipitation amounts enhancing the weathering processes. However, the more astute candidates might note the increased effect of carbonation in colder climates because of the increased solubility of carbon dioxide in water to produce carbonic acid. Carbonation is one of the most significant processes in nivation below snow patches. In hydrolysis, hydrogen ions penetrate the hydrated crystal lattice and hydrogen protons tend to replace non-framework ions in the crystal structure. These displaced ions pass into solution as hydrated cations, the lattice becomes unstable and mineral breakdown may occur. Hydrolysis is probably the most important chemical weathering process and is generally the method by which feldspars and micas are weathered. 2NaAlSi2O8+2H++ H2O produces Al2Si2O5 (OH)4 + 4SiO2 + 2Na+ (feldspar) kaolinite silica Carbonation is when carbon dioxide dissolves in water to produce carbonic acid which then reacts with calcium carbonate to produce a soluble hydrogen carbonate. H2O + CO2 produces H2CO3 then CaCO3 + H2CO3 produces Ca2+ + 2HCO3 - Mark 4/4 or if unbalanced 5/3 or 3/5.
Mark scheme, page 11
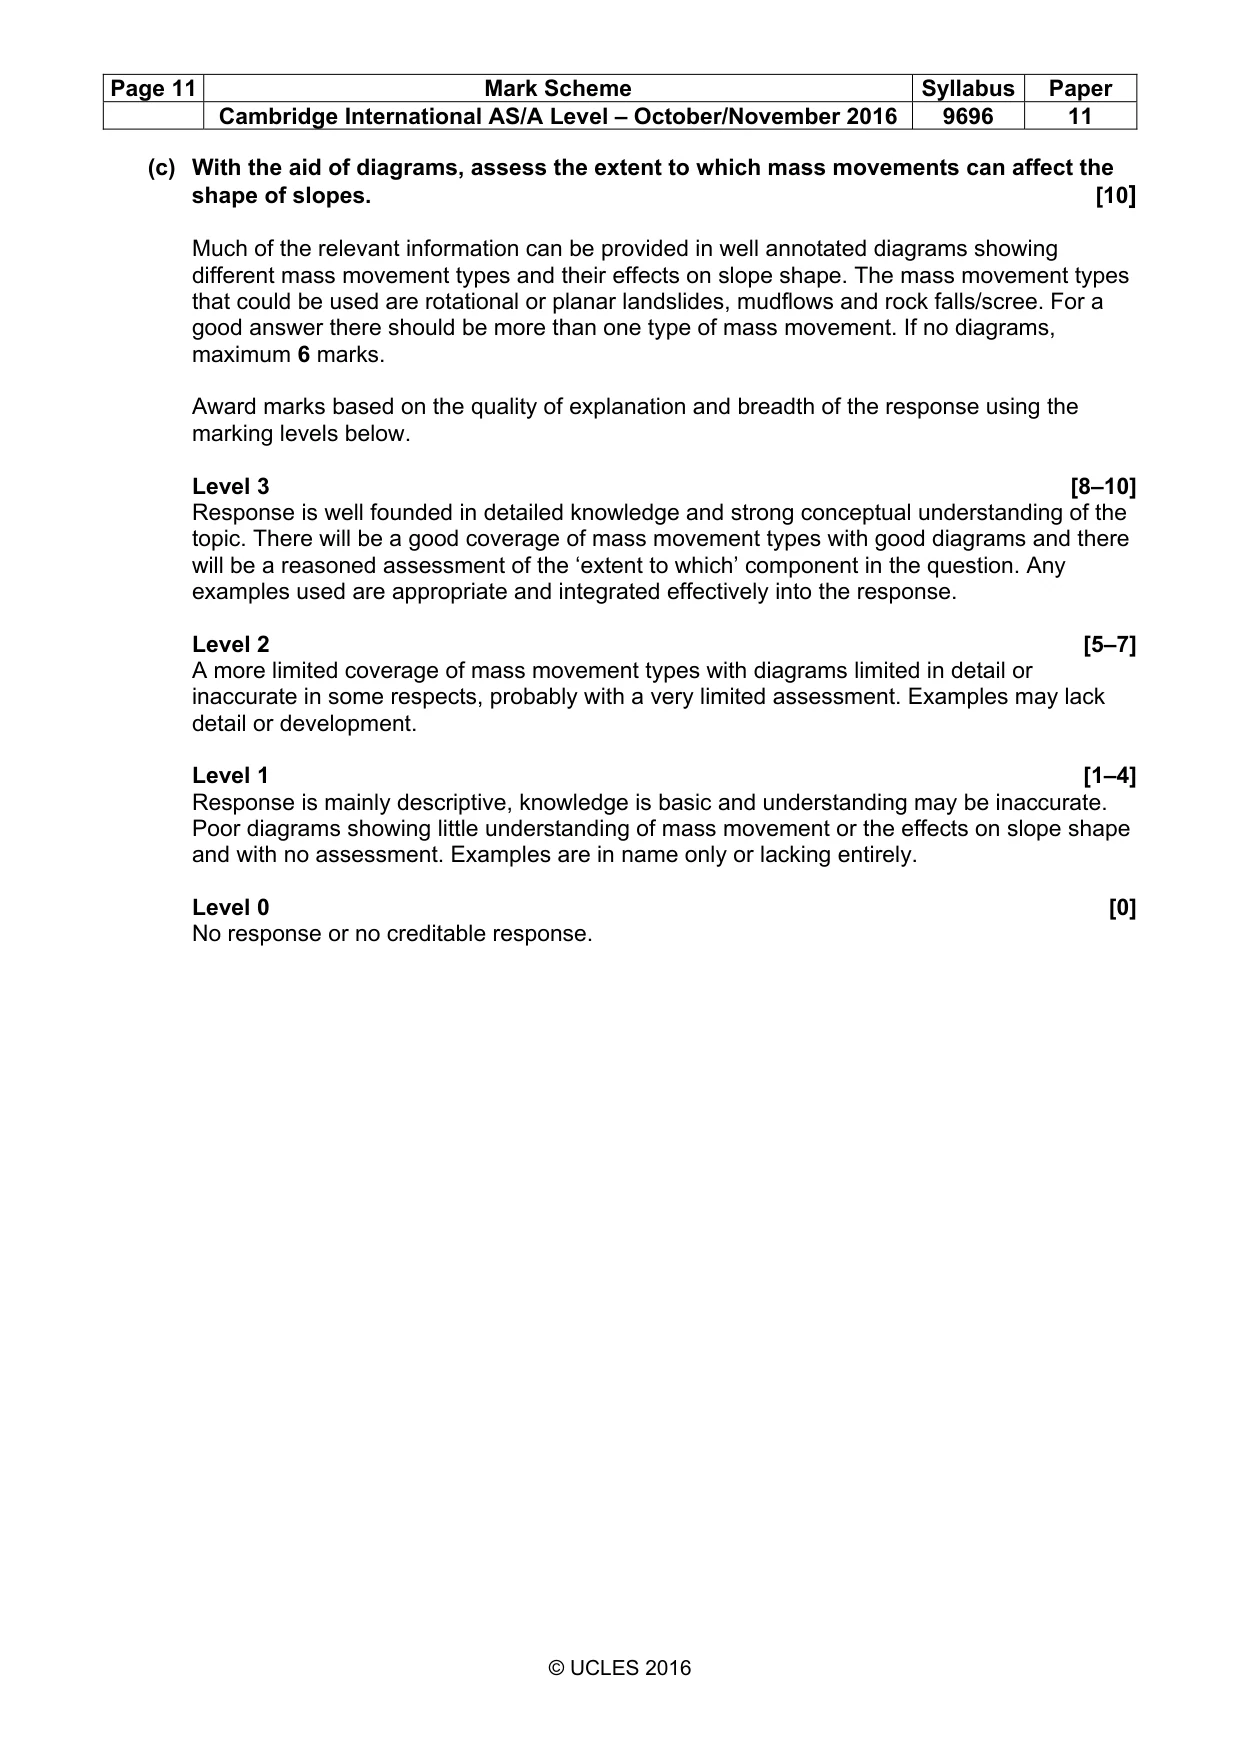
Page 11 Mark Scheme Syllabus Paper Cambridge International AS/A Level – October/November 2016 9696 11 © UCLES 2016 (c) With the aid of diagrams, assess the extent to which mass movements can affect the shape of slopes. [10] Much of the relevant information can be provided in well annotated diagrams showing different mass movement types and their effects on slope shape. The mass movement types that could be used are rotational or planar landslides, mudflows and rock falls/scree. For a good answer there should be more than one type of mass movement. If no diagrams, maximum 6 marks. Award marks based on the quality of explanation and breadth of the response using the marking levels below. Level 3 [8–10] Response is well founded in detailed knowledge and strong conceptual understanding of the topic. There will be a good coverage of mass movement types with good diagrams and there will be a reasoned assessment of the ‘extent to which’ component in the question. Any examples used are appropriate and integrated effectively into the response. Level 2 [5–7] A more limited coverage of mass movement types with diagrams limited in detail or inaccurate in some respects, probably with a very limited assessment. Examples may lack detail or development. Level 1 [1–4] Response is mainly descriptive, knowledge is basic and understanding may be inaccurate. Poor diagrams showing little understanding of mass movement or the effects on slope shape and with no assessment. Examples are in name only or lacking entirely. Level 0 [0] No response or no creditable response.
Mark scheme, page 12
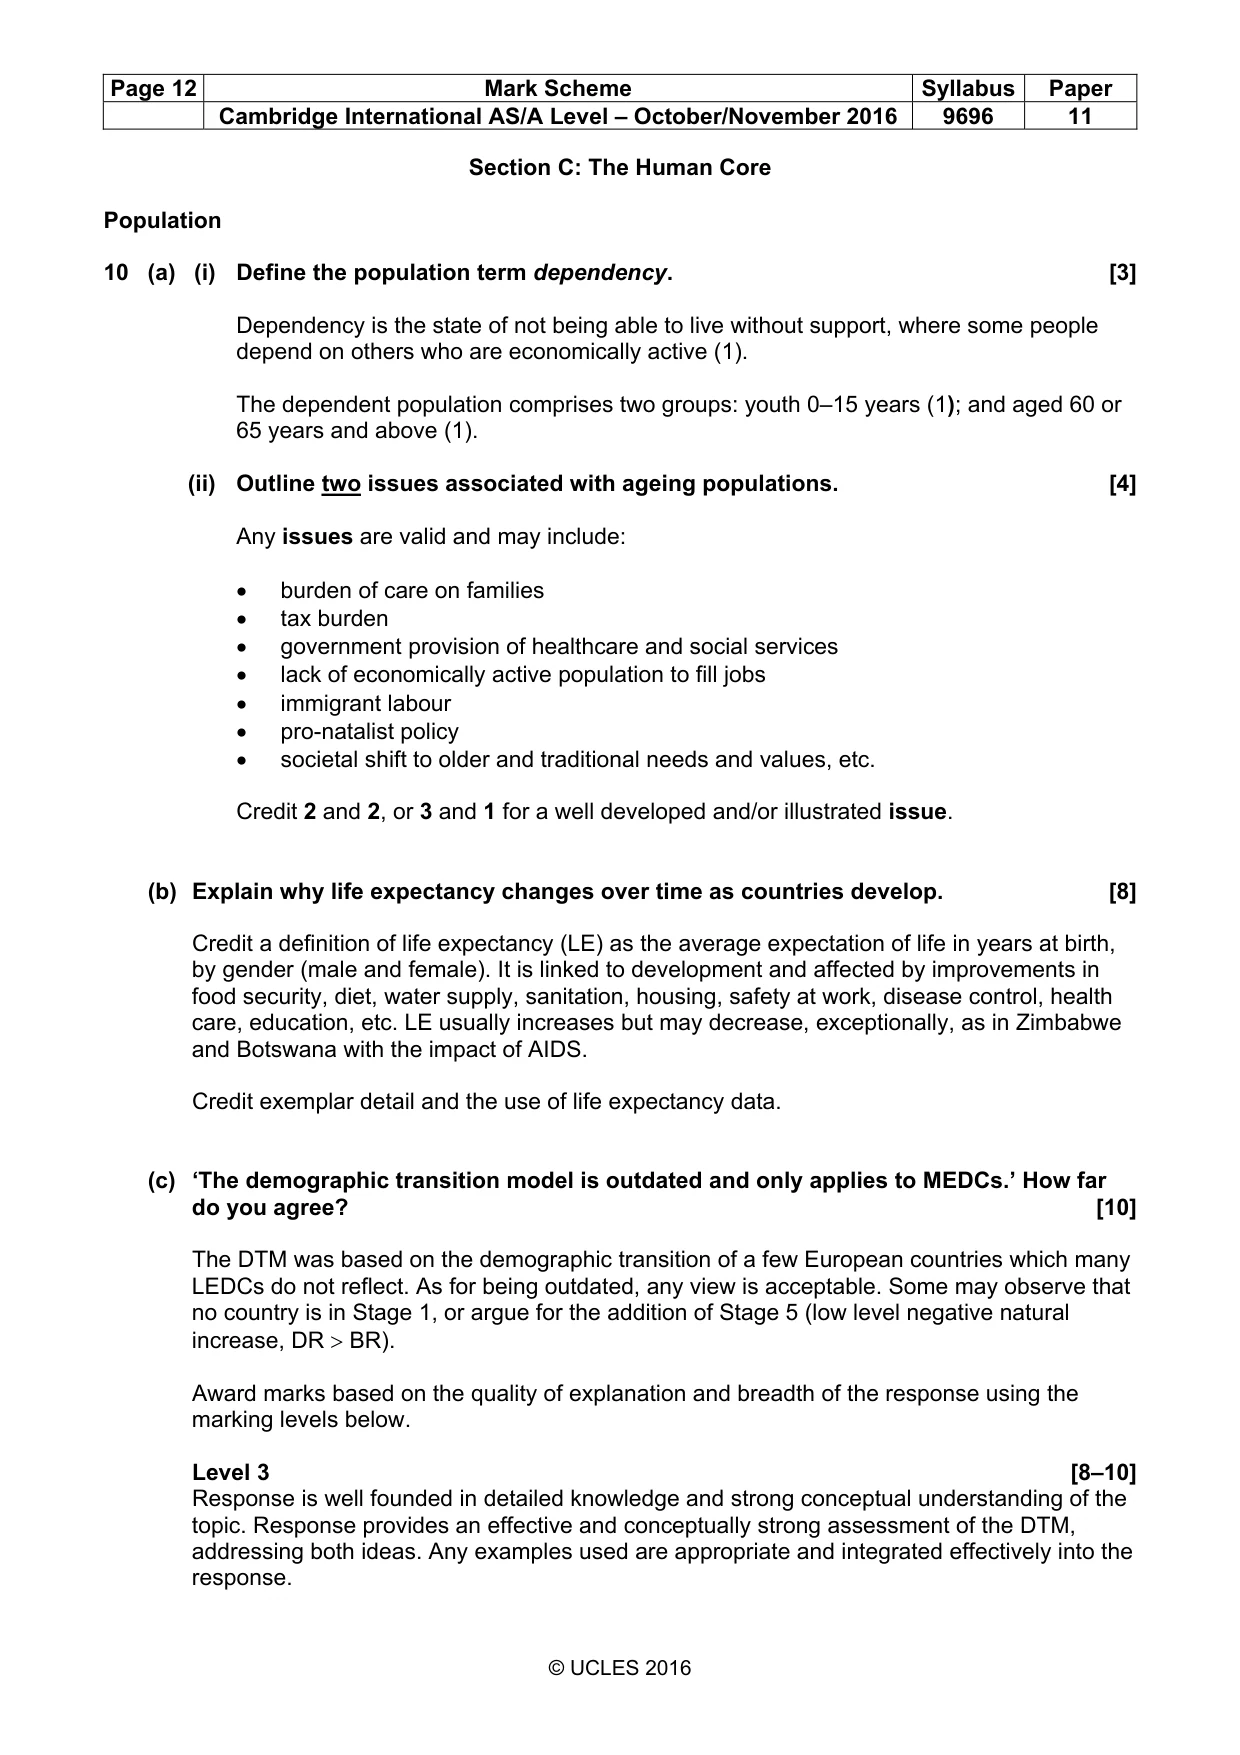
Page 12 Mark Scheme Syllabus Paper Cambridge International AS/A Level – October/November 2016 9696 11 © UCLES 2016 Section C: The Human Core Population 10 (a) (i) Define the population term dependency. [3] Dependency is the state of not being able to live without support, where some people depend on others who are economically active (1). The dependent population comprises two groups: youth 0–15 years (1); and aged 60 or 65 years and above (1). (ii) Outline two issues associated with ageing populations. [4] Any issues are valid and may include: • burden of care on families • tax burden • government provision of healthcare and social services • lack of economically active population to fill jobs • immigrant labour • pro-natalist policy • societal shift to older and traditional needs and values, etc. Credit 2 and 2, or 3 and 1 for a well developed and/or illustrated issue. (b) Explain why life expectancy changes over time as countries develop. [8] Credit a definition of life expectancy (LE) as the average expectation of life in years at birth, by gender (male and female). It is linked to development and affected by improvements in food security, diet, water supply, sanitation, housing, safety at work, disease control, health care, education, etc. LE usually increases but may decrease, exceptionally, as in Zimbabwe and Botswana with the impact of AIDS. Credit exemplar detail and the use of life expectancy data. (c) ‘The demographic transition model is outdated and only applies to MEDCs.’ How far do you agree? [10] The DTM was based on the demographic transition of a few European countries which many LEDCs do not reflect. As for being outdated, any view is acceptable. Some may observe that no country is in Stage 1, or argue for the addition of Stage 5 (low level negative natural increase, DR > BR). Award marks based on the quality of explanation and breadth of the response using the marking levels below. Level 3 [8–10] Response is well founded in detailed knowledge and strong conceptual understanding of the topic. Response provides an effective and conceptually strong assessment of the DTM, addressing both ideas. Any examples used are appropriate and integrated effectively into the response.
Mark scheme, page 13
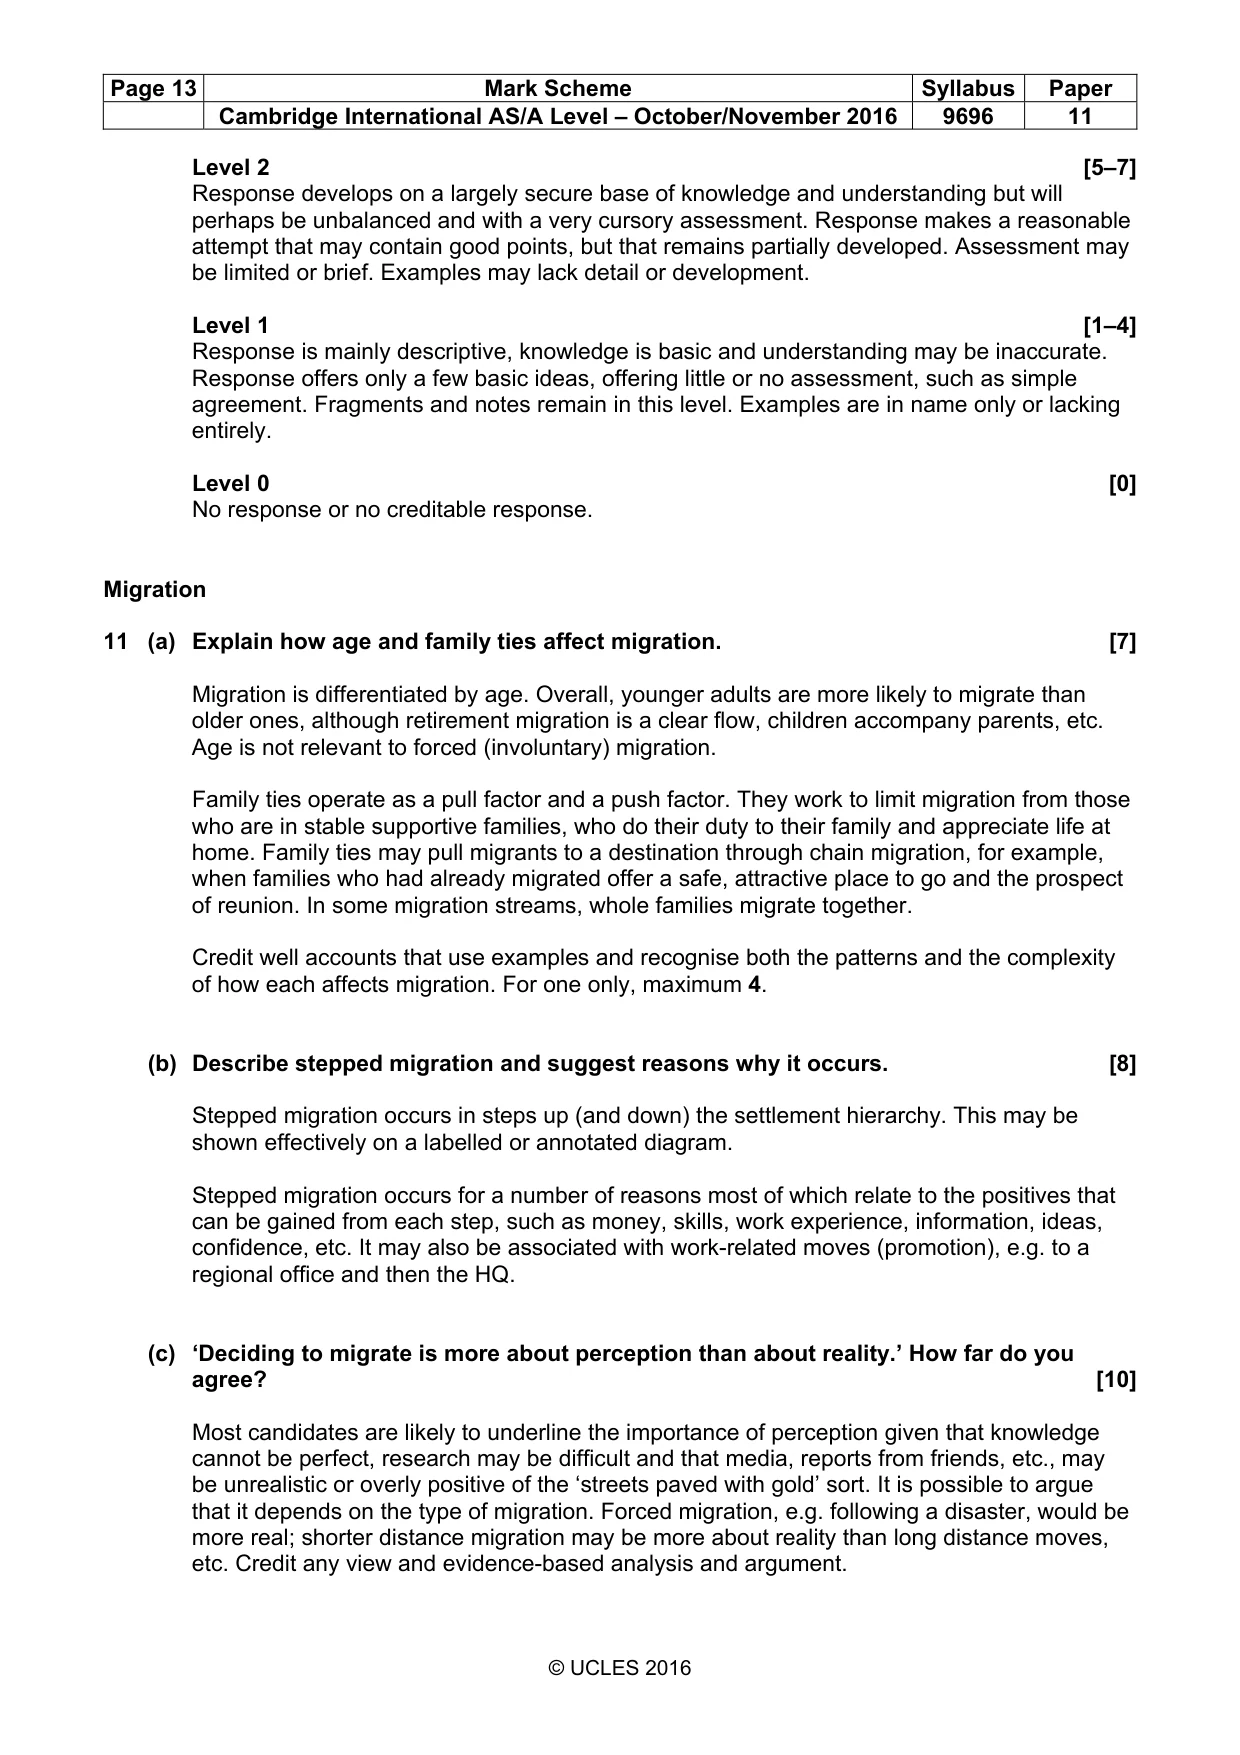
Page 13 Mark Scheme Syllabus Paper Cambridge International AS/A Level – October/November 2016 9696 11 © UCLES 2016 Level 2 [5–7] Response develops on a largely secure base of knowledge and understanding but will perhaps be unbalanced and with a very cursory assessment. Response makes a reasonable attempt that may contain good points, but that remains partially developed. Assessment may be limited or brief. Examples may lack detail or development. Level 1 [1–4] Response is mainly descriptive, knowledge is basic and understanding may be inaccurate. Response offers only a few basic ideas, offering little or no assessment, such as simple agreement. Fragments and notes remain in this level. Examples are in name only or lacking entirely. Level 0 [0] No response or no creditable response. Migration 11 (a) Explain how age and family ties affect migration. [7] Migration is differentiated by age. Overall, younger adults are more likely to migrate than older ones, although retirement migration is a clear flow, children accompany parents, etc. Age is not relevant to forced (involuntary) migration. Family ties operate as a pull factor and a push factor. They work to limit migration from those who are in stable supportive families, who do their duty to their family and appreciate life at home. Family ties may pull migrants to a destination through chain migration, for example, when families who had already migrated offer a safe, attractive place to go and the prospect of reunion. In some migration streams, whole families migrate together. Credit well accounts that use examples and recognise both the patterns and the complexity of how each affects migration. For one only, maximum 4. (b) Describe stepped migration and suggest reasons why it occurs. [8] Stepped migration occurs in steps up (and down) the settlement hierarchy. This may be shown effectively on a labelled or annotated diagram. Stepped migration occurs for a number of reasons most of which relate to the positives that can be gained from each step, such as money, skills, work experience, information, ideas, confidence, etc. It may also be associated with work-related moves (promotion), e.g. to a regional office and then the HQ. (c) ‘Deciding to migrate is more about perception than about reality.’ How far do you agree? [10] Most candidates are likely to underline the importance of perception given that knowledge cannot be perfect, research may be difficult and that media, reports from friends, etc., may be unrealistic or overly positive of the ‘streets paved with gold’ sort. It is possible to argue that it depends on the type of migration. Forced migration, e.g. following a disaster, would be more real; shorter distance migration may be more about reality than long distance moves, etc. Credit any view and evidence-based analysis and argument.
Mark scheme, page 14
Page 14 Mark Scheme Syllabus Paper Cambridge International AS/A Level – October/November 2016 9696 11 © UCLES 2016 Award marks based on the quality of explanation and breadth of the response using the marking levels below. Level 3 [8–10] Response is well founded in detailed knowledge and strong conceptual understanding of the topic. Response provides a good assessment of the roles of perception and of reality in migration decision-making. It shows strong conceptual understanding and uses one or more examples effectively. Level 2 [5–7] Response develops on a largely secure base of knowledge and understanding but will perhaps be unbalanced and with a very cursory assessment. Response makes a sound comment about migration decision-making with some good content, but one which remains limited in examples, scope and/or assessment. Level 1 [1–4] Response is mainly descriptive, knowledge is basic and understanding may be inaccurate. Response offers only a few basic ideas, offering little or no assessment, such as simple agreement. Fragments and notes remain in this level. Examples are in name only or lacking entirely. Level 0 [0] No response or no creditable response. Settlement dynamics 12 (a) (i) Give the meaning of the term functional zonation in relation to urban land-use. [2] Functional zonation is the dominance (1) of one function or land-use over others spatially so that observable clusters or associations exist in different areas of towns and cities, e.g. offices, university quarter (1). (ii) Draw and label a typical bid-rent diagram for an urban area. [5] Credit features: vertical axis (rent) (1), horizontal axis (distance) (1), and three land-uses: CBD, manufacturing and residential land-use (2). Reserve (1) for correct verticals from intersects to give zone.
Mark scheme, page 15
Page 15 Mark Scheme Syllabus Paper Cambridge International AS/A Level – October/November 2016 9696 11 © UCLES 2016 (b) With the help of one or more examples, explain why residential segregation occurs within urban areas. [8] The diagram for (a)(ii) defines an outer residential zone, within which segregation occurs on the basis of: • income / ability to pay • status • planning decisions • history • race / ethnicity • provision of group-specific services, e.g. place of worship • operation of the housing market • ‘gatekeepers’ / vested interests • other Residential segregation could also occur in inner areas of cities. (c) Assess the advantages and disadvantages of a central urban location for retailing (shops and stores). [10] Advantages may include profitability, pedestrian numbers, accessibility, passing trade, prestige, comparison shopping, etc. Disadvantages may include high rents, lack of space for expansion, crime, congestion for deliveries, poor access for car users, etc. Award marks based on the quality of explanation and breadth of the response using the marking levels below. Level 3 [8–10] Response is well founded in detailed knowledge and strong conceptual understanding of the topic. Response provides a good balanced assessment of advantages and disadvantages with a realistic perspective, argument and the integration of detailed exemplar content. It shows strong conceptual understanding and uses one or more examples effectively. Level 2 [5–7] Response develops on a largely secure base of knowledge and understanding but will perhaps be unbalanced and with a very cursory assessment. Response may lack development or detail or is unbalanced in advantages/disadvantages. Examples may lack detail or development. Level 1 [1–4] Response is mainly descriptive, knowledge is basic and understanding may be inaccurate. Response offers only a few basic ideas, offering little or no assessment. Response makes one or more basic points, which may be descriptive rather than evaluative or lack a focus on the question set. Notes and fragments remain in this level. Examples are in name only or lacking entirely. Level 0 [0] No response or no creditable response.
What you needed in this session
Cambridge’s own grade thresholds for 2016 Oct/Nov, Paper 1 · Variant 1. A higher threshold means an easier paper — the bar moves with how the cohort did.