Cambridge A Level Geography 9696 — 2025 Oct/Nov Paper 1 · Variant 3
9696/13/O/N/25 · 60 marks · ≈68 min
The question paper and its mark scheme, free to read here and free to download. This is Cambridge’s own paper, exactly as it was sat.
Question paper4 pages

Mark scheme19 pages
Answers below. Sit the paper first if you are practising.


Paper as text
Question paper, page 1
This document has 4 pages. Any blank pages are indicated. [Turn over Cambridge International AS & A Level * 9 7 7 2 0 1 8 4 6 6 * DC (WW) 351357/2 © UCLES 2025 GEOGRAPHY 9696/13 Paper 1 Core Physical Geography October/November 2025 1 hour 30 minutes You must answer on the enclosed answer booklet. You will need: Answer booklet (enclosed) Insert (enclosed) INSTRUCTIONS ● Answer four questions in total: Section A: answer all questions. Section B: answer one question. ● Follow the instructions on the front cover of the answer booklet. If you need additional answer paper, ask the invigilator for a continuation booklet. ● Sketch maps and diagrams should be drawn whenever they serve to illustrate an answer. INFORMATION ● The total mark for this paper is 60. ● The number of marks for each question or part question is shown in brackets [ ]. ● The insert contains all the resources referred to in the questions.
Question paper, page 2
2 9696/13/O/N/25 © UCLES 2025 Section A Answer all questions in this section. All questions are worth 10 marks. Hydrology and fluvial geomorphology 1 Fig. 1.1 shows river discharge and flood recurrence intervals for River Logone, Chad, Africa, 1 January 2021 to 1 October 2023. (a) Calculate the difference in discharge between the 1.5‑year flood recurrence interval and the 10‑year flood recurrence interval shown in Fig. 1.1. Show your working. [2] (b) Describe the pattern of river discharge shown in Fig. 1.1. [3] (c) Explain why the annual hydrograph of a river might vary. [5] Atmosphere and weather 2 Fig. 2.1 shows the differences in global average surface temperatures, 1880–2022, from the 1901–2000 average. (a) State the maximum negative difference in global average surface temperatures shown in Fig. 2.1. [1] (b) Describe the pattern of differences in global average surface temperatures shown in Fig. 2.1. [4] (c) Explain the pattern of differences in global average surface temperatures between 1980 and 2022 as shown in Fig. 2.1. [5] Rocks and weathering 3 Fig. 3.1 is a photograph which shows a weathered rock. (a) Draw a sketch of the weathered rock shown in Fig. 3.1. Label the main features. [4] (b) Suggest how one process might have weathered the rock shown in Fig. 3.1. [3] (c) Briefly explain one way that vegetation can weather rocks. [3]
Question paper, page 3
3 9696/13/O/N/25 © UCLES 2025 Section B Answer one question from this section. All questions are worth 30 marks. Hydrology and fluvial geomorphology 4 (a) (i) Describe the process of stemflow. [3] (ii) Explain how river levées are formed. [4] (b) Explain how the soils and rock type in a drainage basin might affect the shape of a storm hydrograph. [8] (c) ‘Wetland and riverbank conservation are the most effective ways of reducing the impacts of river floods.’ With the aid of examples, how far do you agree with this statement? [15] Atmosphere and weather 5 (a) (i) Describe how the uplift of air might lead to precipitation. [3] (ii) Explain the daytime energy budget. [4] (b) Explain why some latitudes experience radiation excesses and some latitudes experience radiation deficits. [8] (c) With the aid of examples, to what extent does human activity influence patterns of temperature in urban areas? [15] Rocks and weathering 6 (a) (i) Describe the process of sea floor spreading. [3] (ii) Explain how sheetwash occurs on slopes. [4] (b) Describe and explain the formation of volcanic island arcs. [8] (c) ‘Water is the main cause of mass movement on slopes.’ With the aid of examples, how far do you agree with this statement? [15]
Question paper, page 4
4 9696/13/O/N/25 © UCLES 2025 The boundaries and names shown, the designations used and the presentation of material on any maps contained in this question paper/insert do not imply official endorsement or acceptance by Cambridge Assessment International Education concerning the legal status of any country, territory, or area or any of its authorities, or of the delimitation of its frontiers or boundaries. Permission to reproduce items where third‑party owned material protected by copyright is included has been sought and cleared where possible. Every reasonable effort has been made by the publisher (UCLES) to trace copyright holders, but if any items requiring clearance have unwittingly been included, the publisher will be pleased to make amends at the earliest possible opportunity. To avoid the issue of disclosure of answer‑related information to candidates, all copyright acknowledgements are reproduced online in the Cambridge Assessment International Education Copyright Acknowledgements Booklet. This is produced for each series of examinations and is freely available to download at www.cambridgeinternational.org after the live examination series. Cambridge Assessment International Education is part of Cambridge Assessment. Cambridge Assessment is the brand name of the University of Cambridge Local Examinations Syndicate (UCLES), which is a department of the University of Cambridge. BLANK PAGE
Mark scheme, page 1
This document consists of 19 printed pages. © Cambridge University Press & Assessment 2025 [Turn over Cambridge International AS & A Level GEOGRAPHY 9696/13 Paper 1 Core Physical Geography October/November 2025 MARK SCHEME Maximum Mark: 60 Published This mark scheme is published as an aid to teachers and candidates, to indicate the requirements of the examination. It shows the basis on which Examiners were instructed to award marks. It does not indicate the details of the discussions that took place at an Examiners’ meeting before marking began, which would have considered the acceptability of alternative answers. Mark schemes should be read in conjunction with the question paper and the Principal Examiner Report for Teachers. Cambridge International will not enter into discussions about these mark schemes. Cambridge International is publishing the mark schemes for the October/November 2025 series for most Cambridge IGCSE, Cambridge International A and AS Level components, and some Cambridge O Level components.
Mark scheme, page 2
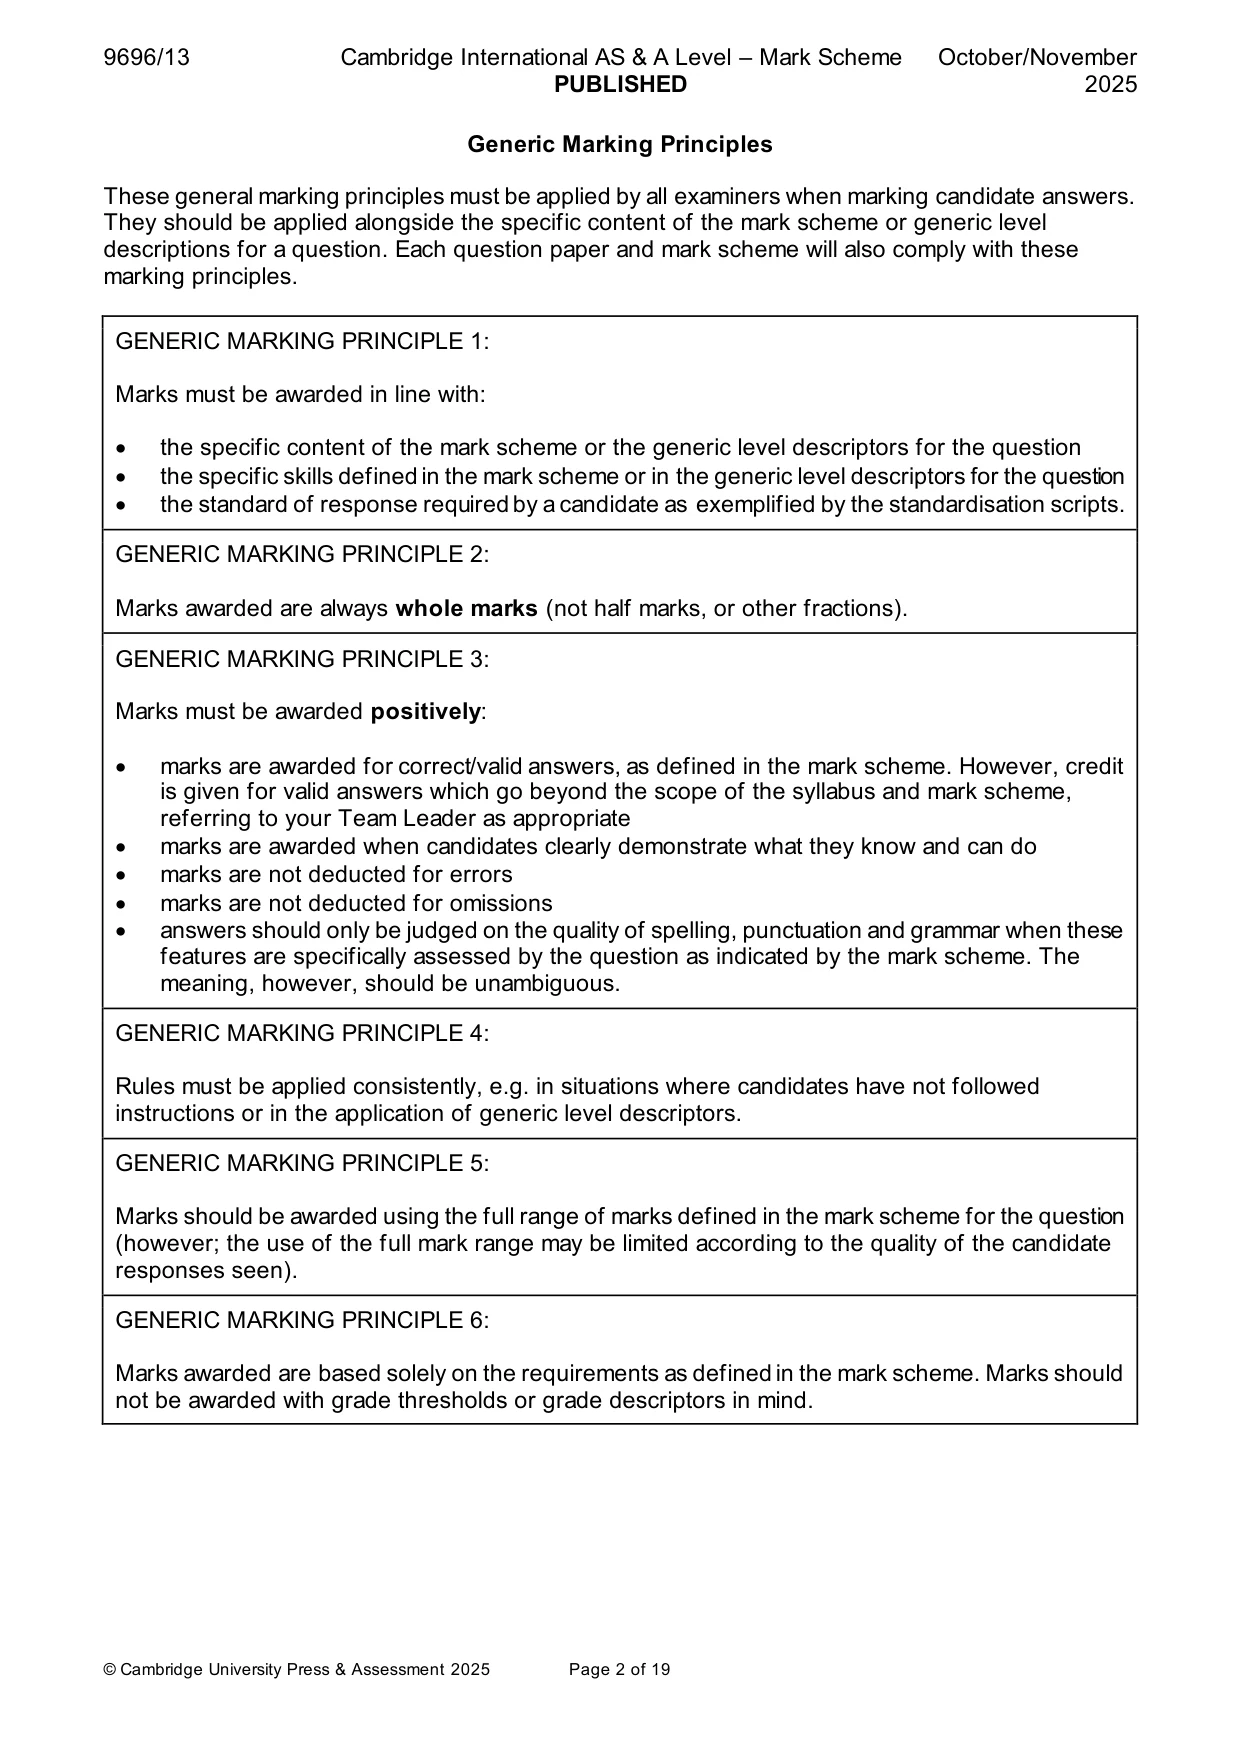
9696/13 Cambridge International AS & A Level – Mark Scheme PUBLISHED October/November 2025 © Cambridge University Press & Assessment 2025 Page 2 of 19 Generic Marking Principles These general marking principles must be applied by all examiners when marking candidate answers. They should be applied alongside the specific content of the mark scheme or generic level descriptions for a question. Each question paper and mark scheme will also comply with these marking principles. GENERIC MARKING PRINCIPLE 1: Marks must be awarded in line with: • the specific content of the mark scheme or the generic level descriptors for the question • the specific skills defined in the mark scheme or in the generic level descriptors for the question • the standard of response required by a candidate as exemplified by the standardisation scripts. GENERIC MARKING PRINCIPLE 2: Marks awarded are always whole marks (not half marks, or other fractions). GENERIC MARKING PRINCIPLE 3: Marks must be awarded positively: • marks are awarded for correct/valid answers, as defined in the mark scheme. However, credit is given for valid answers which go beyond the scope of the syllabus and mark scheme, referring to your Team Leader as appropriate • marks are awarded when candidates clearly demonstrate what they know and can do • marks are not deducted for errors • marks are not deducted for omissions • answers should only be judged on the quality of spelling, punctuation and grammar when these features are specifically assessed by the question as indicated by the mark scheme. The meaning, however, should be unambiguous. GENERIC MARKING PRINCIPLE 4: Rules must be applied consistently, e.g. in situations where candidates have not followed instructions or in the application of generic level descriptors. GENERIC MARKING PRINCIPLE 5: Marks should be awarded using the full range of marks defined in the mark scheme for the question (however; the use of the full mark range may be limited according to the quality of the candidate responses seen). GENERIC MARKING PRINCIPLE 6: Marks awarded are based solely on the requirements as defined in the mark scheme. Marks should not be awarded with grade thresholds or grade descriptors in mind.
Mark scheme, page 3
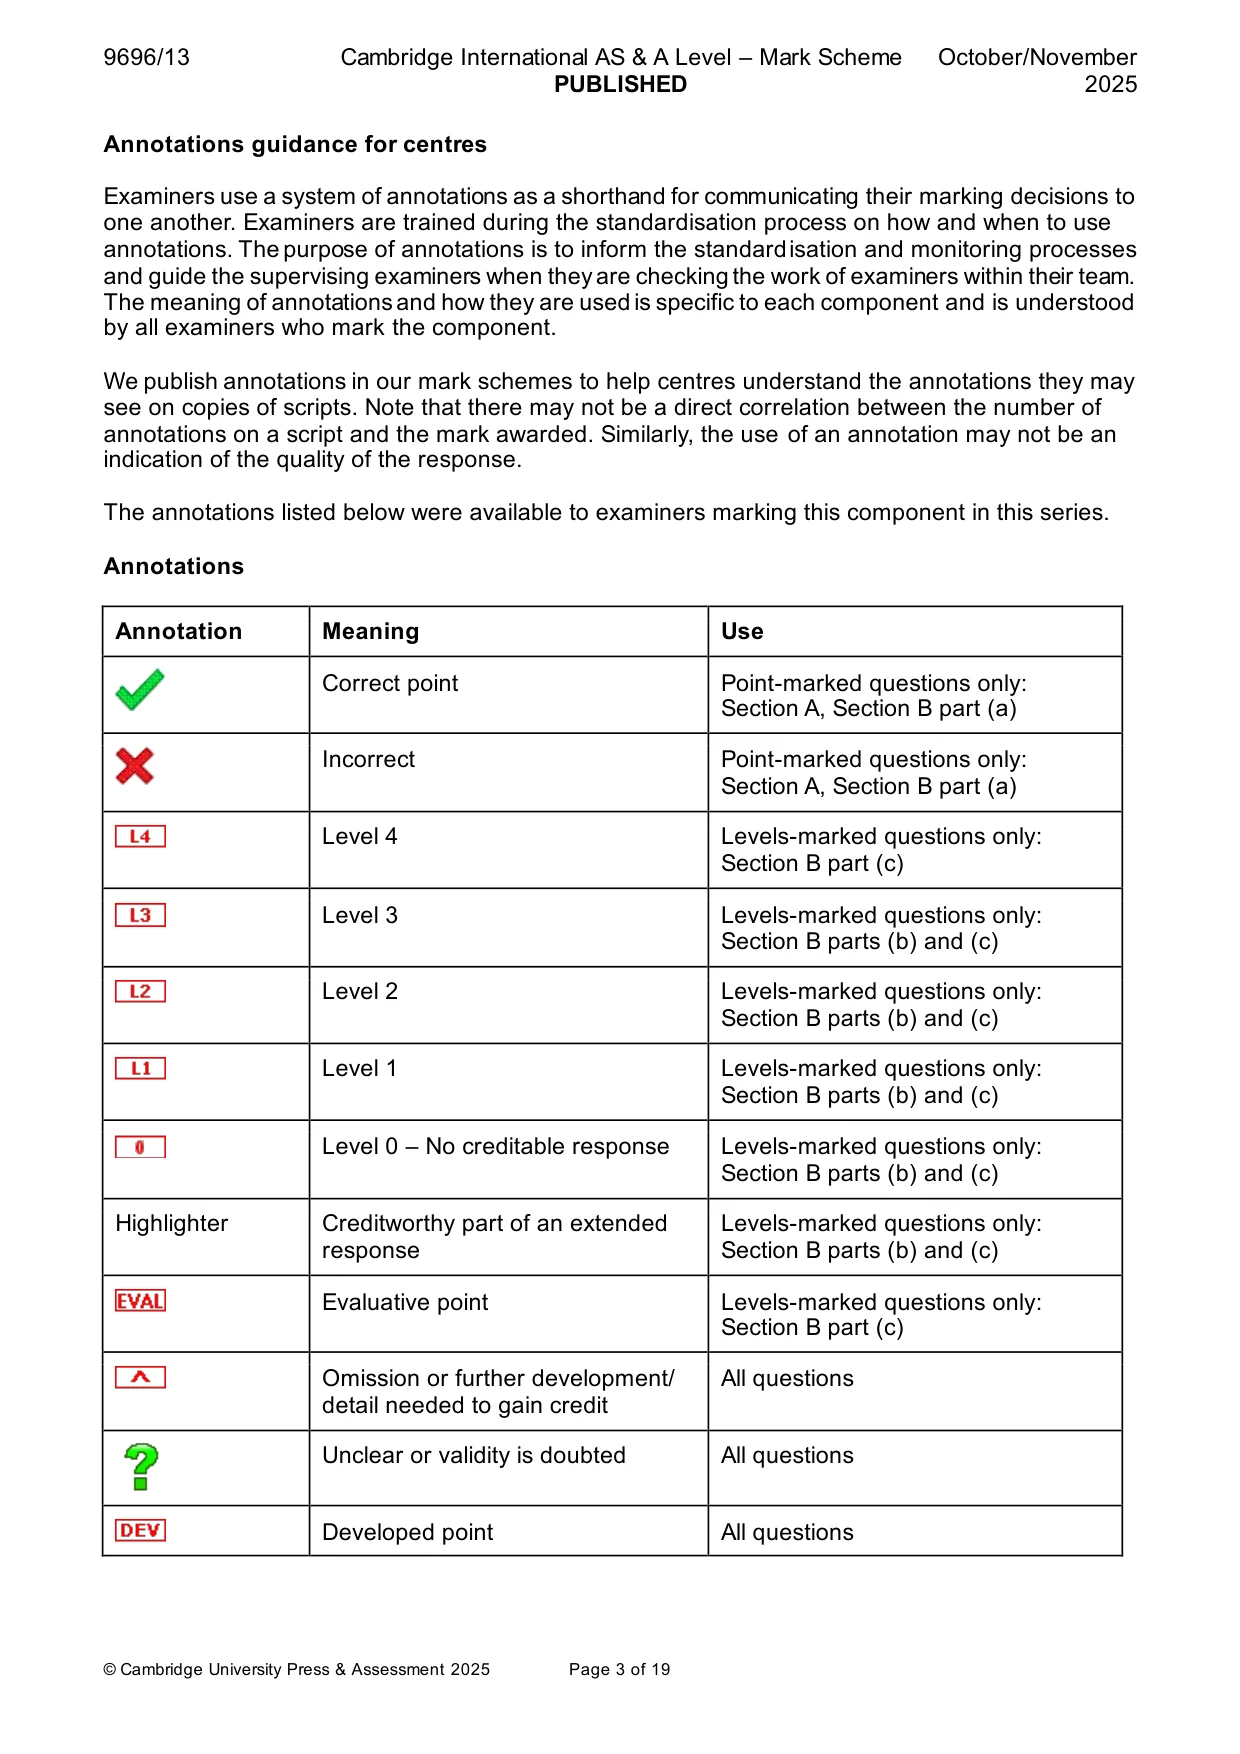
9696/13 Cambridge International AS & A Level – Mark Scheme PUBLISHED October/November 2025 © Cambridge University Press & Assessment 2025 Page 3 of 19 Annotations guidance for centres Examiners use a system of annotations as a shorthand for communicating their marking decisions to one another. Examiners are trained during the standardisation process on how and when to use annotations. The purpose of annotations is to inform the standardisation and monitoring processes and guide the supervising examiners when they are checking the work of examiners within their team. The meaning of annotations and how they are used is specific to each component and is understood by all examiners who mark the component. We publish annotations in our mark schemes to help centres understand the annotations they may see on copies of scripts. Note that there may not be a direct correlation between the number of annotations on a script and the mark awarded. Similarly, the use of an annotation may not be an indication of the quality of the response. The annotations listed below were available to examiners marking this component in this series. Annotations Annotation Meaning Use Correct point Point-marked questions only: Section A, Section B part (a) Incorrect Point-marked questions only: Section A, Section B part (a) Level 4 Levels-marked questions only: Section B part (c) Level 3 Levels-marked questions only: Section B parts (b) and (c) Level 2 Levels-marked questions only: Section B parts (b) and (c) Level 1 Levels-marked questions only: Section B parts (b) and (c) Level 0 – No creditable response Levels-marked questions only: Section B parts (b) and (c) Highlighter Creditworthy part of an extended response Levels-marked questions only: Section B parts (b) and (c) Evaluative point Levels-marked questions only: Section B part (c) Omission or further development/ detail needed to gain credit All questions Unclear or validity is doubted All questions Developed point All questions
Mark scheme, page 4
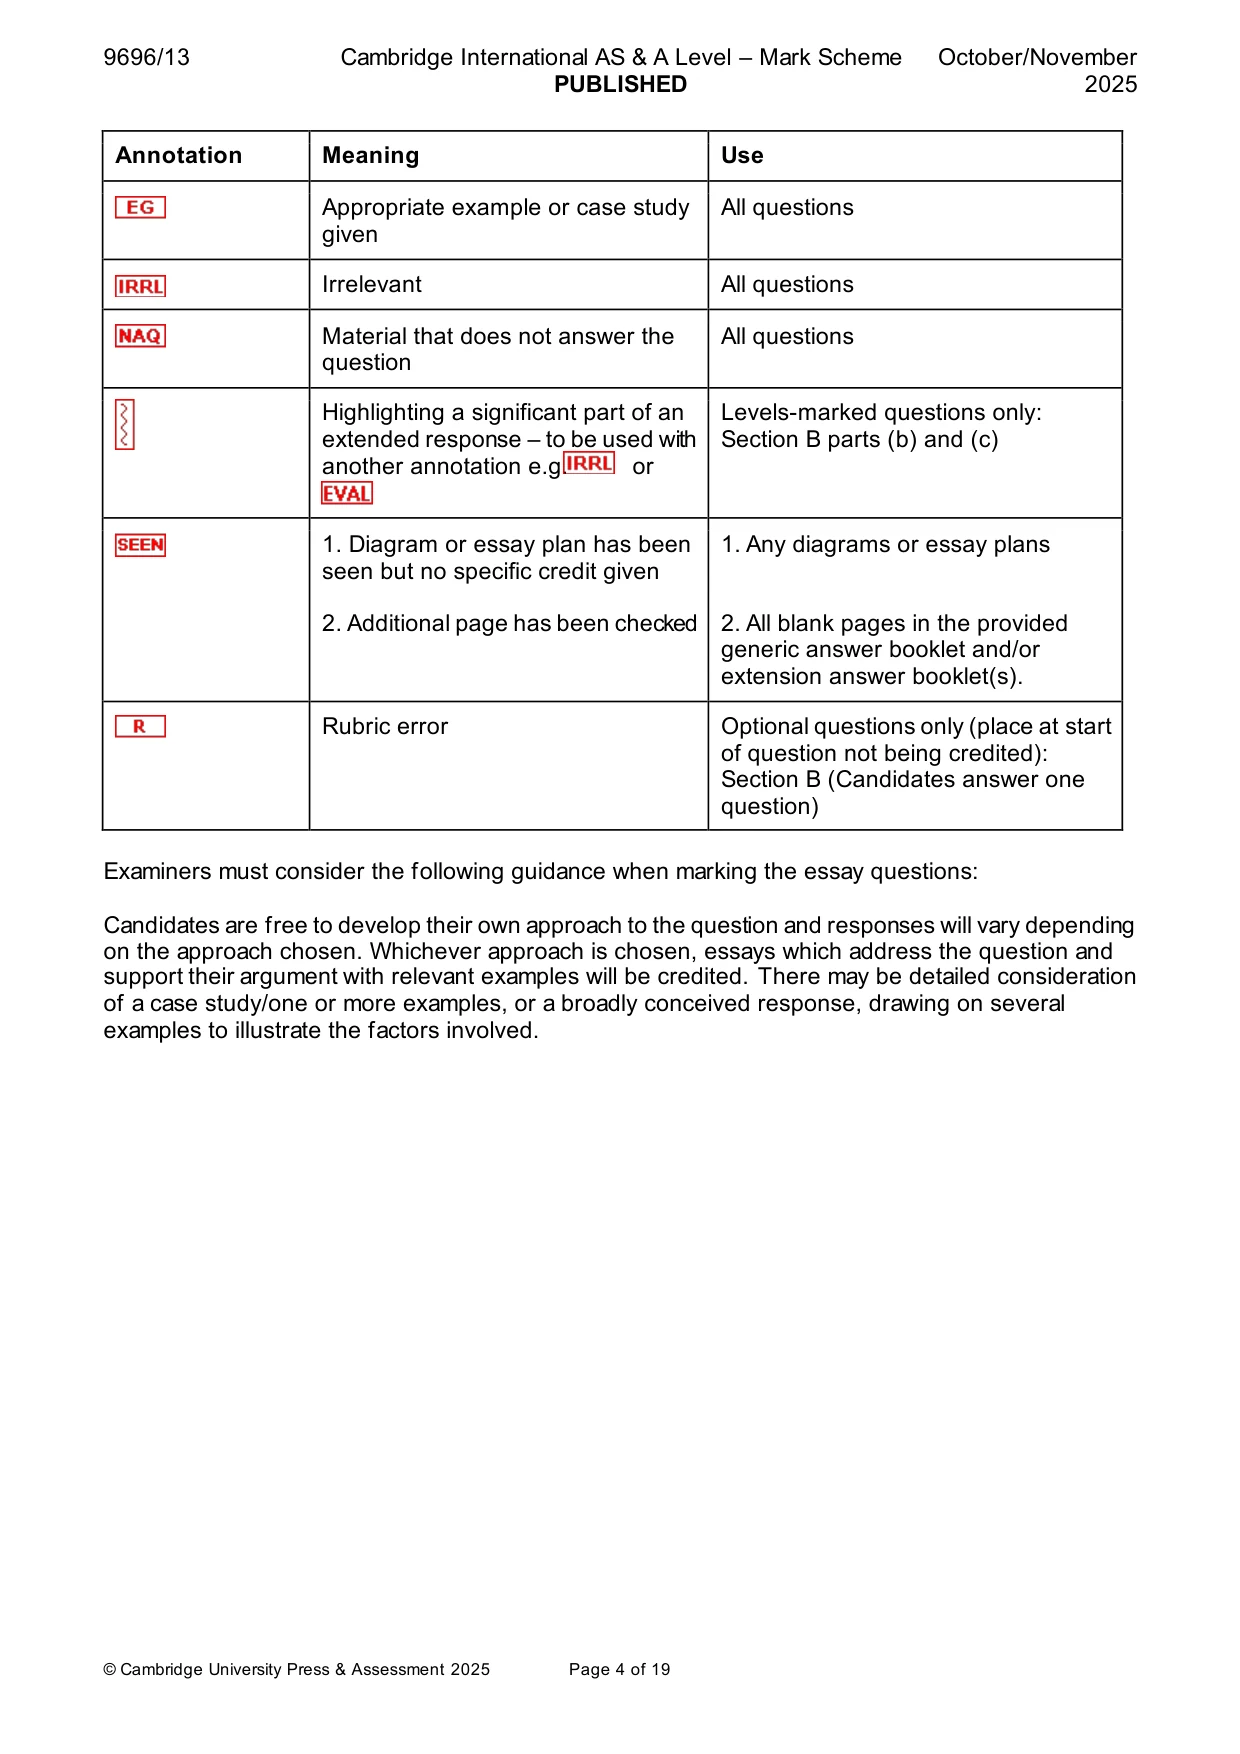
9696/13 Cambridge International AS & A Level – Mark Scheme PUBLISHED October/November 2025 © Cambridge University Press & Assessment 2025 Page 4 of 19 Annotation Meaning Use Appropriate example or case study given All questions Irrelevant All questions Material that does not answer the question All questions Highlighting a significant part of an extended response – to be used with another annotation e.g. or Levels-marked questions only: Section B parts (b) and (c) 1. Diagram or essay plan has been seen but no specific credit given 2. Additional page has been checked 1. Any diagrams or essay plans 2. All blank pages in the provided generic answer booklet and/or extension answer booklet(s). Rubric error Optional questions only (place at start of question not being credited): Section B (Candidates answer one question) Examiners must consider the following guidance when marking the essay questions: Candidates are free to develop their own approach to the question and responses will vary depending on the approach chosen. Whichever approach is chosen, essays which address the question and support their argument with relevant examples will be credited. There may be detailed consideration of a case study/one or more examples, or a broadly conceived response, drawing on several examples to illustrate the factors involved.
Mark scheme, page 5
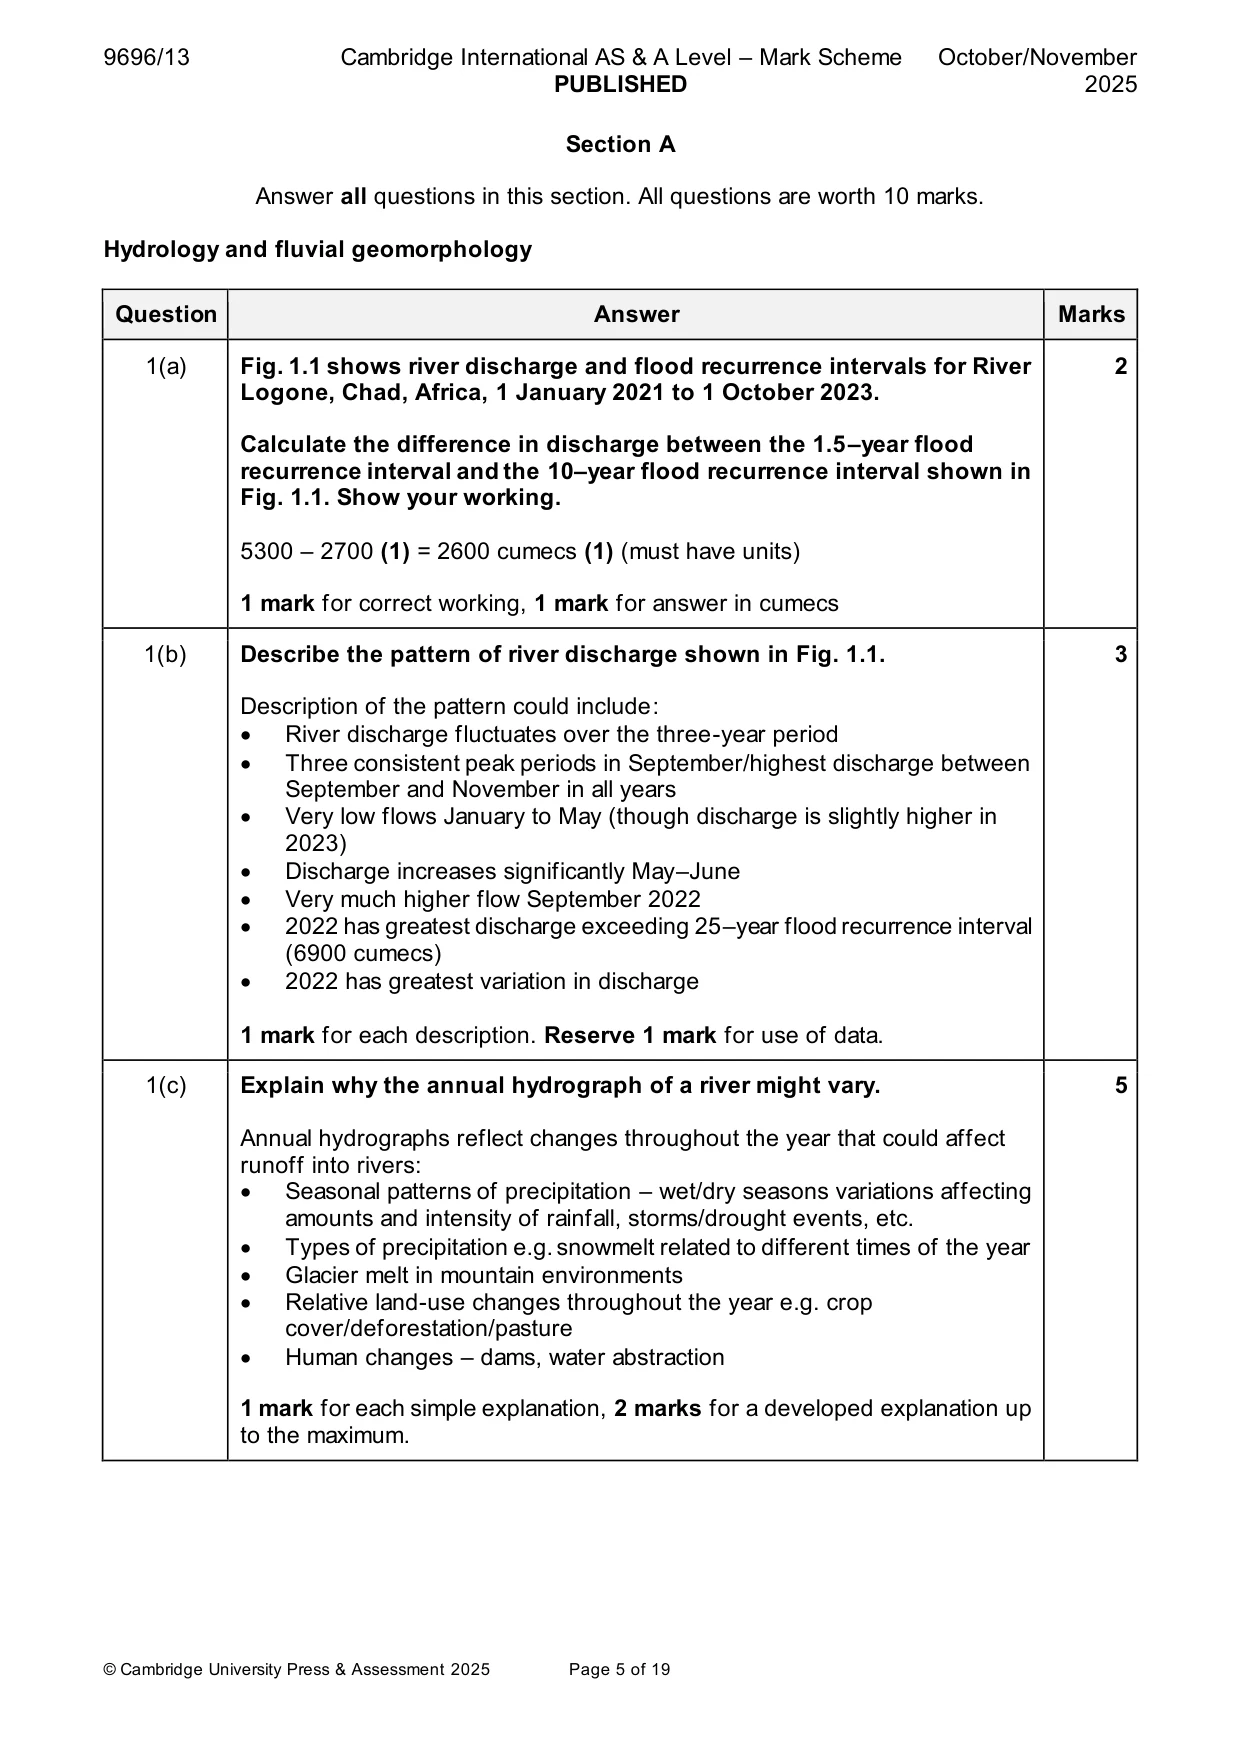
9696/13 Cambridge International AS & A Level – Mark Scheme PUBLISHED October/November 2025 © Cambridge University Press & Assessment 2025 Page 5 of 19 Section A Answer all questions in this section. All questions are worth 10 marks. Hydrology and fluvial geomorphology Question Answer Marks 1(a) Fig. 1.1 shows river discharge and flood recurrence intervals for River Logone, Chad, Africa, 1 January 2021 to 1 October 2023. Calculate the difference in discharge between the 1.5–year flood recurrence interval and the 10–year flood recurrence interval shown in Fig. 1.1. Show your working. 5300 – 2700 (1) = 2600 cumecs (1) (must have units) 1 mark for correct working, 1 mark for answer in cumecs 2 1(b) Describe the pattern of river discharge shown in Fig. 1.1. Description of the pattern could include: • River discharge fluctuates over the three-year period • Three consistent peak periods in September/highest discharge between September and November in all years • Very low flows January to May (though discharge is slightly higher in 2023) • Discharge increases significantly May–June • Very much higher flow September 2022 • 2022 has greatest discharge exceeding 25–year flood recurrence interval (6900 cumecs) • 2022 has greatest variation in discharge 1 mark for each description. Reserve 1 mark for use of data. 3 1(c) Explain why the annual hydrograph of a river might vary. Annual hydrographs reflect changes throughout the year that could affect runoff into rivers: • Seasonal patterns of precipitation – wet/dry seasons variations affecting amounts and intensity of rainfall, storms/drought events, etc. • Types of precipitation e.g. snowmelt related to different times of the year • Glacier melt in mountain environments • Relative land-use changes throughout the year e.g. crop cover/deforestation/pasture • Human changes – dams, water abstraction 1 mark for each simple explanation, 2 marks for a developed explanation up to the maximum. 5
Mark scheme, page 6
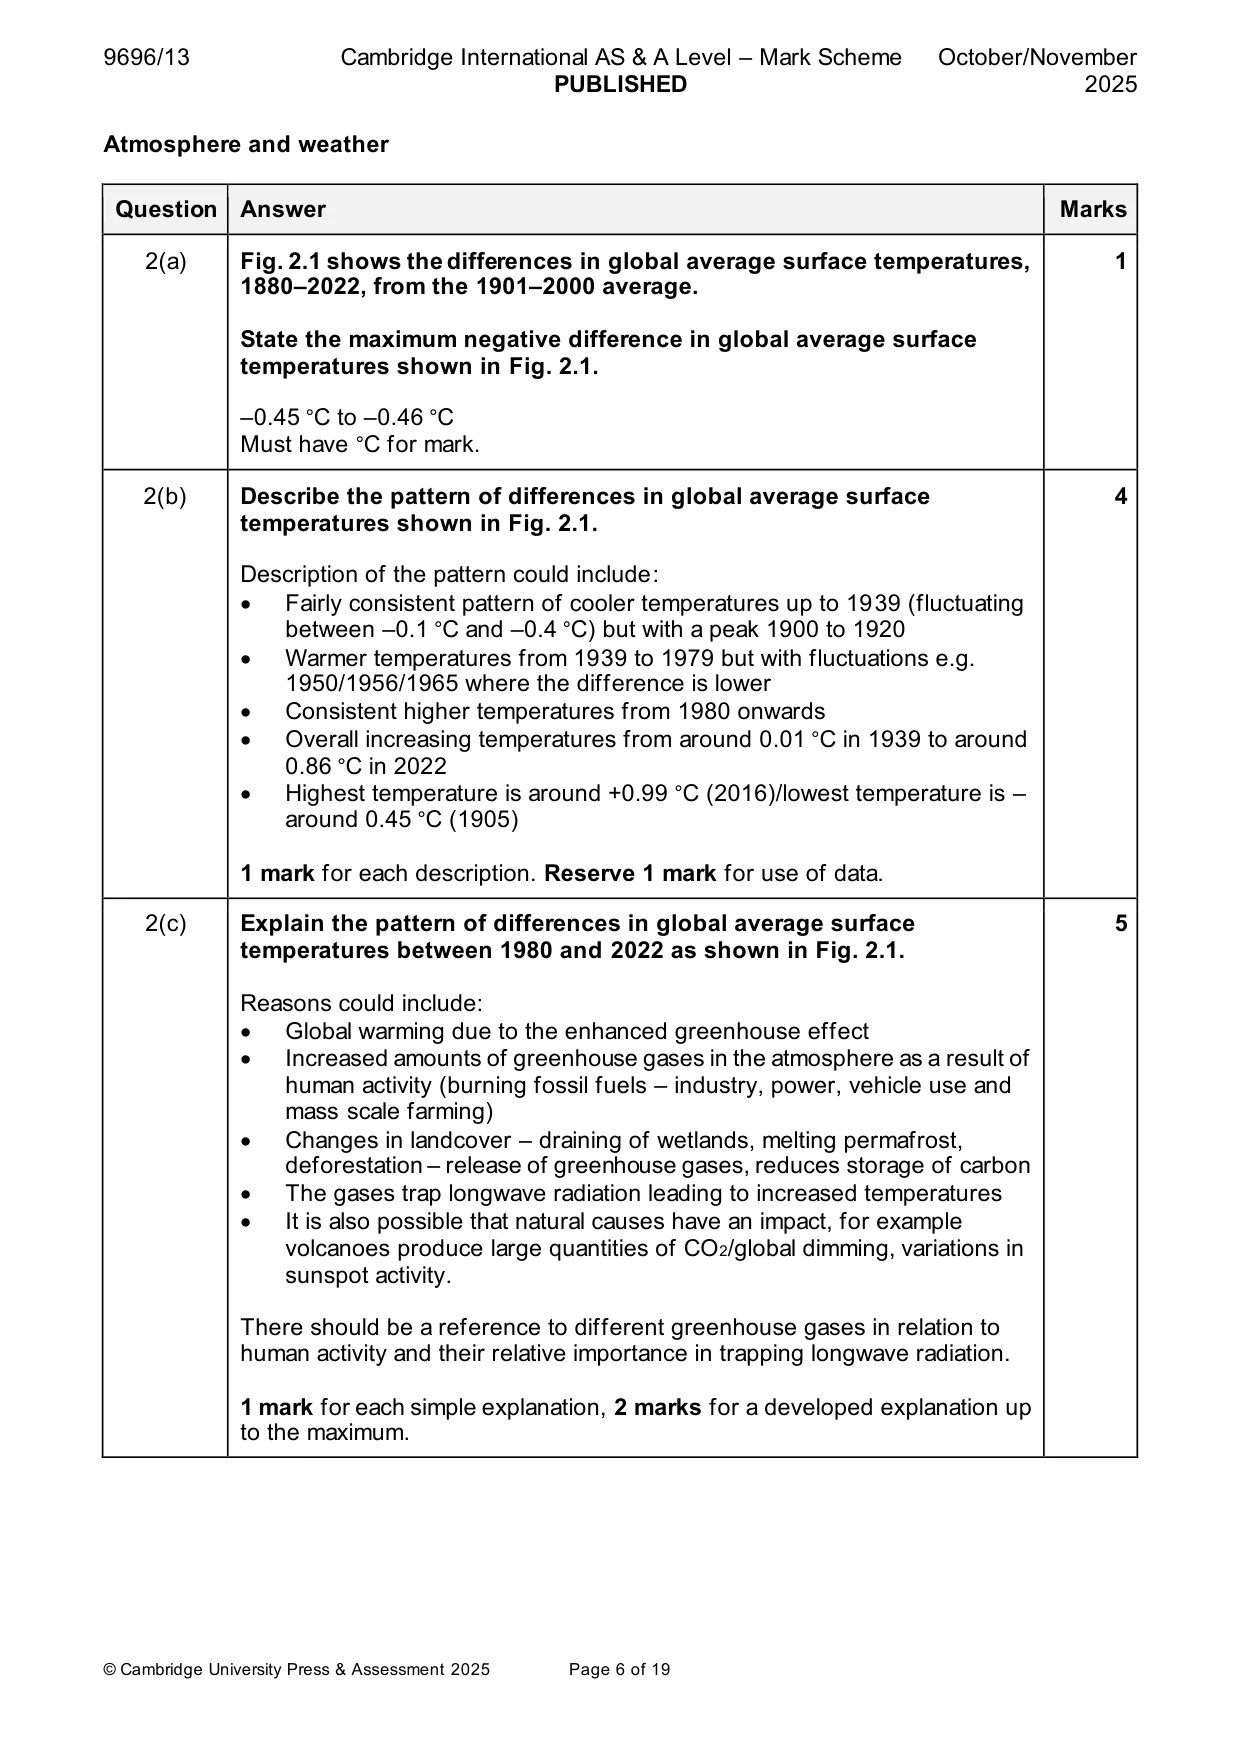
9696/13 Cambridge International AS & A Level – Mark Scheme PUBLISHED October/November 2025 © Cambridge University Press & Assessment 2025 Page 6 of 19 Atmosphere and weather Question Answer Marks 2(a) Fig. 2.1 shows the differences in global average surface temperatures, 1880–2022, from the 1901–2000 average. State the maximum negative difference in global average surface temperatures shown in Fig. 2.1. –0.45 °C to –0.46 °C Must have °C for mark. 1 2(b) Describe the pattern of differences in global average surface temperatures shown in Fig. 2.1. Description of the pattern could include: • Fairly consistent pattern of cooler temperatures up to 1939 (fluctuating between –0.1 °C and –0.4 °C) but with a peak 1900 to 1920 • Warmer temperatures from 1939 to 1979 but with fluctuations e.g. 1950/1956/1965 where the difference is lower • Consistent higher temperatures from 1980 onwards • Overall increasing temperatures from around 0.01 °C in 1939 to around 0.86 °C in 2022 • Highest temperature is around +0.99 °C (2016)/lowest temperature is – around 0.45 °C (1905) 1 mark for each description. Reserve 1 mark for use of data. 4 2(c) Explain the pattern of differences in global average surface temperatures between 1980 and 2022 as shown in Fig. 2.1. Reasons could include: • Global warming due to the enhanced greenhouse effect • Increased amounts of greenhouse gases in the atmosphere as a result of human activity (burning fossil fuels – industry, power, vehicle use and mass scale farming) • Changes in landcover – draining of wetlands, melting permafrost, deforestation – release of greenhouse gases, reduces storage of carbon • The gases trap longwave radiation leading to increased temperatures • It is also possible that natural causes have an impact, for example volcanoes produce large quantities of CO2/global dimming, variations in sunspot activity. There should be a reference to different greenhouse gases in relation to human activity and their relative importance in trapping longwave radiation. 1 mark for each simple explanation, 2 marks for a developed explanation up to the maximum. 5
Mark scheme, page 7
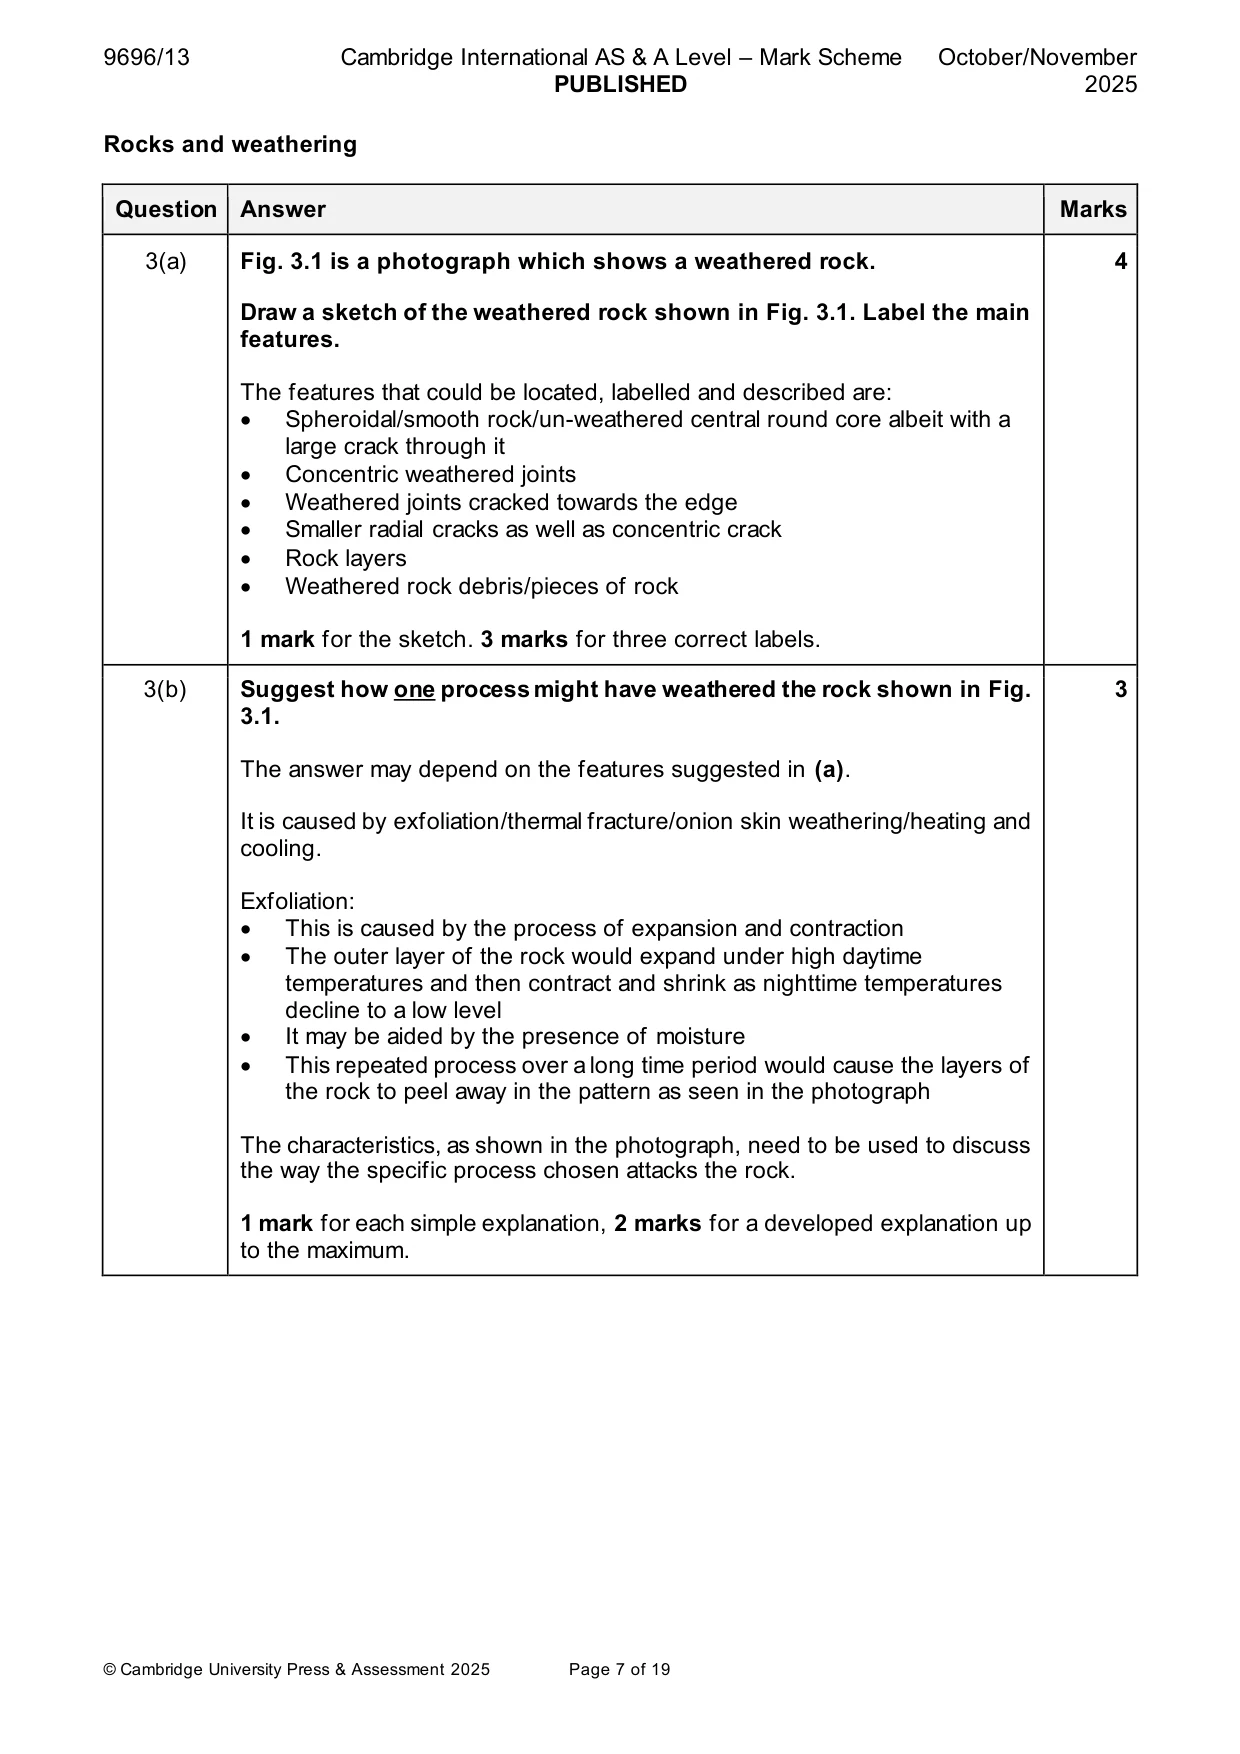
9696/13 Cambridge International AS & A Level – Mark Scheme PUBLISHED October/November 2025 © Cambridge University Press & Assessment 2025 Page 7 of 19 Rocks and weathering Question Answer Marks 3(a) Fig. 3.1 is a photograph which shows a weathered rock. Draw a sketch of the weathered rock shown in Fig. 3.1. Label the main features. The features that could be located, labelled and described are: • Spheroidal/smooth rock/un-weathered central round core albeit with a large crack through it • Concentric weathered joints • Weathered joints cracked towards the edge • Smaller radial cracks as well as concentric crack • Rock layers • Weathered rock debris/pieces of rock 1 mark for the sketch. 3 marks for three correct labels. 4 3(b) Suggest how one process might have weathered the rock shown in Fig. 3.1. The answer may depend on the features suggested in (a). It is caused by exfoliation/thermal fracture/onion skin weathering/heating and cooling. Exfoliation: • This is caused by the process of expansion and contraction • The outer layer of the rock would expand under high daytime temperatures and then contract and shrink as nighttime temperatures decline to a low level • It may be aided by the presence of moisture • This repeated process over a long time period would cause the layers of the rock to peel away in the pattern as seen in the photograph The characteristics, as shown in the photograph, need to be used to discuss the way the specific process chosen attacks the rock. 1 mark for each simple explanation, 2 marks for a developed explanation up to the maximum. 3
Mark scheme, page 8
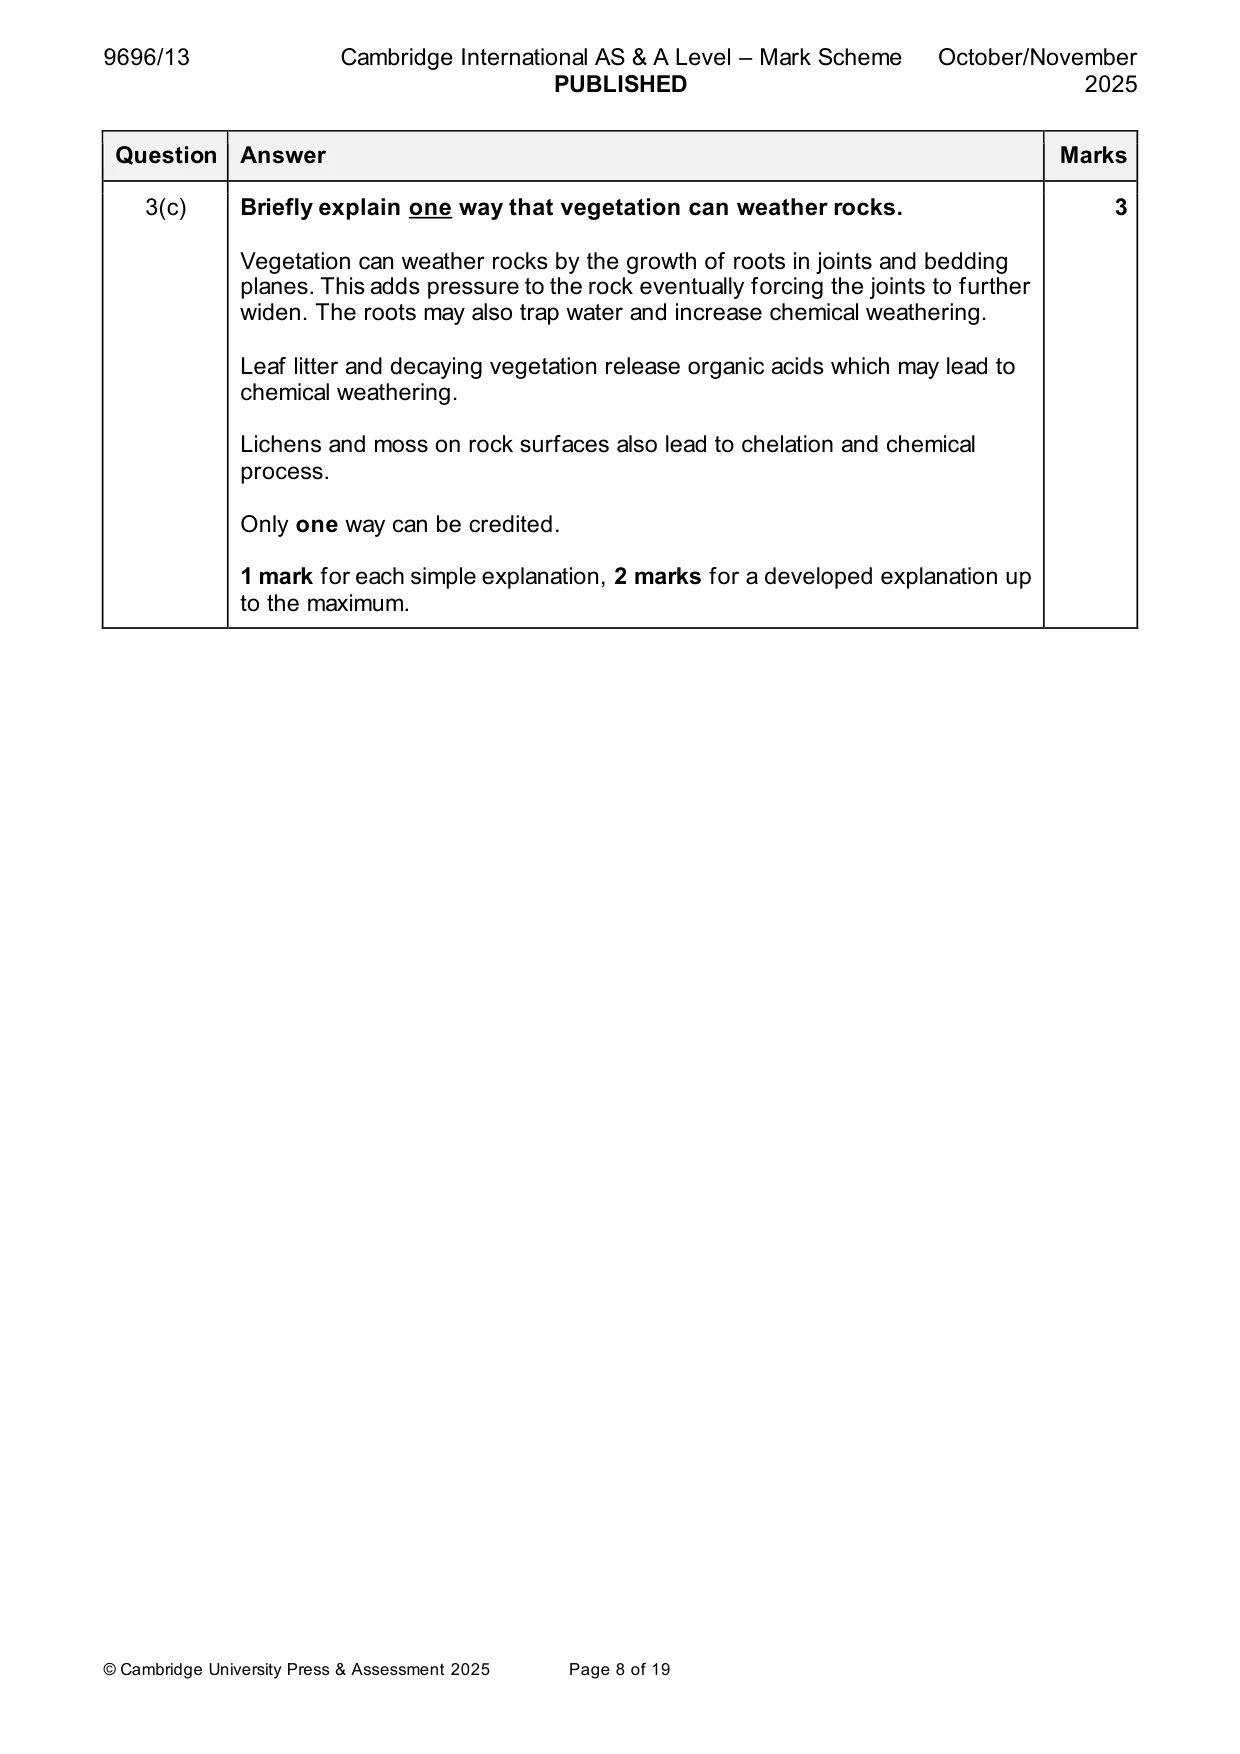
9696/13 Cambridge International AS & A Level – Mark Scheme PUBLISHED October/November 2025 © Cambridge University Press & Assessment 2025 Page 8 of 19 Question Answer Marks 3(c) Briefly explain one way that vegetation can weather rocks. Vegetation can weather rocks by the growth of roots in joints and bedding planes. This adds pressure to the rock eventually forcing the joints to further widen. The roots may also trap water and increase chemical weathering. Leaf litter and decaying vegetation release organic acids which may lead to chemical weathering. Lichens and moss on rock surfaces also lead to chelation and chemical process. Only one way can be credited. 1 mark for each simple explanation, 2 marks for a developed explanation up to the maximum. 3
Mark scheme, page 9
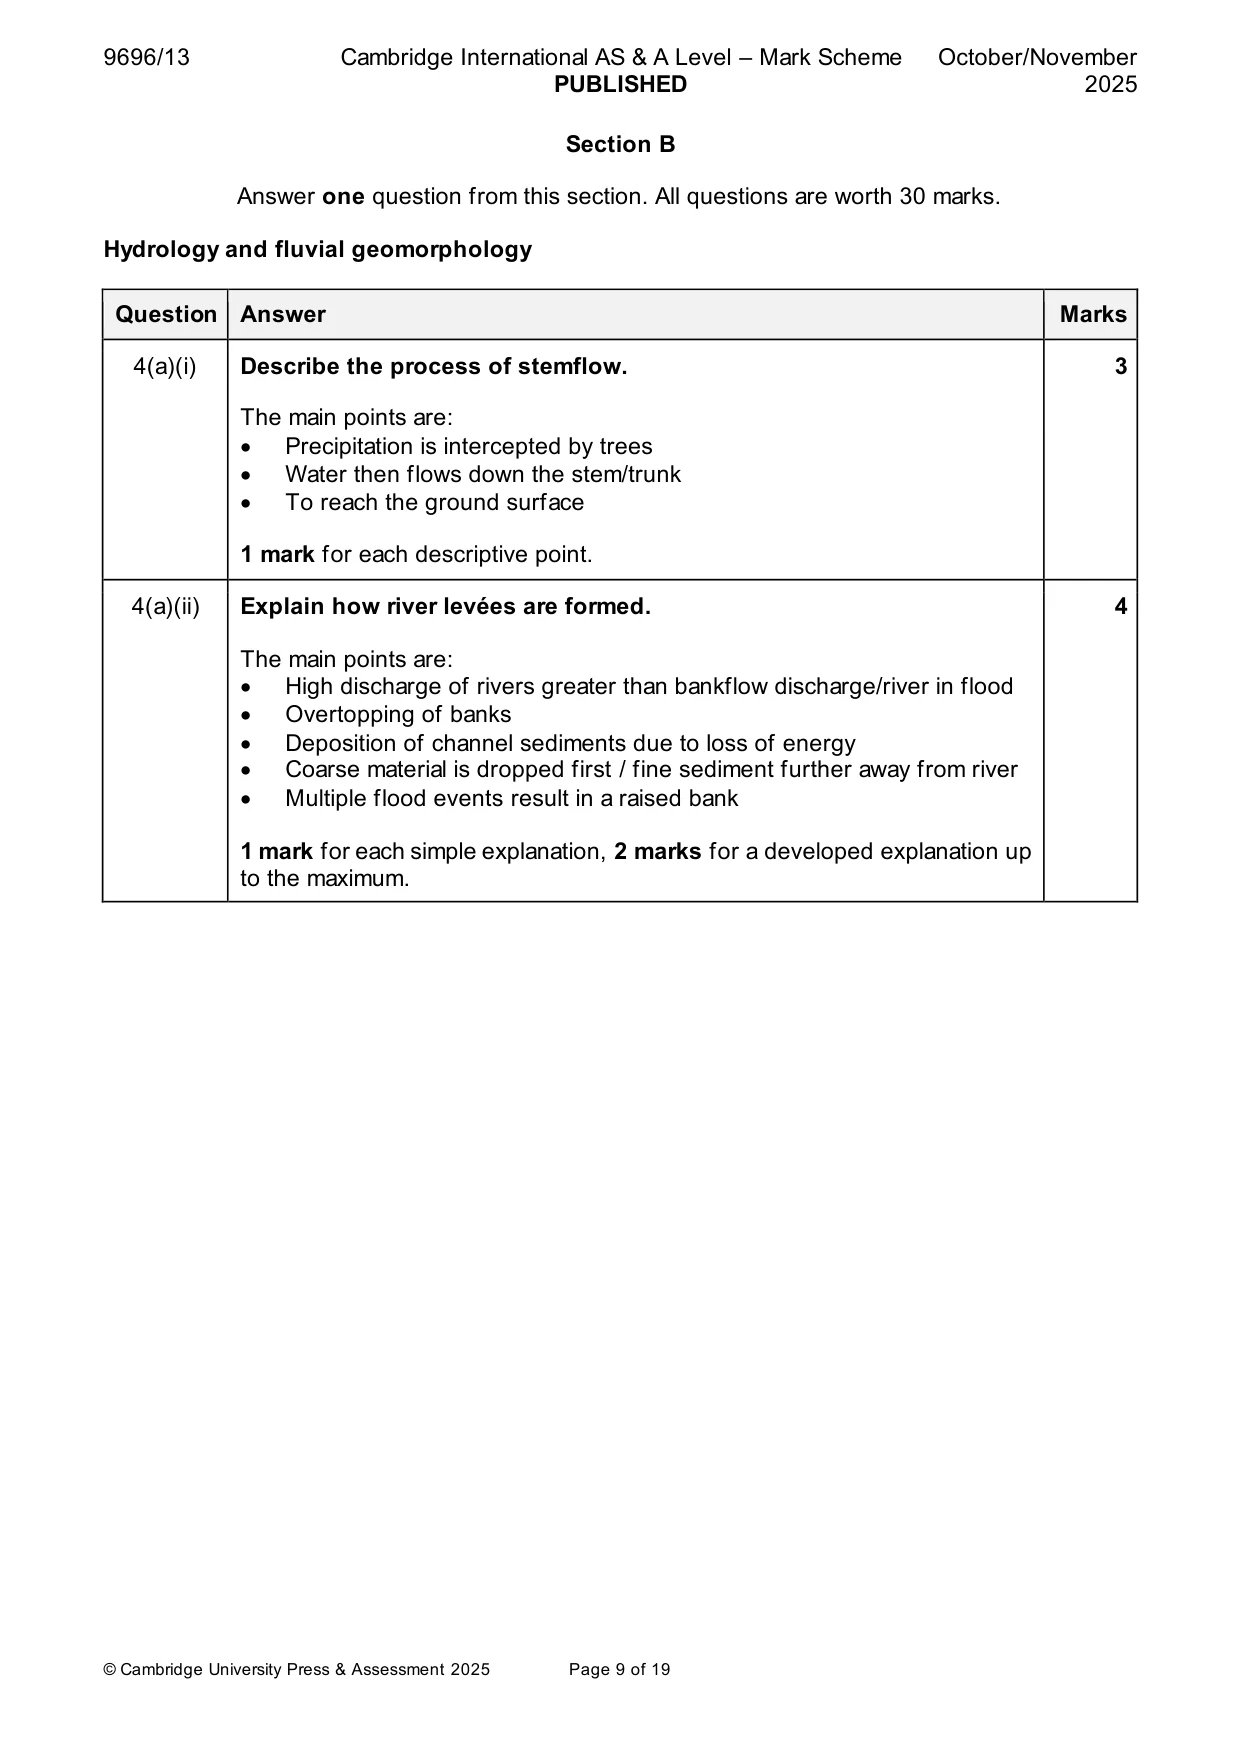
9696/13 Cambridge International AS & A Level – Mark Scheme PUBLISHED October/November 2025 © Cambridge University Press & Assessment 2025 Page 9 of 19 Section B Answer one question from this section. All questions are worth 30 marks. Hydrology and fluvial geomorphology Question Answer Marks 4(a)(i) Describe the process of stemflow. The main points are: • Precipitation is intercepted by trees • Water then flows down the stem/trunk • To reach the ground surface 1 mark for each descriptive point. 3 4(a)(ii) Explain how river levées are formed. The main points are: • High discharge of rivers greater than bankflow discharge/river in flood • Overtopping of banks • Deposition of channel sediments due to loss of energy • Coarse material is dropped first / fine sediment further away from river • Multiple flood events result in a raised bank 1 mark for each simple explanation, 2 marks for a developed explanation up to the maximum. 4
Mark scheme, page 10
9696/13 Cambridge International AS & A Level – Mark Scheme PUBLISHED October/November 2025 © Cambridge University Press & Assessment 2025 Page 10 of 19 Question Answer Marks 4(b) Explain how the soils and rock type in a drainage basin might affect the shape of a storm hydrograph. The shape of storm hydrographs reflects the amount and speed with which water reaches the river channel. This will depend on the amount of overland flow. Overland flow occurs when precipitation exceeds infiltration capacity or soil is saturated. Infiltration capacity is affected by how porous and permeable soils are, for example: • Porous soils, such as sandy soils, have higher infiltration capacities than non-porous soils. This would allow infiltration, so less surface run off and the hydrograph will have lower peak discharge. • Clay soils are highly porous but because the pores are small, they are mainly impermeable, leading to more surface runoff and a quick response time/steep rising limb on the hydrograph. • Soils are generally related to the underlying bedrock, the nature of the rocks will determine whether deep percolation occurs or whether percolation will be impeded leading to soil saturation. For example, permeable limestone allows percolation whereas granite is impermeable and does not. • Where rock/soil are permeable, there are gentle rising/falling limbs, longer lag times and lower peak discharge, although base flow may be higher as water infiltrates and percolates, then is stored as groundwater, which is released as base flow. All the main elements of a storm hydrograph should be discussed – rising/falling limbs, peak discharge, lag time, base flow. Max 4 marks if only soils or rock type is explained. Award marks based on the quality of explanation and breadth of the response using the marking levels below. Level 3 (6–8) Response clearly explains how the soils and rock type in a drainage basin might affect the shape of a storm hydrograph. Response is well founded in detailed knowledge and strong conceptual understanding of the topic. Examples used are appropriate and integrated effectively into the response. Level 2 (3–5) Response explains how the soils and/or rock type in a drainage basin might affect the shape of a storm hydrograph. Response develops on a largely secure base of knowledge and understanding. Examples may lack detail or development. Level 1 (1–2) Response describes how the soils and/or rock type in a drainage basin might affect the shape of a storm hydrograph. Knowledge is basic and understanding may be inaccurate. Examples are in name only or lacking entirely. Level 0 (0) No creditable response. 8
Mark scheme, page 11
9696/13 Cambridge International AS & A Level – Mark Scheme PUBLISHED October/November 2025 © Cambridge University Press & Assessment 2025 Page 11 of 19 Question Answer Marks 4(c) ‘Wetland and riverbank conservation are the most effective ways of reducing the impacts of river floods.’ With the aid of examples, how far do you agree with this statement? Wetlands store large quantities of water and release it slowly. Riverbank conservation will involve stabilising river banks and planting. The impact of flooding can be reduced by soft and hard engineering. Wetland and riverbank conservation are examples of soft engineering. Soft engineering works with natural processes, is cheaper and may have ecosystem benefits (e.g. reestablishing species). Other soft engineering strategies include drainage basin management such as afforestation. However, soft engineering only lessens the impact of floods and do not prevent them. They do not protect against economic loss, and where homes/businesses need to be protected, a hard engineering approach may be better/more reliable, and is usually more reassuring. Hard engineering includes levees, dam construction, channel diversion and channel straightening. Prediction and warning systems could also be discussed. Evaluation may be the idea of using both natural control and hard engineering. The use of specific examples will be needed for precise evaluation. Award marks based on the quality of the response using the marking levels below. Level 4 (12–15) Response thoroughly assesses the extent to which wetland and riverbank conservation are the most effective ways of reducing the impacts of river floods. Examples used are appropriate and integrated effectively into the response. Response is well founded in detailed knowledge and strong conceptual understanding of the topic. Level 3 (8–11) Response assesses the extent to which wetland and riverbank conservation are the most effective ways of reducing the impacts of river floods but may be unbalanced. Examples may lack detail or development. Response develops on a largely secure base of knowledge and understanding. 15
Mark scheme, page 12
9696/13 Cambridge International AS & A Level – Mark Scheme PUBLISHED October/November 2025 © Cambridge University Press & Assessment 2025 Page 12 of 19 Question Answer Marks 4(c) Level 2 (4–7) Response shows general knowledge and understanding of the extent to which wetland and riverbank conservation are the most effective ways of reducing the impacts of river floods. Response is mainly descriptive or explanatory with limited use of examples and understanding of the topic may be partial or inaccurate. Some concluding remarks. General responses without the use of example(s) will not get above the middle of Level 2 (6 marks). Level 1 (1–3) Response may broadly discuss the extent to which wetland and/or riverbank conservation are the most effective ways of reducing the impacts of river floods but does not address the question and does not come to a convincing conclusion. Response is descriptive, knowledge is basic and understanding is poor. Level 0 (0) No creditable response.
Mark scheme, page 13
9696/13 Cambridge International AS & A Level – Mark Scheme PUBLISHED October/November 2025 © Cambridge University Press & Assessment 2025 Page 13 of 19 Atmosphere and weather Question Answer Marks 5(a)(i) Describe how the uplift of air might lead to precipitation. The main points are: • Moist air is forced to rise by convection, frontal uplift or a mountain barrier • As air rises it cools to dew point • Condensation (releases latent heat which encourages further upward movement (fuelling more condensation)) • Water droplets increase in size and may coalesce and fall as precipitation Credit use of diagram. 1 mark for each description. 3 5(a)(ii) Explain the daytime energy budget. The daytime energy budget is composed of six components: incoming shortwave solar radiation, reflected solar radiation, surface absorption, sensible heat and latent heat transfer, and outgoing longwave radiation. All are related to incoming short-wave radiation and the effect of albedo as to the proportion of the radiation that is reflected or absorbed. The temperature of the surfaces will also affect latent heat transfer by evaporation and condensation as well as sensible heat transfer. The daytime energy budget relies upon the sun, the energy input which supplies short-wave energy to the surface. Some energy is reflected by the clouds and the surface (albedo). Some is scattered in the atmosphere and some is absorbed by the clouds and the surface. This absorbed radiation is then emitted as long wave radiation, to be either reabsorbed by the atmospheric gases or clouds or lost to the budget. Both incoming and outgoing radiation must be referred to for full marks. 1 mark for each simple explanation, 2 marks for a developed explanation up to the maximum. 4
Mark scheme, page 14
9696/13 Cambridge International AS & A Level – Mark Scheme PUBLISHED October/November 2025 © Cambridge University Press & Assessment 2025 Page 14 of 19 Question Answer Marks 5(b) Explain why some latitudes experience radiation excesses and some latitudes experience radiation deficits. This is related to the amount of incoming shortwave radiation received by different areas of the earth. Radiation excess: Equatorial areas always receive more incoming shortwave radiation because the sun is higher overhead and radiation has a shorter distance to penetrate the earth’s atmosphere (less scattering/absorption), therefore insolation is concentrated. Radiation deficit: Higher latitude areas receive less radiation input because of the angle of the sun, insolation is less concentrated and spread over a larger surface area. High land albedo also results in lower temperatures. The deficit is enhanced due to seasonal differences with long dark winters due to the tilt of the Earth. Credit the use of diagram(s). Award marks based on the quality of explanation and breadth of the response using the marking levels below. Level 3 (6–8) Response clearly explains why some latitudes experience radiation excesses and some latitudes experience radiation deficits. Response is well founded in detailed knowledge and strong conceptual understanding of the topic. Examples used are appropriate and integrated effectively into the response. Level 2 (3–5) Response explains why some latitudes experience radiation excesses and some latitudes experience radiation deficits. Response develops on a largely secure base of knowledge and understanding. Examples may lack detail or development. Level 1 (1–2) Response describes how some latitudes experience radiation excesses and some latitudes experience radiation deficits. Knowledge is basic and understanding may be inaccurate. Examples are in name only or lacking entirely. Level 0 (0) No creditable response. 8
Mark scheme, page 15
9696/13 Cambridge International AS & A Level – Mark Scheme PUBLISHED October/November 2025 © Cambridge University Press & Assessment 2025 Page 15 of 19 Question Answer Marks 5(c) With the aid of examples, to what extent does human activity influence patterns of temperature in urban areas? The main influence of human activity on the patterns of temperature in urban areas reflect its influence on the production of heat and the varying albedos of the artificial surfaces in urban areas: • Patterns will reflect the various patterns of land use and human activity in the urban areas. Industrial processes, vehicle activity, central heating, use of air conditioning and other factors can all lead to heat production. • Type/age/insulation of buildings will affect how much heat is lost from roofs, etc. • Gas/particulate emissions can affect cloud cover, and thus keeping in long wave radiation • Amounts of vegetation, open water bodies affect evaporation • The differing albedos of artificial surfaces will influence absorption and reflection of incoming short wave solar radiation However, urban areas are found in the context of their climatic location, related to latitude, continentality, etc. Therefore, candidates are likely to conclude that humans can modify the temperature but the climate is the overall influence. The detail will depend on the specific examples chosen to illustrate the effects. Award marks based on the quality of the response using the marking levels below. Level 4 (12–15) Response thoroughly assesses the extent to which human activity influences patterns of temperature in urban areas. Examples used are appropriate and integrated effectively into the response. Response is well founded in detailed knowledge and strong conceptual understanding of the topic. Level 3 (8–11) Response assesses the extent to which human activity influences patterns of temperature in urban areas but may be unbalanced. Examples may lack detail or development. Response develops on a largely secure base of knowledge and understanding. Level 2 (4–7) Response shows general knowledge and understanding of the extent to which human activity influences patterns of temperature in urban areas. Response is mainly descriptive or explanatory with limited use of examples and understanding of the topic may be partial or inaccurate. Some concluding remarks. General responses without the use of example(s) will not get above the middle of Level 2 (6 marks). 15
Mark scheme, page 16
9696/13 Cambridge International AS & A Level – Mark Scheme PUBLISHED October/November 2025 © Cambridge University Press & Assessment 2025 Page 16 of 19 Question Answer Marks 5(c) Level 1 (1–3) Response may broadly discuss the extent to which human activity influences patterns of temperature in urban areas but does not address the question and does not come to a convincing conclusion. Response is descriptive, knowledge is basic and understanding is poor. Level 0 (0) No creditable response.
Mark scheme, page 17
9696/13 Cambridge International AS & A Level – Mark Scheme PUBLISHED October/November 2025 © Cambridge University Press & Assessment 2025 Page 17 of 19 Rocks and weathering Question Answer Marks 6(a)(i) Describe the process of sea floor spreading. The main points are: • Two oceanic plates move apart/at divergent boundaries/at mid-ocean ridge • Magma/less dense material rises to fill gap • Magma cools creating new oceanic crust/lithosphere • The movement is caused by a combination of ridge push and slab pull (with the help of convection currents) 1 mark for each description. 3 6(a)(ii) Explain how sheetwash occurs on slopes. Sheetwash is the unconcentrated flow of water on slopes. The main factors necessary for its occurrence are: • High amounts or high intensity of rain (or frozen ground/compacted surface) • Infiltration capacity of soils is exceeded • Leading to either saturation overland flow or Hortonian overland flow/water flows over the surface in a laminar/sheetlike manner • This requires sufficient gradient to allow the water to flow downslope • A relatively smooth surface is needed so that the flow does not become concentrated 1 mark for each simple explanation, 2 marks for a developed explanation up to the maximum. 4
Mark scheme, page 18
9696/13 Cambridge International AS & A Level – Mark Scheme PUBLISHED October/November 2025 © Cambridge University Press & Assessment 2025 Page 18 of 19 Question Answer Marks 6(b) Describe and explain the formation of volcanic island arcs. Volcanic island arcs are formed by the subduction of one oceanic plate under another oceanic plate as they move together. The movement is caused by a combination of ridge push and slab pull with the help of convection currents. The slighter denser plate is the one that is subducted. The subducted plate is melted in the Benioff zone and magma then rises, through fissures and faults, to produce the volcanic islands. A series of islands form, following a curve like distribution, approximately 200 kms away from the zone of subduction. Award marks based on the quality of explanation and breadth of the response using the marking levels below. Level 3 (6–8) Response clearly describes and explains the formation of volcanic island arcs. Response is well founded in detailed knowledge and strong conceptual understanding of the topic. Examples used are appropriate and integrated effectively into the response. Level 2 (3–5) Response describes and explains the formation of volcanic island arcs. Response develops on a largely secure base of knowledge and understanding. Examples may lack detail or development. Level 1 (1–2) Response describes the formation of volcanic island arcs. Knowledge is basic and understanding may be inaccurate. Examples are in name only or lacking entirely. Level 0 (0) No creditable response. 8
Mark scheme, page 19
9696/13 Cambridge International AS & A Level – Mark Scheme PUBLISHED October/November 2025 © Cambridge University Press & Assessment 2025 Page 19 of 19 Question Answer Marks 6(c) ‘Water is the main cause of mass movement on slopes.’ With the aid of examples, how far do you agree with this statement? Water affects mass movement in several ways: • Water in soils and rock adds weight to a slope which might be enough to overcome the strength of the slope material • Water also enters the pores of, especially clay-based material, increasing the pore water pressure leading to a reduction of cohesion and friction and thus strength • Porewater may also lubricate incipient failure surfaces or shear planes • Water can increase the speed of movement However other agents can be important, for example erosion by ice, human activity, animals burrowing, slope undercutting, earthquakes. Water may also have a role but is not likely to be the trigger (e.g. in a rockfall). Candidates may recognise it is gravity that causes mass movement. Award marks based on the quality of the response using the marking levels below. Level 4 (12–15) Response thoroughly assesses the extent to which water is the main cause of mass movement on slopes. Examples used are appropriate and integrated effectively into the response. Response is well founded in detailed knowledge and strong conceptual understanding of the topic. Level 3 (8–11) Response assesses the extent to which water is the main cause of mass movement on slopes but may be unbalanced. Examples may lack detail or development. Response develops on a largely secure base of knowledge and understanding. Level 2 (4–7) Response shows general knowledge and understanding of the extent to which water is the main cause of mass movement on slopes. Response is mainly descriptive or explanatory with limited use of examples and understanding of the topic may be partial or inaccurate. Some concluding remarks. General responses without the use of example(s) will not get above the middle of Level 2 (6 marks). Level 1 (1–3) Response may broadly discuss the extent to which water is the main cause of mass movement on slopes but does not address the question and does not come to a convincing conclusion. Response is descriptive, knowledge is basic and understanding is poor. Level 0 (0) No creditable response. 15
What you needed in this session
Cambridge’s own grade thresholds for 2025 Oct/Nov, Paper 1 · Variant 3. A higher threshold means an easier paper — the bar moves with how the cohort did.