Cambridge A Level Geography 9696 — 2016 May/June Paper 1 · Variant 3
9696/13/M/J/16 · 100 marks · ≈113 min
The question paper and its mark scheme, free to read here and free to download. This is Cambridge’s own paper, exactly as it was sat.
Question paper8 pages



Mark scheme18 pages
Answers below. Sit the paper first if you are practising.
Paper as text
Question paper, page 1
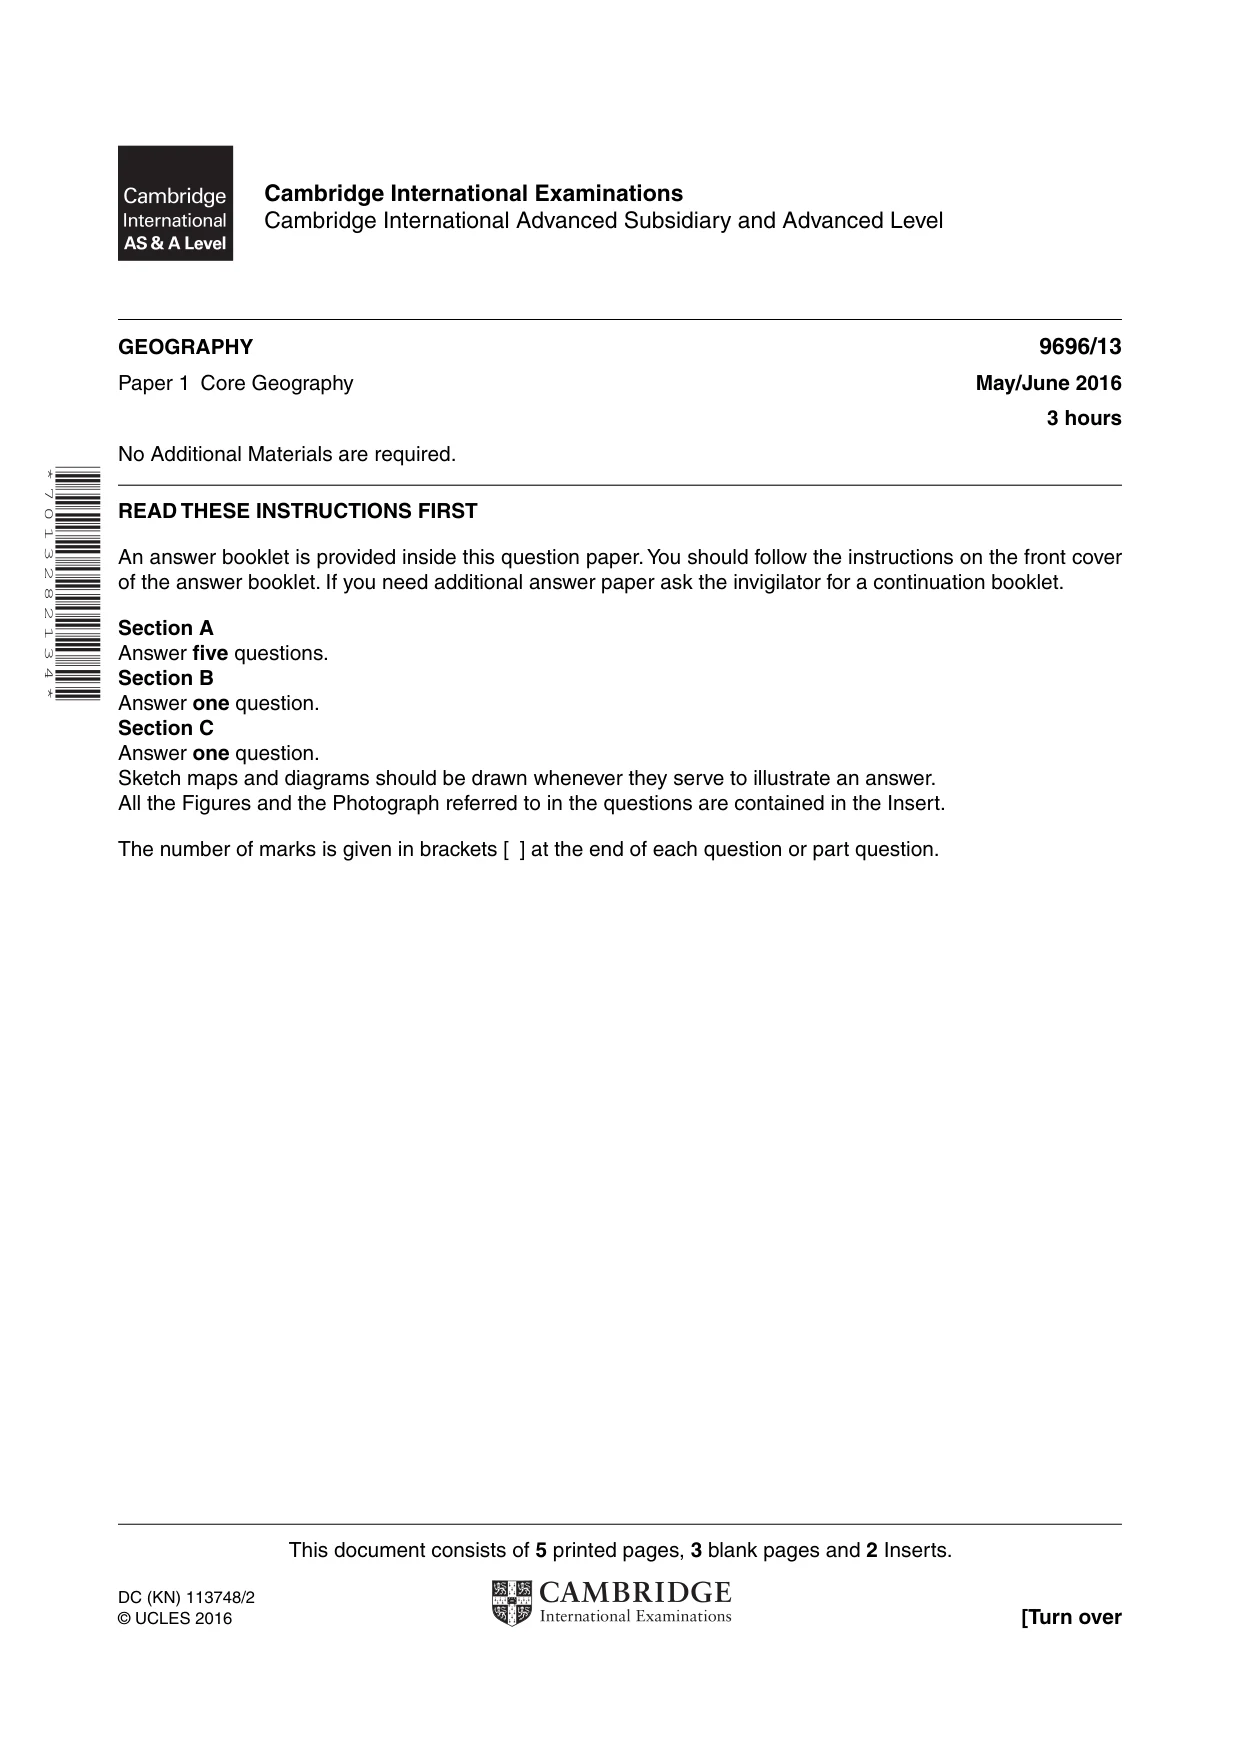
This document consists of 5 printed pages, 3 blank pages and 2 Inserts. DC (KN) 113748/2 © UCLES 2016 [Turn over Cambridge International Examinations Cambridge International Advanced Subsidiary and Advanced Level * 7 0 1 3 2 8 2 1 3 4 * GEOGRAPHY 9696/13 Paper 1 Core Geography May/June 2016 3 hours No Additional Materials are required. READ THESE INSTRUCTIONS FIRST An answer booklet is provided inside this question paper. You should follow the instructions on the front cover of the answer booklet. If you need additional answer paper ask the invigilator for a continuation booklet. Section A Answer five questions. Section B Answer one question. Section C Answer one question. Sketch maps and diagrams should be drawn whenever they serve to illustrate an answer. All the Figures and the Photograph referred to in the questions are contained in the Insert. The number of marks is given in brackets [ ] at the end of each question or part question.
Question paper, page 2
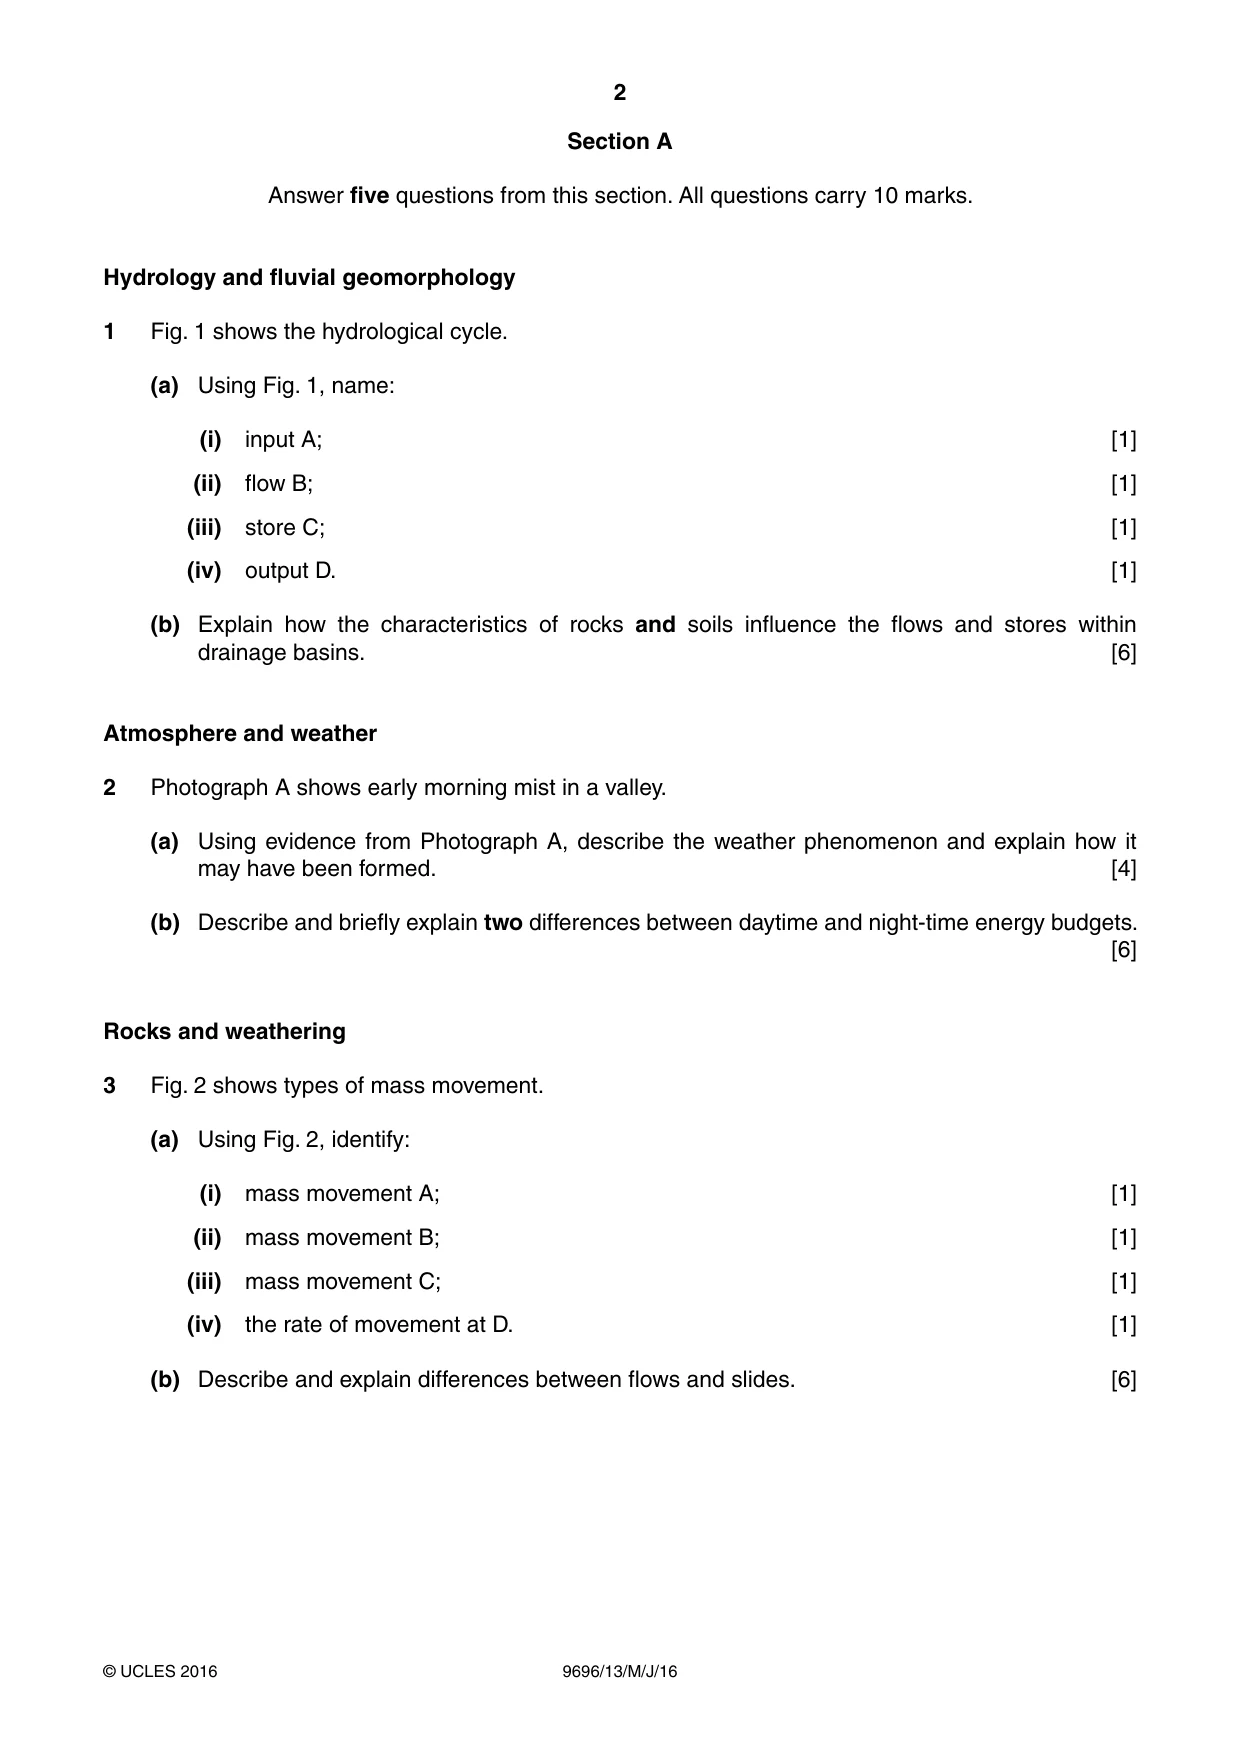
2 9696/13/M/J/16 © UCLES 2016 Section A Answer five questions from this section. All questions carry 10 marks. Hydrology and fluvial geomorphology 1 Fig. 1 shows the hydrological cycle. (a) Using Fig. 1, name: (i) input A; [1] (ii) flow B; [1] (iii) store C; [1] (iv) output D. [1] (b) Explain how the characteristics of rocks and soils influence the flows and stores within drainage basins. [6] Atmosphere and weather 2 Photograph A shows early morning mist in a valley. (a) Using evidence from Photograph A, describe the weather phenomenon and explain how it may have been formed. [4] (b) Describe and briefly explain two differences between daytime and night-time energy budgets. [6] Rocks and weathering 3 Fig. 2 shows types of mass movement. (a) Using Fig. 2, identify: (i) mass movement A; [1] (ii) mass movement B; [1] (iii) mass movement C; [1] (iv) the rate of movement at D. [1] (b) Describe and explain differences between flows and slides. [6]
Question paper, page 3
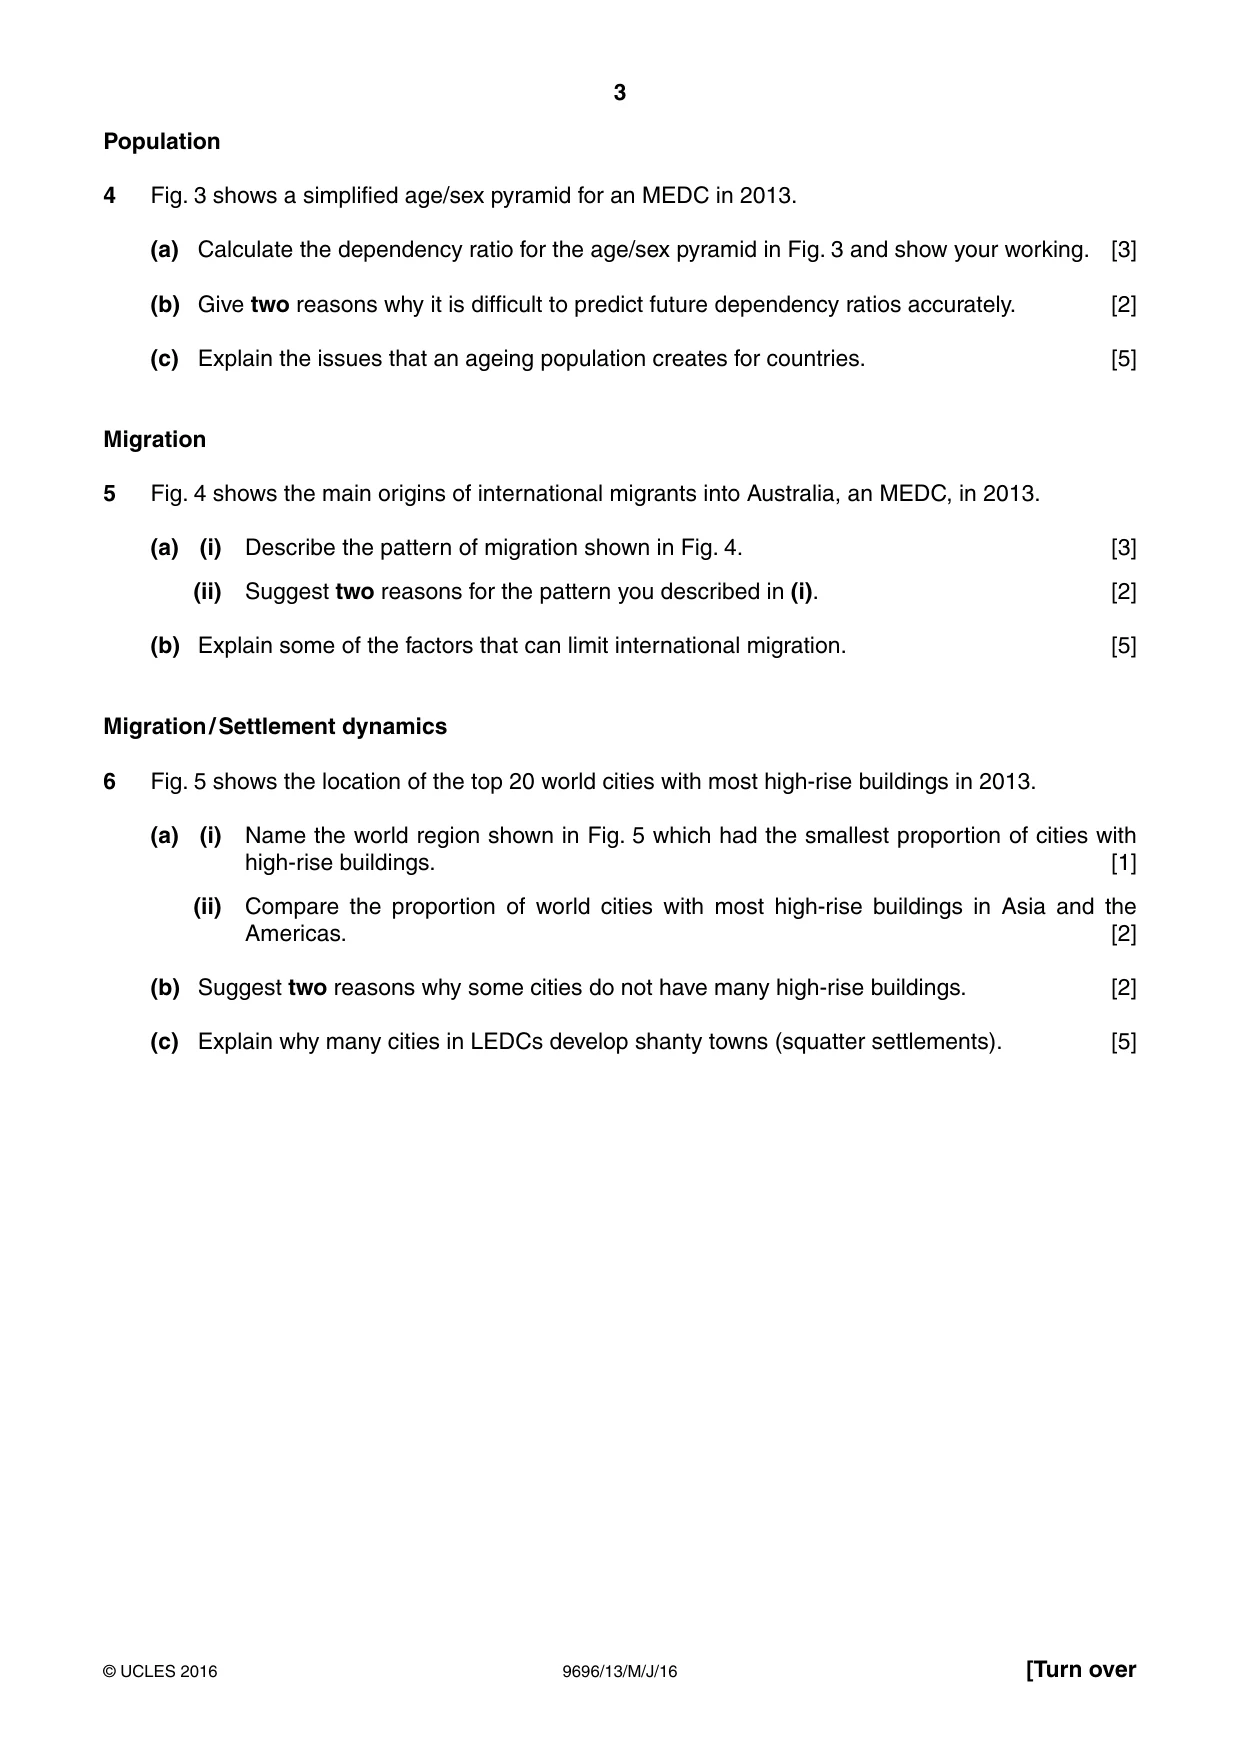
3 9696/13/M/J/16 © UCLES 2016 [Turn over Population 4 Fig. 3 shows a simplified age/sex pyramid for an MEDC in 2013. (a) Calculate the dependency ratio for the age/sex pyramid in Fig. 3 and show your working. [3] (b) Give two reasons why it is difficult to predict future dependency ratios accurately. [2] (c) Explain the issues that an ageing population creates for countries. [5] Migration 5 Fig. 4 shows the main origins of international migrants into Australia, an MEDC, in 2013. (a) (i) Describe the pattern of migration shown in Fig. 4. [3] (ii) Suggest two reasons for the pattern you described in (i). [2] (b) Explain some of the factors that can limit international migration. [5] Migration / Settlement dynamics 6 Fig. 5 shows the location of the top 20 world cities with most high-rise buildings in 2013. (a) (i) Name the world region shown in Fig. 5 which had the smallest proportion of cities with high-rise buildings. [1] (ii) Compare the proportion of world cities with most high-rise buildings in Asia and the Americas. [2] (b) Suggest two reasons why some cities do not have many high-rise buildings. [2] (c) Explain why many cities in LEDCs develop shanty towns (squatter settlements). [5]
Question paper, page 4
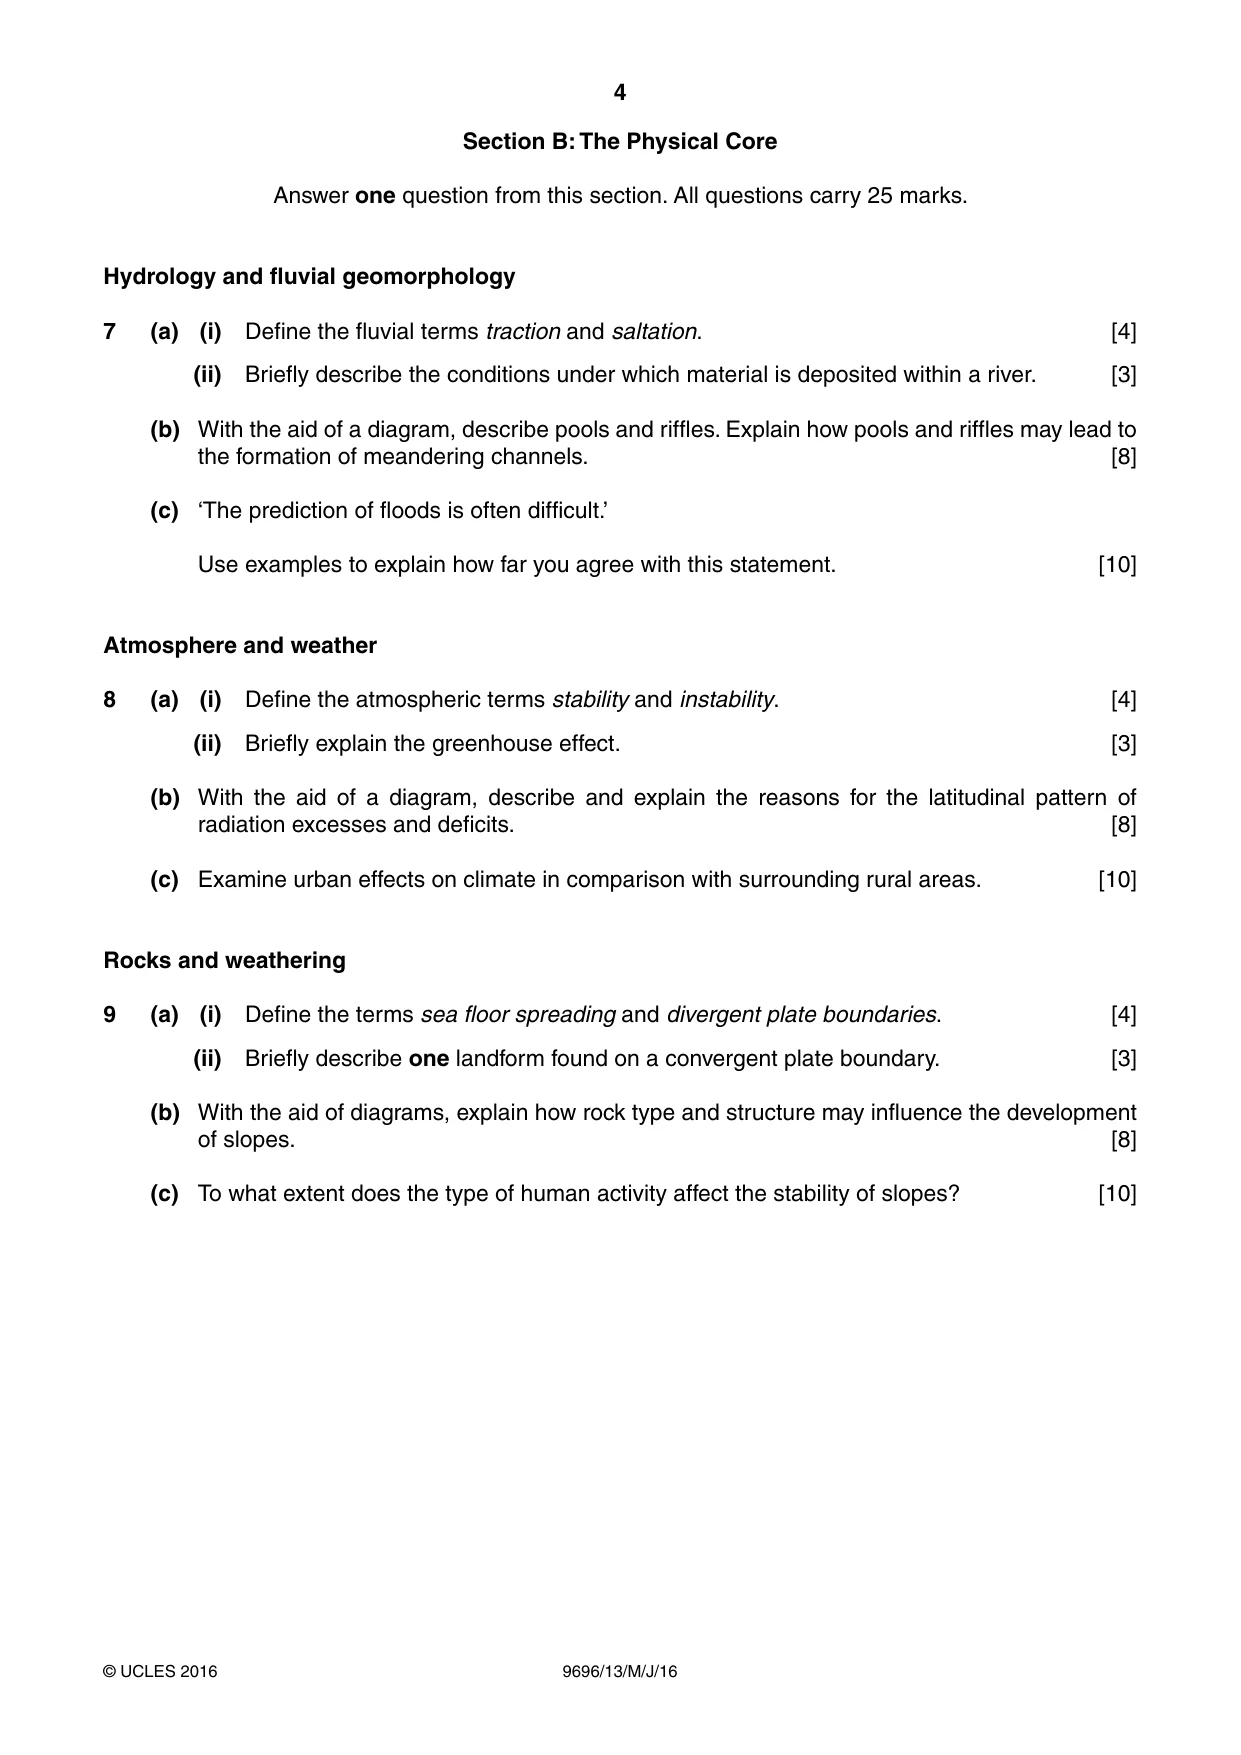
4 9696/13/M/J/16 © UCLES 2016 Section B: The Physical Core Answer one question from this section. All questions carry 25 marks. Hydrology and fluvial geomorphology 7 (a) (i) Define the fluvial terms traction and saltation. [4] (ii) Briefly describe the conditions under which material is deposited within a river. [3] (b) With the aid of a diagram, describe pools and riffles. Explain how pools and riffles may lead to the formation of meandering channels. [8] (c) ‘The prediction of floods is often difficult.’ Use examples to explain how far you agree with this statement. [10] Atmosphere and weather 8 (a) (i) Define the atmospheric terms stability and instability. [4] (ii) Briefly explain the greenhouse effect. [3] (b) With the aid of a diagram, describe and explain the reasons for the latitudinal pattern of radiation excesses and deficits. [8] (c) Examine urban effects on climate in comparison with surrounding rural areas. [10] Rocks and weathering 9 (a) (i) Define the terms sea floor spreading and divergent plate boundaries. [4] (ii) Briefly describe one landform found on a convergent plate boundary. [3] (b) With the aid of diagrams, explain how rock type and structure may influence the development of slopes. [8] (c) To what extent does the type of human activity affect the stability of slopes? [10]
Question paper, page 5
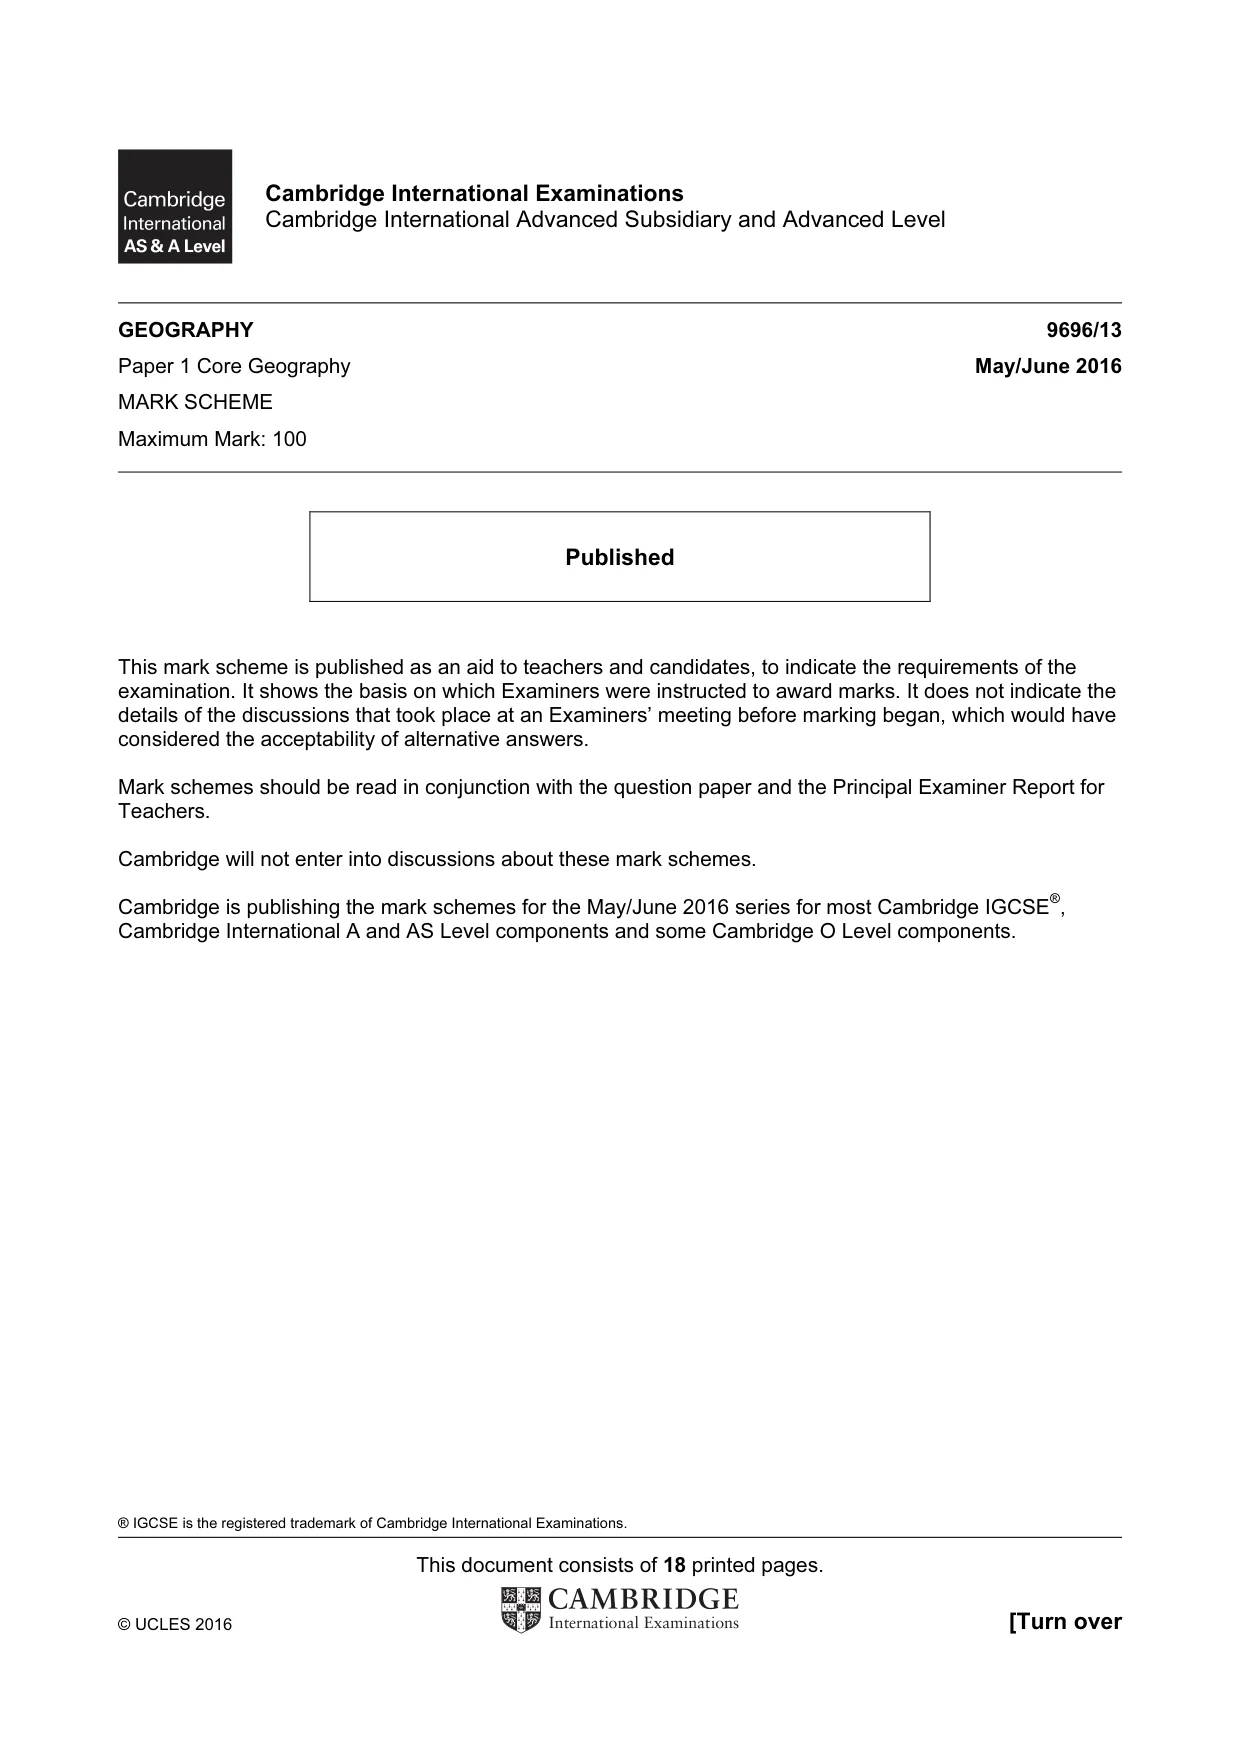
5 9696/13/M/J/16 © UCLES 2016 Section C: The Human Core Answer one question from this section. All questions carry 25 marks. Population 10 (a) (i) Define the term optimum population. [3] (ii) Suggest two pieces of evidence that show a rural area is underpopulated. [4] (b) Using examples, explain how overpopulation may occur. [8] (c) ‘Economic development is the only way to reduce overpopulation.’ To what extent do you agree? [10] Population / Migration 11 (a) (i) Define the term internal migration. [3] (ii) Outline the role of economic factors in internal migration. [4] (b) Explain why governments of LEDCs may wish to control internal migration. [8] (c) Assess the role of environmental factors in the volume and direction of refugee flows. [10] Settlement dynamics 12 (a) (i) Give the meaning of the term CBD. [2] (ii) Describe the main characteristics of CBDs. [5] (b) Explain why activities are moving out of the CBD in many cities. [8] (c) Assess the role of government planning in the location of activities within urban areas. [10]
Question paper, page 6
6 9696/13/M/J/16 © UCLES 2016 BLANK PAGE
Question paper, page 7
7 9696/13/M/J/16 © UCLES 2016 BLANK PAGE
Question paper, page 8
8 9696/13/M/J/16 © UCLES 2016 BLANK PAGE Permission to reproduce items where third-party owned material protected by copyright is included has been sought and cleared where possible. Every reasonable effort has been made by the publisher (UCLES) to trace copyright holders, but if any items requiring clearance have unwittingly been included, the publisher will be pleased to make amends at the earliest possible opportunity. To avoid the issue of disclosure of answer-related information to candidates, all copyright acknowledgements are reproduced online in the Cambridge International Examinations Copyright Acknowledgements Booklet. This is produced for each series of examinations and is freely available to download at www.cie.org.uk after the live examination series. Cambridge International Examinations is part of the Cambridge Assessment Group. Cambridge Assessment is the brand name of University of Cambridge Local Examinations Syndicate (UCLES), which is itself a department of the University of Cambridge.
Mark scheme, page 1
® IGCSE is the registered trademark of Cambridge International Examinations. This document consists of 18 printed pages. © UCLES 2016 [Turn over Cambridge International Examinations Cambridge International Advanced Subsidiary and Advanced Level GEOGRAPHY 9696/13 Paper 1 Core Geography May/June 2016 MARK SCHEME Maximum Mark: 100 Published This mark scheme is published as an aid to teachers and candidates, to indicate the requirements of the examination. It shows the basis on which Examiners were instructed to award marks. It does not indicate the details of the discussions that took place at an Examiners’ meeting before marking began, which would have considered the acceptability of alternative answers. Mark schemes should be read in conjunction with the question paper and the Principal Examiner Report for Teachers. Cambridge will not enter into discussions about these mark schemes. Cambridge is publishing the mark schemes for the May/June 2016 series for most Cambridge IGCSE®, Cambridge International A and AS Level components and some Cambridge O Level components.
Mark scheme, page 2
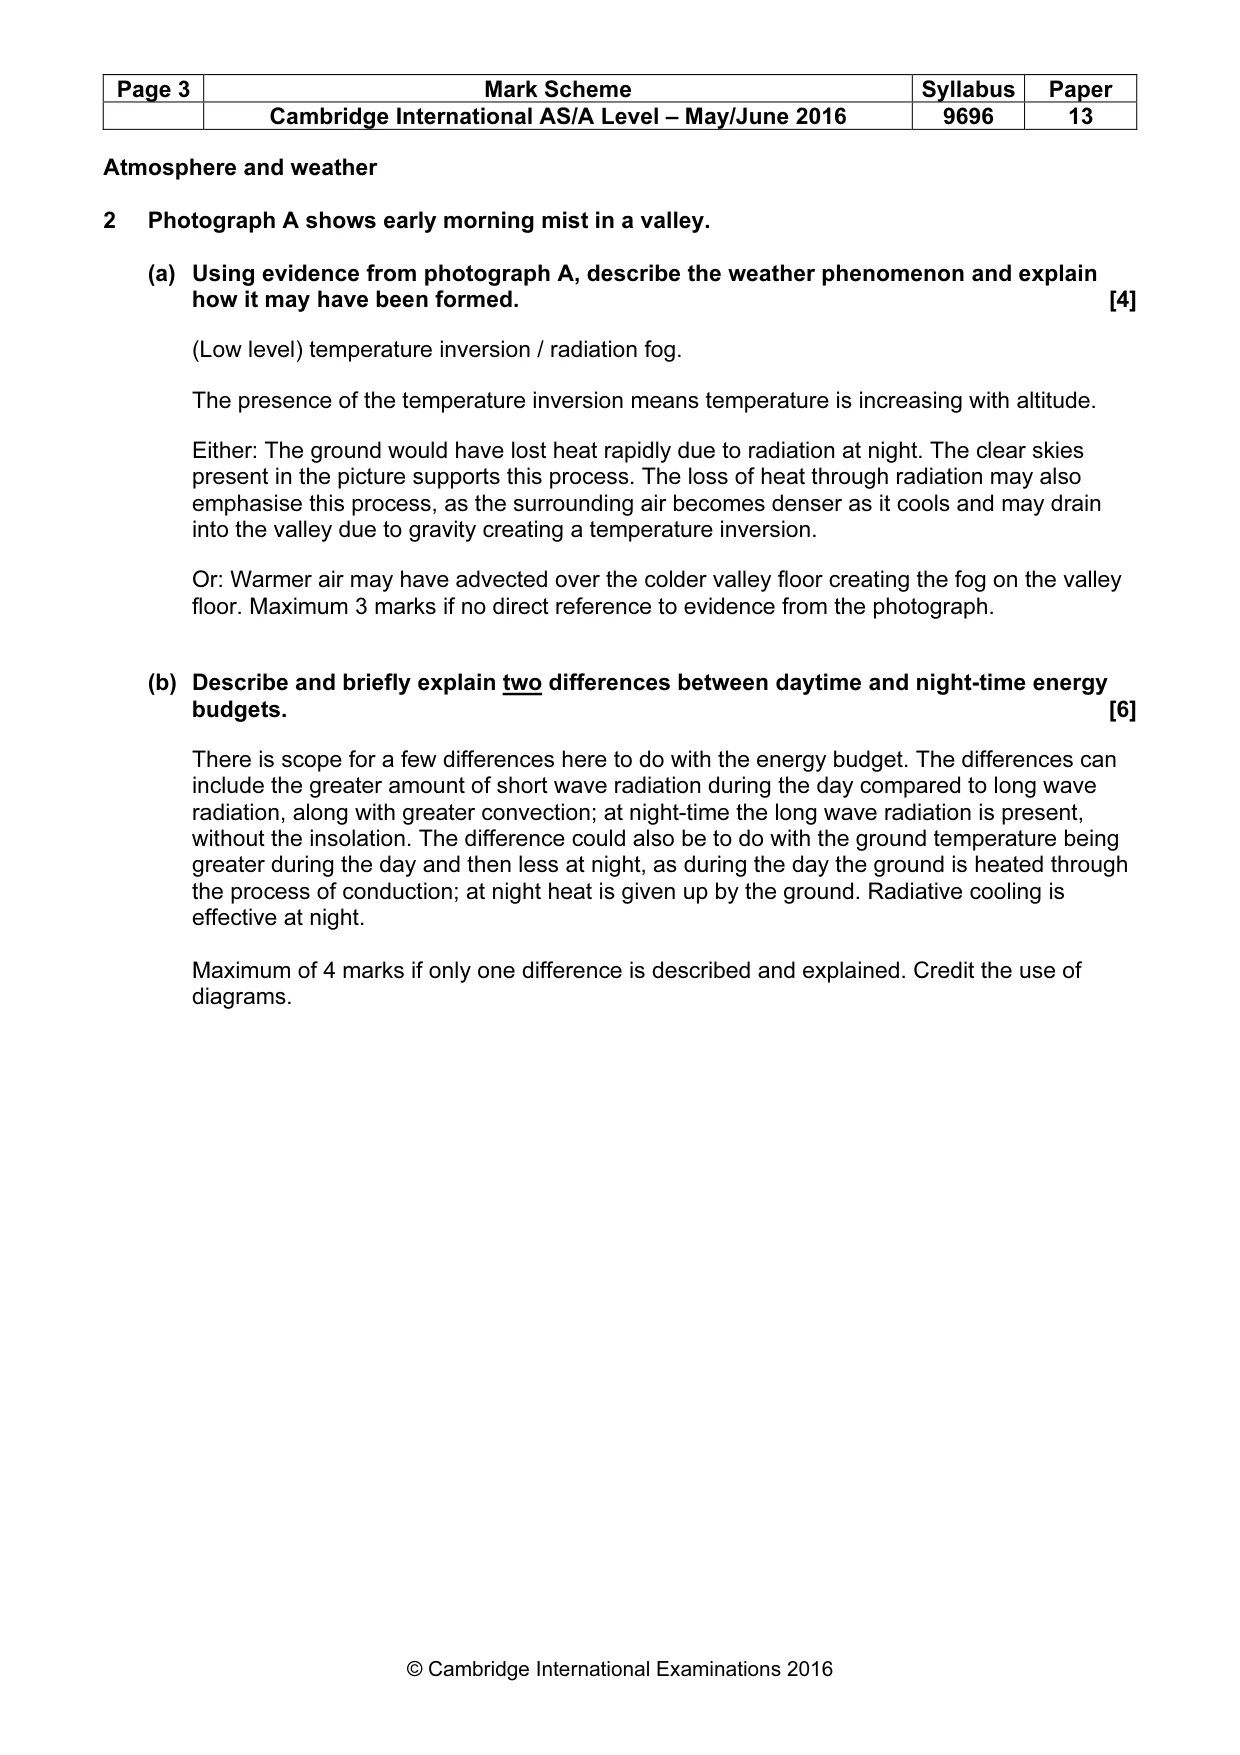
Page 2 Mark Scheme Syllabus Paper Cambridge International AS/A Level – May/June 2016 9696 13 © Cambridge International Examinations 2016 Section A Answer five questions from this section. All questions carry 10 marks. Hydrology and fluvial geomorphology 1 Fig. 1 shows the hydrological cycle. (a) Using Fig. 1, name: (i) input A; Precipitation [1] (ii) flow B; Groundwater flow / base flow [1] (iii) store C; Surface storage / lake / reservoir [1] (iv) output D. Evapotranspiration [1] (b) Explain how the characteristics of rocks and soils influence the flows and stores within drainage basins. [6] Explanations could include how the properties of different rock types result in different stores and flows after the same rainfall event. For example, more permeable rock, such as granite, means that there would be less through flow and groundwater flow, because there is less percolation. The less porous the rock or soil, the less storage of water there is. Maximum 4 marks if only rocks or soils are discussed.
Mark scheme, page 3
Page 3 Mark Scheme Syllabus Paper Cambridge International AS/A Level – May/June 2016 9696 13 © Cambridge International Examinations 2016 Atmosphere and weather 2 Photograph A shows early morning mist in a valley. (a) Using evidence from photograph A, describe the weather phenomenon and explain how it may have been formed. [4] (Low level) temperature inversion / radiation fog. The presence of the temperature inversion means temperature is increasing with altitude. Either: The ground would have lost heat rapidly due to radiation at night. The clear skies present in the picture supports this process. The loss of heat through radiation may also emphasise this process, as the surrounding air becomes denser as it cools and may drain into the valley due to gravity creating a temperature inversion. Or: Warmer air may have advected over the colder valley floor creating the fog on the valley floor. Maximum 3 marks if no direct reference to evidence from the photograph. (b) Describe and briefly explain two differences between daytime and night-time energy budgets. [6] There is scope for a few differences here to do with the energy budget. The differences can include the greater amount of short wave radiation during the day compared to long wave radiation, along with greater convection; at night-time the long wave radiation is present, without the insolation. The difference could also be to do with the ground temperature being greater during the day and then less at night, as during the day the ground is heated through the process of conduction; at night heat is given up by the ground. Radiative cooling is effective at night. Maximum of 4 marks if only one difference is described and explained. Credit the use of diagrams.
Mark scheme, page 4
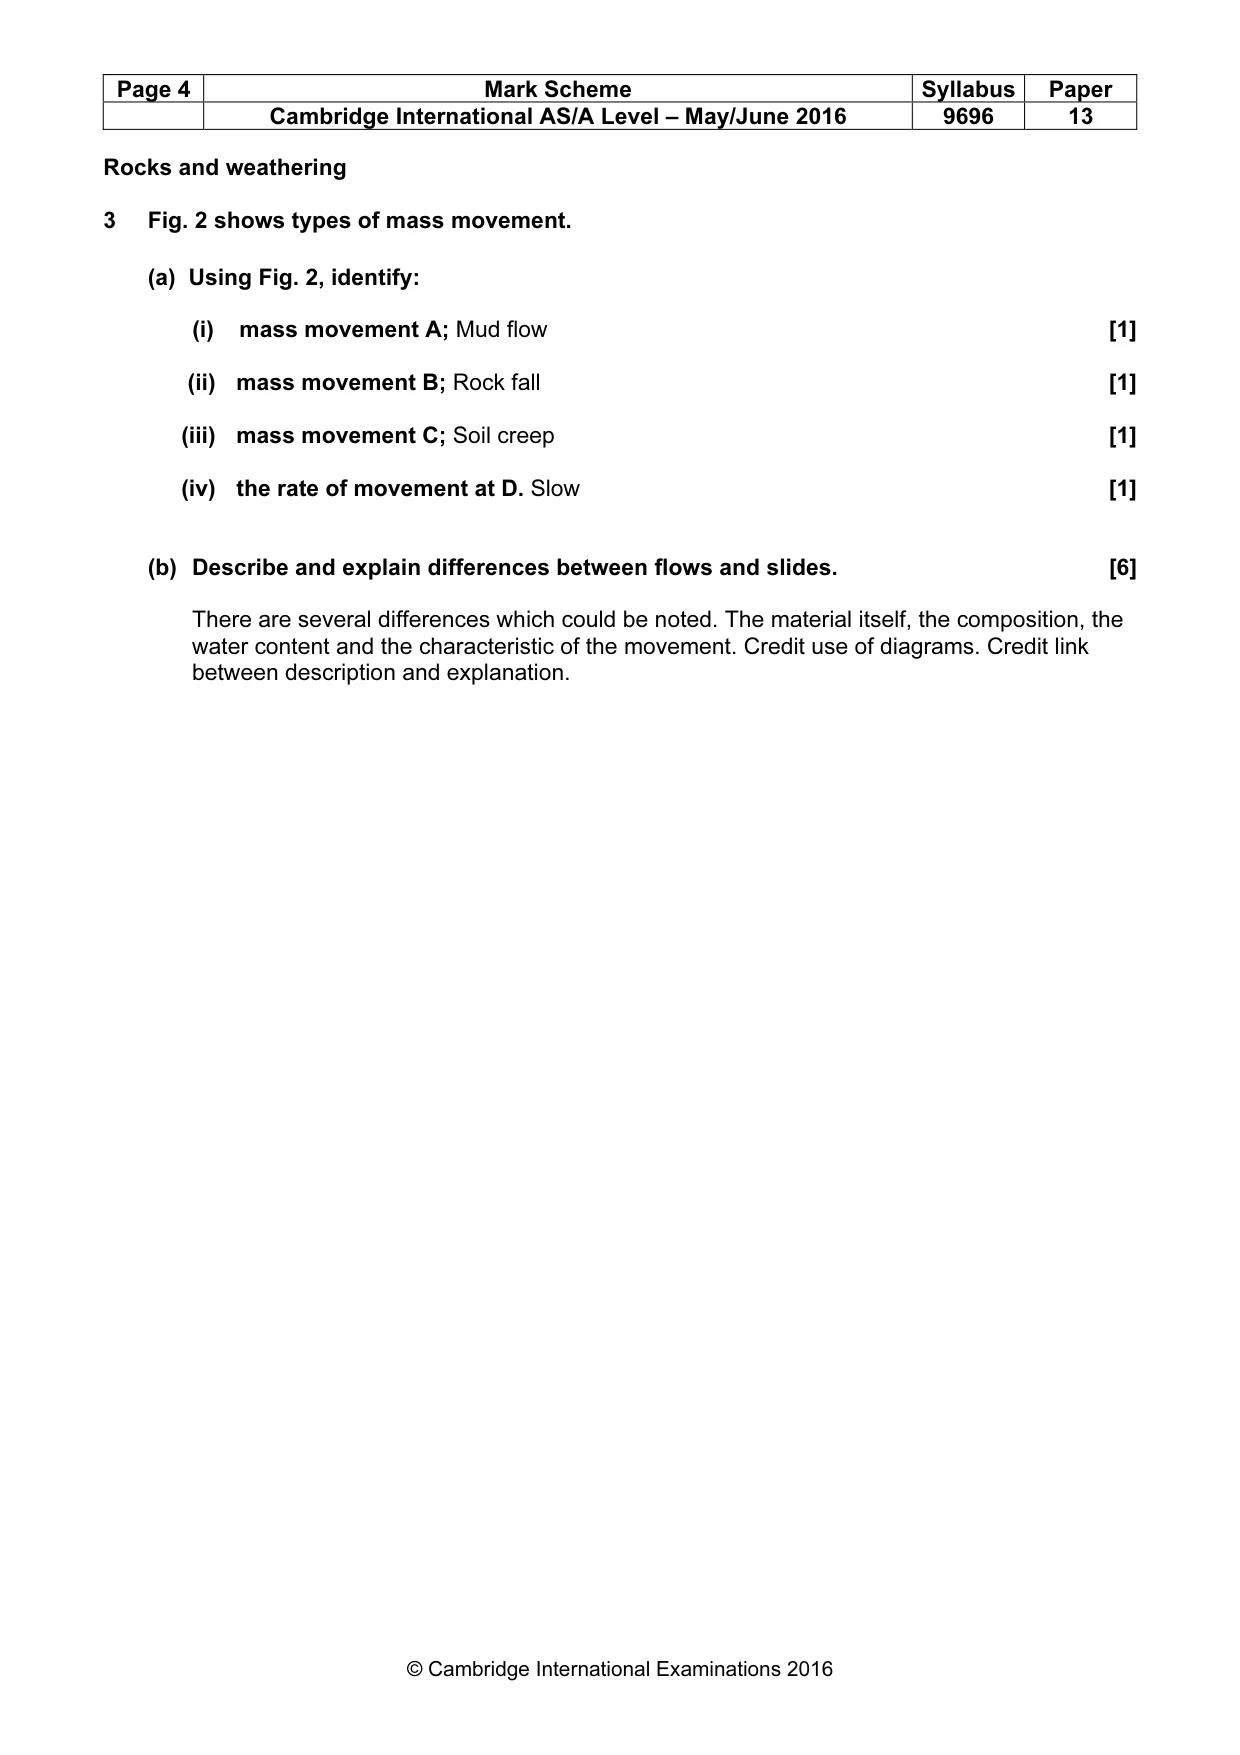
Page 4 Mark Scheme Syllabus Paper Cambridge International AS/A Level – May/June 2016 9696 13 © Cambridge International Examinations 2016 Rocks and weathering 3 Fig. 2 shows types of mass movement. (a) Using Fig. 2, identify: (i) mass movement A; Mud flow [1] (ii) mass movement B; Rock fall [1] (iii) mass movement C; Soil creep [1] (iv) the rate of movement at D. Slow [1] (b) Describe and explain differences between flows and slides. [6] There are several differences which could be noted. The material itself, the composition, the water content and the characteristic of the movement. Credit use of diagrams. Credit link between description and explanation.
Mark scheme, page 5
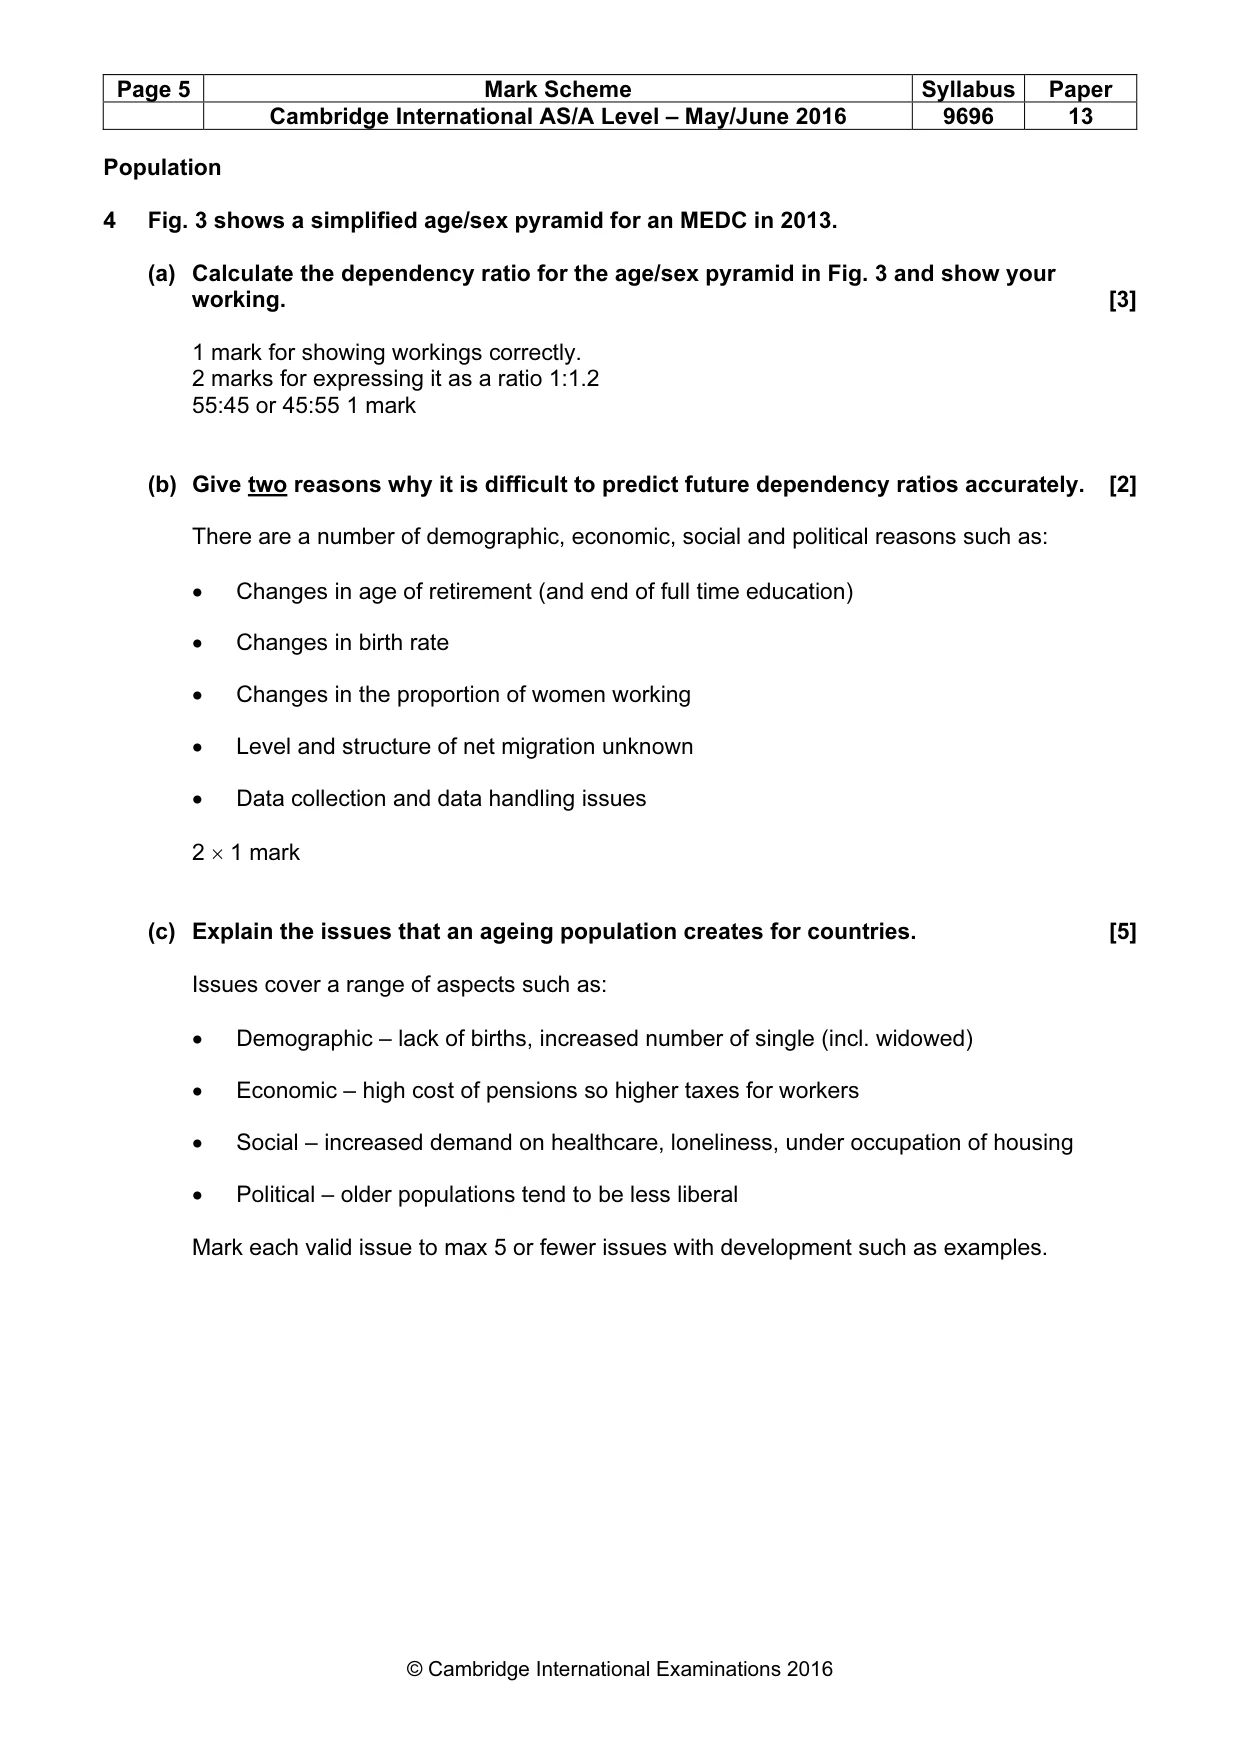
Page 5 Mark Scheme Syllabus Paper Cambridge International AS/A Level – May/June 2016 9696 13 © Cambridge International Examinations 2016 Population 4 Fig. 3 shows a simplified age/sex pyramid for an MEDC in 2013. (a) Calculate the dependency ratio for the age/sex pyramid in Fig. 3 and show your working. [3] 1 mark for showing workings correctly. 2 marks for expressing it as a ratio 1:1.2 55:45 or 45:55 1 mark (b) Give two reasons why it is difficult to predict future dependency ratios accurately. [2] There are a number of demographic, economic, social and political reasons such as: • Changes in age of retirement (and end of full time education) • Changes in birth rate • Changes in the proportion of women working • Level and structure of net migration unknown • Data collection and data handling issues 2 × 1 mark (c) Explain the issues that an ageing population creates for countries. [5] Issues cover a range of aspects such as: • Demographic – lack of births, increased number of single (incl. widowed) • Economic – high cost of pensions so higher taxes for workers • Social – increased demand on healthcare, loneliness, under occupation of housing • Political – older populations tend to be less liberal Mark each valid issue to max 5 or fewer issues with development such as examples.
Mark scheme, page 6
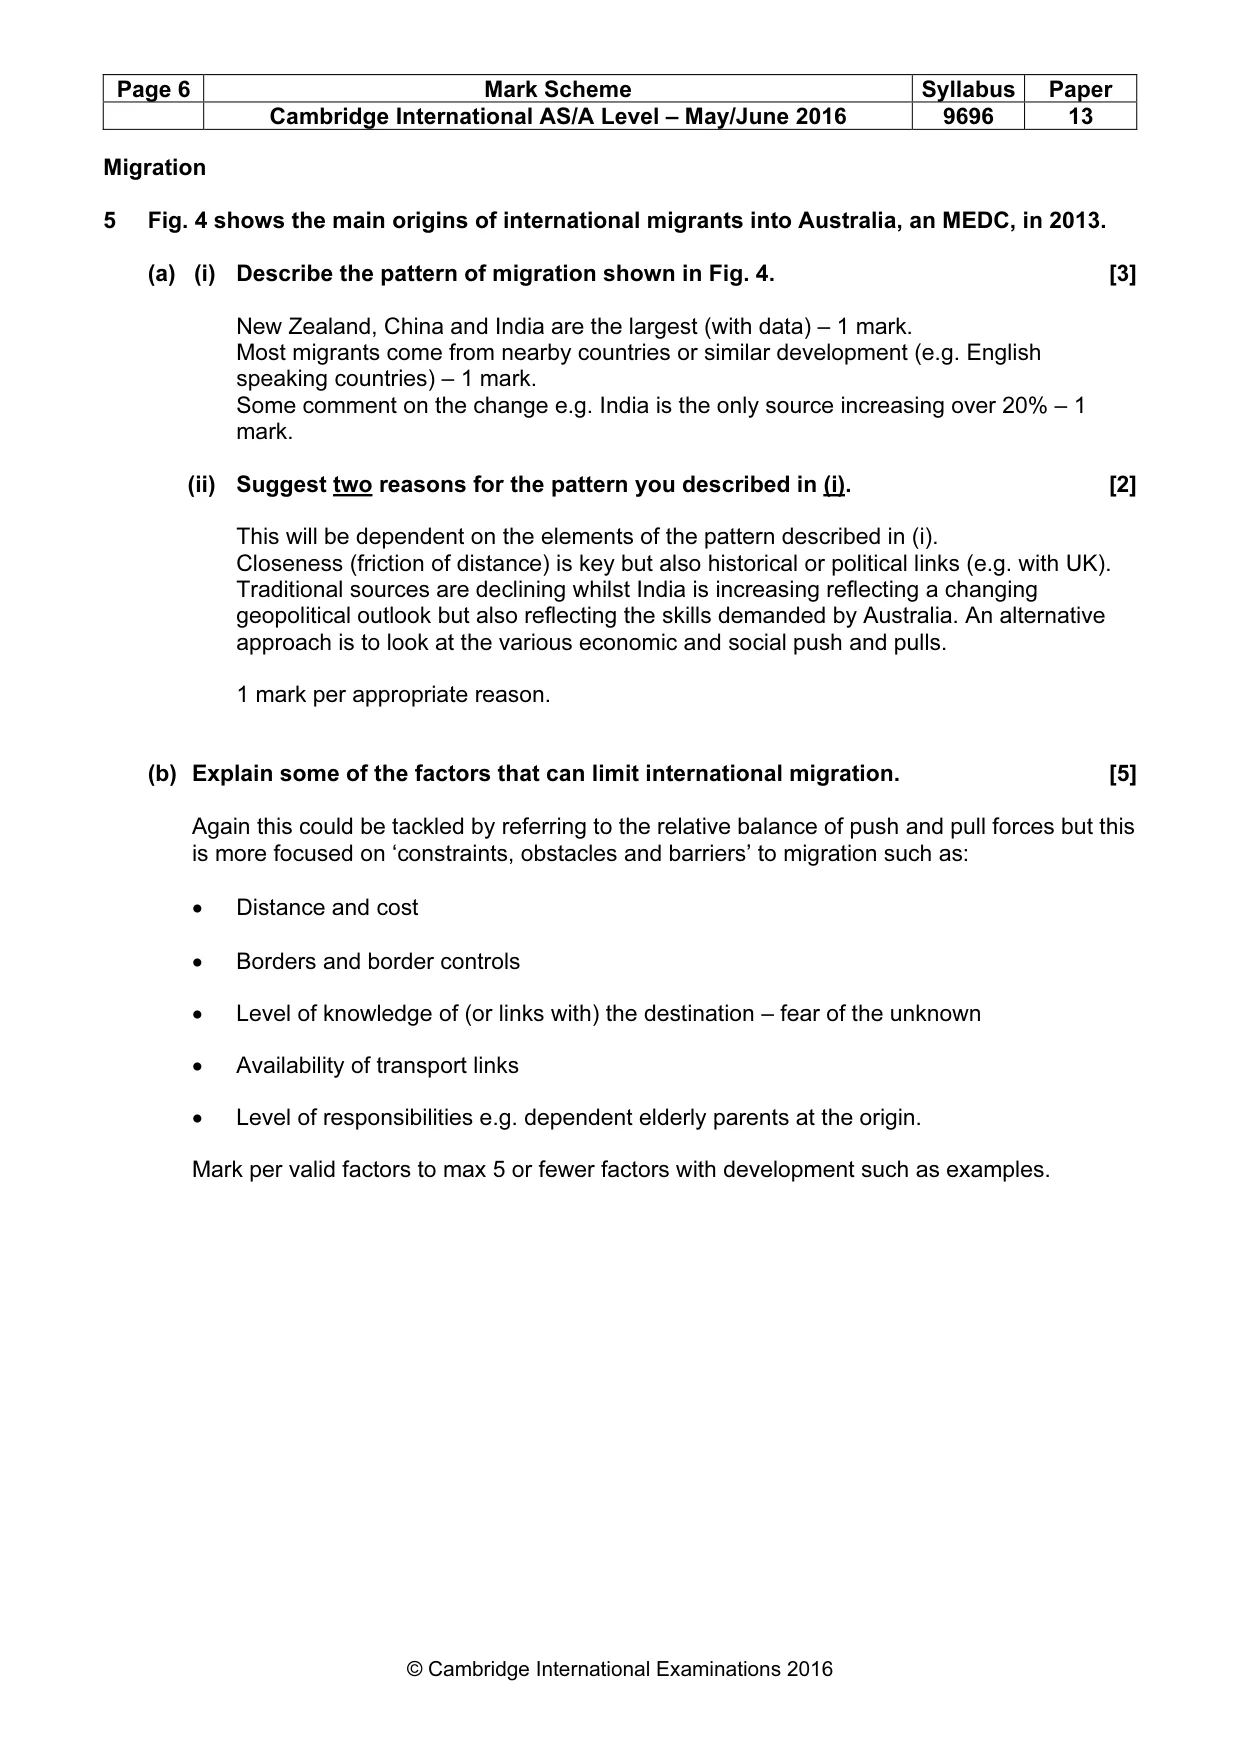
Page 6 Mark Scheme Syllabus Paper Cambridge International AS/A Level – May/June 2016 9696 13 © Cambridge International Examinations 2016 Migration 5 Fig. 4 shows the main origins of international migrants into Australia, an MEDC, in 2013. (a) (i) Describe the pattern of migration shown in Fig. 4. [3] New Zealand, China and India are the largest (with data) – 1 mark. Most migrants come from nearby countries or similar development (e.g. English speaking countries) – 1 mark. Some comment on the change e.g. India is the only source increasing over 20% – 1 mark. (ii) Suggest two reasons for the pattern you described in (i). [2] This will be dependent on the elements of the pattern described in (i). Closeness (friction of distance) is key but also historical or political links (e.g. with UK). Traditional sources are declining whilst India is increasing reflecting a changing geopolitical outlook but also reflecting the skills demanded by Australia. An alternative approach is to look at the various economic and social push and pulls. 1 mark per appropriate reason. (b) Explain some of the factors that can limit international migration. [5] Again this could be tackled by referring to the relative balance of push and pull forces but this is more focused on ‘constraints, obstacles and barriers’ to migration such as: • Distance and cost • Borders and border controls • Level of knowledge of (or links with) the destination – fear of the unknown • Availability of transport links • Level of responsibilities e.g. dependent elderly parents at the origin. Mark per valid factors to max 5 or fewer factors with development such as examples.
Mark scheme, page 7
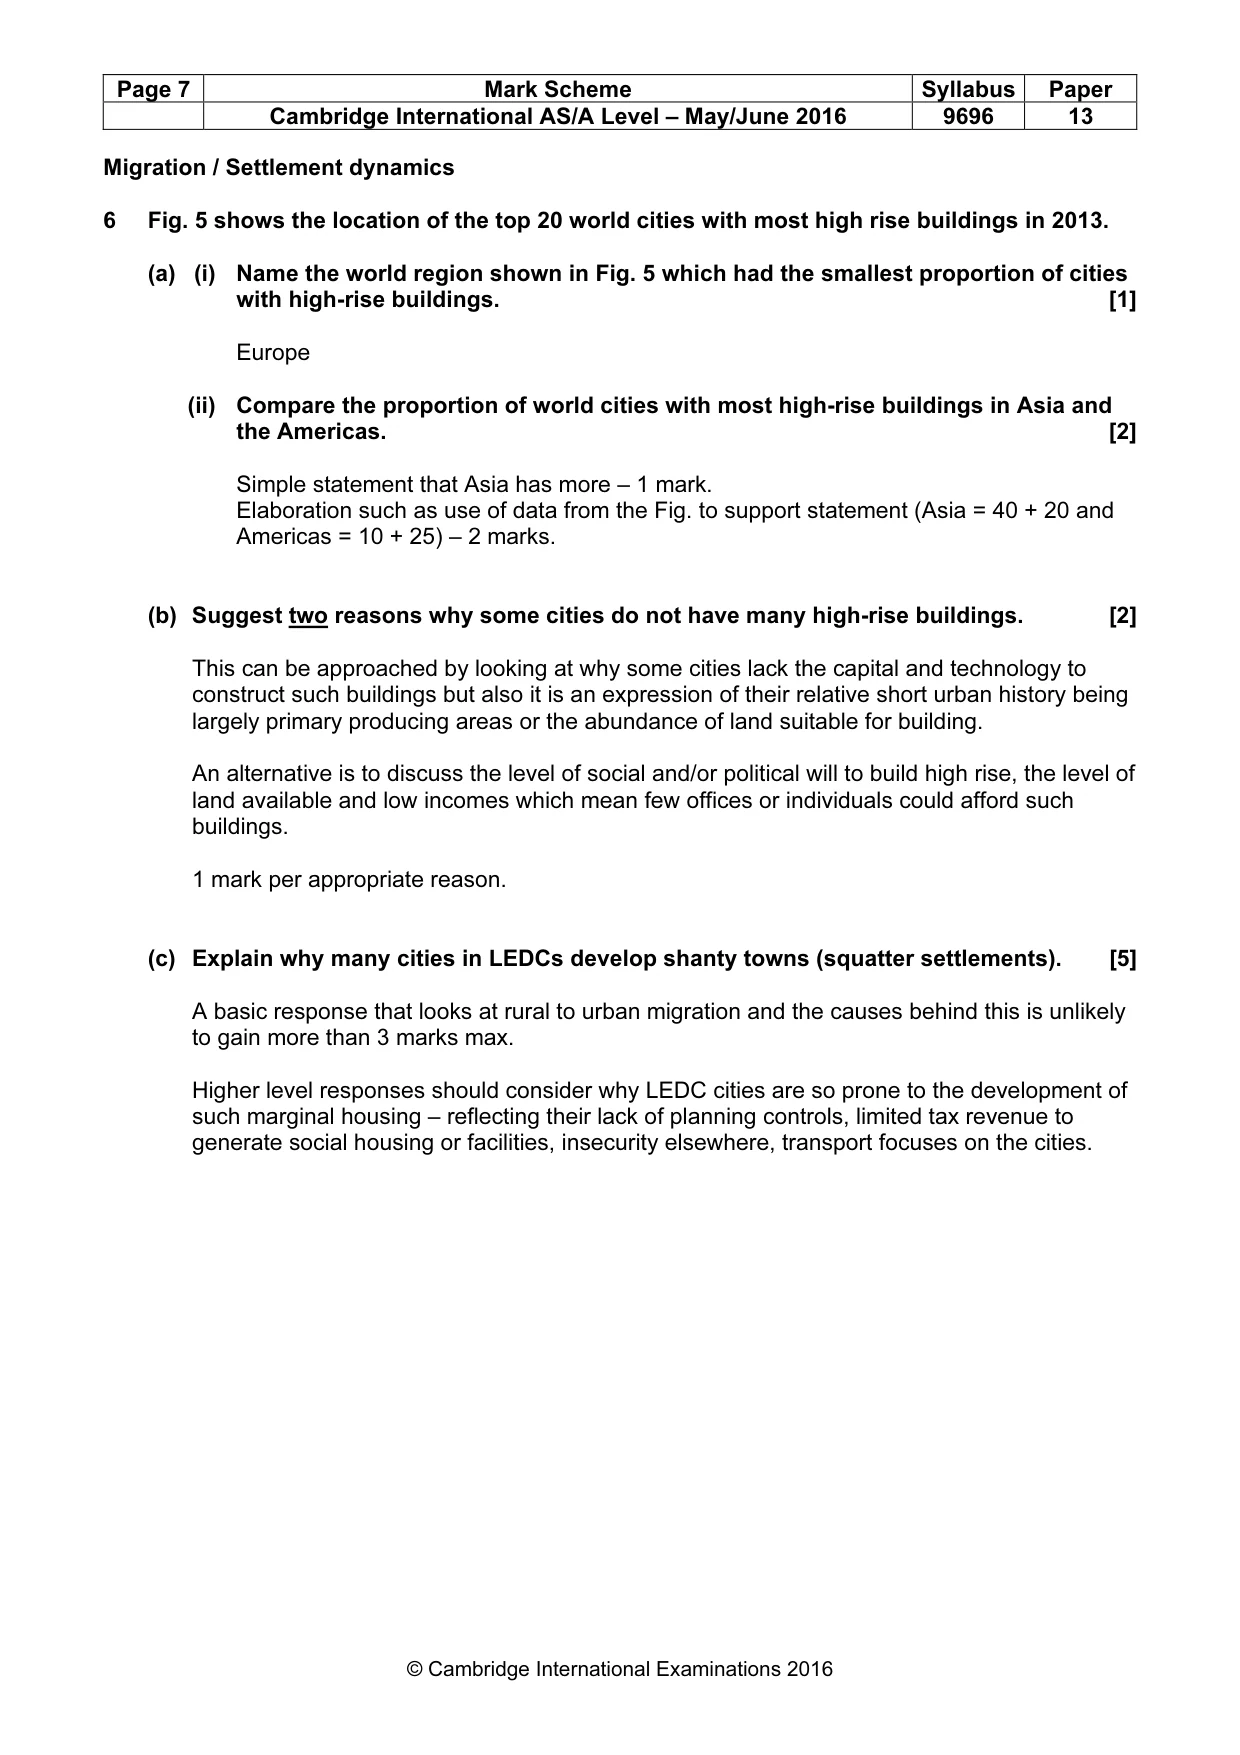
Page 7 Mark Scheme Syllabus Paper Cambridge International AS/A Level – May/June 2016 9696 13 © Cambridge International Examinations 2016 Migration / Settlement dynamics 6 Fig. 5 shows the location of the top 20 world cities with most high rise buildings in 2013. (a) (i) Name the world region shown in Fig. 5 which had the smallest proportion of cities with high-rise buildings. [1] Europe (ii) Compare the proportion of world cities with most high-rise buildings in Asia and the Americas. [2] Simple statement that Asia has more – 1 mark. Elaboration such as use of data from the Fig. to support statement (Asia = 40 + 20 and Americas = 10 + 25) – 2 marks. (b) Suggest two reasons why some cities do not have many high-rise buildings. [2] This can be approached by looking at why some cities lack the capital and technology to construct such buildings but also it is an expression of their relative short urban history being largely primary producing areas or the abundance of land suitable for building. An alternative is to discuss the level of social and/or political will to build high rise, the level of land available and low incomes which mean few offices or individuals could afford such buildings. 1 mark per appropriate reason. (c) Explain why many cities in LEDCs develop shanty towns (squatter settlements). [5] A basic response that looks at rural to urban migration and the causes behind this is unlikely to gain more than 3 marks max. Higher level responses should consider why LEDC cities are so prone to the development of such marginal housing – reflecting their lack of planning controls, limited tax revenue to generate social housing or facilities, insecurity elsewhere, transport focuses on the cities.
Mark scheme, page 8
Page 8 Mark Scheme Syllabus Paper Cambridge International AS/A Level – May/June 2016 9696 13 © Cambridge International Examinations 2016 Section B: The Physical Core Answer one question from this section. All questions carry 25 marks. Hydrology and fluvial geomorphology 7 (a) (i) Define the fluvial terms traction and saltation. [4] Traction is the rolling of coarse sediment along the river bed. Saltation is the bouncing of sediment along the banks of the river. (ii) Briefly describe the conditions under which material is deposited within a river. [3] A decline in the velocity of the river means that there is less energy. This reduction of energy reduces the river’s competence and therefore it is not able to carry its load. The river therefore deposits its load, starting with the particles of the greatest mass. (b) With the aid of a diagram, describe pools and riffles. Explain how pools and riffles may lead to the formation of meandering channels. [8] A diagram showing the pool riffle sequence would be appropriate, with the alternating sequence of pools and riffles. The explanation includes the depth of the water (pools being an area of deeper water, and thus where energy builds up because of the reduced friction). Reference to the spacing can also be discussed. Maximum 5 marks without a diagram.
Mark scheme, page 9
Page 9 Mark Scheme Syllabus Paper Cambridge International AS/A Level – May/June 2016 9696 13 © Cambridge International Examinations 2016 (c) ‘The prediction of floods is often difficult.’ Use examples to explain how far you agree with this statement. [10] The candidate has the opportunity to discuss the prediction of floods and then the link between the prediction and the occurrence. Prediction may include discussions on timing, location and severity. Prediction also includes the understanding of the characteristics of the drainage basin in response to a predicted rainfall event. The candidate needs to present an awareness that flood prediction is not precise and only predicts the probability of a flood. Even if the flood itself is predicted, there may be little predicted about the full extent of it. Level 3 A detailed and well balanced answer that looks at both the prediction of floods and the occurrence. The uncertainty of prediction is clear. The argument may be supported through examples and there is a clear evaluation. [8–10] Level 2 A reasonable attempt to look at the nature of prediction and the occurrence of floods. Lacks balance and limited evaluation. [5–7] Level 1 A basic answer with little attempt to present flood prediction and occurrence. The evaluation is limited or not present. Lists and basic description lie here. [1–4] For no response, or no creditable response, 0.
Mark scheme, page 10
Page 10 Mark Scheme Syllabus Paper Cambridge International AS/A Level – May/June 2016 9696 13 © Cambridge International Examinations 2016 Atmosphere and weather 8 (a) (i) Define the atmospheric terms stability and instability. [4] This could be answered through the lapse rates graphs. Stability is when the rising parcel of air is cooling more quickly than the surrounding air (i.e. the parcel of air has a higher lapse rate). Instability is when the rising air is cooling more slowly than the surrounding air (i.e. the parcel of air has a slower lapse rate than the surrounding air). (ii) Briefly explain the greenhouse effect. [3] This is a natural effect when the short wave radiation passes through the Earth’s atmosphere, but when re-radiated from the Earth’s surface in the form of long wave radiation some of it is trapped and re-radiated downwards resulting in surface warming. Credit the use of a diagram. (b) With the aid of a diagram, describe and explain the reasons for the latitudinal pattern of radiation excesses and deficits. [8] The general pattern in the radiation deficit is in the polar latitudes and there is radiation excess elsewhere. The angle and strength of the insolation from the sun contributes to the area of surplus, whilst the high albedo and lack of insolation at the poles during several months each year contribute to the radiation deficit. Maximum 5 marks with no diagram. (c) Examine urban effects on climate in comparison with surrounding rural areas. [10] A discussion of the key influence an urban area has on its climate can be presented. Reference to temperature, humidity, wind speed and precipitation can all be made. The discussion needs to include how these aspects are different or similar to surrounding rural areas. The highest quality answers may conclude with the extent of this influence and perhaps look at other influences on a climate or suggest how urban areas could be designed to reduce this influence. Level 3 A detailed and well balanced answer that looks at a wide range of factors and may examine which aspects have lesser or greater influence. [8–10] Level 2 A reasonable attempt to look at the way an urban area may influence its climate. May lack discussion of the amount of influence. [5–7] Level 1 A basic answer with little attempt to suggest the degree of influence. Lists and basic description lie here. [1–4] For no response, or no creditable response, 0.
Mark scheme, page 11
Page 11 Mark Scheme Syllabus Paper Cambridge International AS/A Level – May/June 2016 9696 13 © Cambridge International Examinations 2016 Rocks and weathering 9 (a) (i) Define the terms sea floor spreading and divergent plate boundaries. [4] Sea floor spreading is where two plates move away from each other and new lithosphere is created. Divergent plate boundaries are where two plates move away from each other. (ii) Briefly describe one landform found on a convergent plate boundary. [3] The description may be in the form of a diagram. Key features need to be identified. A brief account of the landform is sufficient. No credit for landforms which are not found on convergent plate boundaries. (b) With the aid of diagrams, explain how rock type and structure may influence the development of slopes. [8] A series of diagrams would be appropriate here, showing how the angle of the bedding planes or joints affects the development of a slope. Reference to specific rock types, namely granite or limestone, would enhance the answer when discussing how rock type affects the development of a slope. The better answers would be specific with detail and examples. Weaker answers would be vague about which type of rock or the specific structures. Maximum of 5 marks with no diagram.
Mark scheme, page 12
Page 12 Mark Scheme Syllabus Paper Cambridge International AS/A Level – May/June 2016 9696 13 © Cambridge International Examinations 2016 (c) To what extent does the type of human activity affect the stability of slopes? [10] The discussion needs to relate to the type of human activity and not just human activity in general. Quarrying, mining and dumping material on the Earth’s surface all contribute to the stability of a slope in different ways, and so candidates need to look at how different types of activity affect the stability of the slope. A concluding point may be that it is not just human activity which affects the stability of the slope, or that it may be an indirect consequence of other human activity. The candidate may be aware that human activity could also increase the stability of a slope. Level 3 A detailed and well balanced answer that looks at the type of the activity and the effect on the stability of the slope. The argument may be supported through examples and there is a clear evaluation. [8–10] Level 2 A reasonable attempt to look at the relationship between type of activity and stability of slope. Lacks balance and limited evaluation. [5–7] Level 1 A basic answer with human activity presented in a generalised way with little attempt to present detail. The evaluation is limited or not present. Lists and basic description lie here. [1–4] For no response, or no creditable response, 0.
Mark scheme, page 13
Page 13 Mark Scheme Syllabus Paper Cambridge International AS/A Level – May/June 2016 9696 13 © Cambridge International Examinations 2016 Section C: The Human Core Answer one question from this section. All questions carry 25 marks. Population 10 (a) (i) Define the term optimum population. [3] Optimum population is when the population is at a level that produces the highest standard of living or maximum quality of life – 2 marks. Extra mark for linking it to resources such as – the population is such that it can maximise the benefits from the resources available. (ii) Suggest two pieces of evidence that show a rural area is underpopulated. [4] Underpopulated means the rural area has insufficient population to use the resources of the area efficiently so evidence could include: • Non-optimum farming practices e.g. extensive grazing, long fallows, low productivity • Resources undeveloped or poorly developed e.g. forests, minerals • Limited service provision e.g. few schools, few shops, limited transport • Economic factors such as labour shortage (high wages), low house prices • Social factors such as lack of marriage partners 1 mark per piece of evidence with second for clear linkage to underpopulation. (b) Using examples, explain how overpopulation may occur. [8] This is when population exceeds its resource and technology base so the standard of living falls so can occur due to: • An increase in the population such as caused by net in-migration, high birth rate, falling death rate. • A contraction in or exhaustion of the resource base such as soil erosion reducing crop yields, mineral deposit mined out, deforestation, overfishing Max 5 if either of these two aspects are absent. Max 5 if no use of examples. Credit those that suggest that there may be a difference between short term (e.g. following a disaster) and long term causes or who stress the term is dynamic. Bear in mind the three bands of marks and qualities of response, 1–3, 4–6 and 7–8.
Mark scheme, page 14
Page 14 Mark Scheme Syllabus Paper Cambridge International AS/A Level – May/June 2016 9696 13 © Cambridge International Examinations 2016 (c) ‘Economic development is the only way to reduce overpopulation.’ To what extent do you agree? [10] Clearly, as overpopulation is a relative term – population v resources – then controlling the birth rate is one part of the equation. Economic development often leads to reduced birth rate as a result of the empowerment of women and less need for labour. Economic development also involves better technology which is able to provide more resources or to utilise those resources more efficiently. Candidates will probably: Level 3 Make a response from detailed knowledge and strong conceptual understanding. Have clear cause and effect link between reduction methods and overpopulation. Provide an effective assessment. Use one or more examples in detail. [8–10] Level 2 Make a reasonable attempt, which may contain good points, but which remains partial. Show a thinly developed cause/effect link between reduction methods and overpopulation. Offer a valid, but limited assessment. Refer briefly to examples. [5–7] Level 1 Offer one or more basic ideas and struggle to deal with the issue. Take a descriptive approach making little or no assessment. Offer limited or no examples. [1–4] For no response, or no creditable response, 0.
Mark scheme, page 15
Page 15 Mark Scheme Syllabus Paper Cambridge International AS/A Level – May/June 2016 9696 13 © Cambridge International Examinations 2016 Population / Migration 11 (a) (i) Define the term internal migration. [3] The movement of people/population – 1 mark. Within a country/not crossing borders – 1 mark. For a duration of 1 year or more/permanently – 1 mark. (ii) Outline the role of economic factors in internal migration. [4] Economic factors are often key in terms of pushes and pulls and they provide the means to pay for the costs of migration. A list of economic factors e.g. employment, wealth, transport, house prices etc. is unlikely to get above 2 marks whilst those candidates that link these to the causes and processes of internal migration are likely to access the full marks range. (b) Explain why governments of LEDCs may wish to control internal migration. [8] Governments at various levels and scales attempt to control (encourage, discourage and select) migration for various reasons such as: • Demographic – to change total population or its components • Economic – to gain skills, reduce poverty, reduce costs to the government • Social – to gain or remove social groups, to reduce squatter settlements • Political – to influence voting patterns, to avoid unrest. Bear in mind the three bands of marks and qualities of response, 1–3, 4–6 and 7–8. It is higher level responses that will go beyond the simple control of numbers.
Mark scheme, page 16
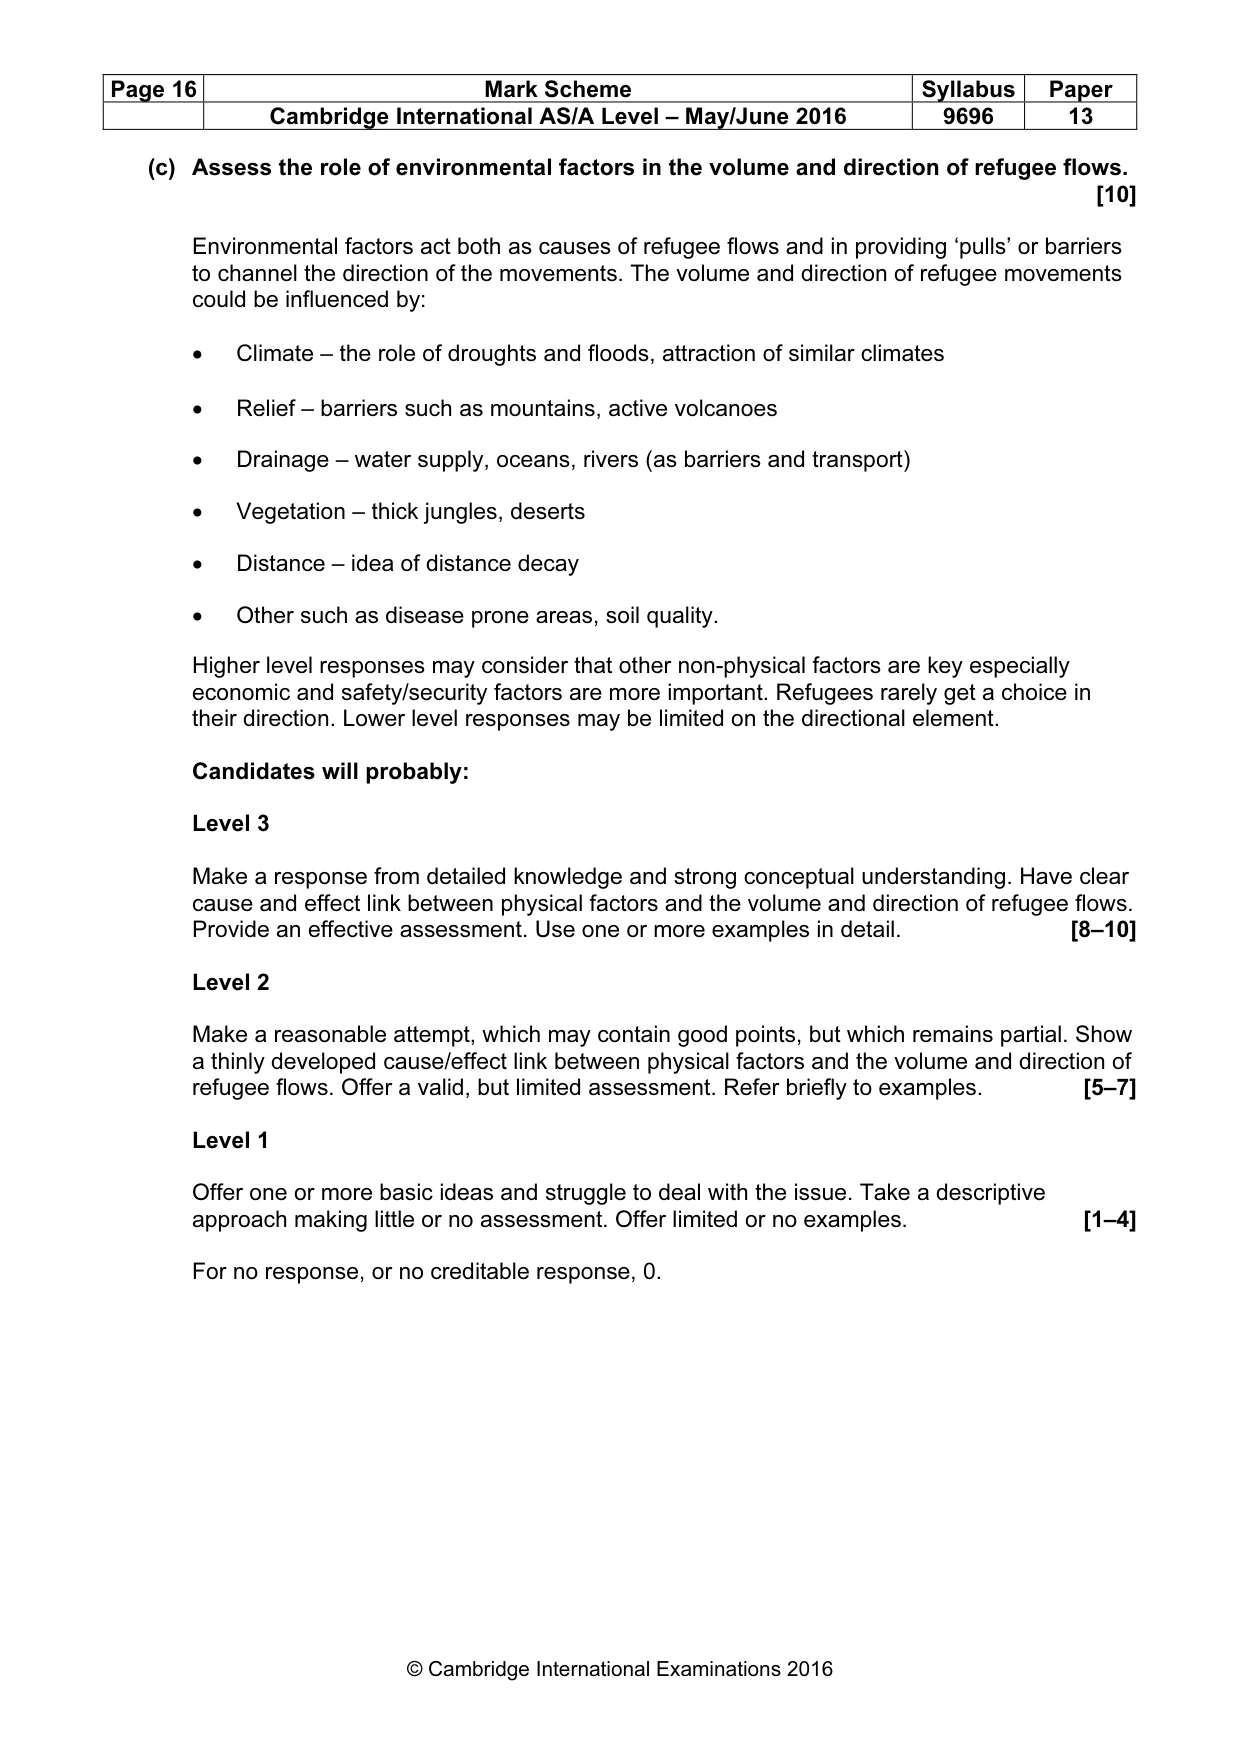
Page 16 Mark Scheme Syllabus Paper Cambridge International AS/A Level – May/June 2016 9696 13 © Cambridge International Examinations 2016 (c) Assess the role of environmental factors in the volume and direction of refugee flows. [10] Environmental factors act both as causes of refugee flows and in providing ‘pulls’ or barriers to channel the direction of the movements. The volume and direction of refugee movements could be influenced by: • Climate – the role of droughts and floods, attraction of similar climates • Relief – barriers such as mountains, active volcanoes • Drainage – water supply, oceans, rivers (as barriers and transport) • Vegetation – thick jungles, deserts • Distance – idea of distance decay • Other such as disease prone areas, soil quality. Higher level responses may consider that other non-physical factors are key especially economic and safety/security factors are more important. Refugees rarely get a choice in their direction. Lower level responses may be limited on the directional element. Candidates will probably: Level 3 Make a response from detailed knowledge and strong conceptual understanding. Have clear cause and effect link between physical factors and the volume and direction of refugee flows. Provide an effective assessment. Use one or more examples in detail. [8–10] Level 2 Make a reasonable attempt, which may contain good points, but which remains partial. Show a thinly developed cause/effect link between physical factors and the volume and direction of refugee flows. Offer a valid, but limited assessment. Refer briefly to examples. [5–7] Level 1 Offer one or more basic ideas and struggle to deal with the issue. Take a descriptive approach making little or no assessment. Offer limited or no examples. [1–4] For no response, or no creditable response, 0.
Mark scheme, page 17
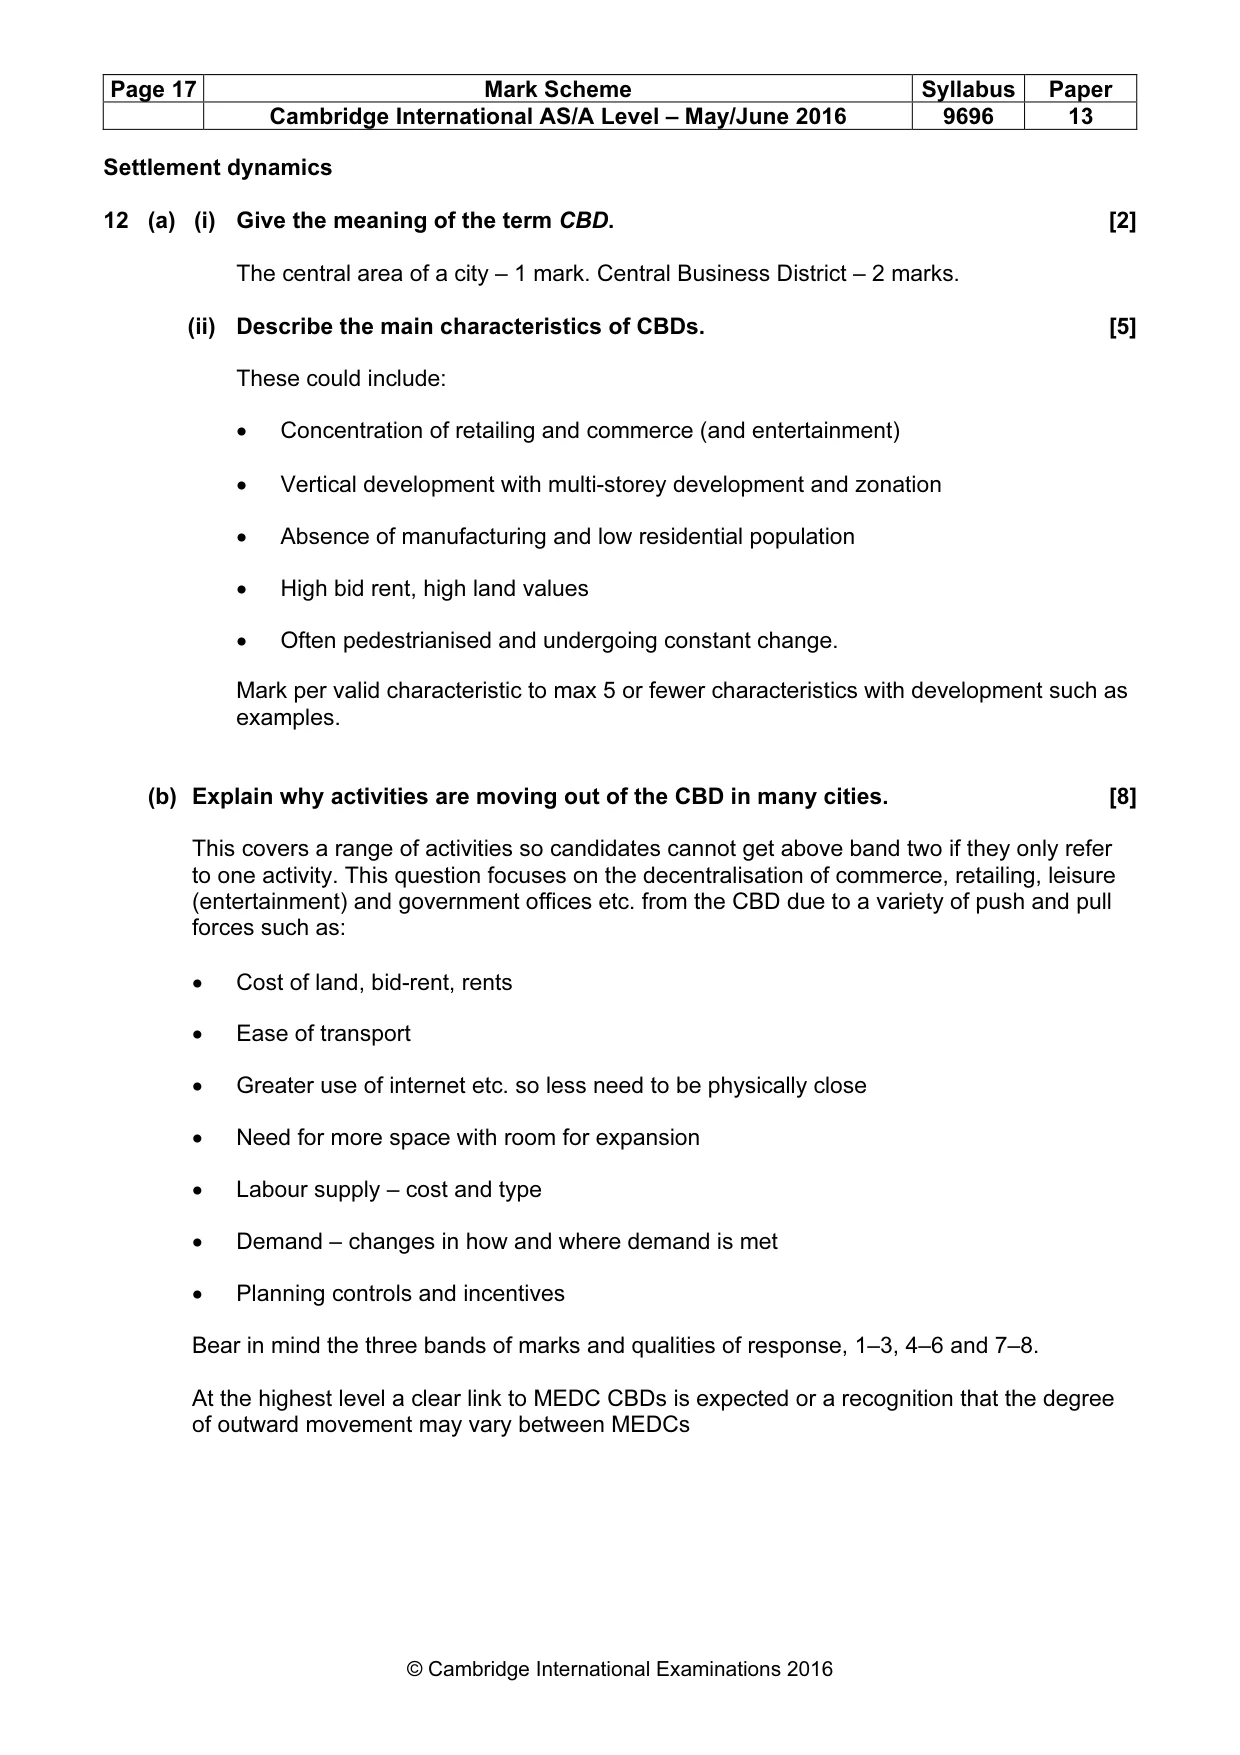
Page 17 Mark Scheme Syllabus Paper Cambridge International AS/A Level – May/June 2016 9696 13 © Cambridge International Examinations 2016 Settlement dynamics 12 (a) (i) Give the meaning of the term CBD. [2] The central area of a city – 1 mark. Central Business District – 2 marks. (ii) Describe the main characteristics of CBDs. [5] These could include: • Concentration of retailing and commerce (and entertainment) • Vertical development with multi-storey development and zonation • Absence of manufacturing and low residential population • High bid rent, high land values • Often pedestrianised and undergoing constant change. Mark per valid characteristic to max 5 or fewer characteristics with development such as examples. (b) Explain why activities are moving out of the CBD in many cities. [8] This covers a range of activities so candidates cannot get above band two if they only refer to one activity. This question focuses on the decentralisation of commerce, retailing, leisure (entertainment) and government offices etc. from the CBD due to a variety of push and pull forces such as: • Cost of land, bid-rent, rents • Ease of transport • Greater use of internet etc. so less need to be physically close • Need for more space with room for expansion • Labour supply – cost and type • Demand – changes in how and where demand is met • Planning controls and incentives Bear in mind the three bands of marks and qualities of response, 1–3, 4–6 and 7–8. At the highest level a clear link to MEDC CBDs is expected or a recognition that the degree of outward movement may vary between MEDCs
Mark scheme, page 18
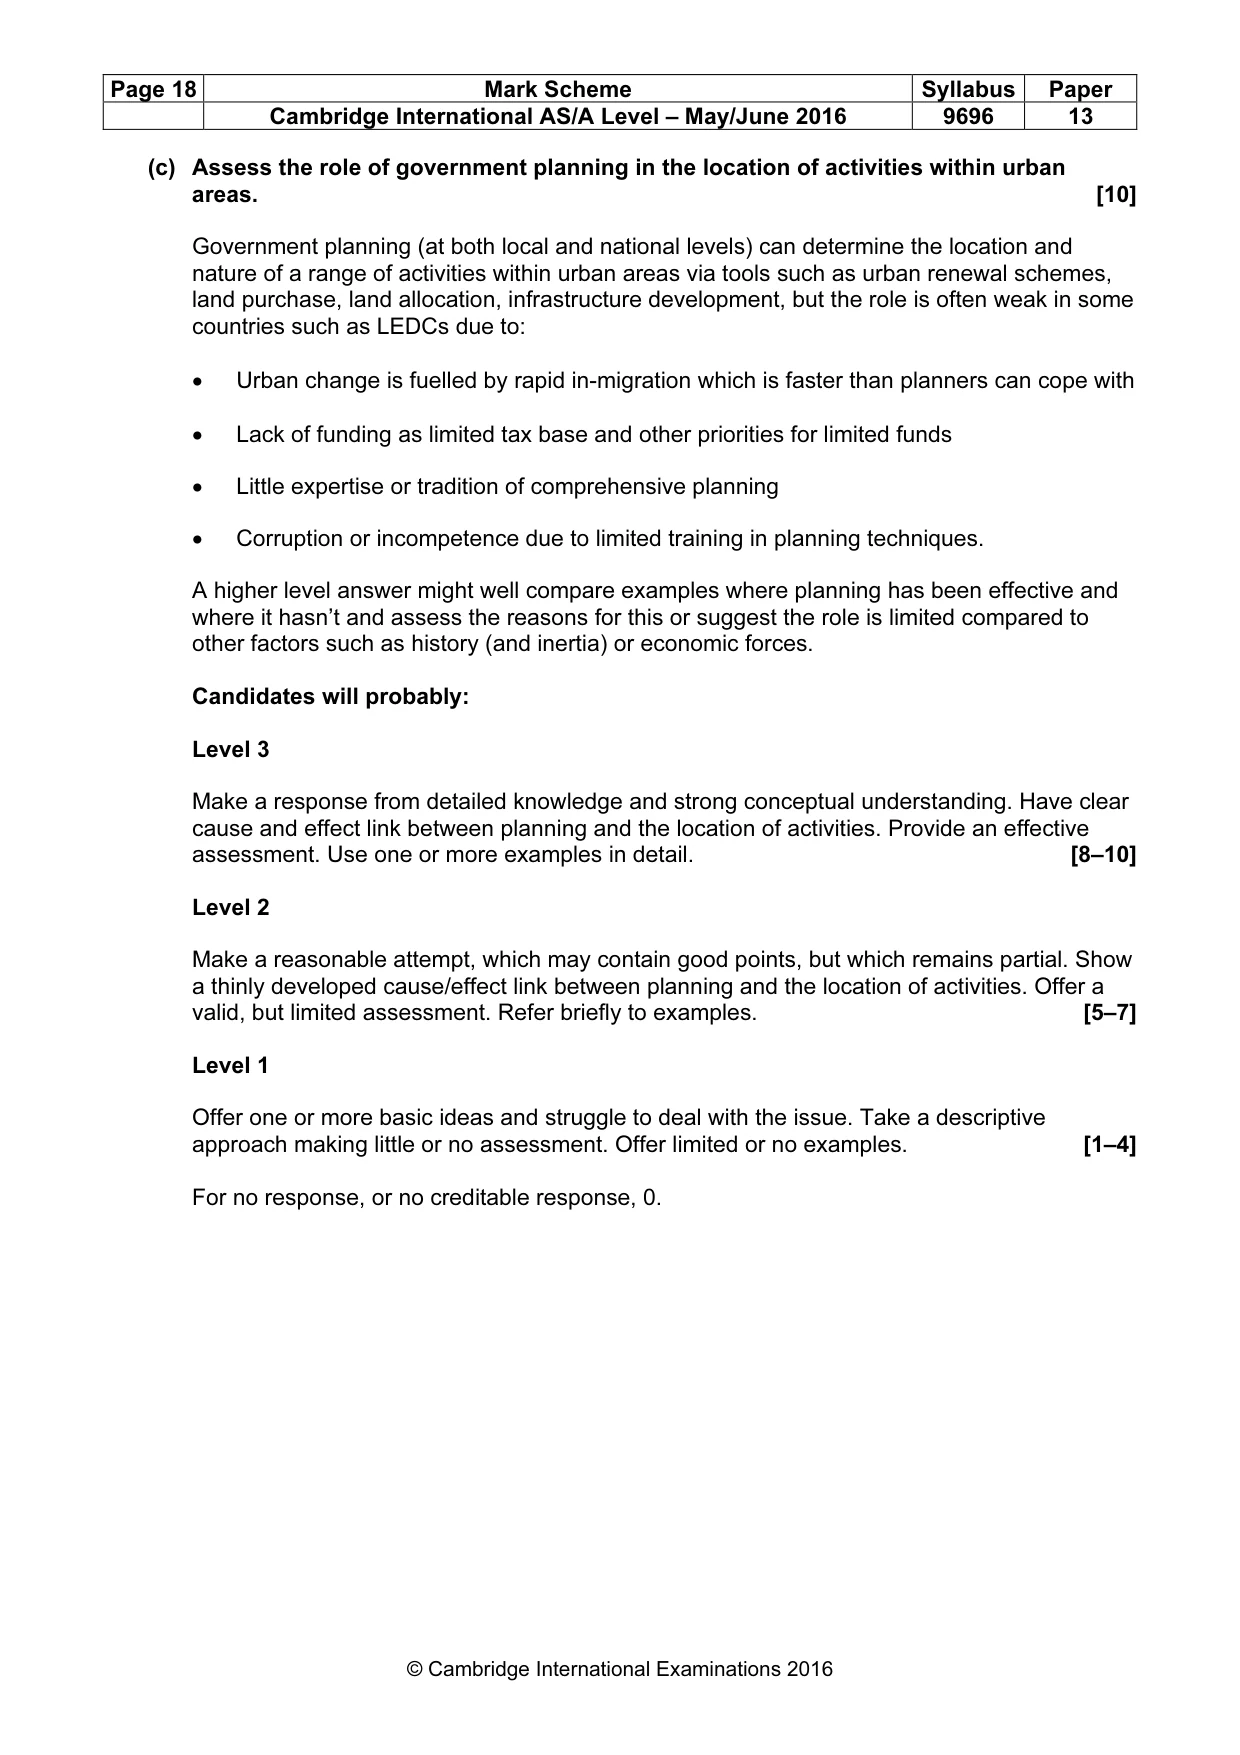
Page 18 Mark Scheme Syllabus Paper Cambridge International AS/A Level – May/June 2016 9696 13 © Cambridge International Examinations 2016 (c) Assess the role of government planning in the location of activities within urban areas. [10] Government planning (at both local and national levels) can determine the location and nature of a range of activities within urban areas via tools such as urban renewal schemes, land purchase, land allocation, infrastructure development, but the role is often weak in some countries such as LEDCs due to: • Urban change is fuelled by rapid in-migration which is faster than planners can cope with • Lack of funding as limited tax base and other priorities for limited funds • Little expertise or tradition of comprehensive planning • Corruption or incompetence due to limited training in planning techniques. A higher level answer might well compare examples where planning has been effective and where it hasn’t and assess the reasons for this or suggest the role is limited compared to other factors such as history (and inertia) or economic forces. Candidates will probably: Level 3 Make a response from detailed knowledge and strong conceptual understanding. Have clear cause and effect link between planning and the location of activities. Provide an effective assessment. Use one or more examples in detail. [8–10] Level 2 Make a reasonable attempt, which may contain good points, but which remains partial. Show a thinly developed cause/effect link between planning and the location of activities. Offer a valid, but limited assessment. Refer briefly to examples. [5–7] Level 1 Offer one or more basic ideas and struggle to deal with the issue. Take a descriptive approach making little or no assessment. Offer limited or no examples. [1–4] For no response, or no creditable response, 0.
What you needed in this session
Cambridge’s own grade thresholds for 2016 May/June, Paper 1 · Variant 3. A higher threshold means an easier paper — the bar moves with how the cohort did.