Cambridge A Level Geography 9696 — 2016 May/June Paper 1 · Variant 1
9696/11/M/J/16 · 100 marks · ≈113 min
The question paper and its mark scheme, free to read here and free to download. This is Cambridge’s own paper, exactly as it was sat.
Question paper8 pages



Mark scheme19 pages
Answers below. Sit the paper first if you are practising.
Paper as text
Question paper, page 1
This document consists of 5 printed pages, 3 blank pages and 2 Inserts. DC (NH) 113771/3 © UCLES 2016 [Turn over * 9 4 6 9 8 0 5 0 0 7 * GEOGRAPHY 9696/11 Paper 1 Core Geography May/June 2016 3 hours No Additional Materials are required. READ THESE INSTRUCTIONS FIRST An answer booklet is provided inside this question paper. You should follow the instructions on the front cover of the answer booklet. If you need additional answer paper ask the invigilator for a continuation booklet. Section A Answer five questions. Section B Answer one question. Section C Answer one question. Sketch maps and diagrams should be drawn whenever they serve to illustrate an answer. The Photograph, Figures and the Table referred to in the questions are contained in the Insert. The number of marks is given in brackets [ ] at the end of each question or part question. Cambridge International Examinations Cambridge International Advanced Subsidiary and Advanced Level
Question paper, page 2
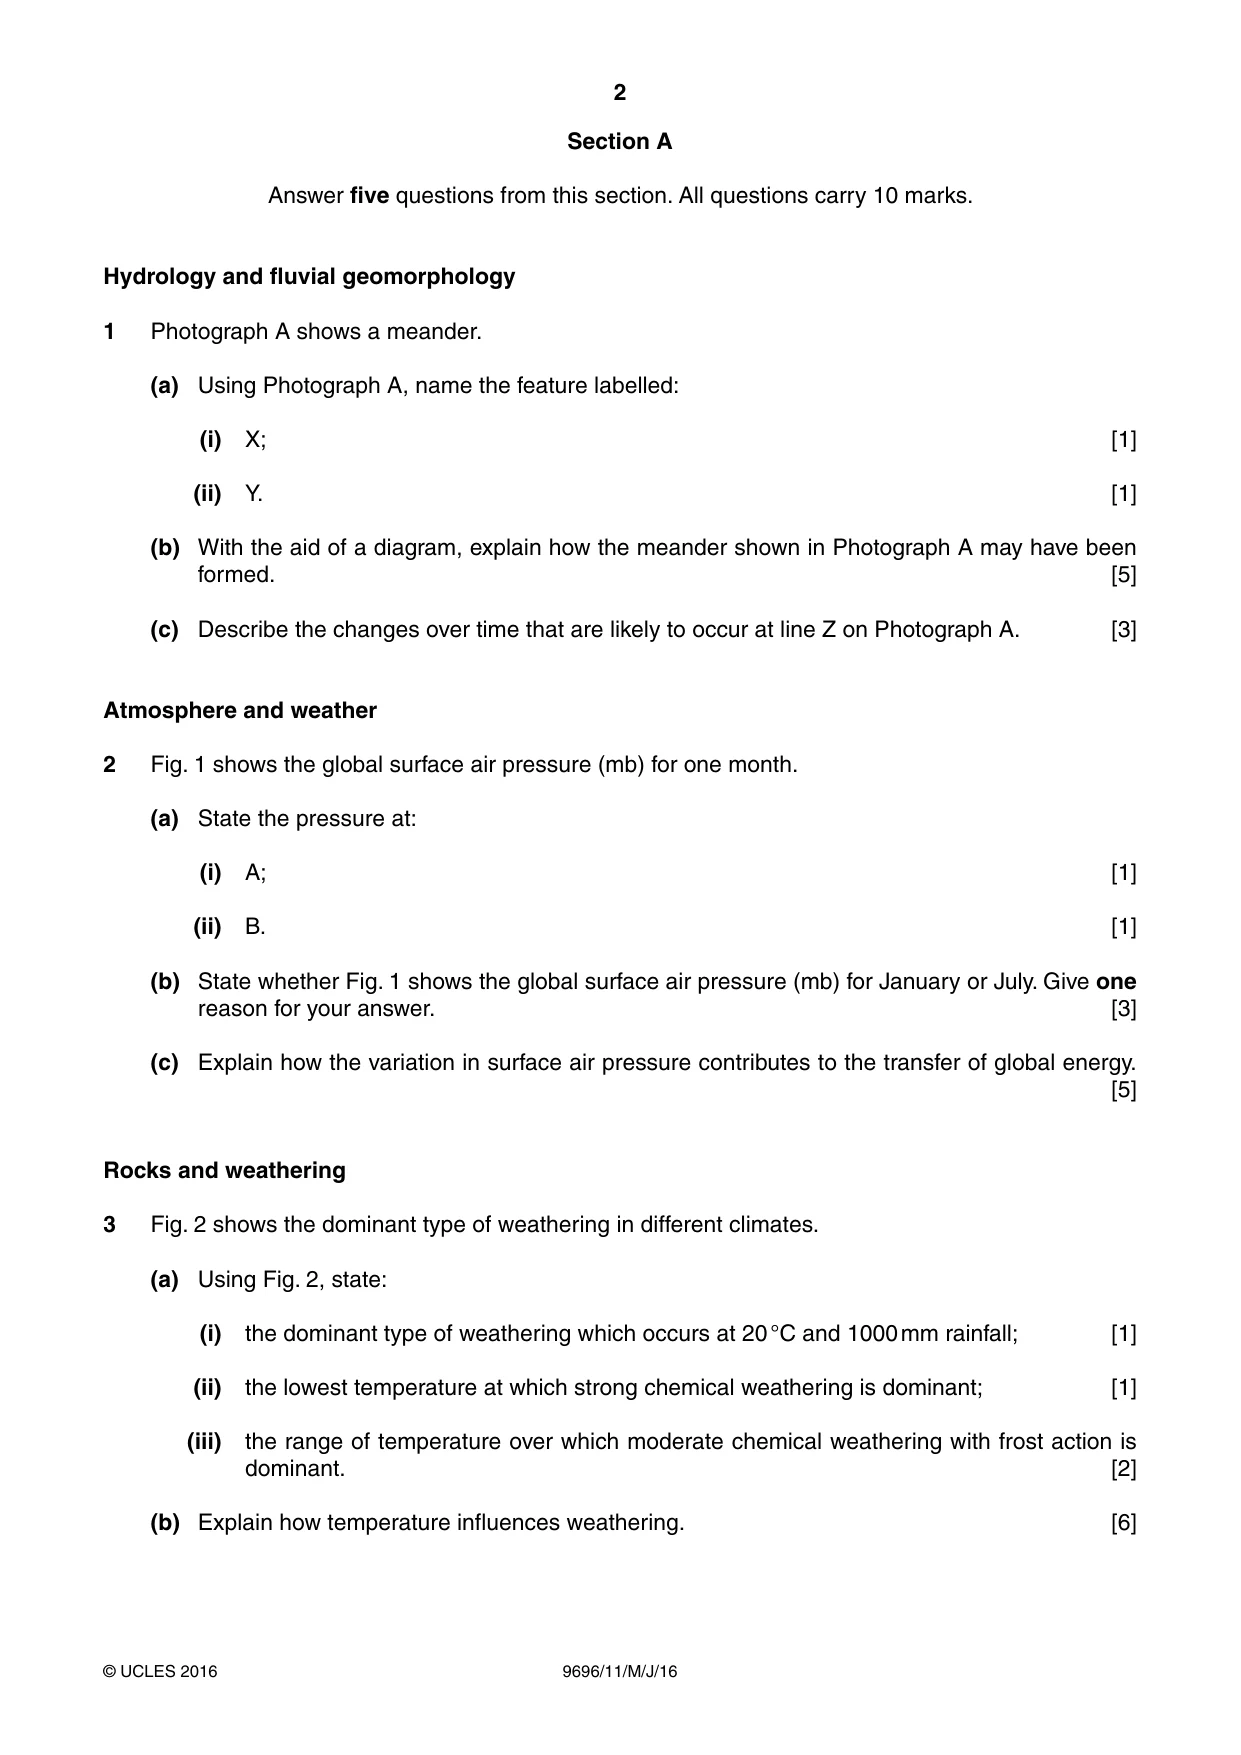
2 9696/11/M/J/16 © UCLES 2016 Section A Answer five questions from this section. All questions carry 10 marks. Hydrology and fluvial geomorphology 1 Photograph A shows a meander. (a) Using Photograph A, name the feature labelled: (i) X; [1] (ii) Y. [1] (b) With the aid of a diagram, explain how the meander shown in Photograph A may have been formed. [5] (c) Describe the changes over time that are likely to occur at line Z on Photograph A. [3] Atmosphere and weather 2 Fig. 1 shows the global surface air pressure (mb) for one month. (a) State the pressure at: (i) A; [1] (ii) B. [1] (b) State whether Fig. 1 shows the global surface air pressure (mb) for January or July. Give one reason for your answer. [3] (c) Explain how the variation in surface air pressure contributes to the transfer of global energy. [5] Rocks and weathering 3 Fig. 2 shows the dominant type of weathering in different climates. (a) Using Fig. 2, state: (i) the dominant type of weathering which occurs at 20 °C and 1000 mm rainfall; [1] (ii) the lowest temperature at which strong chemical weathering is dominant; [1] (iii) the range of temperature over which moderate chemical weathering with frost action is dominant. [2] (b) Explain how temperature influences weathering. [6]
Question paper, page 3
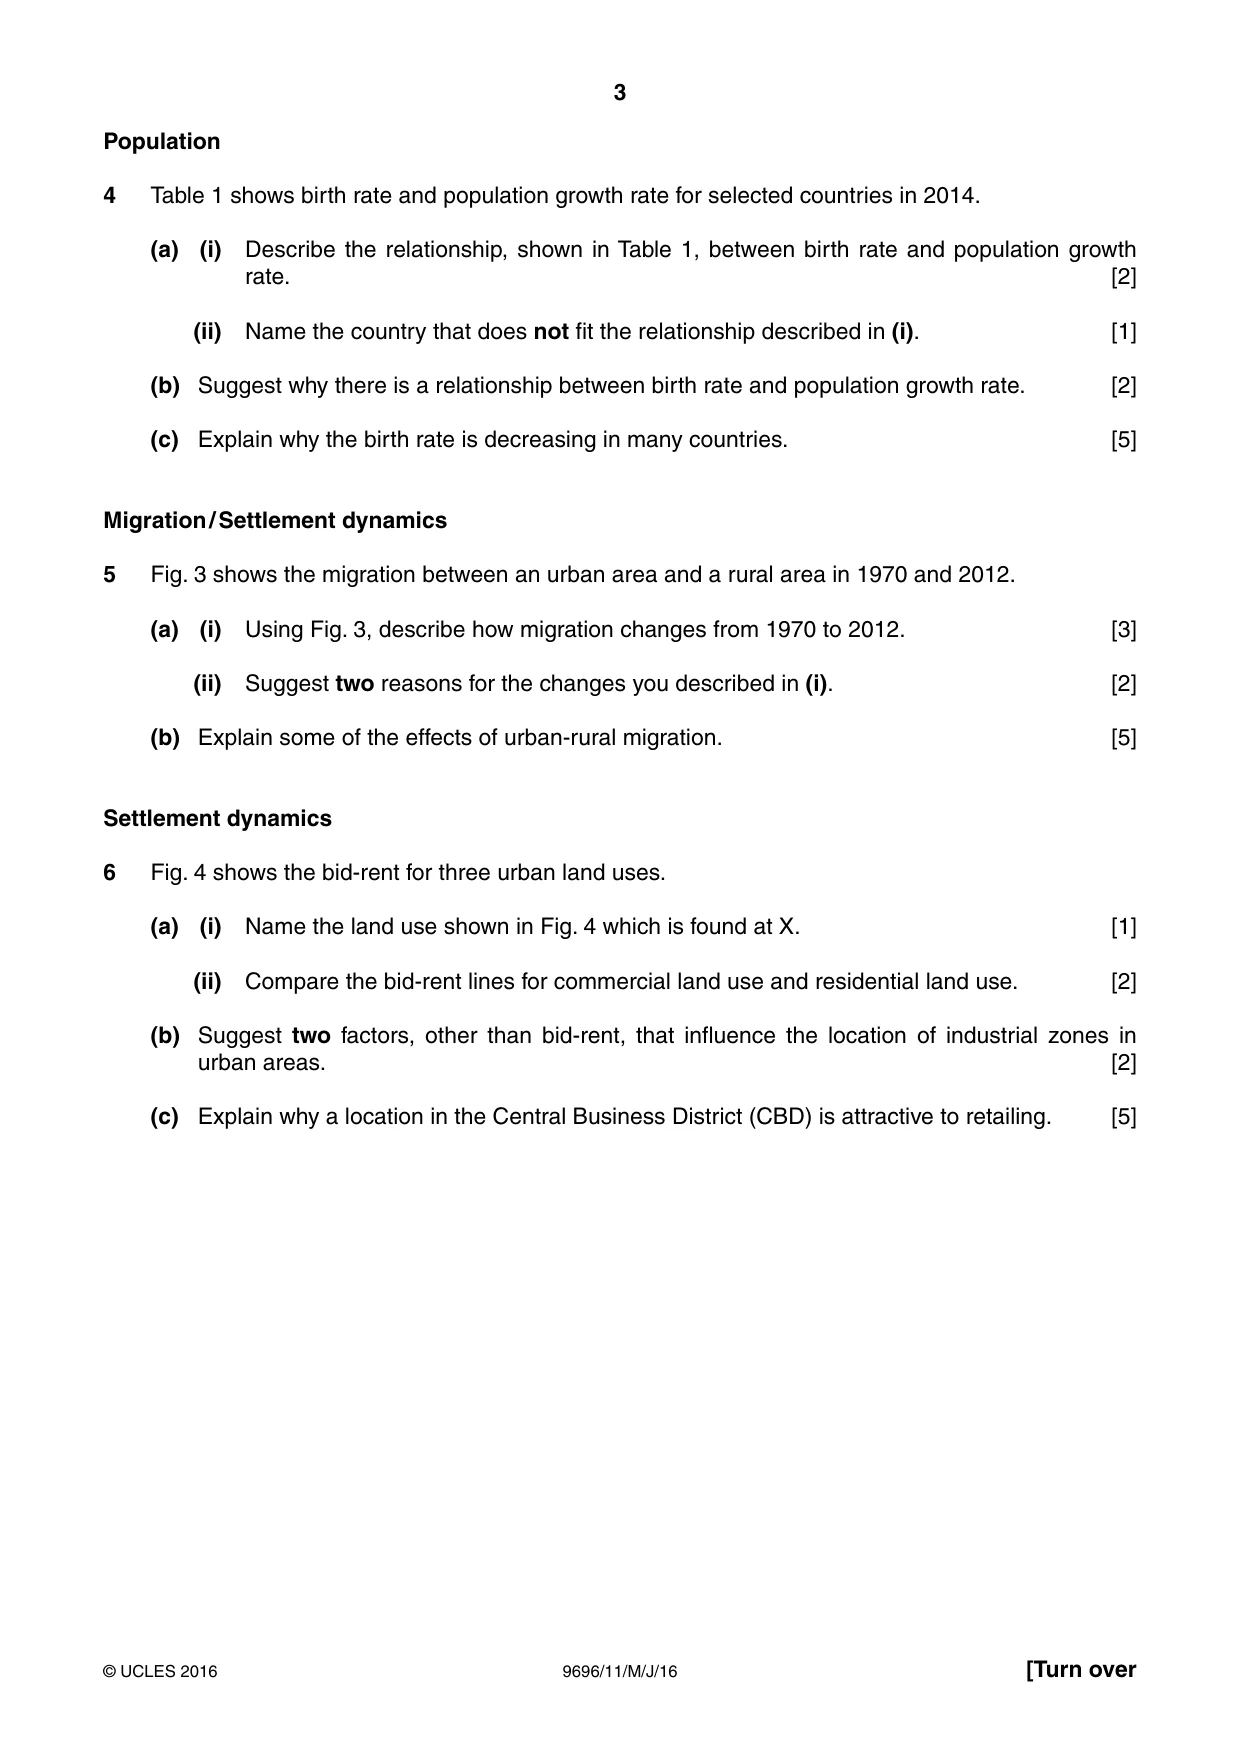
3 9696/11/M/J/16 © UCLES 2016 [Turn over Population 4 Table 1 shows birth rate and population growth rate for selected countries in 2014. (a) (i) Describe the relationship, shown in Table 1, between birth rate and population growth rate. [2] (ii) Name the country that does not fit the relationship described in (i). [1] (b) Suggest why there is a relationship between birth rate and population growth rate. [2] (c) Explain why the birth rate is decreasing in many countries. [5] Migration / Settlement dynamics 5 Fig. 3 shows the migration between an urban area and a rural area in 1970 and 2012. (a) (i) Using Fig. 3, describe how migration changes from 1970 to 2012. [3] (ii) Suggest two reasons for the changes you described in (i). [2] (b) Explain some of the effects of urban-rural migration. [5] Settlement dynamics 6 Fig. 4 shows the bid-rent for three urban land uses. (a) (i) Name the land use shown in Fig. 4 which is found at X. [1] (ii) Compare the bid-rent lines for commercial land use and residential land use. [2] (b) Suggest two factors, other than bid-rent, that influence the location of industrial zones in urban areas. [2] (c) Explain why a location in the Central Business District (CBD) is attractive to retailing. [5]
Question paper, page 4
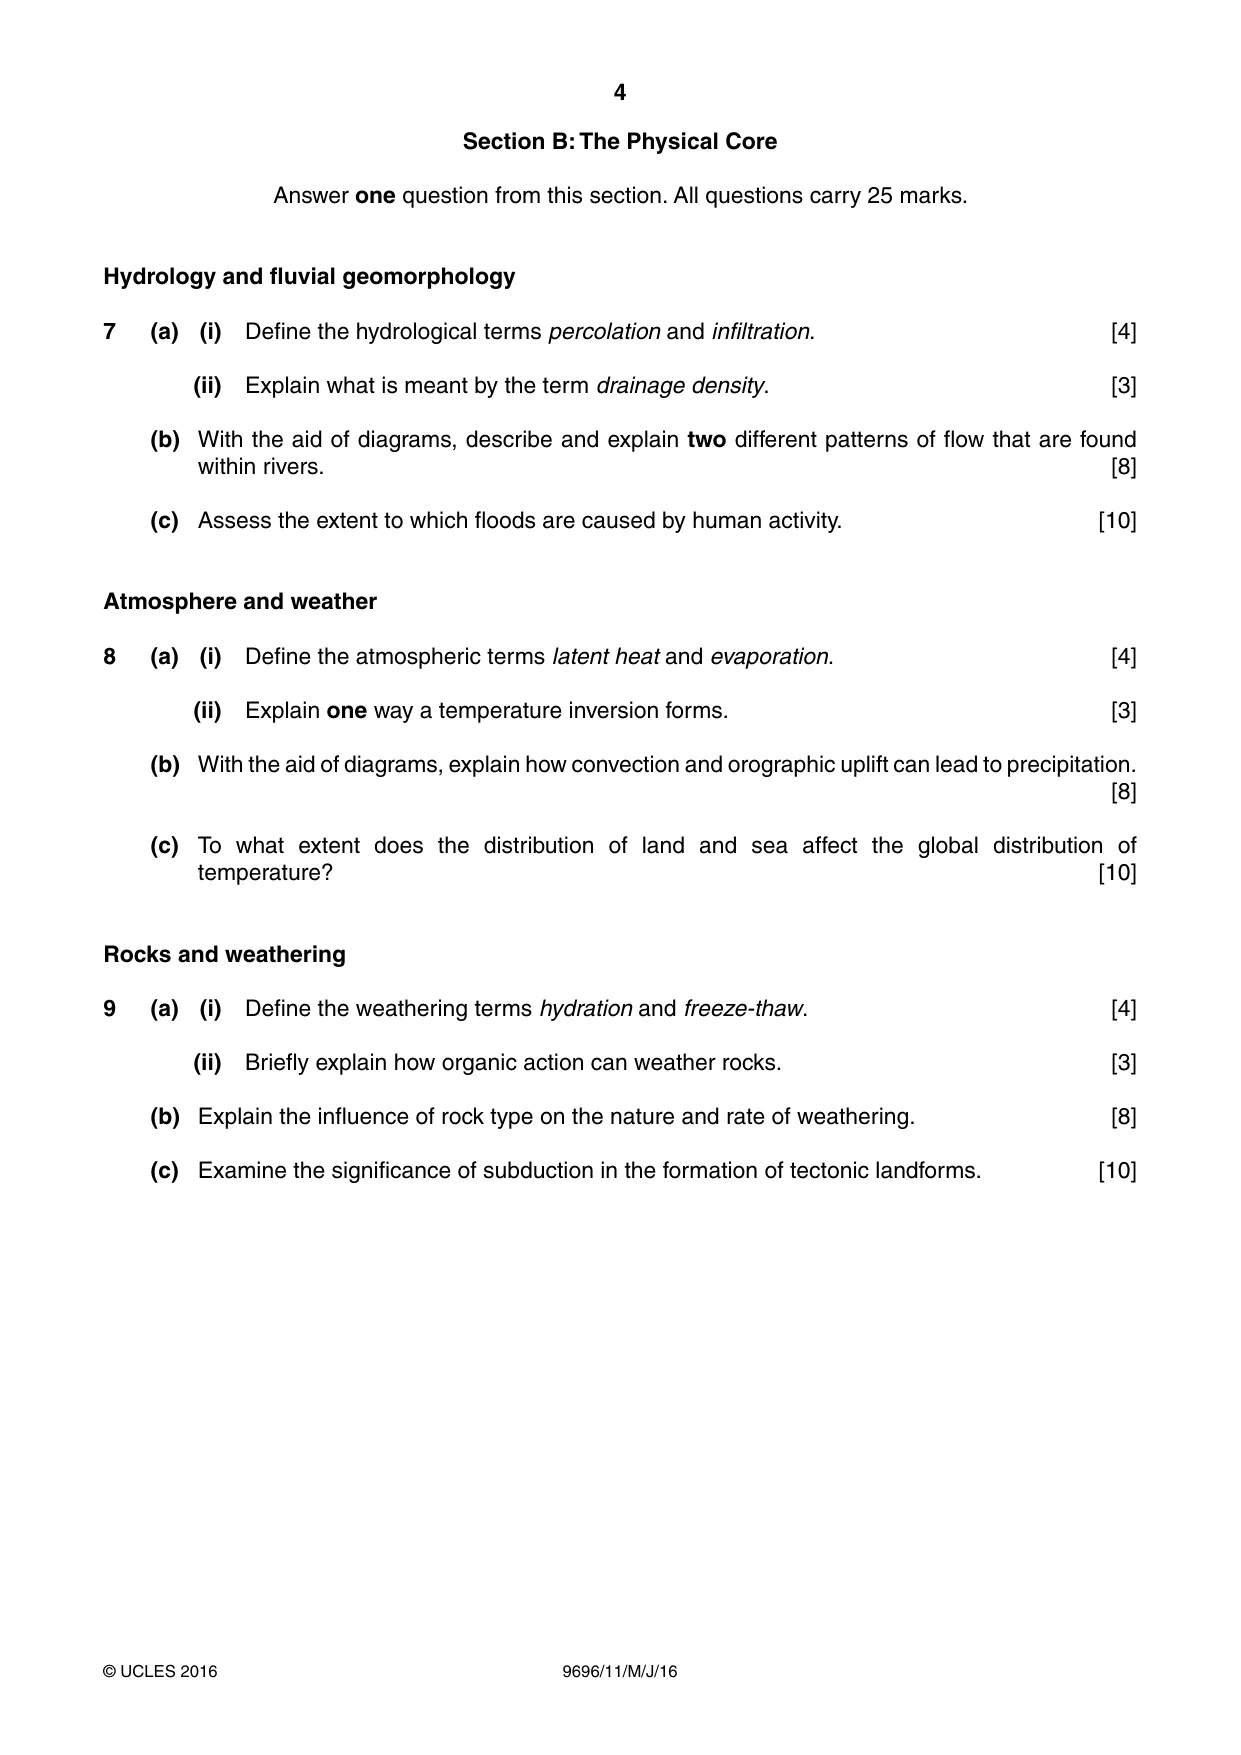
4 9696/11/M/J/16 © UCLES 2016 Section B: The Physical Core Answer one question from this section. All questions carry 25 marks. Hydrology and fluvial geomorphology 7 (a) (i) Define the hydrological terms percolation and infiltration. [4] (ii) Explain what is meant by the term drainage density. [3] (b) With the aid of diagrams, describe and explain two different patterns of flow that are found within rivers. [8] (c) Assess the extent to which floods are caused by human activity. [10] Atmosphere and weather 8 (a) (i) Define the atmospheric terms latent heat and evaporation. [4] (ii) Explain one way a temperature inversion forms. [3] (b) With the aid of diagrams, explain how convection and orographic uplift can lead to precipitation. [8] (c) To what extent does the distribution of land and sea affect the global distribution of temperature? [10] Rocks and weathering 9 (a) (i) Define the weathering terms hydration and freeze-thaw. [4] (ii) Briefly explain how organic action can weather rocks. [3] (b) Explain the influence of rock type on the nature and rate of weathering. [8] (c) Examine the significance of subduction in the formation of tectonic landforms. [10]
Question paper, page 5
5 9696/11/M/J/16 © UCLES 2016 Section C: The Human Core Answer one question from this section. All questions carry 25 marks. Population 10 (a) (i) Define the term dependency ratio. [3] (ii) Suggest two pieces of evidence that might indicate an area has a large young population. [4] (b) Explain the development of an ageing population structure. [8] (c) ‘Controlling migration is the only way to reduce overpopulation.’ To what extent do you agree with this statement? [10] Migration / Settlement dynamics 11 (a) (i) Give the meaning of the term forced (involuntary) migration. [2] (ii) Suggest two reasons why forced migration occurs. [5] (b) Explain how the arrival of large numbers of forced migrants affects the receiving area. [8] (c) To what extent is voluntary international migration the result of economic factors? [10] Settlement dynamics 12 (a) (i) Define the term urban renewal. [3] (ii) Describe two of the characteristics of urban renewal. [4] (b) Explain why there are large areas of urban renewal in many cities. [8] (c) Evaluate the idea that shanty towns (squatter settlements) are areas of hope rather than of despair. [10]
Question paper, page 6
6 9696/11/M/J/16 © UCLES 2016 BLANK PAGE
Question paper, page 7
7 9696/11/M/J/16 © UCLES 2016 BLANK PAGE
Question paper, page 8
8 9696/11/M/J/16 © UCLES 2016 BLANK PAGE Permission to reproduce items where third-party owned material protected by copyright is included has been sought and cleared where possible. Every reasonable effort has been made by the publisher (UCLES) to trace copyright holders, but if any items requiring clearance have unwittingly been included, the publisher will be pleased to make amends at the earliest possible opportunity. To avoid the issue of disclosure of answer-related information to candidates, all copyright acknowledgements are reproduced online in the Cambridge International Examinations Copyright Acknowledgements Booklet. This is produced for each series of examinations and is freely available to download at www.cie.org.uk after the live examination series. Cambridge International Examinations is part of the Cambridge Assessment Group. Cambridge Assessment is the brand name of University of Cambridge Local Examinations Syndicate (UCLES), which is itself a department of the University of Cambridge.
Mark scheme, page 1
® IGCSE is the registered trademark of Cambridge International Examinations. This document consists of 19 printed pages. © UCLES 2016 [Turn over Cambridge International Examinations Cambridge International Advanced Subsidiary and Advanced Level GEOGRAPHY 9696/11 Paper 1 Core Geography May/June 2016 MARK SCHEME Maximum Mark: 100 Published This mark scheme is published as an aid to teachers and candidates, to indicate the requirements of the examination. It shows the basis on which Examiners were instructed to award marks. It does not indicate the details of the discussions that took place at an Examiners’ meeting before marking began, which would have considered the acceptability of alternative answers. Mark schemes should be read in conjunction with the question paper and the Principal Examiner Report for Teachers. Cambridge will not enter into discussions about these mark schemes. Cambridge is publishing the mark schemes for the May/June 2016 series for most Cambridge IGCSE®, Cambridge International A and AS Level components and some Cambridge O Level components.
Mark scheme, page 2
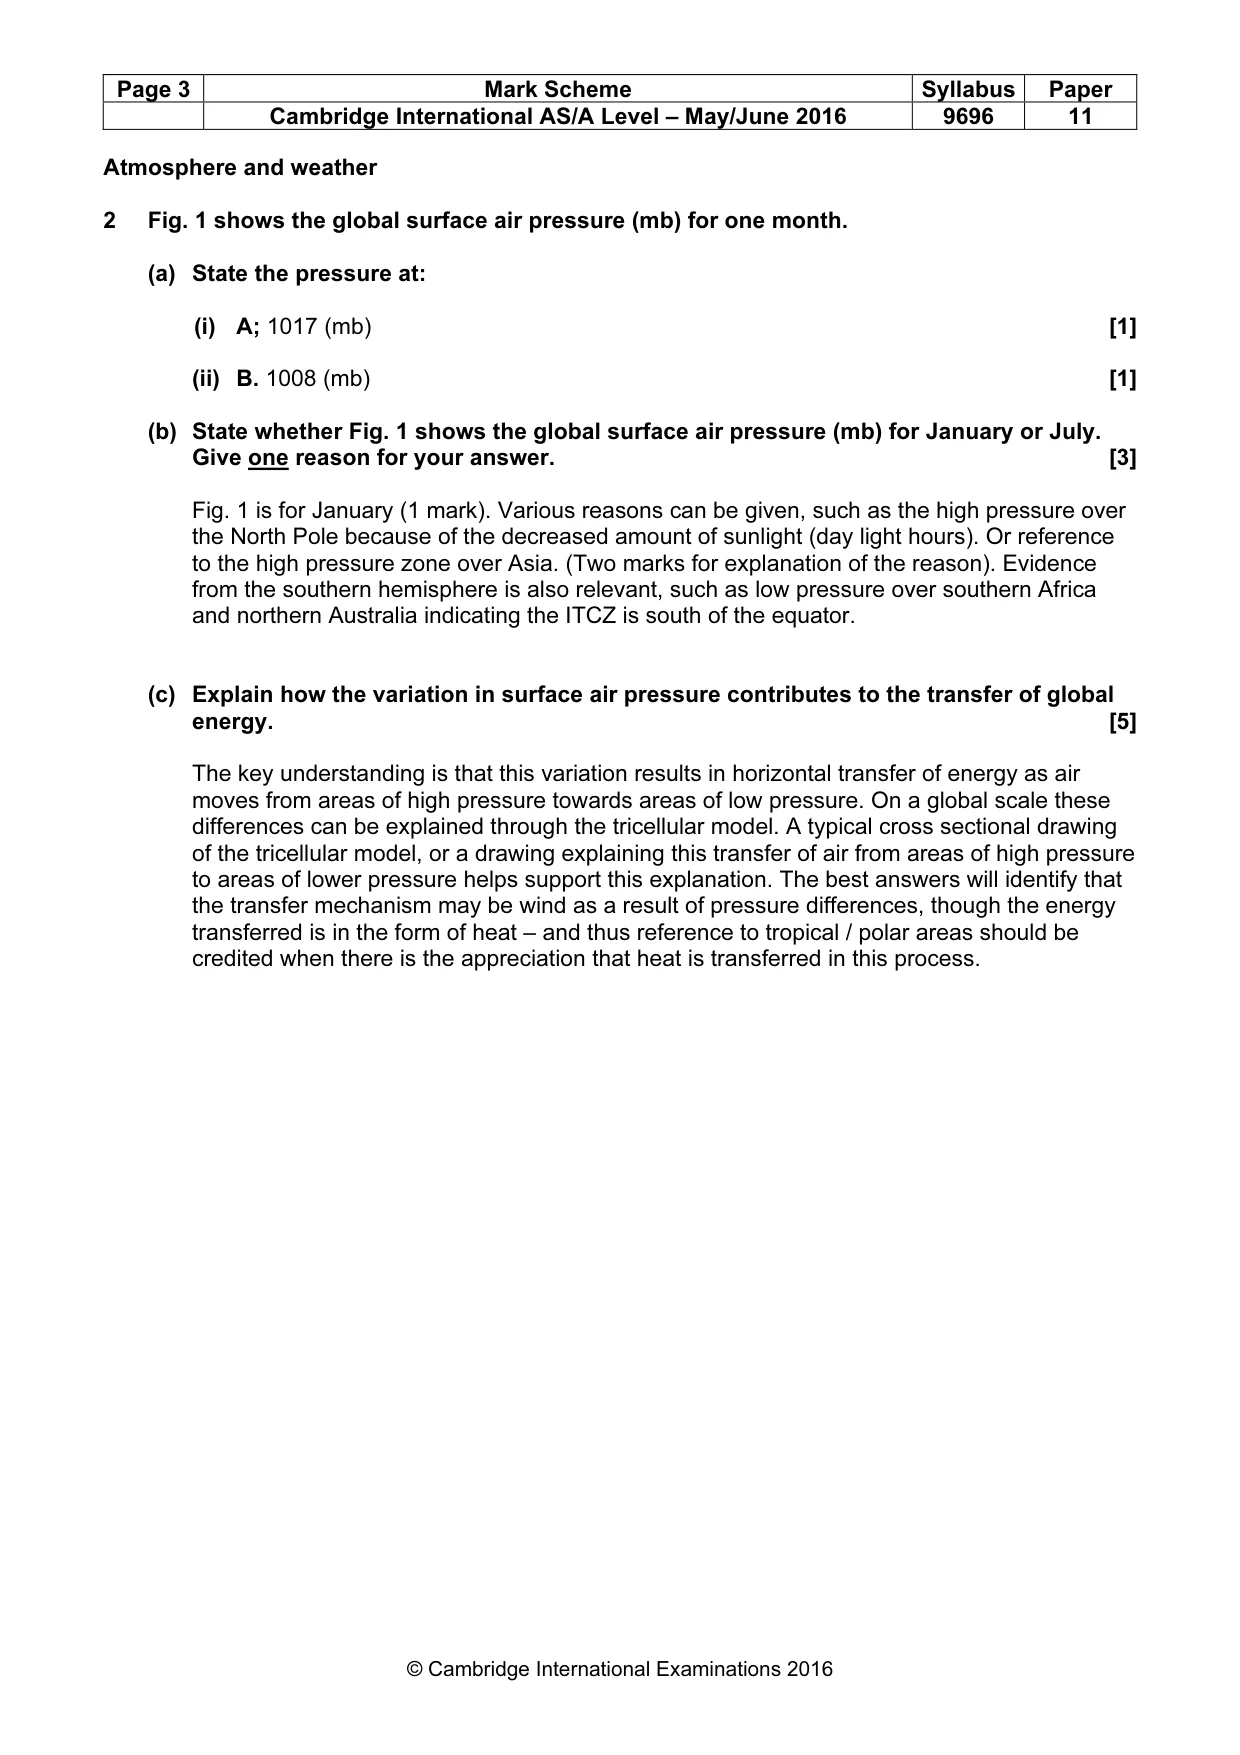
Page 2 Mark Scheme Syllabus Paper Cambridge International AS/A Level – May/June 2016 9696 11 © Cambridge International Examinations 2016 Section A Answer five questions from this section. All questions carry 10 marks. Hydrology and fluvial geomorphology 1 Photograph A shows a meander. (a) Using Photograph A name the feature labelled: (i) X; River cliff [1] (ii) Y. Slip off slope / point bar [1] (b) With the aid of a diagram, explain how the meander shown in Photograph A may have been formed. [5] The better answers will refer to pool and riffle sequence. The different characteristics lead to the fastest flow swinging from one side of the channel to the other. The pools, being an area of less frictional resistance, is a place where erosion takes place. The pool is deepened and widened. The riffle is an area where the energy is dissipated and thus an area normally of deposition. Helicoidal flow is initiated which is a secondary flow on the surface but returning to the other bank at depth which increases the sinuosity of the stream. The helicoidal flow allows the material to be eroded from the outside of the bend and deposited on the inside of the next bend. Little credit should be given for a diagram which shows a corkscrew running down the centre of the channel. Max 3 without a diagram. (c) Describe the changes over time that are likely to occur at line Z on Photograph A. [3] The candidate should note that both end points of the line are at a place of erosion within the river, being on the inside of the meander. Continued erosion would bring both points closer together. Therefore, the candidate needs to refer to line Z shortening (or the “neck” of the meander becoming thinner) and eventually creating the new cut off thus abandoning the part of the channel in the foreground of the picture. The cut off often occurs following several periods of high flow, even with overbank flow. This creates a new straight channel and the previous bend becomes silted up and forms an oxbow lake. A description which uses diagrams should be credited. Suggest 1 mark for the shortening, 1 mark for the eventual cut off and 1 mark for the creation on an oxbow lake.
Mark scheme, page 3
Page 3 Mark Scheme Syllabus Paper Cambridge International AS/A Level – May/June 2016 9696 11 © Cambridge International Examinations 2016 Atmosphere and weather 2 Fig. 1 shows the global surface air pressure (mb) for one month. (a) State the pressure at: (i) A; 1017 (mb) [1] (ii) B. 1008 (mb) [1] (b) State whether Fig. 1 shows the global surface air pressure (mb) for January or July. Give one reason for your answer. [3] Fig. 1 is for January (1 mark). Various reasons can be given, such as the high pressure over the North Pole because of the decreased amount of sunlight (day light hours). Or reference to the high pressure zone over Asia. (Two marks for explanation of the reason). Evidence from the southern hemisphere is also relevant, such as low pressure over southern Africa and northern Australia indicating the ITCZ is south of the equator. (c) Explain how the variation in surface air pressure contributes to the transfer of global energy. [5] The key understanding is that this variation results in horizontal transfer of energy as air moves from areas of high pressure towards areas of low pressure. On a global scale these differences can be explained through the tricellular model. A typical cross sectional drawing of the tricellular model, or a drawing explaining this transfer of air from areas of high pressure to areas of lower pressure helps support this explanation. The best answers will identify that the transfer mechanism may be wind as a result of pressure differences, though the energy transferred is in the form of heat – and thus reference to tropical / polar areas should be credited when there is the appreciation that heat is transferred in this process.
Mark scheme, page 4
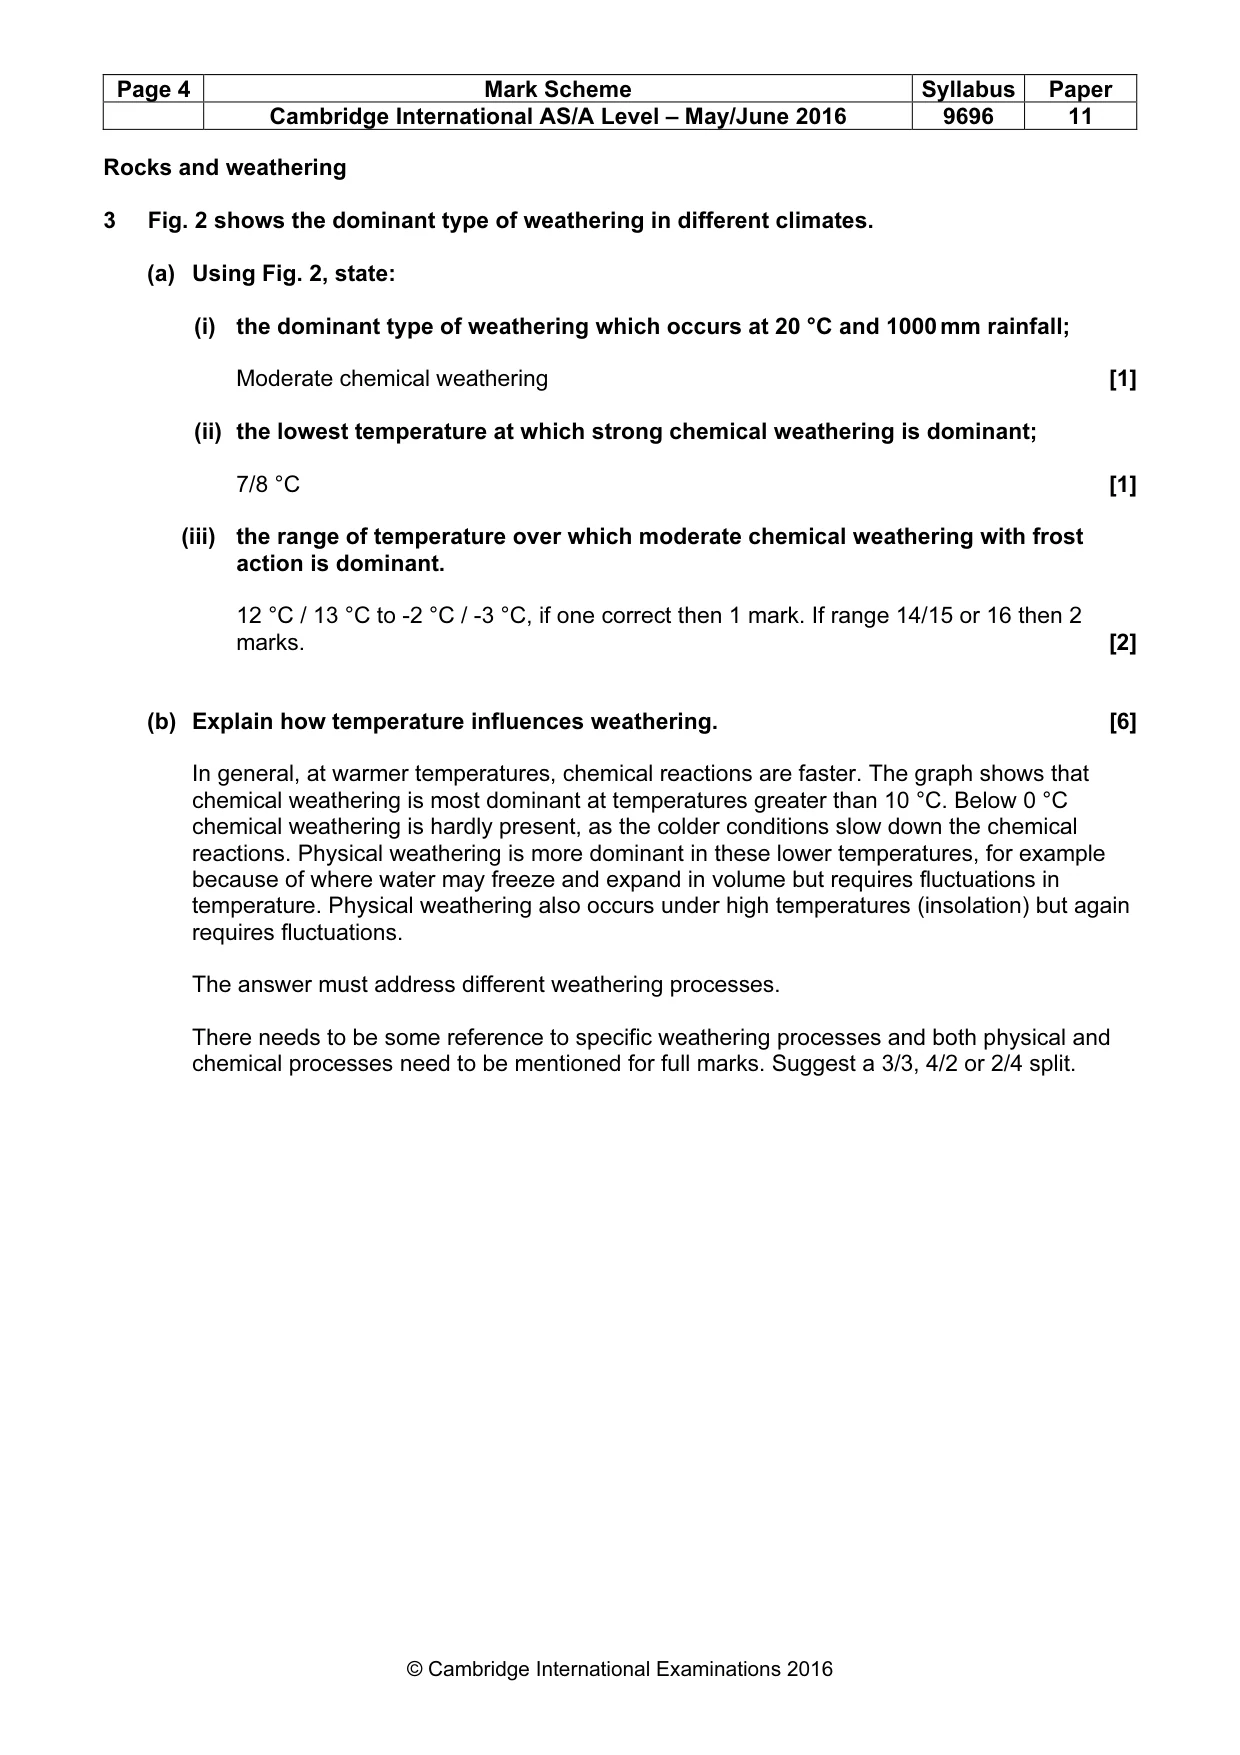
Page 4 Mark Scheme Syllabus Paper Cambridge International AS/A Level – May/June 2016 9696 11 © Cambridge International Examinations 2016 Rocks and weathering 3 Fig. 2 shows the dominant type of weathering in different climates. (a) Using Fig. 2, state: (i) the dominant type of weathering which occurs at 20 °C and 1000 mm rainfall; Moderate chemical weathering [1] (ii) the lowest temperature at which strong chemical weathering is dominant; 7/8 °C [1] (iii) the range of temperature over which moderate chemical weathering with frost action is dominant. 12 °C / 13 °C to -2 °C / -3 °C, if one correct then 1 mark. If range 14/15 or 16 then 2 marks. [2] (b) Explain how temperature influences weathering. [6] In general, at warmer temperatures, chemical reactions are faster. The graph shows that chemical weathering is most dominant at temperatures greater than 10 °C. Below 0 °C chemical weathering is hardly present, as the colder conditions slow down the chemical reactions. Physical weathering is more dominant in these lower temperatures, for example because of where water may freeze and expand in volume but requires fluctuations in temperature. Physical weathering also occurs under high temperatures (insolation) but again requires fluctuations. The answer must address different weathering processes. There needs to be some reference to specific weathering processes and both physical and chemical processes need to be mentioned for full marks. Suggest a 3/3, 4/2 or 2/4 split.
Mark scheme, page 5
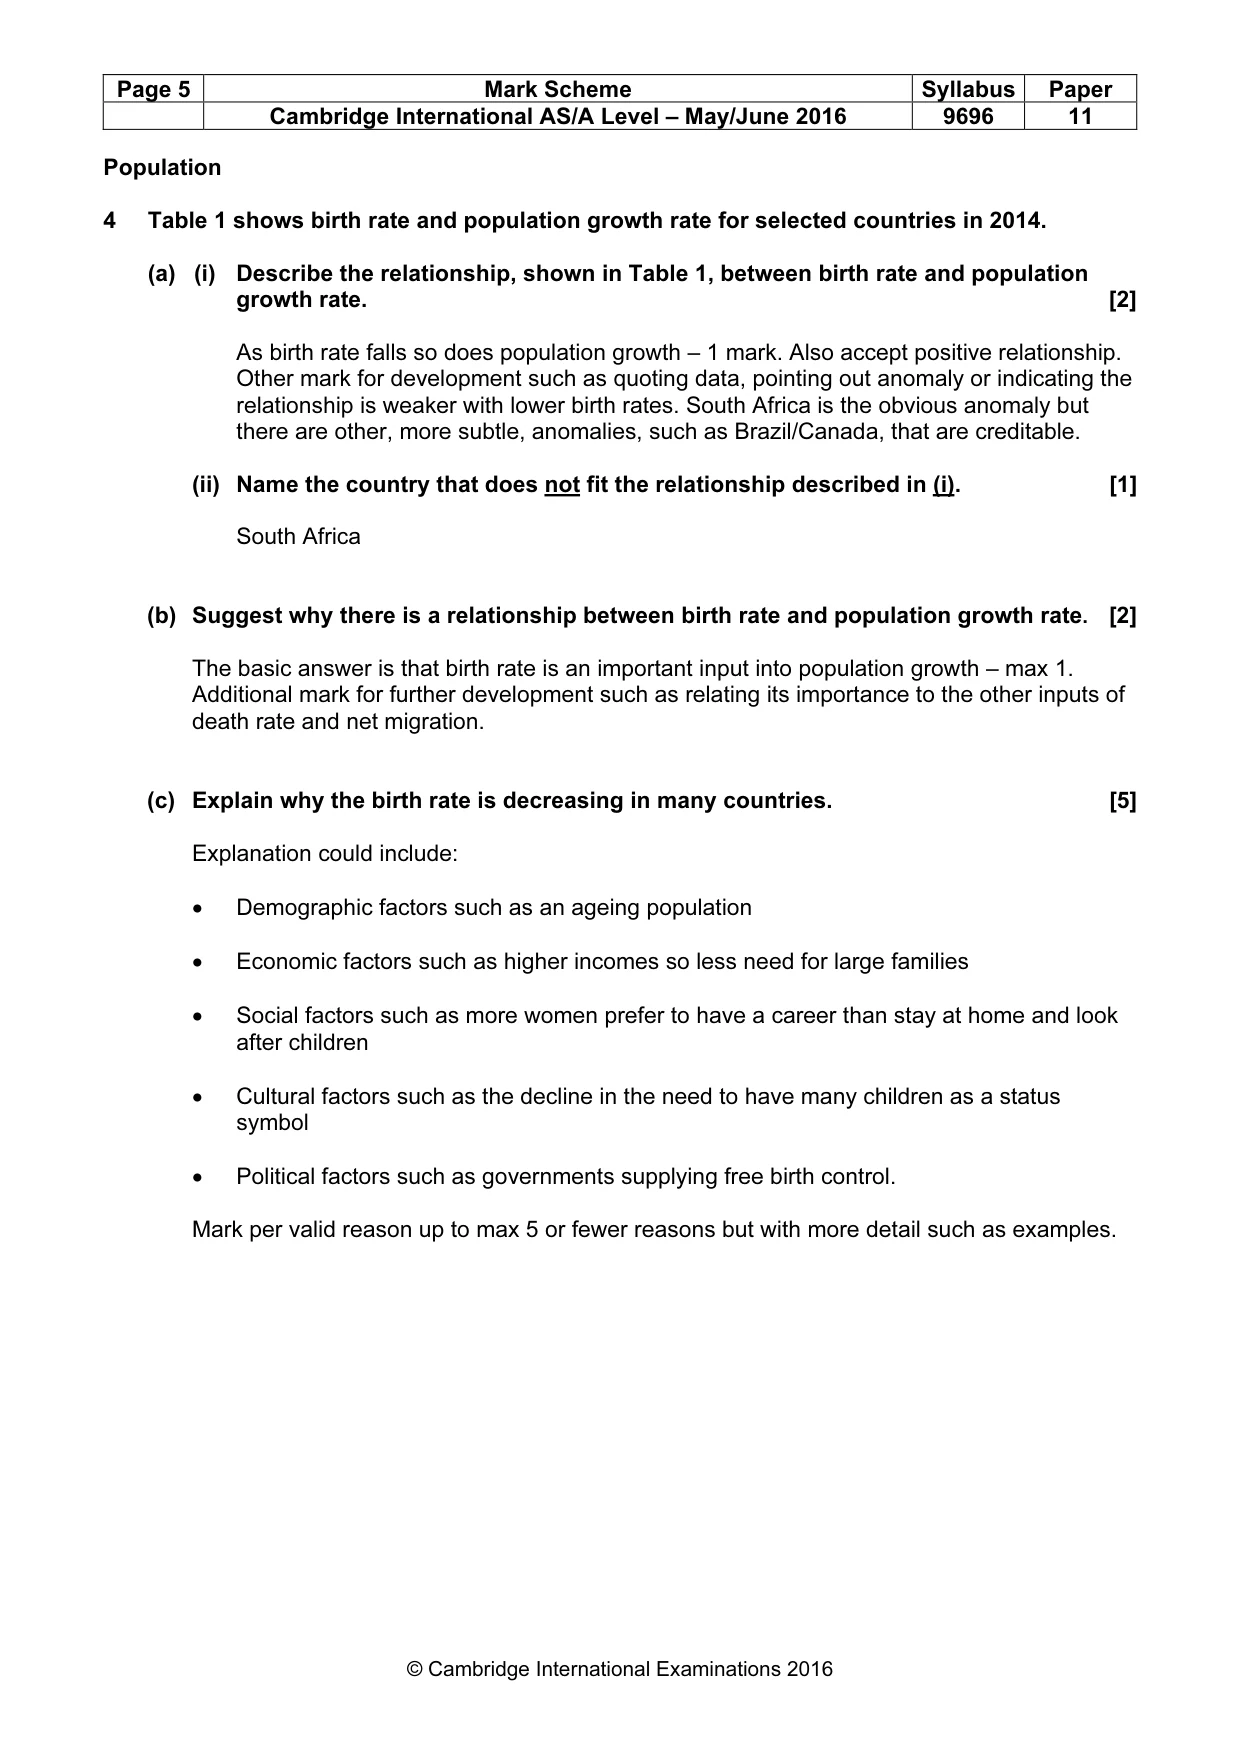
Page 5 Mark Scheme Syllabus Paper Cambridge International AS/A Level – May/June 2016 9696 11 © Cambridge International Examinations 2016 Population 4 Table 1 shows birth rate and population growth rate for selected countries in 2014. (a) (i) Describe the relationship, shown in Table 1, between birth rate and population growth rate. [2] As birth rate falls so does population growth – 1 mark. Also accept positive relationship. Other mark for development such as quoting data, pointing out anomaly or indicating the relationship is weaker with lower birth rates. South Africa is the obvious anomaly but there are other, more subtle, anomalies, such as Brazil/Canada, that are creditable. (ii) Name the country that does not fit the relationship described in (i). [1] South Africa (b) Suggest why there is a relationship between birth rate and population growth rate. [2] The basic answer is that birth rate is an important input into population growth – max 1. Additional mark for further development such as relating its importance to the other inputs of death rate and net migration. (c) Explain why the birth rate is decreasing in many countries. [5] Explanation could include: • Demographic factors such as an ageing population • Economic factors such as higher incomes so less need for large families • Social factors such as more women prefer to have a career than stay at home and look after children • Cultural factors such as the decline in the need to have many children as a status symbol • Political factors such as governments supplying free birth control. Mark per valid reason up to max 5 or fewer reasons but with more detail such as examples.
Mark scheme, page 6
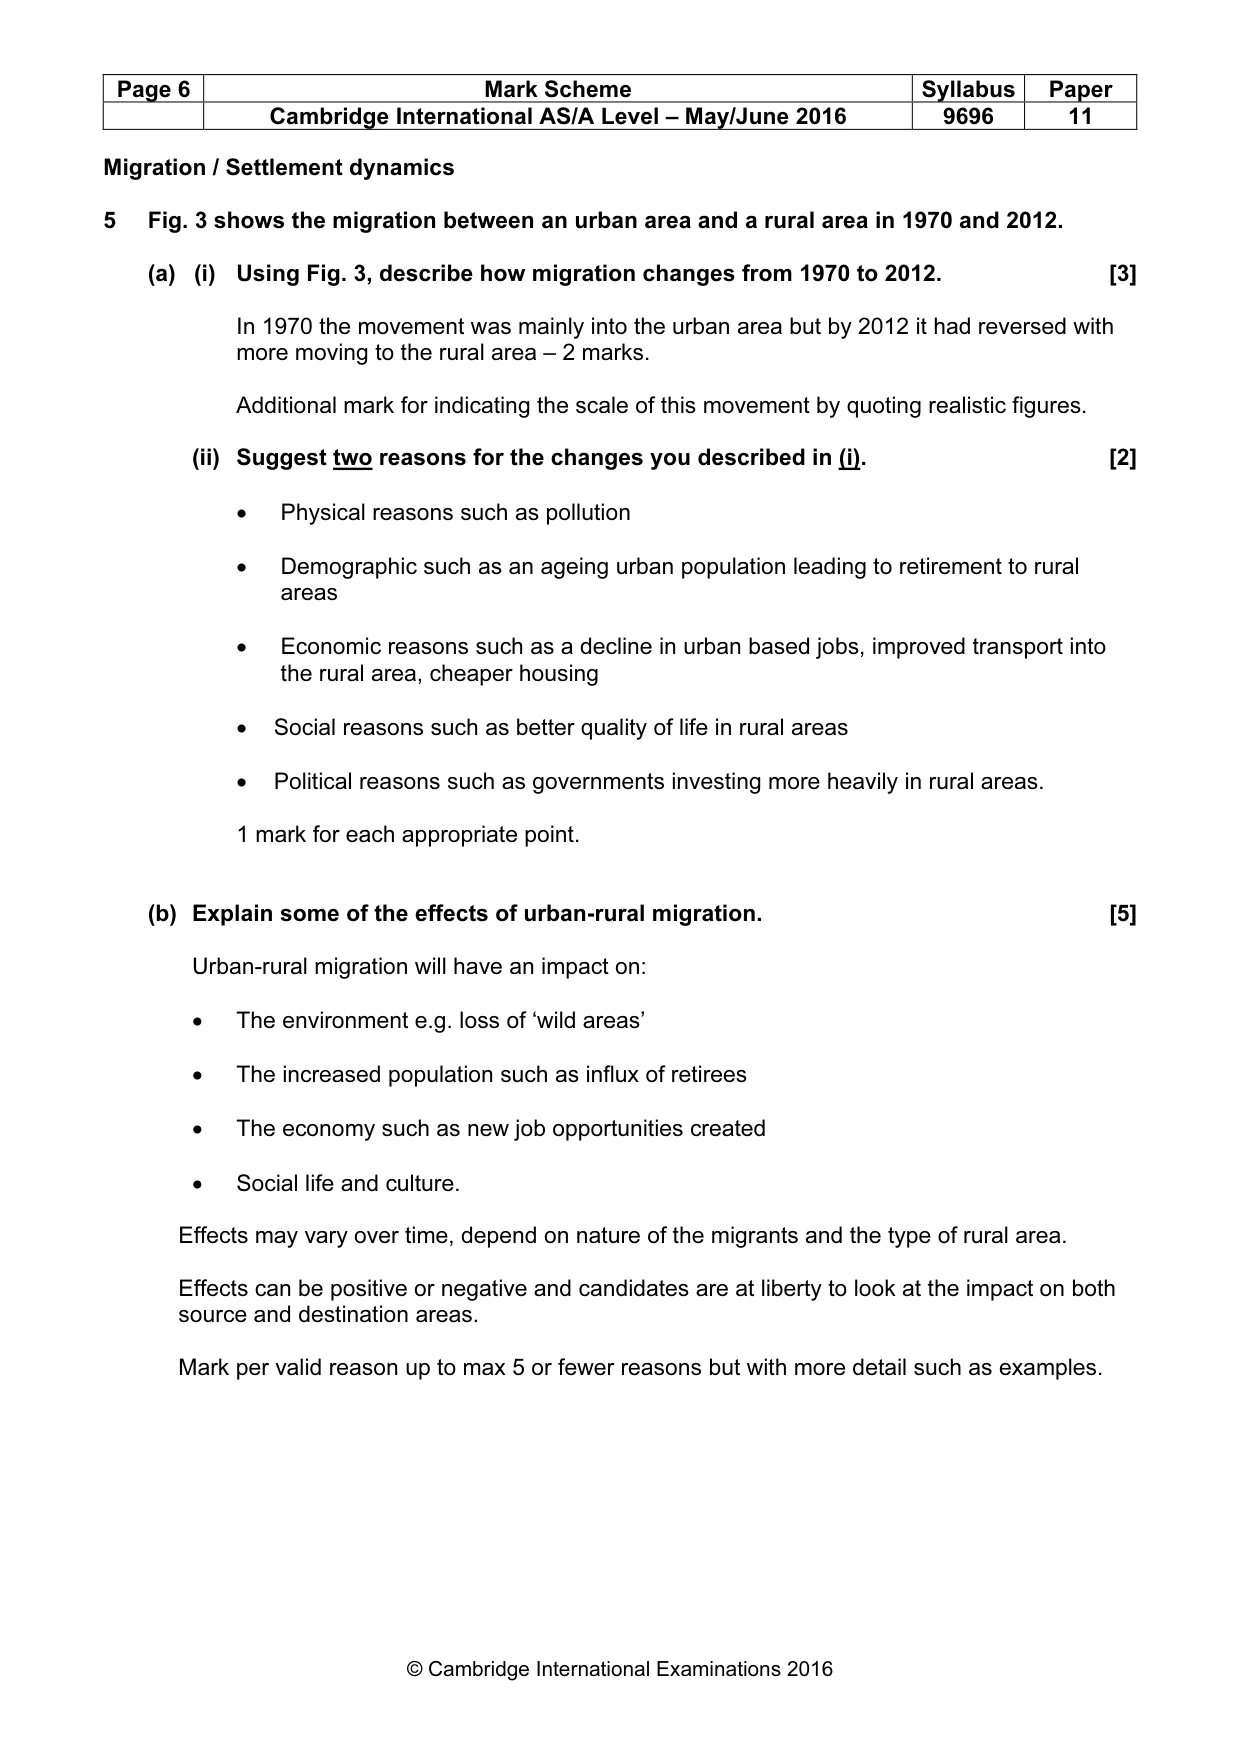
Page 6 Mark Scheme Syllabus Paper Cambridge International AS/A Level – May/June 2016 9696 11 © Cambridge International Examinations 2016 Migration / Settlement dynamics 5 Fig. 3 shows the migration between an urban area and a rural area in 1970 and 2012. (a) (i) Using Fig. 3, describe how migration changes from 1970 to 2012. [3] In 1970 the movement was mainly into the urban area but by 2012 it had reversed with more moving to the rural area – 2 marks. Additional mark for indicating the scale of this movement by quoting realistic figures. (ii) Suggest two reasons for the changes you described in (i). [2] • Physical reasons such as pollution • Demographic such as an ageing urban population leading to retirement to rural areas • Economic reasons such as a decline in urban based jobs, improved transport into the rural area, cheaper housing • Social reasons such as better quality of life in rural areas • Political reasons such as governments investing more heavily in rural areas. 1 mark for each appropriate point. (b) Explain some of the effects of urban-rural migration. [5] Urban-rural migration will have an impact on: • The environment e.g. loss of ‘wild areas’ • The increased population such as influx of retirees • The economy such as new job opportunities created • Social life and culture. Effects may vary over time, depend on nature of the migrants and the type of rural area. Effects can be positive or negative and candidates are at liberty to look at the impact on both source and destination areas. Mark per valid reason up to max 5 or fewer reasons but with more detail such as examples.
Mark scheme, page 7
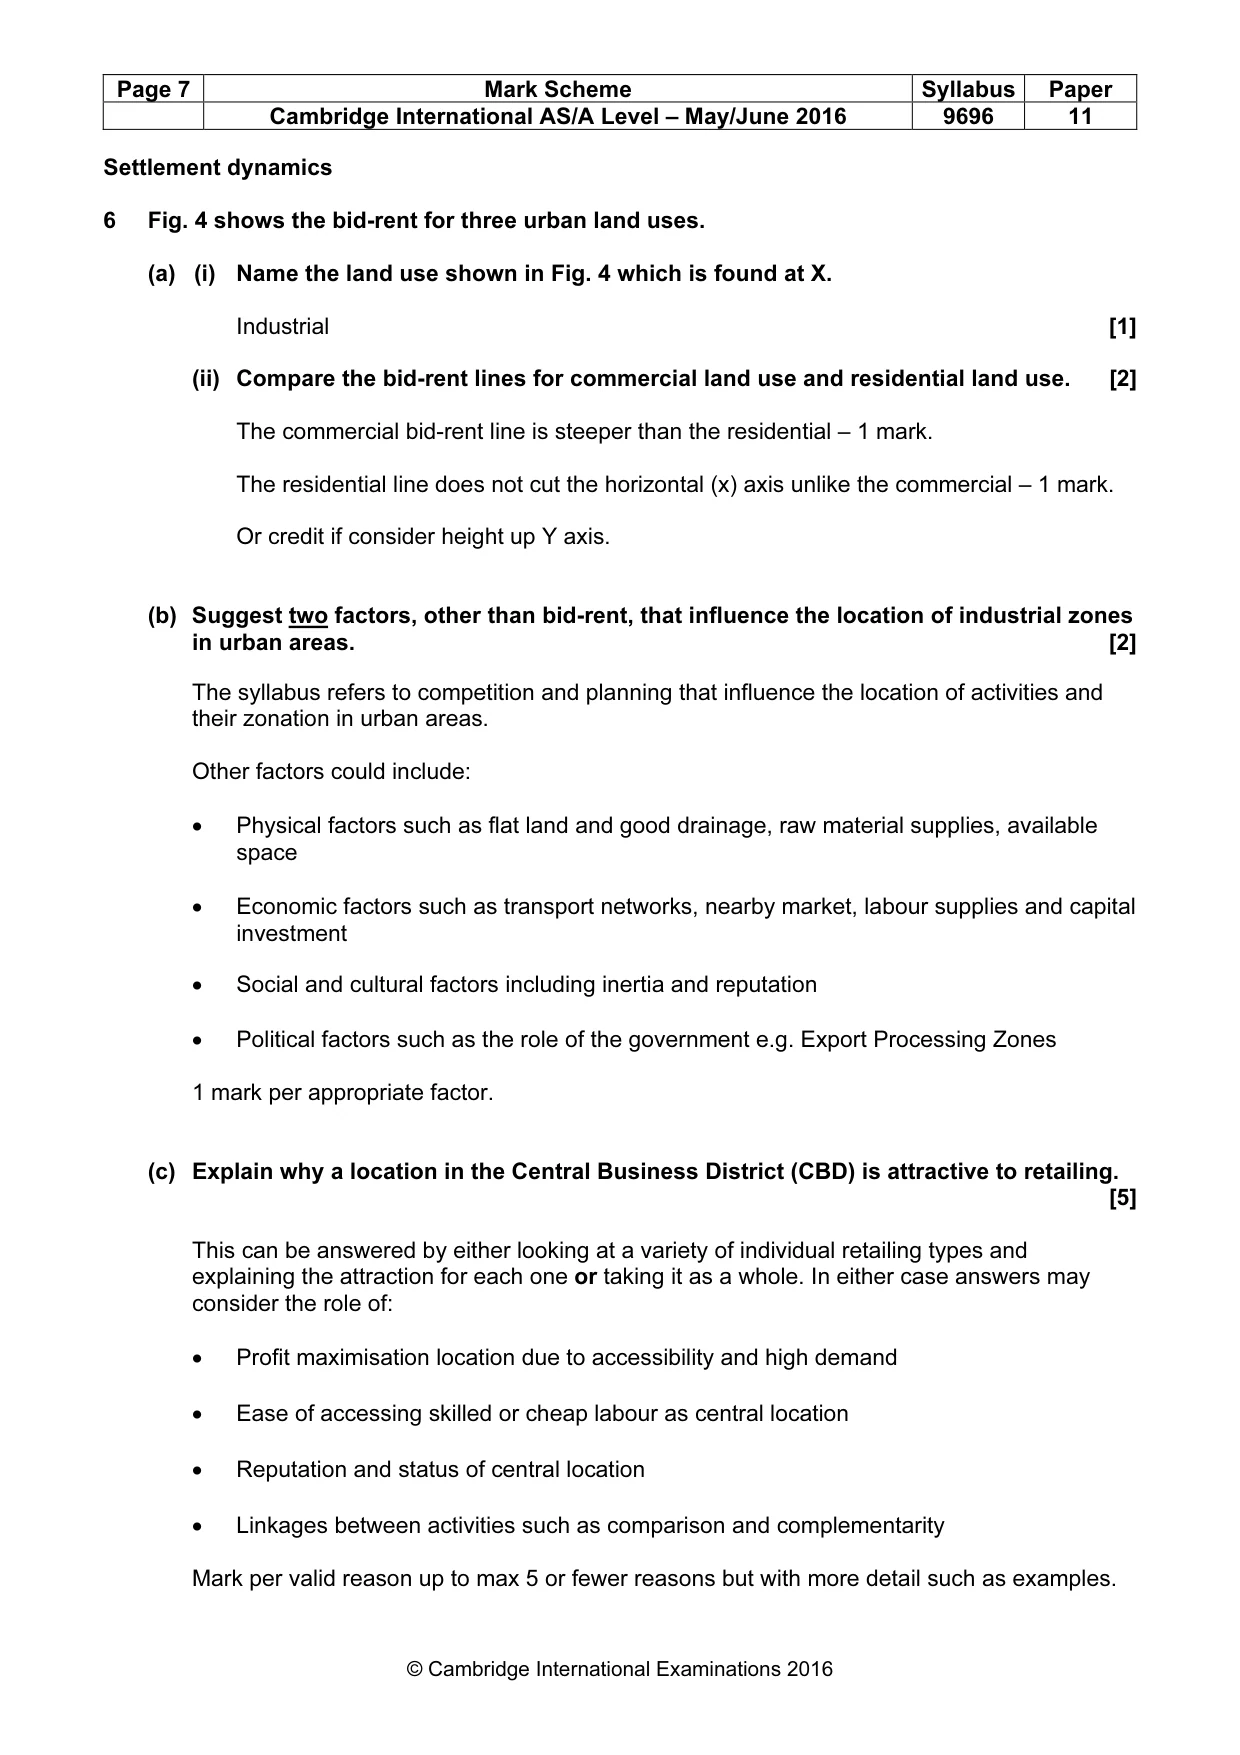
Page 7 Mark Scheme Syllabus Paper Cambridge International AS/A Level – May/June 2016 9696 11 © Cambridge International Examinations 2016 Settlement dynamics 6 Fig. 4 shows the bid-rent for three urban land uses. (a) (i) Name the land use shown in Fig. 4 which is found at X. Industrial [1] (ii) Compare the bid-rent lines for commercial land use and residential land use. [2] The commercial bid-rent line is steeper than the residential – 1 mark. The residential line does not cut the horizontal (x) axis unlike the commercial – 1 mark. Or credit if consider height up Y axis. (b) Suggest two factors, other than bid-rent, that influence the location of industrial zones in urban areas. [2] The syllabus refers to competition and planning that influence the location of activities and their zonation in urban areas. Other factors could include: • Physical factors such as flat land and good drainage, raw material supplies, available space • Economic factors such as transport networks, nearby market, labour supplies and capital investment • Social and cultural factors including inertia and reputation • Political factors such as the role of the government e.g. Export Processing Zones 1 mark per appropriate factor. (c) Explain why a location in the Central Business District (CBD) is attractive to retailing. [5] This can be answered by either looking at a variety of individual retailing types and explaining the attraction for each one or taking it as a whole. In either case answers may consider the role of: • Profit maximisation location due to accessibility and high demand • Ease of accessing skilled or cheap labour as central location • Reputation and status of central location • Linkages between activities such as comparison and complementarity Mark per valid reason up to max 5 or fewer reasons but with more detail such as examples.
Mark scheme, page 8
Page 8 Mark Scheme Syllabus Paper Cambridge International AS/A Level – May/June 2016 9696 11 © Cambridge International Examinations 2016 Section B: The Physical Core Answer one question from this section. All questions carry 25 marks. Hydrology and fluvial geomorphology 7 (a) (i) Define the hydrological terms percolation and infiltration. [4] Percolation: the vertical (downward) movement of water (1 mark) through the soil and/or bedrock (1 mark) Infiltration: the movement of water into the soil (1 mark) from the soil surface (1 mark). (ii) Explain what is meant by the term drainage density. [3] This is one indication of the character of a drainage basin. It is calculated by dividing the total length of all the channels in a drainage basin by the area of the drainage basin. It is perfectly possible to explain what it is meant without the precise definition. But there needs to be some reference to total length of tributaries (drainage channels) with respect to the size of the drainage basin. Referring to the number (amount) of channels could receive a little credit but should still be with reference to drainage basin size. (b) With the aid of diagrams, describe and explain two different patterns of flow that are found within rivers. [8] A discussion of two of the three dominant patterns of flow stated within the syllabus may be given – laminar, turbulent and helicoidal. If laminar flow is chosen as one of the two types of flow, it must be appreciated that this is mainly a theoretical type of flow. The diagrams should show laminar flow arrows in parallel layers and direction. Turbulent flow diagram should show the flow arrows to be more randomly located. Helicoidal flow can typically be drawn showing a movement from one bank to the other and possibly by a cross-section showing the surface movement and return flow at depth. Accept braiding and thalweg patterns as patterns of flow. The description can be found within the diagrams, with additional text to support. Laminar flow is the least common, because of the properties of water. It is easily disrupted by the presence of particles within the water or on the river bed. In reality it is very uncommon. Helicoidal flow is often cited as the reason for the development of meanders. Turbulent flow is the least regular, and may result in the localised direction of flow being contrary to the dominant direction of flow usually caused by bed roughness, boulders etc., Maximum 5 if only one flow described and fully explained. Maximum 5 if no diagram. Maximum 6 if clearly no explanation.
Mark scheme, page 9
Page 9 Mark Scheme Syllabus Paper Cambridge International AS/A Level – May/June 2016 9696 11 © Cambridge International Examinations 2016 (c) Assess the extent to which floods are caused by human activity. [10] The use of case study material is valuable here. Human activity, such as deforestation and urbanisation, can contribute to increased runoff and the cause of the flood, but it cannot be the sole reason for a flood. Natural factors include high precipitation amount and snow melt. Therefore, a discussion about the key causes of a flood is needed, and the degree to which human activity contributes to each cause. Human actions can also reduce the relative incidence of flooding by hard and soft engineering and catchment modification, but discussion of this is not necessary to achieve a mark in Level 3. Level 3 A detailed and well balanced answer that looks comprehensively at both sides and makes a well-exemplified evaluation. A range of factors are presented accurately. [8–10] Level 2 A less detailed and somewhat unbalanced attempt to assess the extent to which floods are caused by human activity. A range of factors are mentioned but may be lacking in detail and variety. There is a less balanced argument or the evaluation is limited. [5–7] Level 1 A basic answer with little attempt to evaluate and with little knowledge of a range of factors that may cause floods. Lists and basic description are characteristic of answers at this level. [1–4] For no response, or no creditable response, 0.
Mark scheme, page 10
Page 10 Mark Scheme Syllabus Paper Cambridge International AS/A Level – May/June 2016 9696 11 © Cambridge International Examinations 2016 Atmosphere and weather 8 (a) (i) Define the atmospheric terms latent heat and evaporation. [4] Latent heat is the amount of heat energy needed (1 mark) to change the substance from say a liquid to a gas (1 mark) or the heat released (1 mark) when a gas condenses into a liquid (1 mark). Evaporation is the process of a change of state from a liquid to a gas (1 mark) by heat (1 mark). (ii) Explain one way a temperature inversion forms. [3] There should be a statement as to what it is at the beginning. Reference could be made either to low level temperature inversions – where colder air is overlaid by warmer air from the rapid cooling of the ground – or high level temperature inversions. A discussion of radiation could be presented. (Rapid cooling of a valley floor at night and anticyclonic conditions. The air above is warmer and moist). Frontal temperature inversions are also valid as is advection. (b) With the aid of diagrams, explain how convection and orographic uplift can lead to precipitation. [8] Orographic uplift of air is most likely to create orographic rainfall if the air is moist and close to saturation point. A diagram showing the passage of air over a mountainous region and the correct placement of rainfall is worthy of credit. An advanced discussion may develop the concept of lapse rates and explain that as air is forced to rise, dew point could be reached thus changing DALR to SALR and instability could occur should the temperature of the uplifted air be greater than the temperature of the surrounding air. Convection in the atmosphere refers to the heating of low level air, resulting in the warmer air rising and being replaced by cooler air. This rising air, if sufficiently moist, can lead to condensation and thus precipitation. Maximum of 5 marks without diagrams. Maximum 5 marks if only one process is explained.
Mark scheme, page 11
Page 11 Mark Scheme Syllabus Paper Cambridge International AS/A Level – May/June 2016 9696 11 © Cambridge International Examinations 2016 (c) To what extent does the distribution of land and sea affect the global distribution of temperature? [10] Energy is absorbed and radiated differently depending on the surface upon which it falls. The sea has a higher specific heat capacity and is capable of transmitting heat more deeply. Therefore, the sea requires more energy to raise its temperature when compared to an equivalent mass of land. The argument could be presented that this distribution may affect the range of temperatures seen. The candidate needs to discuss other factors which affect the global distribution of temperature, such as ocean currents, height above sea level, prevailing wind, latitude and angle of the sun. Level 3 A detailed and well balanced answer that looks comprehensively at the extent to which land and sea distribution influences the global distribution of temperature, and also the influence of other factors. The argument may be supported through examples and there is a clear evaluation. [8–10] Level 2 A less detailed and somewhat unbalanced attempt to assess the extent to which land and sea distribution influences global temperature. A range of other factors are mentioned but may be lacking in detail and variety. There is a less balanced argument and limited evaluation. [5–7] Level 1 A basic answer with little attempt to evaluate and with little knowledge of the range of factors which affect global temperature. The evaluation is limited or not present. Lists and basic description are characteristic of answers at this level. [1–4] For no response, or no creditable response, 0.
Mark scheme, page 12
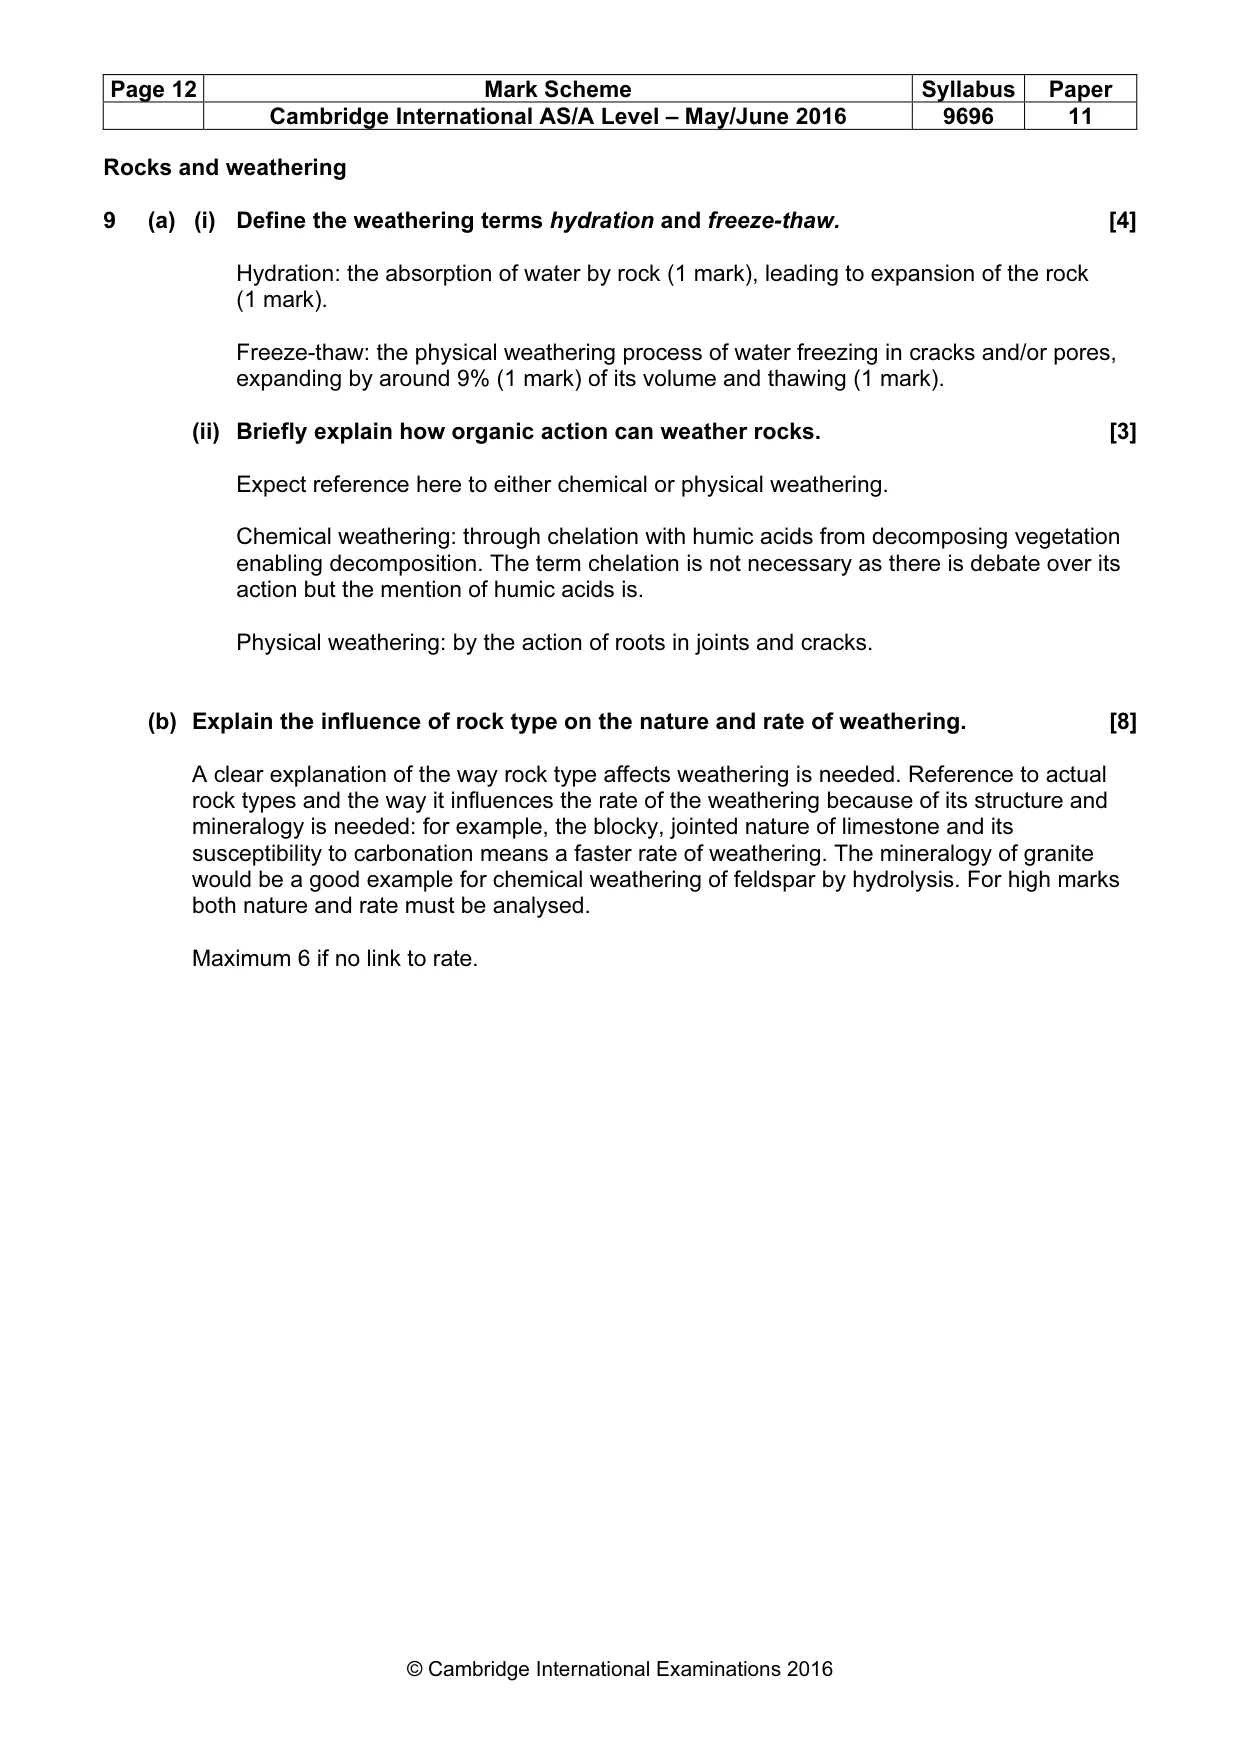
Page 12 Mark Scheme Syllabus Paper Cambridge International AS/A Level – May/June 2016 9696 11 © Cambridge International Examinations 2016 Rocks and weathering 9 (a) (i) Define the weathering terms hydration and freeze-thaw. [4] Hydration: the absorption of water by rock (1 mark), leading to expansion of the rock (1 mark). Freeze-thaw: the physical weathering process of water freezing in cracks and/or pores, expanding by around 9% (1 mark) of its volume and thawing (1 mark). (ii) Briefly explain how organic action can weather rocks. [3] Expect reference here to either chemical or physical weathering. Chemical weathering: through chelation with humic acids from decomposing vegetation enabling decomposition. The term chelation is not necessary as there is debate over its action but the mention of humic acids is. Physical weathering: by the action of roots in joints and cracks. (b) Explain the influence of rock type on the nature and rate of weathering. [8] A clear explanation of the way rock type affects weathering is needed. Reference to actual rock types and the way it influences the rate of the weathering because of its structure and mineralogy is needed: for example, the blocky, jointed nature of limestone and its susceptibility to carbonation means a faster rate of weathering. The mineralogy of granite would be a good example for chemical weathering of feldspar by hydrolysis. For high marks both nature and rate must be analysed. Maximum 6 if no link to rate.
Mark scheme, page 13
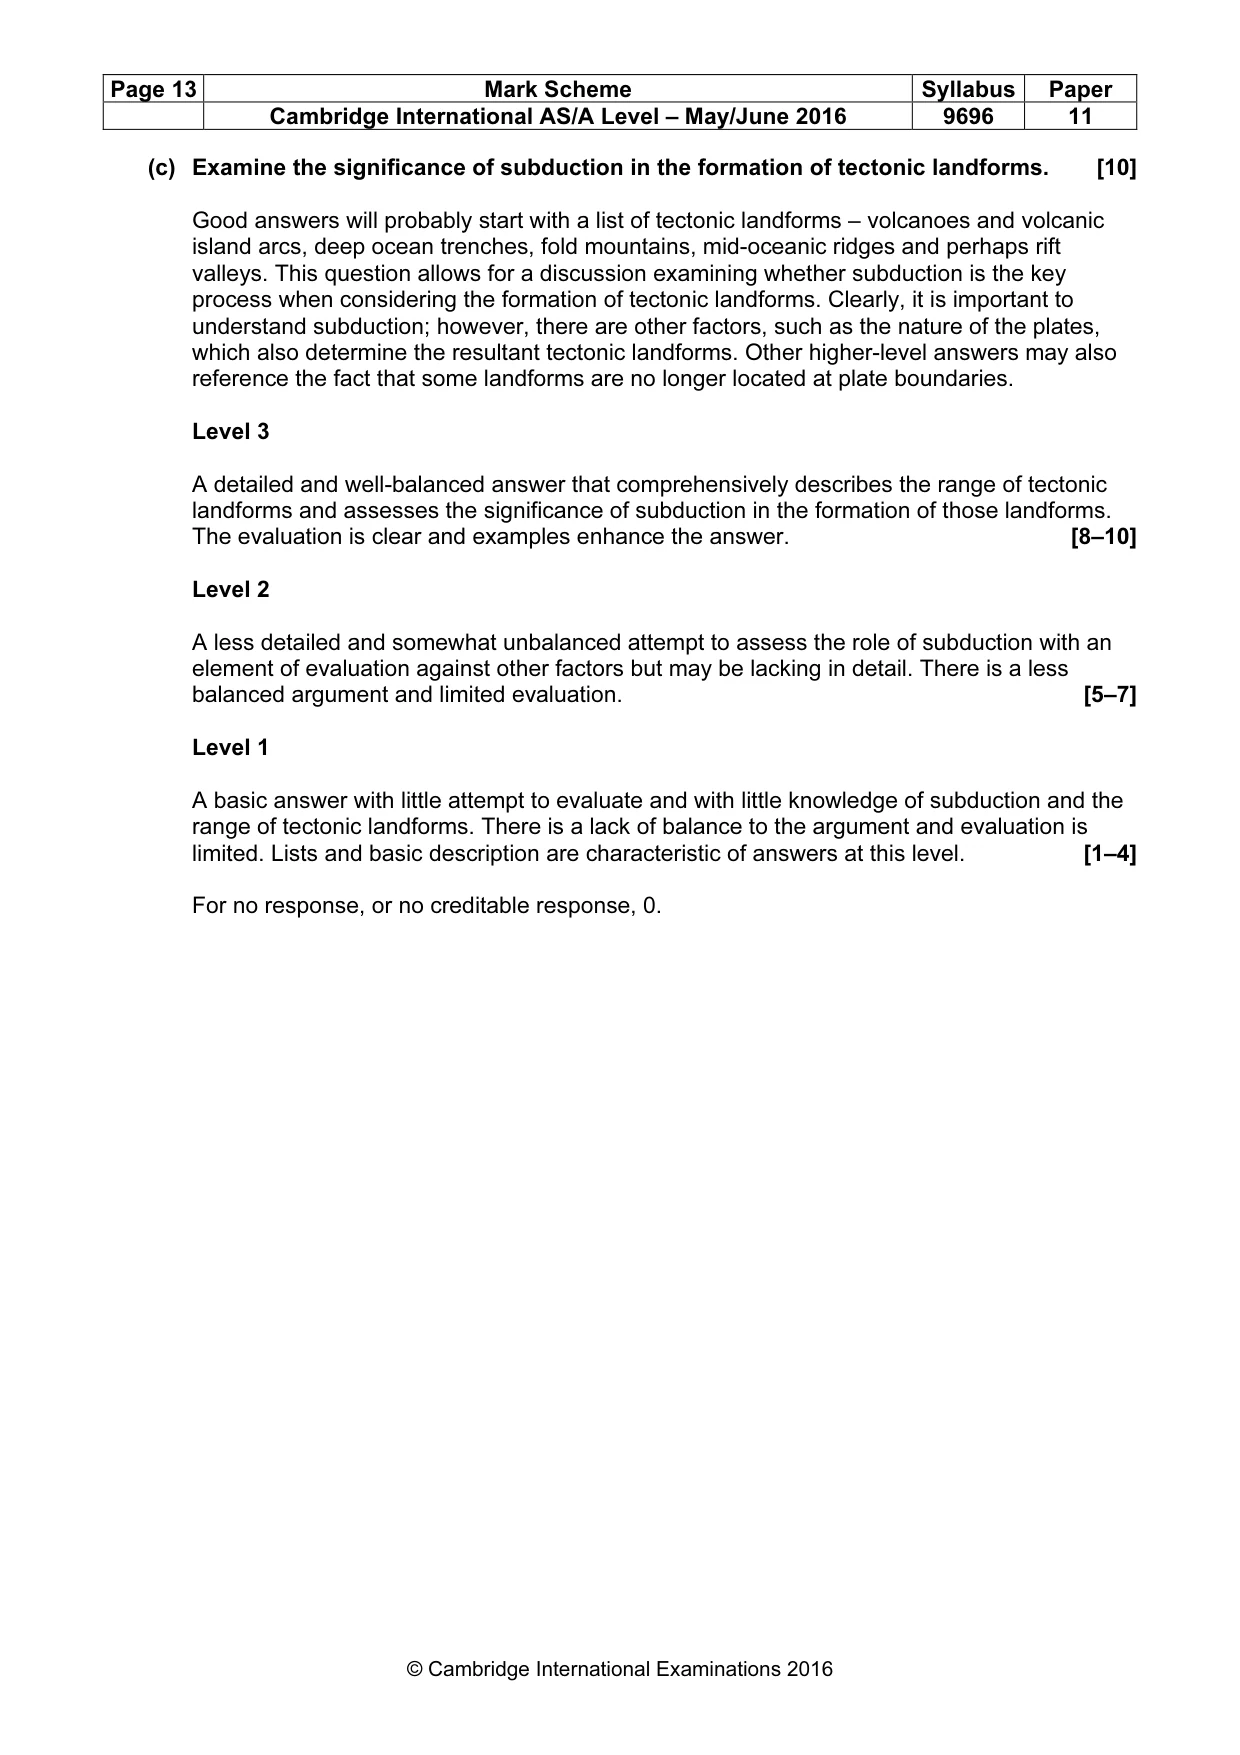
Page 13 Mark Scheme Syllabus Paper Cambridge International AS/A Level – May/June 2016 9696 11 © Cambridge International Examinations 2016 (c) Examine the significance of subduction in the formation of tectonic landforms. [10] Good answers will probably start with a list of tectonic landforms – volcanoes and volcanic island arcs, deep ocean trenches, fold mountains, mid-oceanic ridges and perhaps rift valleys. This question allows for a discussion examining whether subduction is the key process when considering the formation of tectonic landforms. Clearly, it is important to understand subduction; however, there are other factors, such as the nature of the plates, which also determine the resultant tectonic landforms. Other higher-level answers may also reference the fact that some landforms are no longer located at plate boundaries. Level 3 A detailed and well-balanced answer that comprehensively describes the range of tectonic landforms and assesses the significance of subduction in the formation of those landforms. The evaluation is clear and examples enhance the answer. [8–10] Level 2 A less detailed and somewhat unbalanced attempt to assess the role of subduction with an element of evaluation against other factors but may be lacking in detail. There is a less balanced argument and limited evaluation. [5–7] Level 1 A basic answer with little attempt to evaluate and with little knowledge of subduction and the range of tectonic landforms. There is a lack of balance to the argument and evaluation is limited. Lists and basic description are characteristic of answers at this level. [1–4] For no response, or no creditable response, 0.
Mark scheme, page 14
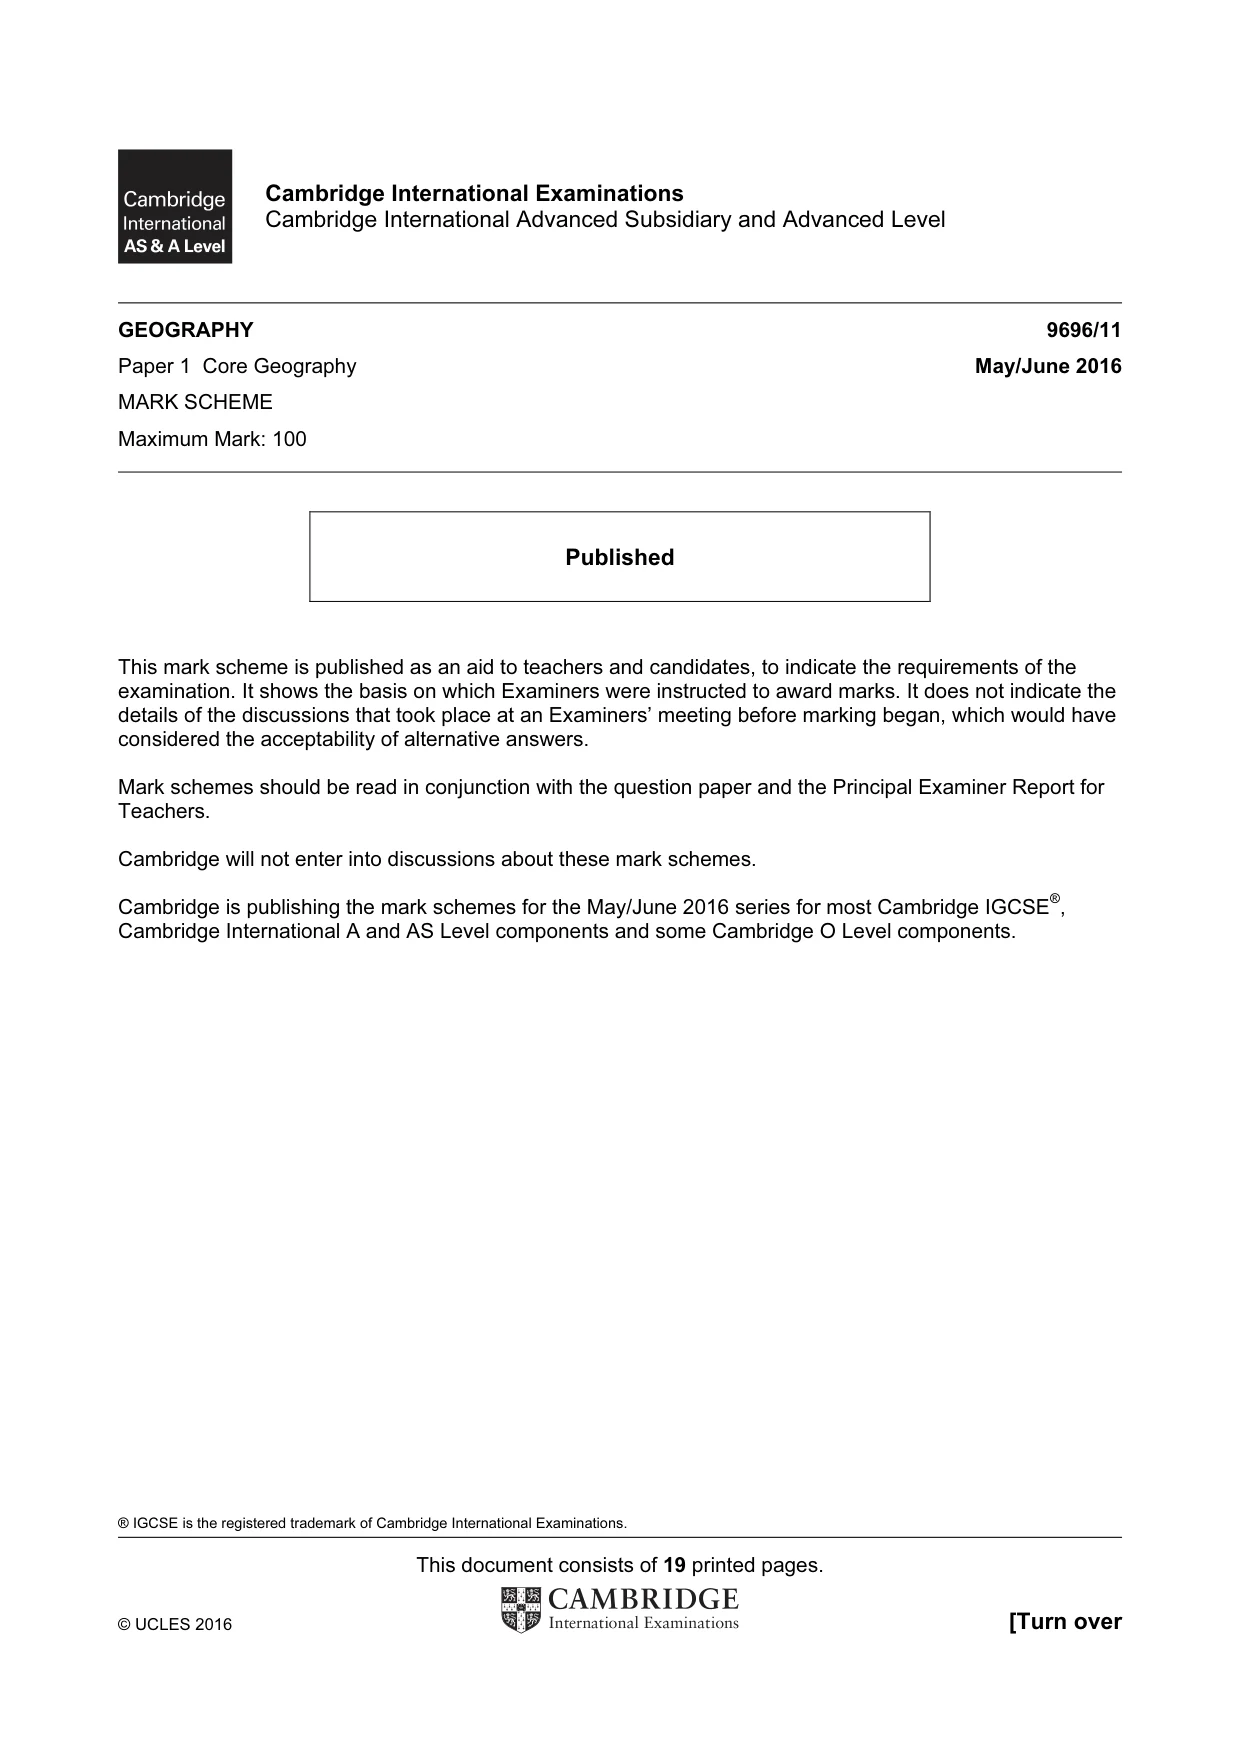
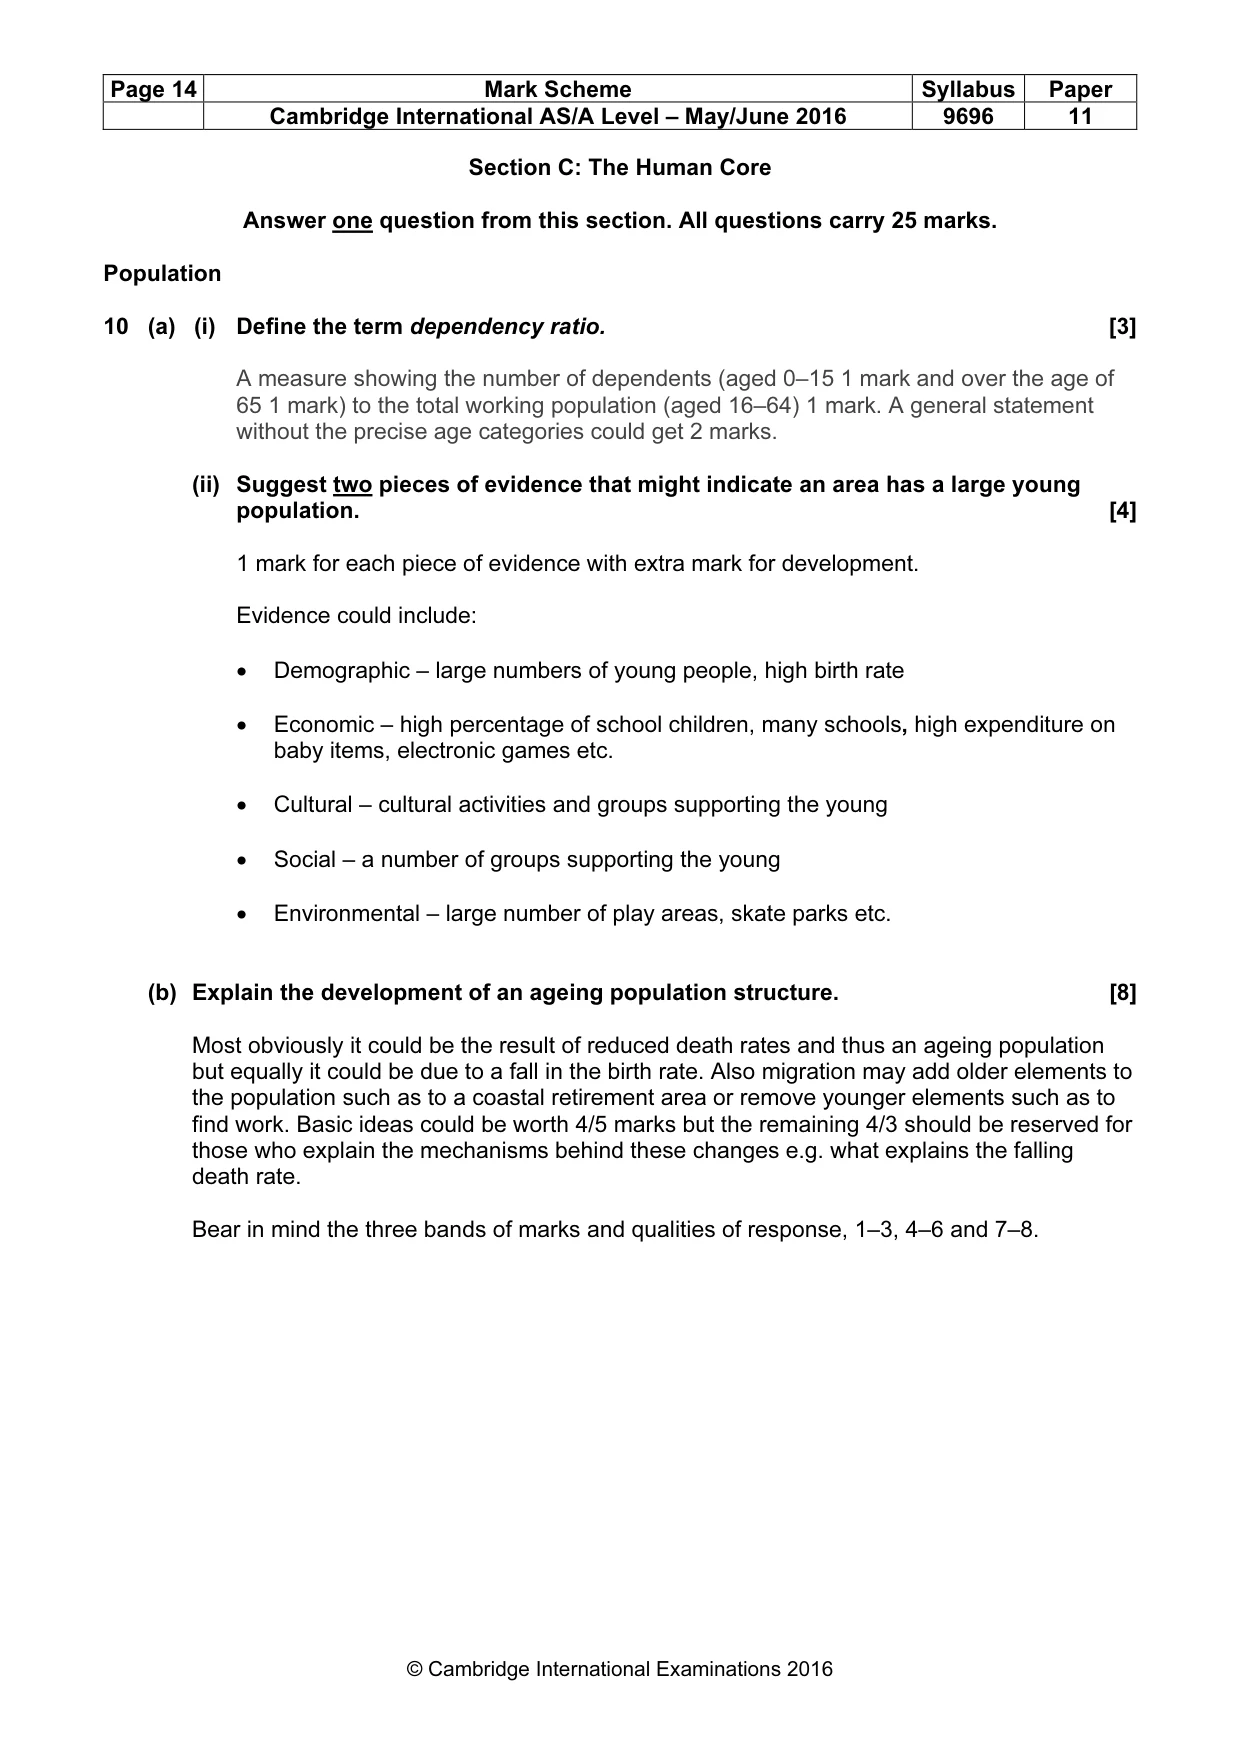
Page 14 Mark Scheme Syllabus Paper Cambridge International AS/A Level – May/June 2016 9696 11 © Cambridge International Examinations 2016 Section C: The Human Core Answer one question from this section. All questions carry 25 marks. Population 10 (a) (i) Define the term dependency ratio. [3] A measure showing the number of dependents (aged 0–15 1 mark and over the age of 65 1 mark) to the total working population (aged 16–64) 1 mark. A general statement without the precise age categories could get 2 marks. (ii) Suggest two pieces of evidence that might indicate an area has a large young population. [4] 1 mark for each piece of evidence with extra mark for development. Evidence could include: • Demographic – large numbers of young people, high birth rate • Economic – high percentage of school children, many schools, high expenditure on baby items, electronic games etc. • Cultural – cultural activities and groups supporting the young • Social – a number of groups supporting the young • Environmental – large number of play areas, skate parks etc. (b) Explain the development of an ageing population structure. [8] Most obviously it could be the result of reduced death rates and thus an ageing population but equally it could be due to a fall in the birth rate. Also migration may add older elements to the population such as to a coastal retirement area or remove younger elements such as to find work. Basic ideas could be worth 4/5 marks but the remaining 4/3 should be reserved for those who explain the mechanisms behind these changes e.g. what explains the falling death rate. Bear in mind the three bands of marks and qualities of response, 1–3, 4–6 and 7–8.
Mark scheme, page 15
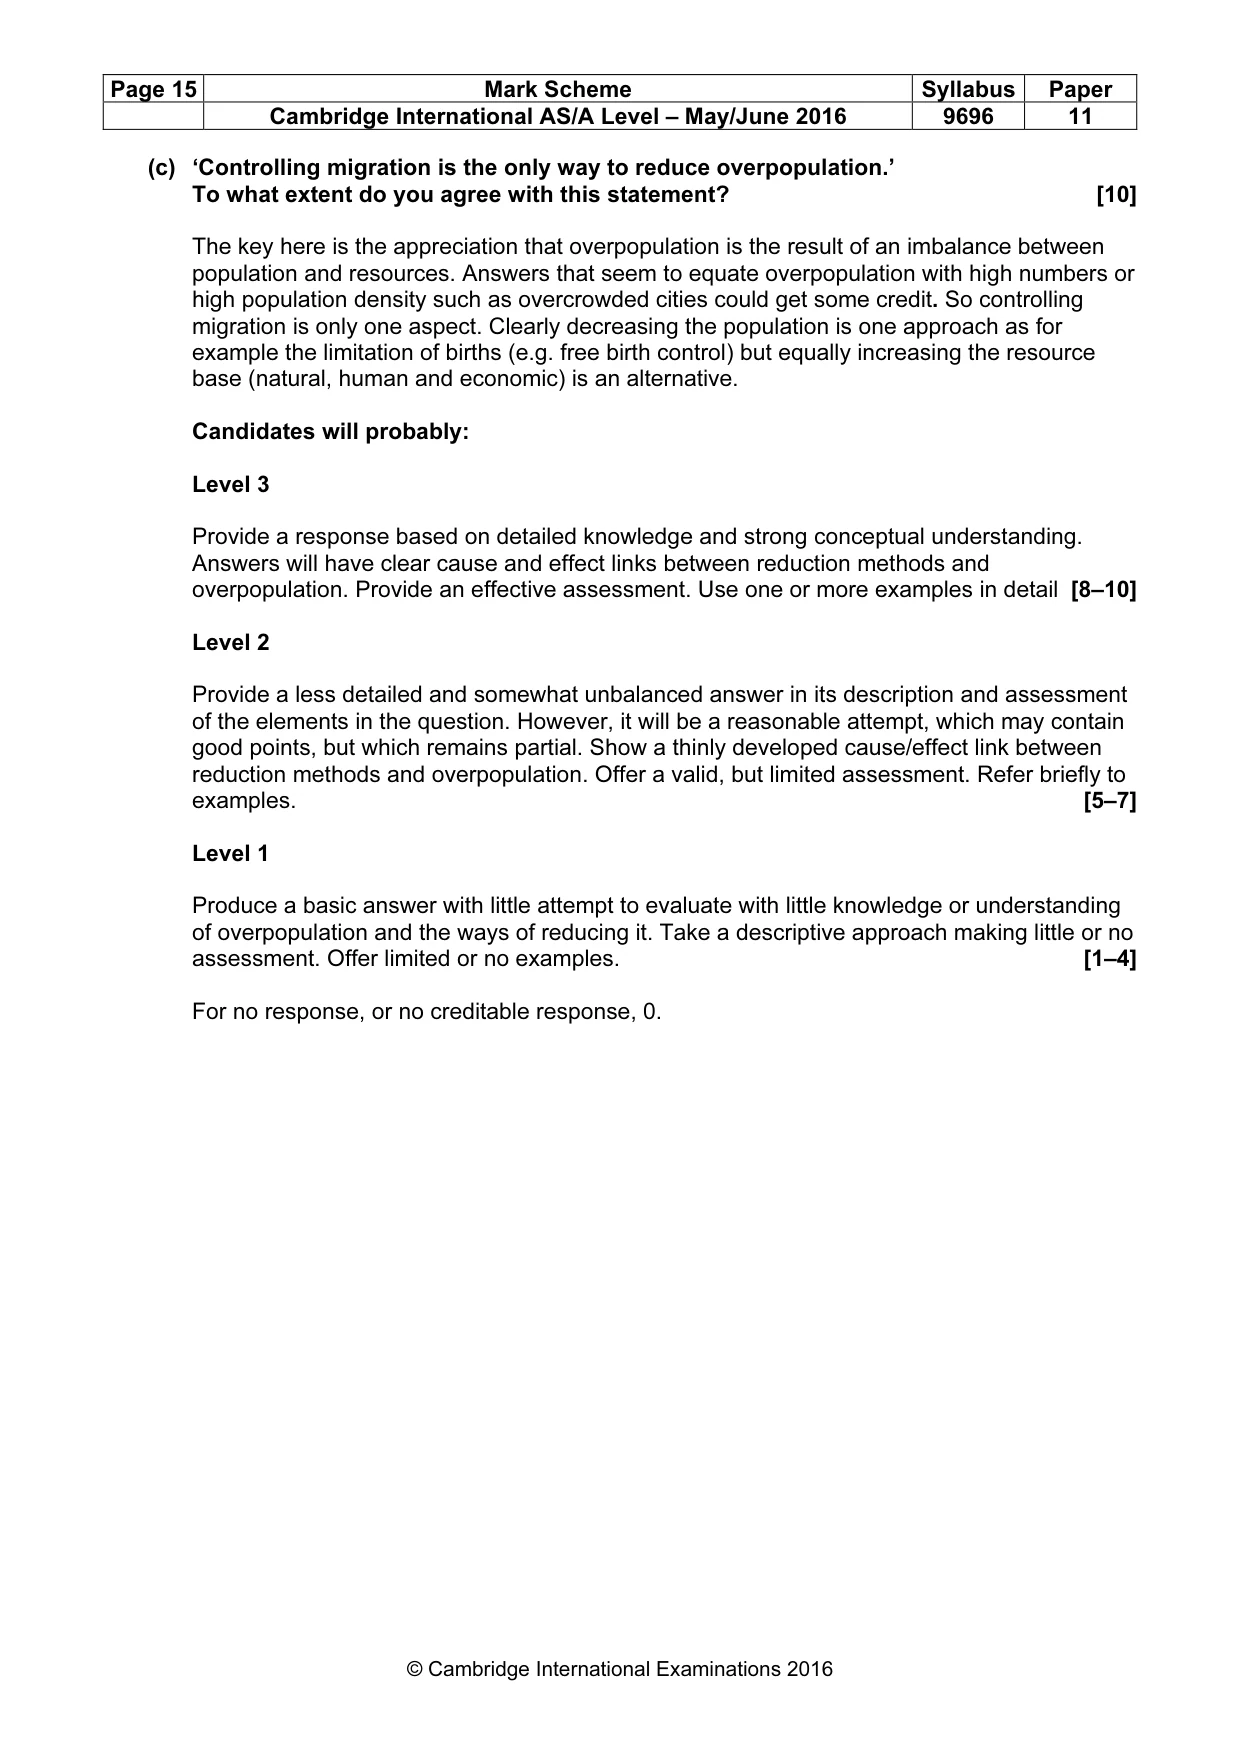
Page 15 Mark Scheme Syllabus Paper Cambridge International AS/A Level – May/June 2016 9696 11 © Cambridge International Examinations 2016 (c) ‘Controlling migration is the only way to reduce overpopulation.’ To what extent do you agree with this statement? [10] The key here is the appreciation that overpopulation is the result of an imbalance between population and resources. Answers that seem to equate overpopulation with high numbers or high population density such as overcrowded cities could get some credit. So controlling migration is only one aspect. Clearly decreasing the population is one approach as for example the limitation of births (e.g. free birth control) but equally increasing the resource base (natural, human and economic) is an alternative. Candidates will probably: Level 3 Provide a response based on detailed knowledge and strong conceptual understanding. Answers will have clear cause and effect links between reduction methods and overpopulation. Provide an effective assessment. Use one or more examples in detail [8–10] Level 2 Provide a less detailed and somewhat unbalanced answer in its description and assessment of the elements in the question. However, it will be a reasonable attempt, which may contain good points, but which remains partial. Show a thinly developed cause/effect link between reduction methods and overpopulation. Offer a valid, but limited assessment. Refer briefly to examples. [5–7] Level 1 Produce a basic answer with little attempt to evaluate with little knowledge or understanding of overpopulation and the ways of reducing it. Take a descriptive approach making little or no assessment. Offer limited or no examples. [1–4] For no response, or no creditable response, 0.
Mark scheme, page 16
Page 16 Mark Scheme Syllabus Paper Cambridge International AS/A Level – May/June 2016 9696 11 © Cambridge International Examinations 2016 Migration / Settlement dynamics 11 (a) (i) Give the meaning of the term forced (involuntary) migration. [2] There is a lack of choice/control by the individual in migrating – 1 mark. Additional mark for migration being over a duration of one year or a fuller notion such as endangerment to life, freedom or livelihood or by giving a valid example. The International Organization for Migration defines forced migration as any person who migrates to "escape persecution, conflict, repression, natural and human-made disasters, ecological degradation, or other situations that endanger their lives, freedom or livelihood.” (ii) Suggest two reasons why forced migration occurs. [5] A number of sources recognise a variety of reasons such as: • Conflict induced reasons e.g. war • Social reasons e.g. religious or racial persecution • Natural disasters e.g. flood, famine, disease • Development induced reasons e.g. to flood their village for a dam. • Political such as resettlement • Historic e.g. slavery Mark as 2/3 or 3/2 (b) Explain how the arrival of large numbers of forced migrants affects the receiving area.[8] Impacts may be: • Physical / environmental e.g. water shortages, increased pollution • Economic e.g. cost of housing and feeding them, impact on employment • Cultural e.g. new religions and cultures introduced • Social e.g. social tension increased, intermarriage with locals, need for schools etc. • Political e.g. unrest, impact on voting patterns. To some extent this depends on the nature of the migrants e.g. their wealth and the nature of the reception area e.g. LEDC v MEDC – a candidate developing these aspects could well be answering at the top band. Bear in mind the three bands of marks and qualities of response, 1–3, 4–6 and 7–8. If totally negative or positive impacts, then max 5.
Mark scheme, page 17
Page 17 Mark Scheme Syllabus Paper Cambridge International AS/A Level – May/June 2016 9696 11 © Cambridge International Examinations 2016 (c) To what extent is voluntary international migration the result of economic factors? [10] Many will see economic factors as paramount either as: • Driving forces as in terms of pushes (from the source area) and pulls (to the reception area) Or as • Enabling (or restricting factors) such as the cost of migration, availability of transport. Candidates should also appreciate that there are other social, cultural, environmental and political factors that influence voluntary migration. Candidates may appreciate that the balance of these factors may vary (e.g. between push and pull), with the nature of the migrants e.g. their wealth and age. A candidate assessing these aspects could well be answering at the top level. If misread as internal migration, maximum Level 1. Candidates will probably: Level 3 Make a response based on detailed knowledge and strong conceptual understanding. Answers will have clear cause and effect link between economic factors and voluntary migration. Provide an effective assessment with clear reference to other non-economic factors. Use one or more examples in detail. [8–10] Level 2 Provide a less detailed account which nevertheless makes a reasonable attempt, which may contain good points, but which remains partial. Show a thinly developed cause/effect link between economic factors and voluntary migration. Offer a valid, but limited assessment. Refer briefly to one or more examples. [5–7] Level 1 Provide a basic answer which offers one or more simple ideas and struggles to deal with the issue. Take a descriptive approach making little or no assessment. Offer limited or no example. [1–4] For no response, or no creditable response, 0.
Mark scheme, page 18
Page 18 Mark Scheme Syllabus Paper Cambridge International AS/A Level – May/June 2016 9696 11 © Cambridge International Examinations 2016 Settlement dynamics 12 (a) (i) Define the term urban renewal. [3] This is the process whereby the derelict or run down areas (1) of a town or city (1) are improved by upgrading existing buildings (1) and infrastructure (1). Any 3 for full marks. (ii) Describe two of the characteristics of urban renewal. [4] Characteristics can include: • Demolition of (usually older) buildings and structures and creation of new ones • Relocation of people, change in social groups • Location e.g. inner city • Relocation of economic activity and introduction of new more dynamic activities • Government intervention with grants, compulsory purchase of property etc. 2 x 2 marks. (b) Explain why there are large areas of urban renewal in many cities. [8] This focuses on why cities have large areas that need renewal. So answers may focus on MEDC cities with their long history of urban development resulting now in ageing buildings and infrastructure, changing economic forces such as the change from manufacturing to services and the changing expectations of populations such as the increased demand for newer or more spacious property. Equally renewal of LEDC cities is valid especially the renewal of shanty towns. Higher band responses may get behind the processes and examine the increased wealth of urban areas (and/or populations) which enable them to afford such schemes and the changing socio-political structures that enable governments to influence private property owners. Bear in mind the three bands of marks and qualities of response, 1–3, 4–6 and 7–8.
Mark scheme, page 19
Page 19 Mark Scheme Syllabus Paper Cambridge International AS/A Level – May/June 2016 9696 11 © Cambridge International Examinations 2016 (c) Evaluate the idea that shanty towns (squatter settlements) are areas of hope rather than of despair. [10] Shanty towns are often seen as purely negative due to the poor living conditions, insecurity, unemployment, lack of facilities – they are areas of despair where the disadvantaged end up. In reality there are many advantages of living in shanty towns such as cheap housing, flexible housing (can add bits as families grow), many have facilities (albeit often illegally), there is a strong sense of community and often they police themselves, there is a thriving ‘informal economy’ – they often are merely the first stage on an upward trend for the new migrant when they first arrive in the city. Those that recognise that there are two sides to this plus that it may vary with the ability and ambition of the individual shanty town dweller are likely to be in the top level. Candidates will probably: Level 3 Provide a response based on detailed knowledge and strong conceptual understanding. Answers will have clear cause and effect link between the nature of shanty towns and their advantages and disadvantages. Provide an effective assessment of the suggestion. Use one or more examples in detail. [8–10] Level 2 Provide a less detailed account which nevertheless makes a reasonable attempt, which may contain good points, but which remains partial. Show a thinly developed cause/effect link between the nature of shanty towns and their advantages and disadvantages. Offer a valid, but limited assessment. Refer briefly to one or more examples. [5–7] Level 1 Provide a basic answer which offers one or more simple ideas and struggles to deal with the issue. Take a descriptive approach making little or no assessment. Offer limited or no example. [1–4] For no response, or no creditable response, 0.
What you needed in this session
Cambridge’s own grade thresholds for 2016 May/June, Paper 1 · Variant 1. A higher threshold means an easier paper — the bar moves with how the cohort did.