Cambridge A Level Geography 9696 — 2016 May/June Paper 1 · Variant 2
9696/12/M/J/16 · 100 marks · ≈113 min
The question paper and its mark scheme, free to read here and free to download. This is Cambridge’s own paper, exactly as it was sat.
Question paper8 pages



Mark scheme18 pages
Answers below. Sit the paper first if you are practising.
Paper as text
Question paper, page 1
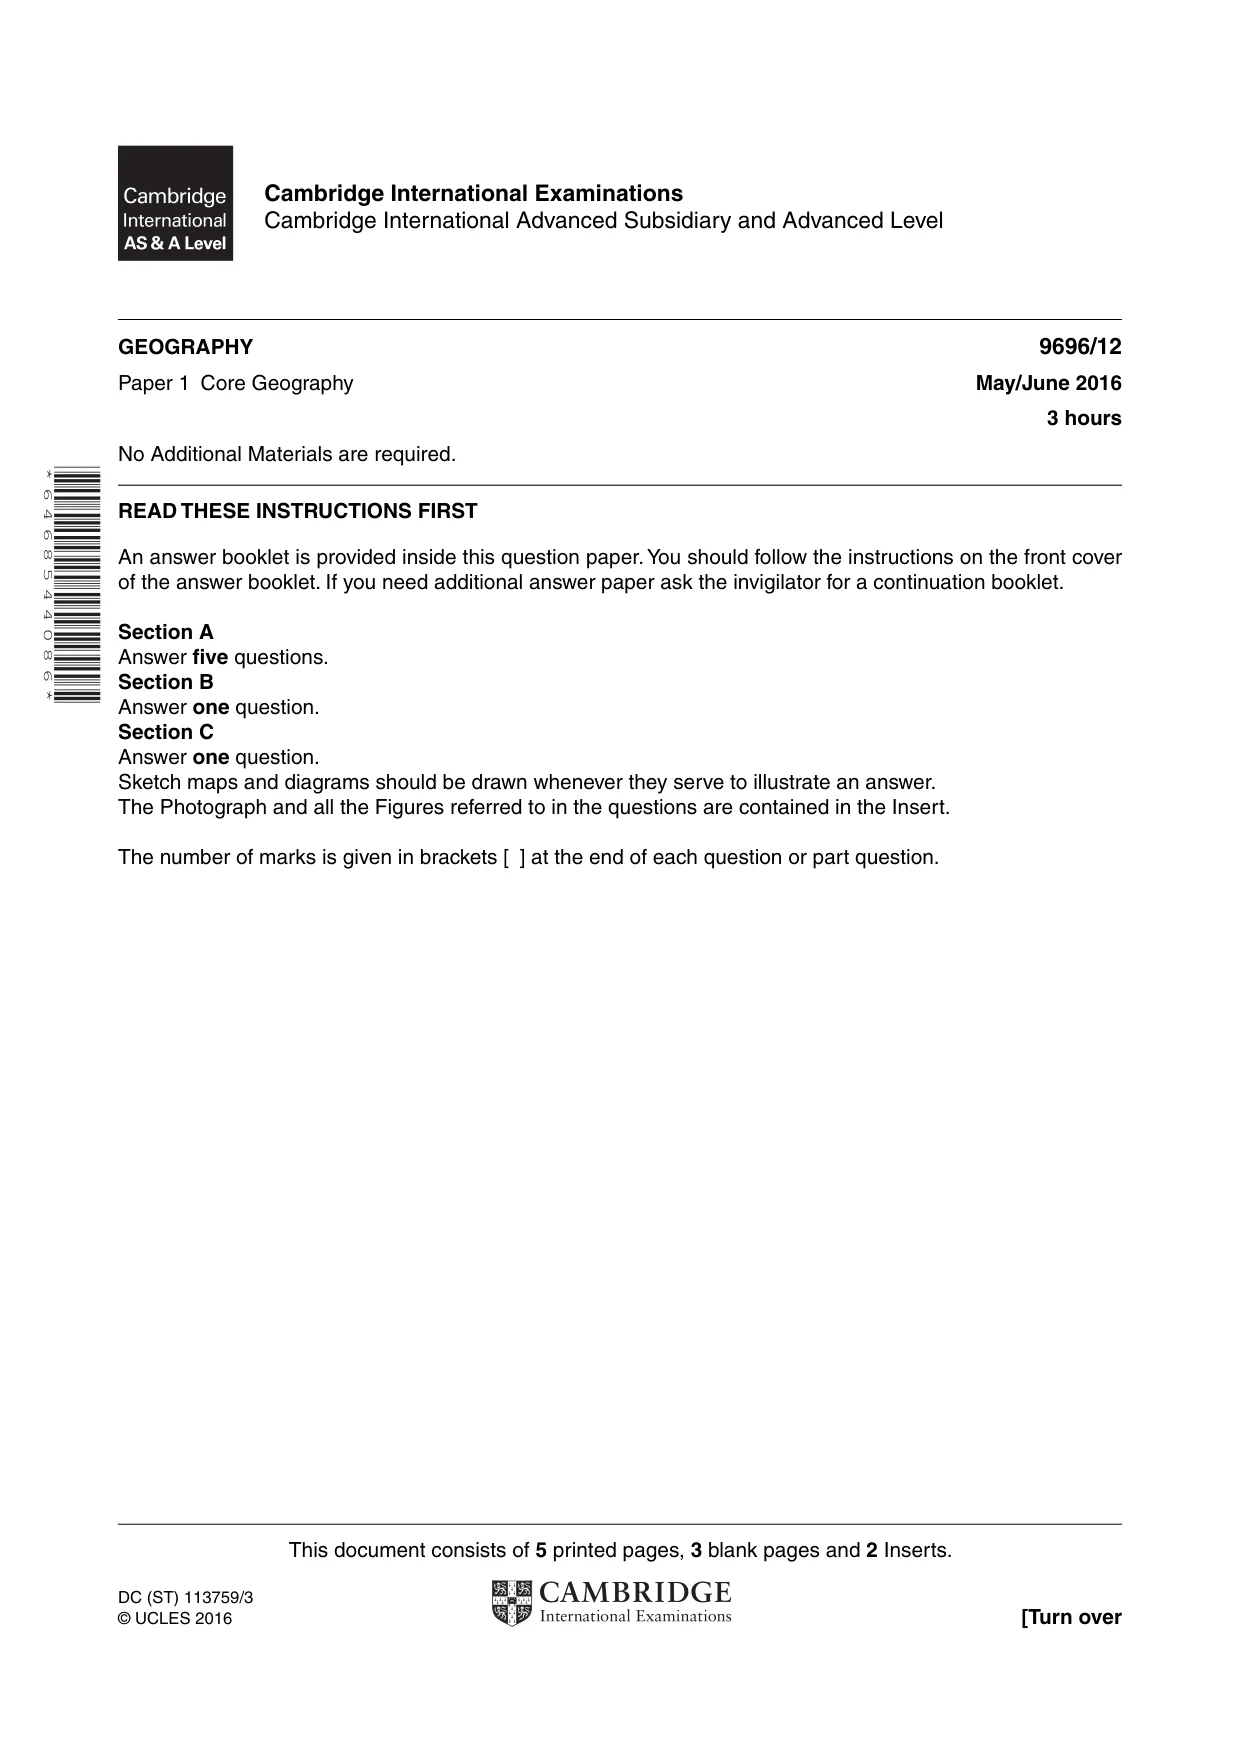
This document consists of 5 printed pages, 3 blank pages and 2 Inserts. DC (ST) 113759/3 © UCLES 2016 [Turn over Cambridge International Examinations Cambridge International Advanced Subsidiary and Advanced Level * 6 4 6 8 5 4 4 0 8 6 * GEOGRAPHY 9696/12 Paper 1 Core Geography May/June 2016 3 hours No Additional Materials are required. READ THESE INSTRUCTIONS FIRST An answer booklet is provided inside this question paper. You should follow the instructions on the front cover of the answer booklet. If you need additional answer paper ask the invigilator for a continuation booklet. Section A Answer five questions. Section B Answer one question. Section C Answer one question. Sketch maps and diagrams should be drawn whenever they serve to illustrate an answer. The Photograph and all the Figures referred to in the questions are contained in the Insert. The number of marks is given in brackets [ ] at the end of each question or part question.
Question paper, page 2
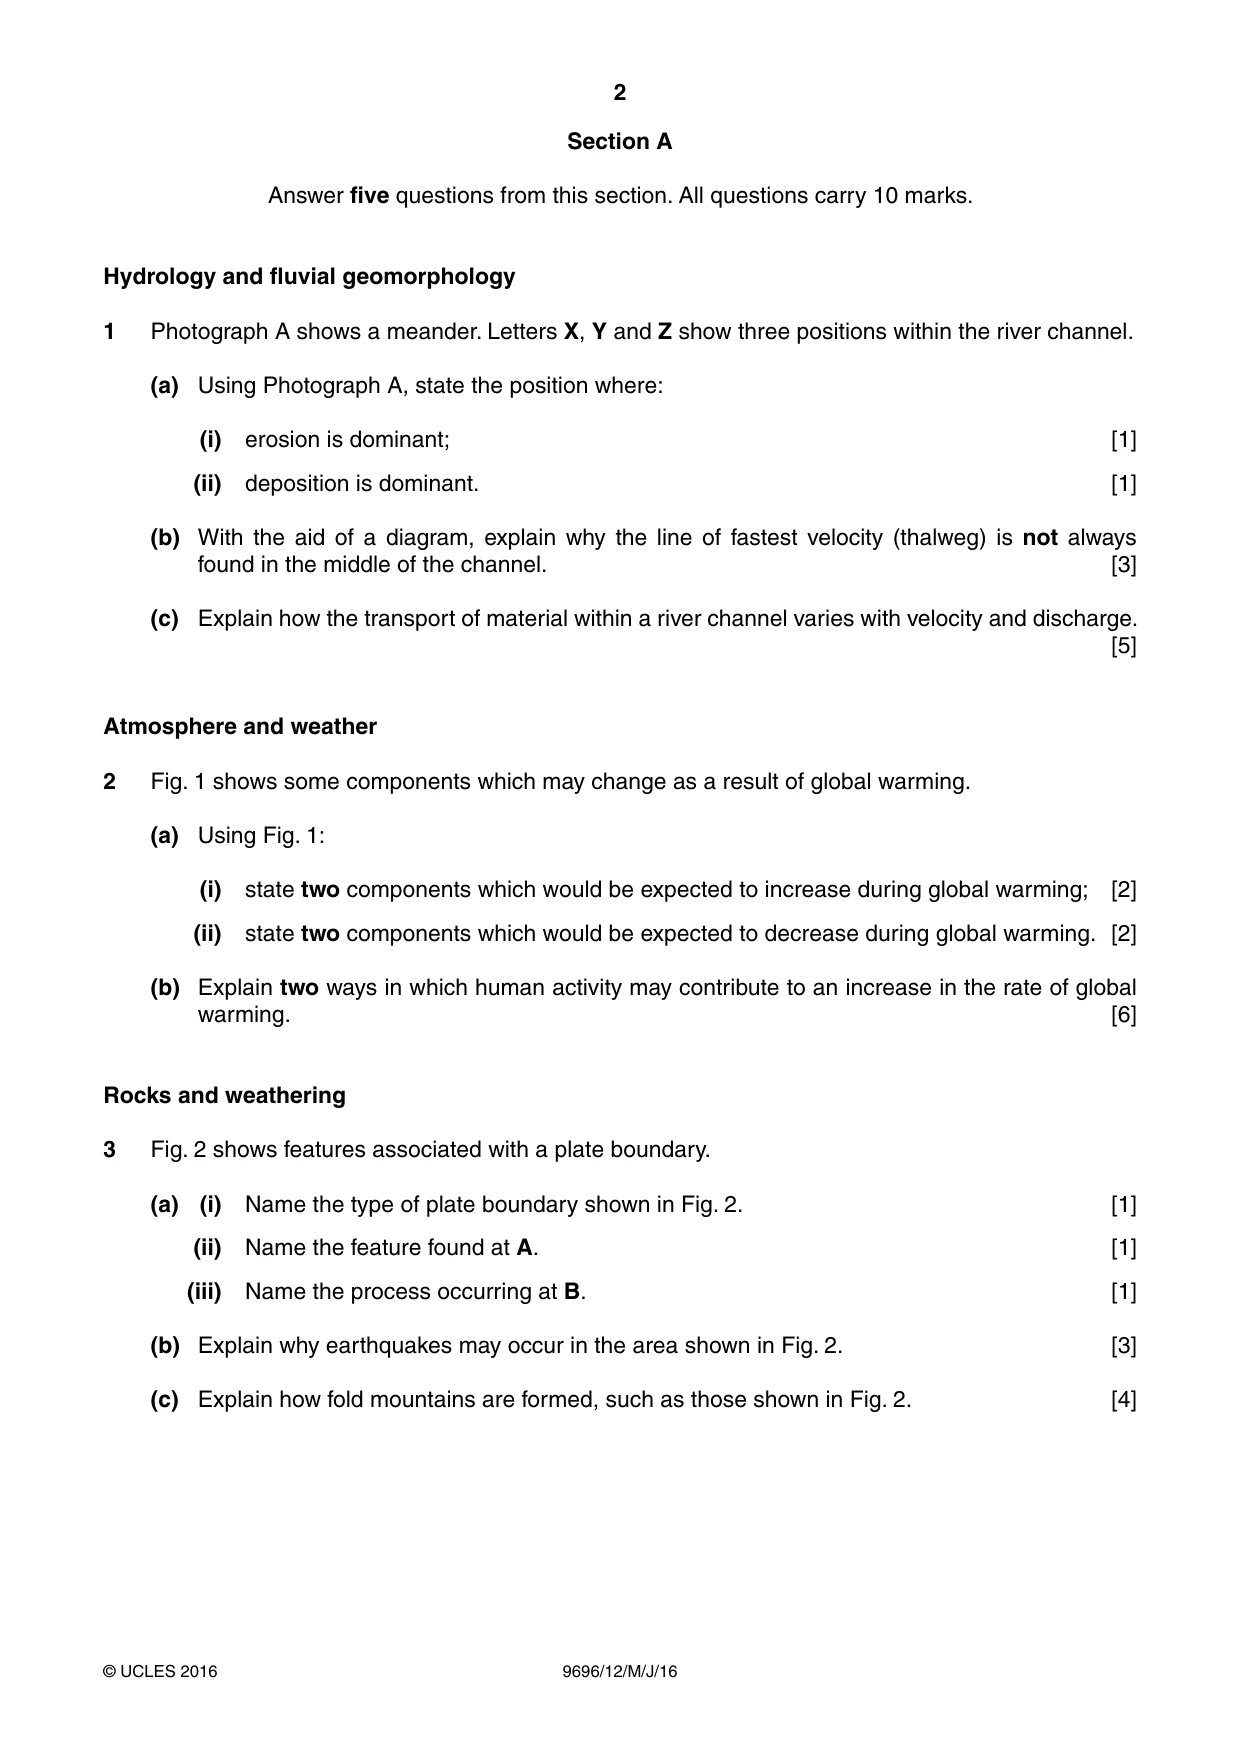
2 9696/12/M/J/16 © UCLES 2016 Section A Answer five questions from this section. All questions carry 10 marks. Hydrology and fluvial geomorphology 1 Photograph A shows a meander. Letters X, Y and Z show three positions within the river channel. (a) Using Photograph A, state the position where: (i) erosion is dominant; [1] (ii) deposition is dominant. [1] (b) With the aid of a diagram, explain why the line of fastest velocity (thalweg) is not always found in the middle of the channel. [3] (c) Explain how the transport of material within a river channel varies with velocity and discharge. [5] Atmosphere and weather 2 Fig. 1 shows some components which may change as a result of global warming. (a) Using Fig. 1: (i) state two components which would be expected to increase during global warming; [2] (ii) state two components which would be expected to decrease during global warming. [2] (b) Explain two ways in which human activity may contribute to an increase in the rate of global warming. [6] Rocks and weathering 3 Fig. 2 shows features associated with a plate boundary. (a) (i) Name the type of plate boundary shown in Fig. 2. [1] (ii) Name the feature found at A. [1] (iii) Name the process occurring at B. [1] (b) Explain why earthquakes may occur in the area shown in Fig. 2. [3] (c) Explain how fold mountains are formed, such as those shown in Fig. 2. [4]
Question paper, page 3
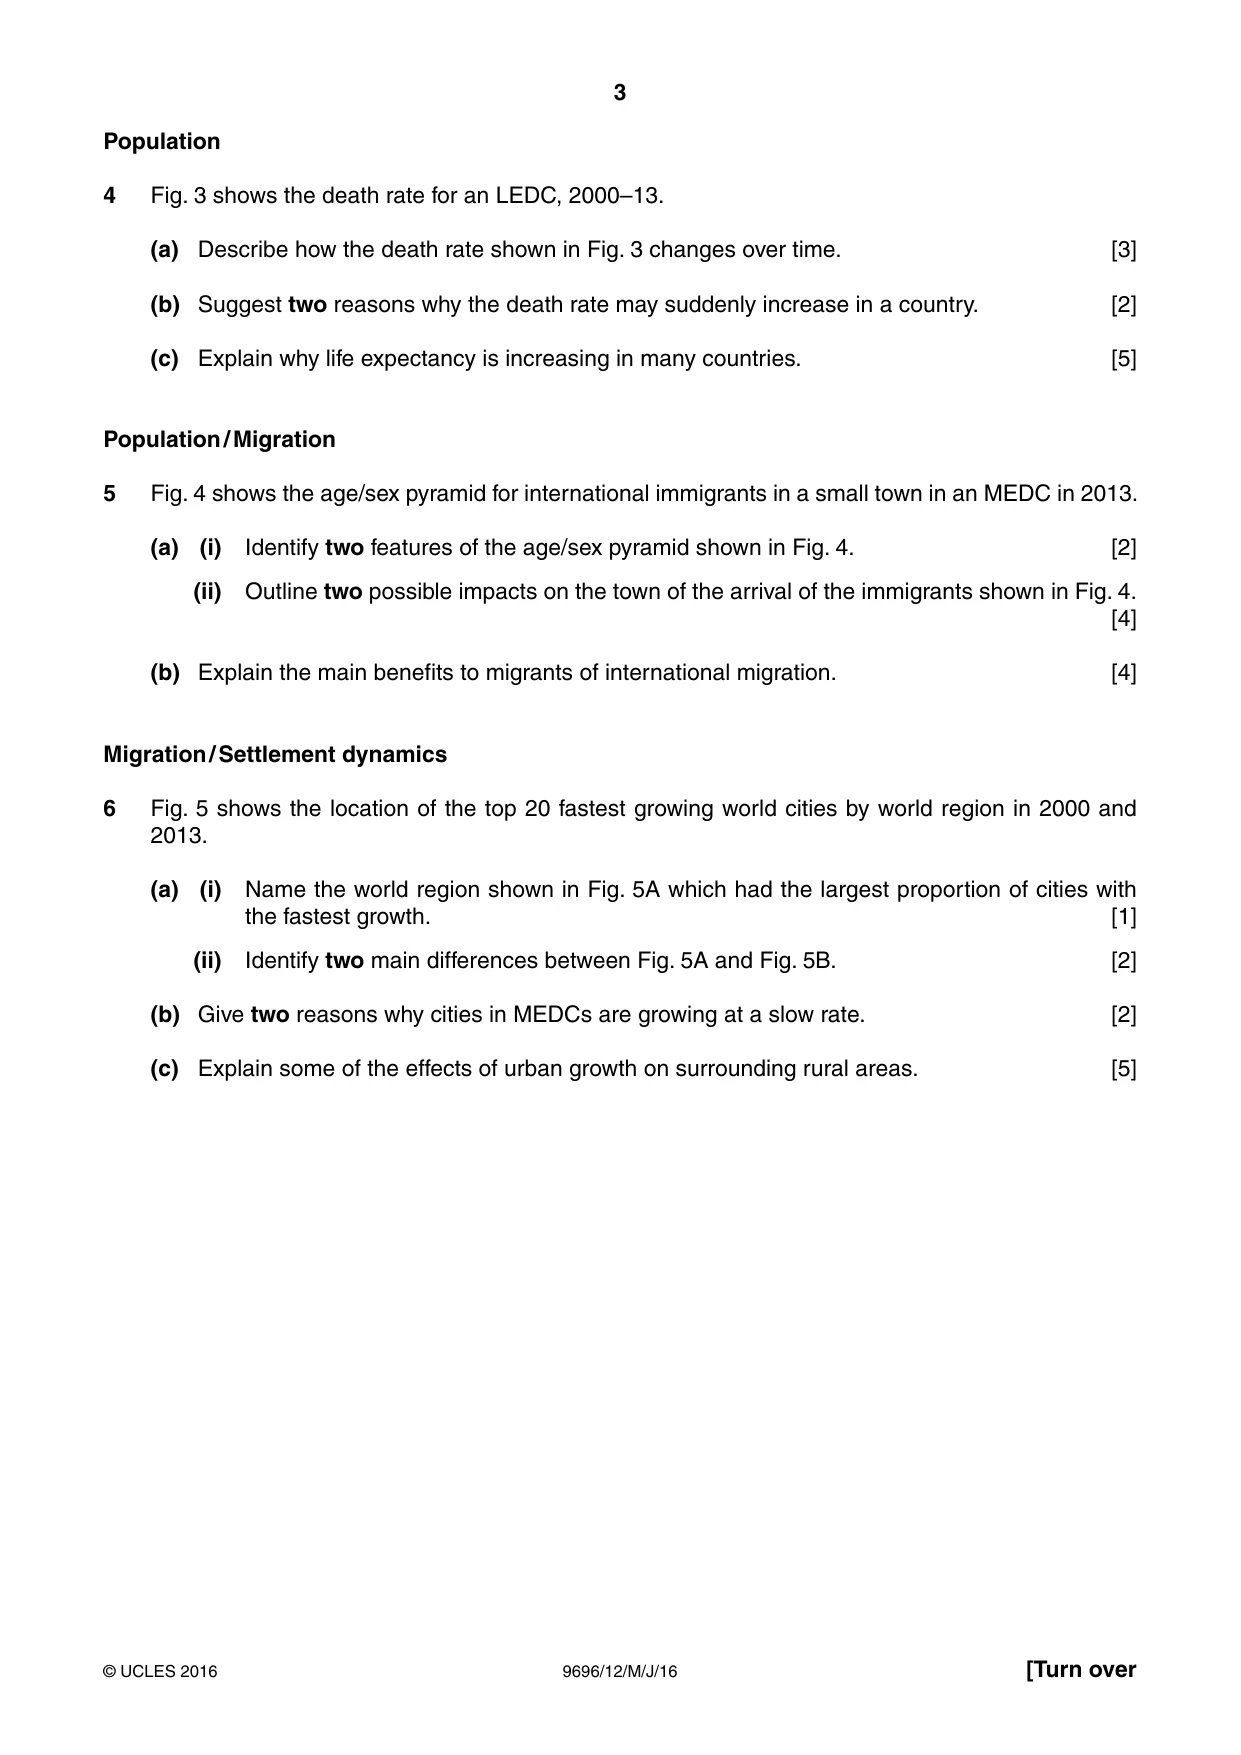
3 9696/12/M/J/16 © UCLES 2016 [Turn over Population 4 Fig. 3 shows the death rate for an LEDC, 2000–13. (a) Describe how the death rate shown in Fig. 3 changes over time. [3] (b) Suggest two reasons why the death rate may suddenly increase in a country. [2] (c) Explain why life expectancy is increasing in many countries. [5] Population / Migration 5 Fig. 4 shows the age/sex pyramid for international immigrants in a small town in an MEDC in 2013. (a) (i) Identify two features of the age/sex pyramid shown in Fig. 4. [2] (ii) Outline two possible impacts on the town of the arrival of the immigrants shown in Fig. 4. [4] (b) Explain the main benefits to migrants of international migration. [4] Migration / Settlement dynamics 6 Fig. 5 shows the location of the top 20 fastest growing world cities by world region in 2000 and 2013. (a) (i) Name the world region shown in Fig. 5A which had the largest proportion of cities with the fastest growth. [1] (ii) Identify two main differences between Fig. 5A and Fig. 5B. [2] (b) Give two reasons why cities in MEDCs are growing at a slow rate. [2] (c) Explain some of the effects of urban growth on surrounding rural areas. [5]
Question paper, page 4
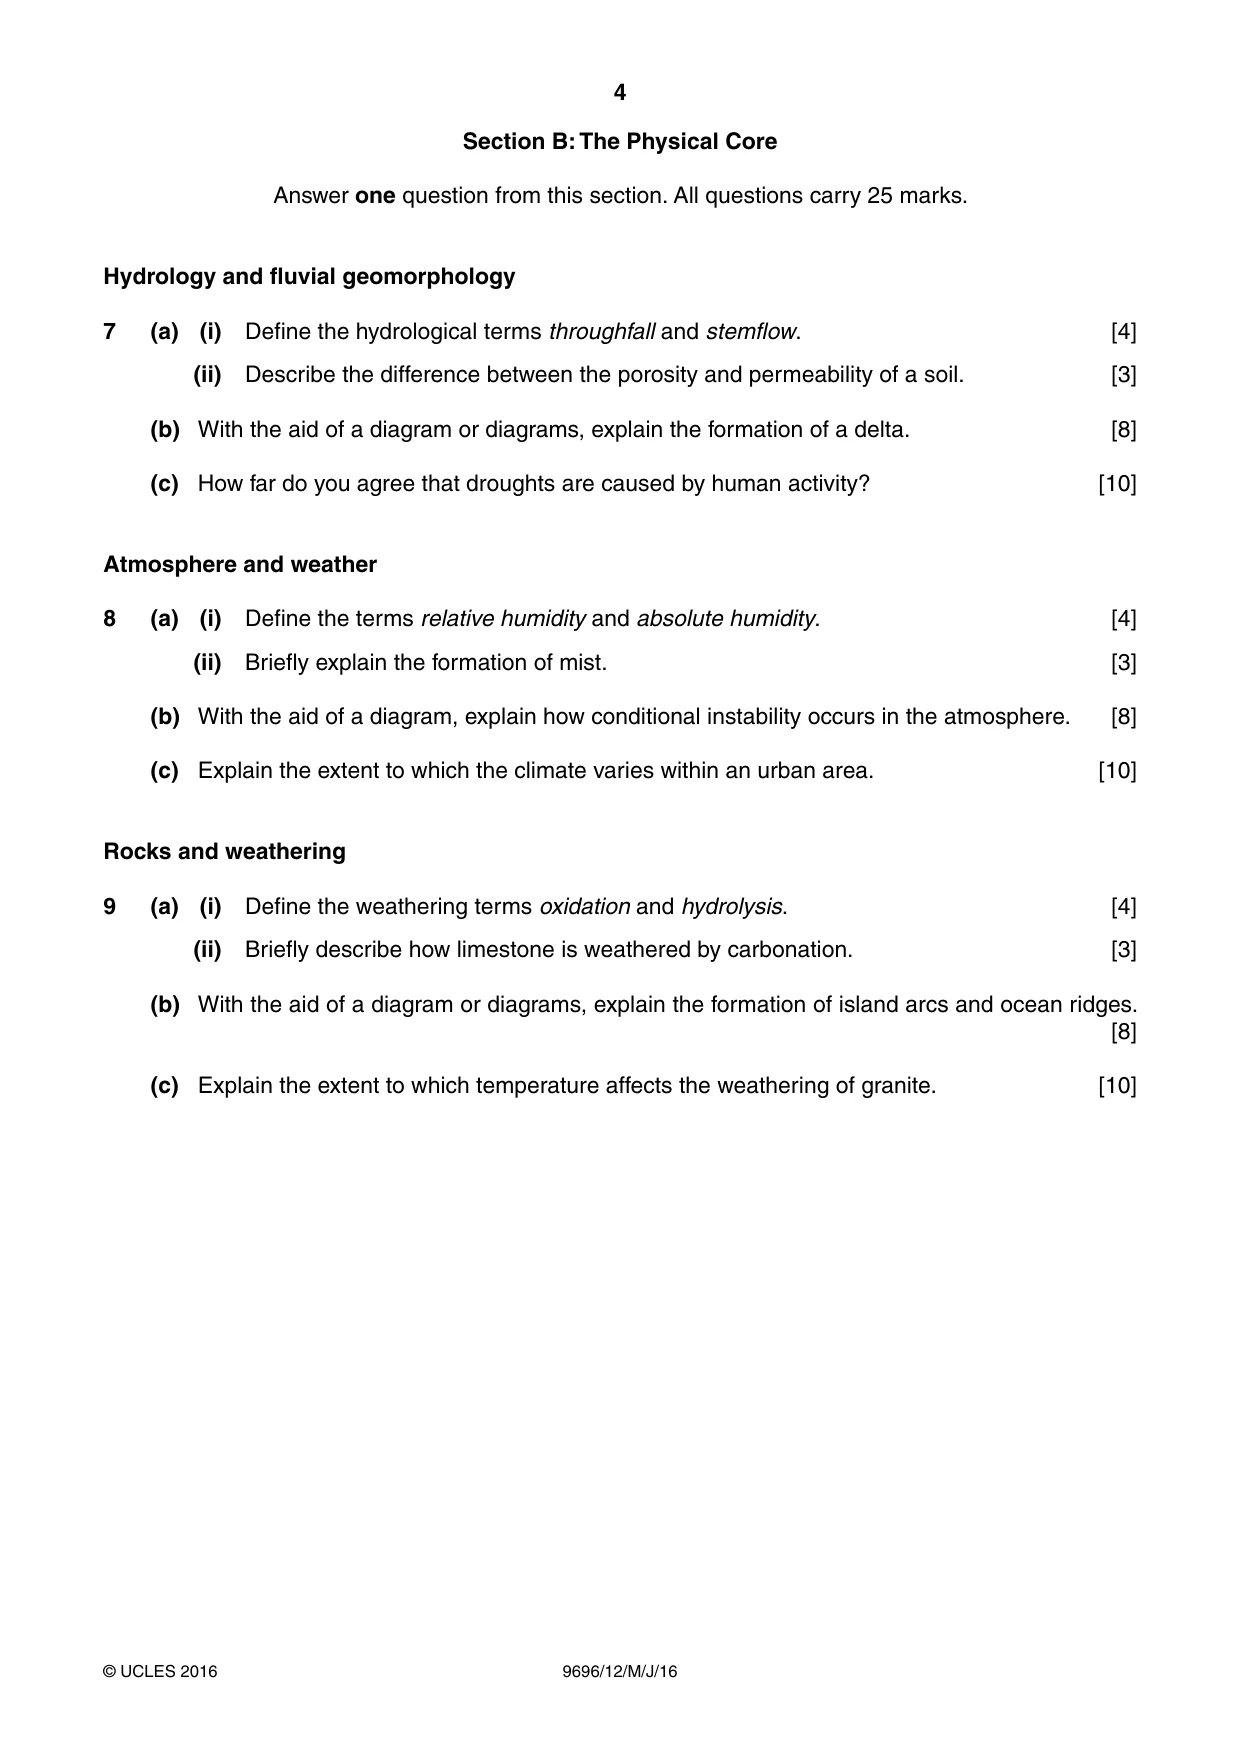
4 9696/12/M/J/16 © UCLES 2016 Section B: The Physical Core Answer one question from this section. All questions carry 25 marks. Hydrology and fluvial geomorphology 7 (a) (i) Define the hydrological terms throughfall and stemflow. [4] (ii) Describe the difference between the porosity and permeability of a soil. [3] (b) With the aid of a diagram or diagrams, explain the formation of a delta. [8] (c) How far do you agree that droughts are caused by human activity? [10] Atmosphere and weather 8 (a) (i) Define the terms relative humidity and absolute humidity. [4] (ii) Briefly explain the formation of mist. [3] (b) With the aid of a diagram, explain how conditional instability occurs in the atmosphere. [8] (c) Explain the extent to which the climate varies within an urban area. [10] Rocks and weathering 9 (a) (i) Define the weathering terms oxidation and hydrolysis. [4] (ii) Briefly describe how limestone is weathered by carbonation. [3] (b) With the aid of a diagram or diagrams, explain the formation of island arcs and ocean ridges. [8] (c) Explain the extent to which temperature affects the weathering of granite. [10]
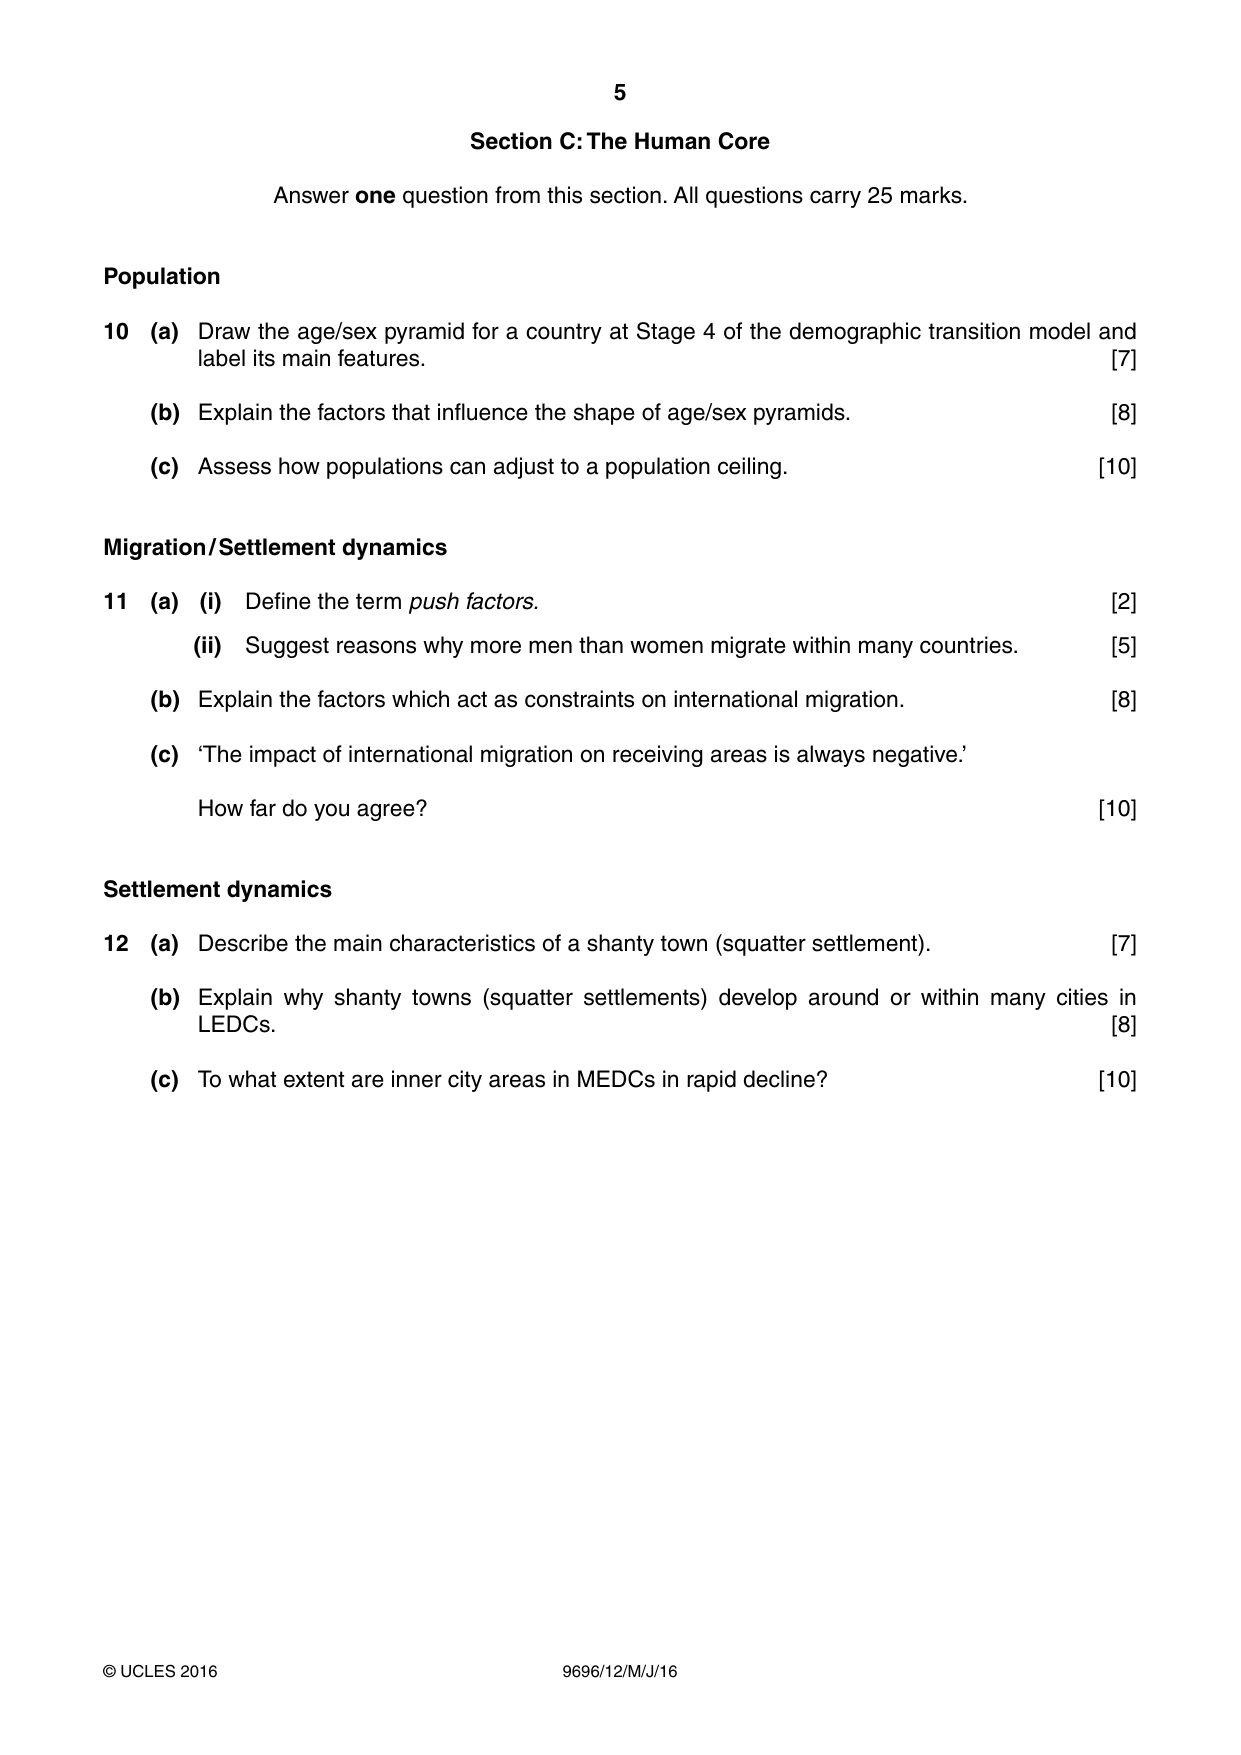
Question paper, page 5
5 9696/12/M/J/16 © UCLES 2016 Section C: The Human Core Answer one question from this section. All questions carry 25 marks. Population 10 (a) Draw the age/sex pyramid for a country at Stage 4 of the demographic transition model and label its main features. [7] (b) Explain the factors that influence the shape of age/sex pyramids. [8] (c) Assess how populations can adjust to a population ceiling. [10] Migration / Settlement dynamics 11 (a) (i) Define the term push factors. [2] (ii) Suggest reasons why more men than women migrate within many countries. [5] (b) Explain the factors which act as constraints on international migration. [8] (c) ‘The impact of international migration on receiving areas is always negative.’ How far do you agree? [10] Settlement dynamics 12 (a) Describe the main characteristics of a shanty town (squatter settlement). [7] (b) Explain why shanty towns (squatter settlements) develop around or within many cities in LEDCs. [8] (c) To what extent are inner city areas in MEDCs in rapid decline? [10]
Question paper, page 6
6 9696/12/M/J/16 © UCLES 2016 BLANK PAGE
Question paper, page 7
7 9696/12/M/J/16 © UCLES 2016 BLANK PAGE
Question paper, page 8
8 9696/12/M/J/16 © UCLES 2016 BLANK PAGE Permission to reproduce items where third-party owned material protected by copyright is included has been sought and cleared where possible. Every reasonable effort has been made by the publisher (UCLES) to trace copyright holders, but if any items requiring clearance have unwittingly been included, the publisher will be pleased to make amends at the earliest possible opportunity. To avoid the issue of disclosure of answer-related information to candidates, all copyright acknowledgements are reproduced online in the Cambridge International Examinations Copyright Acknowledgements Booklet. This is produced for each series of examinations and is freely available to download at www.cie.org.uk after the live examination series. Cambridge International Examinations is part of the Cambridge Assessment Group. Cambridge Assessment is the brand name of University of Cambridge Local Examinations Syndicate (UCLES), which is itself a department of the University of Cambridge.
Mark scheme, page 1
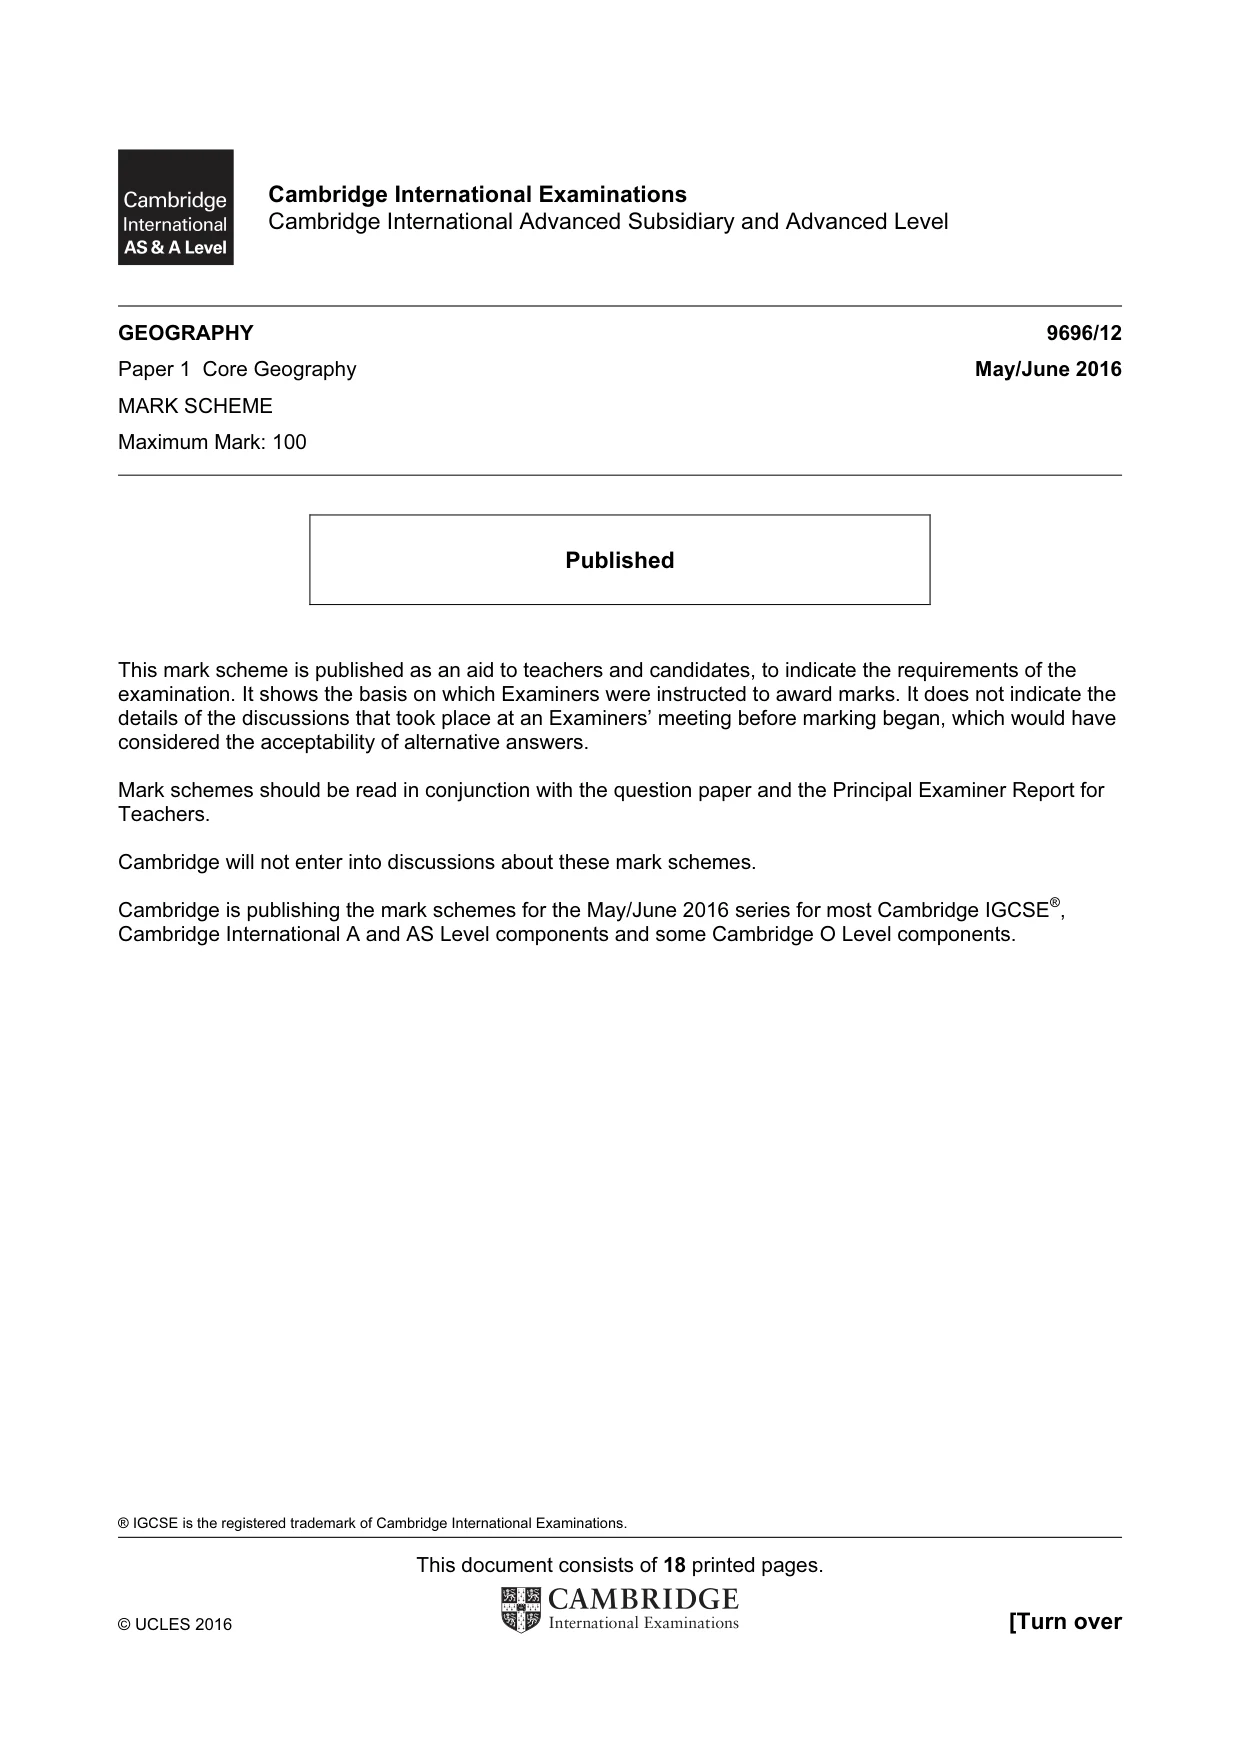
® IGCSE is the registered trademark of Cambridge International Examinations. This document consists of 18 printed pages. © UCLES 2016 [Turn over Cambridge International Examinations Cambridge International Advanced Subsidiary and Advanced Level GEOGRAPHY 9696/12 Paper 1 Core Geography May/June 2016 MARK SCHEME Maximum Mark: 100 Published This mark scheme is published as an aid to teachers and candidates, to indicate the requirements of the examination. It shows the basis on which Examiners were instructed to award marks. It does not indicate the details of the discussions that took place at an Examiners’ meeting before marking began, which would have considered the acceptability of alternative answers. Mark schemes should be read in conjunction with the question paper and the Principal Examiner Report for Teachers. Cambridge will not enter into discussions about these mark schemes. Cambridge is publishing the mark schemes for the May/June 2016 series for most Cambridge IGCSE®, Cambridge International A and AS Level components and some Cambridge O Level components.
Mark scheme, page 2
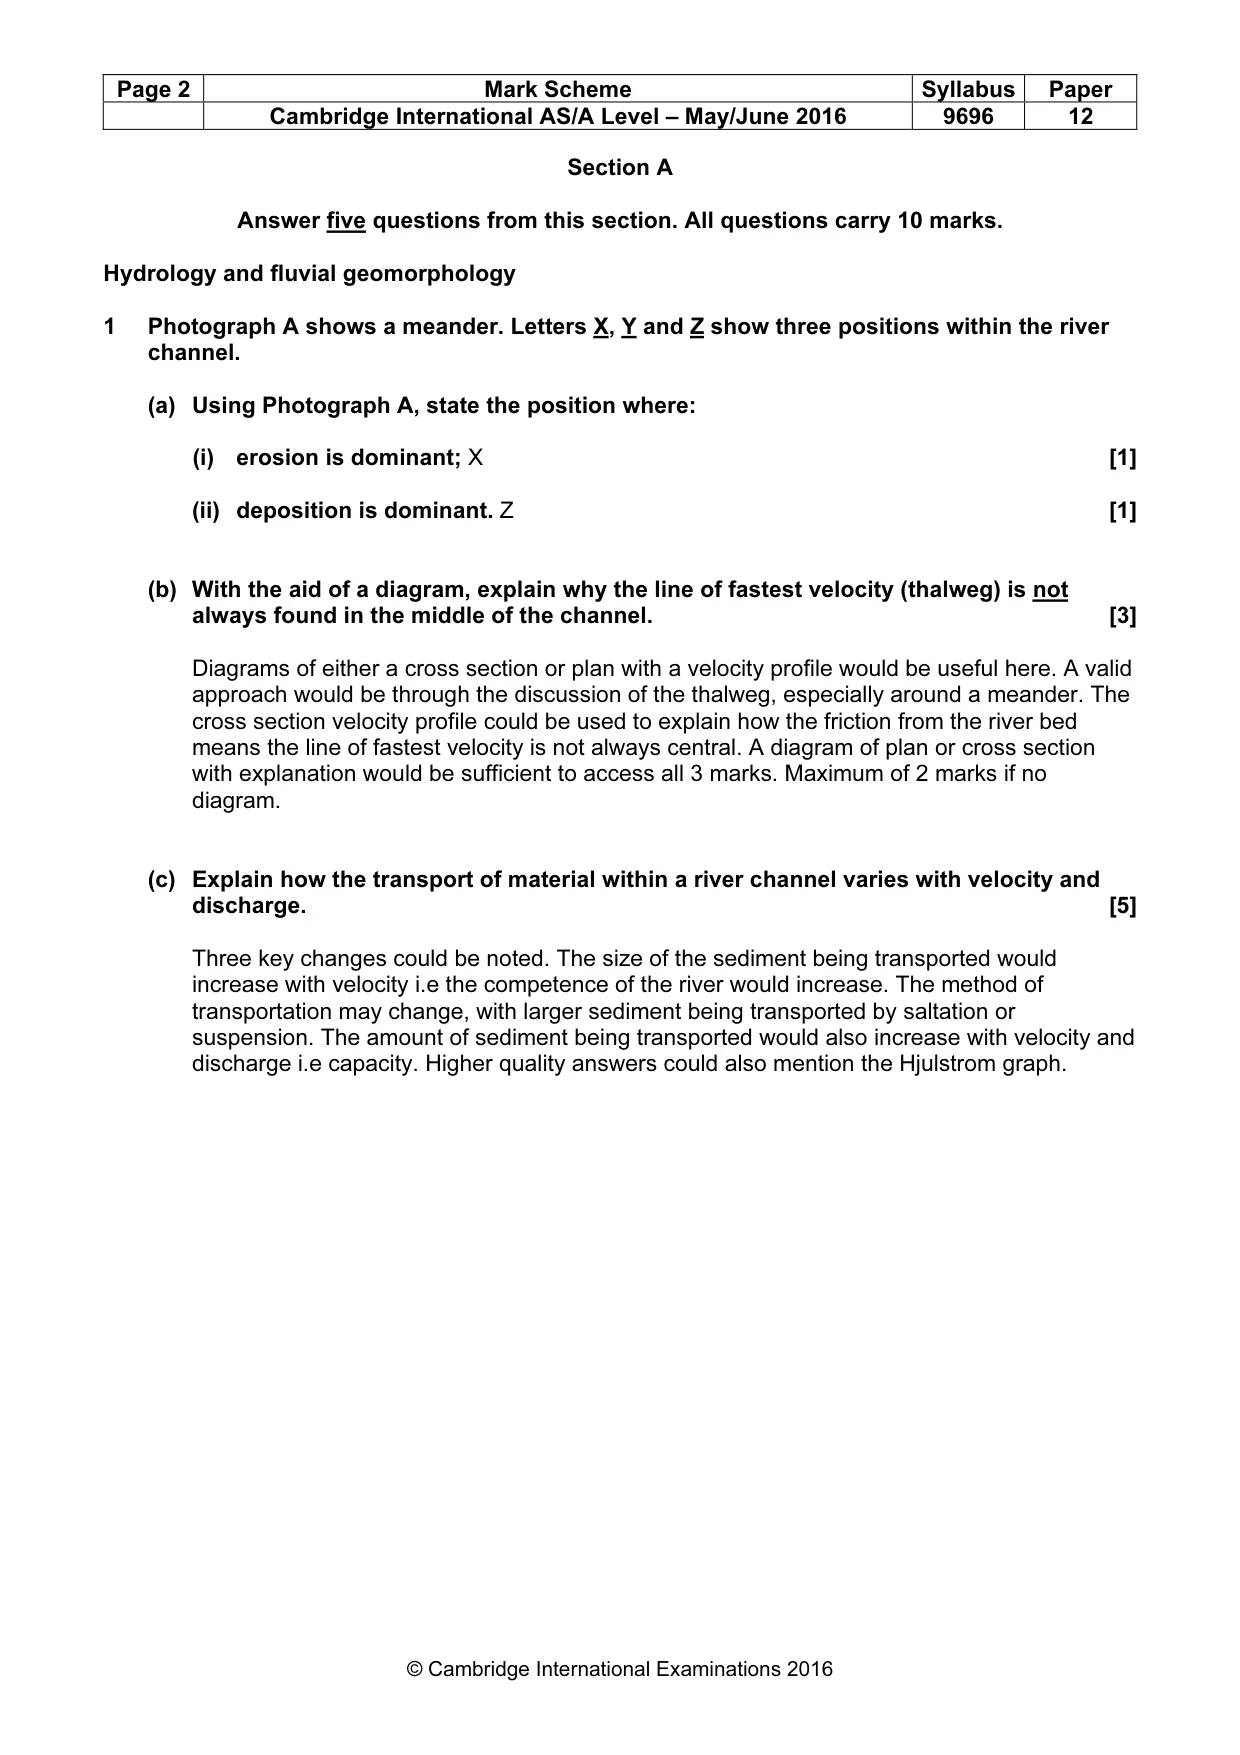
Page 2 Mark Scheme Syllabus Paper Cambridge International AS/A Level – May/June 2016 9696 12 © Cambridge International Examinations 2016 Section A Answer five questions from this section. All questions carry 10 marks. Hydrology and fluvial geomorphology 1 Photograph A shows a meander. Letters X, Y and Z show three positions within the river channel. (a) Using Photograph A, state the position where: (i) erosion is dominant; X [1] (ii) deposition is dominant. Z [1] (b) With the aid of a diagram, explain why the line of fastest velocity (thalweg) is not always found in the middle of the channel. [3] Diagrams of either a cross section or plan with a velocity profile would be useful here. A valid approach would be through the discussion of the thalweg, especially around a meander. The cross section velocity profile could be used to explain how the friction from the river bed means the line of fastest velocity is not always central. A diagram of plan or cross section with explanation would be sufficient to access all 3 marks. Maximum of 2 marks if no diagram. (c) Explain how the transport of material within a river channel varies with velocity and discharge. [5] Three key changes could be noted. The size of the sediment being transported would increase with velocity i.e the competence of the river would increase. The method of transportation may change, with larger sediment being transported by saltation or suspension. The amount of sediment being transported would also increase with velocity and discharge i.e capacity. Higher quality answers could also mention the Hjulstrom graph.
Mark scheme, page 3
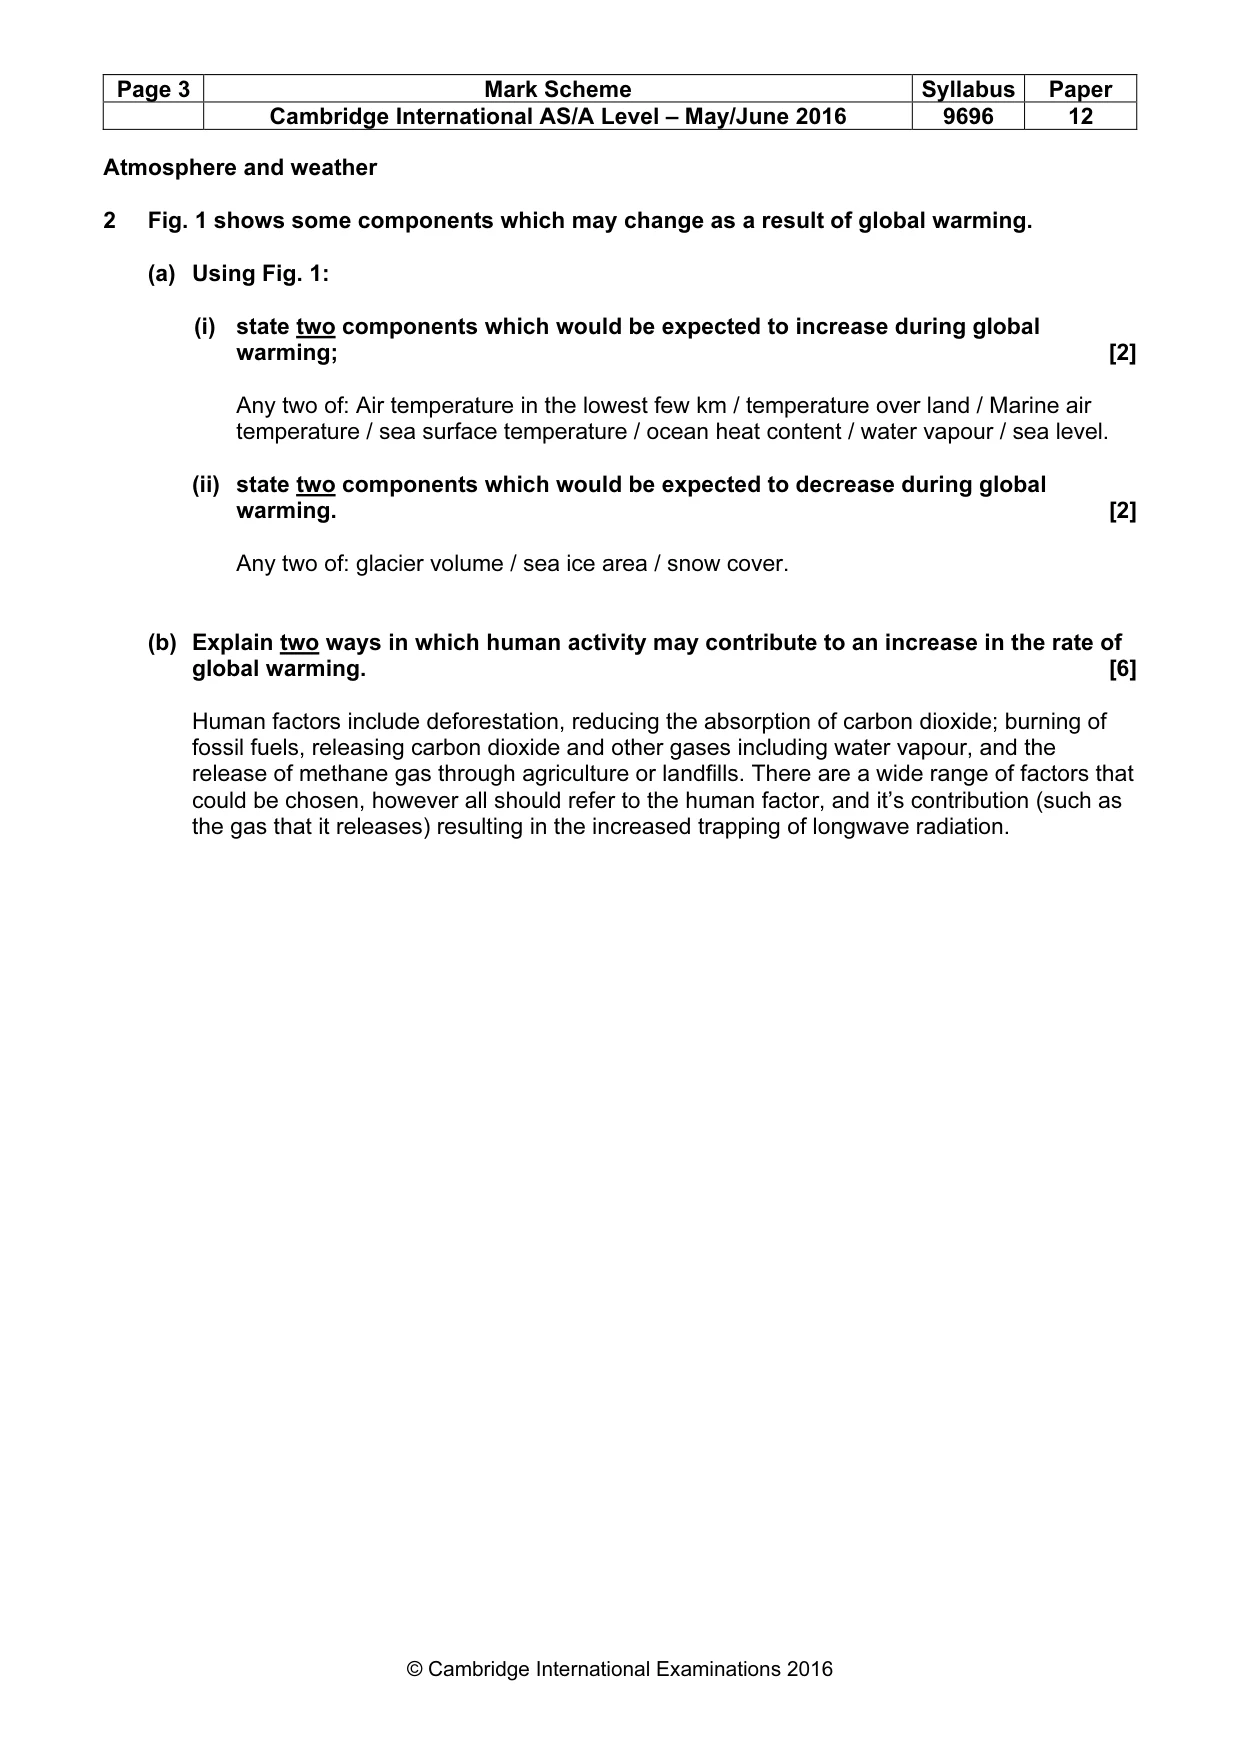
Page 3 Mark Scheme Syllabus Paper Cambridge International AS/A Level – May/June 2016 9696 12 © Cambridge International Examinations 2016 Atmosphere and weather 2 Fig. 1 shows some components which may change as a result of global warming. (a) Using Fig. 1: (i) state two components which would be expected to increase during global warming; [2] Any two of: Air temperature in the lowest few km / temperature over land / Marine air temperature / sea surface temperature / ocean heat content / water vapour / sea level. (ii) state two components which would be expected to decrease during global warming. [2] Any two of: glacier volume / sea ice area / snow cover. (b) Explain two ways in which human activity may contribute to an increase in the rate of global warming. [6] Human factors include deforestation, reducing the absorption of carbon dioxide; burning of fossil fuels, releasing carbon dioxide and other gases including water vapour, and the release of methane gas through agriculture or landfills. There are a wide range of factors that could be chosen, however all should refer to the human factor, and it’s contribution (such as the gas that it releases) resulting in the increased trapping of longwave radiation.
Mark scheme, page 4
Page 4 Mark Scheme Syllabus Paper Cambridge International AS/A Level – May/June 2016 9696 12 © Cambridge International Examinations 2016 Rocks and weathering 3 Fig. 2 shows features associated with a plate boundary. (a) (i) Name the type of plate boundary shown in Fig. 2. convergent/destructive [1] (ii) Name the feature found at A. Ocean trench/trench/accretionary wedge [1] (iii) Name the process occurring at B. Subduction [1] (b) Explain why earthquakes may occur in the area shown in Fig. 2. [3] The oceanic plate is forced beneath the continental plate (1) and this results in an increase in pressure/friction (1) and triggers earthquakes as this pressure is suddenly released (1). The foci largely follow the incline of the plate as it is subducted past the overlying mantle. Beyond this depth the mantle is molten so friction is reduced. (c) Explain how fold mountains are formed, such as those shown in Fig. 2. [4] The focus here is on the explanation. The formation of mountain chains on continents is from the movement of the tectonic plates. The movement of the plates leads to the folding of sediments trapped between the plates and subsequent uplift. The result is mountain chains. The term orogeny can be used. Annotated diagrams can be credited as they can be used to enhance the explanation. Give some credit for collision margins e.g. Himalayas.
Mark scheme, page 5
Page 5 Mark Scheme Syllabus Paper Cambridge International AS/A Level – May/June 2016 9696 12 © Cambridge International Examinations 2016 Population 4 Fig. 3 shows the death rate for an LEDC, 2000–13. (a) Describe how the death rate shown in Fig. 3 changes over time. [3] The general trend is one of a declining death rate – 1 mark. Fluctuations and/or anomalies – 1 mark. Quoting of data to support description – 1 mark. (b) Suggest two reasons why death rate may suddenly increase in a country. [2] This is not based on (a) but many of the reasons could apply to this LEDC: • Sudden climatic disaster e.g. flood, drought • Natural disaster such as an earthquake or tsunamis • Social unrest such as a civil war or an invasion • Outbreak of a disease such as Ebola, AIDS. 1 mark per appropriate reason. (c) Explain why life expectancy is increasing in many countries. [5] The increase is largely due to better health care, more medicines, etc. It also reflects growth in affluence and social care that mean old people live longer. It also reflects greater health and safety, a decline in those dangerous primary (and industrial) activities such as mining. Better diets, more education (about health threats such as smoking), reduction in infant mortality, safer forms of transport all help. Simple list without development/examples Max 3.
Mark scheme, page 6
Page 6 Mark Scheme Syllabus Paper Cambridge International AS/A Level – May/June 2016 9696 12 © Cambridge International Examinations 2016 Population / Migration 5 Fig. 4 shows the age/sex pyramid for international immigrants in a small town in an MEDC in 2013. (a) (i) Identify two features of the age/sex pyramid shown in Fig. 4. [2] Features could include: • Majority are males (77%) • Most are over the age of 24 – few older people (6% over 50) • Low birth rate – very few teenagers 1 mark per appropriate feature. (ii) Outline two possible impacts on the town of the arrival of the immigrants shown in Fig. 4. [4] The arrival of a large number of young males in the town could impact on: • Demography – may increase intermarrying with locals, increase birth rate, lower death rate, male-female imbalance • Economic – unemployment rises, economic stimulus as cheaper labour, housing prices rise, more demand for goods and services • Social and cultural – greater variety of restaurants, possible boost to church attendance, increased demand for school places, cultural conflict • Political – change in voting patterns, unrest/friction 2 x 2 marks or 3/1 depending on degree of detail/development. (b) Explain the main benefits to migrants of international migration. [4] Economic: The main benefit is usually economic with the migrant gaining employment and higher wages than at the origin – 2 marks. Social: There are many social benefits such as free social services e.g. healthcare, better education, more freedom, greater security, a range of new cultural activities.These are the pull factors but equally valid may be the desire to escape (push factors) from problems in the origin. Max 3 for economic or social only.
Mark scheme, page 7
Page 7 Mark Scheme Syllabus Paper Cambridge International AS/A Level – May/June 2016 9696 12 © Cambridge International Examinations 2016 Migration / Settlement dynamics 6. Fig. 5 shows the location of the top 20 fastest growing world cities by world region in 2000 and 2013. (a) (i) Name the world region shown in Fig. 5A which had the largest proportion of cities with the fastest growth. East Asia [1] (ii) Identify two main differences between Fig. 5A and Fig. 5B. 1 mark per correct difference. These include: • Africa now has the largest proportion • East Asia shrunk in importance • North America not in the 2013 list • South Asia increased in importance (b) Give two reasons why cities in MEDCs are growing at a slow rate. [2] 1 mark per appropriate reason. There are a number of reasons such as: • They are undergoing counterurbanisation – a movement out to the fringe or rural areas • Diseconomies of scale are setting in such as pollution, high housing costs, unrest • They were some of the first countries to urbanise so they are now undergoing urban renewal and redevelopment • Their economies are decentralising – the internet has reduced the need for large cities • Lower birth rates/ageing population (c) Explain some of the effects of urban growth on surrounding rural areas. [5] Effects could include: • Impact on the environment and rural ecosystem – loss of habitat. • Demographic on the local rural population – commuters inject new age/sex elements • Economic – price of land rises, impact on employment, house prices • Social – new cultural and social elements added to the rural area Mark per valid reason to max 5 or fewer reasons with some development. Discussion of the decline of rural areas (i.e rural-urban migration) can be fully credited.
Mark scheme, page 8
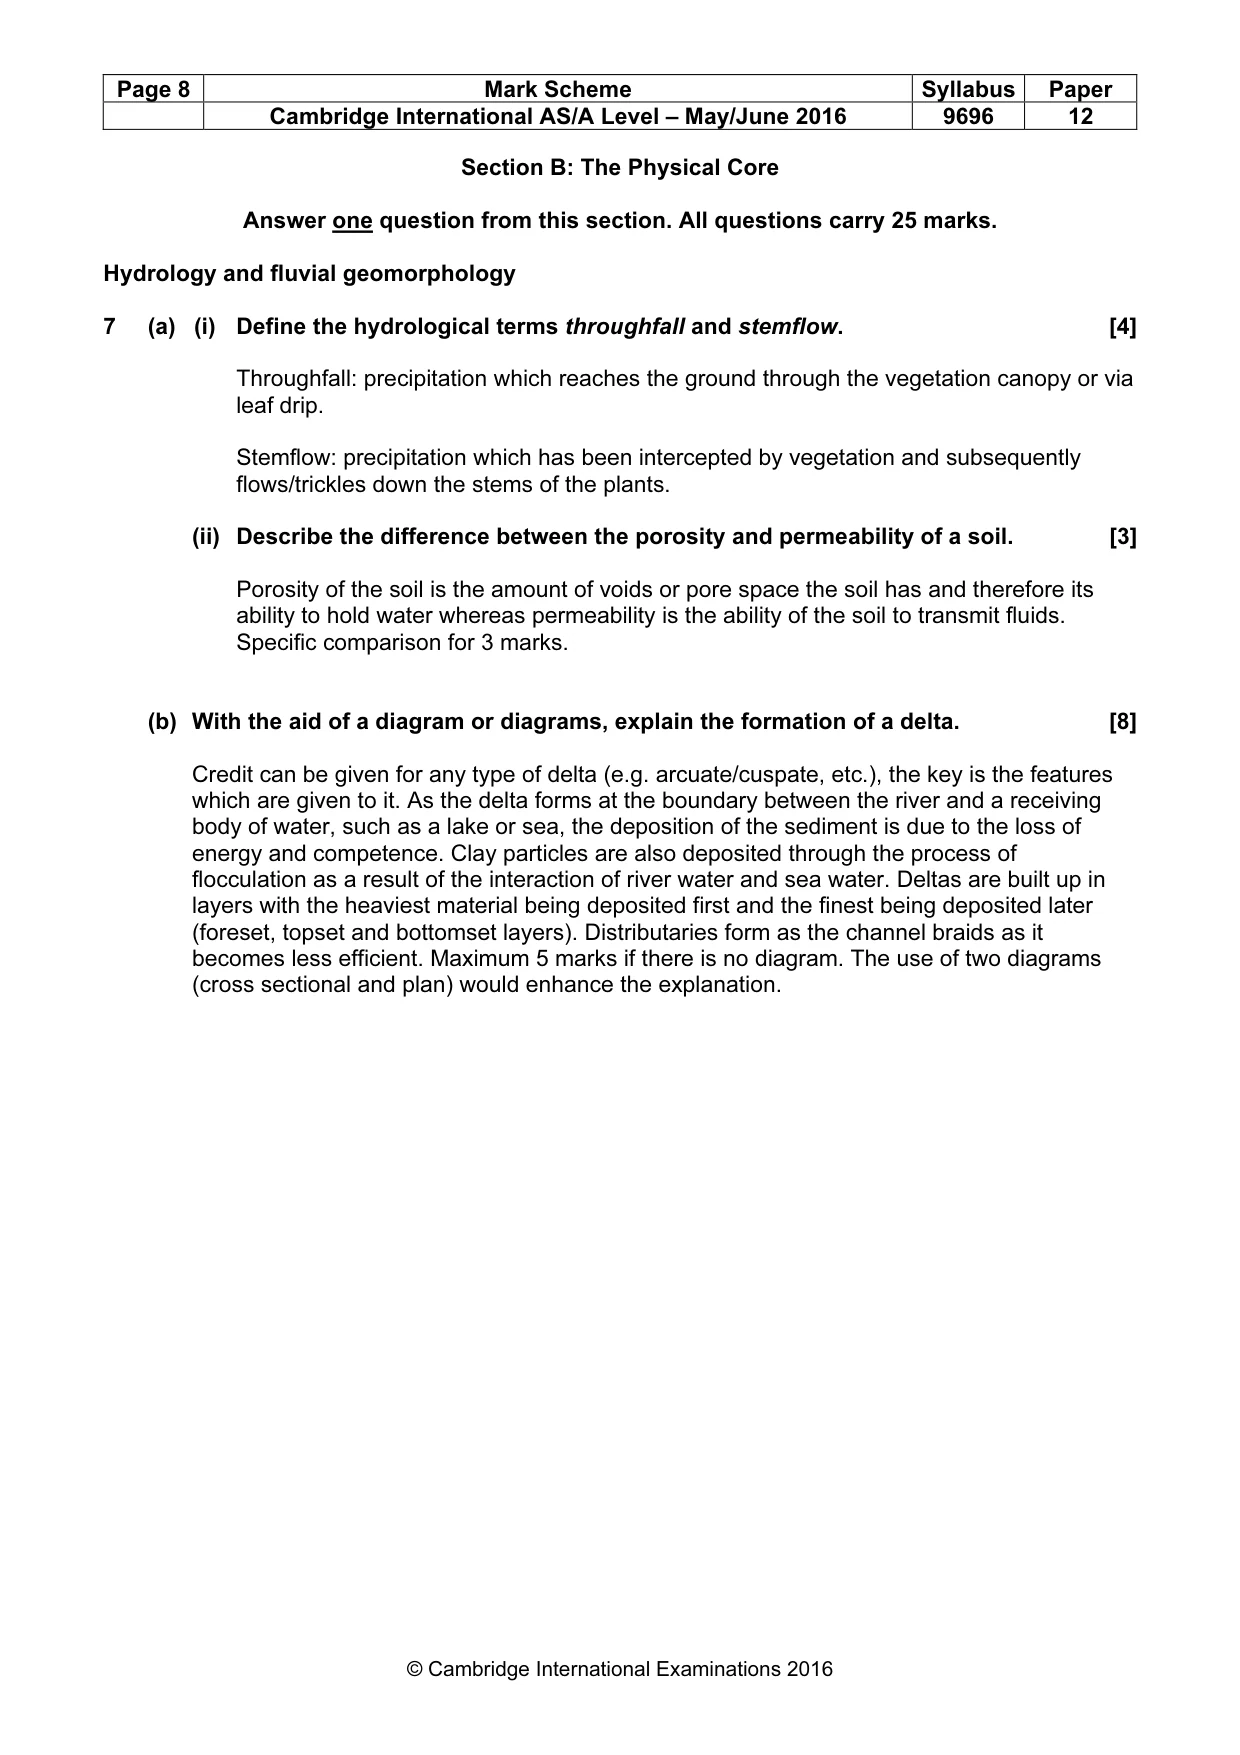
Page 8 Mark Scheme Syllabus Paper Cambridge International AS/A Level – May/June 2016 9696 12 © Cambridge International Examinations 2016 Section B: The Physical Core Answer one question from this section. All questions carry 25 marks. Hydrology and fluvial geomorphology 7 (a) (i) Define the hydrological terms throughfall and stemflow. [4] Throughfall: precipitation which reaches the ground through the vegetation canopy or via leaf drip. Stemflow: precipitation which has been intercepted by vegetation and subsequently flows/trickles down the stems of the plants. (ii) Describe the difference between the porosity and permeability of a soil. [3] Porosity of the soil is the amount of voids or pore space the soil has and therefore its ability to hold water whereas permeability is the ability of the soil to transmit fluids. Specific comparison for 3 marks. (b) With the aid of a diagram or diagrams, explain the formation of a delta. [8] Credit can be given for any type of delta (e.g. arcuate/cuspate, etc.), the key is the features which are given to it. As the delta forms at the boundary between the river and a receiving body of water, such as a lake or sea, the deposition of the sediment is due to the loss of energy and competence. Clay particles are also deposited through the process of flocculation as a result of the interaction of river water and sea water. Deltas are built up in layers with the heaviest material being deposited first and the finest being deposited later (foreset, topset and bottomset layers). Distributaries form as the channel braids as it becomes less efficient. Maximum 5 marks if there is no diagram. The use of two diagrams (cross sectional and plan) would enhance the explanation.
Mark scheme, page 9
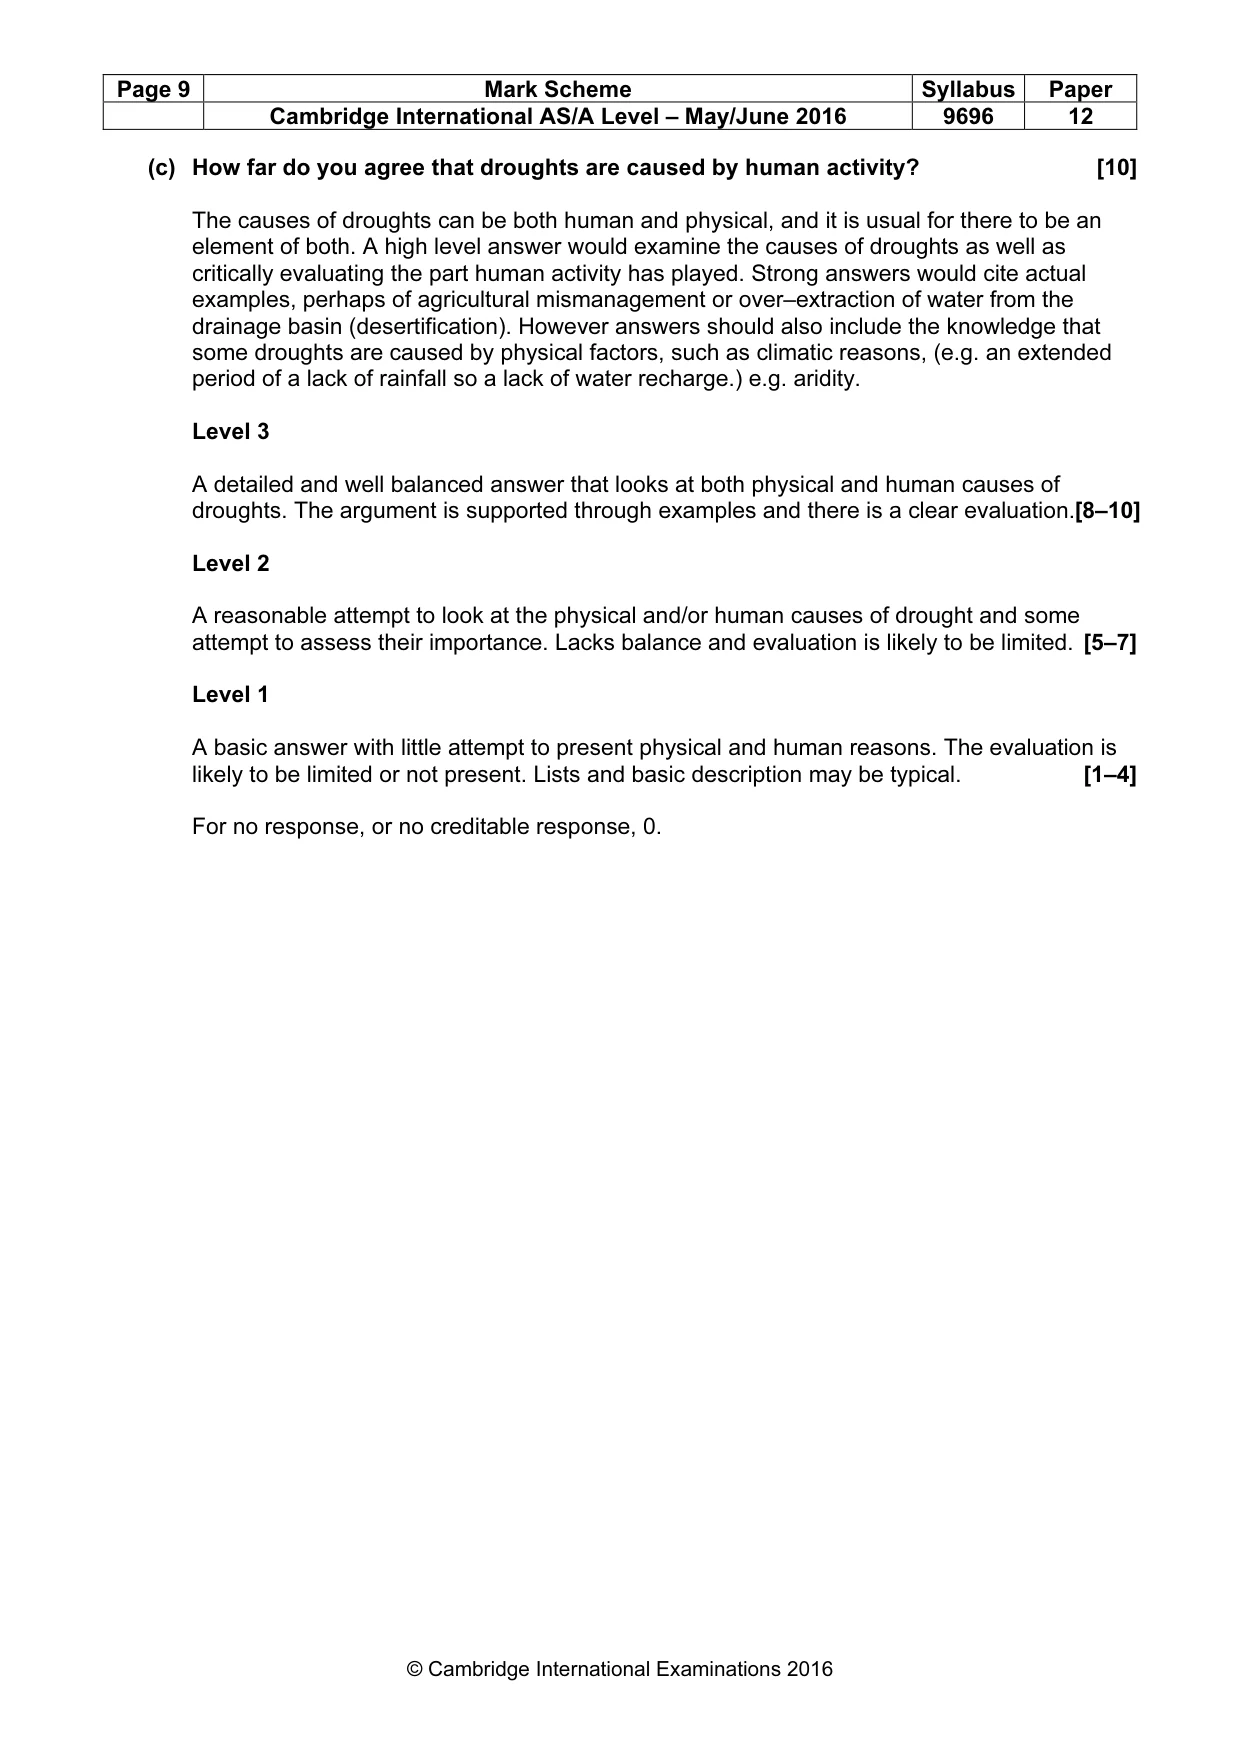
Page 9 Mark Scheme Syllabus Paper Cambridge International AS/A Level – May/June 2016 9696 12 © Cambridge International Examinations 2016 (c) How far do you agree that droughts are caused by human activity? [10] The causes of droughts can be both human and physical, and it is usual for there to be an element of both. A high level answer would examine the causes of droughts as well as critically evaluating the part human activity has played. Strong answers would cite actual examples, perhaps of agricultural mismanagement or over–extraction of water from the drainage basin (desertification). However answers should also include the knowledge that some droughts are caused by physical factors, such as climatic reasons, (e.g. an extended period of a lack of rainfall so a lack of water recharge.) e.g. aridity. Level 3 A detailed and well balanced answer that looks at both physical and human causes of droughts. The argument is supported through examples and there is a clear evaluation.[8–10] Level 2 A reasonable attempt to look at the physical and/or human causes of drought and some attempt to assess their importance. Lacks balance and evaluation is likely to be limited. [5–7] Level 1 A basic answer with little attempt to present physical and human reasons. The evaluation is likely to be limited or not present. Lists and basic description may be typical. [1–4] For no response, or no creditable response, 0.
Mark scheme, page 10
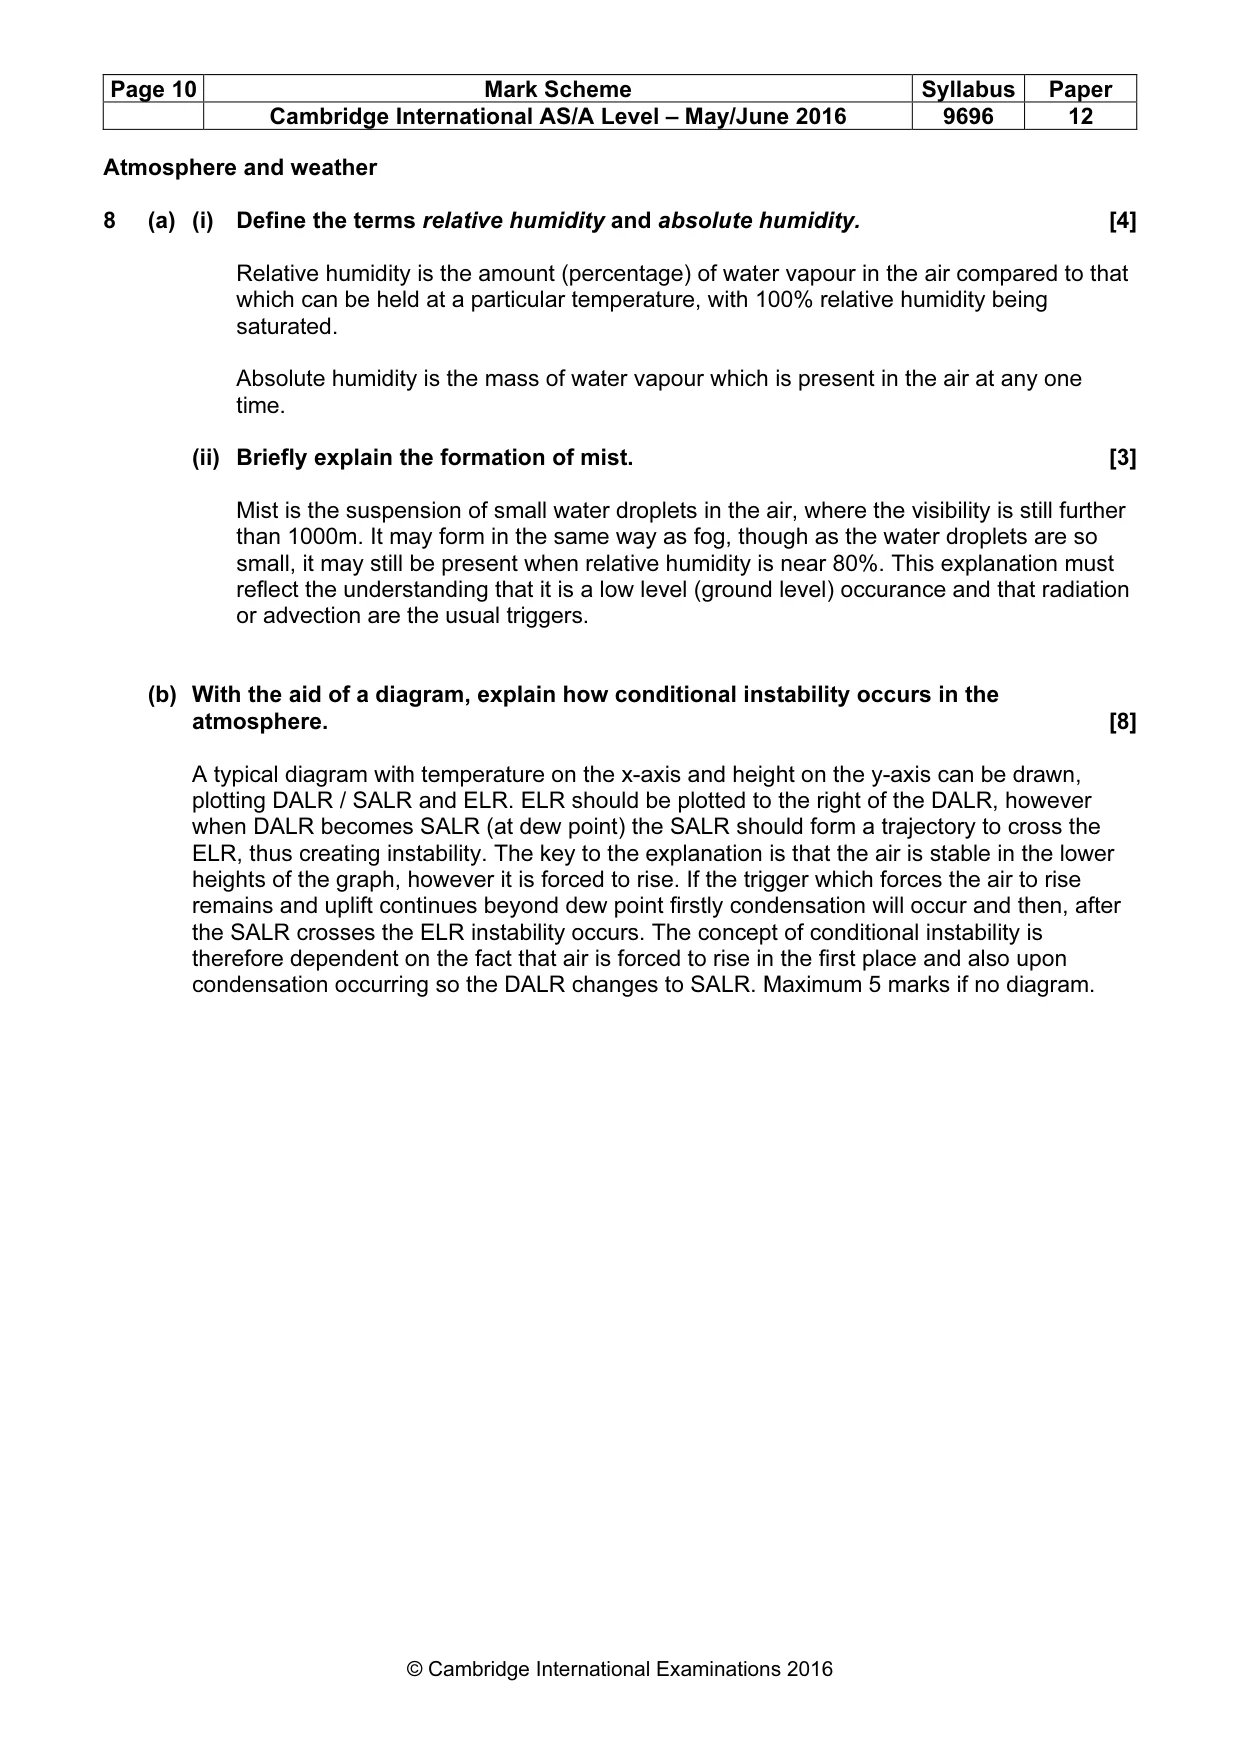
Page 10 Mark Scheme Syllabus Paper Cambridge International AS/A Level – May/June 2016 9696 12 © Cambridge International Examinations 2016 Atmosphere and weather 8 (a) (i) Define the terms relative humidity and absolute humidity. [4] Relative humidity is the amount (percentage) of water vapour in the air compared to that which can be held at a particular temperature, with 100% relative humidity being saturated. Absolute humidity is the mass of water vapour which is present in the air at any one time. (ii) Briefly explain the formation of mist. [3] Mist is the suspension of small water droplets in the air, where the visibility is still further than 1000m. It may form in the same way as fog, though as the water droplets are so small, it may still be present when relative humidity is near 80%. This explanation must reflect the understanding that it is a low level (ground level) occurance and that radiation or advection are the usual triggers. (b) With the aid of a diagram, explain how conditional instability occurs in the atmosphere. [8] A typical diagram with temperature on the x-axis and height on the y-axis can be drawn, plotting DALR / SALR and ELR. ELR should be plotted to the right of the DALR, however when DALR becomes SALR (at dew point) the SALR should form a trajectory to cross the ELR, thus creating instability. The key to the explanation is that the air is stable in the lower heights of the graph, however it is forced to rise. If the trigger which forces the air to rise remains and uplift continues beyond dew point firstly condensation will occur and then, after the SALR crosses the ELR instability occurs. The concept of conditional instability is therefore dependent on the fact that air is forced to rise in the first place and also upon condensation occurring so the DALR changes to SALR. Maximum 5 marks if no diagram.
Mark scheme, page 11
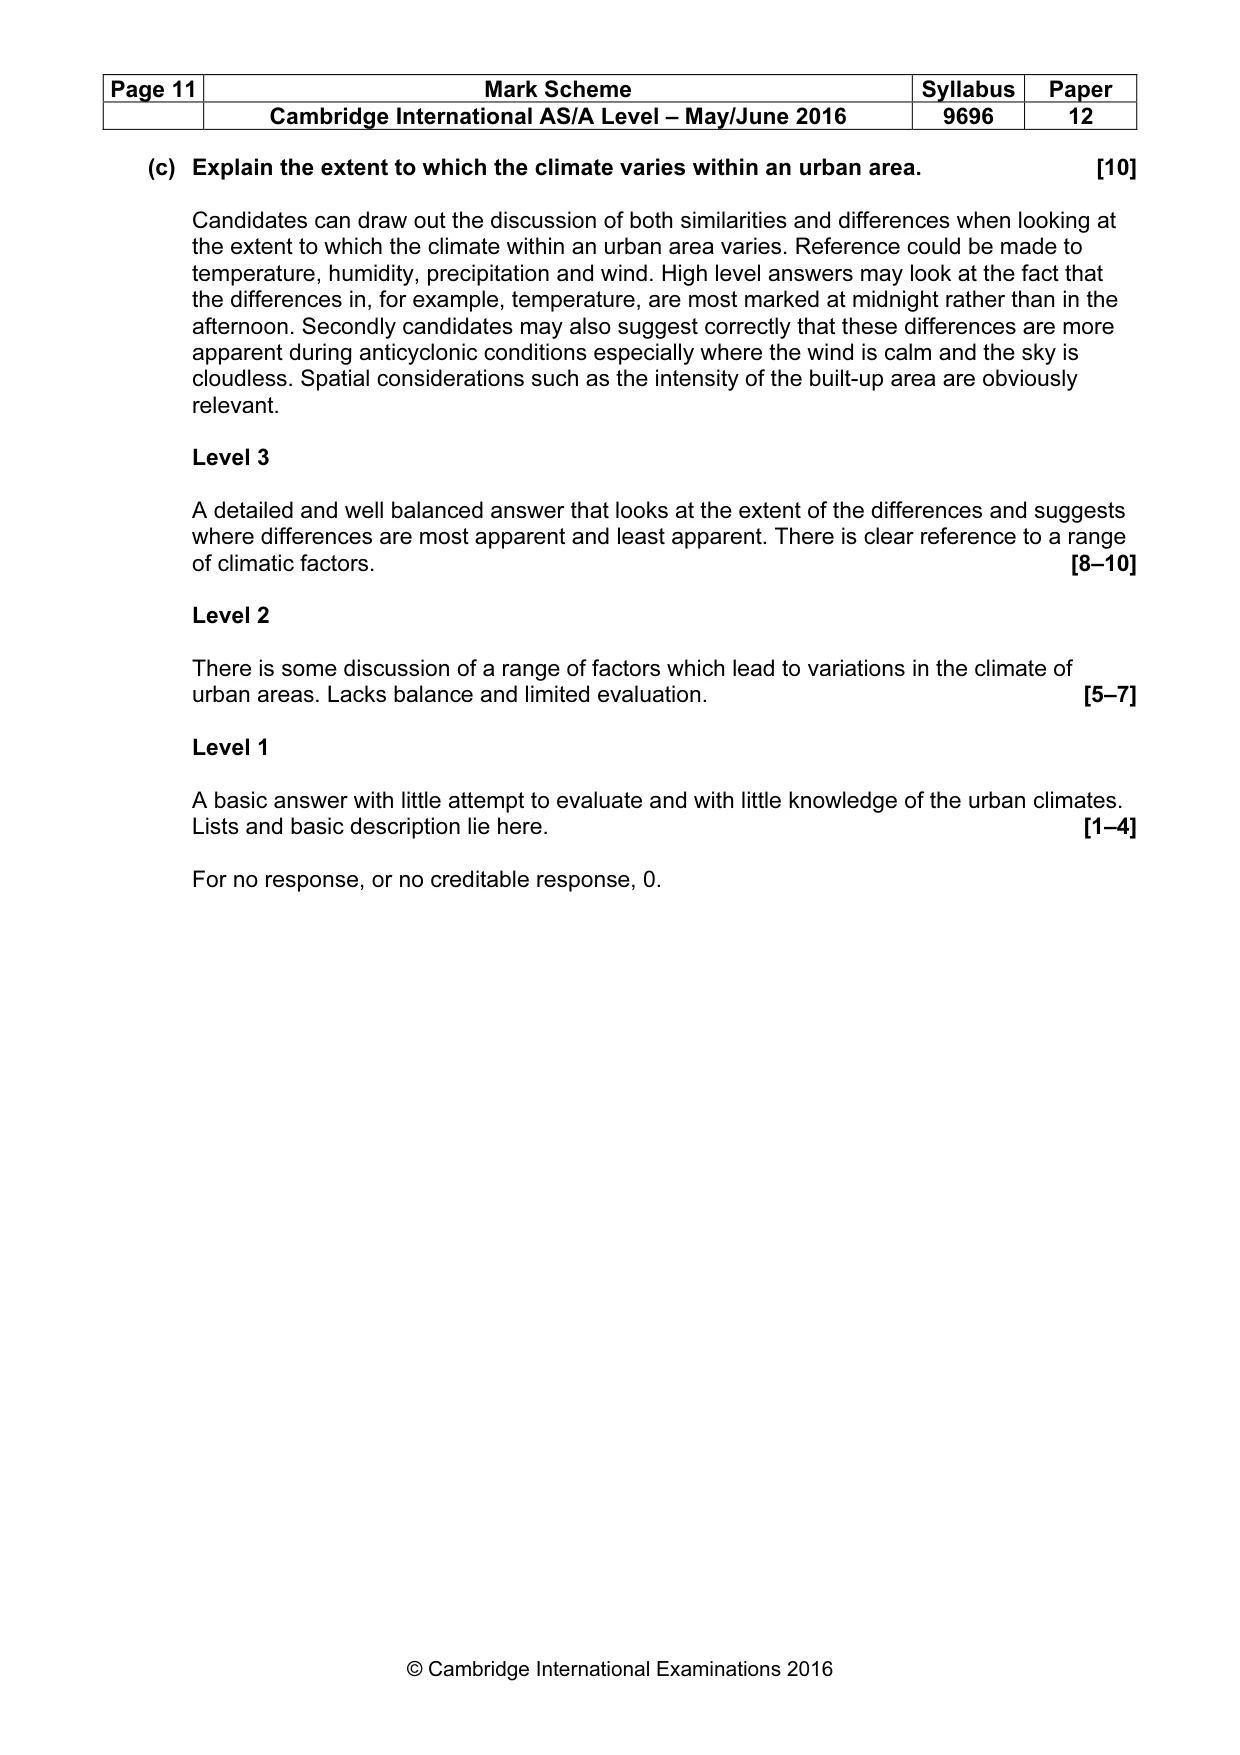
Page 11 Mark Scheme Syllabus Paper Cambridge International AS/A Level – May/June 2016 9696 12 © Cambridge International Examinations 2016 (c) Explain the extent to which the climate varies within an urban area. [10] Candidates can draw out the discussion of both similarities and differences when looking at the extent to which the climate within an urban area varies. Reference could be made to temperature, humidity, precipitation and wind. High level answers may look at the fact that the differences in, for example, temperature, are most marked at midnight rather than in the afternoon. Secondly candidates may also suggest correctly that these differences are more apparent during anticyclonic conditions especially where the wind is calm and the sky is cloudless. Spatial considerations such as the intensity of the built-up area are obviously relevant. Level 3 A detailed and well balanced answer that looks at the extent of the differences and suggests where differences are most apparent and least apparent. There is clear reference to a range of climatic factors. [8–10] Level 2 There is some discussion of a range of factors which lead to variations in the climate of urban areas. Lacks balance and limited evaluation. [5–7] Level 1 A basic answer with little attempt to evaluate and with little knowledge of the urban climates. Lists and basic description lie here. [1–4] For no response, or no creditable response, 0.
Mark scheme, page 12
Page 12 Mark Scheme Syllabus Paper Cambridge International AS/A Level – May/June 2016 9696 12 © Cambridge International Examinations 2016 Rocks and weathering 9 (a) (i) Define the weathering terms oxidation and hydrolysis. [4] Oxidation is a form of chemical weathering where the oxygen in water reacts with rock / soil, often causing a reddening of the material. Hydrolysis is a form of chemical weathering where minerals are broken down through the reaction with hydrogen ions. Recognition of chemical weathering – Max 1 mark. (ii) Briefly describe how limestone is weathered by carbonation. [3] This is the process where slightly acidic water (containing carbon dioxide in solution) dissolves the calcium carbonate. The calcium carbonate is removed in solution as calcium bicarbonate through the passage of water. A chemical formula with a brief description is sufficent for 3 marks. (b) With the aid of a diagram or diagrams, explain the formation of island arcs and ocean ridges. [8] Island arcs are a chain of volcanic islands formed where two oceanic plates converge. Ocean ridges are formed underwater at constructive plate boundaries. Both are formed through the movement of plates because of convection currents. Mark 4/4 (c) Explain the extent to which temperature affects the weathering of granite. [10] A discussion of how important temperature is in both physical and chemical weathering is necessary. However temperature is not the only factor and the candidate needs to make reference to the other factors which also play a role, such as the nature of granite (jointing, mineralogy). The availability of water, aspect and gradient of slope, as well as the amount and nature of vegetation all play a part. Expect freeze-thaw, granular disintegration and hydrolysis. Level 3 A detailed answer that looks at temperature and also other factors which affect weathering. The answer is balanced. These factors are evaluated and a conclusion is drawn. [8–10] Level 2 A reasonable attempt to look at the variety of factors which affect weathering and some attempt at an evaluation is made. The answer lacks balance. [5–7] Level 1 A basic answer with little attempt to evaluate and with little knowledge of the factors which may affect weathering. Lists and basic description will be typical. [1–4] For no response, or no creditable response, 0.
Mark scheme, page 13
Page 13 Mark Scheme Syllabus Paper Cambridge International AS/A Level – May/June 2016 9696 12 © Cambridge International Examinations 2016 Section C: The Human Core Answer one question from this section. All questions carry 25 marks. Population 10 (a) Draw the age/sex pyramid for a country at Stage 4 of the demographic transition model and label its main features. [7] Stage 4 is low fluctuating or stationary where both birth and death rates are low. Stage 4 is also known as the contractive stage and is typical of many economically developed countries. The Stage 4 pyramid is a convex beehive shape with a high dependency ratio. The shape drawn should indicate age and gender emphasising many elderly dependents and showing a low birth rate (3 marks). Labelling may be descriptive and/or causal: • Few young dependents • Low birth rate • Falling elderly death rate/low death rate • High dependency ratio • Increasing number of elderly – usually female • Stable working age population (4 marks). (b) Explain the factors that influence the shape of age/sex pyramids. [8] Candidates should look at those factors that influence birth and death rates and net migration rates or they may look at the various characteristics of different pyramids. Factors could include: • Demographic – the link between low DRs and resulting low BRs, ageing pop. • Economic – high cost of children, working wives, opportunity costs, consumerism • Social – health care, education, religion, status of women, housing • Political – birth control, greater security, tax policies, pensions • Level and type of migration. Bear in mind the three bands of marks and qualities of response, 1–3, 4–6 and 7–8. Higher level responses should clearly focus on explaining shape of the pyramids.
Mark scheme, page 14
Page 14 Mark Scheme Syllabus Paper Cambridge International AS/A Level – May/June 2016 9696 12 © Cambridge International Examinations 2016 (c) Assess how populations can adjust to a population ceiling. [10] The concept of a population ceiling, first suggested by Malthus, is of a saturation level where the population equals the carrying capacity (or resources) of the local environment. This concept is often applied to animal populations but ignores the idea that humans can adjust the carrying capacity by resource development. Populations may adjust to a population ceiling by: • Malthusian type checks such as famine, disease, war which reduce the population • Take preventative measures such as birth control, out migration • Invent, discover or develop new resources or increase the productivity of existing resources Candidates will probably: Level 3 Make a response from detailed knowledge and strong conceptual understanding. Have clear cause and effect link between population adjustments and the population ceiling. Provide an effective assessment of both concepts. Use one or more examples in detail. [8–10] Level 2 Make a reasonable attempt, which may contain good points, but which remains partial. Show a thinly developed cause/effect link between population adjustments and the population ceiling. Offer a valid, but limited assessment of one or both concepts. Refer briefly to one or more examples. [5–7] Level 1 Offer one or more basic ideas and struggle to deal with the issue. Take a descriptive approach making little or no assessment. Offer limited or no example. [1–4] For no response, or no creditable response, 0.
Mark scheme, page 15
Page 15 Mark Scheme Syllabus Paper Cambridge International AS/A Level – May/June 2016 9696 12 © Cambridge International Examinations 2016 Migration / Settlement dynamics 11 (a) (i) Define the term push factors. [2] Push factors are those perceived (1 mark) disadvantages of the origin that encourage the migrant to leave (1 mark). (ii) Suggest reasons why more men than women migrate within many countries. [5] This is based on the premise that push and pull factors have differing significance for the sexes. It is partly because men are more mobile having fewer ties, being the main breadwinner, often more educated with higher status but also partly because women are less mobile often tied to bringing up the children, keeping house, looking after elderly parents, having less education and status. If only one side of this explanation then max 3 marks. (b) Explain the factors which act as constraints on international migration. [8] Again this could be tackled by referring to the relative balance of push and pull forces but this is more focused on ‘constraints, obstacles and barriers’ to migration such as: • Distance and cost • Borders and border controls • Level of knowledge of (or links with) the destination – fear of the unknown • Availability of transport links • Inertia • Level of responsibilities e.g. dependent elderly parents at the origin. Bear in mind the three bands of marks and qualities of response, 1–3, 4–6 and 7–8. At the higher level the link to how/why these factors constrain international migration should be clear.
Mark scheme, page 16
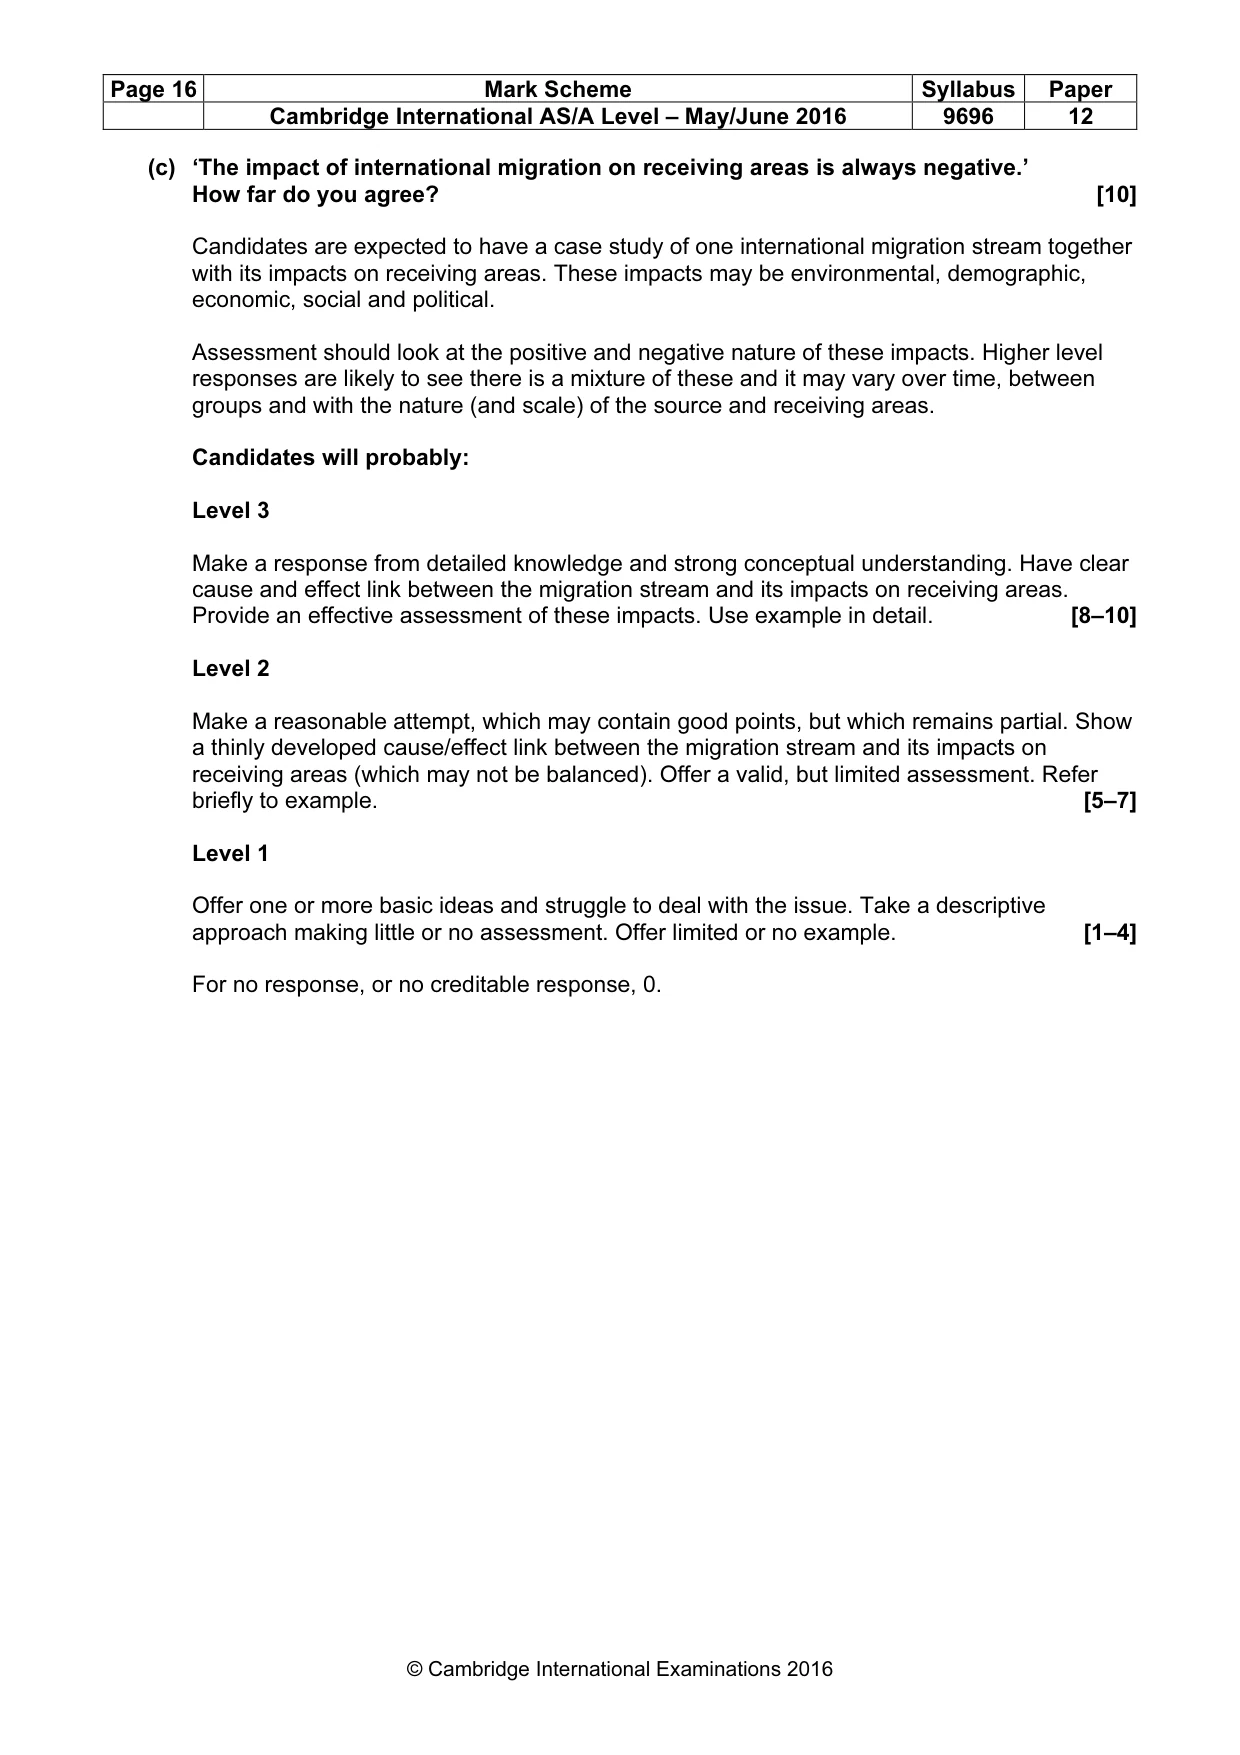
Page 16 Mark Scheme Syllabus Paper Cambridge International AS/A Level – May/June 2016 9696 12 © Cambridge International Examinations 2016 (c) ‘The impact of international migration on receiving areas is always negative.’ How far do you agree? [10] Candidates are expected to have a case study of one international migration stream together with its impacts on receiving areas. These impacts may be environmental, demographic, economic, social and political. Assessment should look at the positive and negative nature of these impacts. Higher level responses are likely to see there is a mixture of these and it may vary over time, between groups and with the nature (and scale) of the source and receiving areas. Candidates will probably: Level 3 Make a response from detailed knowledge and strong conceptual understanding. Have clear cause and effect link between the migration stream and its impacts on receiving areas. Provide an effective assessment of these impacts. Use example in detail. [8–10] Level 2 Make a reasonable attempt, which may contain good points, but which remains partial. Show a thinly developed cause/effect link between the migration stream and its impacts on receiving areas (which may not be balanced). Offer a valid, but limited assessment. Refer briefly to example. [5–7] Level 1 Offer one or more basic ideas and struggle to deal with the issue. Take a descriptive approach making little or no assessment. Offer limited or no example. [1–4] For no response, or no creditable response, 0.
Mark scheme, page 17
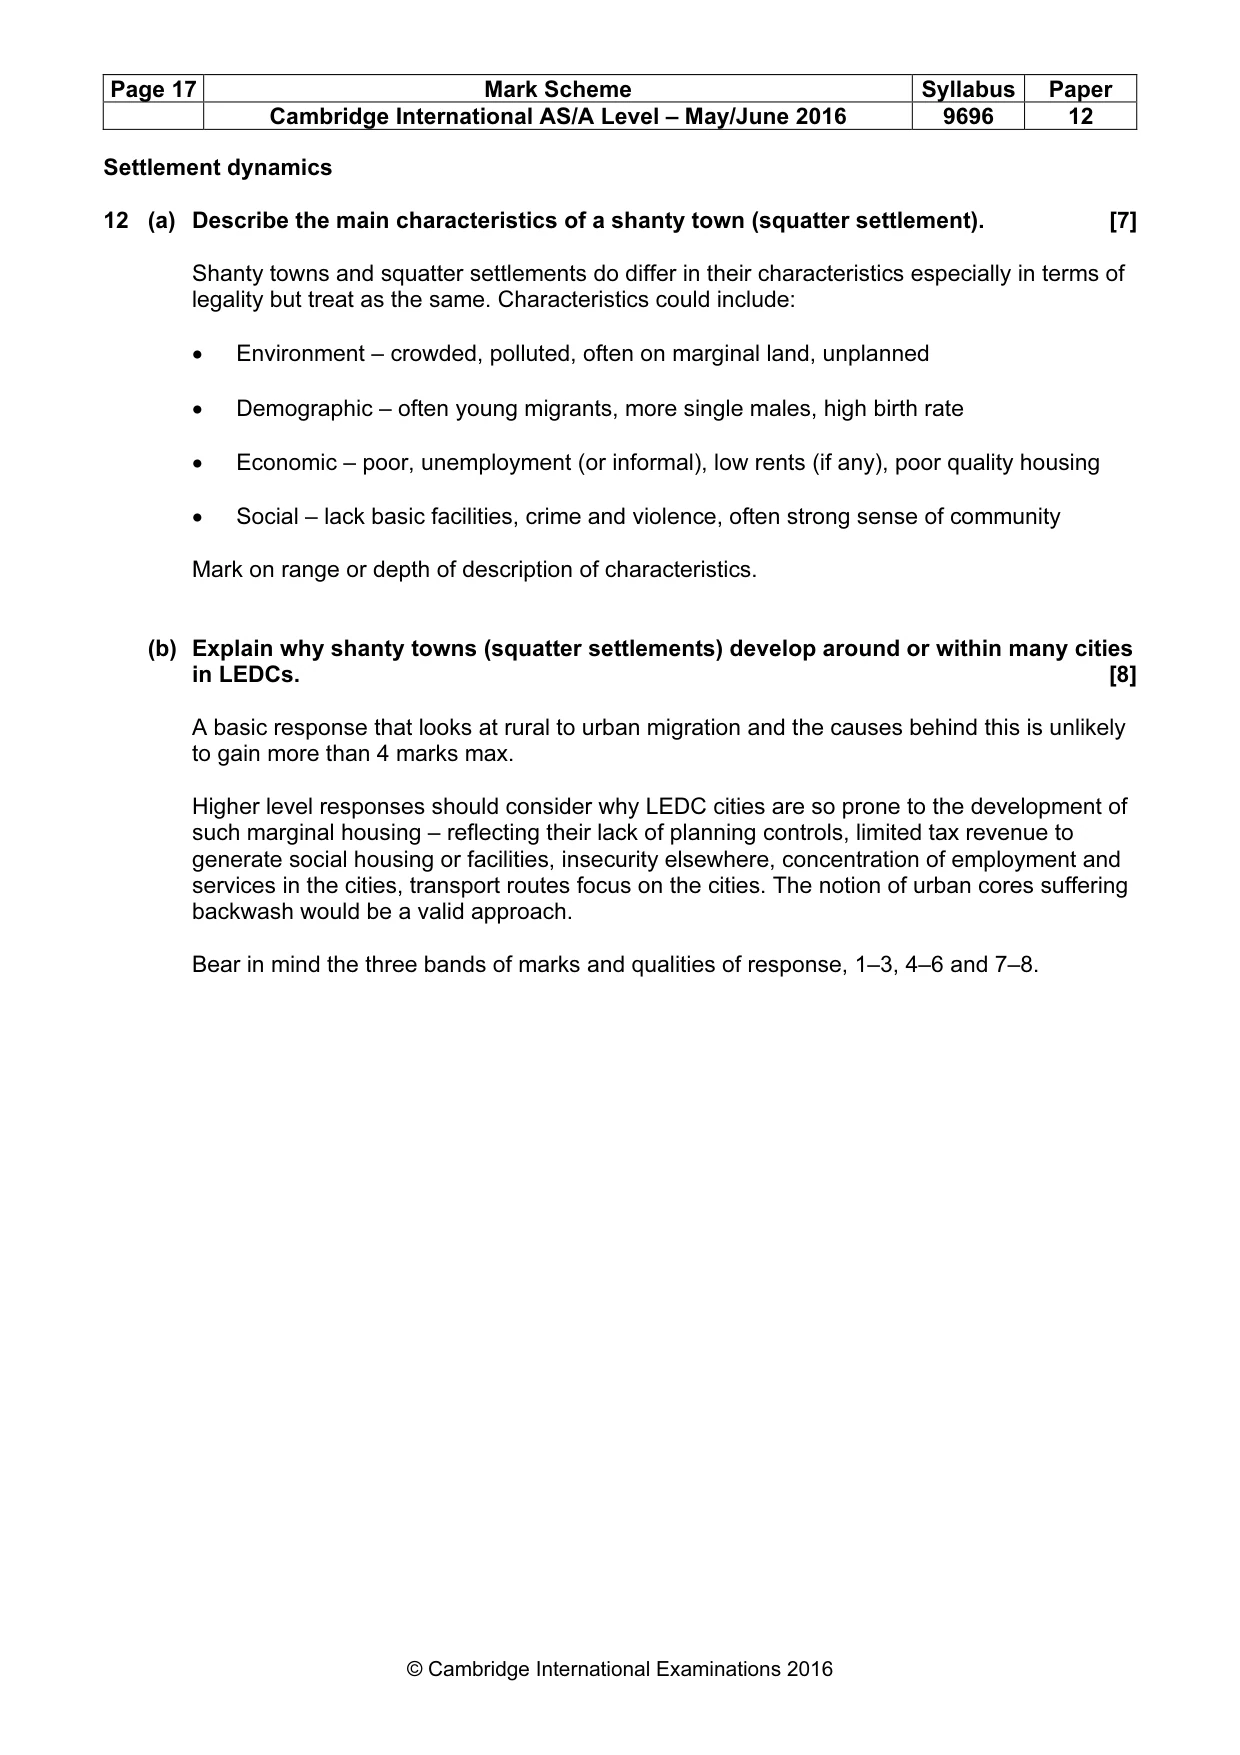
Page 17 Mark Scheme Syllabus Paper Cambridge International AS/A Level – May/June 2016 9696 12 © Cambridge International Examinations 2016 Settlement dynamics 12 (a) Describe the main characteristics of a shanty town (squatter settlement). [7] Shanty towns and squatter settlements do differ in their characteristics especially in terms of legality but treat as the same. Characteristics could include: • Environment – crowded, polluted, often on marginal land, unplanned • Demographic – often young migrants, more single males, high birth rate • Economic – poor, unemployment (or informal), low rents (if any), poor quality housing • Social – lack basic facilities, crime and violence, often strong sense of community Mark on range or depth of description of characteristics. (b) Explain why shanty towns (squatter settlements) develop around or within many cities in LEDCs. [8] A basic response that looks at rural to urban migration and the causes behind this is unlikely to gain more than 4 marks max. Higher level responses should consider why LEDC cities are so prone to the development of such marginal housing – reflecting their lack of planning controls, limited tax revenue to generate social housing or facilities, insecurity elsewhere, concentration of employment and services in the cities, transport routes focus on the cities. The notion of urban cores suffering backwash would be a valid approach. Bear in mind the three bands of marks and qualities of response, 1–3, 4–6 and 7–8.
Mark scheme, page 18
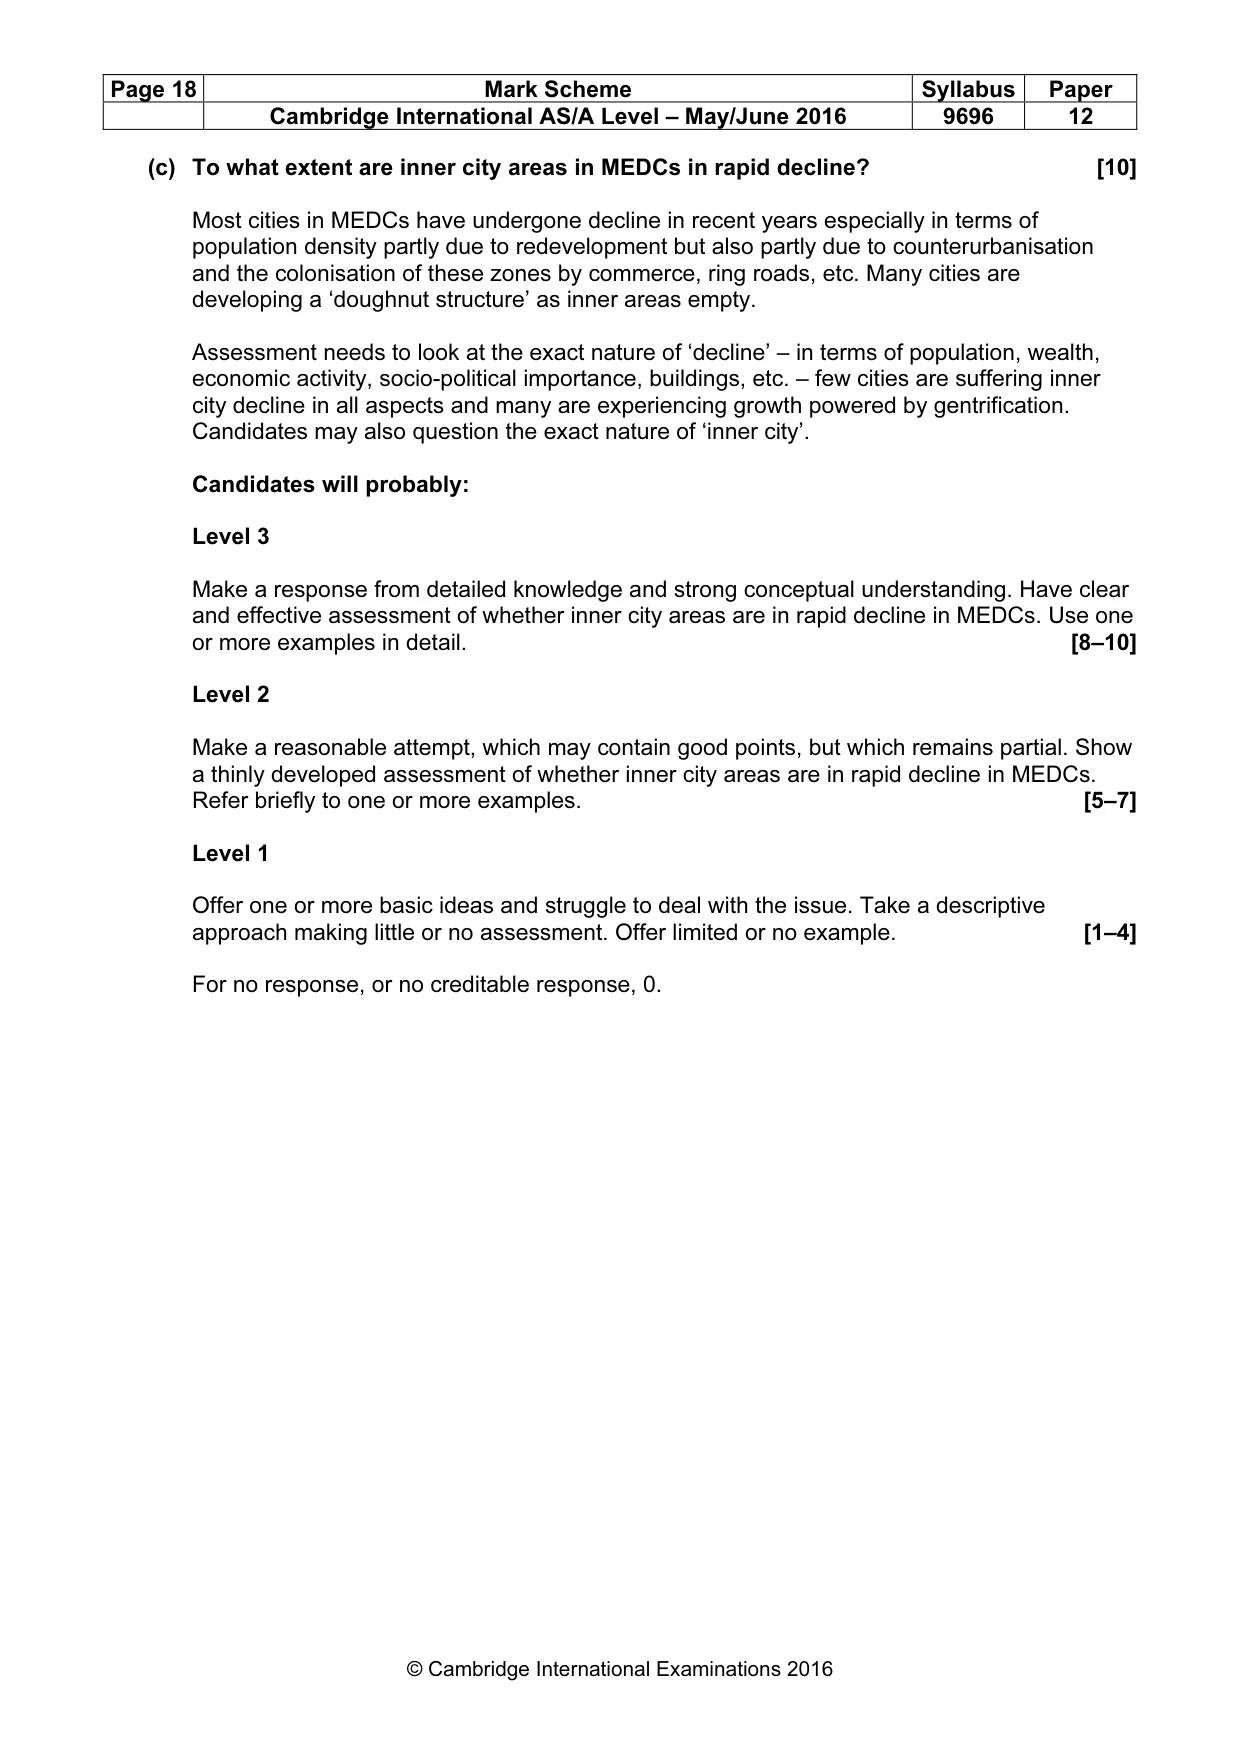
Page 18 Mark Scheme Syllabus Paper Cambridge International AS/A Level – May/June 2016 9696 12 © Cambridge International Examinations 2016 (c) To what extent are inner city areas in MEDCs in rapid decline? [10] Most cities in MEDCs have undergone decline in recent years especially in terms of population density partly due to redevelopment but also partly due to counterurbanisation and the colonisation of these zones by commerce, ring roads, etc. Many cities are developing a ‘doughnut structure’ as inner areas empty. Assessment needs to look at the exact nature of ‘decline’ – in terms of population, wealth, economic activity, socio-political importance, buildings, etc. – few cities are suffering inner city decline in all aspects and many are experiencing growth powered by gentrification. Candidates may also question the exact nature of ‘inner city’. Candidates will probably: Level 3 Make a response from detailed knowledge and strong conceptual understanding. Have clear and effective assessment of whether inner city areas are in rapid decline in MEDCs. Use one or more examples in detail. [8–10] Level 2 Make a reasonable attempt, which may contain good points, but which remains partial. Show a thinly developed assessment of whether inner city areas are in rapid decline in MEDCs. Refer briefly to one or more examples. [5–7] Level 1 Offer one or more basic ideas and struggle to deal with the issue. Take a descriptive approach making little or no assessment. Offer limited or no example. [1–4] For no response, or no creditable response, 0.
What you needed in this session
Cambridge’s own grade thresholds for 2016 May/June, Paper 1 · Variant 2. A higher threshold means an easier paper — the bar moves with how the cohort did.