Cambridge A Level Geography 9696 — 2015 Oct/Nov Paper 1 · Variant 3
9696/13/O/N/15 · 100 marks · ≈113 min
The question paper and its mark scheme, free to read here and free to download. This is Cambridge’s own paper, exactly as it was sat.
Question paper8 pages



Mark scheme17 pages
Answers below. Sit the paper first if you are practising.

Paper as text
Question paper, page 1
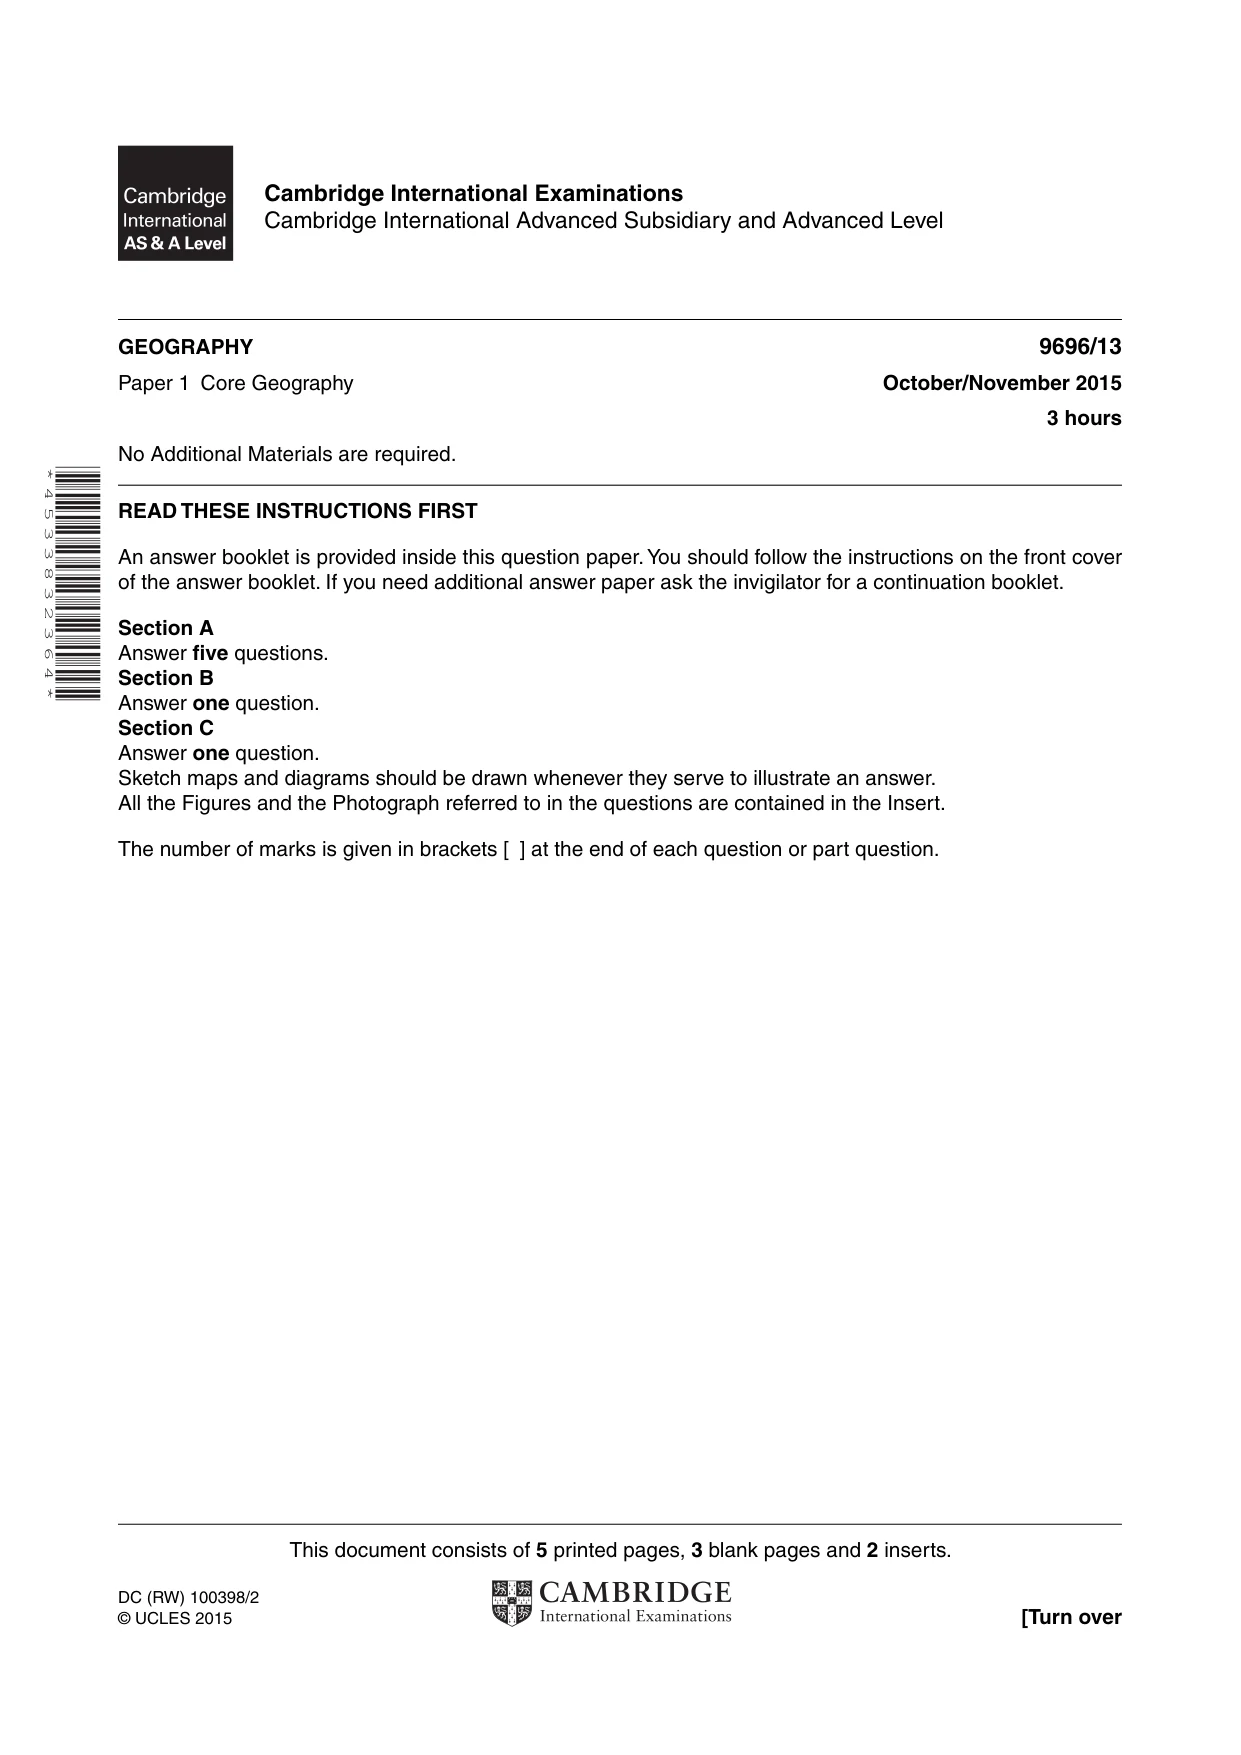
This document consists of 5 printed pages, 3 blank pages and 2 inserts. DC (RW) 100398/2 © UCLES 2015 [Turn over Cambridge International Examinations Cambridge International Advanced Subsidiary and Advanced Level * 4 5 3 3 8 3 2 3 6 4 * GEOGRAPHY 9696/13 Paper 1 Core Geography October/November 2015 3 hours No Additional Materials are required. READ THESE INSTRUCTIONS FIRST An answer booklet is provided inside this question paper. You should follow the instructions on the front cover of the answer booklet. If you need additional answer paper ask the invigilator for a continuation booklet. Section A Answer five questions. Section B Answer one question. Section C Answer one question. Sketch maps and diagrams should be drawn whenever they serve to illustrate an answer. All the Figures and the Photograph referred to in the questions are contained in the Insert. The number of marks is given in brackets [ ] at the end of each question or part question.
Question paper, page 2
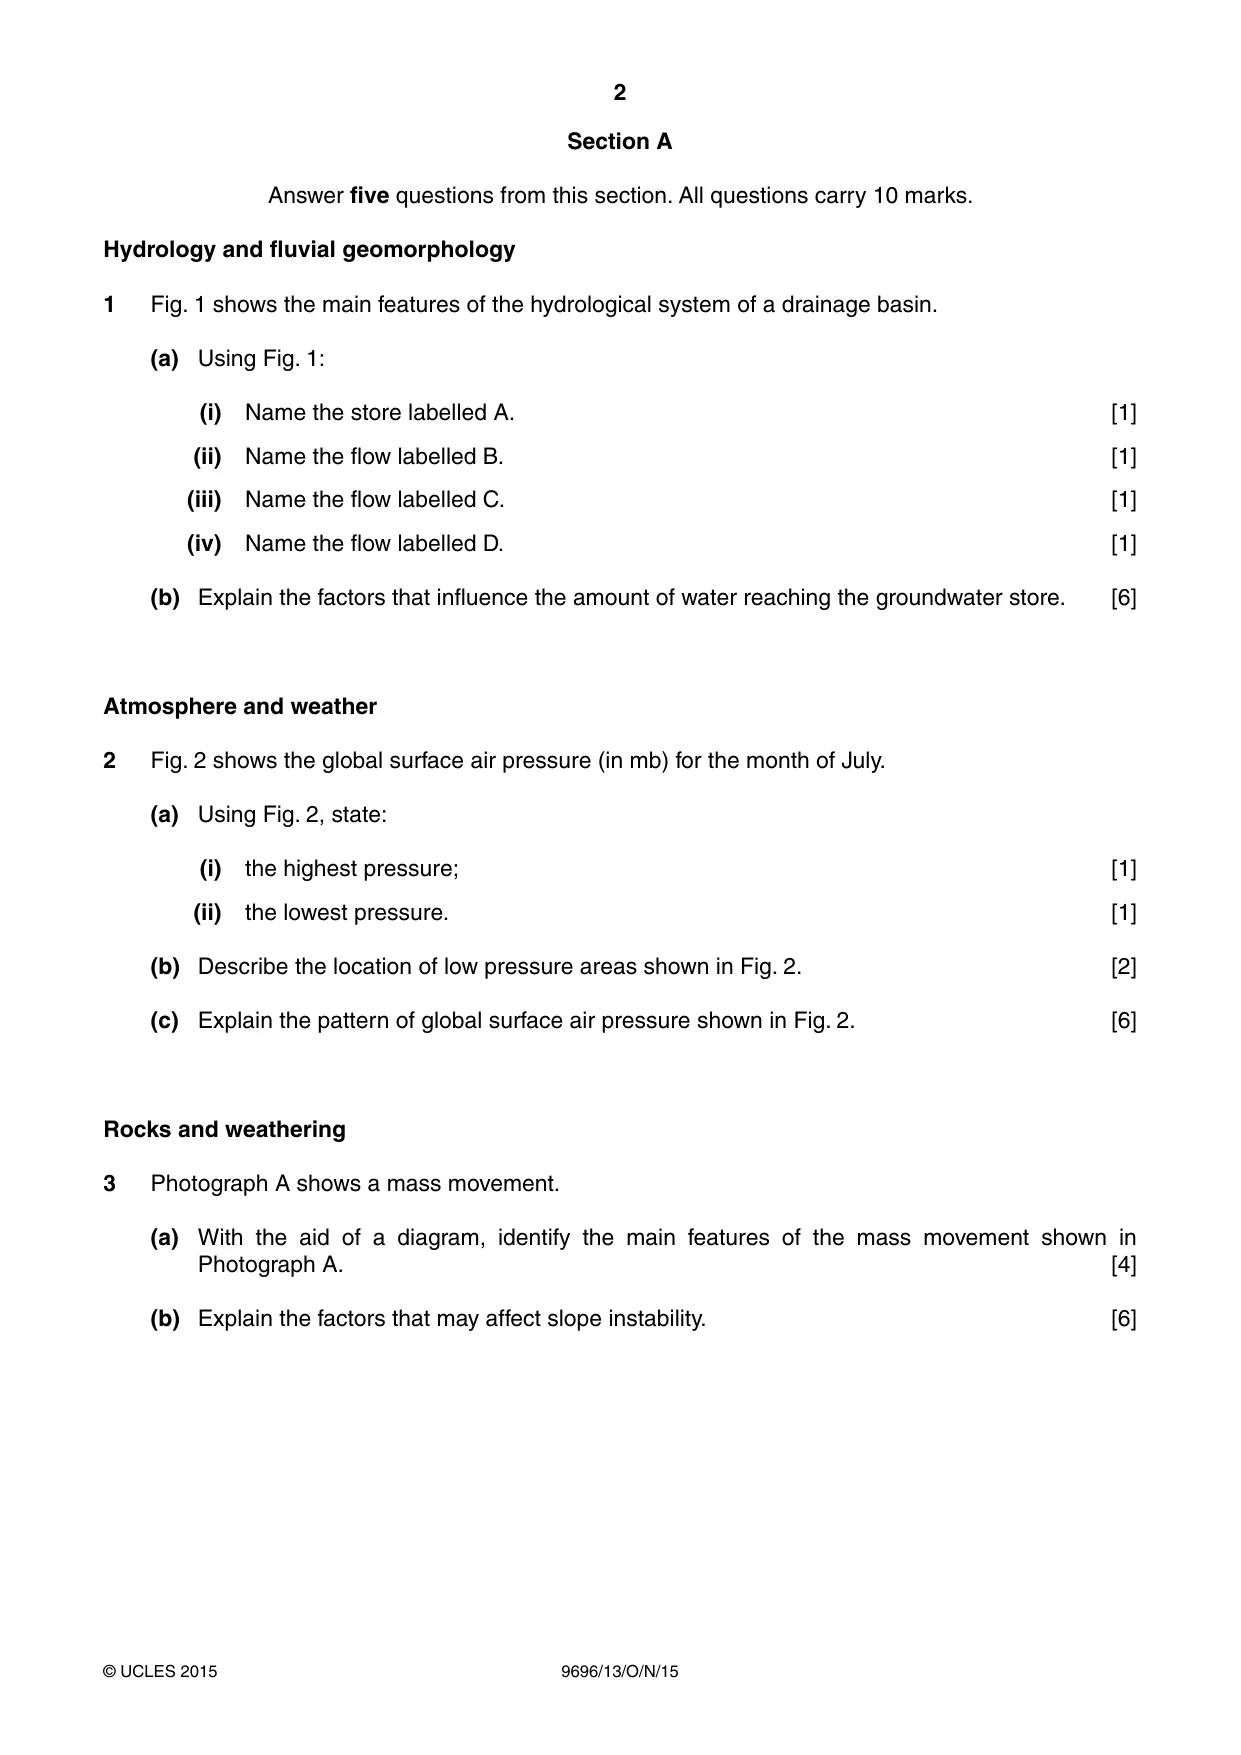
2 9696/13/O/N/15 © UCLES 2015 Section A Answer five questions from this section. All questions carry 10 marks. Hydrology and fluvial geomorphology 1 Fig. 1 shows the main features of the hydrological system of a drainage basin. (a) Using Fig. 1: (i) Name the store labelled A. [1] (ii) Name the flow labelled B. [1] (iii) Name the flow labelled C. [1] (iv) Name the flow labelled D. [1] (b) Explain the factors that influence the amount of water reaching the groundwater store. [6] Atmosphere and weather 2 Fig. 2 shows the global surface air pressure (in mb) for the month of July. (a) Using Fig. 2, state: (i) the highest pressure; [1] (ii) the lowest pressure. [1] (b) Describe the location of low pressure areas shown in Fig. 2. [2] (c) Explain the pattern of global surface air pressure shown in Fig. 2. [6] Rocks and weathering 3 Photograph A shows a mass movement. (a) With the aid of a diagram, identify the main features of the mass movement shown in Photograph A. [4] (b) Explain the factors that may affect slope instability. [6]
Question paper, page 3
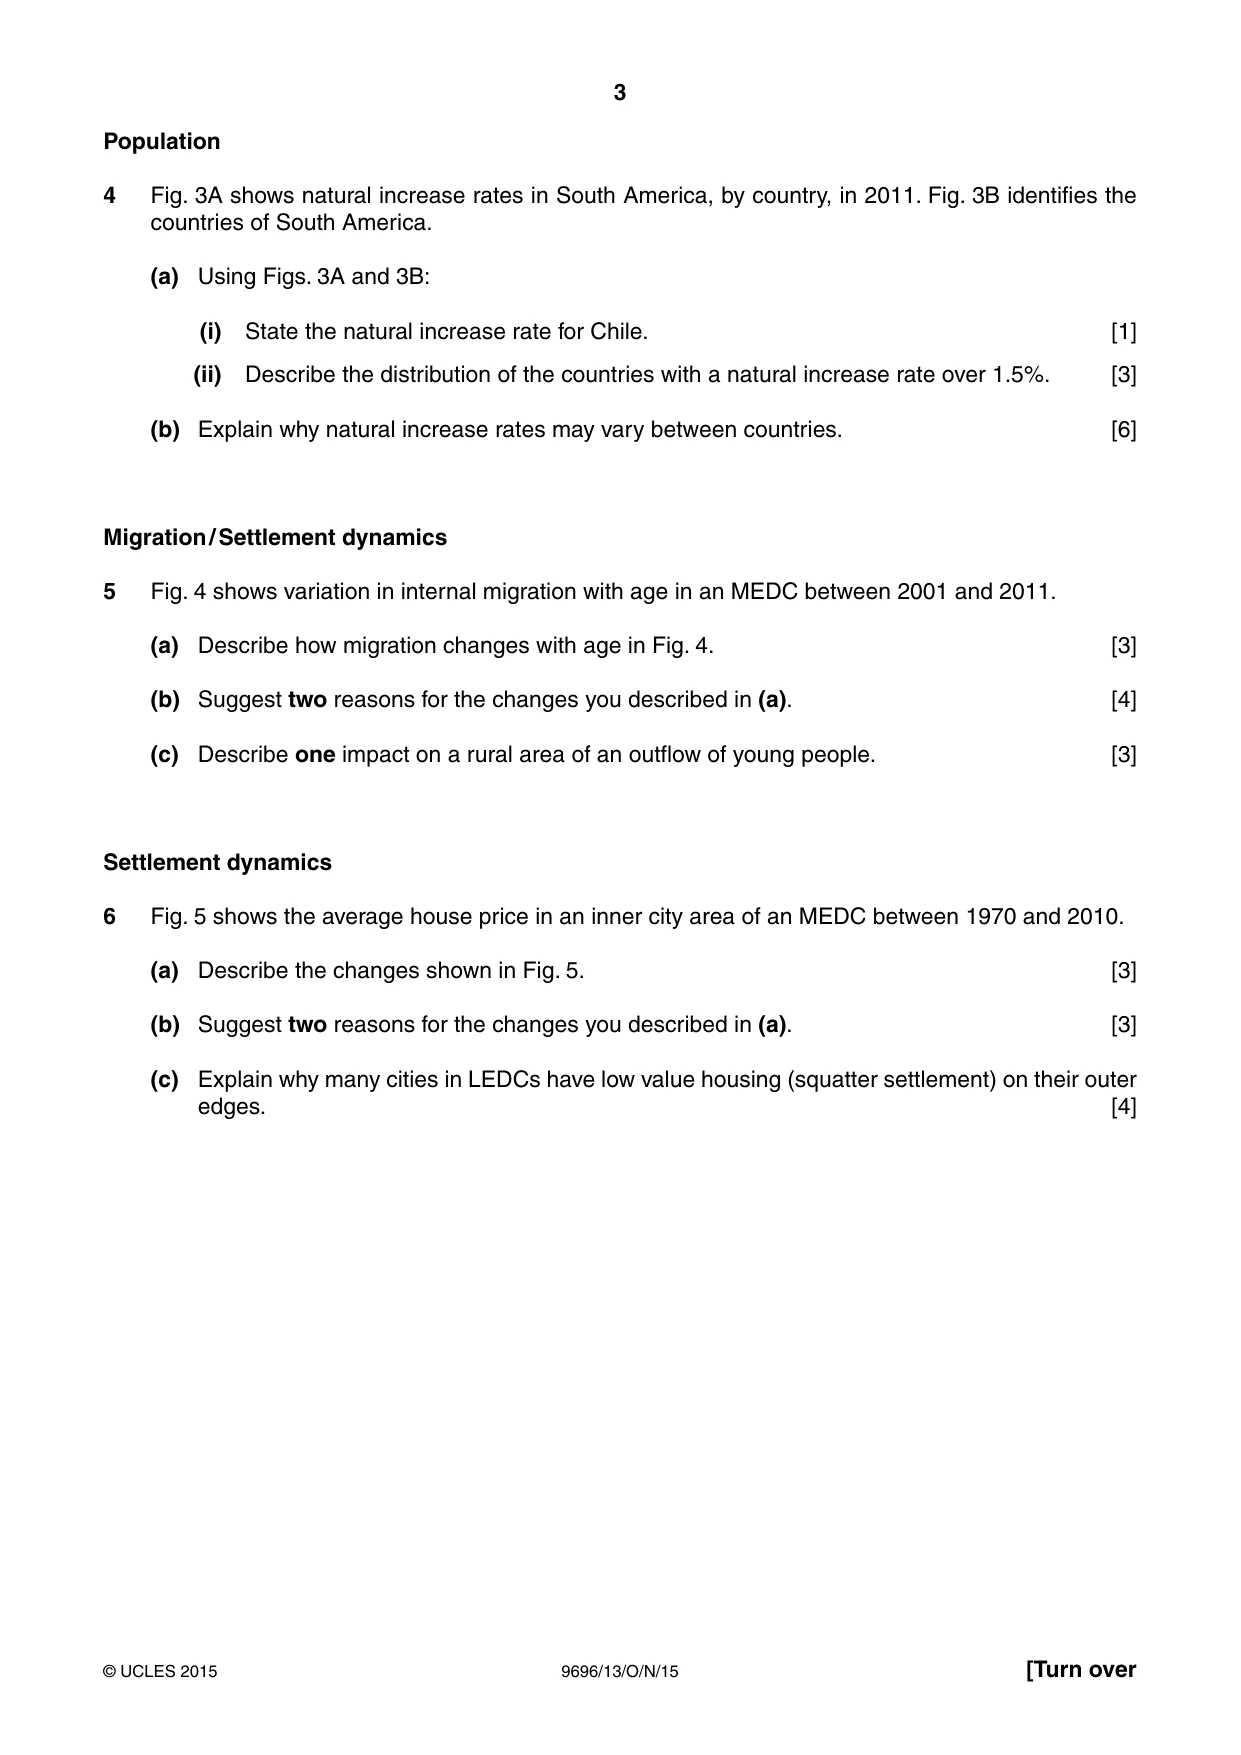
3 9696/13/O/N/15 © UCLES 2015 [Turn over Population 4 Fig. 3A shows natural increase rates in South America, by country, in 2011. Fig. 3B identifies the countries of South America. (a) Using Figs. 3A and 3B: (i) State the natural increase rate for Chile. [1] (ii) Describe the distribution of the countries with a natural increase rate over 1.5%. [3] (b) Explain why natural increase rates may vary between countries. [6] Migration / Settlement dynamics 5 Fig. 4 shows variation in internal migration with age in an MEDC between 2001 and 2011. (a) Describe how migration changes with age in Fig. 4. [3] (b) Suggest two reasons for the changes you described in (a). [4] (c) Describe one impact on a rural area of an outflow of young people. [3] Settlement dynamics 6 Fig. 5 shows the average house price in an inner city area of an MEDC between 1970 and 2010. (a) Describe the changes shown in Fig. 5. [3] (b) Suggest two reasons for the changes you described in (a). [3] (c) Explain why many cities in LEDCs have low value housing (squatter settlement) on their outer edges. [4]
Question paper, page 4
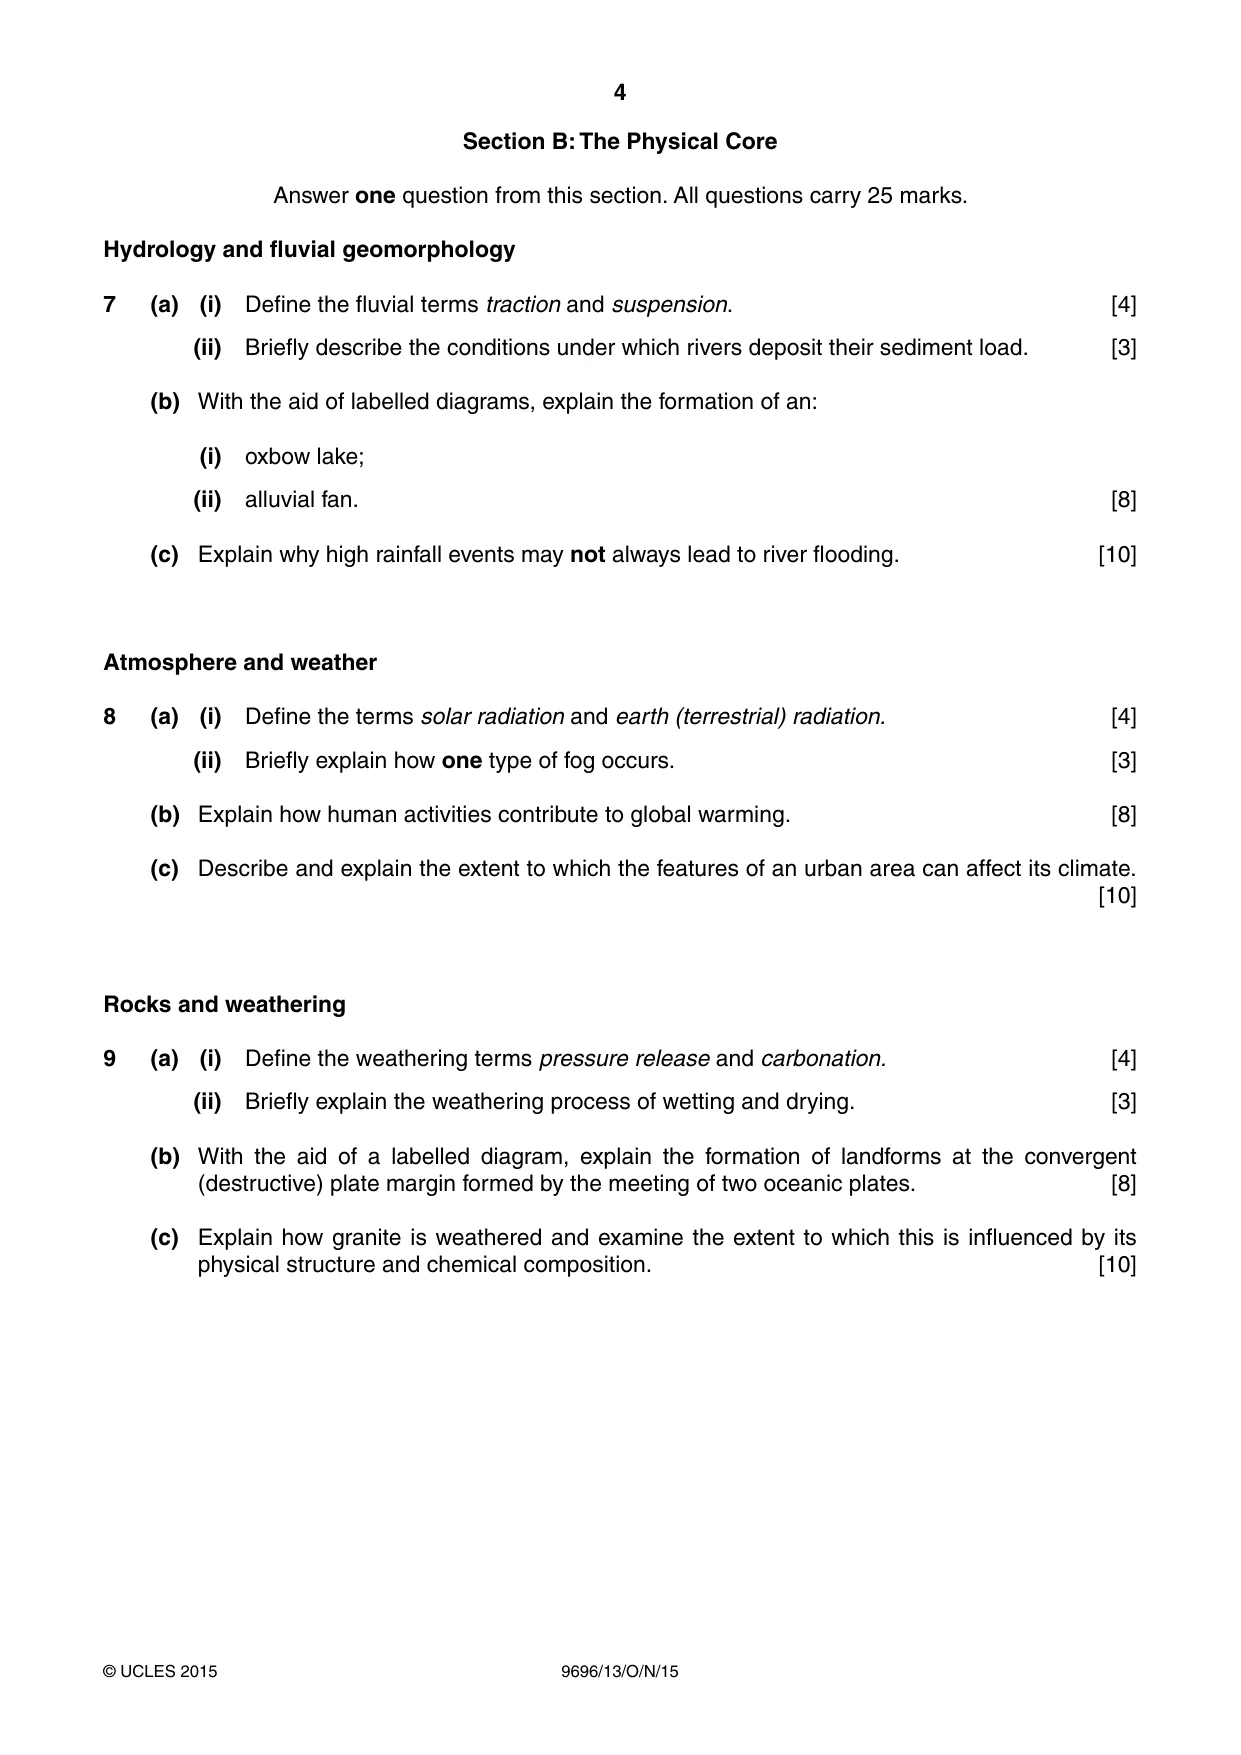
4 9696/13/O/N/15 © UCLES 2015 Section B: The Physical Core Answer one question from this section. All questions carry 25 marks. Hydrology and fluvial geomorphology 7 (a) (i) Define the fluvial terms traction and suspension. [4] (ii) Briefly describe the conditions under which rivers deposit their sediment load. [3] (b) With the aid of labelled diagrams, explain the formation of an: (i) oxbow lake; (ii) alluvial fan. [8] (c) Explain why high rainfall events may not always lead to river flooding. [10] Atmosphere and weather 8 (a) (i) Define the terms solar radiation and earth (terrestrial) radiation. [4] (ii) Briefly explain how one type of fog occurs. [3] (b) Explain how human activities contribute to global warming. [8] (c) Describe and explain the extent to which the features of an urban area can affect its climate. [10] Rocks and weathering 9 (a) (i) Define the weathering terms pressure release and carbonation. [4] (ii) Briefly explain the weathering process of wetting and drying. [3] (b) With the aid of a labelled diagram, explain the formation of landforms at the convergent (destructive) plate margin formed by the meeting of two oceanic plates. [8] (c) Explain how granite is weathered and examine the extent to which this is influenced by its physical structure and chemical composition. [10]
Question paper, page 5
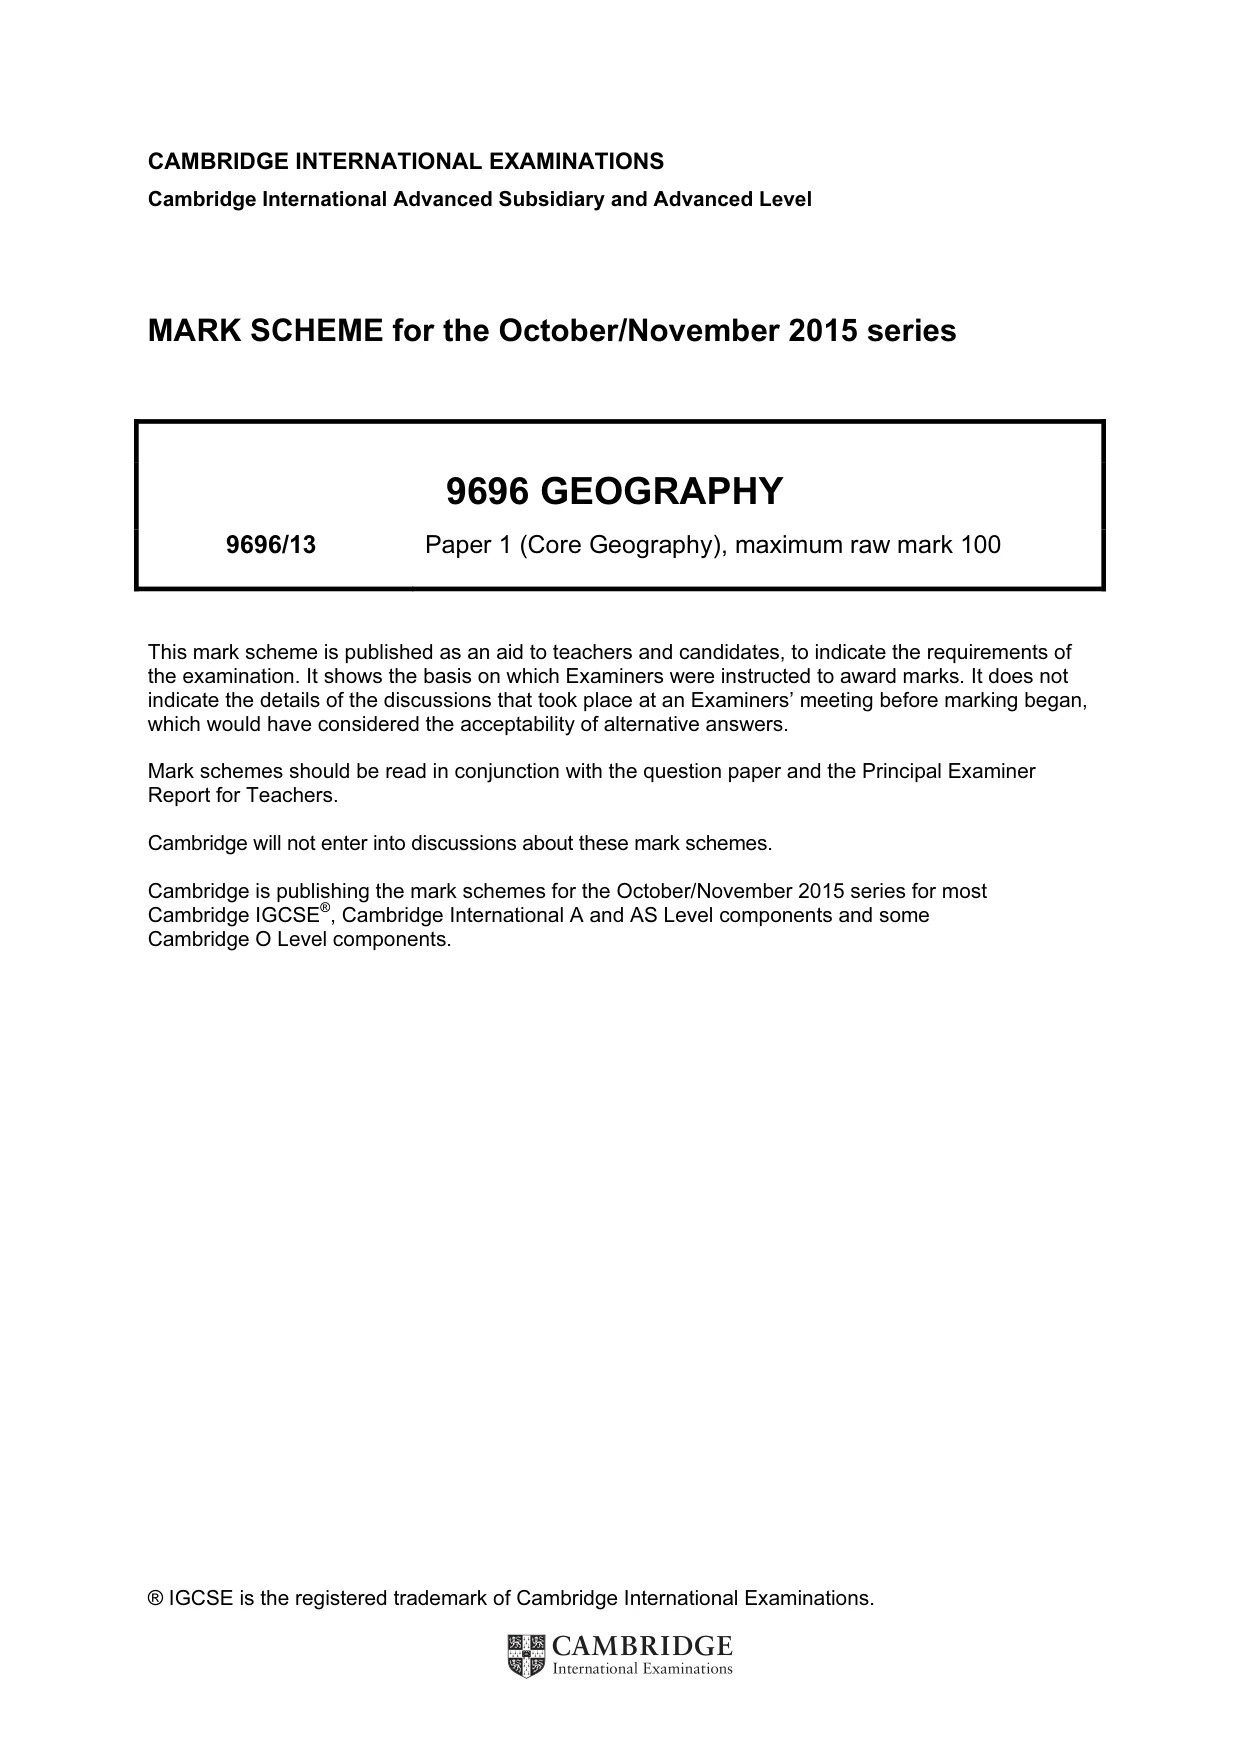
5 9696/13/O/N/15 © UCLES 2015 Section C: The Human Core Answer one question from this section. All questions carry 25 marks. Population 10 (a) (i) Draw a labelled diagram to show the features of stage 3 of the demographic transition model. [3] (ii) Explain the features you have shown in (a)(i). [4] (b) Describe the possible consequences of total population exceeding the resources in an area. [8] (c) To what extent does resource development result from technology and innovation? [10] Migration / Settlement dynamics 11 (a) (i) Outline the main pull factors in rural-urban migration. [4] (ii) Describe two ways in which these pull factors might be unrealistic. [3] (b) Outline why push factors in rural-urban migration may differ in their importance between LEDCs and MEDCs. [8] (c) ‘Cost is the greatest barrier to migration.’ How far do you agree? [10] Settlement dynamics 12 (a) (i) Give the meaning of the term gentrification. [3] (ii) Outline two reasons why gentrification occurs in many cities in MEDCs. [4] (b) Explain why the provision of services is changing in rural areas. [8] (c) Evaluate the responses to the issues caused by either rural growth or rural decline. [10]
Question paper, page 6
6 9696/13/O/N/15 © UCLES 2015 BLANK PAGE
Question paper, page 7
7 9696/13/O/N/15 © UCLES 2015 BLANK PAGE
Question paper, page 8
8 9696/13/O/N/15 © UCLES 2015 BLANK PAGE Permission to reproduce items where third-party owned material protected by copyright is included has been sought and cleared where possible. Every reasonable effort has been made by the publisher (UCLES) to trace copyright holders, but if any items requiring clearance have unwittingly been included, the publisher will be pleased to make amends at the earliest possible opportunity. To avoid the issue of disclosure of answer-related information to candidates, all copyright acknowledgements are reproduced online in the Cambridge International Examinations Copyright Acknowledgements Booklet. This is produced for each series of examinations and is freely available to download at www.cie.org.uk after the live examination series. Cambridge International Examinations is part of the Cambridge Assessment Group. Cambridge Assessment is the brand name of University of Cambridge Local Examinations Syndicate (UCLES), which is itself a department of the University of Cambridge.
Mark scheme, page 1
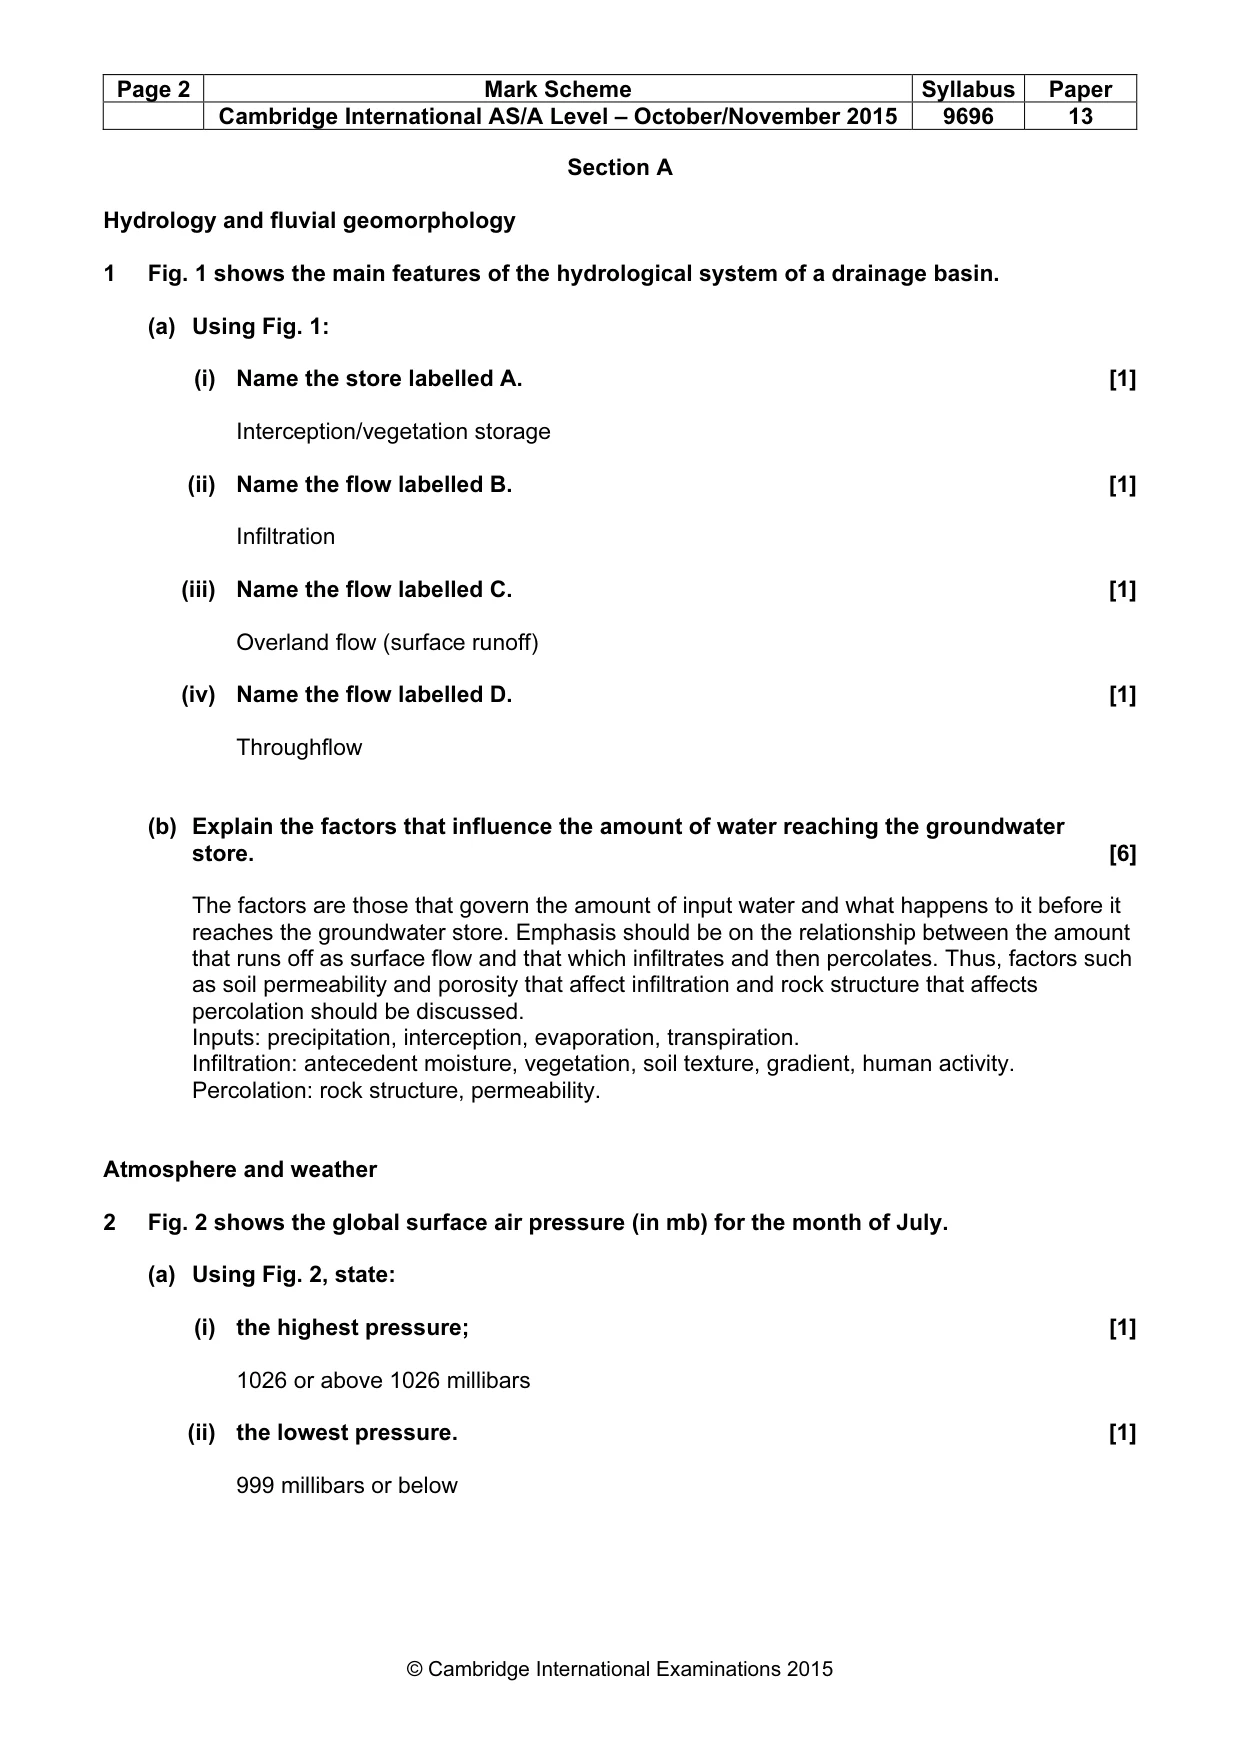
® IGCSE is the registered trademark of Cambridge International Examinations. CAMBRIDGE INTERNATIONAL EXAMINATIONS Cambridge International Advanced Subsidiary and Advanced Level MARK SCHEME for the October/November 2015 series 9696 GEOGRAPHY 9696/13 Paper 1 (Core Geography), maximum raw mark 100 This mark scheme is published as an aid to teachers and candidates, to indicate the requirements of the examination. It shows the basis on which Examiners were instructed to award marks. It does not indicate the details of the discussions that took place at an Examiners’ meeting before marking began, which would have considered the acceptability of alternative answers. Mark schemes should be read in conjunction with the question paper and the Principal Examiner Report for Teachers. Cambridge will not enter into discussions about these mark schemes. Cambridge is publishing the mark schemes for the October/November 2015 series for most Cambridge IGCSE®, Cambridge International A and AS Level components and some Cambridge O Level components.
Mark scheme, page 2
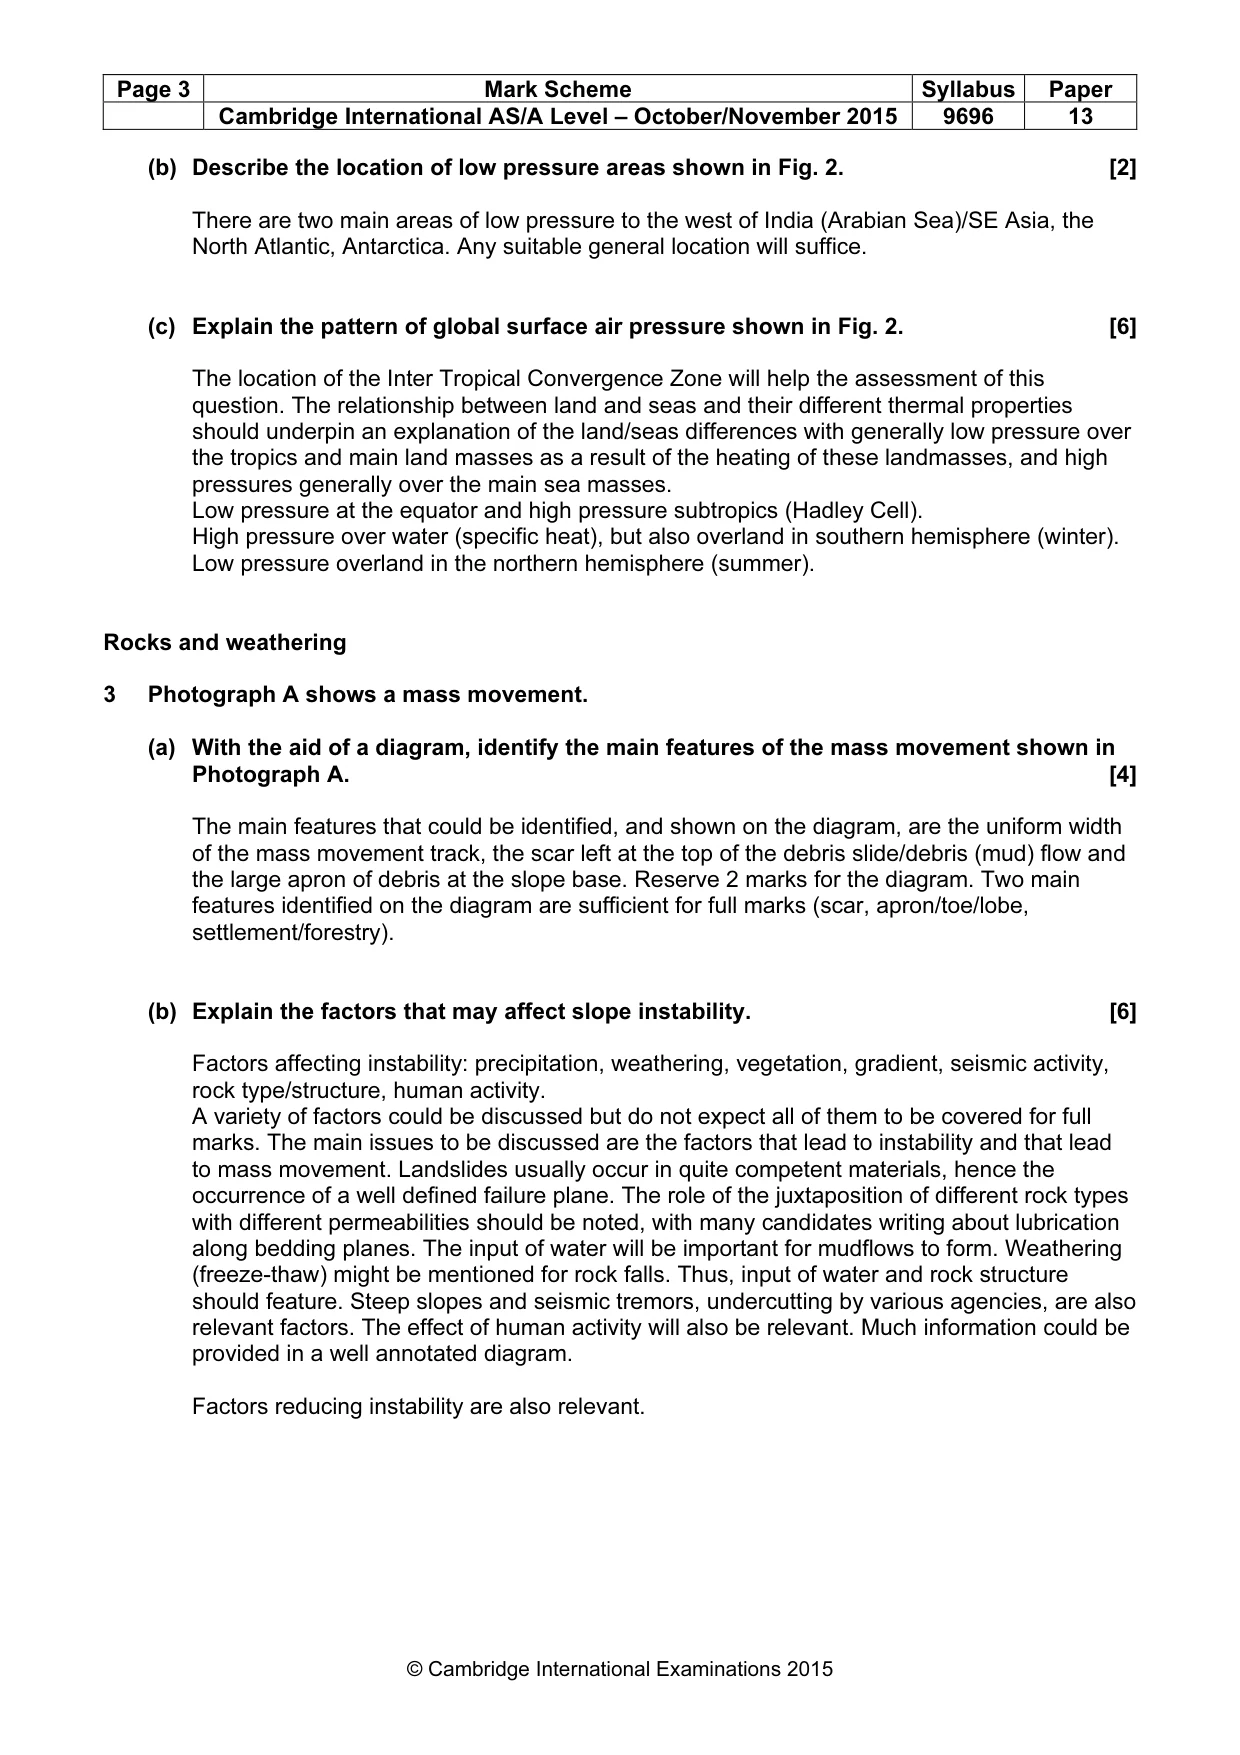
Page 2 Mark Scheme Syllabus Paper Cambridge International AS/A Level – October/November 2015 9696 13 © Cambridge International Examinations 2015 Section A Hydrology and fluvial geomorphology 1 Fig. 1 shows the main features of the hydrological system of a drainage basin. (a) Using Fig. 1: (i) Name the store labelled A. [1] Interception/vegetation storage (ii) Name the flow labelled B. [1] Infiltration (iii) Name the flow labelled C. [1] Overland flow (surface runoff) (iv) Name the flow labelled D. [1] Throughflow (b) Explain the factors that influence the amount of water reaching the groundwater store. [6] The factors are those that govern the amount of input water and what happens to it before it reaches the groundwater store. Emphasis should be on the relationship between the amount that runs off as surface flow and that which infiltrates and then percolates. Thus, factors such as soil permeability and porosity that affect infiltration and rock structure that affects percolation should be discussed. Inputs: precipitation, interception, evaporation, transpiration. Infiltration: antecedent moisture, vegetation, soil texture, gradient, human activity. Percolation: rock structure, permeability. Atmosphere and weather 2 Fig. 2 shows the global surface air pressure (in mb) for the month of July. (a) Using Fig. 2, state: (i) the highest pressure; [1] 1026 or above 1026 millibars (ii) the lowest pressure. [1] 999 millibars or below
Mark scheme, page 3
Page 3 Mark Scheme Syllabus Paper Cambridge International AS/A Level – October/November 2015 9696 13 © Cambridge International Examinations 2015 (b) Describe the location of low pressure areas shown in Fig. 2. [2] There are two main areas of low pressure to the west of India (Arabian Sea)/SE Asia, the North Atlantic, Antarctica. Any suitable general location will suffice. (c) Explain the pattern of global surface air pressure shown in Fig. 2. [6] The location of the Inter Tropical Convergence Zone will help the assessment of this question. The relationship between land and seas and their different thermal properties should underpin an explanation of the land/seas differences with generally low pressure over the tropics and main land masses as a result of the heating of these landmasses, and high pressures generally over the main sea masses. Low pressure at the equator and high pressure subtropics (Hadley Cell). High pressure over water (specific heat), but also overland in southern hemisphere (winter). Low pressure overland in the northern hemisphere (summer). Rocks and weathering 3 Photograph A shows a mass movement. (a) With the aid of a diagram, identify the main features of the mass movement shown in Photograph A. [4] The main features that could be identified, and shown on the diagram, are the uniform width of the mass movement track, the scar left at the top of the debris slide/debris (mud) flow and the large apron of debris at the slope base. Reserve 2 marks for the diagram. Two main features identified on the diagram are sufficient for full marks (scar, apron/toe/lobe, settlement/forestry). (b) Explain the factors that may affect slope instability. [6] Factors affecting instability: precipitation, weathering, vegetation, gradient, seismic activity, rock type/structure, human activity. A variety of factors could be discussed but do not expect all of them to be covered for full marks. The main issues to be discussed are the factors that lead to instability and that lead to mass movement. Landslides usually occur in quite competent materials, hence the occurrence of a well defined failure plane. The role of the juxtaposition of different rock types with different permeabilities should be noted, with many candidates writing about lubrication along bedding planes. The input of water will be important for mudflows to form. Weathering (freeze-thaw) might be mentioned for rock falls. Thus, input of water and rock structure should feature. Steep slopes and seismic tremors, undercutting by various agencies, are also relevant factors. The effect of human activity will also be relevant. Much information could be provided in a well annotated diagram. Factors reducing instability are also relevant.
Mark scheme, page 4
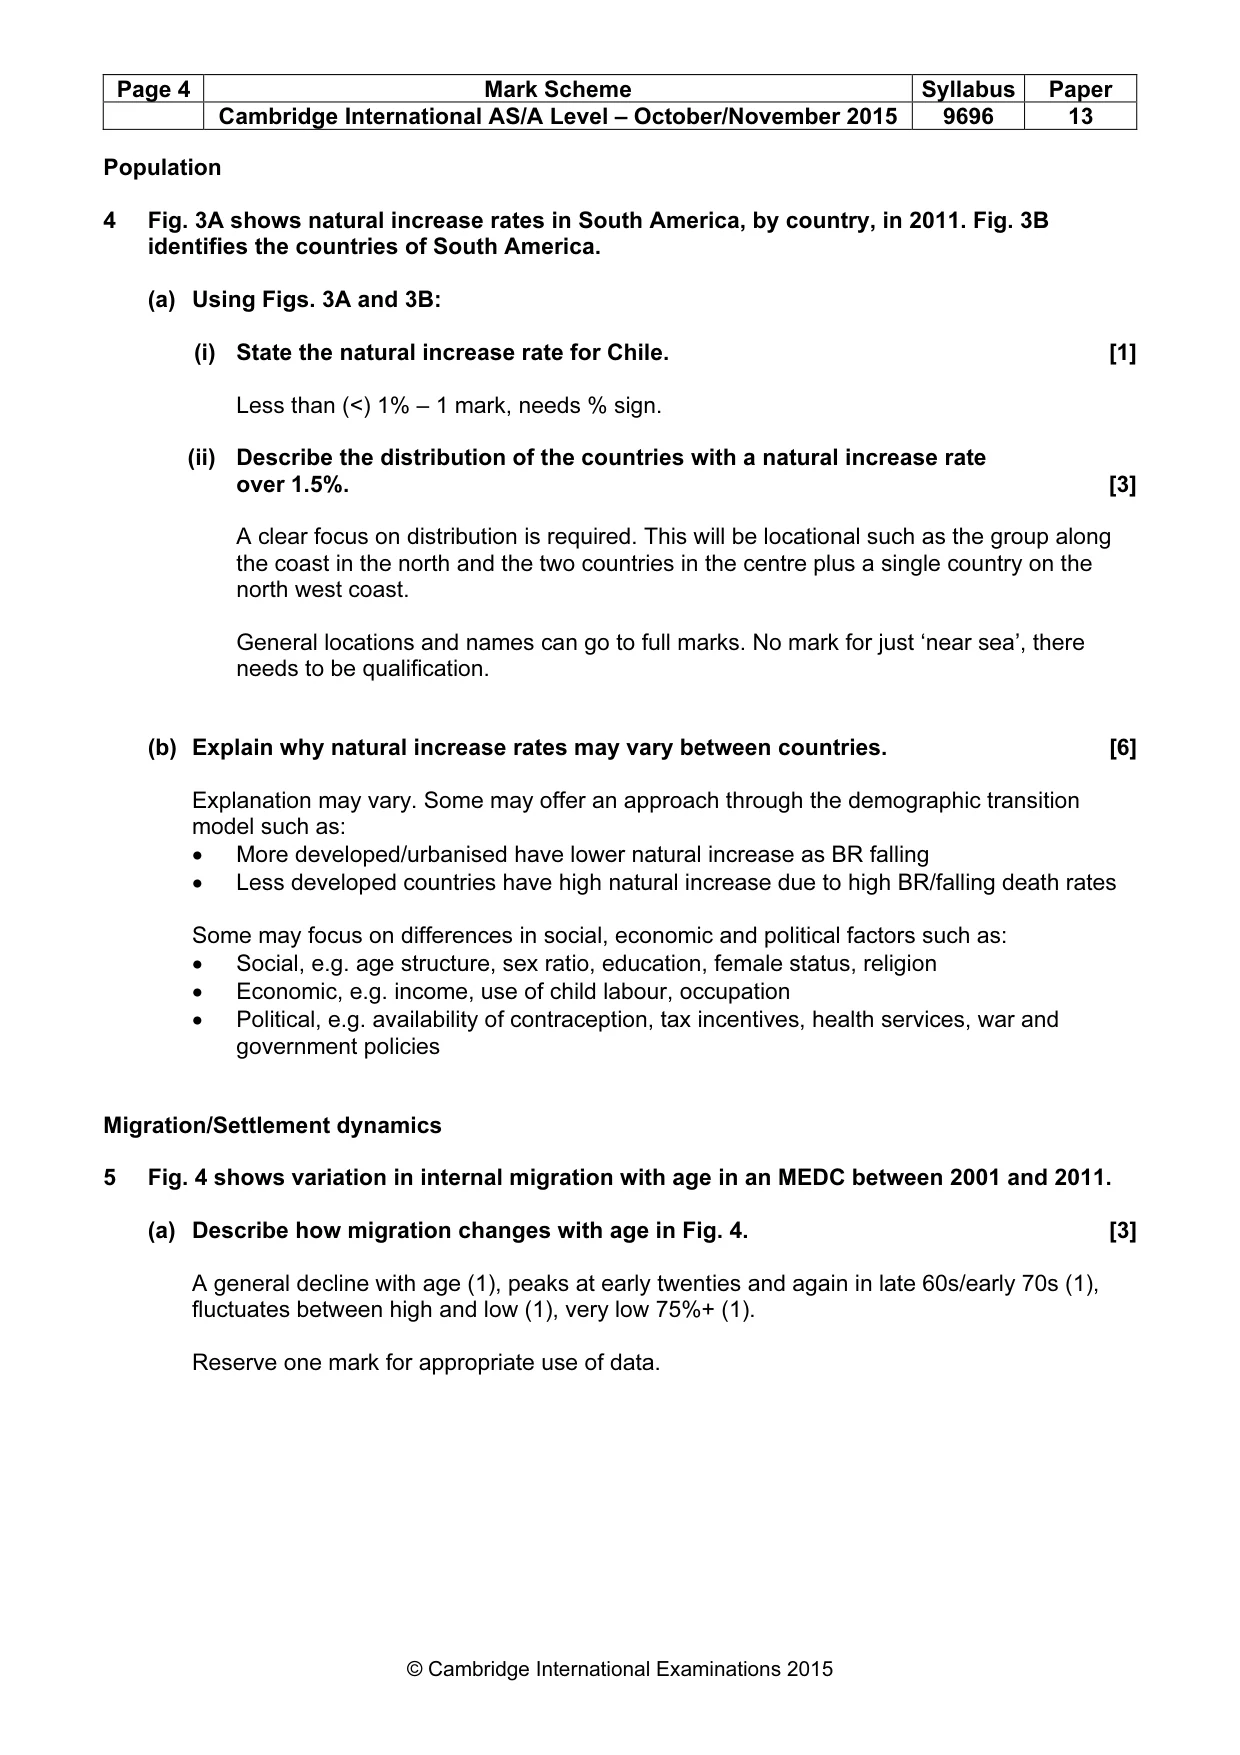
Page 4 Mark Scheme Syllabus Paper Cambridge International AS/A Level – October/November 2015 9696 13 © Cambridge International Examinations 2015 Population 4 Fig. 3A shows natural increase rates in South America, by country, in 2011. Fig. 3B identifies the countries of South America. (a) Using Figs. 3A and 3B: (i) State the natural increase rate for Chile. [1] Less than (<) 1% – 1 mark, needs % sign. (ii) Describe the distribution of the countries with a natural increase rate over 1.5%. [3] A clear focus on distribution is required. This will be locational such as the group along the coast in the north and the two countries in the centre plus a single country on the north west coast. General locations and names can go to full marks. No mark for just ‘near sea’, there needs to be qualification. (b) Explain why natural increase rates may vary between countries. [6] Explanation may vary. Some may offer an approach through the demographic transition model such as: • More developed/urbanised have lower natural increase as BR falling • Less developed countries have high natural increase due to high BR/falling death rates Some may focus on differences in social, economic and political factors such as: • Social, e.g. age structure, sex ratio, education, female status, religion • Economic, e.g. income, use of child labour, occupation • Political, e.g. availability of contraception, tax incentives, health services, war and government policies Migration/Settlement dynamics 5 Fig. 4 shows variation in internal migration with age in an MEDC between 2001 and 2011. (a) Describe how migration changes with age in Fig. 4. [3] A general decline with age (1), peaks at early twenties and again in late 60s/early 70s (1), fluctuates between high and low (1), very low 75%+ (1). Reserve one mark for appropriate use of data.
Mark scheme, page 5
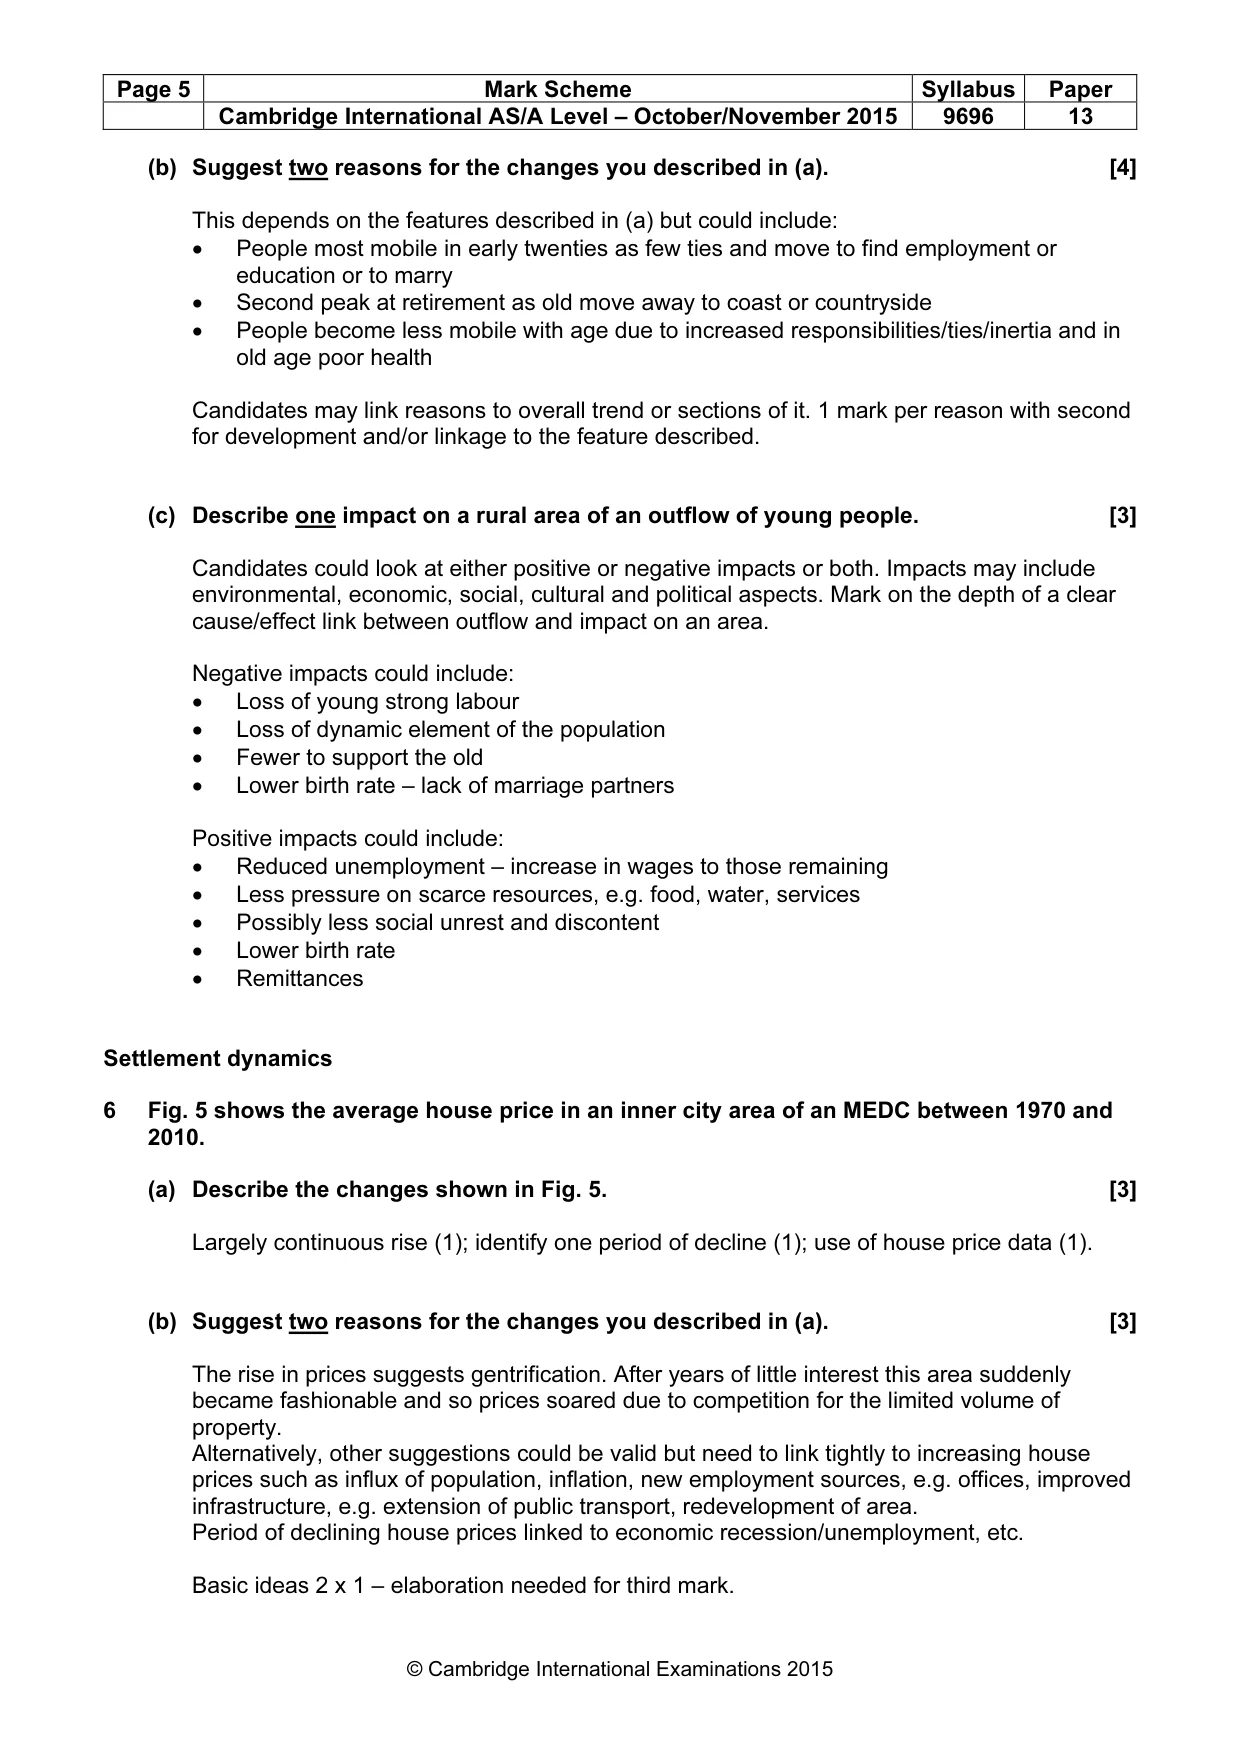
Page 5 Mark Scheme Syllabus Paper Cambridge International AS/A Level – October/November 2015 9696 13 © Cambridge International Examinations 2015 (b) Suggest two reasons for the changes you described in (a). [4] This depends on the features described in (a) but could include: • People most mobile in early twenties as few ties and move to find employment or education or to marry • Second peak at retirement as old move away to coast or countryside • People become less mobile with age due to increased responsibilities/ties/inertia and in old age poor health Candidates may link reasons to overall trend or sections of it. 1 mark per reason with second for development and/or linkage to the feature described. (c) Describe one impact on a rural area of an outflow of young people. [3] Candidates could look at either positive or negative impacts or both. Impacts may include environmental, economic, social, cultural and political aspects. Mark on the depth of a clear cause/effect link between outflow and impact on an area. Negative impacts could include: • Loss of young strong labour • Loss of dynamic element of the population • Fewer to support the old • Lower birth rate – lack of marriage partners Positive impacts could include: • Reduced unemployment – increase in wages to those remaining • Less pressure on scarce resources, e.g. food, water, services • Possibly less social unrest and discontent • Lower birth rate • Remittances Settlement dynamics 6 Fig. 5 shows the average house price in an inner city area of an MEDC between 1970 and 2010. (a) Describe the changes shown in Fig. 5. [3] Largely continuous rise (1); identify one period of decline (1); use of house price data (1). (b) Suggest two reasons for the changes you described in (a). [3] The rise in prices suggests gentrification. After years of little interest this area suddenly became fashionable and so prices soared due to competition for the limited volume of property. Alternatively, other suggestions could be valid but need to link tightly to increasing house prices such as influx of population, inflation, new employment sources, e.g. offices, improved infrastructure, e.g. extension of public transport, redevelopment of area. Period of declining house prices linked to economic recession/unemployment, etc. Basic ideas 2 x 1 – elaboration needed for third mark.
Mark scheme, page 6
Page 6 Mark Scheme Syllabus Paper Cambridge International AS/A Level – October/November 2015 9696 13 © Cambridge International Examinations 2015 (c) Explain why many cities in LEDCs have low value housing (squatter settlement) on their outer edges. [4] Candidates may look at this in a broadly theoretical way such as applying the bid rent model, so suggesting land uses that can only afford low rents are outbid for more central (scarcer) sites. Most will probably look at the growth of squatter settlement/shanty town development on the urban fringes and link this to the in-migration of poor rural workers. Mark holistically, but to achieve the maximum mark candidates should clearly explain why such low value settlement is on the outer fringes of the cities. This may be seen as a mix of economic, social and political forces, such as transport, distance from city centre, low environmental quality (steep slopes, marshland, degraded land).
Mark scheme, page 7
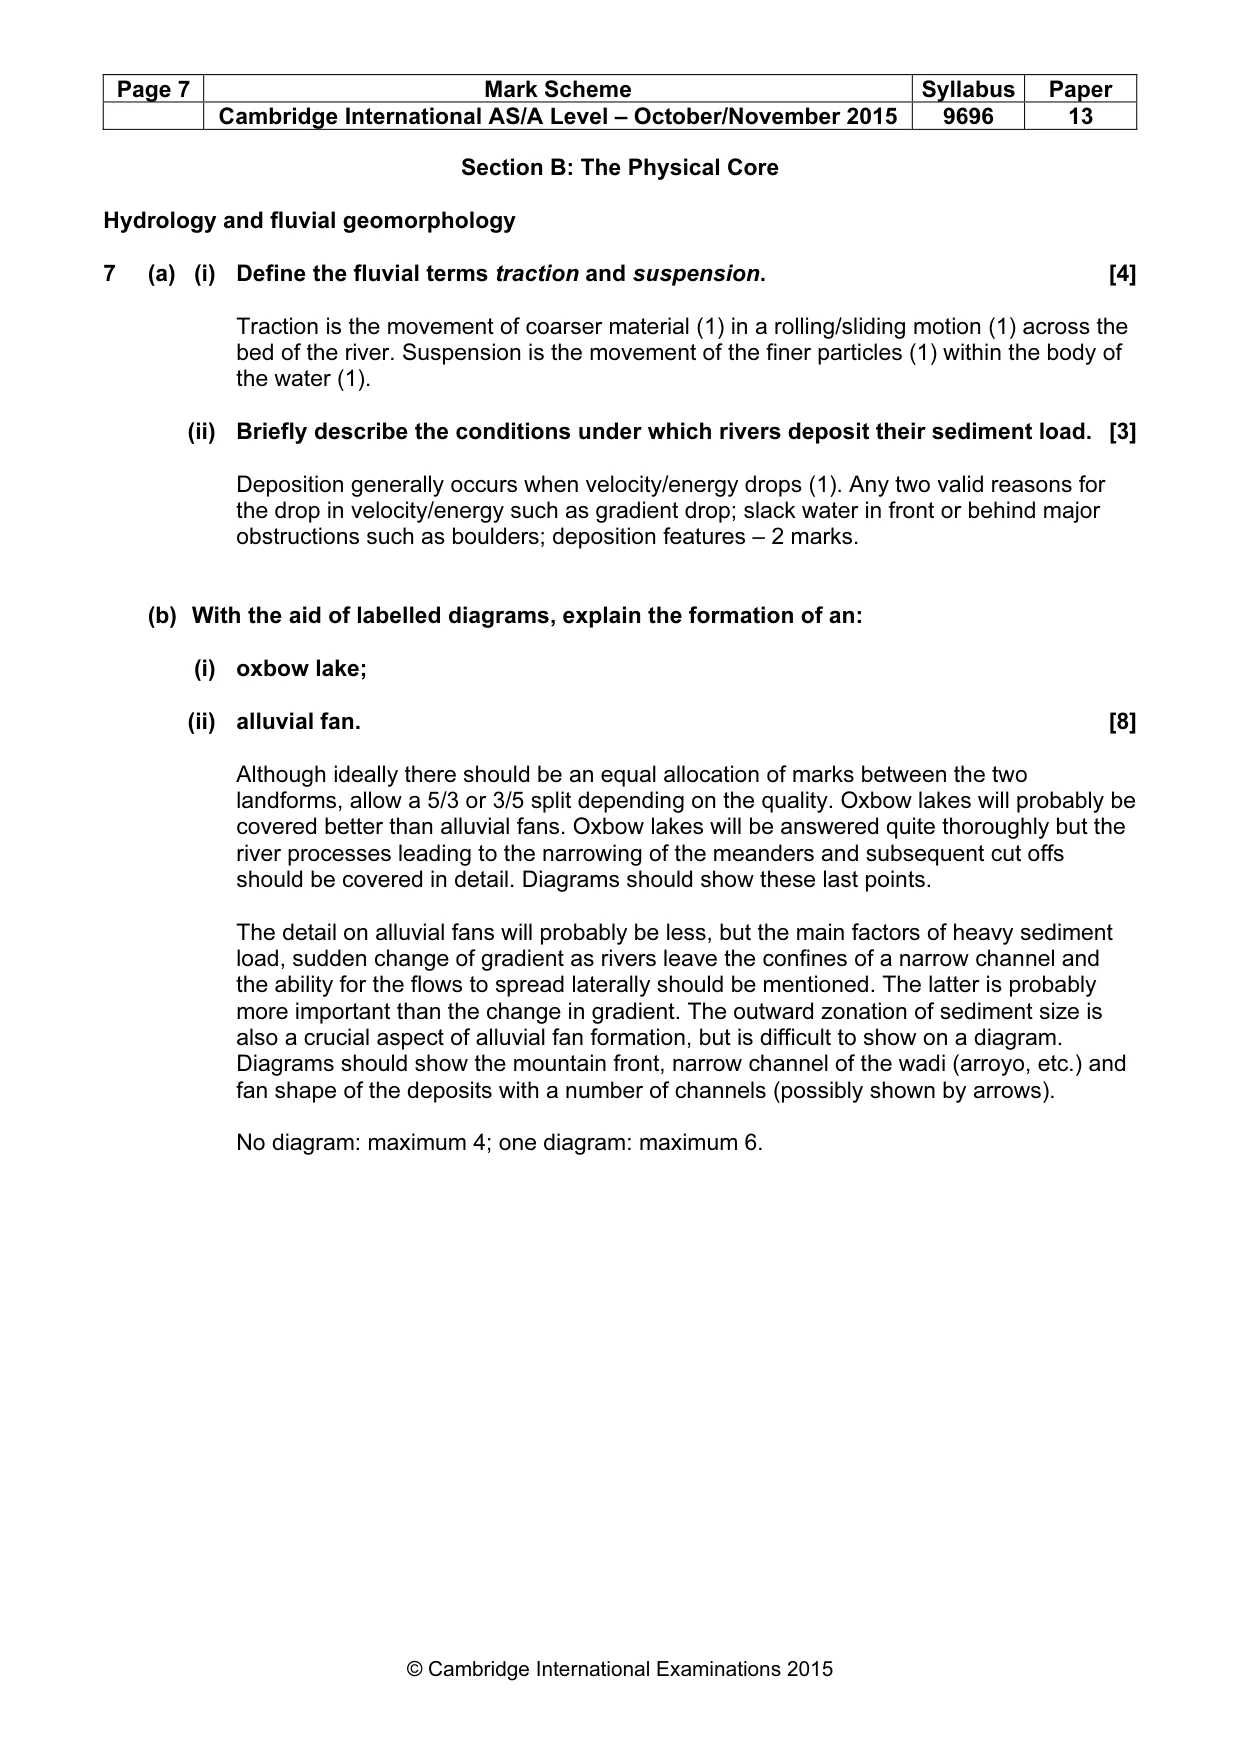
Page 7 Mark Scheme Syllabus Paper Cambridge International AS/A Level – October/November 2015 9696 13 © Cambridge International Examinations 2015 Section B: The Physical Core Hydrology and fluvial geomorphology 7 (a) (i) Define the fluvial terms traction and suspension. [4] Traction is the movement of coarser material (1) in a rolling/sliding motion (1) across the bed of the river. Suspension is the movement of the finer particles (1) within the body of the water (1). (ii) Briefly describe the conditions under which rivers deposit their sediment load. [3] Deposition generally occurs when velocity/energy drops (1). Any two valid reasons for the drop in velocity/energy such as gradient drop; slack water in front or behind major obstructions such as boulders; deposition features – 2 marks. (b) With the aid of labelled diagrams, explain the formation of an: (i) oxbow lake; (ii) alluvial fan. [8] Although ideally there should be an equal allocation of marks between the two landforms, allow a 5/3 or 3/5 split depending on the quality. Oxbow lakes will probably be covered better than alluvial fans. Oxbow lakes will be answered quite thoroughly but the river processes leading to the narrowing of the meanders and subsequent cut offs should be covered in detail. Diagrams should show these last points. The detail on alluvial fans will probably be less, but the main factors of heavy sediment load, sudden change of gradient as rivers leave the confines of a narrow channel and the ability for the flows to spread laterally should be mentioned. The latter is probably more important than the change in gradient. The outward zonation of sediment size is also a crucial aspect of alluvial fan formation, but is difficult to show on a diagram. Diagrams should show the mountain front, narrow channel of the wadi (arroyo, etc.) and fan shape of the deposits with a number of channels (possibly shown by arrows). No diagram: maximum 4; one diagram: maximum 6.
Mark scheme, page 8
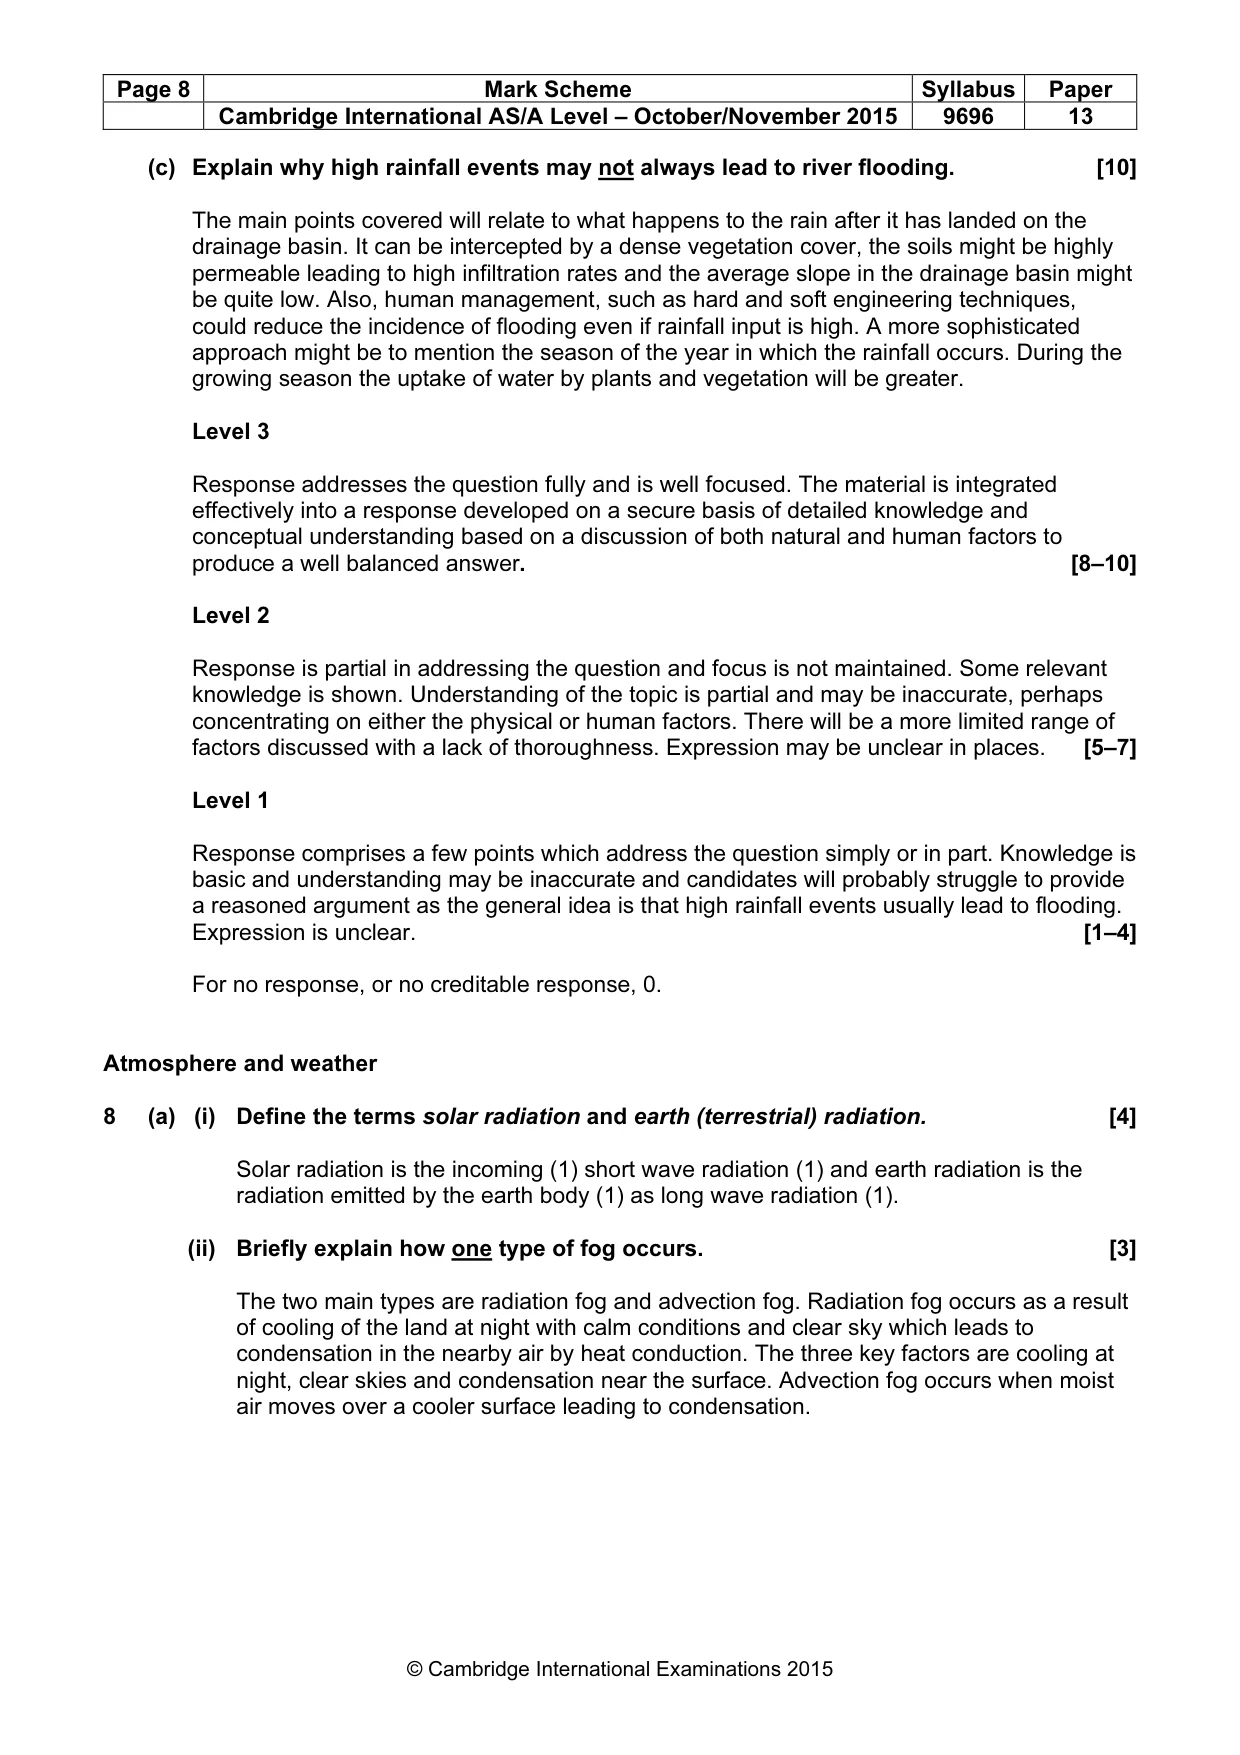
Page 8 Mark Scheme Syllabus Paper Cambridge International AS/A Level – October/November 2015 9696 13 © Cambridge International Examinations 2015 (c) Explain why high rainfall events may not always lead to river flooding. [10] The main points covered will relate to what happens to the rain after it has landed on the drainage basin. It can be intercepted by a dense vegetation cover, the soils might be highly permeable leading to high infiltration rates and the average slope in the drainage basin might be quite low. Also, human management, such as hard and soft engineering techniques, could reduce the incidence of flooding even if rainfall input is high. A more sophisticated approach might be to mention the season of the year in which the rainfall occurs. During the growing season the uptake of water by plants and vegetation will be greater. Level 3 Response addresses the question fully and is well focused. The material is integrated effectively into a response developed on a secure basis of detailed knowledge and conceptual understanding based on a discussion of both natural and human factors to produce a well balanced answer. [8–10] Level 2 Response is partial in addressing the question and focus is not maintained. Some relevant knowledge is shown. Understanding of the topic is partial and may be inaccurate, perhaps concentrating on either the physical or human factors. There will be a more limited range of factors discussed with a lack of thoroughness. Expression may be unclear in places. [5–7] Level 1 Response comprises a few points which address the question simply or in part. Knowledge is basic and understanding may be inaccurate and candidates will probably struggle to provide a reasoned argument as the general idea is that high rainfall events usually lead to flooding. Expression is unclear. [1–4] For no response, or no creditable response, 0. Atmosphere and weather 8 (a) (i) Define the terms solar radiation and earth (terrestrial) radiation. [4] Solar radiation is the incoming (1) short wave radiation (1) and earth radiation is the radiation emitted by the earth body (1) as long wave radiation (1). (ii) Briefly explain how one type of fog occurs. [3] The two main types are radiation fog and advection fog. Radiation fog occurs as a result of cooling of the land at night with calm conditions and clear sky which leads to condensation in the nearby air by heat conduction. The three key factors are cooling at night, clear skies and condensation near the surface. Advection fog occurs when moist air moves over a cooler surface leading to condensation.
Mark scheme, page 9
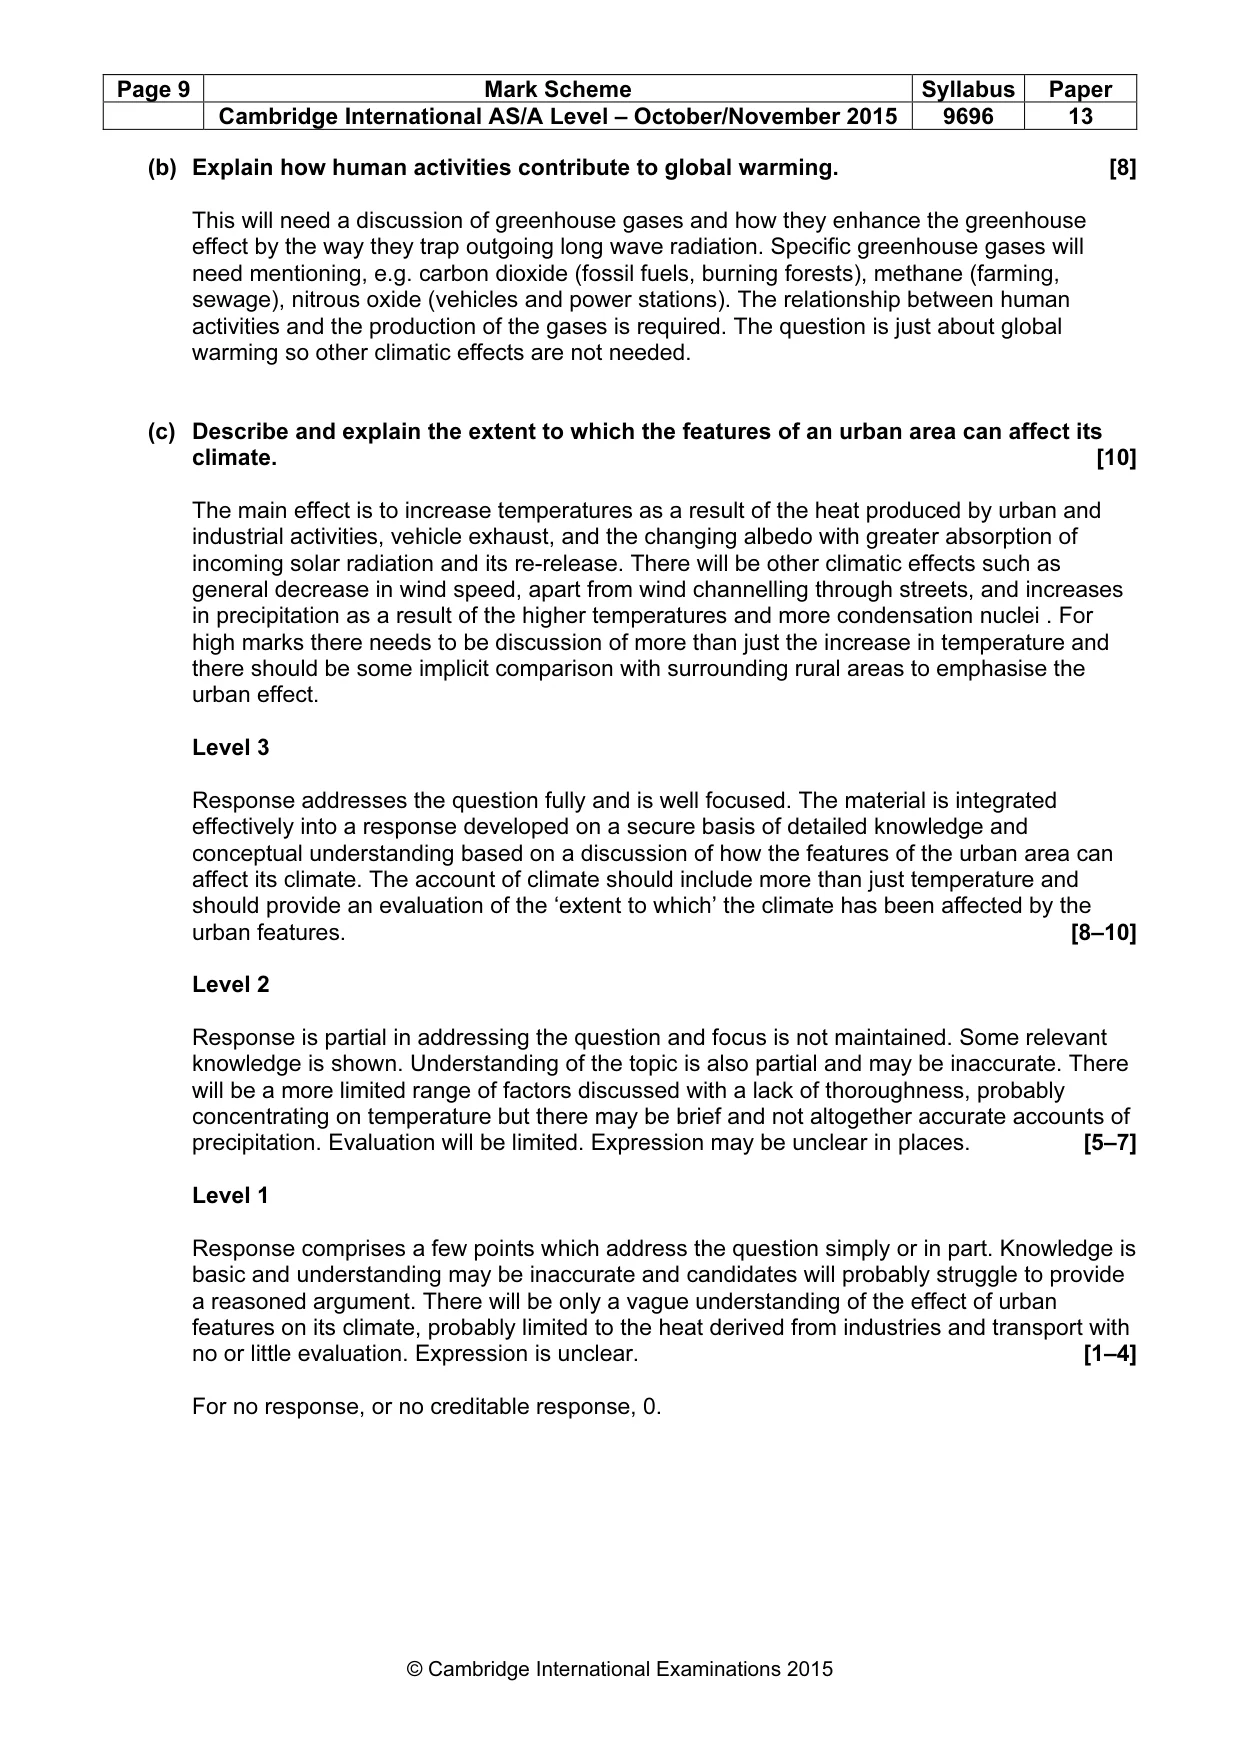
Page 9 Mark Scheme Syllabus Paper Cambridge International AS/A Level – October/November 2015 9696 13 © Cambridge International Examinations 2015 (b) Explain how human activities contribute to global warming. [8] This will need a discussion of greenhouse gases and how they enhance the greenhouse effect by the way they trap outgoing long wave radiation. Specific greenhouse gases will need mentioning, e.g. carbon dioxide (fossil fuels, burning forests), methane (farming, sewage), nitrous oxide (vehicles and power stations). The relationship between human activities and the production of the gases is required. The question is just about global warming so other climatic effects are not needed. (c) Describe and explain the extent to which the features of an urban area can affect its climate. [10] The main effect is to increase temperatures as a result of the heat produced by urban and industrial activities, vehicle exhaust, and the changing albedo with greater absorption of incoming solar radiation and its re-release. There will be other climatic effects such as general decrease in wind speed, apart from wind channelling through streets, and increases in precipitation as a result of the higher temperatures and more condensation nuclei . For high marks there needs to be discussion of more than just the increase in temperature and there should be some implicit comparison with surrounding rural areas to emphasise the urban effect. Level 3 Response addresses the question fully and is well focused. The material is integrated effectively into a response developed on a secure basis of detailed knowledge and conceptual understanding based on a discussion of how the features of the urban area can affect its climate. The account of climate should include more than just temperature and should provide an evaluation of the ‘extent to which’ the climate has been affected by the urban features. [8–10] Level 2 Response is partial in addressing the question and focus is not maintained. Some relevant knowledge is shown. Understanding of the topic is also partial and may be inaccurate. There will be a more limited range of factors discussed with a lack of thoroughness, probably concentrating on temperature but there may be brief and not altogether accurate accounts of precipitation. Evaluation will be limited. Expression may be unclear in places. [5–7] Level 1 Response comprises a few points which address the question simply or in part. Knowledge is basic and understanding may be inaccurate and candidates will probably struggle to provide a reasoned argument. There will be only a vague understanding of the effect of urban features on its climate, probably limited to the heat derived from industries and transport with no or little evaluation. Expression is unclear. [1–4] For no response, or no creditable response, 0.
Mark scheme, page 10
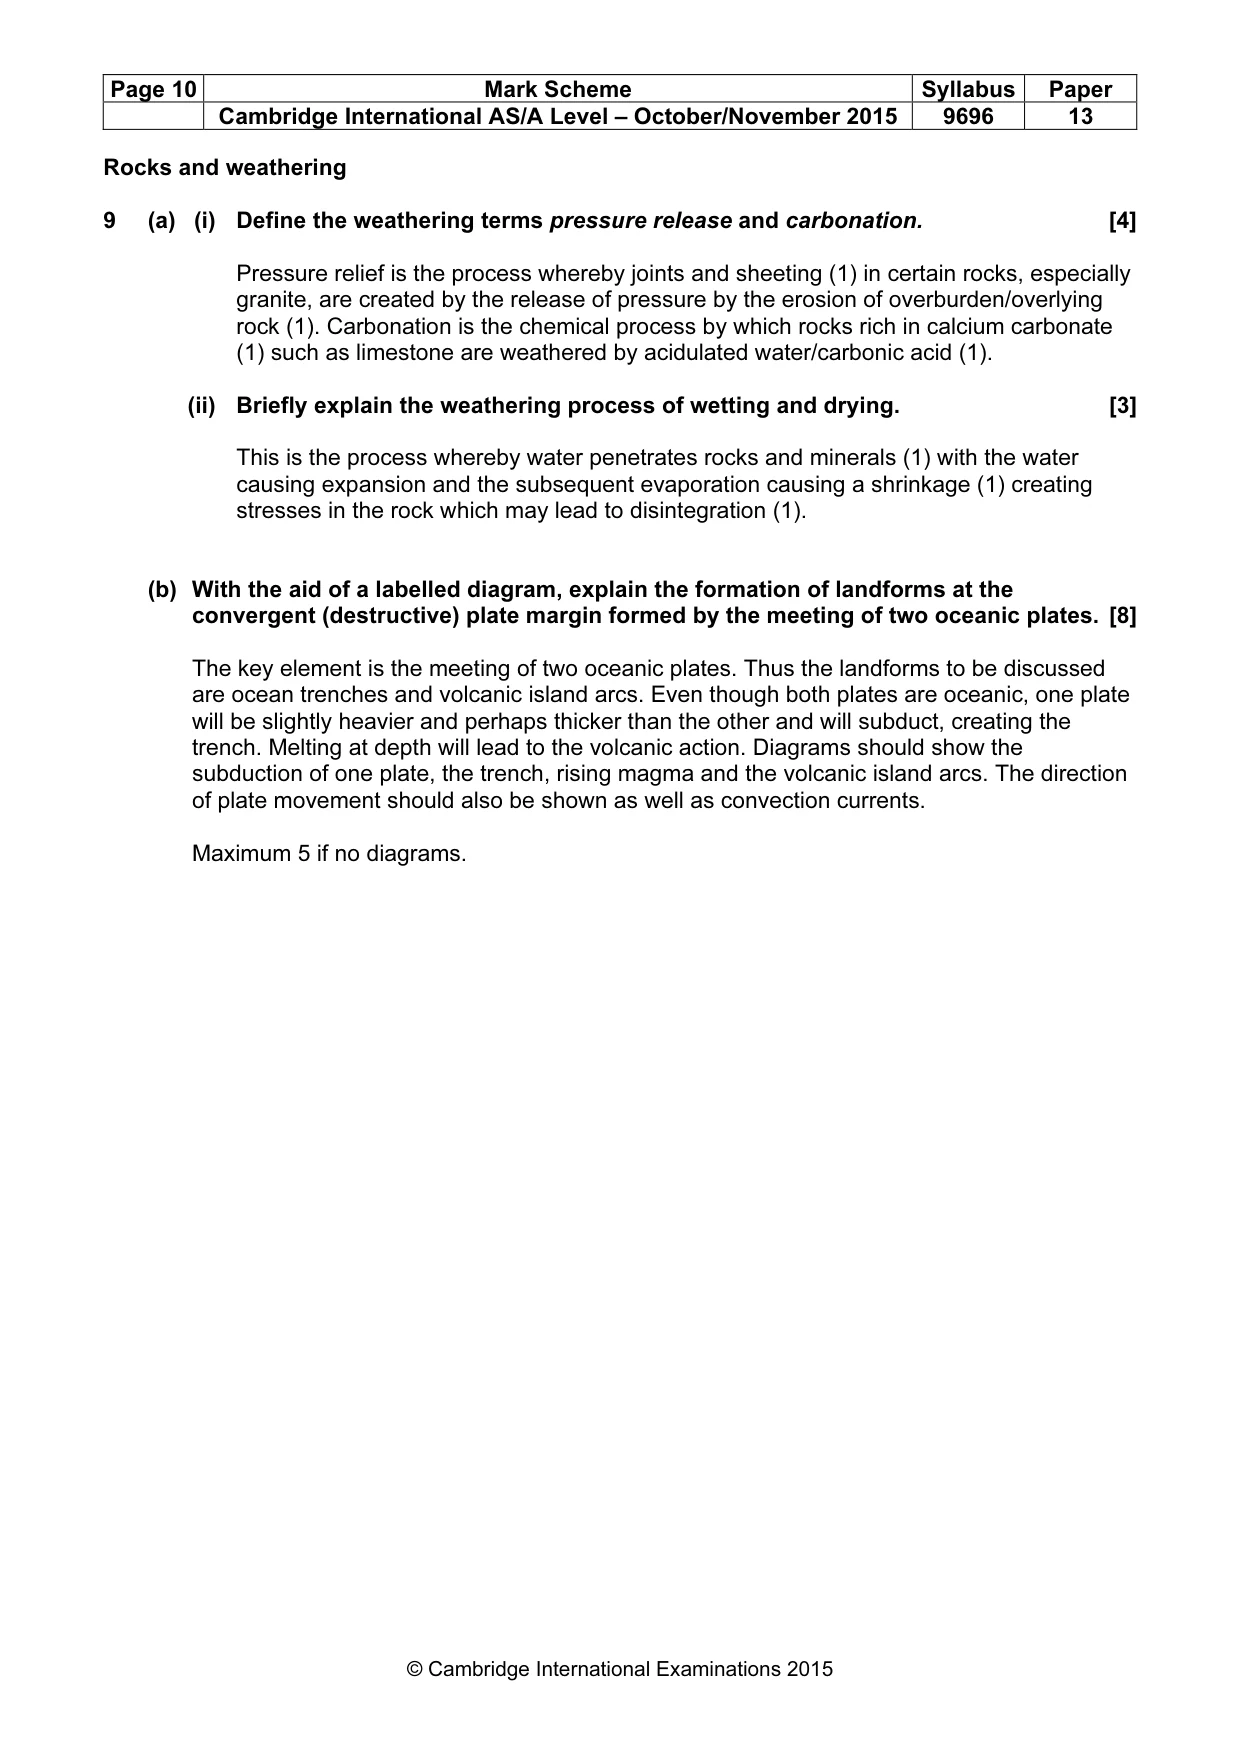
Page 10 Mark Scheme Syllabus Paper Cambridge International AS/A Level – October/November 2015 9696 13 © Cambridge International Examinations 2015 Rocks and weathering 9 (a) (i) Define the weathering terms pressure release and carbonation. [4] Pressure relief is the process whereby joints and sheeting (1) in certain rocks, especially granite, are created by the release of pressure by the erosion of overburden/overlying rock (1). Carbonation is the chemical process by which rocks rich in calcium carbonate (1) such as limestone are weathered by acidulated water/carbonic acid (1). (ii) Briefly explain the weathering process of wetting and drying. [3] This is the process whereby water penetrates rocks and minerals (1) with the water causing expansion and the subsequent evaporation causing a shrinkage (1) creating stresses in the rock which may lead to disintegration (1). (b) With the aid of a labelled diagram, explain the formation of landforms at the convergent (destructive) plate margin formed by the meeting of two oceanic plates. [8] The key element is the meeting of two oceanic plates. Thus the landforms to be discussed are ocean trenches and volcanic island arcs. Even though both plates are oceanic, one plate will be slightly heavier and perhaps thicker than the other and will subduct, creating the trench. Melting at depth will lead to the volcanic action. Diagrams should show the subduction of one plate, the trench, rising magma and the volcanic island arcs. The direction of plate movement should also be shown as well as convection currents. Maximum 5 if no diagrams.
Mark scheme, page 11
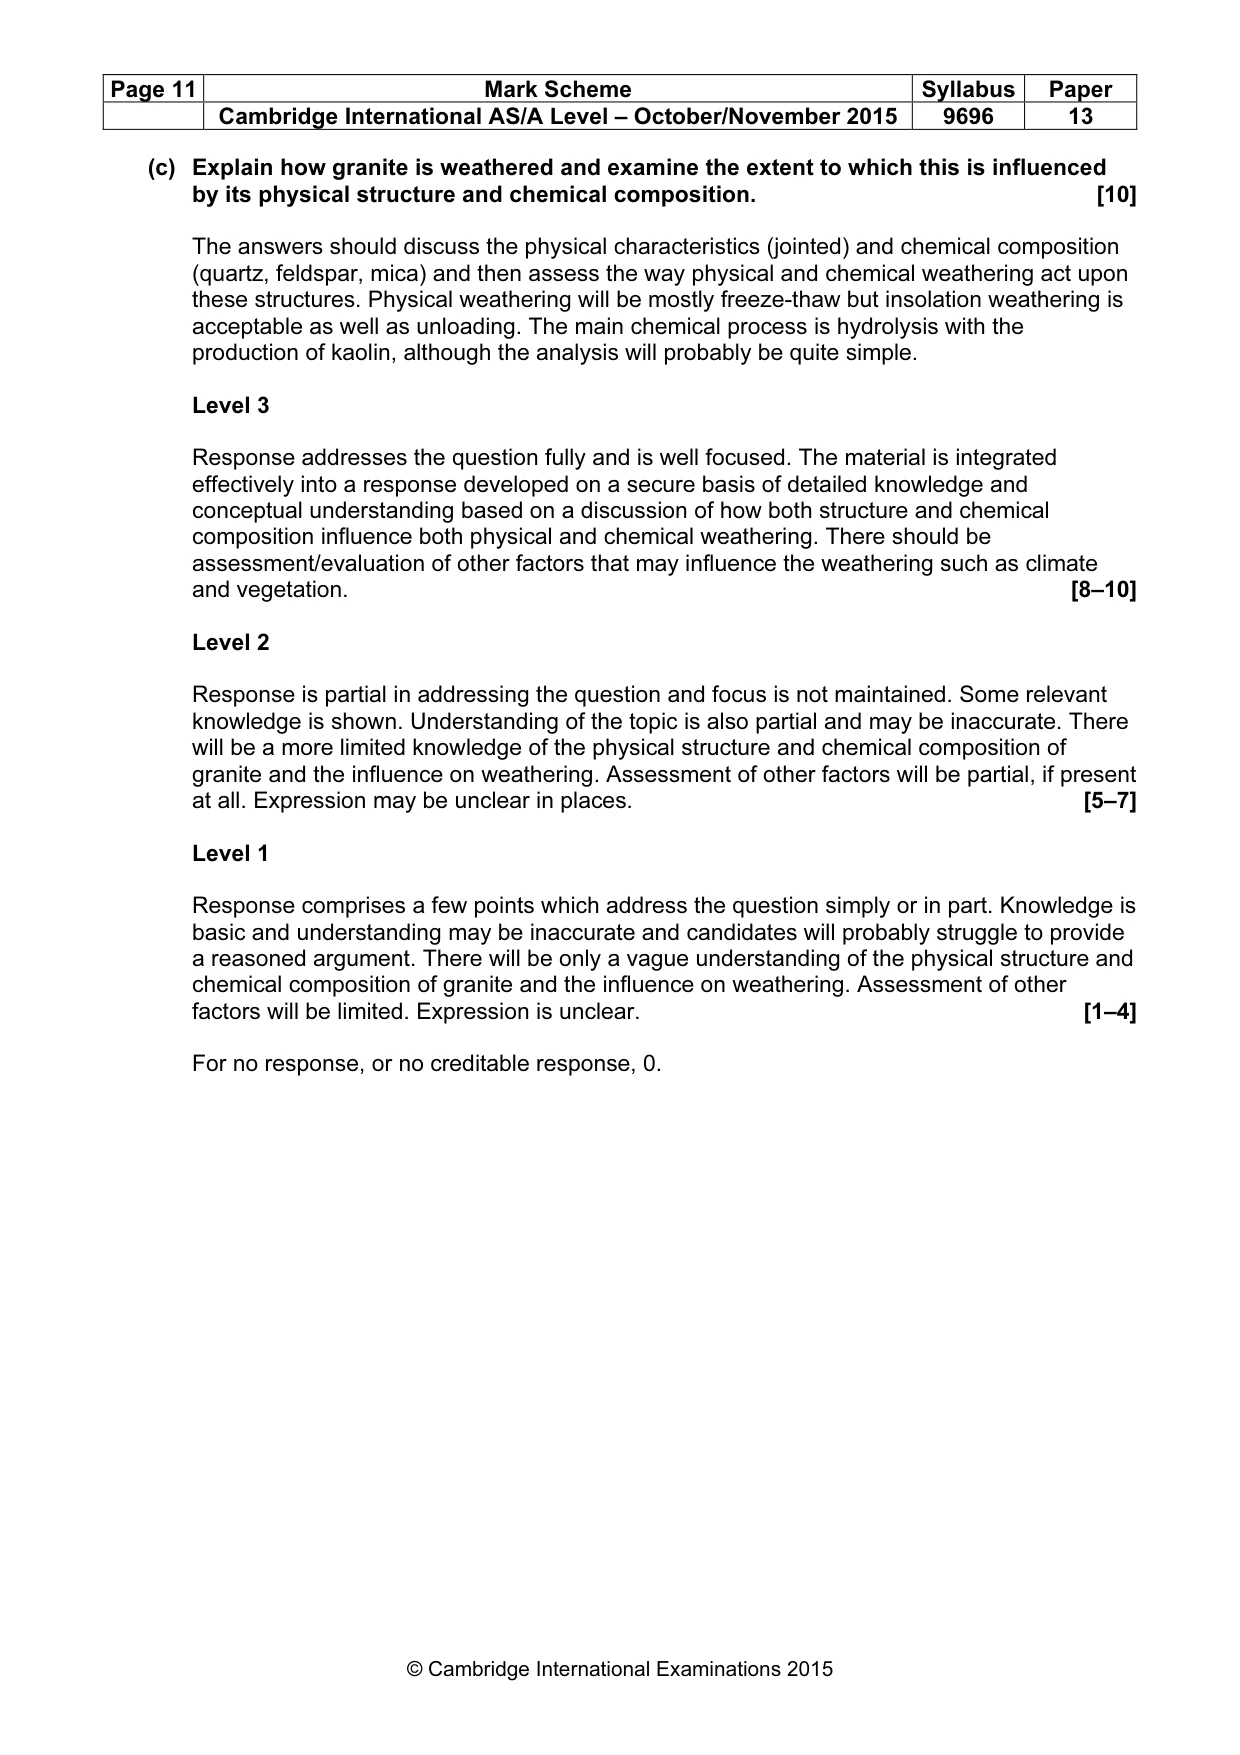
Page 11 Mark Scheme Syllabus Paper Cambridge International AS/A Level – October/November 2015 9696 13 © Cambridge International Examinations 2015 (c) Explain how granite is weathered and examine the extent to which this is influenced by its physical structure and chemical composition. [10] The answers should discuss the physical characteristics (jointed) and chemical composition (quartz, feldspar, mica) and then assess the way physical and chemical weathering act upon these structures. Physical weathering will be mostly freeze-thaw but insolation weathering is acceptable as well as unloading. The main chemical process is hydrolysis with the production of kaolin, although the analysis will probably be quite simple. Level 3 Response addresses the question fully and is well focused. The material is integrated effectively into a response developed on a secure basis of detailed knowledge and conceptual understanding based on a discussion of how both structure and chemical composition influence both physical and chemical weathering. There should be assessment/evaluation of other factors that may influence the weathering such as climate and vegetation. [8–10] Level 2 Response is partial in addressing the question and focus is not maintained. Some relevant knowledge is shown. Understanding of the topic is also partial and may be inaccurate. There will be a more limited knowledge of the physical structure and chemical composition of granite and the influence on weathering. Assessment of other factors will be partial, if present at all. Expression may be unclear in places. [5–7] Level 1 Response comprises a few points which address the question simply or in part. Knowledge is basic and understanding may be inaccurate and candidates will probably struggle to provide a reasoned argument. There will be only a vague understanding of the physical structure and chemical composition of granite and the influence on weathering. Assessment of other factors will be limited. Expression is unclear. [1–4] For no response, or no creditable response, 0.
Mark scheme, page 12
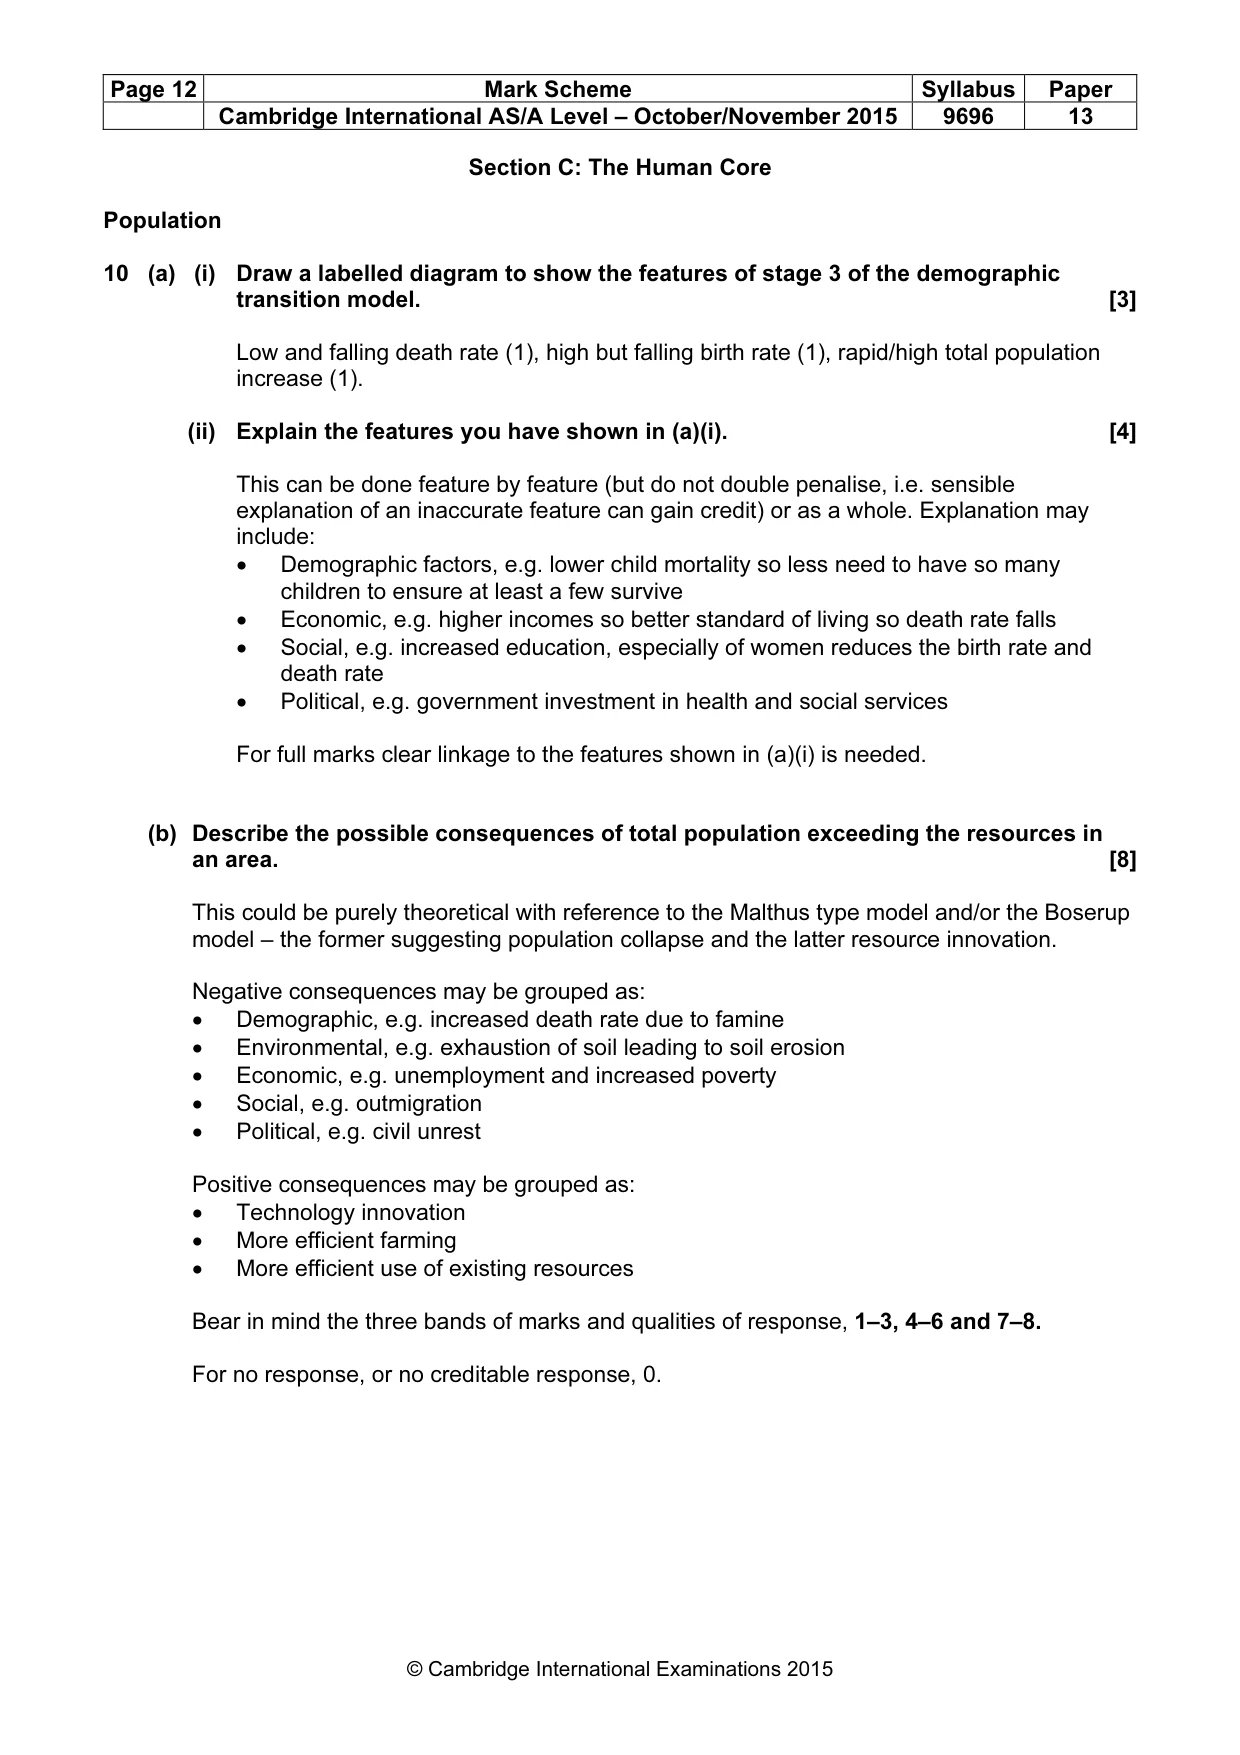
Page 12 Mark Scheme Syllabus Paper Cambridge International AS/A Level – October/November 2015 9696 13 © Cambridge International Examinations 2015 Section C: The Human Core Population 10 (a) (i) Draw a labelled diagram to show the features of stage 3 of the demographic transition model. [3] Low and falling death rate (1), high but falling birth rate (1), rapid/high total population increase (1). (ii) Explain the features you have shown in (a)(i). [4] This can be done feature by feature (but do not double penalise, i.e. sensible explanation of an inaccurate feature can gain credit) or as a whole. Explanation may include: • Demographic factors, e.g. lower child mortality so less need to have so many children to ensure at least a few survive • Economic, e.g. higher incomes so better standard of living so death rate falls • Social, e.g. increased education, especially of women reduces the birth rate and death rate • Political, e.g. government investment in health and social services For full marks clear linkage to the features shown in (a)(i) is needed. (b) Describe the possible consequences of total population exceeding the resources in an area. [8] This could be purely theoretical with reference to the Malthus type model and/or the Boserup model – the former suggesting population collapse and the latter resource innovation. Negative consequences may be grouped as: • Demographic, e.g. increased death rate due to famine • Environmental, e.g. exhaustion of soil leading to soil erosion • Economic, e.g. unemployment and increased poverty • Social, e.g. outmigration • Political, e.g. civil unrest Positive consequences may be grouped as: • Technology innovation • More efficient farming • More efficient use of existing resources Bear in mind the three bands of marks and qualities of response, 1–3, 4–6 and 7–8. For no response, or no creditable response, 0.
Mark scheme, page 13
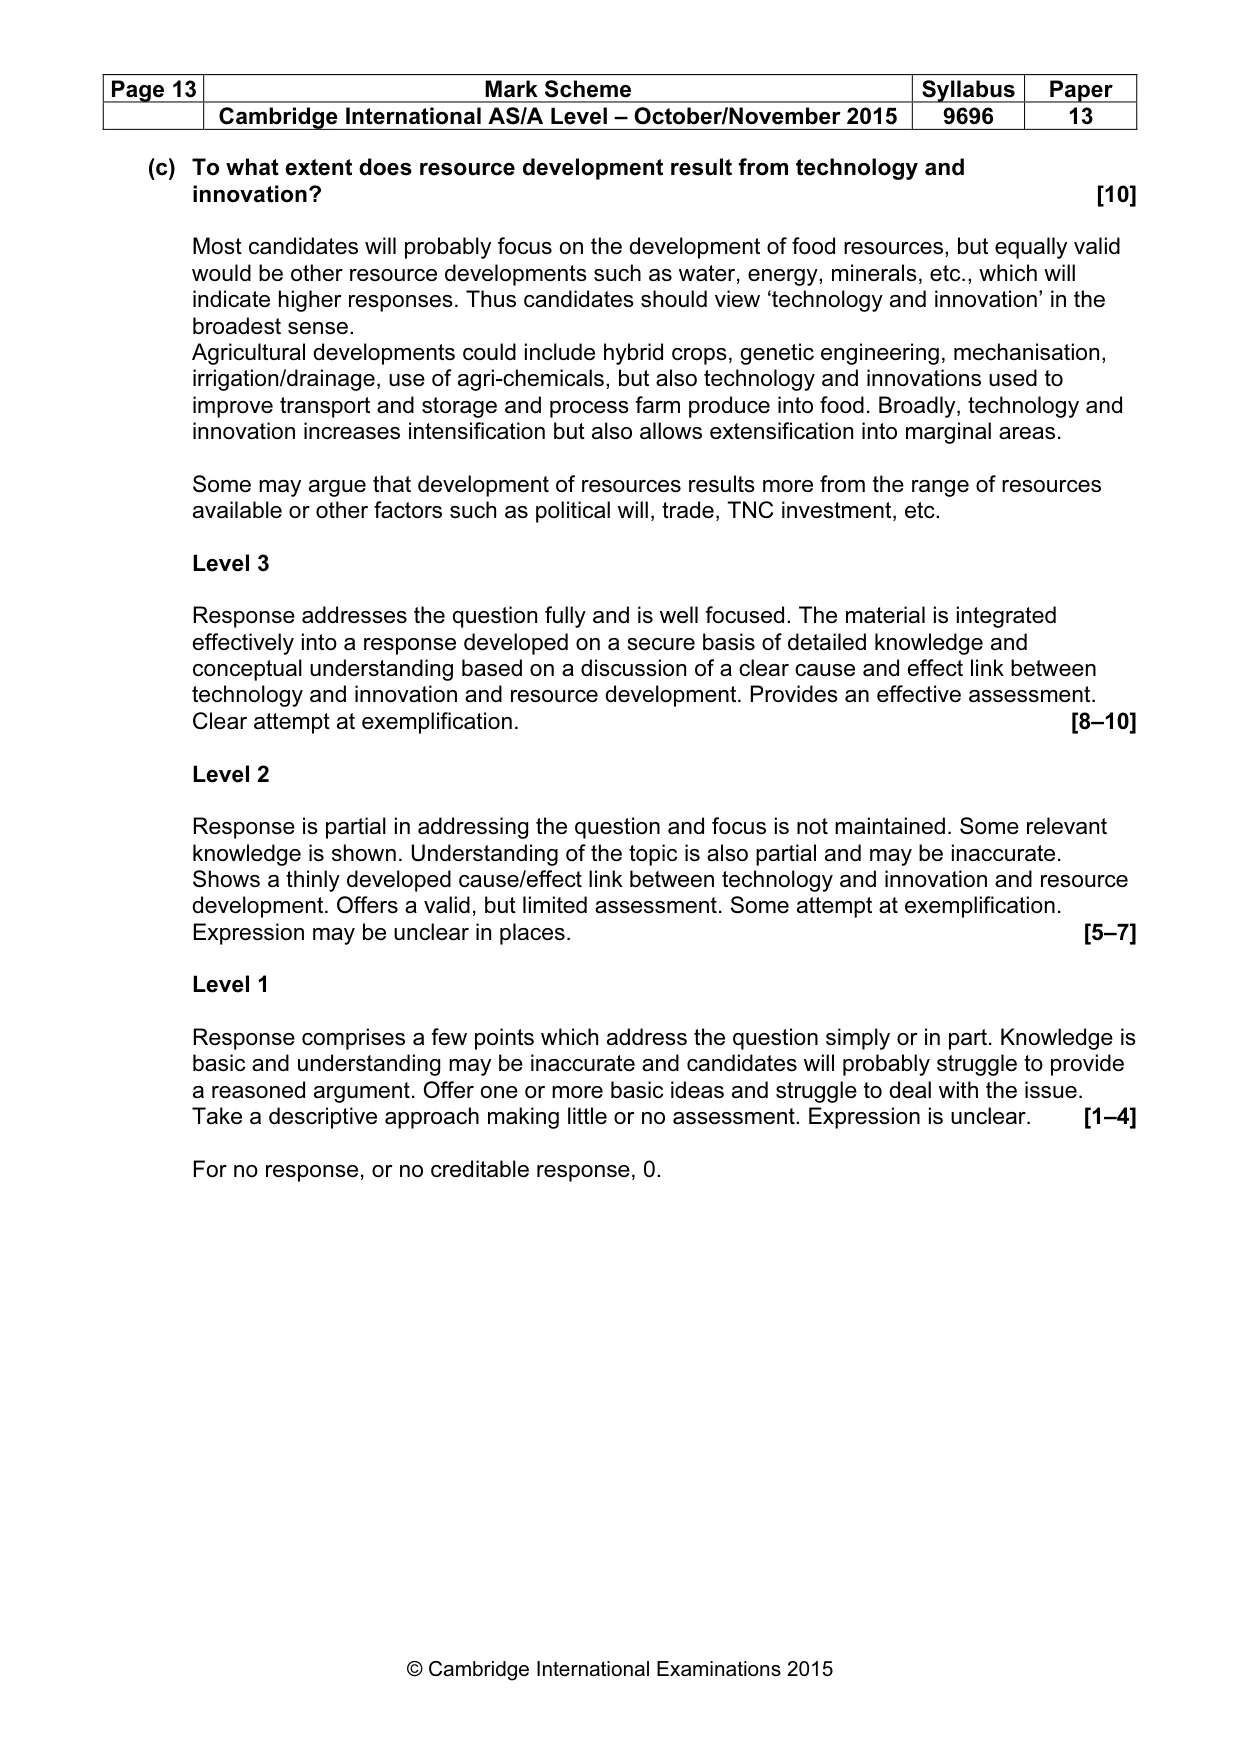
Page 13 Mark Scheme Syllabus Paper Cambridge International AS/A Level – October/November 2015 9696 13 © Cambridge International Examinations 2015 (c) To what extent does resource development result from technology and innovation? [10] Most candidates will probably focus on the development of food resources, but equally valid would be other resource developments such as water, energy, minerals, etc., which will indicate higher responses. Thus candidates should view ‘technology and innovation’ in the broadest sense. Agricultural developments could include hybrid crops, genetic engineering, mechanisation, irrigation/drainage, use of agri-chemicals, but also technology and innovations used to improve transport and storage and process farm produce into food. Broadly, technology and innovation increases intensification but also allows extensification into marginal areas. Some may argue that development of resources results more from the range of resources available or other factors such as political will, trade, TNC investment, etc. Level 3 Response addresses the question fully and is well focused. The material is integrated effectively into a response developed on a secure basis of detailed knowledge and conceptual understanding based on a discussion of a clear cause and effect link between technology and innovation and resource development. Provides an effective assessment. Clear attempt at exemplification. [8–10] Level 2 Response is partial in addressing the question and focus is not maintained. Some relevant knowledge is shown. Understanding of the topic is also partial and may be inaccurate. Shows a thinly developed cause/effect link between technology and innovation and resource development. Offers a valid, but limited assessment. Some attempt at exemplification. Expression may be unclear in places. [5–7] Level 1 Response comprises a few points which address the question simply or in part. Knowledge is basic and understanding may be inaccurate and candidates will probably struggle to provide a reasoned argument. Offer one or more basic ideas and struggle to deal with the issue. Take a descriptive approach making little or no assessment. Expression is unclear. [1–4] For no response, or no creditable response, 0.
Mark scheme, page 14
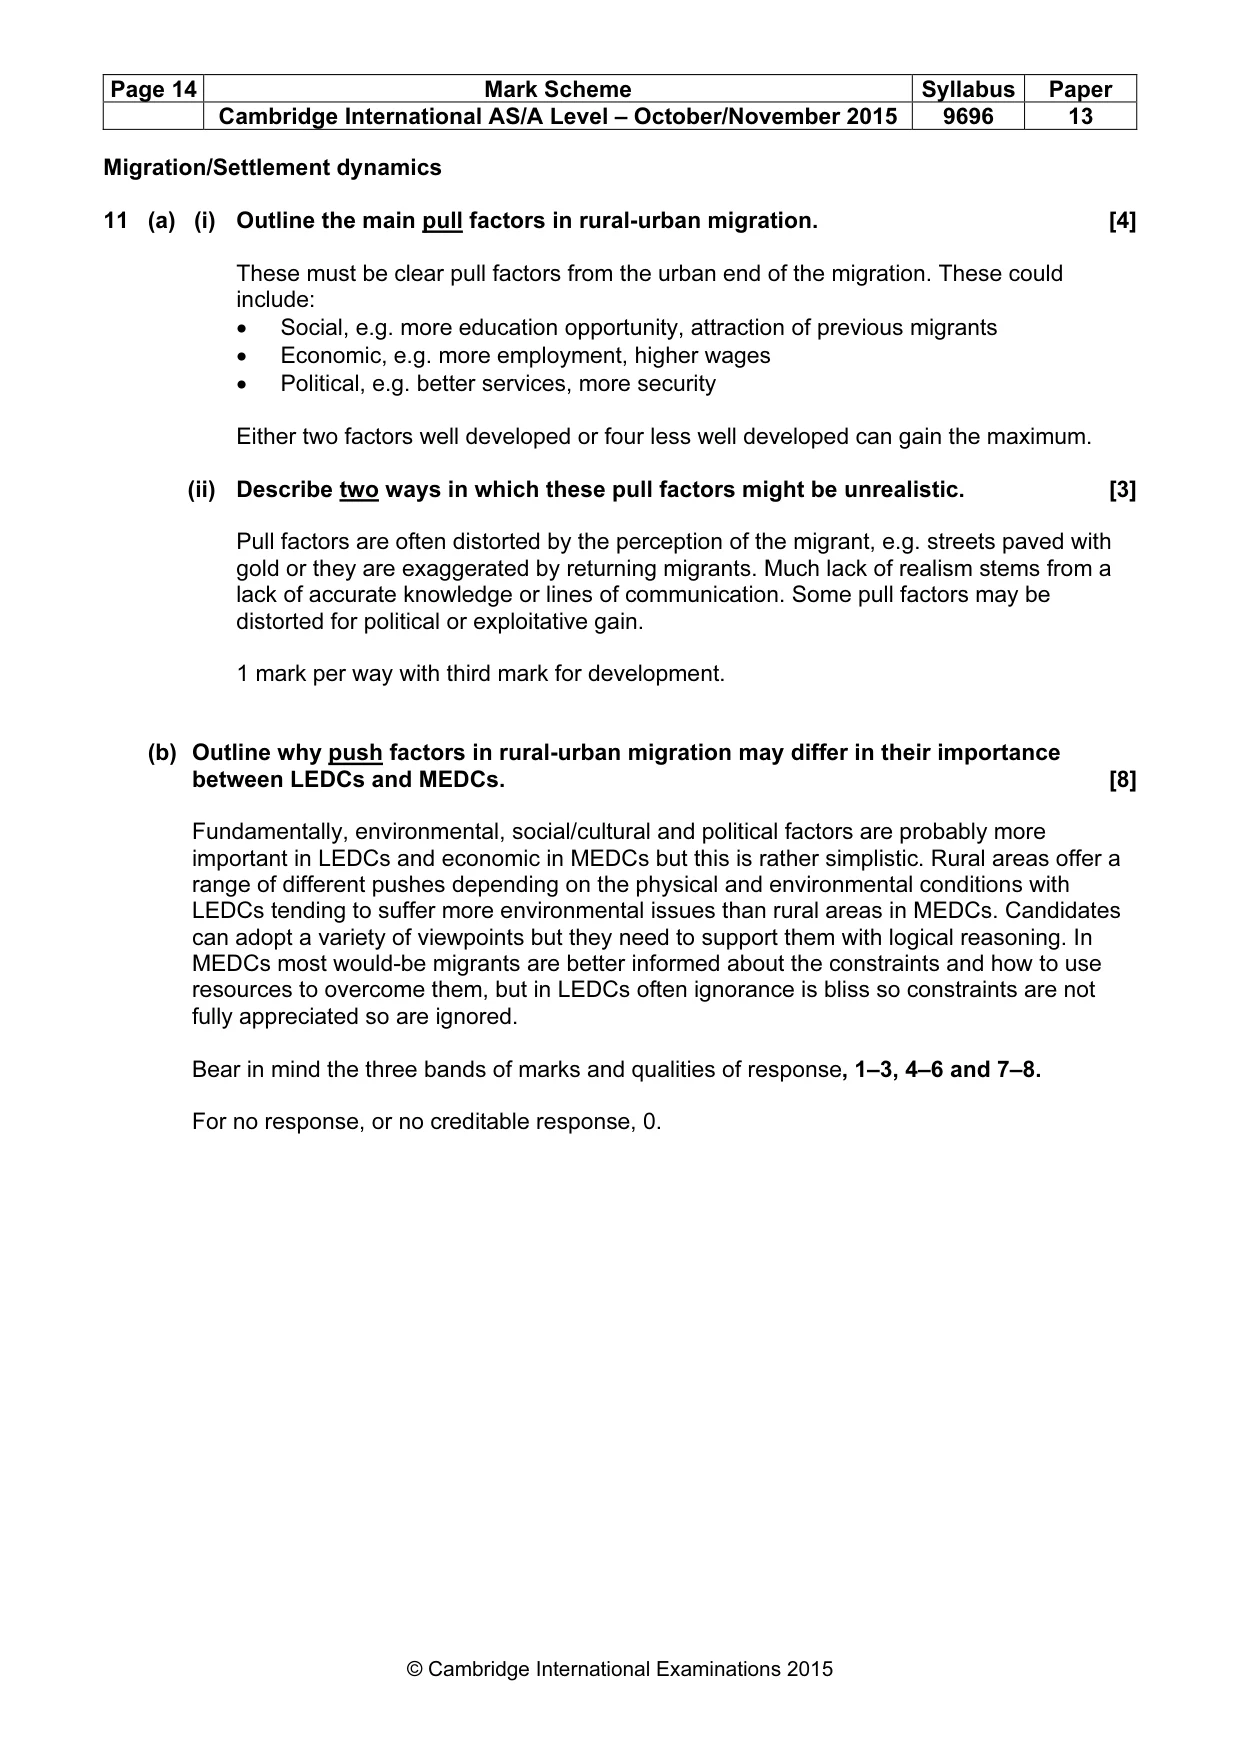
Page 14 Mark Scheme Syllabus Paper Cambridge International AS/A Level – October/November 2015 9696 13 © Cambridge International Examinations 2015 Migration/Settlement dynamics 11 (a) (i) Outline the main pull factors in rural-urban migration. [4] These must be clear pull factors from the urban end of the migration. These could include: • Social, e.g. more education opportunity, attraction of previous migrants • Economic, e.g. more employment, higher wages • Political, e.g. better services, more security Either two factors well developed or four less well developed can gain the maximum. (ii) Describe two ways in which these pull factors might be unrealistic. [3] Pull factors are often distorted by the perception of the migrant, e.g. streets paved with gold or they are exaggerated by returning migrants. Much lack of realism stems from a lack of accurate knowledge or lines of communication. Some pull factors may be distorted for political or exploitative gain. 1 mark per way with third mark for development. (b) Outline why push factors in rural-urban migration may differ in their importance between LEDCs and MEDCs. [8] Fundamentally, environmental, social/cultural and political factors are probably more important in LEDCs and economic in MEDCs but this is rather simplistic. Rural areas offer a range of different pushes depending on the physical and environmental conditions with LEDCs tending to suffer more environmental issues than rural areas in MEDCs. Candidates can adopt a variety of viewpoints but they need to support them with logical reasoning. In MEDCs most would-be migrants are better informed about the constraints and how to use resources to overcome them, but in LEDCs often ignorance is bliss so constraints are not fully appreciated so are ignored. Bear in mind the three bands of marks and qualities of response, 1–3, 4–6 and 7–8. For no response, or no creditable response, 0.
Mark scheme, page 15
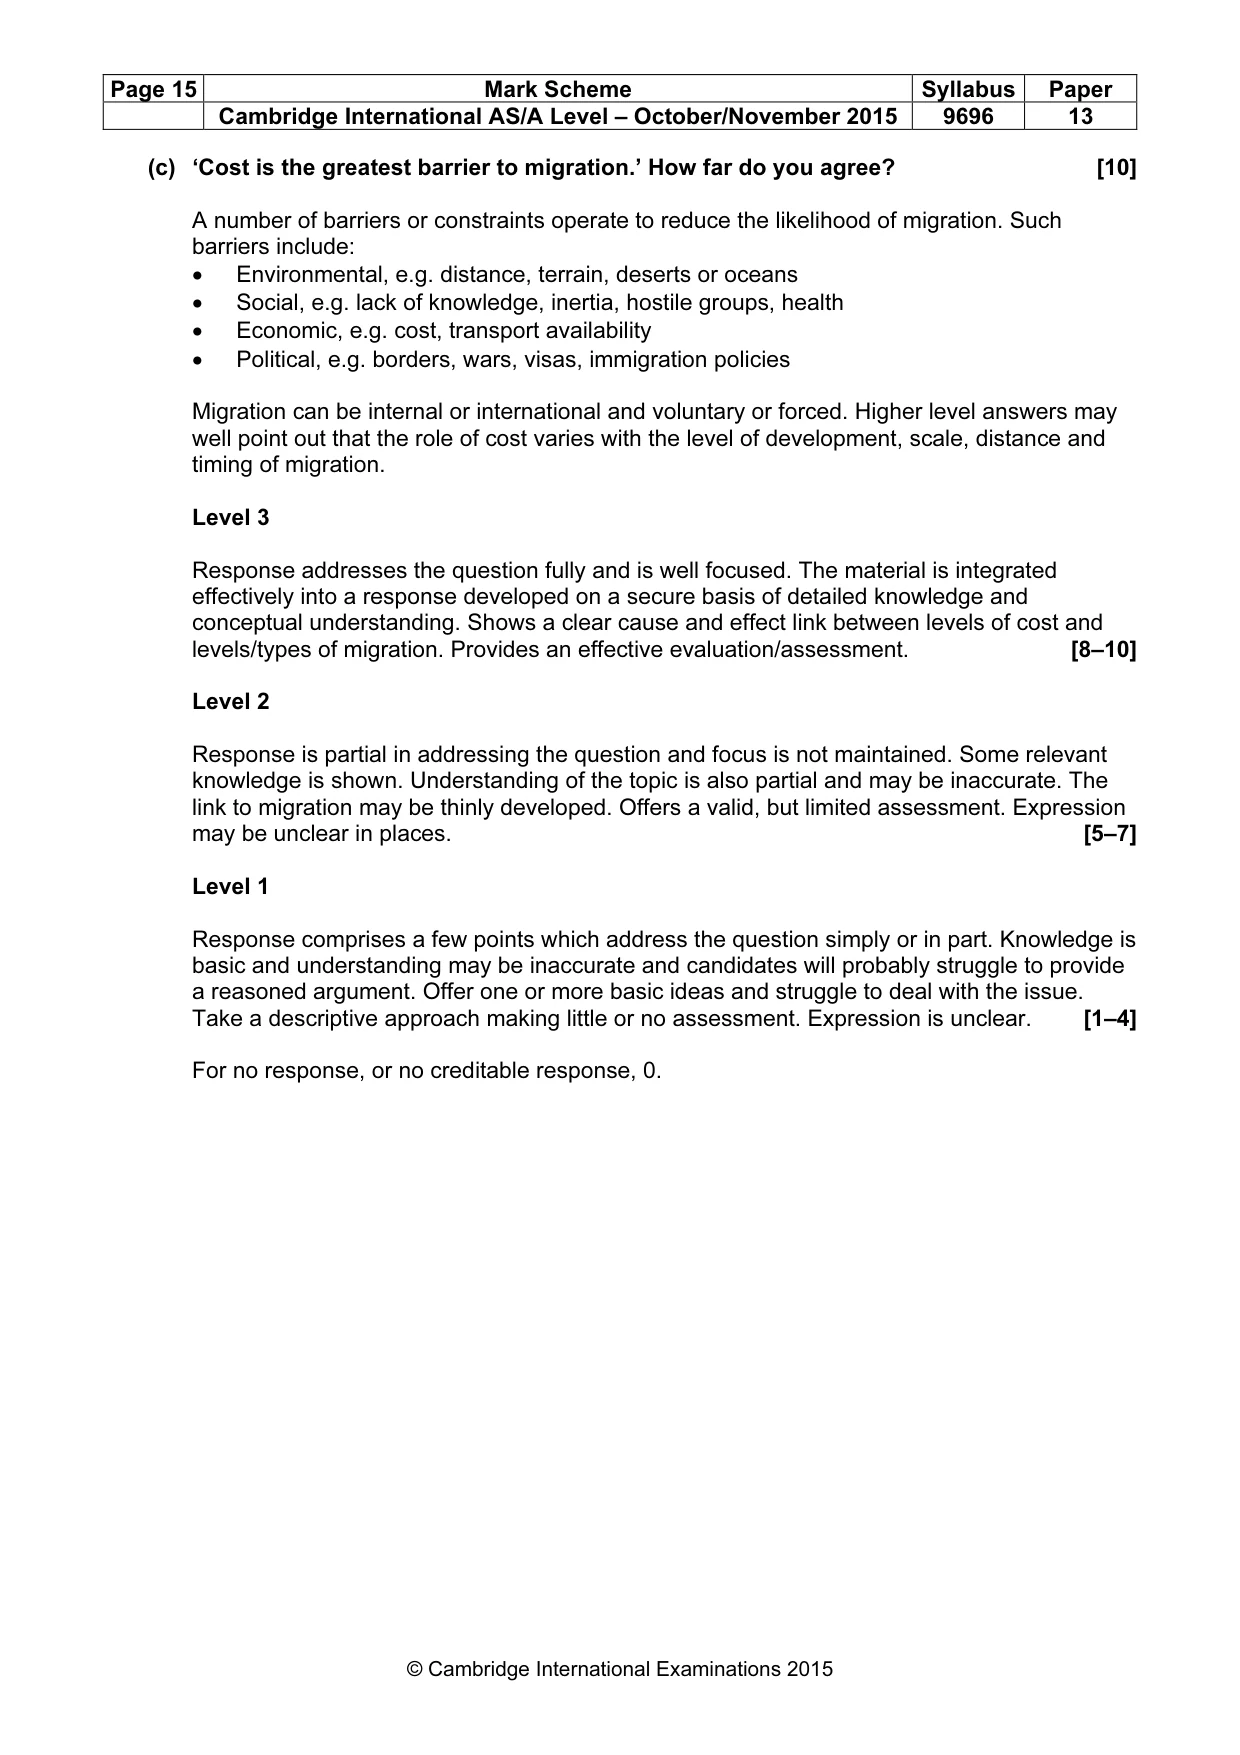
Page 15 Mark Scheme Syllabus Paper Cambridge International AS/A Level – October/November 2015 9696 13 © Cambridge International Examinations 2015 (c) ‘Cost is the greatest barrier to migration.’ How far do you agree? [10] A number of barriers or constraints operate to reduce the likelihood of migration. Such barriers include: • Environmental, e.g. distance, terrain, deserts or oceans • Social, e.g. lack of knowledge, inertia, hostile groups, health • Economic, e.g. cost, transport availability • Political, e.g. borders, wars, visas, immigration policies Migration can be internal or international and voluntary or forced. Higher level answers may well point out that the role of cost varies with the level of development, scale, distance and timing of migration. Level 3 Response addresses the question fully and is well focused. The material is integrated effectively into a response developed on a secure basis of detailed knowledge and conceptual understanding. Shows a clear cause and effect link between levels of cost and levels/types of migration. Provides an effective evaluation/assessment. [8–10] Level 2 Response is partial in addressing the question and focus is not maintained. Some relevant knowledge is shown. Understanding of the topic is also partial and may be inaccurate. The link to migration may be thinly developed. Offers a valid, but limited assessment. Expression may be unclear in places. [5–7] Level 1 Response comprises a few points which address the question simply or in part. Knowledge is basic and understanding may be inaccurate and candidates will probably struggle to provide a reasoned argument. Offer one or more basic ideas and struggle to deal with the issue. Take a descriptive approach making little or no assessment. Expression is unclear. [1–4] For no response, or no creditable response, 0.
Mark scheme, page 16
Page 16 Mark Scheme Syllabus Paper Cambridge International AS/A Level – October/November 2015 9696 13 © Cambridge International Examinations 2015 Settlement dynamics 12 (a) (i) Give the meaning of the term gentrification. [3] This is the process of an area being upgraded (1) by an influx of wealthy groups (1) who improve the quality of the housing and environment (1). Three elements for 3 marks. (ii) Outline two reasons why gentrification occurs in many cities in MEDCs. [4] There are a variety of reasons and these may differ between MEDC cities. In most cases it reflects a movement inwards of wealthy groups, which could be the result of pushes from the suburbs but are more likely to be pulls from the inner areas of larger houses which can be improved, higher property prices, nearness to work in the CBD, better transport, nearness to cultural and entertainment facilities and the attraction of the same social groups such as lawyers or artists, attractive water fronts and park locations. 1 mark per reason – 2 marks per developed (and well related to gentrification) reason. (b) Explain why the provision of services is changing in rural areas. [8] Services may be seen in a variety of ways including retailing, education, tourism, etc. and ‘changing’ covers growth, decline and a shift in the balance between service elements. Candidates should appreciate that this is a demand v supply issue. Demand is ever changing due to population change, rising standards/expectations and changes in affluence and/or inequality. In MEDCs some remote areas are losing services such as schools and post offices while more accessible areas are gaining services. Many LEDC rural areas are gaining services (albeit from a low base) as development trickles down the hierarchy or outward from the main cities. Bear in mind the three bands of marks and qualities of response, 1–3, 4–6 and 7–8. For no response, or no creditable response, 0.
Mark scheme, page 17
Page 17 Mark Scheme Syllabus Paper Cambridge International AS/A Level – October/November 2015 9696 13 © Cambridge International Examinations 2015 (c) Evaluate the responses to the issues caused by either rural growth or rural decline. [10] Candidates are required in 3.1 to have studied a case study of a rural settlement or rural area illustrating some of the issues of its growth or decline and an evaluation of the responses to these. Growth/decline may be seen in terms of population, infrastructure, economy, etc. So candidates may look at these responses at a variety of scales or by contrasting LEDCs and MEDCs or by considering responses for each of the physical, economic, social and political issues generated by the growth or decline. Evaluation should focus on the level of success achieved and higher level answers may recognise that this can vary: • Between types of rural areas, e.g. outskirts of a city v remote • Between different groups, e.g. rich v poor • Between differing elements of the economy or infrastructural mix, e.g. transport v energy Level 3 Response addresses the question fully and is well focused. The material is integrated effectively into a response developed on a secure basis of detailed knowledge and conceptual understanding. Provides an effective assessment recognising that the level of success varies, due to a range of reasons, with detailed exemplification. [8–10] Level 2 Response is partial in addressing the question and focus is not maintained. Some relevant knowledge is shown. Understanding of the topic is also partial and may be inaccurate. Offers a valid, but partial assessment based in limited exemplification. Expression may be unclear in places. [5–7] Level 1 Response comprises a few points which address the question simply or in part. Knowledge is basic and understanding may be inaccurate and candidates will probably struggle to provide a reasoned argument. Take a descriptive approach making little or no assessment and possibly very limited or no exemplification. Expression is unclear. [1–4] For no response, or no creditable response, 0.
What you needed in this session
Cambridge’s own grade thresholds for 2015 Oct/Nov, Paper 1 · Variant 3. A higher threshold means an easier paper — the bar moves with how the cohort did.