Cambridge A Level Geography 9696 — 2015 Oct/Nov Paper 1 · Variant 1
9696/11/O/N/15 · 100 marks · ≈113 min
The question paper and its mark scheme, free to read here and free to download. This is Cambridge’s own paper, exactly as it was sat.
Question paper8 pages



Mark scheme14 pages
Answers below. Sit the paper first if you are practising.
Paper as text
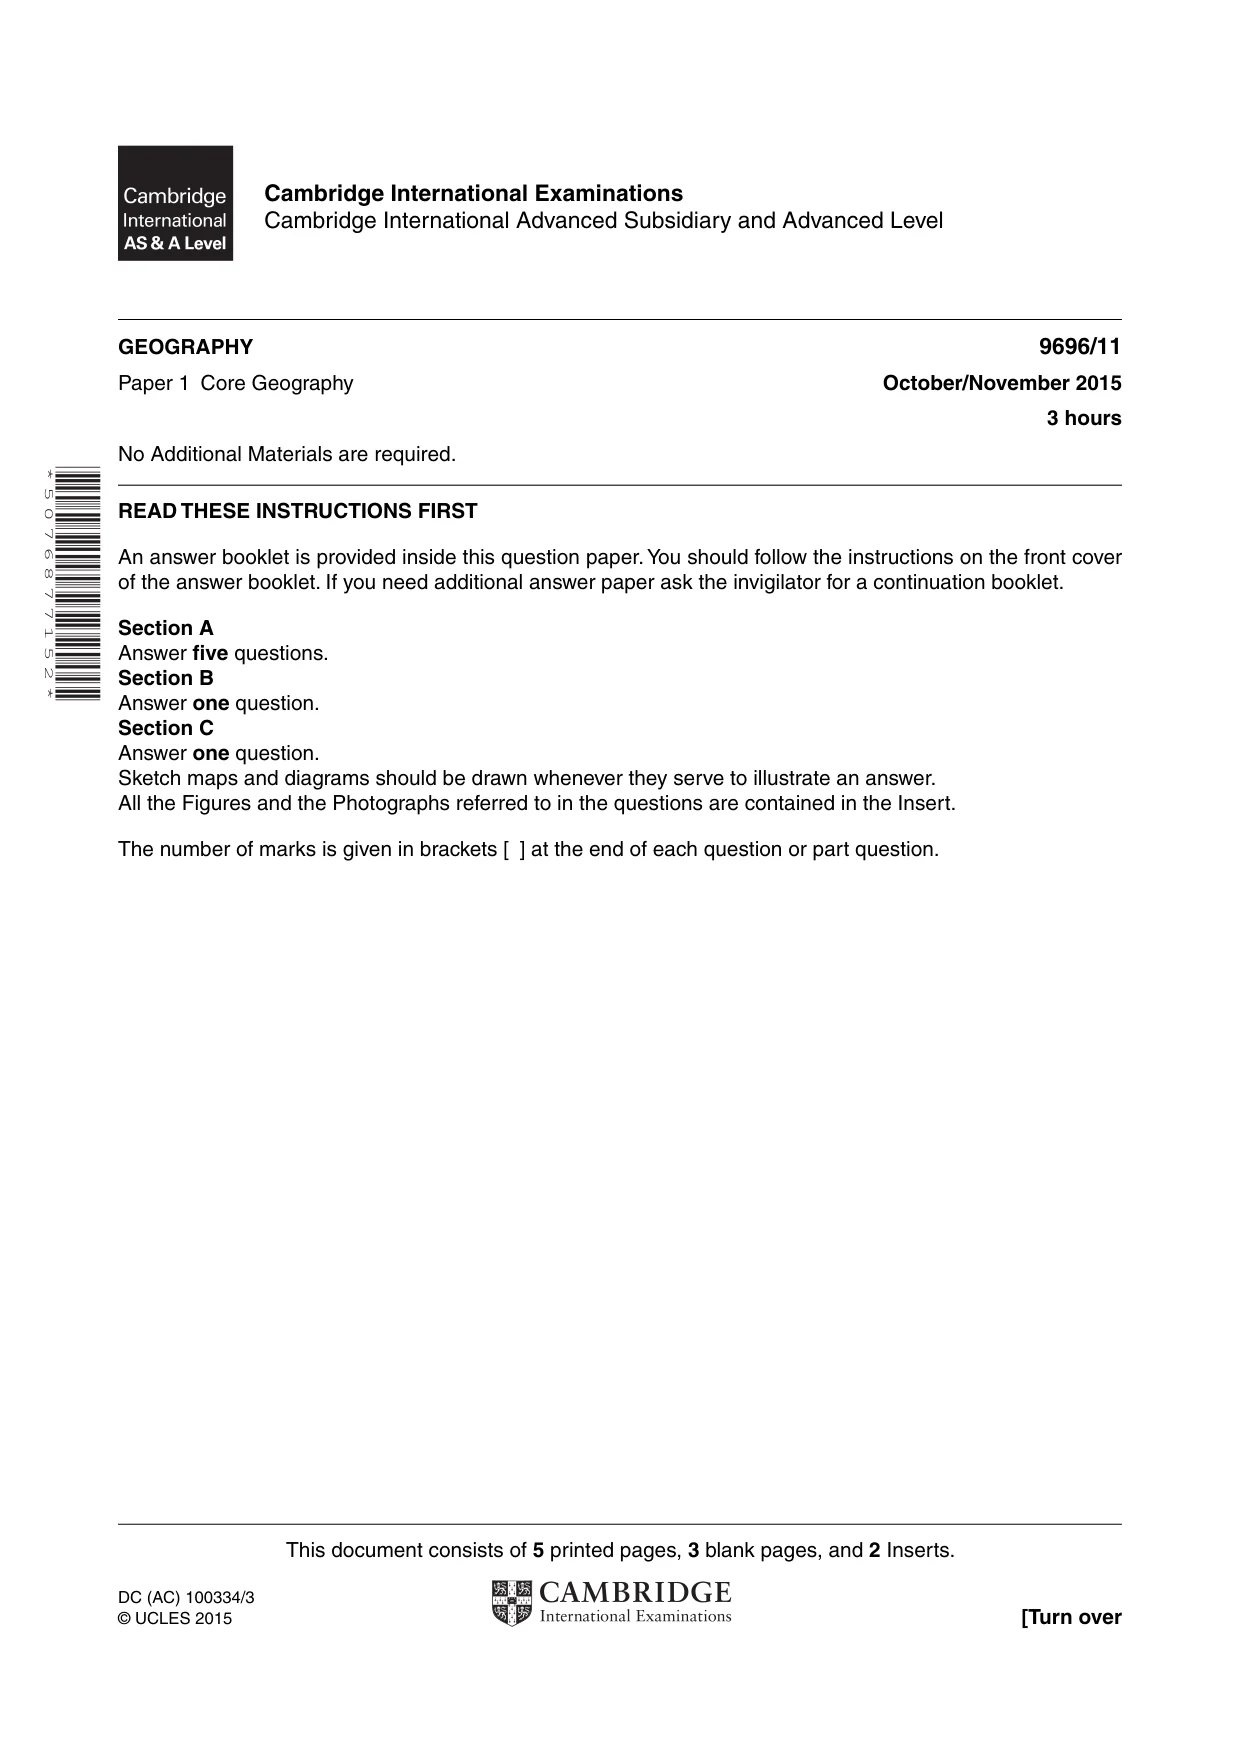
Question paper, page 1
This document consists of 5 printed pages, 3 blank pages, and 2 Inserts. DC (AC) 100334/3 © UCLES 2015 [Turn over Cambridge International Examinations Cambridge International Advanced Subsidiary and Advanced Level * 5 0 7 6 8 7 7 1 5 2 * GEOGRAPHY 9696/11 Paper 1 Core Geography October/November 2015 3 hours No Additional Materials are required. READ THESE INSTRUCTIONS FIRST An answer booklet is provided inside this question paper. You should follow the instructions on the front cover of the answer booklet. If you need additional answer paper ask the invigilator for a continuation booklet. Section A Answer five questions. Section B Answer one question. Section C Answer one question. Sketch maps and diagrams should be drawn whenever they serve to illustrate an answer. All the Figures and the Photographs referred to in the questions are contained in the Insert. The number of marks is given in brackets [ ] at the end of each question or part question.
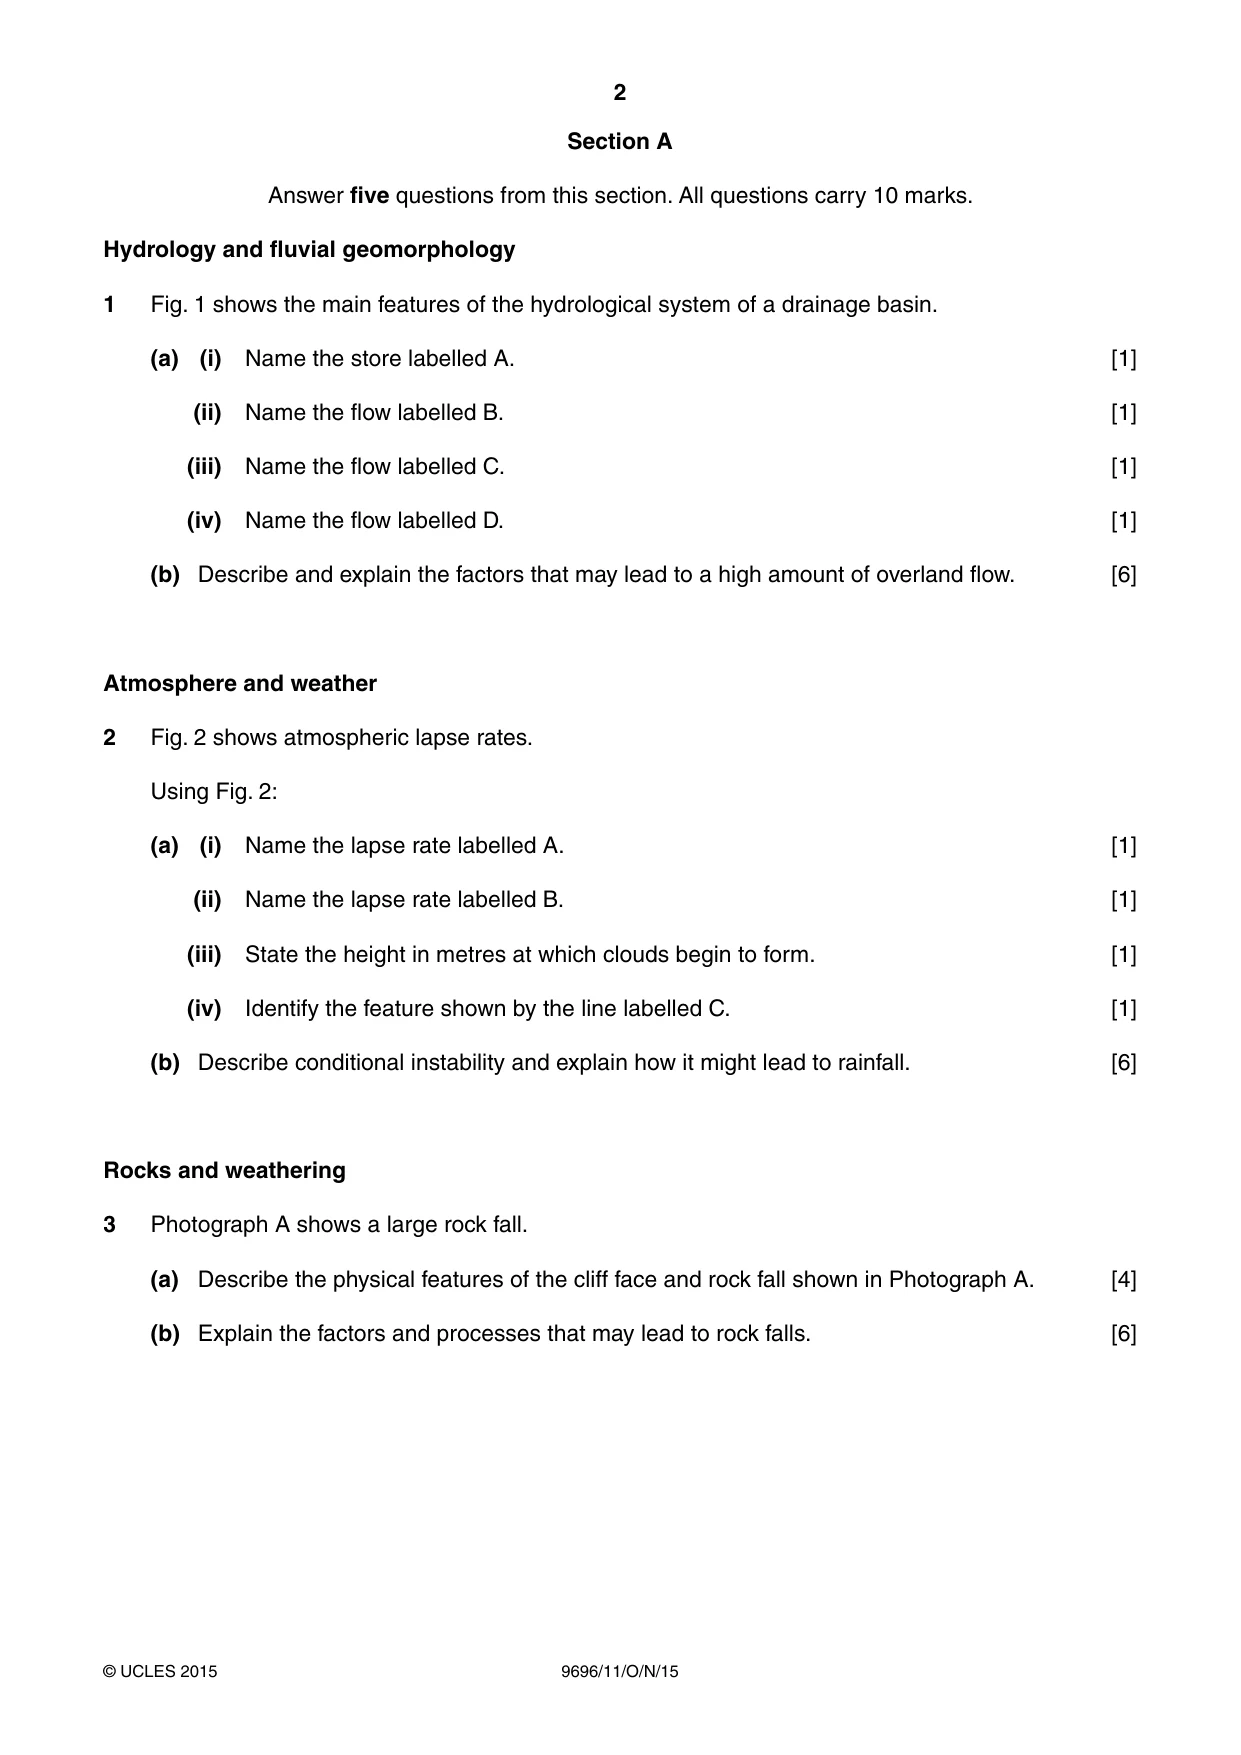
Question paper, page 2
2 9696/11/O/N/15 © UCLES 2015 Section A Answer five questions from this section. All questions carry 10 marks. Hydrology and fluvial geomorphology 1 Fig. 1 shows the main features of the hydrological system of a drainage basin. (a) (i) Name the store labelled A. [1] (ii) Name the flow labelled B. [1] (iii) Name the flow labelled C. [1] (iv) Name the flow labelled D. [1] (b) Describe and explain the factors that may lead to a high amount of overland flow. [6] Atmosphere and weather 2 Fig. 2 shows atmospheric lapse rates. Using Fig. 2: (a) (i) Name the lapse rate labelled A. [1] (ii) Name the lapse rate labelled B. [1] (iii) State the height in metres at which clouds begin to form. [1] (iv) Identify the feature shown by the line labelled C. [1] (b) Describe conditional instability and explain how it might lead to rainfall. [6] Rocks and weathering 3 Photograph A shows a large rock fall. (a) Describe the physical features of the cliff face and rock fall shown in Photograph A. [4] (b) Explain the factors and processes that may lead to rock falls. [6]
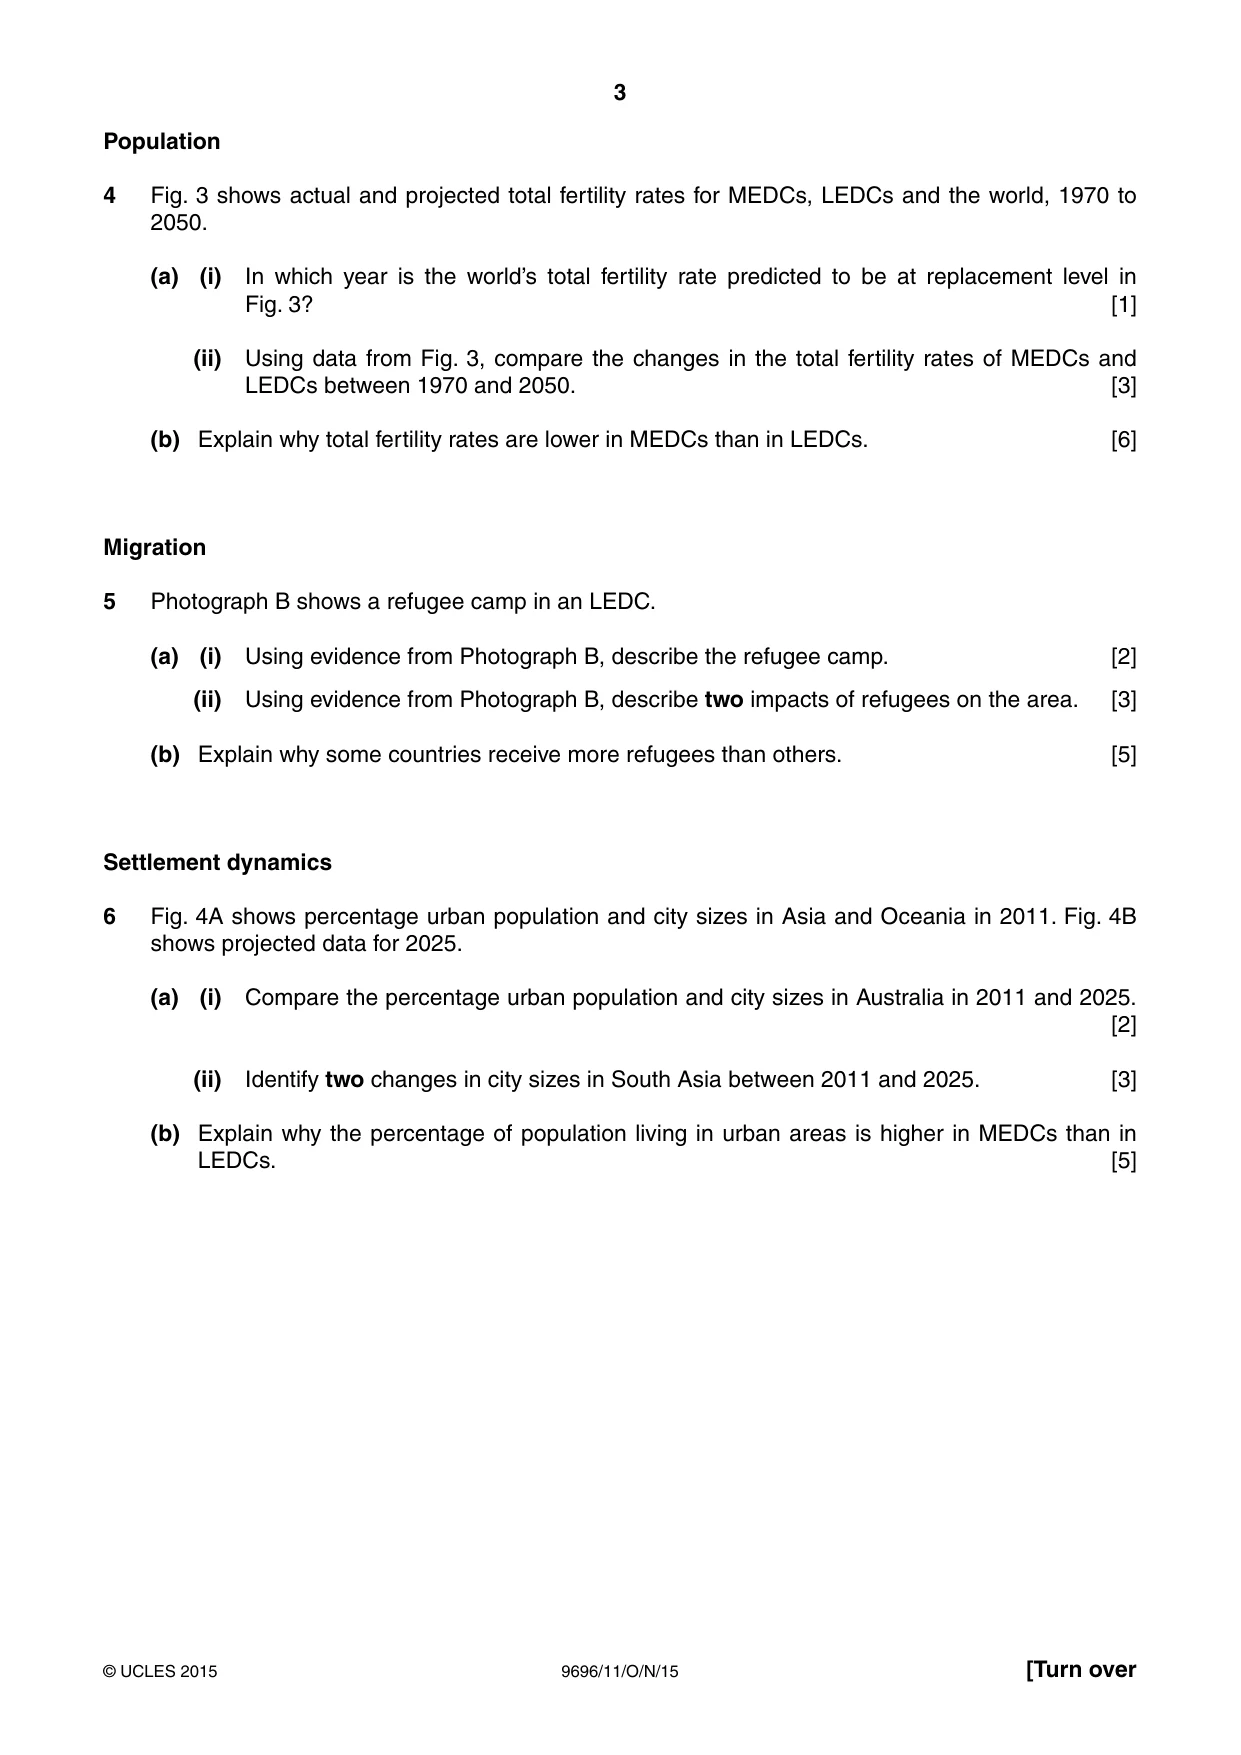
Question paper, page 3
3 9696/11/O/N/15 © UCLES 2015 [Turn over Population 4 Fig. 3 shows actual and projected total fertility rates for MEDCs, LEDCs and the world, 1970 to 2050. (a) (i) In which year is the world’s total fertility rate predicted to be at replacement level in Fig. 3? [1] (ii) Using data from Fig. 3, compare the changes in the total fertility rates of MEDCs and LEDCs between 1970 and 2050. [3] (b) Explain why total fertility rates are lower in MEDCs than in LEDCs. [6] Migration 5 Photograph B shows a refugee camp in an LEDC. (a) (i) Using evidence from Photograph B, describe the refugee camp. [2] (ii) Using evidence from Photograph B, describe two impacts of refugees on the area. [3] (b) Explain why some countries receive more refugees than others. [5] Settlement dynamics 6 Fig. 4A shows percentage urban population and city sizes in Asia and Oceania in 2011. Fig. 4B shows projected data for 2025. (a) (i) Compare the percentage urban population and city sizes in Australia in 2011 and 2025. [2] (ii) Identify two changes in city sizes in South Asia between 2011 and 2025. [3] (b) Explain why the percentage of population living in urban areas is higher in MEDCs than in LEDCs. [5]
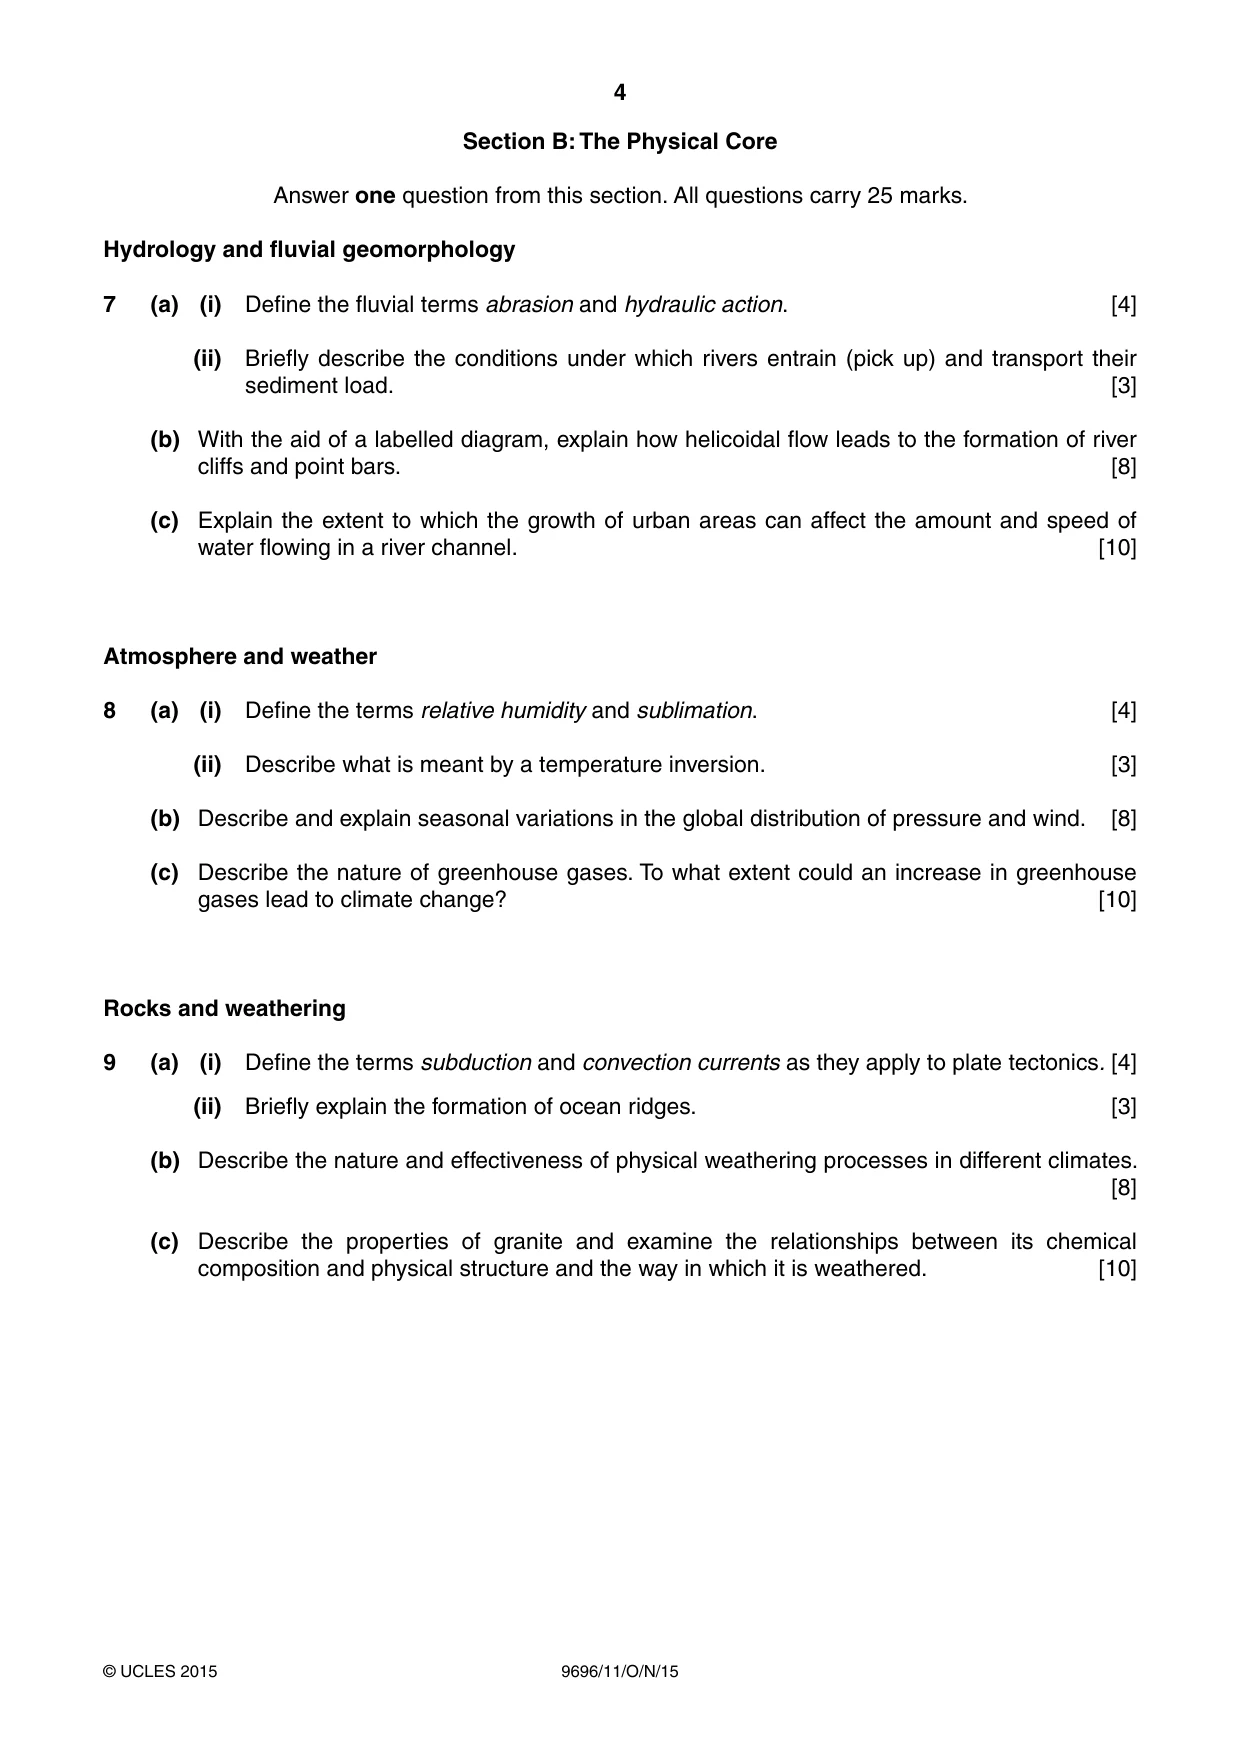
Question paper, page 4
4 9696/11/O/N/15 © UCLES 2015 Section B: The Physical Core Answer one question from this section. All questions carry 25 marks. Hydrology and fluvial geomorphology 7 (a) (i) Define the fluvial terms abrasion and hydraulic action. [4] (ii) Briefly describe the conditions under which rivers entrain (pick up) and transport their sediment load. [3] (b) With the aid of a labelled diagram, explain how helicoidal flow leads to the formation of river cliffs and point bars. [8] (c) Explain the extent to which the growth of urban areas can affect the amount and speed of water flowing in a river channel. [10] Atmosphere and weather 8 (a) (i) Define the terms relative humidity and sublimation. [4] (ii) Describe what is meant by a temperature inversion. [3] (b) Describe and explain seasonal variations in the global distribution of pressure and wind. [8] (c) Describe the nature of greenhouse gases. To what extent could an increase in greenhouse gases lead to climate change? [10] Rocks and weathering 9 (a) (i) Define the terms subduction and convection currents as they apply to plate tectonics. [4] (ii) Briefly explain the formation of ocean ridges. [3] (b) Describe the nature and effectiveness of physical weathering processes in different climates. [8] (c) Describe the properties of granite and examine the relationships between its chemical composition and physical structure and the way in which it is weathered. [10]
Question paper, page 5
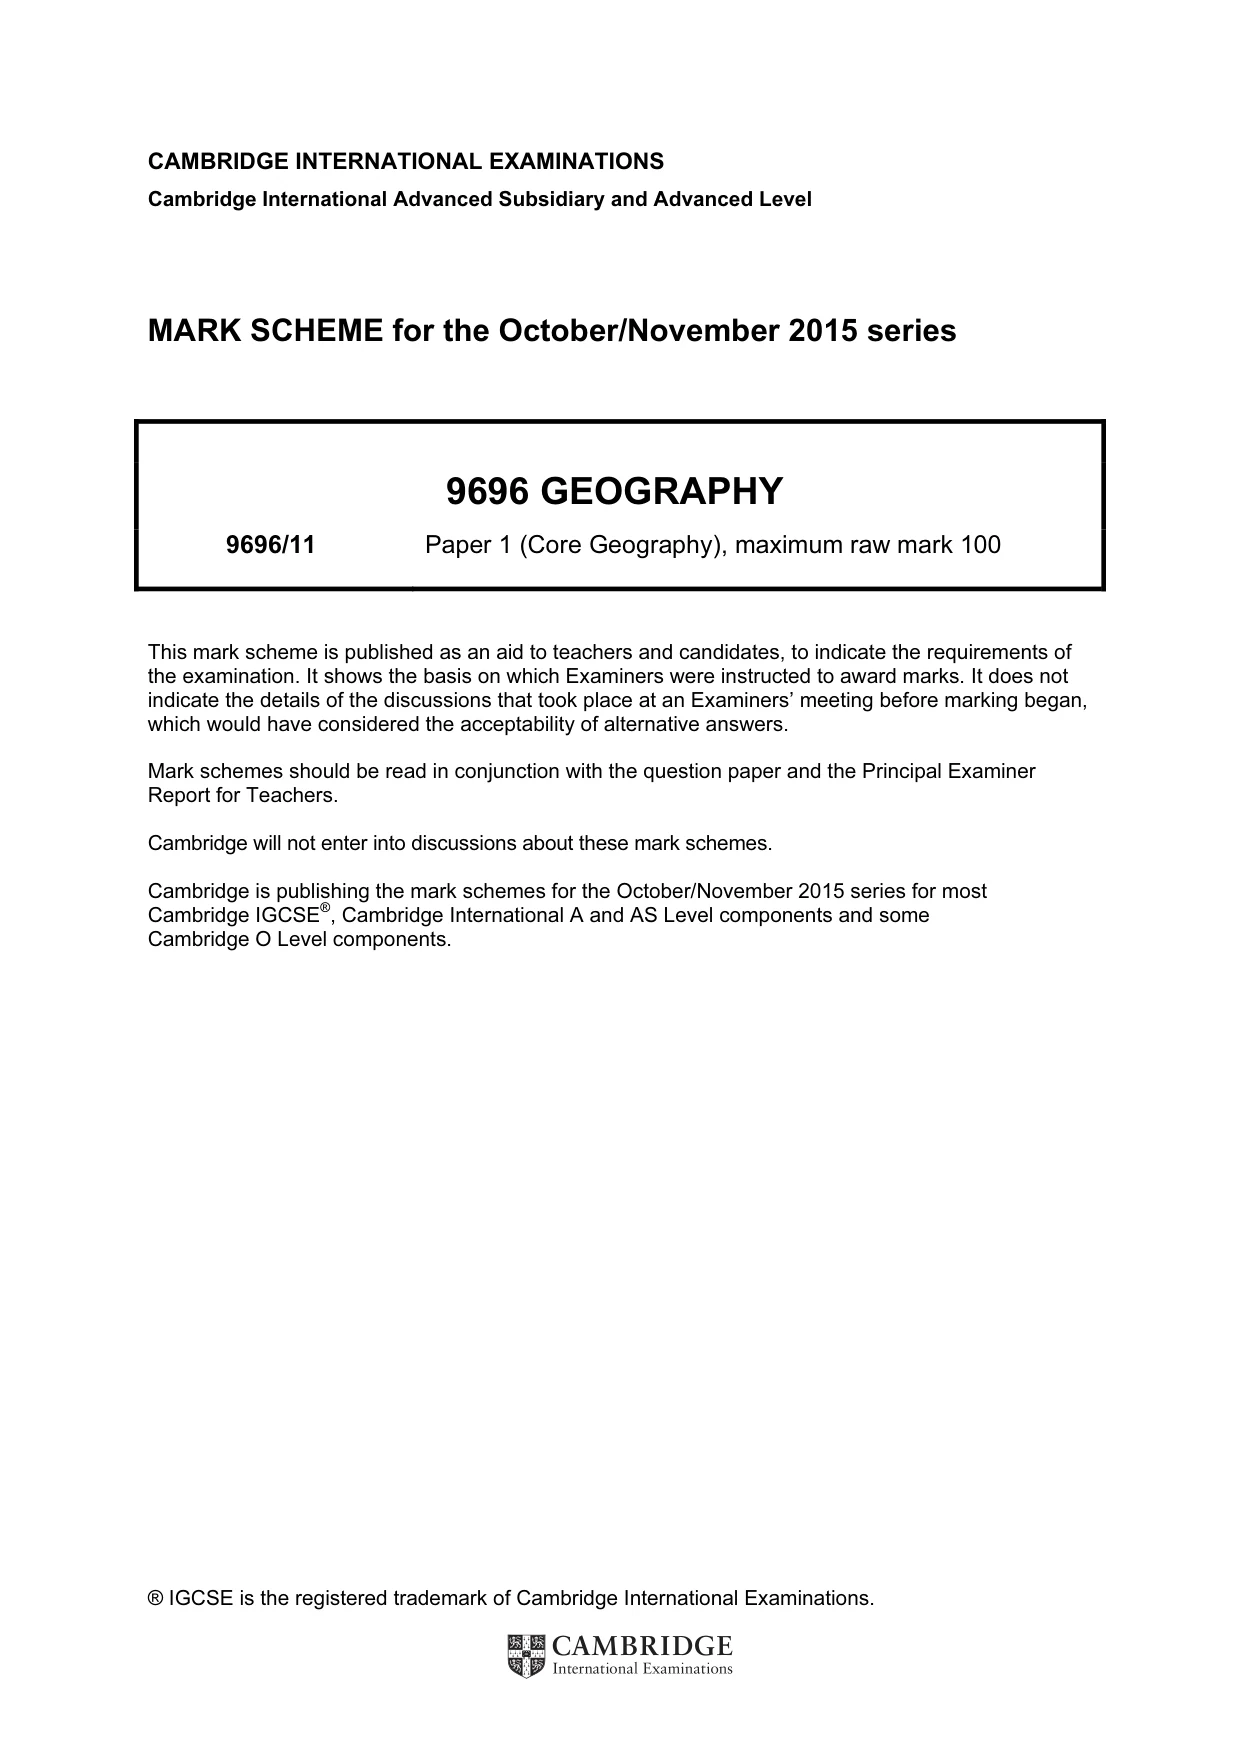
5 9696/11/O/N/15 © UCLES 2015 Section C: The Human Core Answer one question from this section. All questions carry 25 marks. Population 10 (a) (i) Give the meaning of the term carrying capacity. [3] (ii) Outline two possible responses of the population in an area that has reached its carrying capacity. [4] (b) Explain the constraints on increasing food production in LEDCs. [8] (c) Outline the population policy of one named country and assess its success. [10] Migration 11 (a) (i) Define the term international migration. [3] (ii) Describe the political barriers to international migration. [4] (b) Explain why voluntary international migration is increasing. [8] (c) With reference to one named example of international migration, evaluate its impacts on the source and the receiving areas. [10] Settlement dynamics 12 (a) (i) Define the term urbanisation. [3] (ii) Briefly explain why there is a high rate of urbanisation in many LEDCs. [4] (b) Explain the positive and negative consequences of rapid urban growth in LEDCs. [8] (c) With reference to examples, assess the effectiveness of strategies for reducing urbanisation in LEDCs. [10]
Question paper, page 6
6 9696/11/O/N/15 © UCLES 2015 BLANK PAGE
Question paper, page 7
7 9696/11/O/N/15 © UCLES 2015 BLANK PAGE
Question paper, page 8
8 9696/11/O/N/15 © UCLES 2015 BLANK PAGE Permission to reproduce items where third-party owned material protected by copyright is included has been sought and cleared where possible. Every reasonable effort has been made by the publisher (UCLES) to trace copyright holders, but if any items requiring clearance have unwittingly been included, the publisher will be pleased to make amends at the earliest possible opportunity. To avoid the issue of disclosure of answer-related information to candidates, all copyright acknowledgements are reproduced online in the Cambridge International Examinations Copyright Acknowledgements Booklet. This is produced for each series of examinations and is freely available to download at www.cie.org.uk after the live examination series. Cambridge International Examinations is part of the Cambridge Assessment Group. Cambridge Assessment is the brand name of University of Cambridge Local Examinations Syndicate (UCLES), which is itself a department of the University of Cambridge.
Mark scheme, page 1
® IGCSE is the registered trademark of Cambridge International Examinations. CAMBRIDGE INTERNATIONAL EXAMINATIONS Cambridge International Advanced Subsidiary and Advanced Level MARK SCHEME for the October/November 2015 series 9696 GEOGRAPHY 9696/11 Paper 1 (Core Geography), maximum raw mark 100 This mark scheme is published as an aid to teachers and candidates, to indicate the requirements of the examination. It shows the basis on which Examiners were instructed to award marks. It does not indicate the details of the discussions that took place at an Examiners’ meeting before marking began, which would have considered the acceptability of alternative answers. Mark schemes should be read in conjunction with the question paper and the Principal Examiner Report for Teachers. Cambridge will not enter into discussions about these mark schemes. Cambridge is publishing the mark schemes for the October/November 2015 series for most Cambridge IGCSE®, Cambridge International A and AS Level components and some Cambridge O Level components.
Mark scheme, page 2
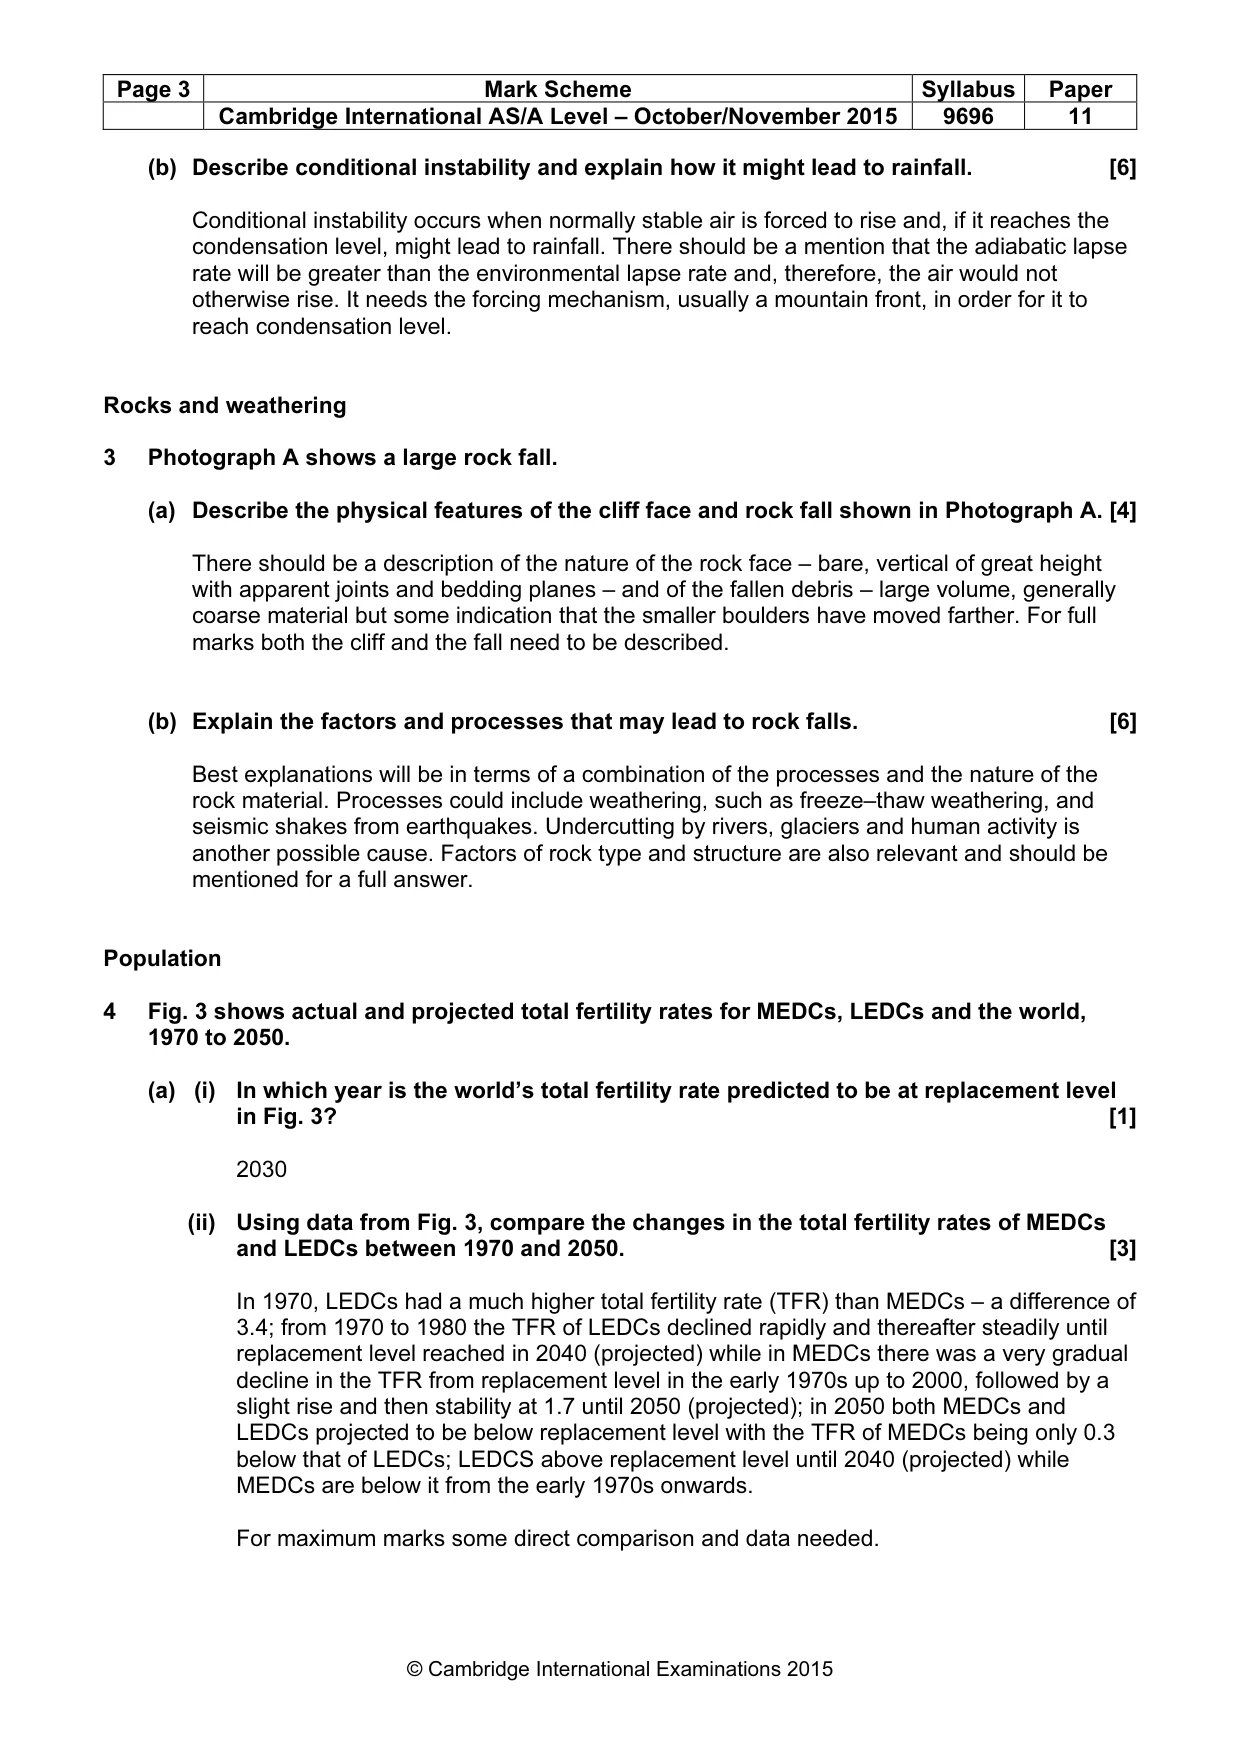
Page 2 Mark Scheme Syllabus Paper Cambridge International AS/A Level – October/November 2015 9696 11 © Cambridge International Examinations 2015 Section A Hydrology and fluvial geomorphology 1 Fig. 1 shows the main features of the hydrological system of a drainage basin. (a) (i) Name the store labelled A. [1] Interception (ii) Name the flow labelled B. [1] Throughflow (iii) Name the flow labelled C. [1] Percolation (iv) Name the flow labelled D. [1] Groundwater flow (b) Describe and explain the factors that may lead to a high amount of overland flow. [6] A number of factors could be discussed such as heavy precipitation, nature of surface characteristics such as impermeable soils, lack of vegetation and interception, steep slopes and others. For full marks, there must be mention of heavy precipitation which is often ignored. There must be explanation as well as description and for good marks there should be some mention of the fact that the factors work together to promote surface runoff. Atmosphere and weather 2 Fig. 2 shows atmospheric lapse rates. Using Fig. 2: (a) (i) Name the lapse rate labelled A. [1] Environmental lapse rate (ii) Name the lapse rate labelled B. [1] Saturated adiabatic lapse rate (iii) State the height in metres at which clouds begin to form. [1] 1000 metres (iv) Identify the feature shown by the line labelled C. [1] Top of the clouds or point where the lapse rates cross
Mark scheme, page 3
Page 3 Mark Scheme Syllabus Paper Cambridge International AS/A Level – October/November 2015 9696 11 © Cambridge International Examinations 2015 (b) Describe conditional instability and explain how it might lead to rainfall. [6] Conditional instability occurs when normally stable air is forced to rise and, if it reaches the condensation level, might lead to rainfall. There should be a mention that the adiabatic lapse rate will be greater than the environmental lapse rate and, therefore, the air would not otherwise rise. It needs the forcing mechanism, usually a mountain front, in order for it to reach condensation level. Rocks and weathering 3 Photograph A shows a large rock fall. (a) Describe the physical features of the cliff face and rock fall shown in Photograph A. [4] There should be a description of the nature of the rock face – bare, vertical of great height with apparent joints and bedding planes – and of the fallen debris – large volume, generally coarse material but some indication that the smaller boulders have moved farther. For full marks both the cliff and the fall need to be described. (b) Explain the factors and processes that may lead to rock falls. [6] Best explanations will be in terms of a combination of the processes and the nature of the rock material. Processes could include weathering, such as freeze–thaw weathering, and seismic shakes from earthquakes. Undercutting by rivers, glaciers and human activity is another possible cause. Factors of rock type and structure are also relevant and should be mentioned for a full answer. Population 4 Fig. 3 shows actual and projected total fertility rates for MEDCs, LEDCs and the world, 1970 to 2050. (a) (i) In which year is the world’s total fertility rate predicted to be at replacement level in Fig. 3? [1] 2030 (ii) Using data from Fig. 3, compare the changes in the total fertility rates of MEDCs and LEDCs between 1970 and 2050. [3] In 1970, LEDCs had a much higher total fertility rate (TFR) than MEDCs – a difference of 3.4; from 1970 to 1980 the TFR of LEDCs declined rapidly and thereafter steadily until replacement level reached in 2040 (projected) while in MEDCs there was a very gradual decline in the TFR from replacement level in the early 1970s up to 2000, followed by a slight rise and then stability at 1.7 until 2050 (projected); in 2050 both MEDCs and LEDCs projected to be below replacement level with the TFR of MEDCs being only 0.3 below that of LEDCs; LEDCS above replacement level until 2040 (projected) while MEDCs are below it from the early 1970s onwards. For maximum marks some direct comparison and data needed.
Mark scheme, page 4
Page 4 Mark Scheme Syllabus Paper Cambridge International AS/A Level – October/November 2015 9696 11 © Cambridge International Examinations 2015 (b) Explain why total fertility rates are lower in MEDCs than in LEDCs. [6] In MEDCs lower TFRs due to: social and economic change bringing new attitudes to children / new norms; the role of women; the expense of child rearing; ease of access to and low cost of contraception, etc. In LEDCs higher TFRs due to: economic necessity / need for labour; role of women; lack of easy and affordable access to family planning and contraception; religion; cultural norms, etc. For maximum marks at least two well explained reasons and reference to both MEDCs and LEDCs. No double credit for opposites. Migration 5 Photograph B shows a refugee camp in an LEDC. (a) (i) Using evidence from Photograph B, describe the refugee camp. [2] Large numbers of people in the camp; temporary accommodation / tents of different sizes and colours; informal layout / lack of a plan; one dirt road and mud paths between the tents. Any two points for which there is photographic evidence. (ii) Using evidence from Photograph B, describe two impacts of refugees on the area. [3] Deforestation to make space for the refugee camp and to provide firewood; bare ground as low growing vegetation trampled and soil compacted; reduced air quality due to the smoke from forest clearing and burning and from cooking fires. Any two points for which there is photographic evidence, one mark for a simple point and two marks for a developed point. (b) Explain why some countries receive more refugees than others. [5] Characteristics of countries that receive more refugees: proximity to and / or good transport links with a country suffering war / conflict or natural disasters – neighbouring countries in particular may receive large numbers of refugees; a lack of border controls; historical ties with the source country; being welcoming to refugees (or perceived to be); MEDCs – so more opportunities; peaceful – so attractive to refugees from war zones. Response can be general or case study based. At least two well developed points for maximum marks.
Mark scheme, page 5
Page 5 Mark Scheme Syllabus Paper Cambridge International AS/A Level – October/November 2015 9696 11 © Cambridge International Examinations 2015 Settlement dynamics 6 Fig. 4A shows percentage urban population and city sizes in Asia and Oceania in 2011. Fig. 4B shows projected data for 2025. (a) (i) Compare the percentage urban population and city sizes in Australia in 2011 and 2025. [2] % urban population remains in same category, 76–100% (1); number of cities of 1 million+ also remains the same, 5, but one of the cities is projected to grow from 1–5 million in 2011 to 6–10 million in 2025 (1). (ii) Identify two changes in city sizes in South Asia between 2011 and 2025. [3] The total number of cities of 1 million+ projected to grow significantly (from approx. 40 to approx. 50); the number of largest cities of 11 million+ projected to grow from 5 to 9; in 2011 only 1 of largest cities away from the coast but in 2025 an increase to 4; cities in South India / South of region to experience particularly large growth in both number and size. Any two changes at one mark each plus one mark for appropriate use of data. (b) Explain why the percentage of population living in urban areas is higher in MEDCs than in LEDCs. [5] MEDCs at a later stage in the urbanisation cycle; urbanisation associated with industrialisation in MEDCs, e.g. from late 18thC in Britain; by mid-20thC urbanisation stage coming to an end and majority of population already living in urban areas. LEDCs at an earlier stage in the urbanisation cycle; industrialisation more recent and urbanisation a more recent process; rapid urbanisation taking place now, the % of population living in urban areas is therefore increasing but not yet the majority as in MEDCs. At least two well explained points for maximum marks.
Mark scheme, page 6
Page 6 Mark Scheme Syllabus Paper Cambridge International AS/A Level – October/November 2015 9696 11 © Cambridge International Examinations 2015 Section B: The Physical Core Hydrology and fluvial geomorphology 7 (a) (i) Define the fluvial terms abrasion and hydraulic action. [4] Abrasion is the grinding (rubbing) action of river bedload as it impacts rock on the bed or sides of the channel. Hydraulic action, in the narrowest sense, is the wearing effect of water acting on exposed bedrock, although many candidates will describe the cavitation effect of water in joints. (ii) Briefly describe the conditions under which rivers entrain (pick up) and transport their sediment load. [3] Most sediment is entrained during periods of high velocity and high flows. A detailed description is not needed for full marks, but there should be some mention of size of material entrained in relation to the flow velocities. (b) With the aid of a labelled diagram, explain how helicoidal flow leads to the formation of river cliffs and point bars. [8] The diagram should, as a minimum, show the cross channel flow of water moving across the channel as an upper flow from inner to outer bank and then returning at depth to the inner bank. This flow needs then to be related to the formation of river cliffs by erosion on the outer bend and deposition on the inner bend to produce point bars (slip off slopes). Much of this could be included in a well annotated diagram. If no diagram, maximum 5 marks.
Mark scheme, page 7
Page 7 Mark Scheme Syllabus Paper Cambridge International AS/A Level – October/November 2015 9696 11 © Cambridge International Examinations 2015 (c) Explain the extent to which the growth of urban areas can affect the amount and speed of water flowing in a river channel. [10] Most candidates will probably concentrate on the amount of water flowing with a discussion of the effects of urban areas on the amount and speed of runoff and the quick return of water to the river. Increased discharge usually also results in increased velocity, but velocity at a point can be increased by channelisation changing the hydraulic radius and decreasing friction. Obstructions, such as bridges, can also lead to increased velocities. Level 3 Answers will cover both amount and speed with some assessment of the relative effects. The reasons for the changes will be examined very convincingly. There needs to be convincing assessment of the ‘extent to which’. [8–10] Level 2 Answers will probably be unbalanced with an overconcentration on amount of flow rather than speed. There will probably be some confusion over velocity / discharge relationships in modified river channels. [5–7] Level 1 Will have limited understanding of the effects of urban areas on flow velocity and amount. Will probably cover only one of the components and will exhibit a lack of understanding as to how river discharge and velocity are related. [1–4] For no response, or no creditable response, 0. Atmosphere and weather 8 (a) (i) Define the terms relative humidity and sublimation. [4] Relative humidity is the amount of moisture in the air (atmosphere) as a percentage of the total amount of moisture that the air can hold at a particular temperature. Sublimation is the change of state from a solid, usually ice or snow, directly into a gas, usually water vapour. (ii) Describe what is meant by a temperature inversion. [3] The increase in temperature with height in the atmosphere. For full marks there should be some indication that this is the reverse of normal conditions. (b) Describe and explain seasonal variations in the global distribution of pressure and wind. [8] Emphasis should be on the seasonal movement of the thermal equator with the main low pressure shifting north and south with it. As winds are related to the positions of the low and high pressure areas, winds will shift with the pressure belts but much less than the pressure systems because of the different thermal properties of the oceans. It is only the monsoons that show a marked seasonal pattern. Better answers will mention the differences between land and sea masses. Much information can be portrayed in a simple diagram of the three atmospheric cells and the effects on wind directions.
Mark scheme, page 8
Page 8 Mark Scheme Syllabus Paper Cambridge International AS/A Level – October/November 2015 9696 11 © Cambridge International Examinations 2015 (c) Describe the nature of greenhouse gases. To what extent could an increase in greenhouse gases lead to climate change? [10] Greenhouse gases are gases that allow incoming short wave radiation from the sun to pass through the atmosphere but absorb outgoing long wave radiation. The main gases, carbon dioxide, methane, nitrous oxides and water vapour should be mentioned. The effect of the gases is to increase the temperature of the atmosphere by trapping and re-radiating the heat. This will have other effects such as on evaporation rates and sea surface temperatures possibly leading to greater storminess and increased variability of atmospheric hazards. It is difficult to allocate a mark simply for the description of the nature of the gases as this should be part of the assessment. Mark as a whole. Level 3 There will be an accurate description of greenhouse gases and their effects. The possible impact on climate change will cover more than just a brief statement of global warming. The operation of the greenhouse effect will be thorough with no mention of the ‘blanket’ effect. There needs to be a convincing assessment of ‘to what extent’. [8–10] Level 2 There will be a general grasp of the nature of greenhouse gases but it will be incomplete in some respects. The effect on climate will be restricted to very general statements. [5–7] Level 1 There will be little understanding of the nature of greenhouse gases or the greenhouse effect. The ozone layer will probably be introduced. The effect on climate change will be limited to brief statements of global warming without any specific reference to weather phenomena. [1–4] For no response, or no creditable response, 0. Rocks and weathering 9 (a) (i) Define the terms subduction and convection currents as they apply to plate tectonics. [4] Subduction is the process where the oceanic crust is forced downwards under a continental plate or another oceanic plate and is melted in the subduction (Benioff) zone. Convection currents are created by heat within the earth generated by radioactive decay. Convection currents occur in the semi-molten mantle and are responsible for the movement of the crustal plates. (ii) Briefly explain the formation of ocean ridges. [3] Where two oceanic plates are moving apart (spreading) driven by convection currents, molten rock from the mantle rises to fill the gap forming a mid-ocean ridge and submarine volcanoes. The most appropriate example is the mid-Atlantic Ridge. A detailed annotated diagram could achieve full marks.
Mark scheme, page 9
Page 9 Mark Scheme Syllabus Paper Cambridge International AS/A Level – October/November 2015 9696 11 © Cambridge International Examinations 2015 (b) Describe the nature and effectiveness of physical weathering processes in different climates. [8] Candidates might refer to the Peltier diagram to assess effectiveness compared to chemical weathering. The main physical weathering processes should be related to climatic factors, such as temperature and rainfall amounts. Effectiveness could be assessed in terms such as insolation weathering is effective in hot and dry climates but freeze-thaw is relatively ineffective or in terms of the relative effectiveness of the insolation weathering as opposed to salt crystal weathering. Other climates could be assessed in the same way. (c) Describe the properties of granite and examine the relationships between its chemical composition and physical structure and the way in which it is weathered. [10] Granite is a common and widely occurring type of intrusive, igneous rock. It has a medium to coarse texture composed usually of feldspar, quartz and mica. It is a hard rock but usually has three orthogonal sets of joints which increases its permeability and allows chemical and physical weathering processes to operate. The main physical weathering process is freeze- thaw, with hydrolysis being the main chemical weathering process. Hydrolysis affects the feldspar mostly, but mica is also weathered. Quartz is essentially inert and remains as a residue. Hydrolysis of feldspar results in the formation of kaolin (china clay). The different colours of the minerals, such as the dark colour of biotite mica, affect the intensity of insolation weathering, the end product being granular disintegration. The creation of joints following unloading (pressure relief) might also be mentioned. Level 3 There will be a thorough understanding of the nature of granite and an ability to relate this knowledge to the weathering processes that affect it. [8–10] Level 2 The knowledge of the properties of granite will be partial in some respects and possibly unbalanced between chemical and physical properties. Detail on the weathering processes might be limited. [5–7] Level 1 Limited knowledge of the properties of granite with little discussion of weathering processes. [1–4] For no response, or no creditable response, 0.
Mark scheme, page 10
Page 10 Mark Scheme Syllabus Paper Cambridge International AS/A Level – October/November 2015 9696 11 © Cambridge International Examinations 2015 Section C: The Human Core Population 10 (a) (i) Give the meaning of the term carrying capacity. [3] The largest / maximum number of people (1) that can be supported (1) by the resources in a particular area / environment (1). (ii) Outline two possible responses of the population in an area that has reached its carrying capacity. [4] This can be answered either by using theory, outlining the S and J shaped population curves, or by outlining two actual responses, e.g. out-migration, agricultural intensification, agricultural innovation, etc. Award 1 mark for a simple point plus 1 for some elaboration / development; 2+2 overall. (b) Explain the constraints on increasing food production in LEDCs. [8] A general answer or a detailed case study acceptable. For maximum marks there must be at least two constraints and an explanation of how the constraints operate to limit an increase in food production. Expect human and physical constraints such as: funding; agricultural practices; transport and storage; war / conflict; trade barriers; climatic and other environmental hazards; climate change.
Mark scheme, page 11
Page 11 Mark Scheme Syllabus Paper Cambridge International AS/A Level – October/November 2015 9696 11 © Cambridge International Examinations 2015 (c) Outline the population policy of one named country and assess its success. [10] This provides the opportunity to use case study knowledge of a population policy, either anti- natalist or pro-natalist. There should be some balance between description and assessment of the policy. An anti-natalist policy is more likely to be chosen, and expect China’s One Child Policy. Candidates will probably: Level 1 Show detailed case study knowledge. Develop a full and balanced answer with description and assessment of the success of the chosen policy. Provide some supporting evidence for the assessment. [8–10] Level 2 Show some case study knowledge. Provide a description of the chosen policy but only a limited or partial assessment of its success. [5–7] Level 1 Provide a descriptive response with little case study detail and with little or no assessment of the success of the chosen policy. [1–4] For no response, or no creditable response, 0. Migration 11 (a) (i) Define the term international migration. [3] The movement of population (1) from one country to another / across international boundaries (1) for a period of more than a year (1). (ii) Describe the political barriers to international migration. [4] Immigration laws / controls such as: tightly controlled borders; quota systems; visa / permit requirements, e.g. specifying particular skills. At least 2 examples are needed. 1 mark per simple statement plus 1 for elaboration / detail. (b) Explain why voluntary international migration is increasing. [8] Answer can be general or case study based. Increased mobility – advances in transport and reduced costs of transport; modern media providing increased knowledge of wide socio-economic disparities between countries and increased knowledge of potential destinations; globalisation and the availability of work opportunities in other countries / strong pull factors; population growth and increasing concentrations of people in poverty stricken areas / strong push factors. For maximum marks expect at least two well explained reasons.
Mark scheme, page 12
Page 12 Mark Scheme Syllabus Paper Cambridge International AS/A Level – October/November 2015 9696 11 © Cambridge International Examinations 2015 (c) With reference to one named example of international migration, evaluate its impacts on the source and the receiving areas. [10] Case study knowledge of a forced or voluntary international migration can be shown here, but the focus must be on evaluating the impacts of the migration. Positive and negative socio-economic, political and environmental impacts are to be weighed up in both the source and receiving areas. Candidates will probably: Level 3 Develop a well structured and well argued response that provides a full and balanced evaluation of various positive and negative impacts of the migration on source and receiving areas. Show detailed case study knowledge. [8–10] Level 2 Provide a limited or partial evaluation of the impacts of the migration which may lack balance between types of impact, between positive and negative impacts or between source and receiving areas. Show some case study knowledge. [5–7] Level 1 Provide a descriptive response with little or no evaluation of the impacts of the migration and with little or no case study detail. [1–4] For no response, or no creditable response, 0. Settlement dynamics 12 (a) (i) Define the term urbanisation. [3] The growth / increase (1) in the proportion / percentage of the population (1) living in urban areas (1). (ii) Briefly explain why there is a high rate of urbanisation in many LEDCs. [4] Stage of urbanisation cycle; rural-urban migration and the push and pull factors involved; high rate of natural population increase in urban areas. For maximum marks there must be some reference to the high rate of natural population increase in urban areas as well as to rural-urban migration.
Mark scheme, page 13
Page 13 Mark Scheme Syllabus Paper Cambridge International AS/A Level – October/November 2015 9696 11 © Cambridge International Examinations 2015 (b) Explain the positive and negative consequences of rapid urban growth in LEDCs. [8] Can be a general answer or case study based. Positive consequences: development of secondary and tertiary industries concentrated in large cities – demand for labour met by rapid influx of population from rural areas; large pool of cheap, available labour an attraction to more industries including TNCs; multiplier effect; a city increases in status and power from economic growth and large population (may become a world city); positive aspects of living in shanty towns / squatter settlement (‘slums of hope’ idea), e.g. improved access to education and health care in urban areas; out-migration from rural areas relieves pressure – mechanisation of agriculture has reduced need for labour. Negative consequences: under / unemployment; unplanned growth with loss of agricultural land and unsafe building; demand for housing outstrips supply, problems associated with shanty towns / squatter settlement (‘slums of despair’ idea); inadequate infrastructure – traffic congestion, water and power supplies not extended quickly enough; growth in crime and social problems; out-migration from rural areas can break up families, cause a loss of working age groups and produce an ageing population; agricultural decline and service decline can occur in rural areas. At least one positive and one negative consequence to be explained for maximum marks.
Mark scheme, page 14
Page 14 Mark Scheme Syllabus Paper Cambridge International AS/A Level – October/November 2015 9696 11 © Cambridge International Examinations 2015 (c) With reference to examples, assess the effectiveness of strategies for reducing urbanisation in LEDCs. [10] Expect some reference to the negative consequences of rapid urbanisation, i.e. reasons for the strategies, and some description of the strategies themselves. However, the focus must be on the effectiveness of these strategies. The strategies can be rural based, e.g. rural development programmes or the decentralisation of industries. They can be urban based, e.g. permit schemes to limit / regulate rural-urban migration, eviction and clearance of squatter settlements, or encouragement of fertility decline. Candidates will probably: Level 3 Develop a well structured response with a full and balanced assessment of the effectiveness of more than one strategy to reduce urbanisation. Include detailed exemplar support. [8–10] Level 2 Provide a limited or partial assessment of the effectiveness of a strategy or strategies to reduce urbanisation. Include some exemplar detail. [5–7] Level 1 Provide a predominantly descriptive response with little or no assessment of the effectiveness of a strategy or strategies to reduce urbanisation and with little or no exemplar detail. [1–4] For no response, or no creditable response, 0.
What you needed in this session
Cambridge’s own grade thresholds for 2015 Oct/Nov, Paper 1 · Variant 1. A higher threshold means an easier paper — the bar moves with how the cohort did.