Cambridge A Level Geography 9696 — 2015 Oct/Nov Paper 1 · Variant 2
9696/12/O/N/15 · 100 marks · ≈113 min
The question paper and its mark scheme, free to read here and free to download. This is Cambridge’s own paper, exactly as it was sat.
Question paper8 pages



Mark scheme15 pages
Answers below. Sit the paper first if you are practising.
Paper as text
Question paper, page 1
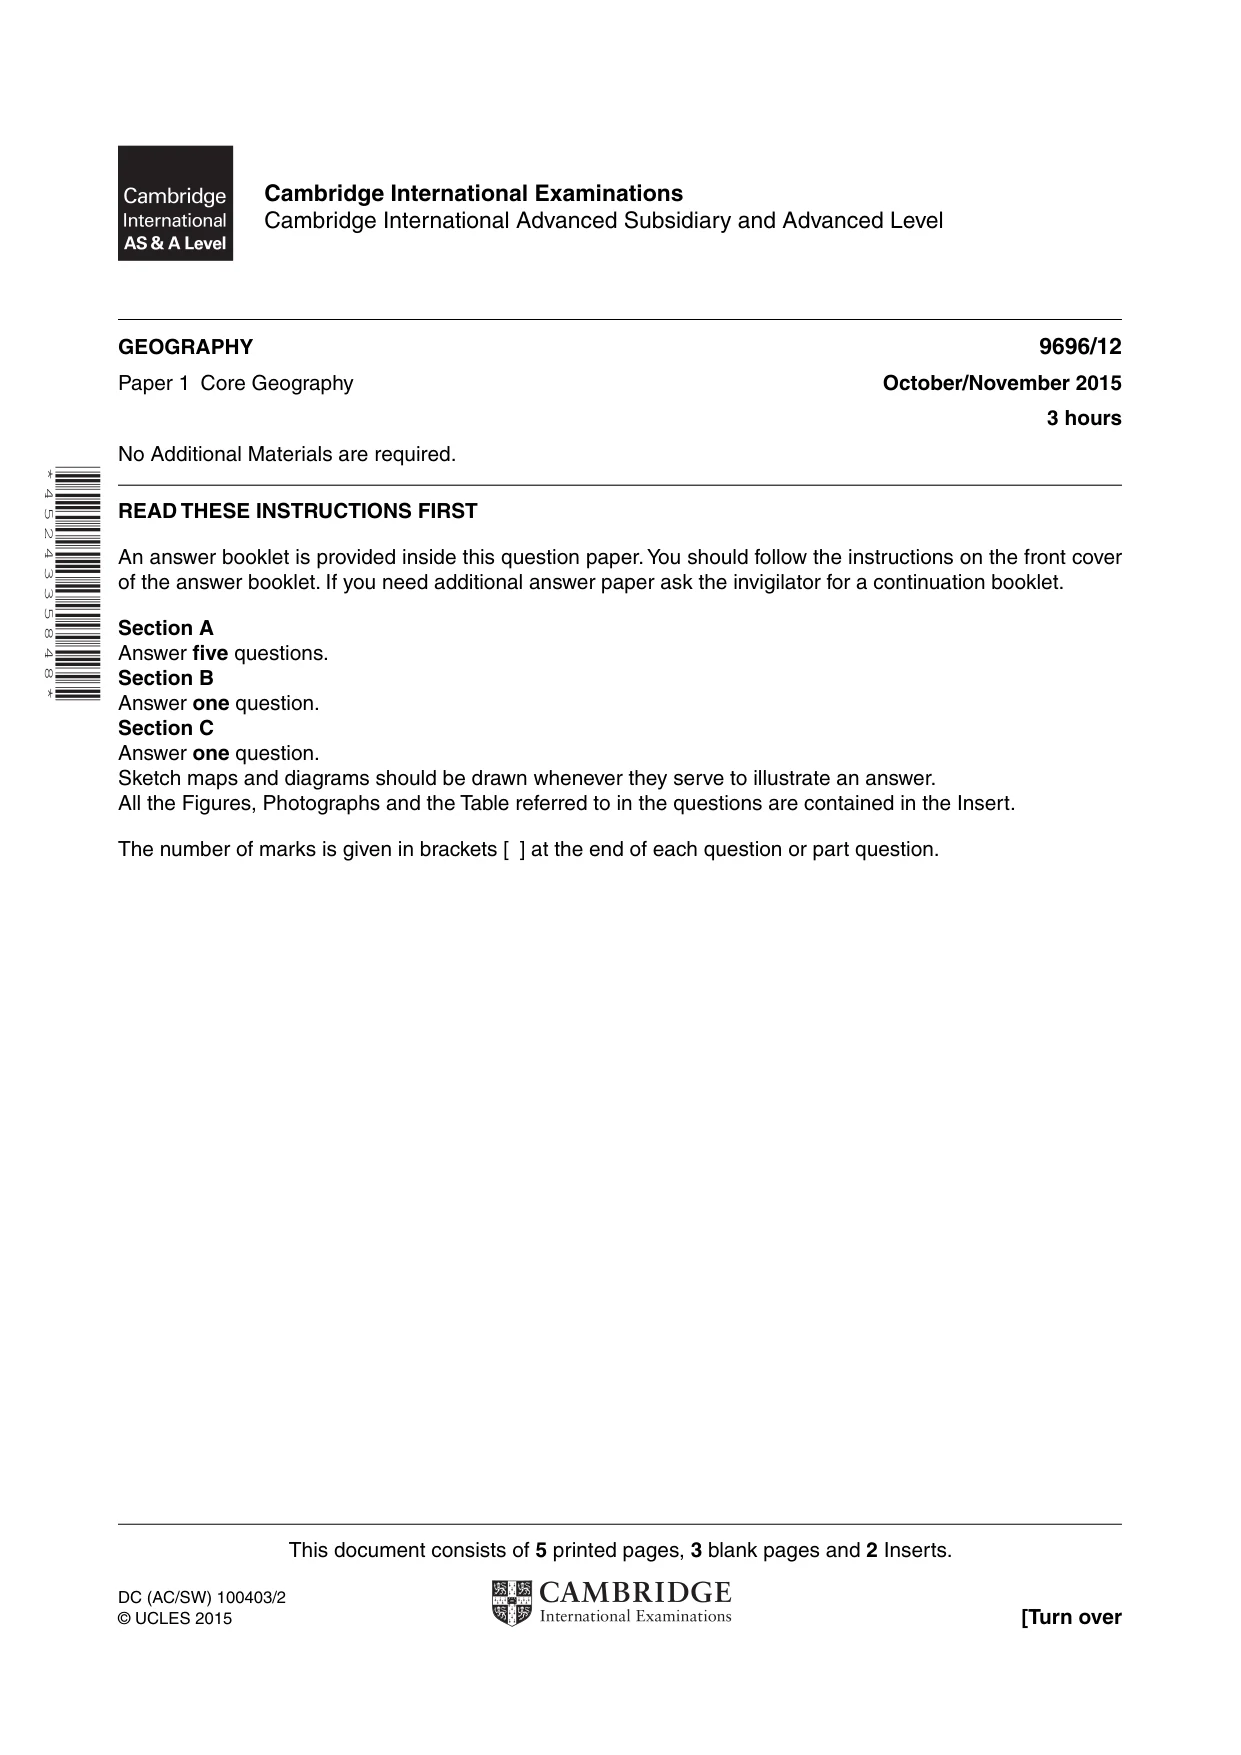
This document consists of 5 printed pages, 3 blank pages and 2 Inserts. DC (AC/SW) 100403/2 © UCLES 2015 [Turn over Cambridge International Examinations Cambridge International Advanced Subsidiary and Advanced Level * 4 5 2 4 3 3 5 8 4 8 * GEOGRAPHY 9696/12 Paper 1 Core Geography October/November 2015 3 hours No Additional Materials are required. READ THESE INSTRUCTIONS FIRST An answer booklet is provided inside this question paper. You should follow the instructions on the front cover of the answer booklet. If you need additional answer paper ask the invigilator for a continuation booklet. Section A Answer five questions. Section B Answer one question. Section C Answer one question. Sketch maps and diagrams should be drawn whenever they serve to illustrate an answer. All the Figures, Photographs and the Table referred to in the questions are contained in the Insert. The number of marks is given in brackets [ ] at the end of each question or part question.
Question paper, page 2
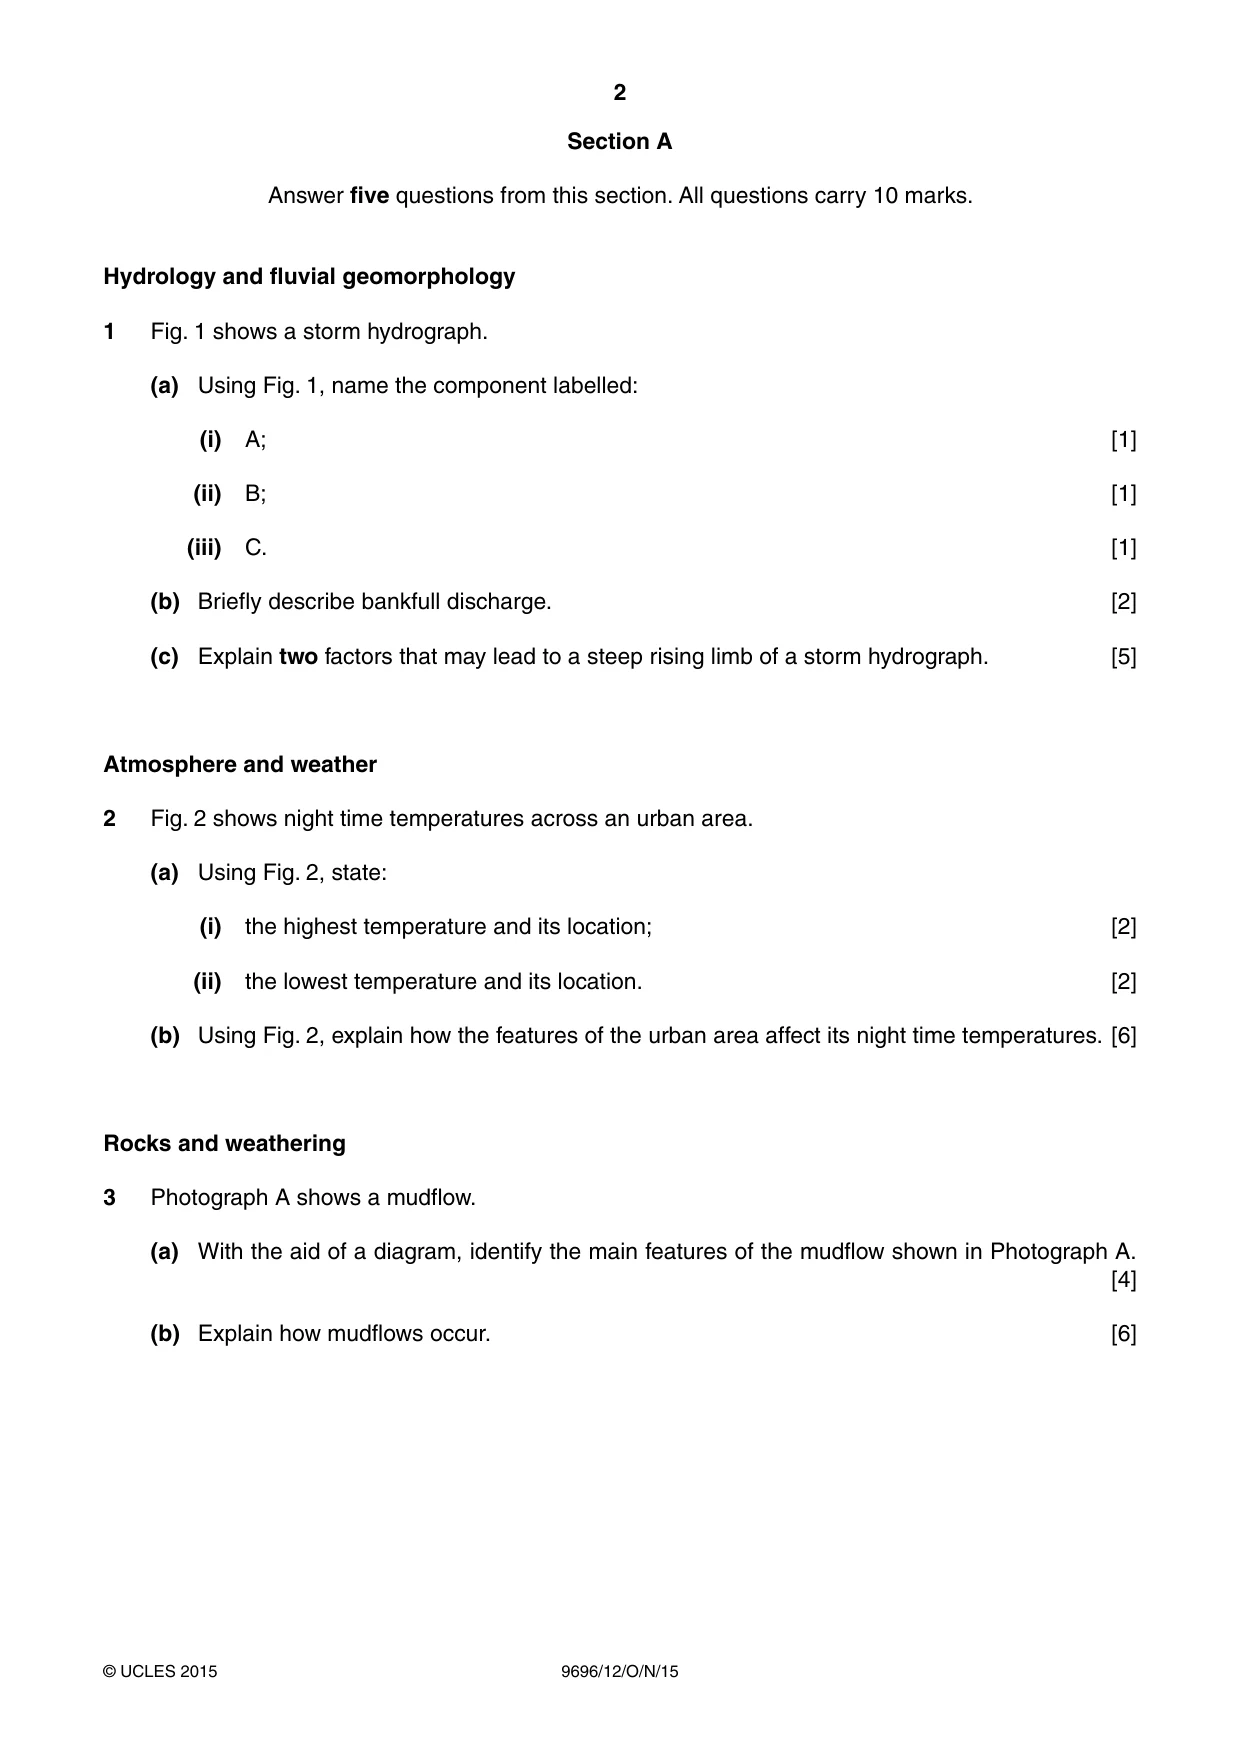
2 9696/12/O/N/15 © UCLES 2015 Section A Answer five questions from this section. All questions carry 10 marks. Hydrology and fluvial geomorphology 1 Fig. 1 shows a storm hydrograph. (a) Using Fig. 1, name the component labelled: (i) A; [1] (ii) B; [1] (iii) C. [1] (b) Briefly describe bankfull discharge. [2] (c) Explain two factors that may lead to a steep rising limb of a storm hydrograph. [5] Atmosphere and weather 2 Fig. 2 shows night time temperatures across an urban area. (a) Using Fig. 2, state: (i) the highest temperature and its location; [2] (ii) the lowest temperature and its location. [2] (b) Using Fig. 2, explain how the features of the urban area affect its night time temperatures. [6] Rocks and weathering 3 Photograph A shows a mudflow. (a) With the aid of a diagram, identify the main features of the mudflow shown in Photograph A. [4] (b) Explain how mudflows occur. [6]
Question paper, page 3
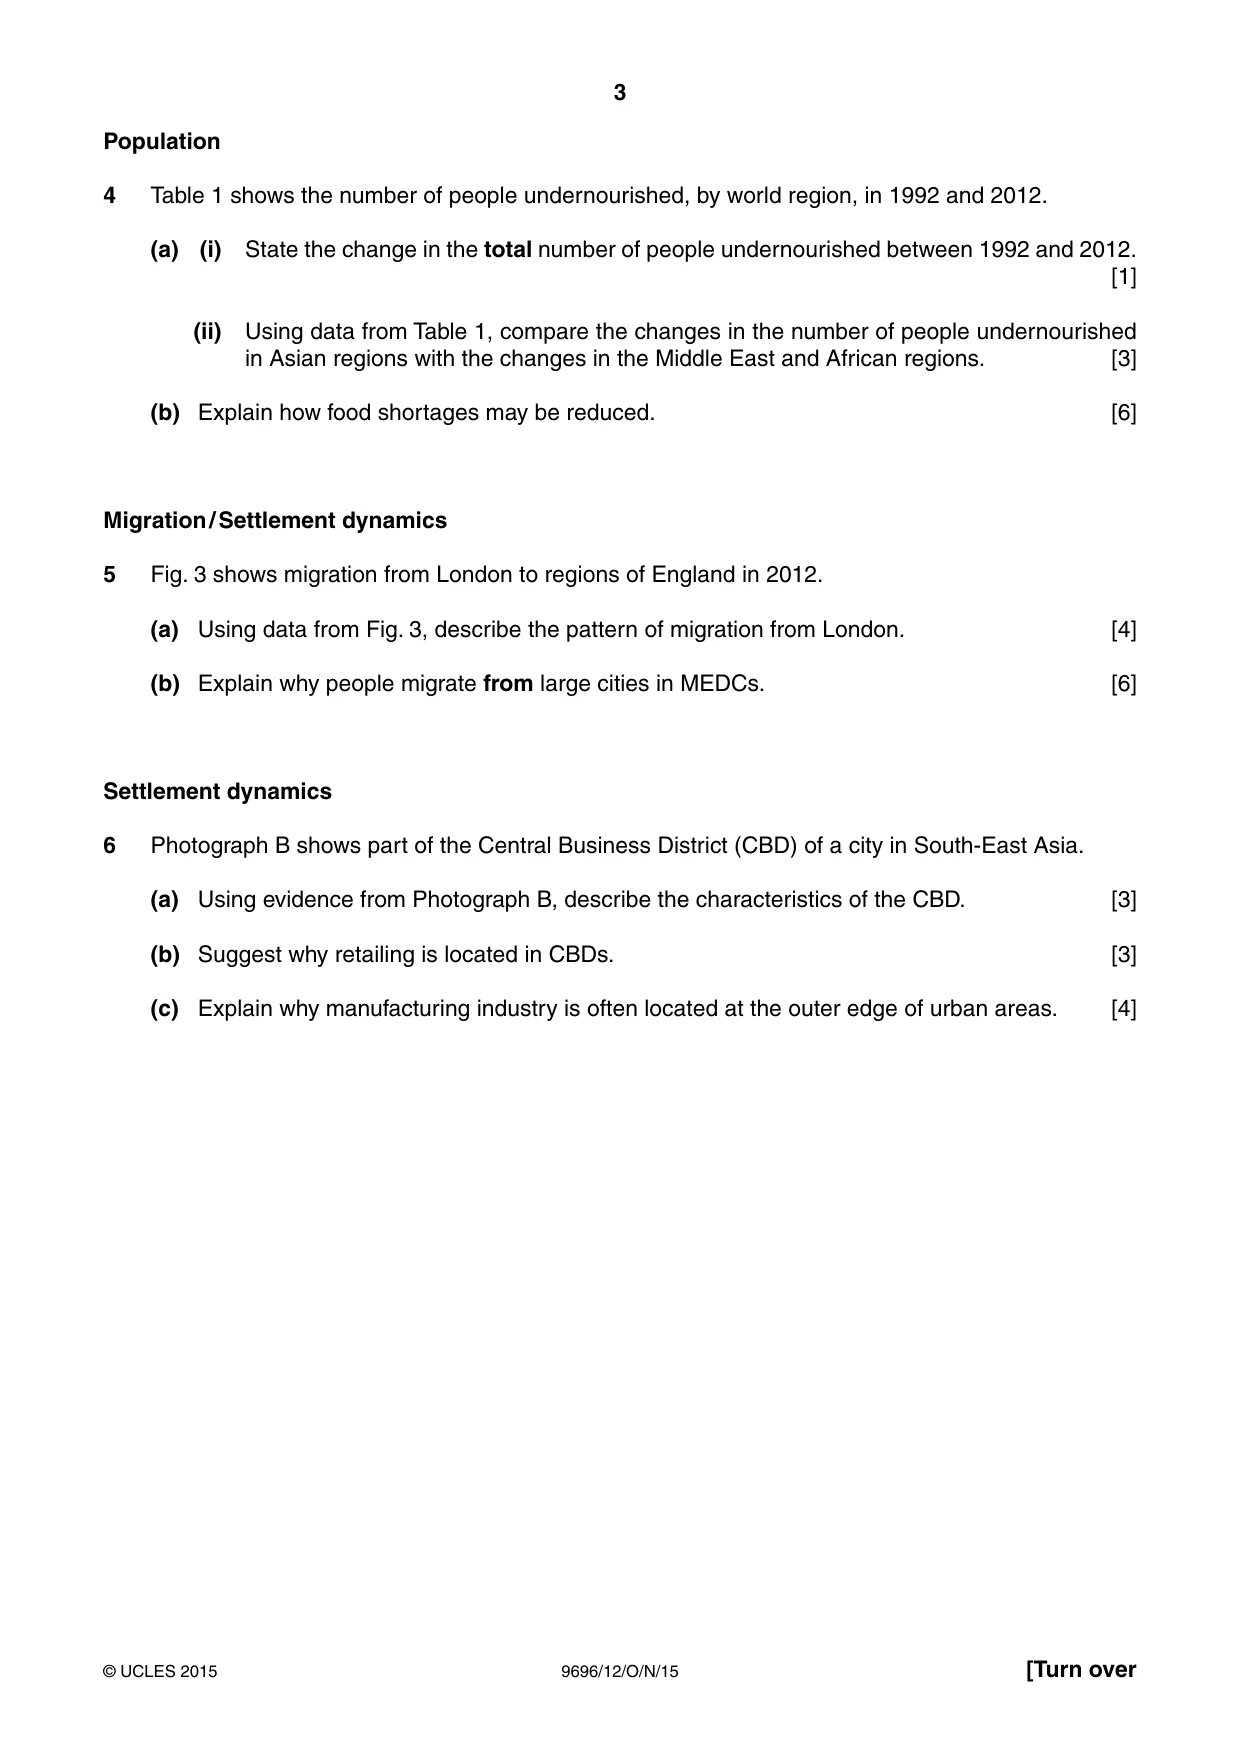
3 9696/12/O/N/15 © UCLES 2015 [Turn over Population 4 Table 1 shows the number of people undernourished, by world region, in 1992 and 2012. (a) (i) State the change in the total number of people undernourished between 1992 and 2012. [1] (ii) Using data from Table 1, compare the changes in the number of people undernourished in Asian regions with the changes in the Middle East and African regions. [3] (b) Explain how food shortages may be reduced. [6] Migration / Settlement dynamics 5 Fig. 3 shows migration from London to regions of England in 2012. (a) Using data from Fig. 3, describe the pattern of migration from London. [4] (b) Explain why people migrate from large cities in MEDCs. [6] Settlement dynamics 6 Photograph B shows part of the Central Business District (CBD) of a city in South-East Asia. (a) Using evidence from Photograph B, describe the characteristics of the CBD. [3] (b) Suggest why retailing is located in CBDs. [3] (c) Explain why manufacturing industry is often located at the outer edge of urban areas. [4]
Question paper, page 4
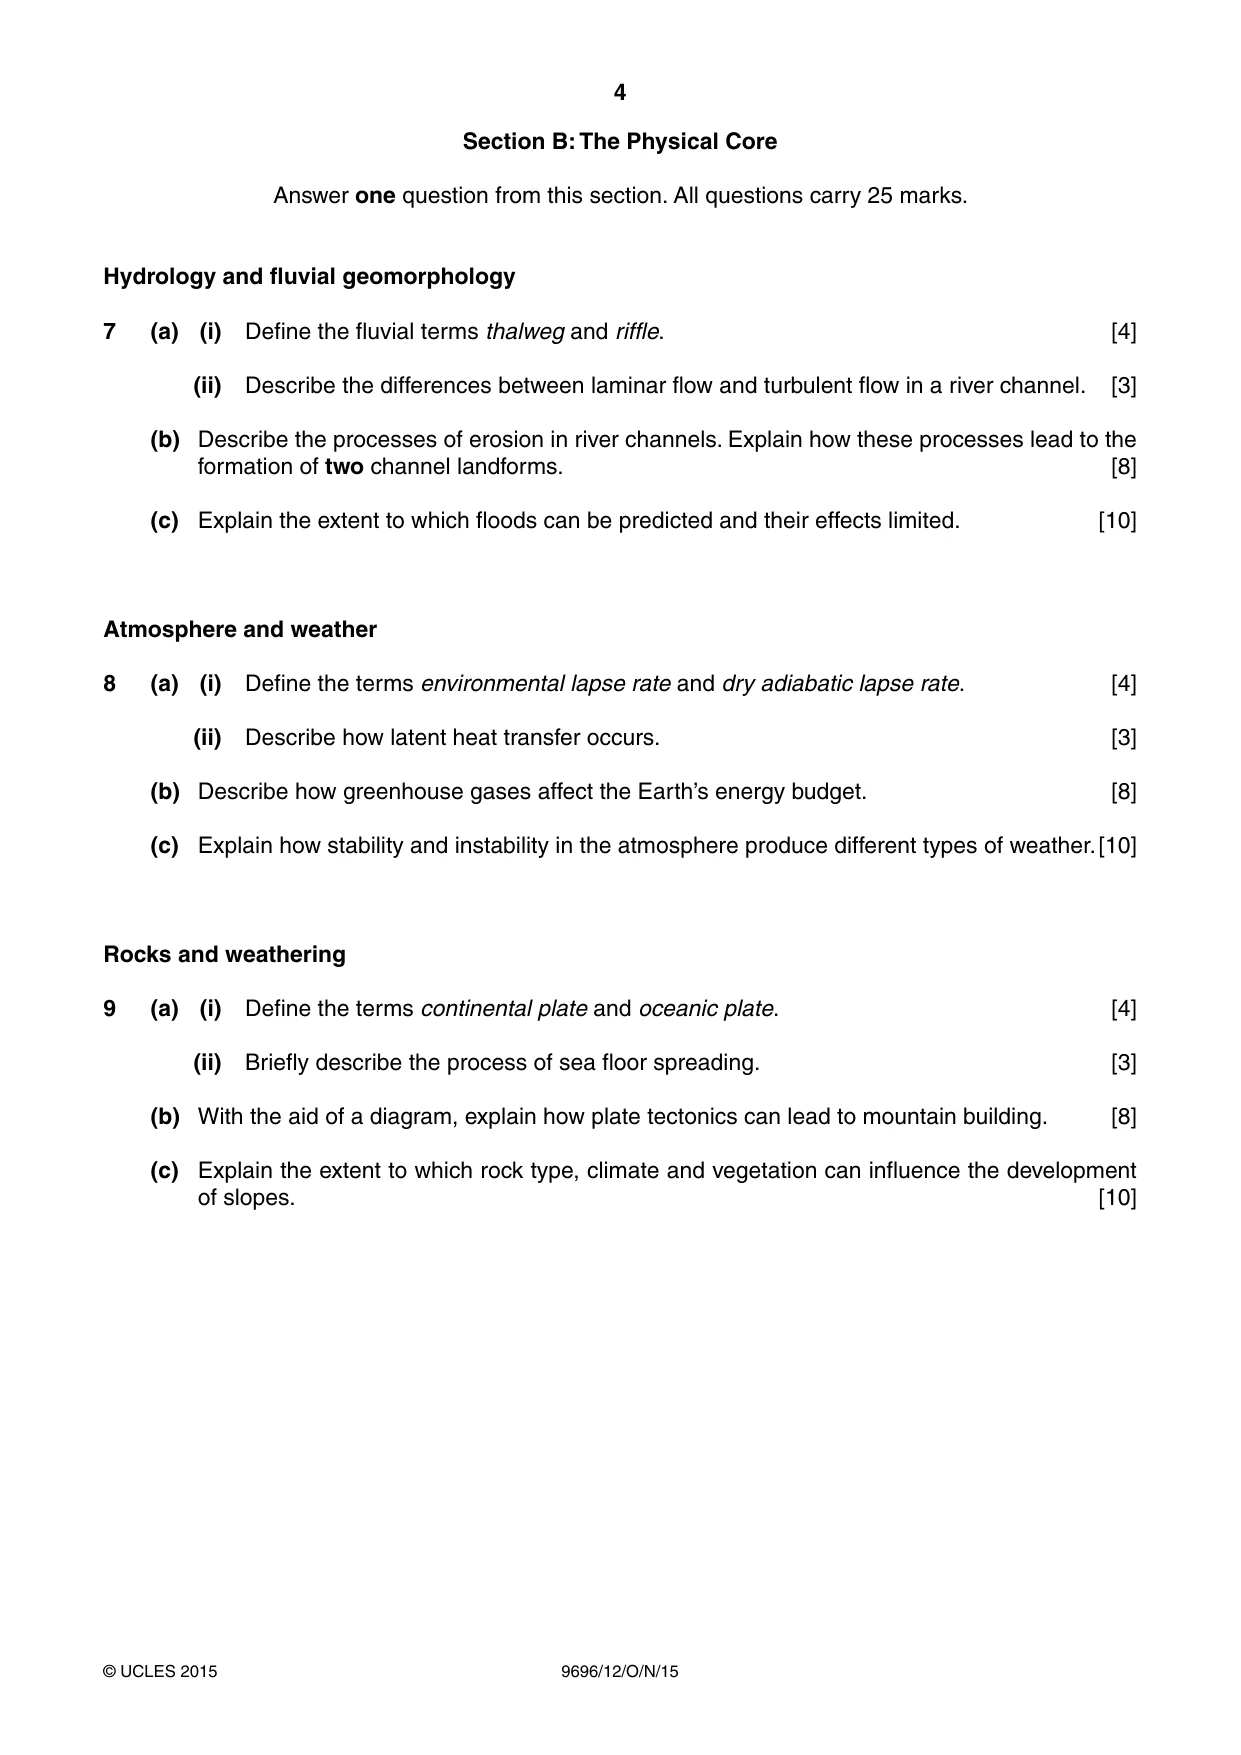
4 9696/12/O/N/15 © UCLES 2015 Section B: The Physical Core Answer one question from this section. All questions carry 25 marks. Hydrology and fluvial geomorphology 7 (a) (i) Define the fluvial terms thalweg and riffle. [4] (ii) Describe the differences between laminar flow and turbulent flow in a river channel. [3] (b) Describe the processes of erosion in river channels. Explain how these processes lead to the formation of two channel landforms. [8] (c) Explain the extent to which floods can be predicted and their effects limited. [10] Atmosphere and weather 8 (a) (i) Define the terms environmental lapse rate and dry adiabatic lapse rate. [4] (ii) Describe how latent heat transfer occurs. [3] (b) Describe how greenhouse gases affect the Earth’s energy budget. [8] (c) Explain how stability and instability in the atmosphere produce different types of weather. [10] Rocks and weathering 9 (a) (i) Define the terms continental plate and oceanic plate. [4] (ii) Briefly describe the process of sea floor spreading. [3] (b) With the aid of a diagram, explain how plate tectonics can lead to mountain building. [8] (c) Explain the extent to which rock type, climate and vegetation can influence the development of slopes. [10]
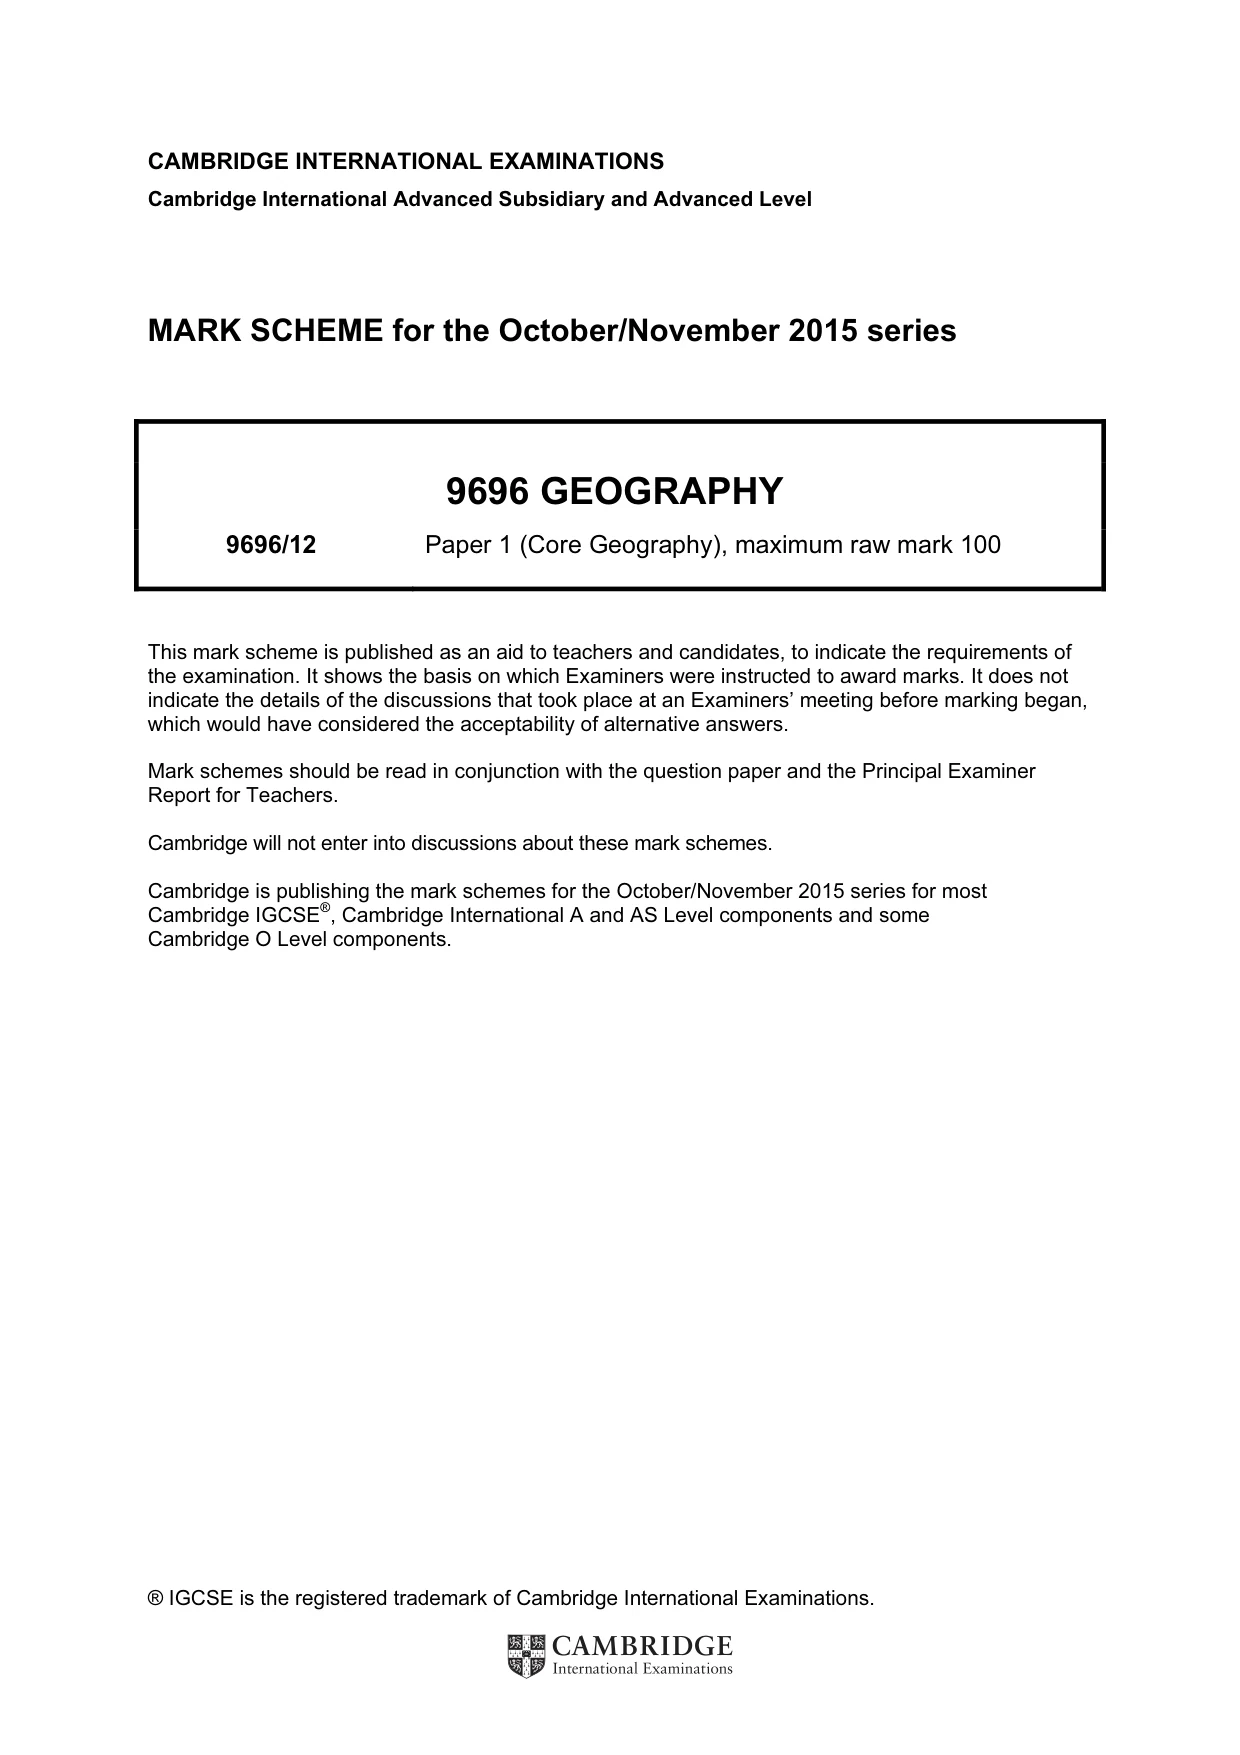
Question paper, page 5
5 9696/12/O/N/15 © UCLES 2015 Section C: The Human Core Answer one question from this section. All questions carry 25 marks. Population / Migration 10 (a) (i) Give the meaning of the term dependency ratio. [3] (ii) Explain why an area may have more males than females in its economically active population. [4] (b) Explain why many LEDCs have a young population. [8] (c) With reference to one or more countries, assess the challenges of an ageing population. [10] Migration 11 (a) (i) Define the term refugee. [3] (ii) Suggest two reasons why the number of refugees in the world is increasing. [4] (b) Describe and explain the impacts of large numbers of refugees on receiving areas. [8] (c) With reference to voluntary international migration, to what extent is there a typical migrant? [10] Settlement dynamics 12 (a) (i) Give the meaning of the term world city. [3] (ii) Suggest two reasons why the hierarchy of world cities may change. [4] (b) Describe and explain the location of shanty towns (squatter settlement) in cities in LEDCs. [8] (c) With reference to examples, evaluate the attempts to improve living conditions in shanty towns (squatter settlement) in LEDCs. [10]
Question paper, page 6
6 9696/12/O/N/15 © UCLES 2015 BLANK PAGE
Question paper, page 7
7 9696/12/O/N/15 © UCLES 2015 BLANK PAGE
Question paper, page 8
8 9696/12/O/N/15 © UCLES 2015 BLANK PAGE Permission to reproduce items where third-party owned material protected by copyright is included has been sought and cleared where possible. Every reasonable effort has been made by the publisher (UCLES) to trace copyright holders, but if any items requiring clearance have unwittingly been included, the publisher will be pleased to make amends at the earliest possible opportunity. To avoid the issue of disclosure of answer-related information to candidates, all copyright acknowledgements are reproduced online in the Cambridge International Examinations Copyright Acknowledgements Booklet. This is produced for each series of examinations and is freely available to download at www.cie.org.uk after the live examination series. Cambridge International Examinations is part of the Cambridge Assessment Group. Cambridge Assessment is the brand name of University of Cambridge Local Examinations Syndicate (UCLES), which is itself a department of the University of Cambridge.
Mark scheme, page 1
® IGCSE is the registered trademark of Cambridge International Examinations. CAMBRIDGE INTERNATIONAL EXAMINATIONS Cambridge International Advanced Subsidiary and Advanced Level MARK SCHEME for the October/November 2015 series 9696 GEOGRAPHY 9696/12 Paper 1 (Core Geography), maximum raw mark 100 This mark scheme is published as an aid to teachers and candidates, to indicate the requirements of the examination. It shows the basis on which Examiners were instructed to award marks. It does not indicate the details of the discussions that took place at an Examiners’ meeting before marking began, which would have considered the acceptability of alternative answers. Mark schemes should be read in conjunction with the question paper and the Principal Examiner Report for Teachers. Cambridge will not enter into discussions about these mark schemes. Cambridge is publishing the mark schemes for the October/November 2015 series for most Cambridge IGCSE®, Cambridge International A and AS Level components and some Cambridge O Level components.
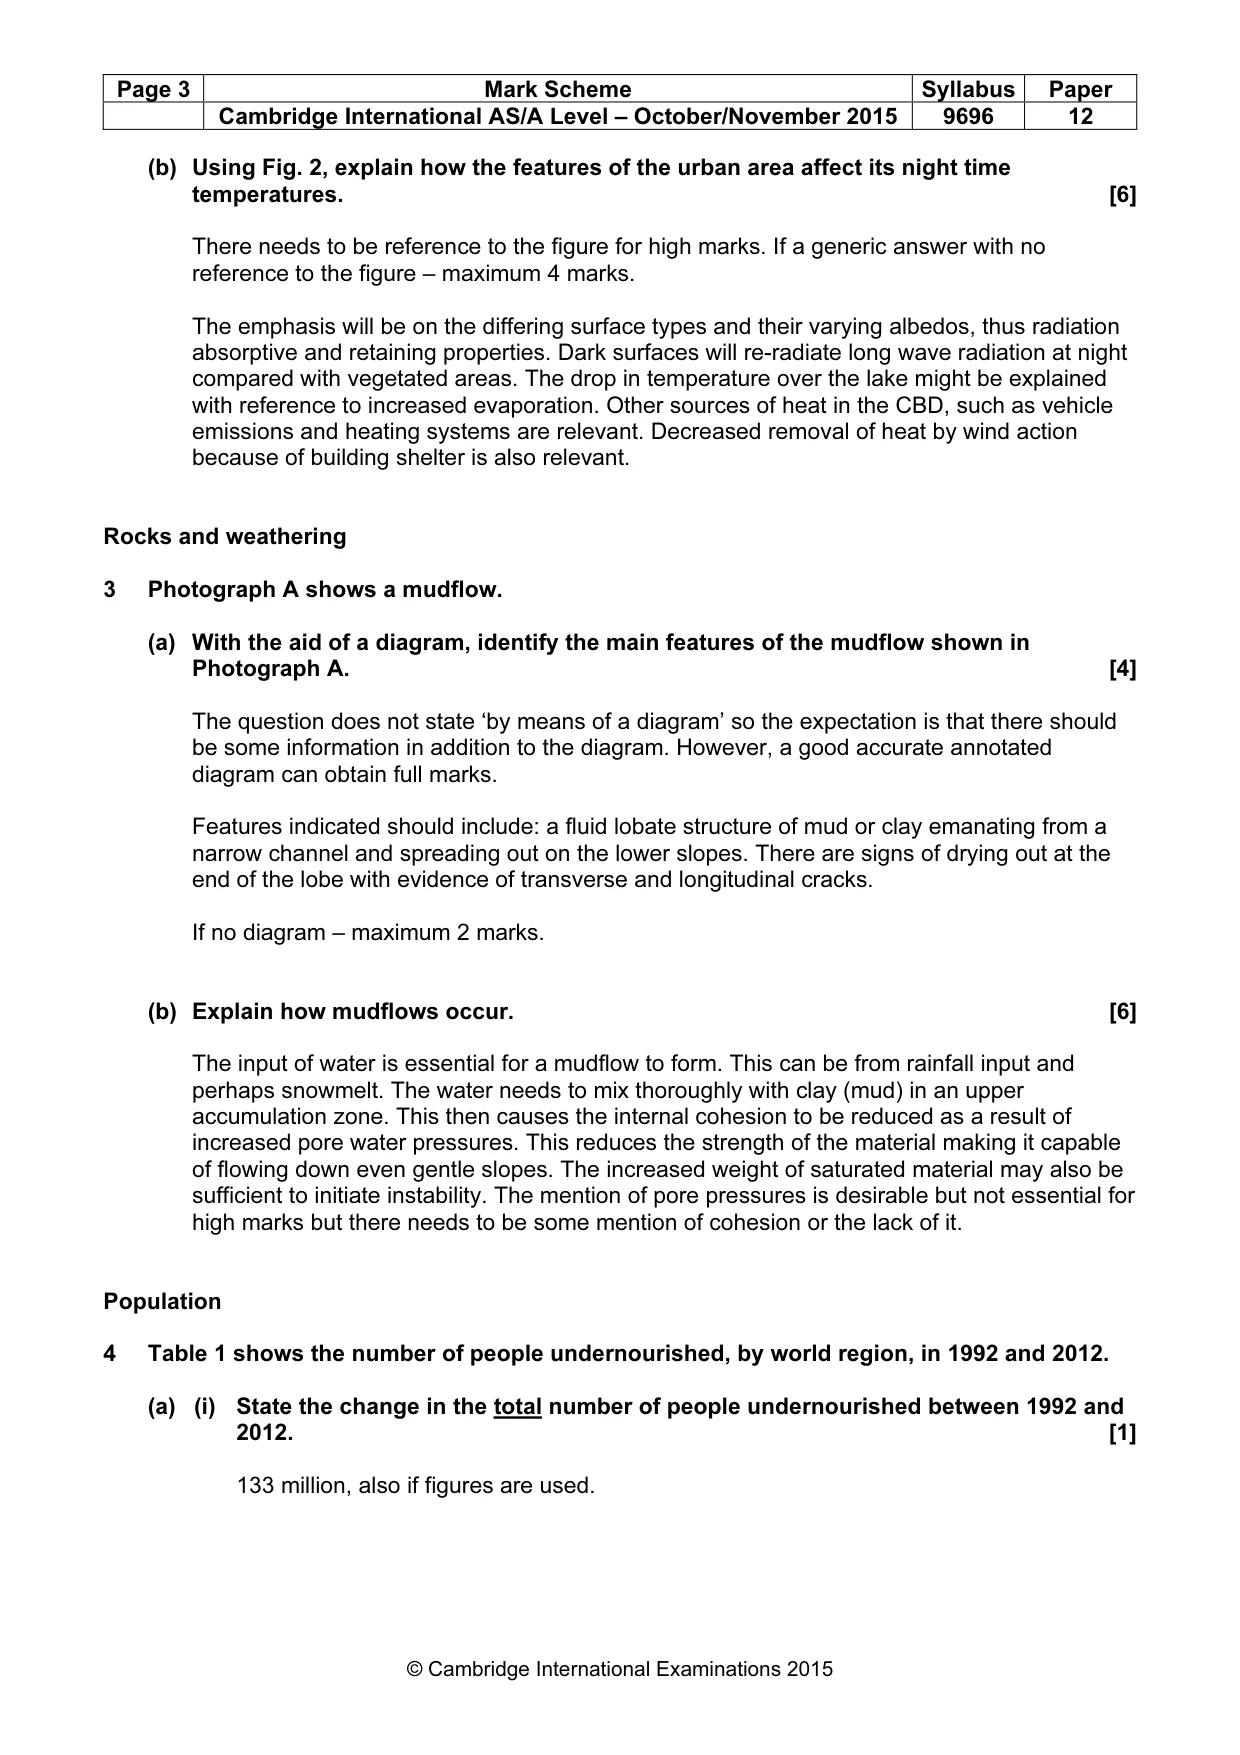
Mark scheme, page 2
Page 2 Mark Scheme Syllabus Paper Cambridge International AS/A Level – October/November 2015 9696 12 © Cambridge International Examinations 2015 Section A Hydrology and fluvial geomorphology 1 Fig. 1 shows a storm hydrograph. (a) Using Fig. 1, name the component labelled: (i) A; [1] Lag time (ii) B; [1] Base flow/groundwater flow. Needs flow for the mark (iii) C. [1] Peak discharge/peak flow (b) Briefly describe bankfull discharge. [2] The water level in a river that just reaches the top of the river bank (1). Any sensible development of the concept for the extra mark. (c) Explain two factors that may lead to a steep rising limb of a storm hydrograph. [5] These will be factors that lead to rapid and increased surface runoff, such as intense precipitation, impermeable or saturated soils, lack of interception, steep slopes, drainage basin shape and density. It is a factor of both water amount and speed of movement, so both should be emphasized for high marks. It is not just the speed of movement. The manner in which the factors interact and sometimes reinforce the effect should be mentioned for top marks rather than just a simple description of the factors. Mark 3/2 or 2/3 depending on detail. Atmosphere and weather 2 Fig. 2 shows night time temperatures across an urban area. (a) Using Fig. 2 state: (i) the highest temperature and its location; [2] 8–9 degrees and CBD (ii) the lowest temperature and its location. [2] 0–1 degrees and west suburban
Mark scheme, page 3
Page 3 Mark Scheme Syllabus Paper Cambridge International AS/A Level – October/November 2015 9696 12 © Cambridge International Examinations 2015 (b) Using Fig. 2, explain how the features of the urban area affect its night time temperatures. [6] There needs to be reference to the figure for high marks. If a generic answer with no reference to the figure – maximum 4 marks. The emphasis will be on the differing surface types and their varying albedos, thus radiation absorptive and retaining properties. Dark surfaces will re-radiate long wave radiation at night compared with vegetated areas. The drop in temperature over the lake might be explained with reference to increased evaporation. Other sources of heat in the CBD, such as vehicle emissions and heating systems are relevant. Decreased removal of heat by wind action because of building shelter is also relevant. Rocks and weathering 3 Photograph A shows a mudflow. (a) With the aid of a diagram, identify the main features of the mudflow shown in Photograph A. [4] The question does not state ‘by means of a diagram’ so the expectation is that there should be some information in addition to the diagram. However, a good accurate annotated diagram can obtain full marks. Features indicated should include: a fluid lobate structure of mud or clay emanating from a narrow channel and spreading out on the lower slopes. There are signs of drying out at the end of the lobe with evidence of transverse and longitudinal cracks. If no diagram – maximum 2 marks. (b) Explain how mudflows occur. [6] The input of water is essential for a mudflow to form. This can be from rainfall input and perhaps snowmelt. The water needs to mix thoroughly with clay (mud) in an upper accumulation zone. This then causes the internal cohesion to be reduced as a result of increased pore water pressures. This reduces the strength of the material making it capable of flowing down even gentle slopes. The increased weight of saturated material may also be sufficient to initiate instability. The mention of pore pressures is desirable but not essential for high marks but there needs to be some mention of cohesion or the lack of it. Population 4 Table 1 shows the number of people undernourished, by world region, in 1992 and 2012. (a) (i) State the change in the total number of people undernourished between 1992 and 2012. [1] 133 million, also if figures are used.
Mark scheme, page 4
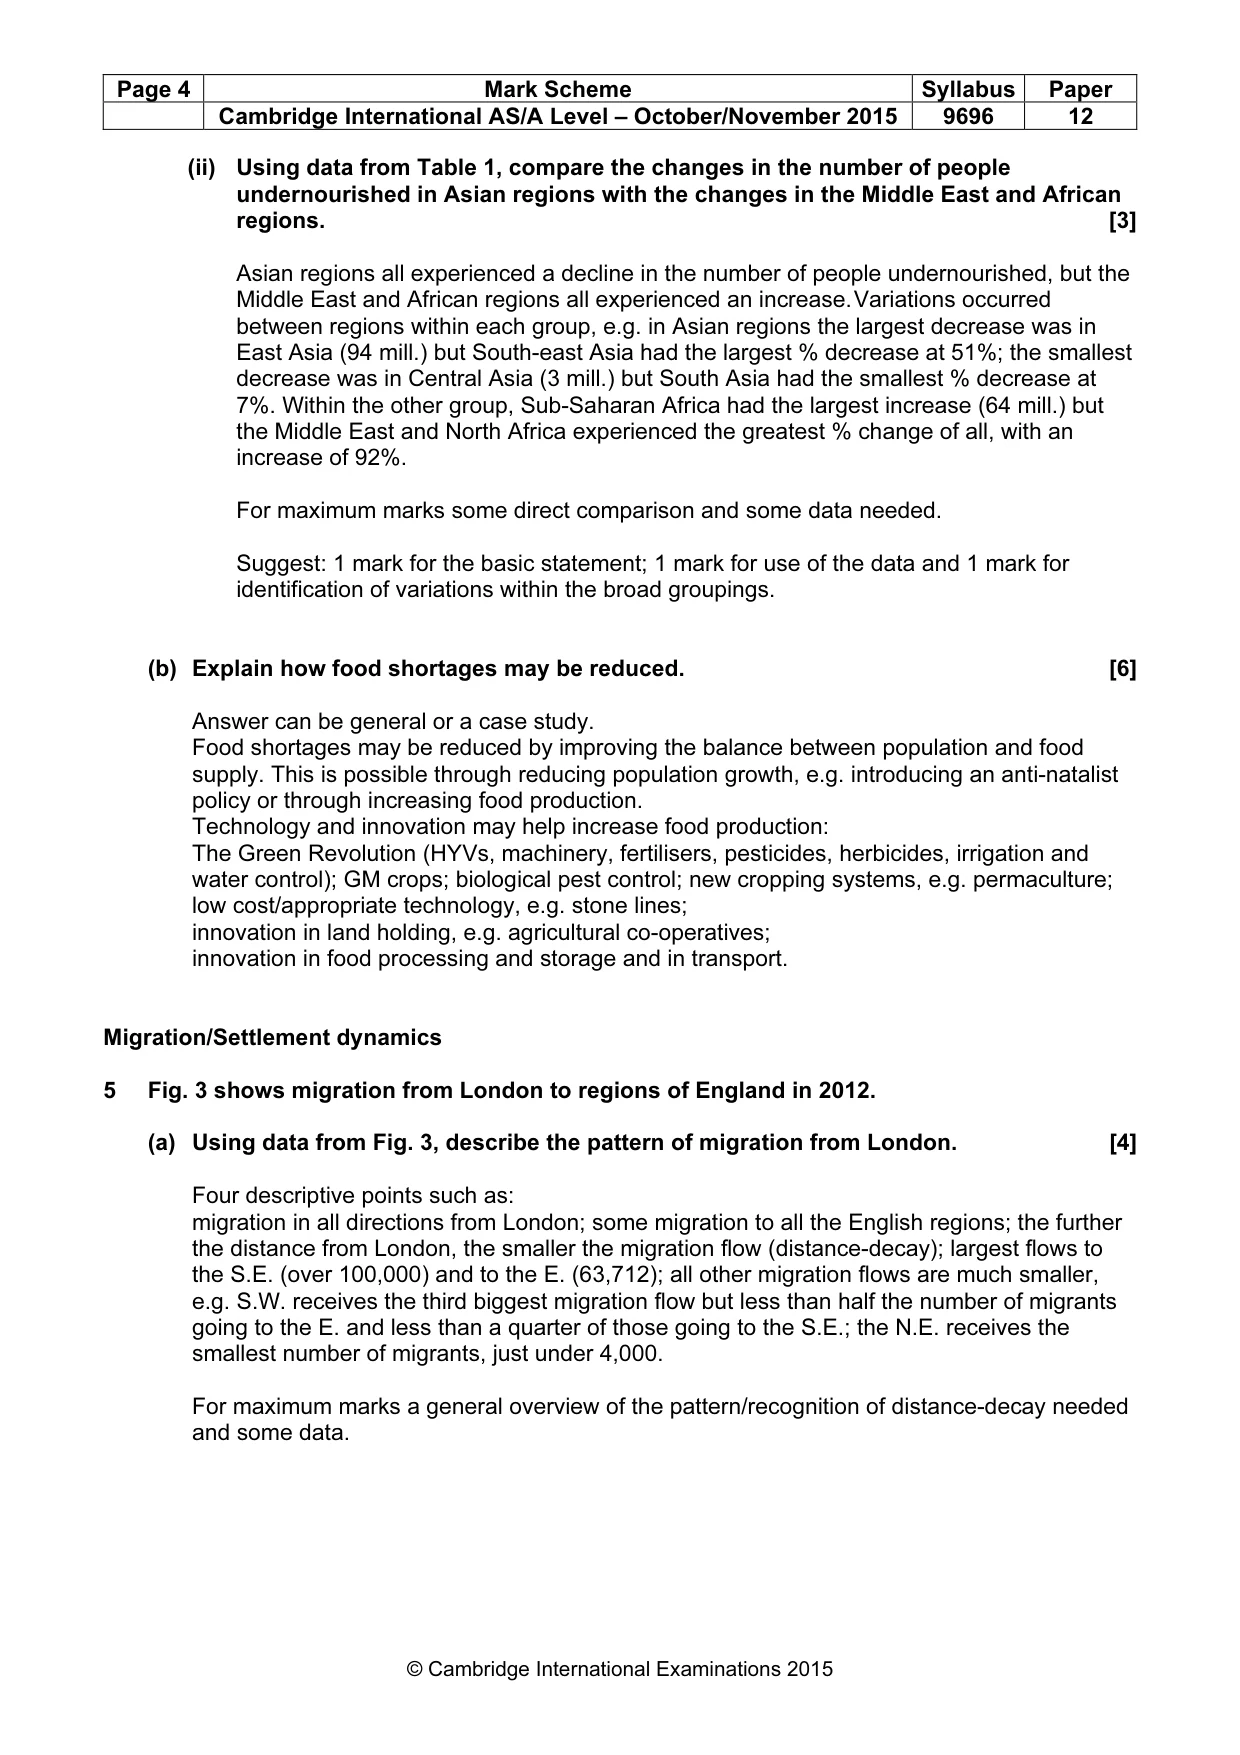
Page 4 Mark Scheme Syllabus Paper Cambridge International AS/A Level – October/November 2015 9696 12 © Cambridge International Examinations 2015 (ii) Using data from Table 1, compare the changes in the number of people undernourished in Asian regions with the changes in the Middle East and African regions. [3] Asian regions all experienced a decline in the number of people undernourished, but the Middle East and African regions all experienced an increase. Variations occurred between regions within each group, e.g. in Asian regions the largest decrease was in East Asia (94 mill.) but South-east Asia had the largest % decrease at 51%; the smallest decrease was in Central Asia (3 mill.) but South Asia had the smallest % decrease at 7%. Within the other group, Sub-Saharan Africa had the largest increase (64 mill.) but the Middle East and North Africa experienced the greatest % change of all, with an increase of 92%. For maximum marks some direct comparison and some data needed. Suggest: 1 mark for the basic statement; 1 mark for use of the data and 1 mark for identification of variations within the broad groupings. (b) Explain how food shortages may be reduced. [6] Answer can be general or a case study. Food shortages may be reduced by improving the balance between population and food supply. This is possible through reducing population growth, e.g. introducing an anti-natalist policy or through increasing food production. Technology and innovation may help increase food production: The Green Revolution (HYVs, machinery, fertilisers, pesticides, herbicides, irrigation and water control); GM crops; biological pest control; new cropping systems, e.g. permaculture; low cost/appropriate technology, e.g. stone lines; innovation in land holding, e.g. agricultural co-operatives; innovation in food processing and storage and in transport. Migration/Settlement dynamics 5 Fig. 3 shows migration from London to regions of England in 2012. (a) Using data from Fig. 3, describe the pattern of migration from London. [4] Four descriptive points such as: migration in all directions from London; some migration to all the English regions; the further the distance from London, the smaller the migration flow (distance-decay); largest flows to the S.E. (over 100,000) and to the E. (63,712); all other migration flows are much smaller, e.g. S.W. receives the third biggest migration flow but less than half the number of migrants going to the E. and less than a quarter of those going to the S.E.; the N.E. receives the smallest number of migrants, just under 4,000. For maximum marks a general overview of the pattern/recognition of distance-decay needed and some data.
Mark scheme, page 5
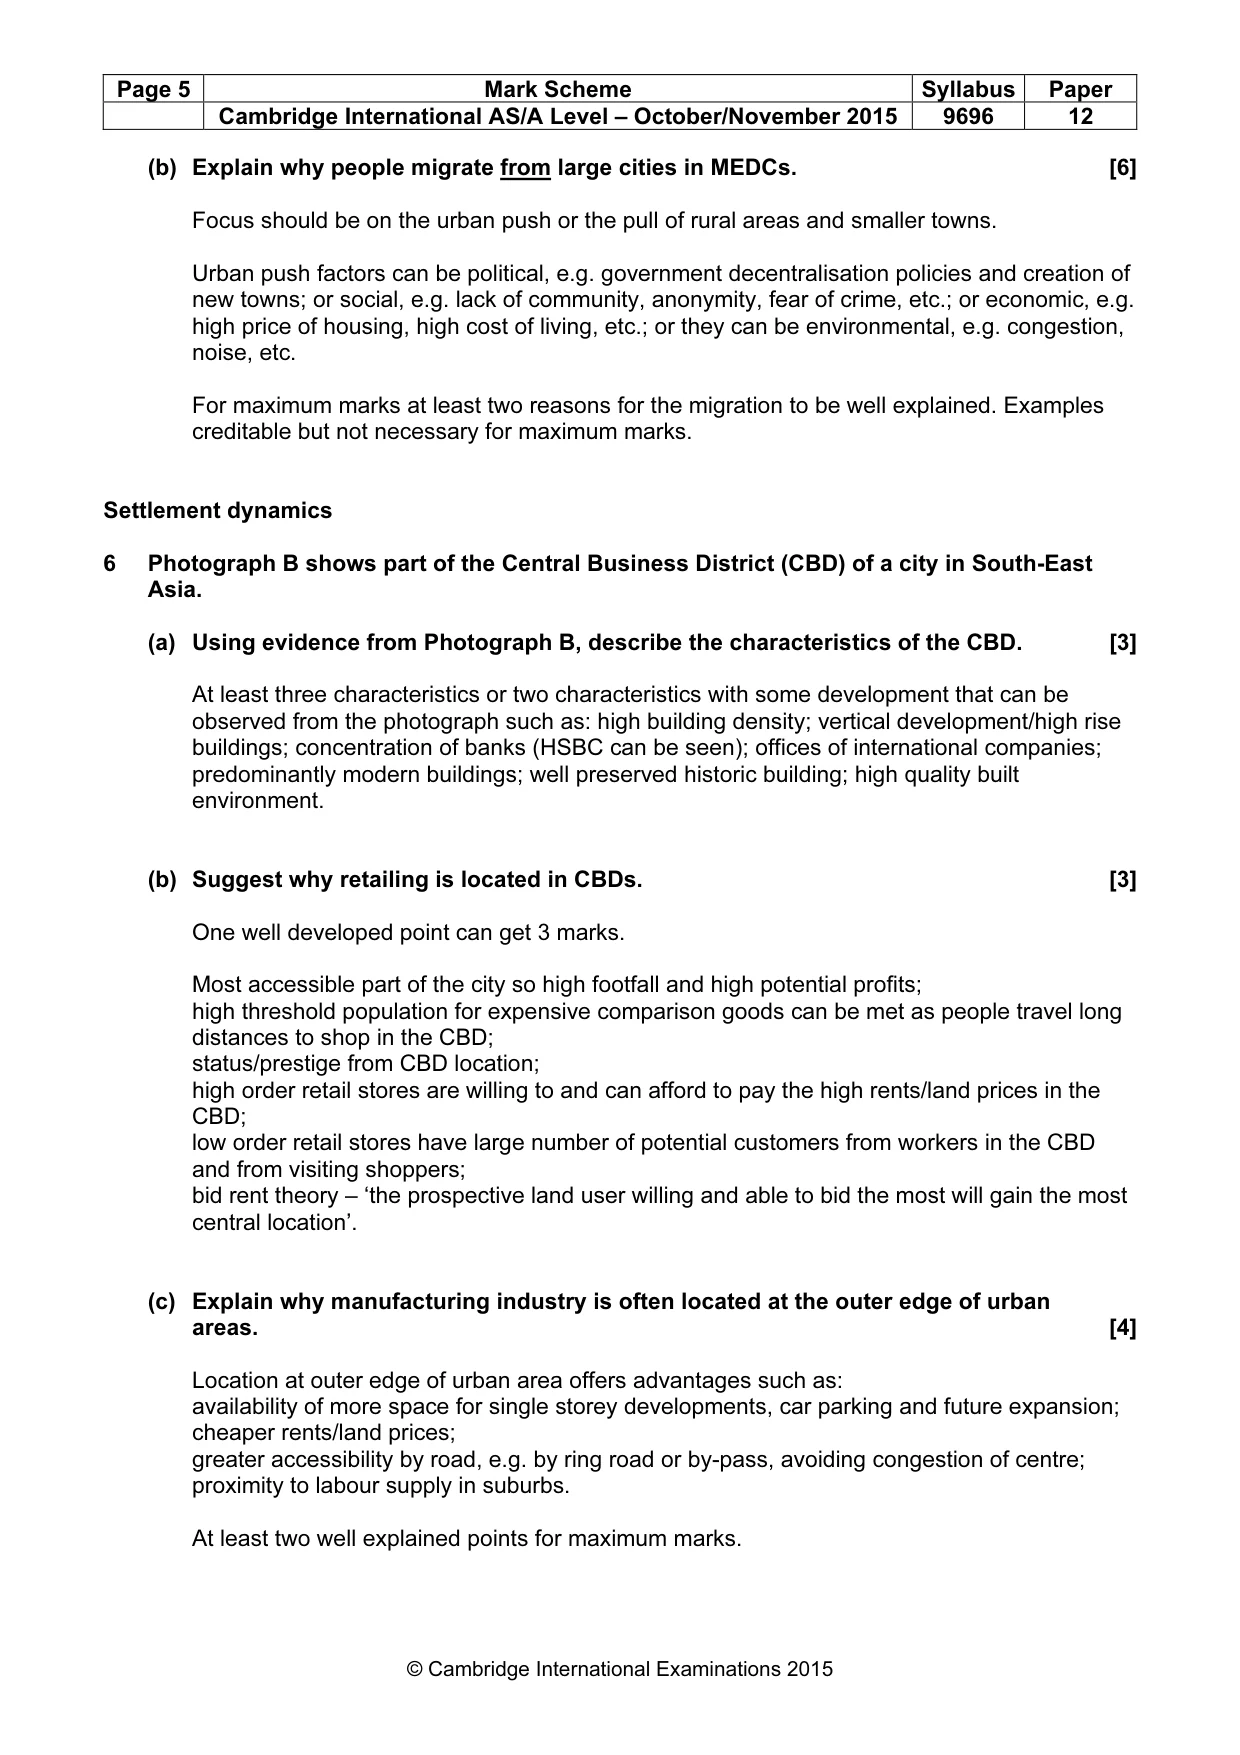
Page 5 Mark Scheme Syllabus Paper Cambridge International AS/A Level – October/November 2015 9696 12 © Cambridge International Examinations 2015 (b) Explain why people migrate from large cities in MEDCs. [6] Focus should be on the urban push or the pull of rural areas and smaller towns. Urban push factors can be political, e.g. government decentralisation policies and creation of new towns; or social, e.g. lack of community, anonymity, fear of crime, etc.; or economic, e.g. high price of housing, high cost of living, etc.; or they can be environmental, e.g. congestion, noise, etc. For maximum marks at least two reasons for the migration to be well explained. Examples creditable but not necessary for maximum marks. Settlement dynamics 6 Photograph B shows part of the Central Business District (CBD) of a city in South-East Asia. (a) Using evidence from Photograph B, describe the characteristics of the CBD. [3] At least three characteristics or two characteristics with some development that can be observed from the photograph such as: high building density; vertical development/high rise buildings; concentration of banks (HSBC can be seen); offices of international companies; predominantly modern buildings; well preserved historic building; high quality built environment. (b) Suggest why retailing is located in CBDs. [3] One well developed point can get 3 marks. Most accessible part of the city so high footfall and high potential profits; high threshold population for expensive comparison goods can be met as people travel long distances to shop in the CBD; status/prestige from CBD location; high order retail stores are willing to and can afford to pay the high rents/land prices in the CBD; low order retail stores have large number of potential customers from workers in the CBD and from visiting shoppers; bid rent theory – ‘the prospective land user willing and able to bid the most will gain the most central location’. (c) Explain why manufacturing industry is often located at the outer edge of urban areas. [4] Location at outer edge of urban area offers advantages such as: availability of more space for single storey developments, car parking and future expansion; cheaper rents/land prices; greater accessibility by road, e.g. by ring road or by-pass, avoiding congestion of centre; proximity to labour supply in suburbs. At least two well explained points for maximum marks.
Mark scheme, page 6
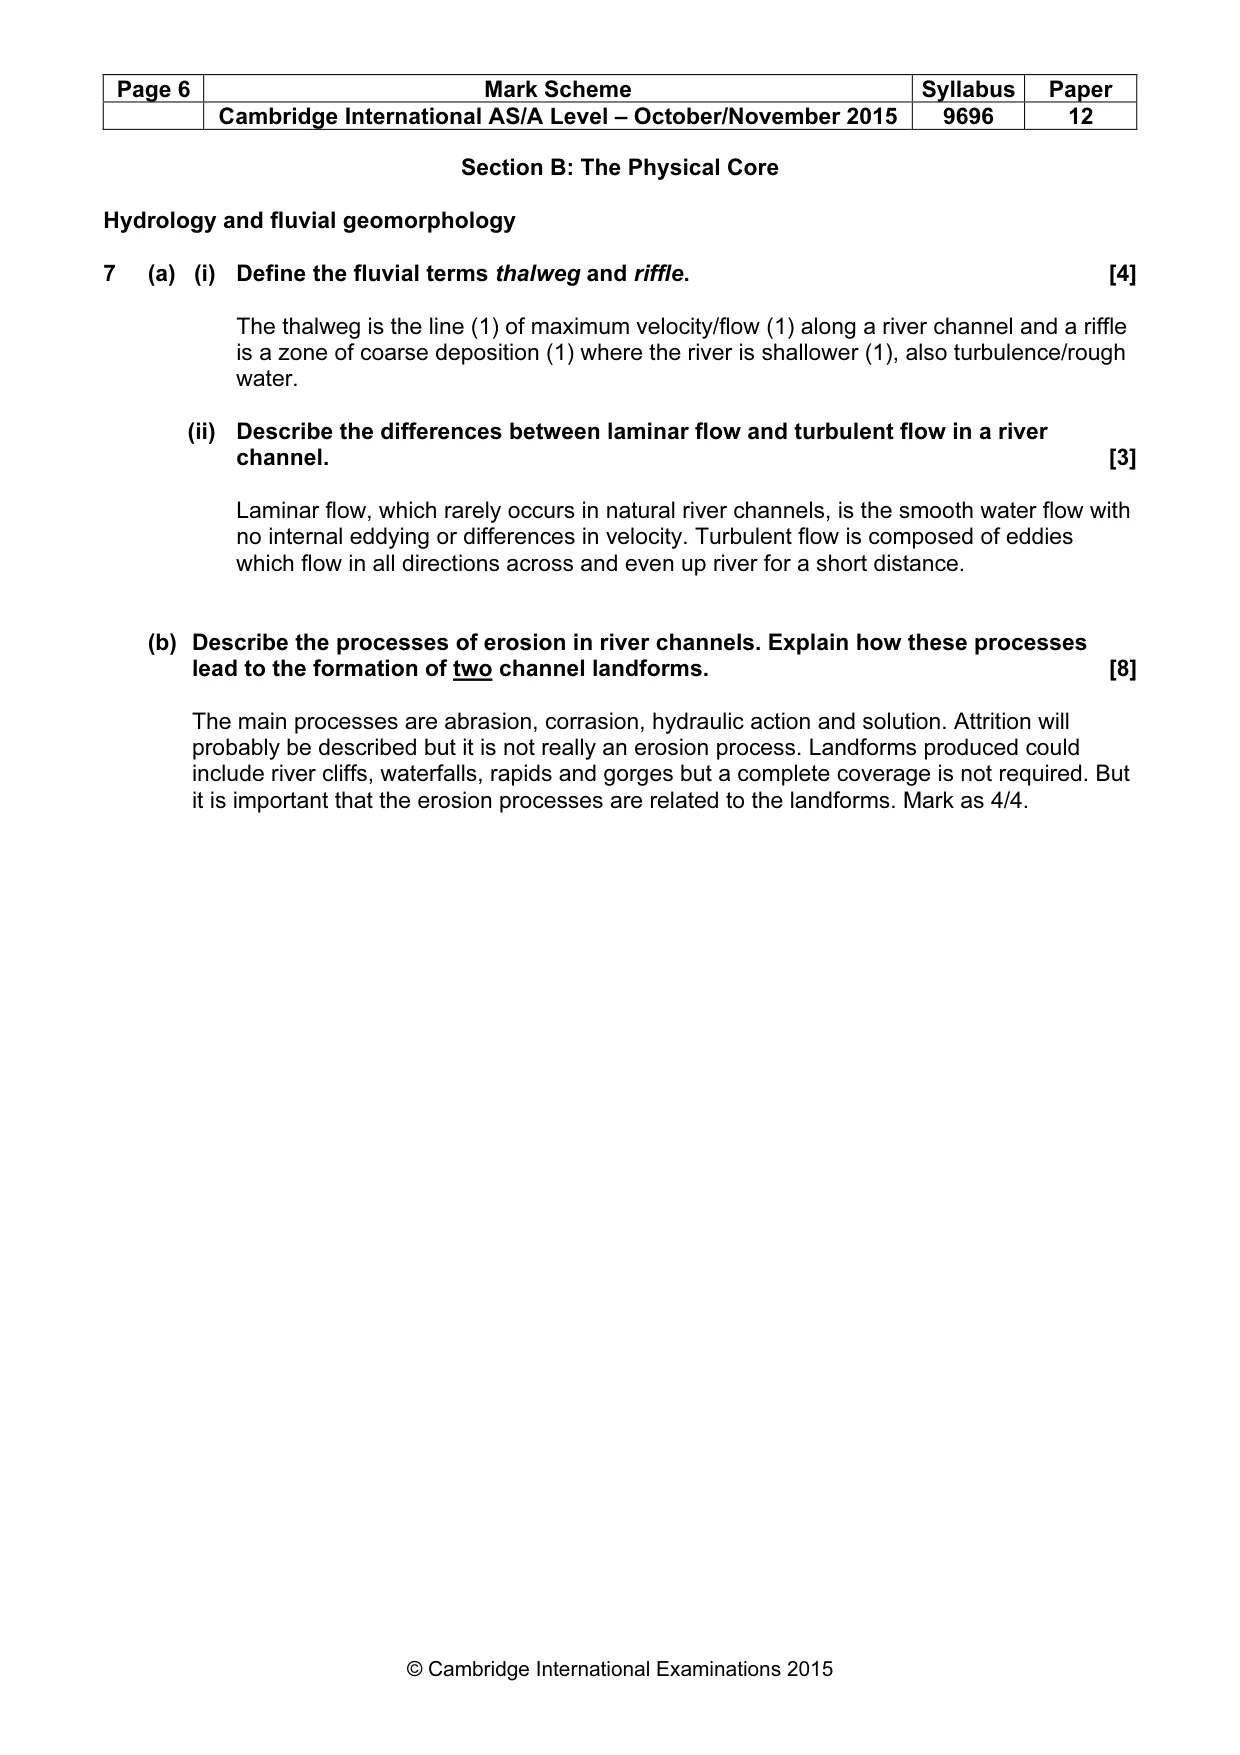
Page 6 Mark Scheme Syllabus Paper Cambridge International AS/A Level – October/November 2015 9696 12 © Cambridge International Examinations 2015 Section B: The Physical Core Hydrology and fluvial geomorphology 7 (a) (i) Define the fluvial terms thalweg and riffle. [4] The thalweg is the line (1) of maximum velocity/flow (1) along a river channel and a riffle is a zone of coarse deposition (1) where the river is shallower (1), also turbulence/rough water. (ii) Describe the differences between laminar flow and turbulent flow in a river channel. [3] Laminar flow, which rarely occurs in natural river channels, is the smooth water flow with no internal eddying or differences in velocity. Turbulent flow is composed of eddies which flow in all directions across and even up river for a short distance. (b) Describe the processes of erosion in river channels. Explain how these processes lead to the formation of two channel landforms. [8] The main processes are abrasion, corrasion, hydraulic action and solution. Attrition will probably be described but it is not really an erosion process. Landforms produced could include river cliffs, waterfalls, rapids and gorges but a complete coverage is not required. But it is important that the erosion processes are related to the landforms. Mark as 4/4.
Mark scheme, page 7
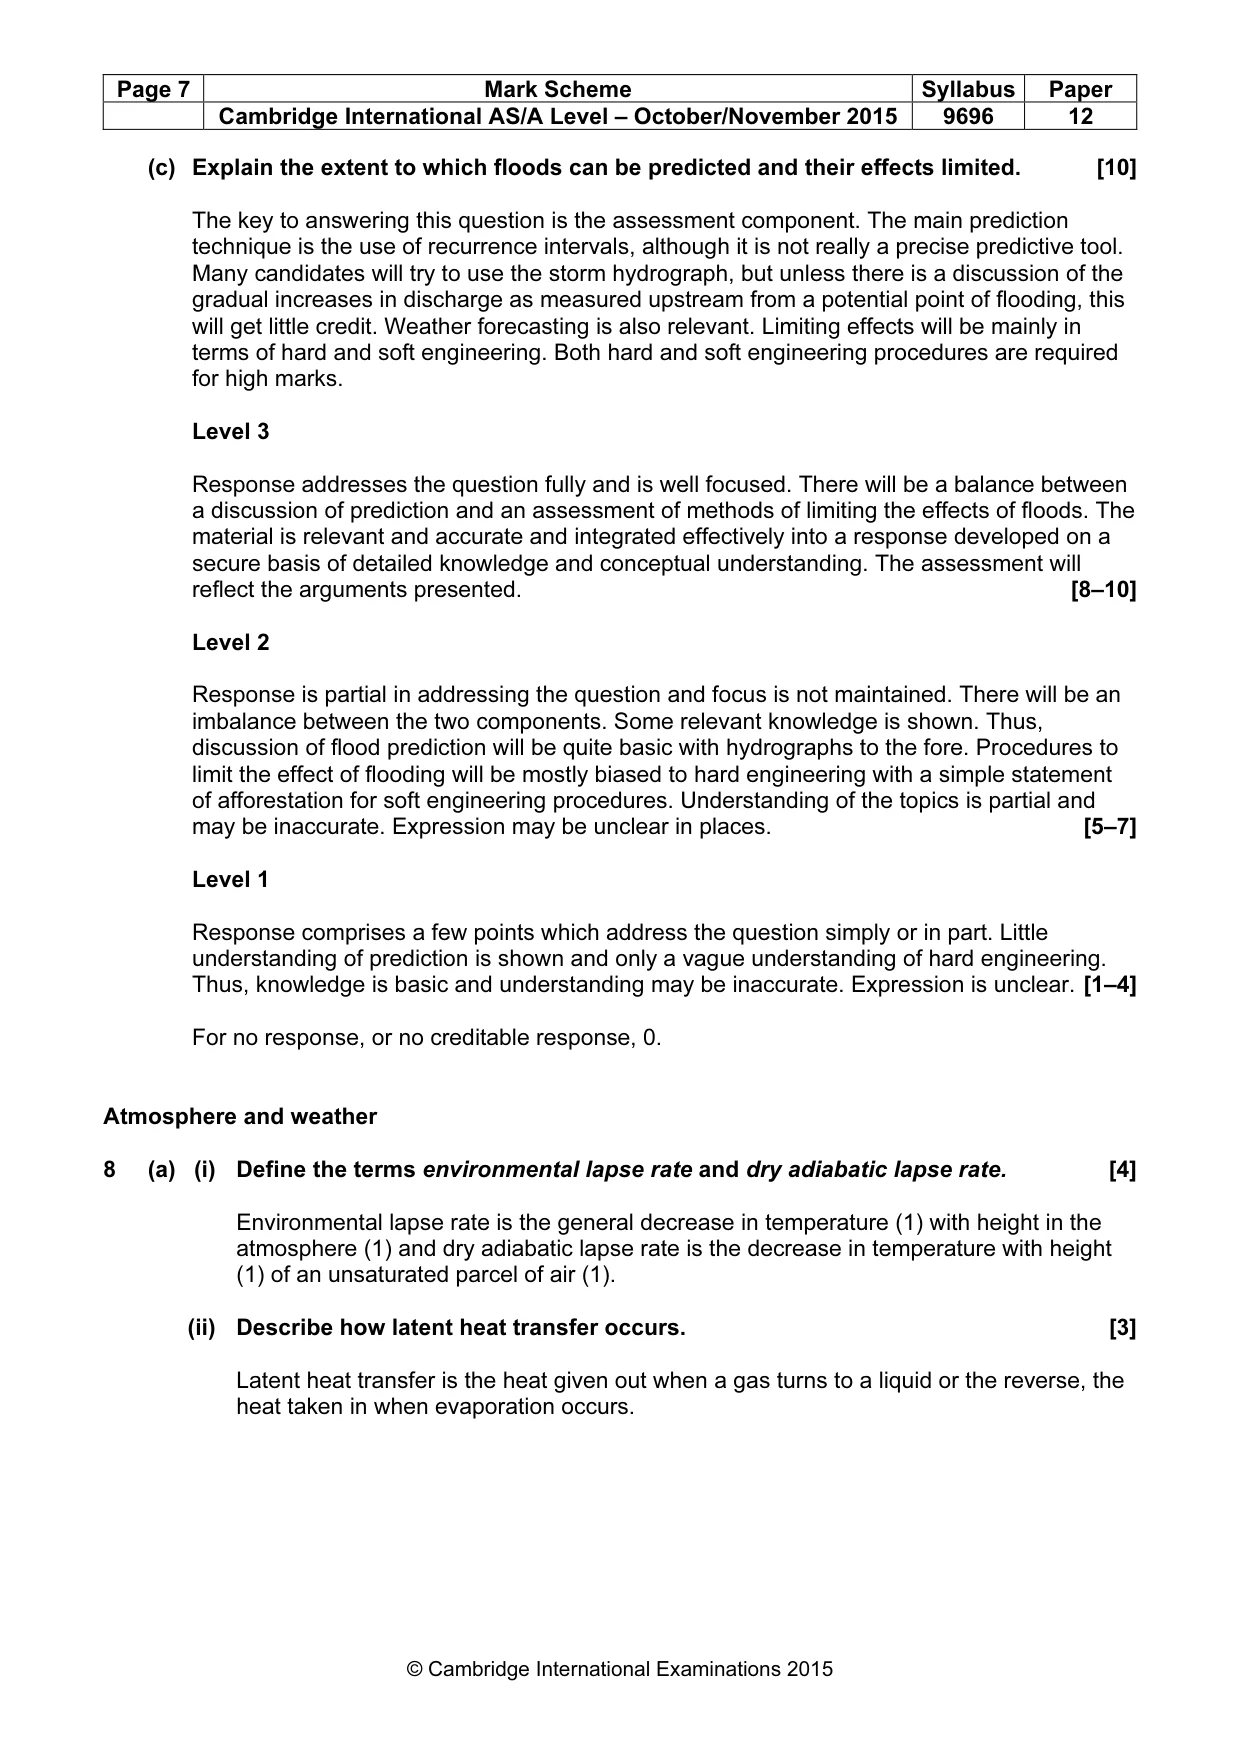
Page 7 Mark Scheme Syllabus Paper Cambridge International AS/A Level – October/November 2015 9696 12 © Cambridge International Examinations 2015 (c) Explain the extent to which floods can be predicted and their effects limited. [10] The key to answering this question is the assessment component. The main prediction technique is the use of recurrence intervals, although it is not really a precise predictive tool. Many candidates will try to use the storm hydrograph, but unless there is a discussion of the gradual increases in discharge as measured upstream from a potential point of flooding, this will get little credit. Weather forecasting is also relevant. Limiting effects will be mainly in terms of hard and soft engineering. Both hard and soft engineering procedures are required for high marks. Level 3 Response addresses the question fully and is well focused. There will be a balance between a discussion of prediction and an assessment of methods of limiting the effects of floods. The material is relevant and accurate and integrated effectively into a response developed on a secure basis of detailed knowledge and conceptual understanding. The assessment will reflect the arguments presented. [8–10] Level 2 Response is partial in addressing the question and focus is not maintained. There will be an imbalance between the two components. Some relevant knowledge is shown. Thus, discussion of flood prediction will be quite basic with hydrographs to the fore. Procedures to limit the effect of flooding will be mostly biased to hard engineering with a simple statement of afforestation for soft engineering procedures. Understanding of the topics is partial and may be inaccurate. Expression may be unclear in places. [5–7] Level 1 Response comprises a few points which address the question simply or in part. Little understanding of prediction is shown and only a vague understanding of hard engineering. Thus, knowledge is basic and understanding may be inaccurate. Expression is unclear. [1–4] For no response, or no creditable response, 0. Atmosphere and weather 8 (a) (i) Define the terms environmental lapse rate and dry adiabatic lapse rate. [4] Environmental lapse rate is the general decrease in temperature (1) with height in the atmosphere (1) and dry adiabatic lapse rate is the decrease in temperature with height (1) of an unsaturated parcel of air (1). (ii) Describe how latent heat transfer occurs. [3] Latent heat transfer is the heat given out when a gas turns to a liquid or the reverse, the heat taken in when evaporation occurs.
Mark scheme, page 8
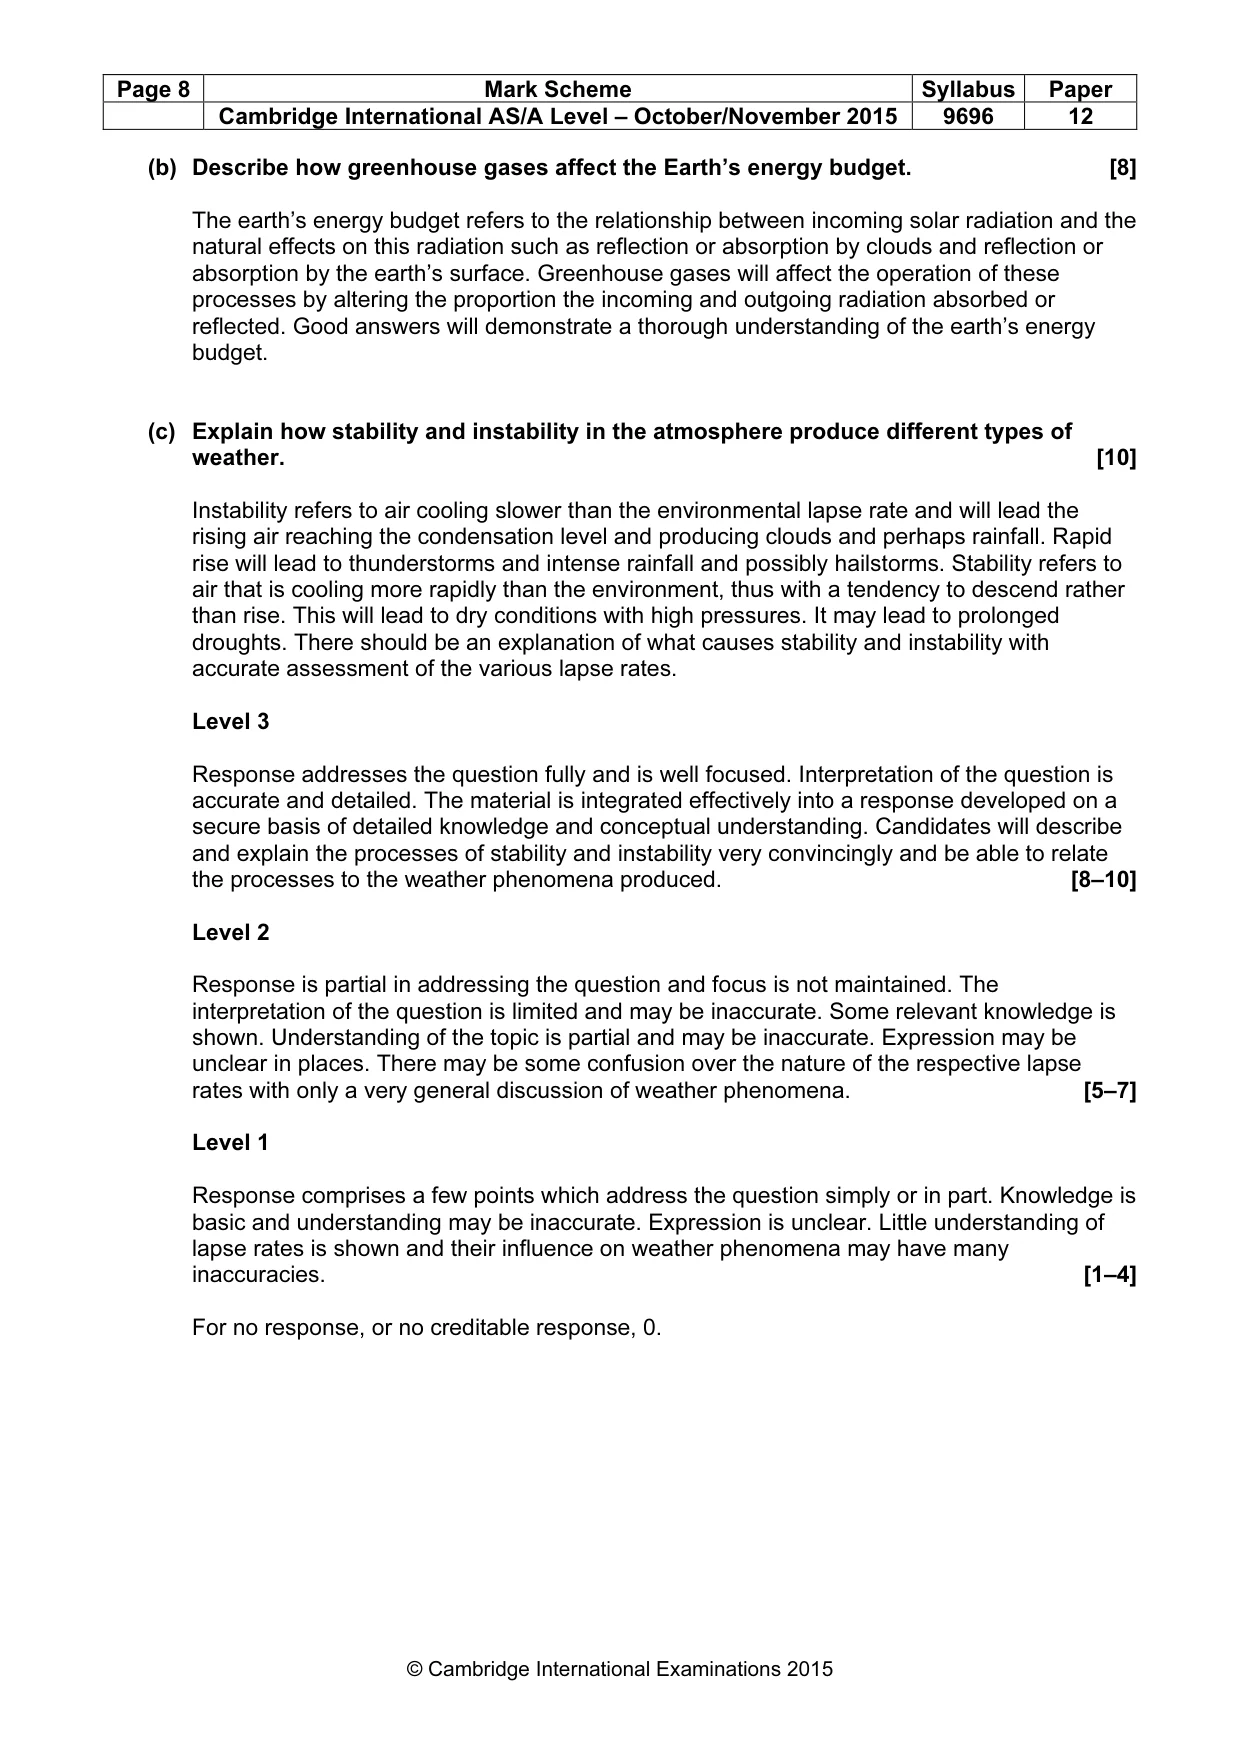
Page 8 Mark Scheme Syllabus Paper Cambridge International AS/A Level – October/November 2015 9696 12 © Cambridge International Examinations 2015 (b) Describe how greenhouse gases affect the Earth’s energy budget. [8] The earth’s energy budget refers to the relationship between incoming solar radiation and the natural effects on this radiation such as reflection or absorption by clouds and reflection or absorption by the earth’s surface. Greenhouse gases will affect the operation of these processes by altering the proportion the incoming and outgoing radiation absorbed or reflected. Good answers will demonstrate a thorough understanding of the earth’s energy budget. (c) Explain how stability and instability in the atmosphere produce different types of weather. [10] Instability refers to air cooling slower than the environmental lapse rate and will lead the rising air reaching the condensation level and producing clouds and perhaps rainfall. Rapid rise will lead to thunderstorms and intense rainfall and possibly hailstorms. Stability refers to air that is cooling more rapidly than the environment, thus with a tendency to descend rather than rise. This will lead to dry conditions with high pressures. It may lead to prolonged droughts. There should be an explanation of what causes stability and instability with accurate assessment of the various lapse rates. Level 3 Response addresses the question fully and is well focused. Interpretation of the question is accurate and detailed. The material is integrated effectively into a response developed on a secure basis of detailed knowledge and conceptual understanding. Candidates will describe and explain the processes of stability and instability very convincingly and be able to relate the processes to the weather phenomena produced. [8–10] Level 2 Response is partial in addressing the question and focus is not maintained. The interpretation of the question is limited and may be inaccurate. Some relevant knowledge is shown. Understanding of the topic is partial and may be inaccurate. Expression may be unclear in places. There may be some confusion over the nature of the respective lapse rates with only a very general discussion of weather phenomena. [5–7] Level 1 Response comprises a few points which address the question simply or in part. Knowledge is basic and understanding may be inaccurate. Expression is unclear. Little understanding of lapse rates is shown and their influence on weather phenomena may have many inaccuracies. [1–4] For no response, or no creditable response, 0.
Mark scheme, page 9
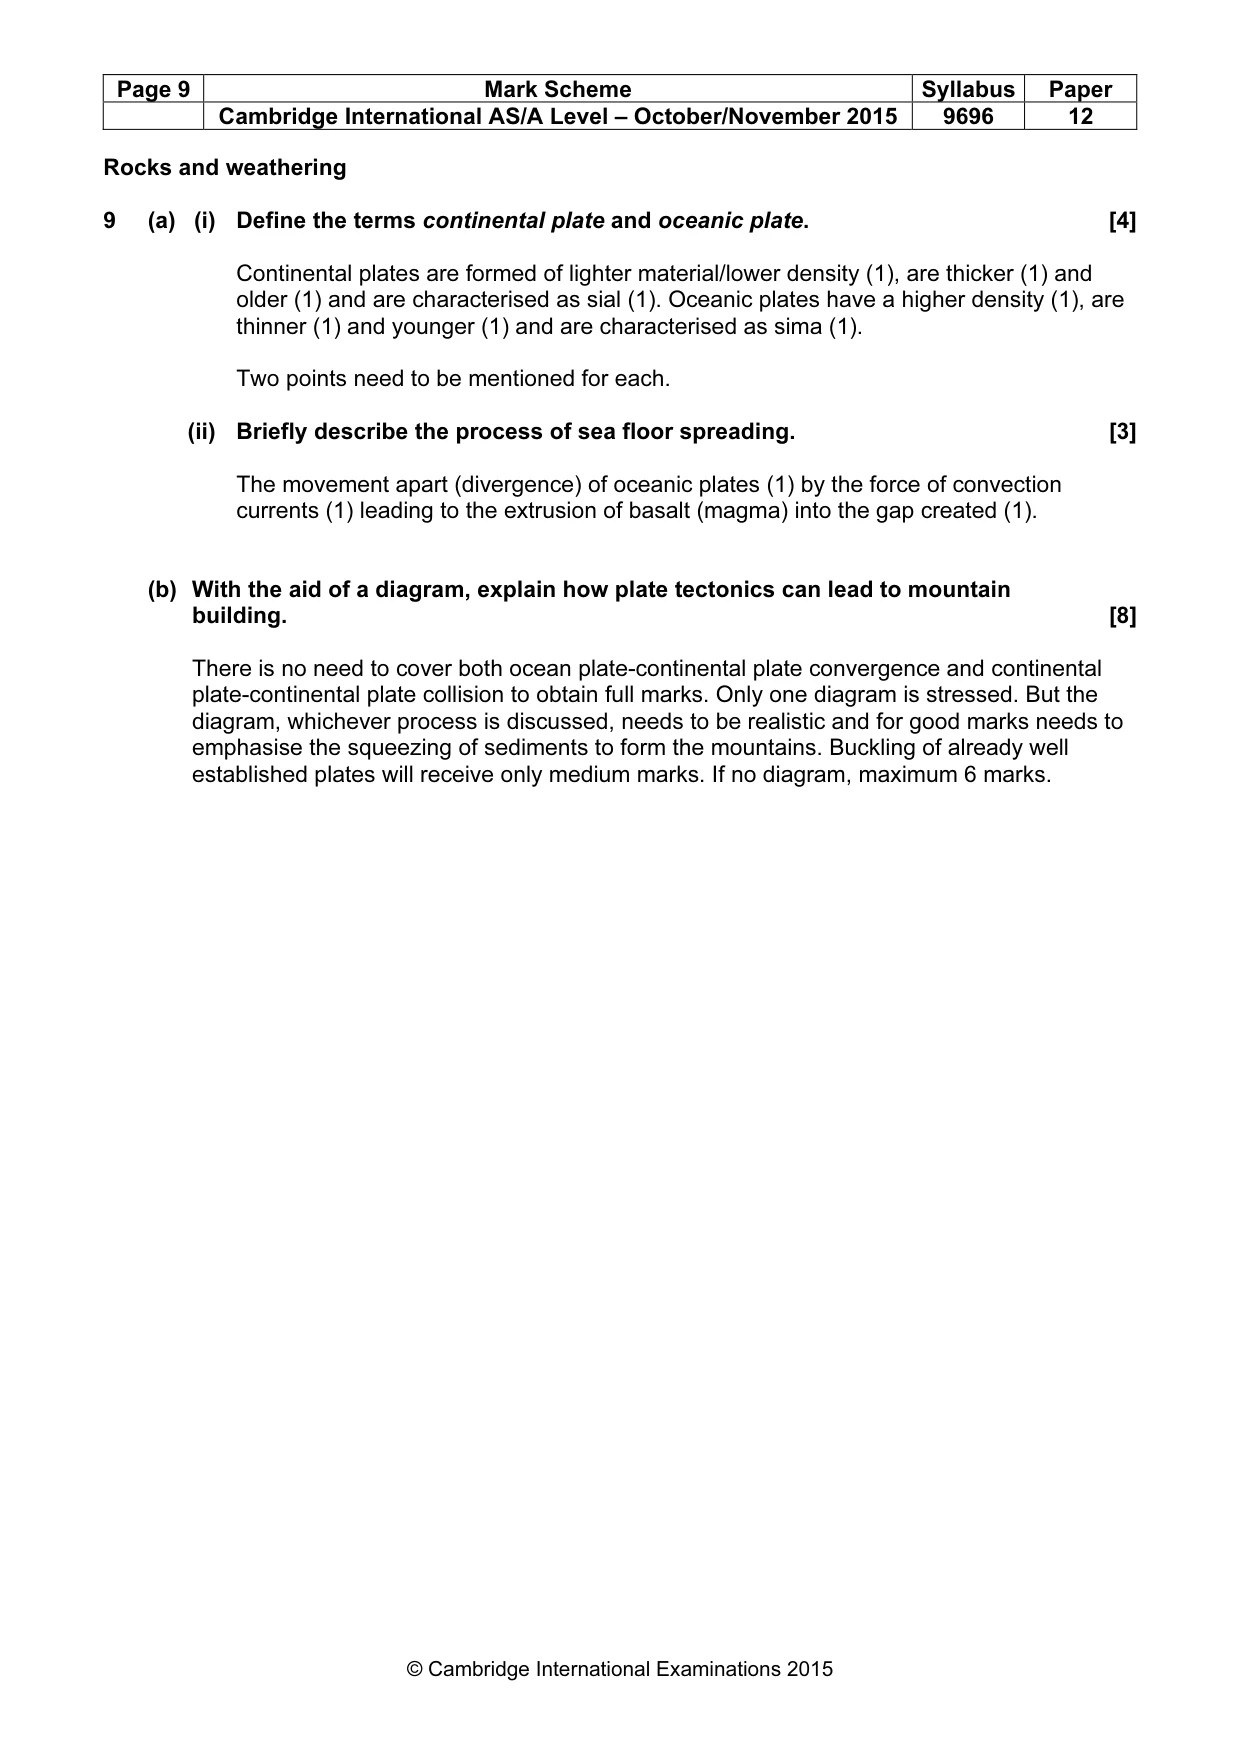
Page 9 Mark Scheme Syllabus Paper Cambridge International AS/A Level – October/November 2015 9696 12 © Cambridge International Examinations 2015 Rocks and weathering 9 (a) (i) Define the terms continental plate and oceanic plate. [4] Continental plates are formed of lighter material/lower density (1), are thicker (1) and older (1) and are characterised as sial (1). Oceanic plates have a higher density (1), are thinner (1) and younger (1) and are characterised as sima (1). Two points need to be mentioned for each. (ii) Briefly describe the process of sea floor spreading. [3] The movement apart (divergence) of oceanic plates (1) by the force of convection currents (1) leading to the extrusion of basalt (magma) into the gap created (1). (b) With the aid of a diagram, explain how plate tectonics can lead to mountain building. [8] There is no need to cover both ocean plate-continental plate convergence and continental plate-continental plate collision to obtain full marks. Only one diagram is stressed. But the diagram, whichever process is discussed, needs to be realistic and for good marks needs to emphasise the squeezing of sediments to form the mountains. Buckling of already well established plates will receive only medium marks. If no diagram, maximum 6 marks.
Mark scheme, page 10
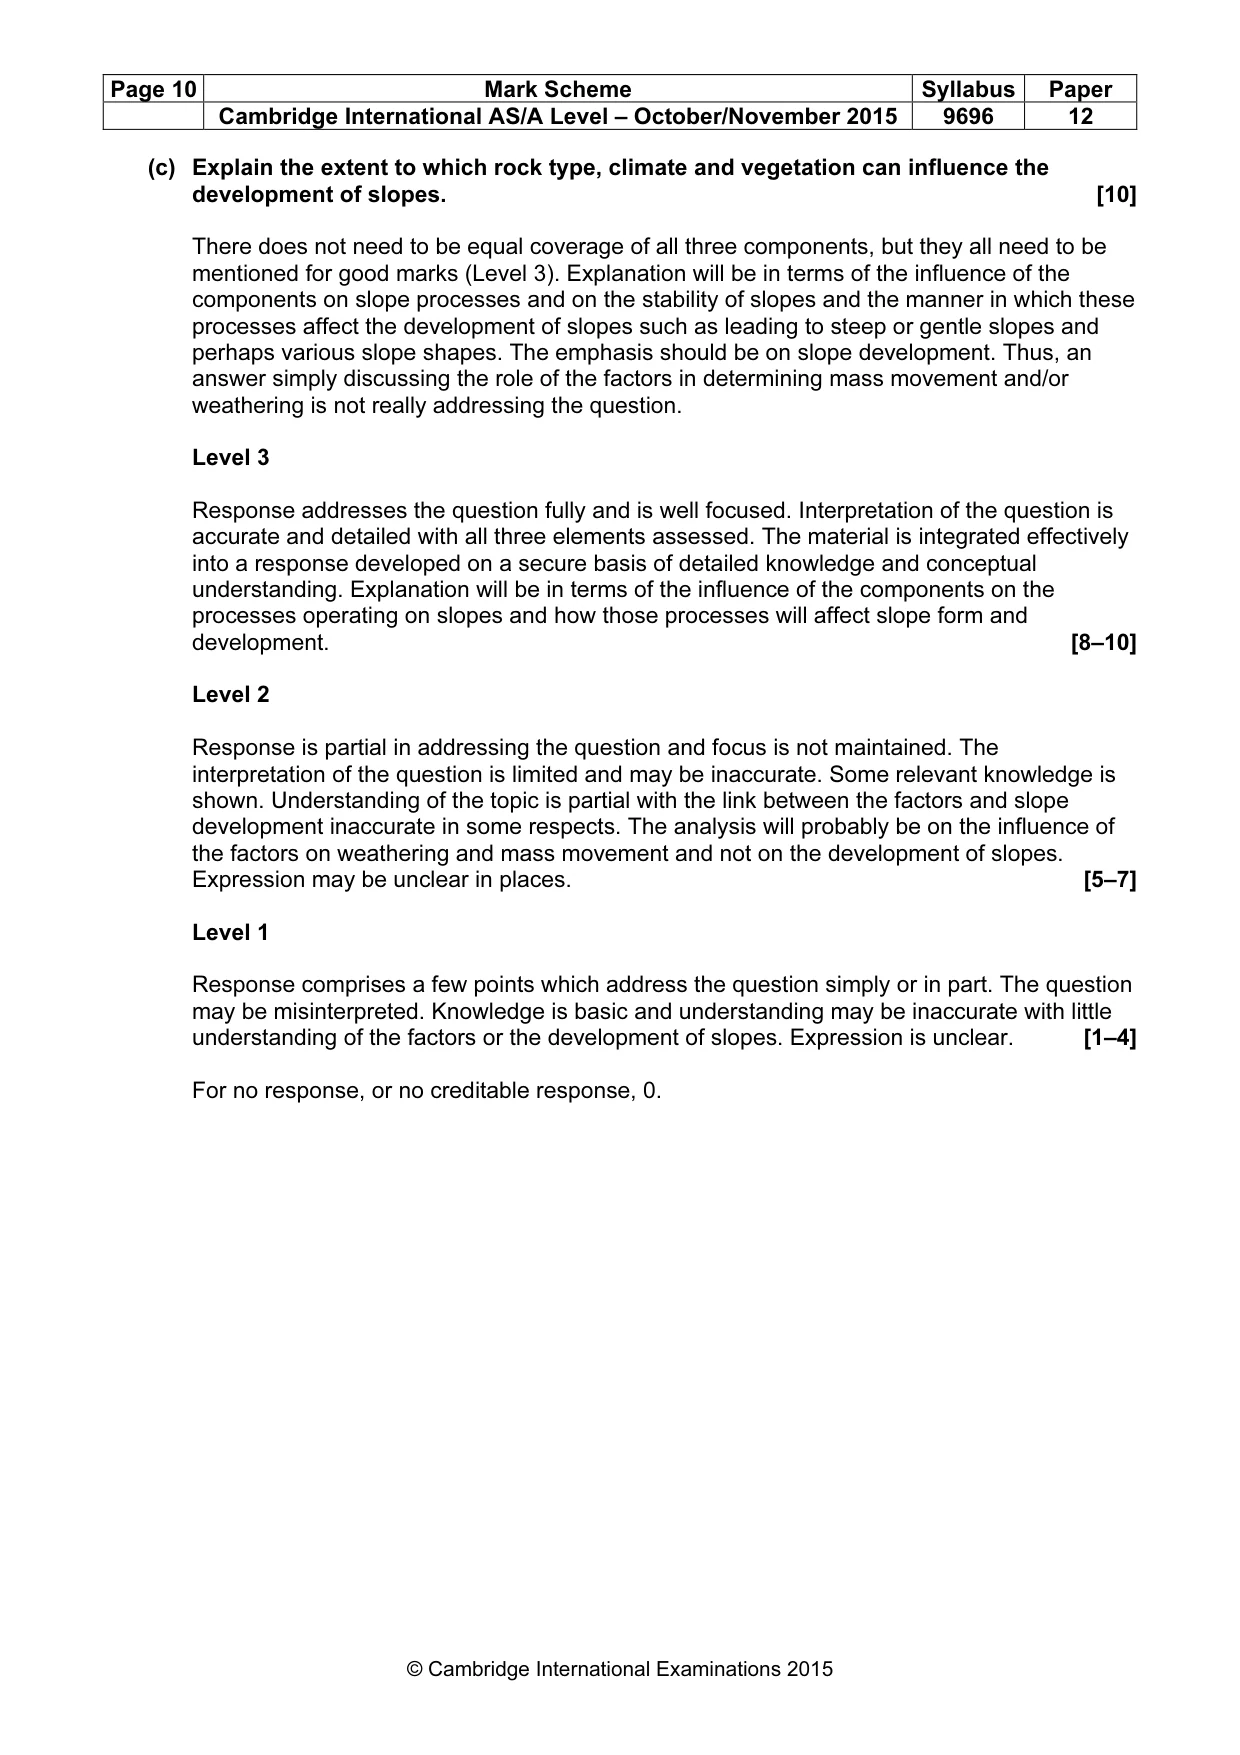
Page 10 Mark Scheme Syllabus Paper Cambridge International AS/A Level – October/November 2015 9696 12 © Cambridge International Examinations 2015 (c) Explain the extent to which rock type, climate and vegetation can influence the development of slopes. [10] There does not need to be equal coverage of all three components, but they all need to be mentioned for good marks (Level 3). Explanation will be in terms of the influence of the components on slope processes and on the stability of slopes and the manner in which these processes affect the development of slopes such as leading to steep or gentle slopes and perhaps various slope shapes. The emphasis should be on slope development. Thus, an answer simply discussing the role of the factors in determining mass movement and/or weathering is not really addressing the question. Level 3 Response addresses the question fully and is well focused. Interpretation of the question is accurate and detailed with all three elements assessed. The material is integrated effectively into a response developed on a secure basis of detailed knowledge and conceptual understanding. Explanation will be in terms of the influence of the components on the processes operating on slopes and how those processes will affect slope form and development. [8–10] Level 2 Response is partial in addressing the question and focus is not maintained. The interpretation of the question is limited and may be inaccurate. Some relevant knowledge is shown. Understanding of the topic is partial with the link between the factors and slope development inaccurate in some respects. The analysis will probably be on the influence of the factors on weathering and mass movement and not on the development of slopes. Expression may be unclear in places. [5–7] Level 1 Response comprises a few points which address the question simply or in part. The question may be misinterpreted. Knowledge is basic and understanding may be inaccurate with little understanding of the factors or the development of slopes. Expression is unclear. [1–4] For no response, or no creditable response, 0.
Mark scheme, page 11
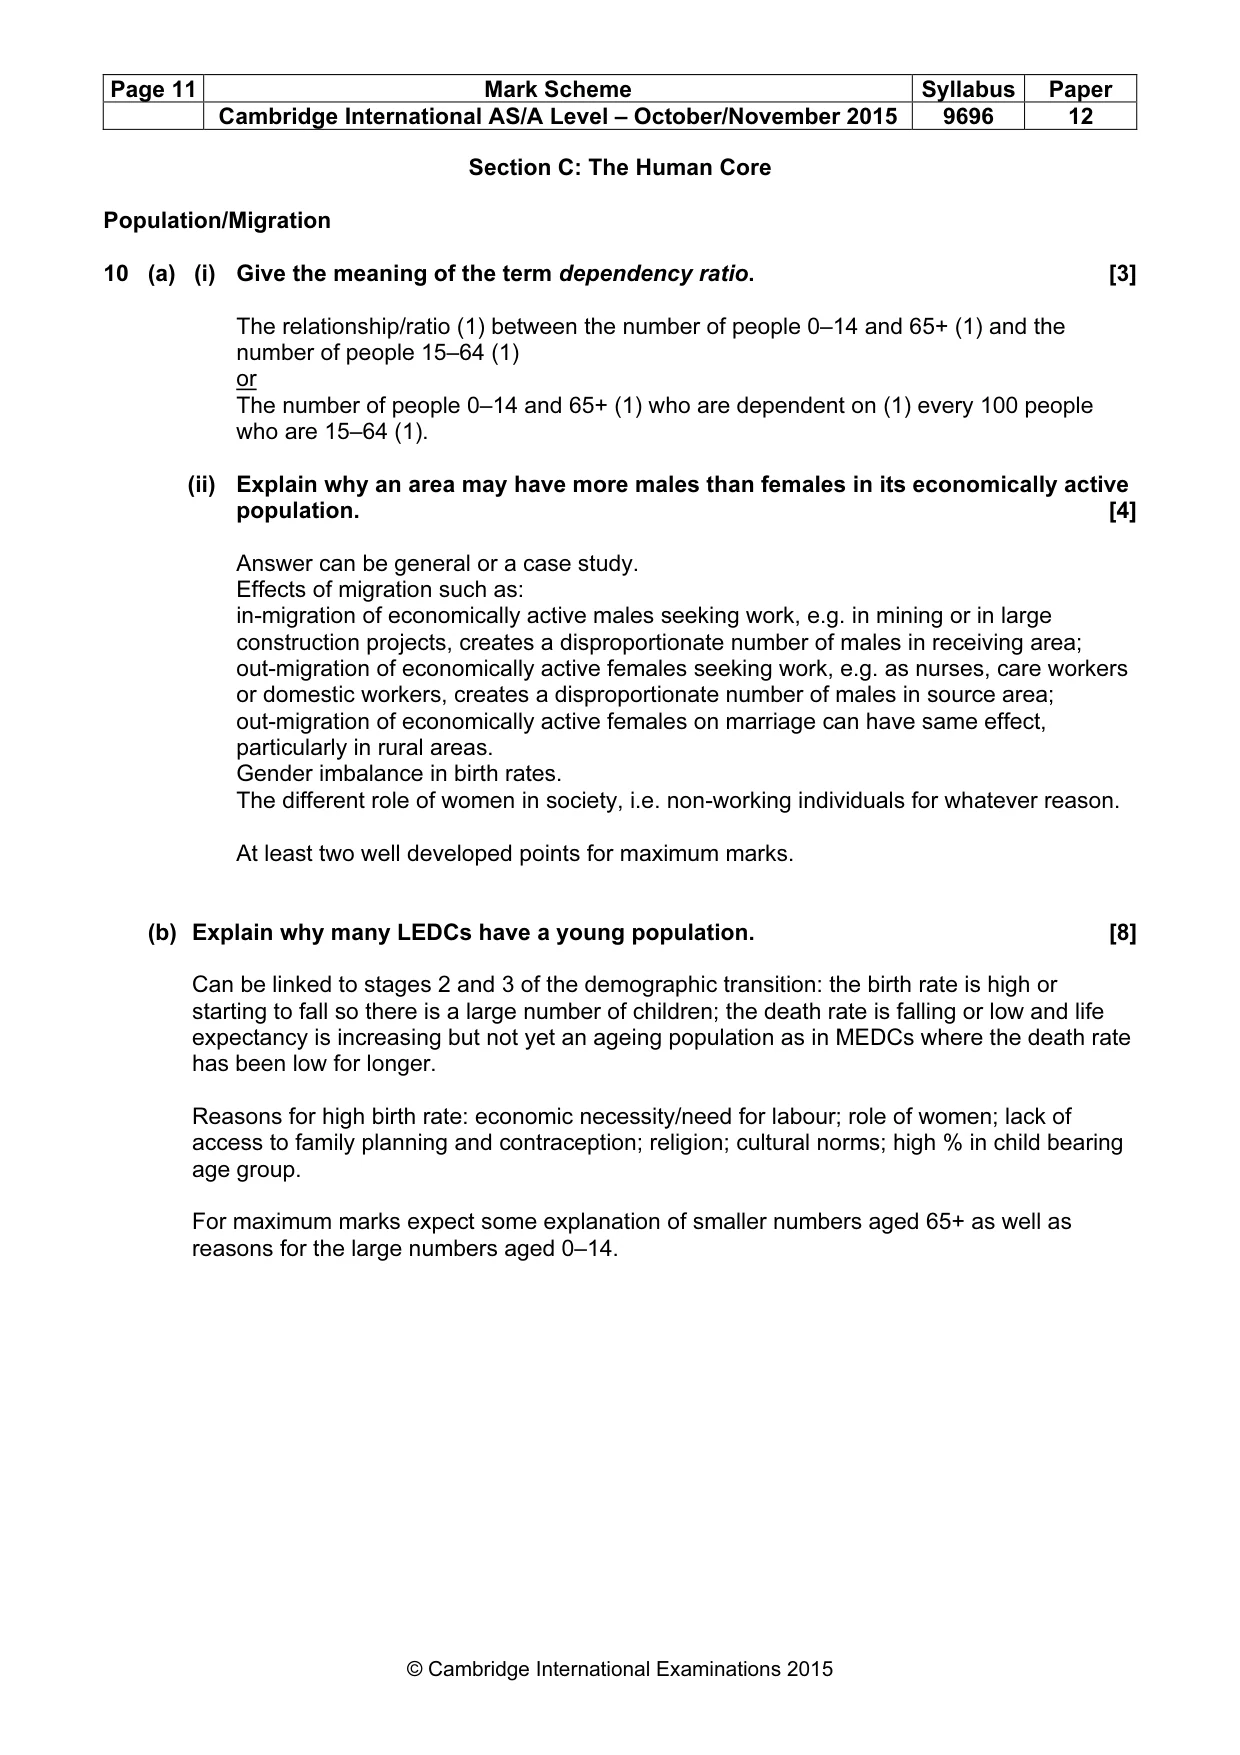
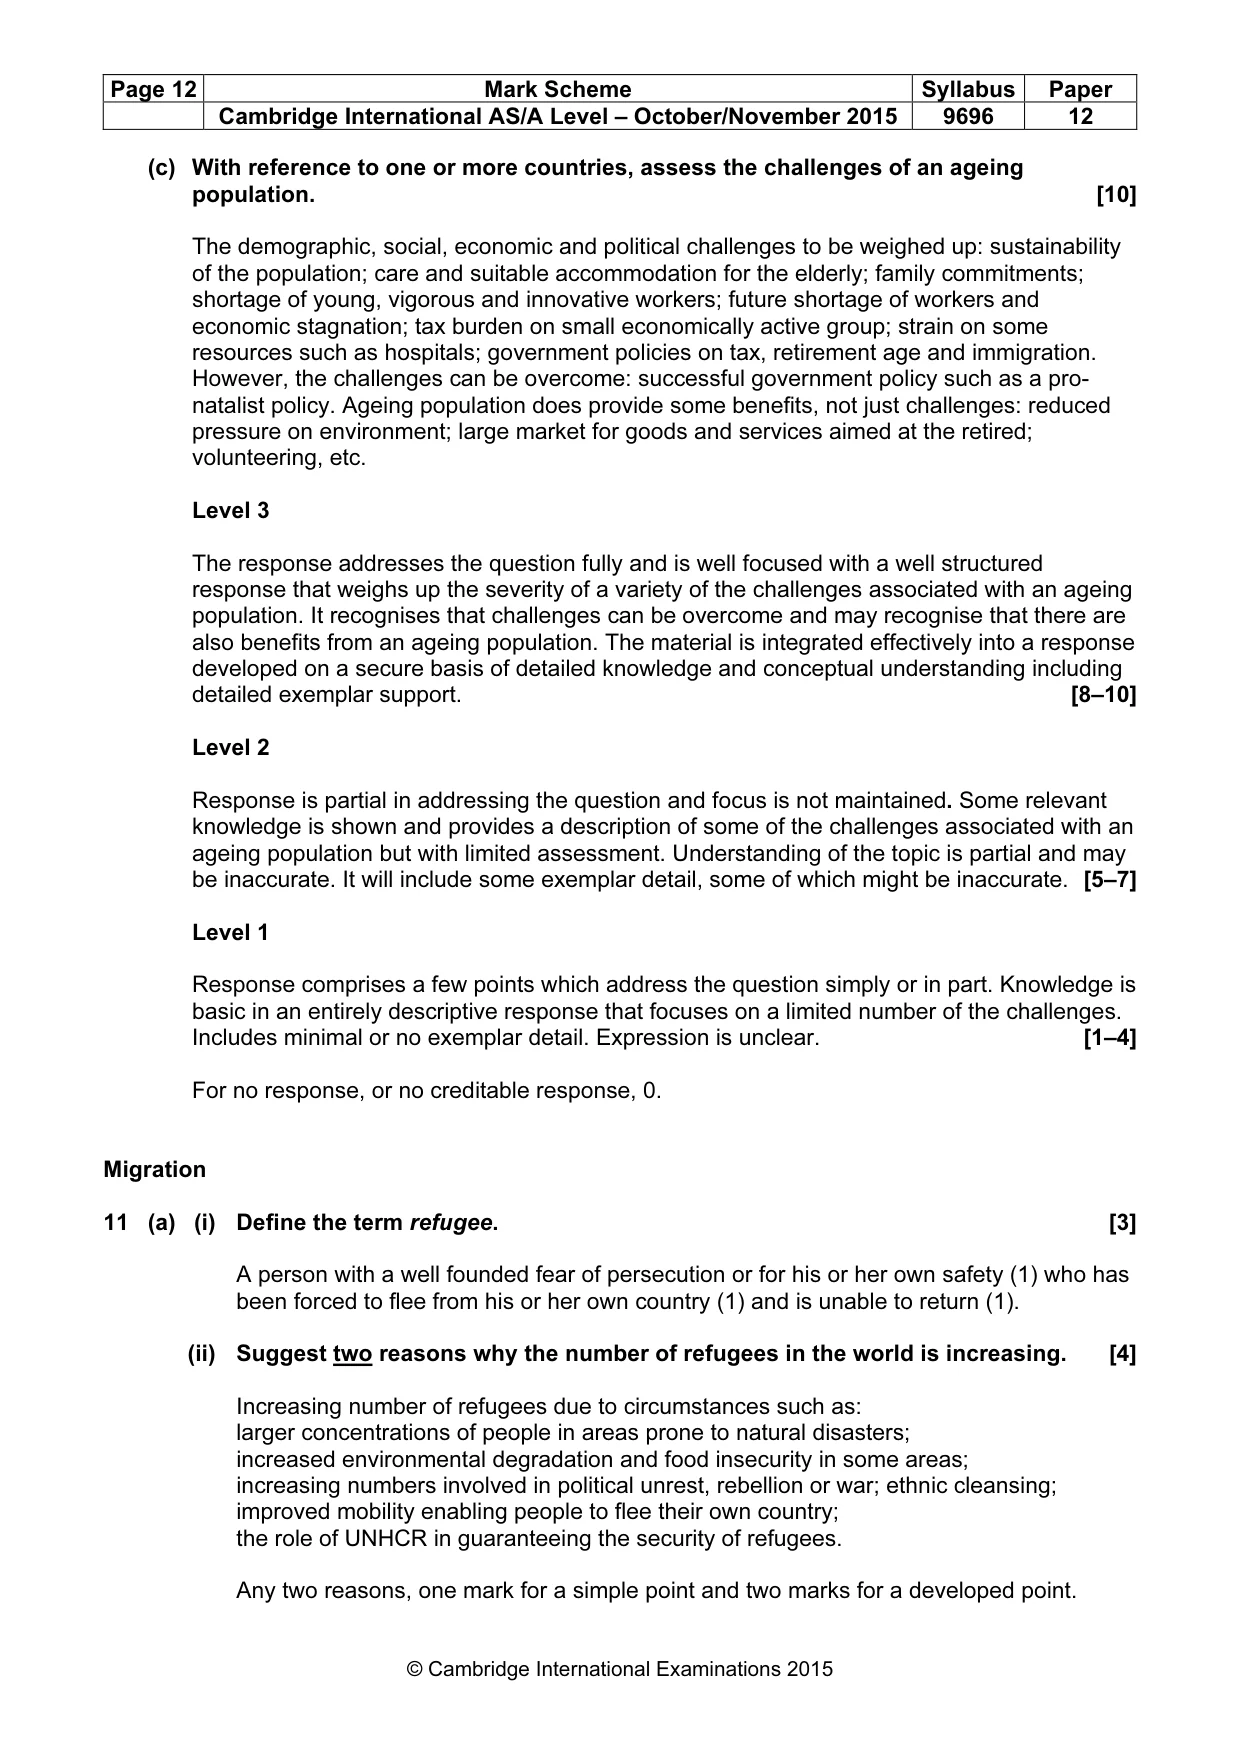
Page 11 Mark Scheme Syllabus Paper Cambridge International AS/A Level – October/November 2015 9696 12 © Cambridge International Examinations 2015 Section C: The Human Core Population/Migration 10 (a) (i) Give the meaning of the term dependency ratio. [3] The relationship/ratio (1) between the number of people 0–14 and 65+ (1) and the number of people 15–64 (1) or The number of people 0–14 and 65+ (1) who are dependent on (1) every 100 people who are 15–64 (1). (ii) Explain why an area may have more males than females in its economically active population. [4] Answer can be general or a case study. Effects of migration such as: in-migration of economically active males seeking work, e.g. in mining or in large construction projects, creates a disproportionate number of males in receiving area; out-migration of economically active females seeking work, e.g. as nurses, care workers or domestic workers, creates a disproportionate number of males in source area; out-migration of economically active females on marriage can have same effect, particularly in rural areas. Gender imbalance in birth rates. The different role of women in society, i.e. non-working individuals for whatever reason. At least two well developed points for maximum marks. (b) Explain why many LEDCs have a young population. [8] Can be linked to stages 2 and 3 of the demographic transition: the birth rate is high or starting to fall so there is a large number of children; the death rate is falling or low and life expectancy is increasing but not yet an ageing population as in MEDCs where the death rate has been low for longer. Reasons for high birth rate: economic necessity/need for labour; role of women; lack of access to family planning and contraception; religion; cultural norms; high % in child bearing age group. For maximum marks expect some explanation of smaller numbers aged 65+ as well as reasons for the large numbers aged 0–14.
Mark scheme, page 12
Page 12 Mark Scheme Syllabus Paper Cambridge International AS/A Level – October/November 2015 9696 12 © Cambridge International Examinations 2015 (c) With reference to one or more countries, assess the challenges of an ageing population. [10] The demographic, social, economic and political challenges to be weighed up: sustainability of the population; care and suitable accommodation for the elderly; family commitments; shortage of young, vigorous and innovative workers; future shortage of workers and economic stagnation; tax burden on small economically active group; strain on some resources such as hospitals; government policies on tax, retirement age and immigration. However, the challenges can be overcome: successful government policy such as a pro- natalist policy. Ageing population does provide some benefits, not just challenges: reduced pressure on environment; large market for goods and services aimed at the retired; volunteering, etc. Level 3 The response addresses the question fully and is well focused with a well structured response that weighs up the severity of a variety of the challenges associated with an ageing population. It recognises that challenges can be overcome and may recognise that there are also benefits from an ageing population. The material is integrated effectively into a response developed on a secure basis of detailed knowledge and conceptual understanding including detailed exemplar support. [8–10] Level 2 Response is partial in addressing the question and focus is not maintained. Some relevant knowledge is shown and provides a description of some of the challenges associated with an ageing population but with limited assessment. Understanding of the topic is partial and may be inaccurate. It will include some exemplar detail, some of which might be inaccurate. [5–7] Level 1 Response comprises a few points which address the question simply or in part. Knowledge is basic in an entirely descriptive response that focuses on a limited number of the challenges. Includes minimal or no exemplar detail. Expression is unclear. [1–4] For no response, or no creditable response, 0. Migration 11 (a) (i) Define the term refugee. [3] A person with a well founded fear of persecution or for his or her own safety (1) who has been forced to flee from his or her own country (1) and is unable to return (1). (ii) Suggest two reasons why the number of refugees in the world is increasing. [4] Increasing number of refugees due to circumstances such as: larger concentrations of people in areas prone to natural disasters; increased environmental degradation and food insecurity in some areas; increasing numbers involved in political unrest, rebellion or war; ethnic cleansing; improved mobility enabling people to flee their own country; the role of UNHCR in guaranteeing the security of refugees. Any two reasons, one mark for a simple point and two marks for a developed point.
Mark scheme, page 13
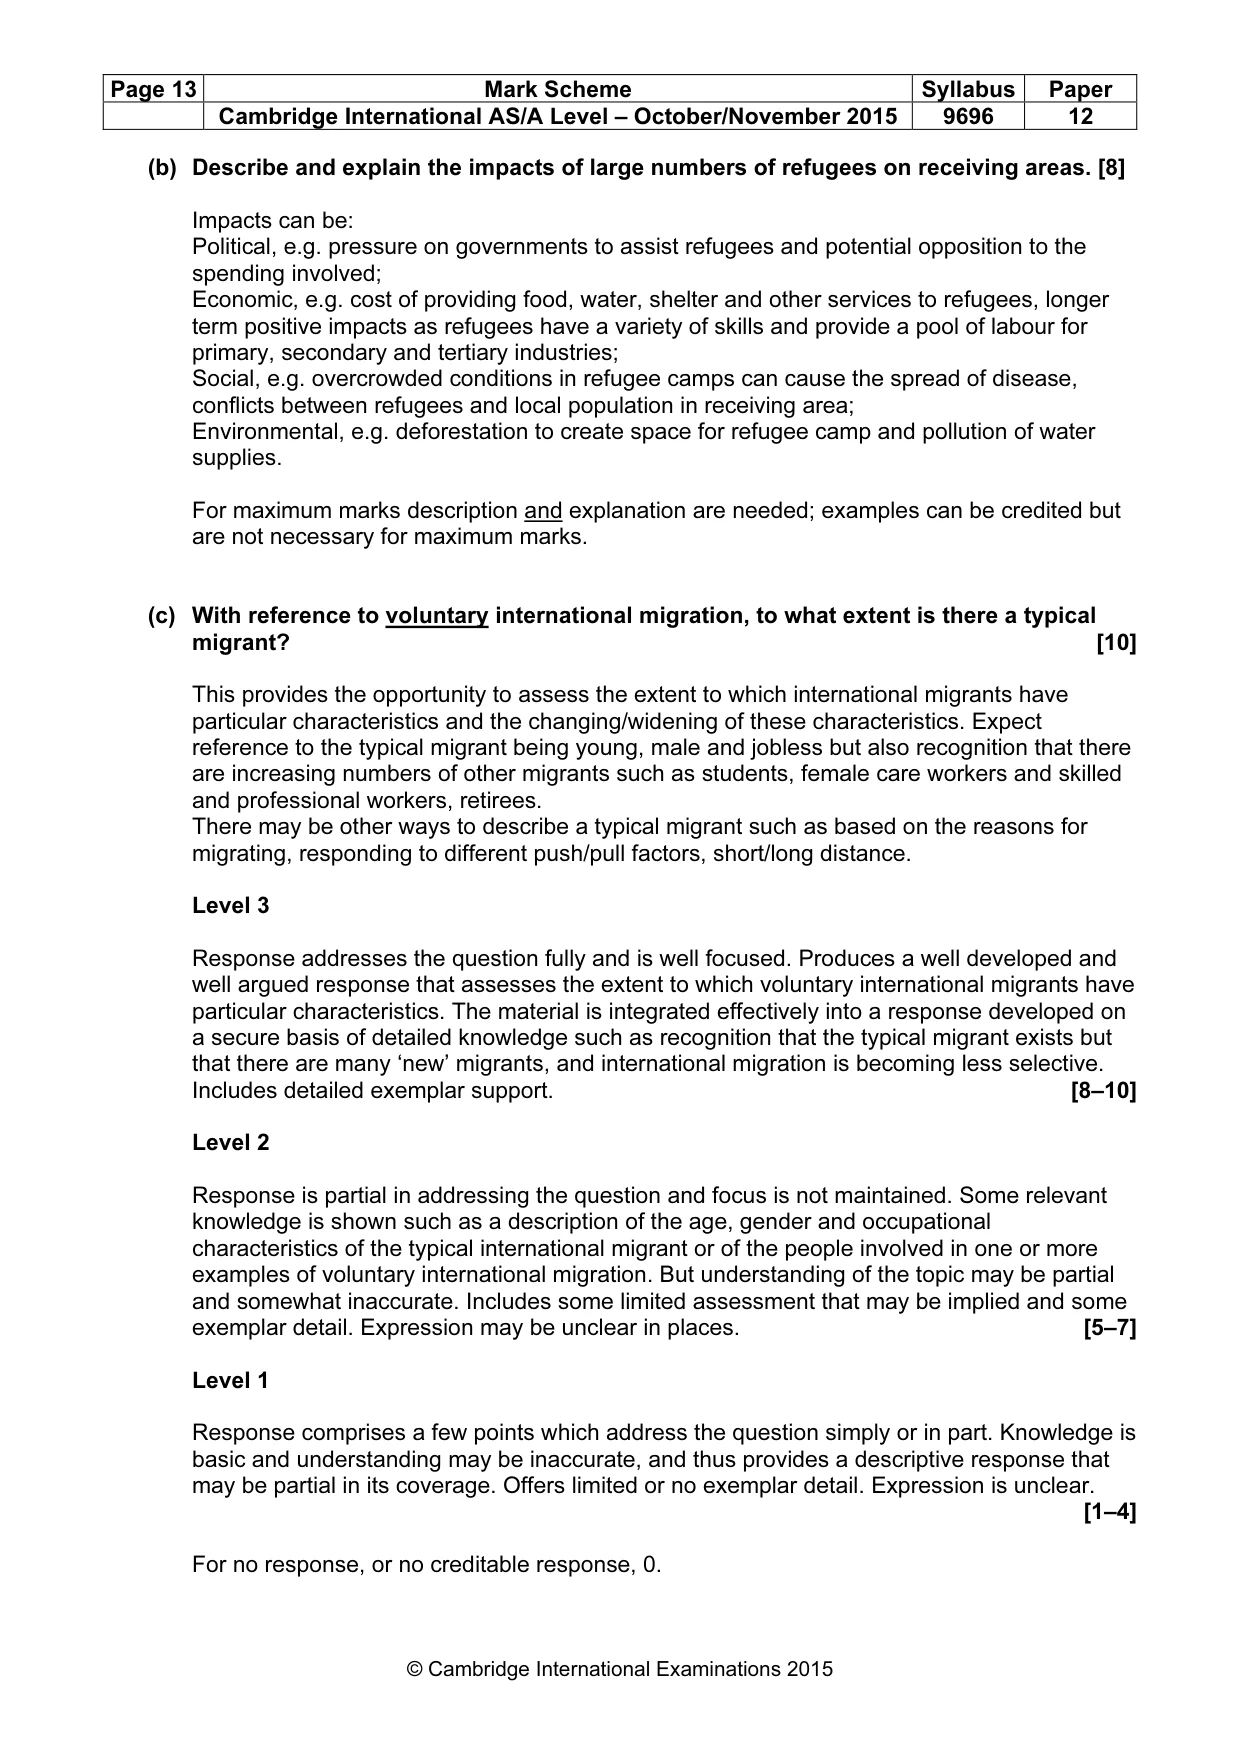
Page 13 Mark Scheme Syllabus Paper Cambridge International AS/A Level – October/November 2015 9696 12 © Cambridge International Examinations 2015 (b) Describe and explain the impacts of large numbers of refugees on receiving areas. [8] Impacts can be: Political, e.g. pressure on governments to assist refugees and potential opposition to the spending involved; Economic, e.g. cost of providing food, water, shelter and other services to refugees, longer term positive impacts as refugees have a variety of skills and provide a pool of labour for primary, secondary and tertiary industries; Social, e.g. overcrowded conditions in refugee camps can cause the spread of disease, conflicts between refugees and local population in receiving area; Environmental, e.g. deforestation to create space for refugee camp and pollution of water supplies. For maximum marks description and explanation are needed; examples can be credited but are not necessary for maximum marks. (c) With reference to voluntary international migration, to what extent is there a typical migrant? [10] This provides the opportunity to assess the extent to which international migrants have particular characteristics and the changing/widening of these characteristics. Expect reference to the typical migrant being young, male and jobless but also recognition that there are increasing numbers of other migrants such as students, female care workers and skilled and professional workers, retirees. There may be other ways to describe a typical migrant such as based on the reasons for migrating, responding to different push/pull factors, short/long distance. Level 3 Response addresses the question fully and is well focused. Produces a well developed and well argued response that assesses the extent to which voluntary international migrants have particular characteristics. The material is integrated effectively into a response developed on a secure basis of detailed knowledge such as recognition that the typical migrant exists but that there are many ‘new’ migrants, and international migration is becoming less selective. Includes detailed exemplar support. [8–10] Level 2 Response is partial in addressing the question and focus is not maintained. Some relevant knowledge is shown such as a description of the age, gender and occupational characteristics of the typical international migrant or of the people involved in one or more examples of voluntary international migration. But understanding of the topic may be partial and somewhat inaccurate. Includes some limited assessment that may be implied and some exemplar detail. Expression may be unclear in places. [5–7] Level 1 Response comprises a few points which address the question simply or in part. Knowledge is basic and understanding may be inaccurate, and thus provides a descriptive response that may be partial in its coverage. Offers limited or no exemplar detail. Expression is unclear. [1–4] For no response, or no creditable response, 0.
Mark scheme, page 14
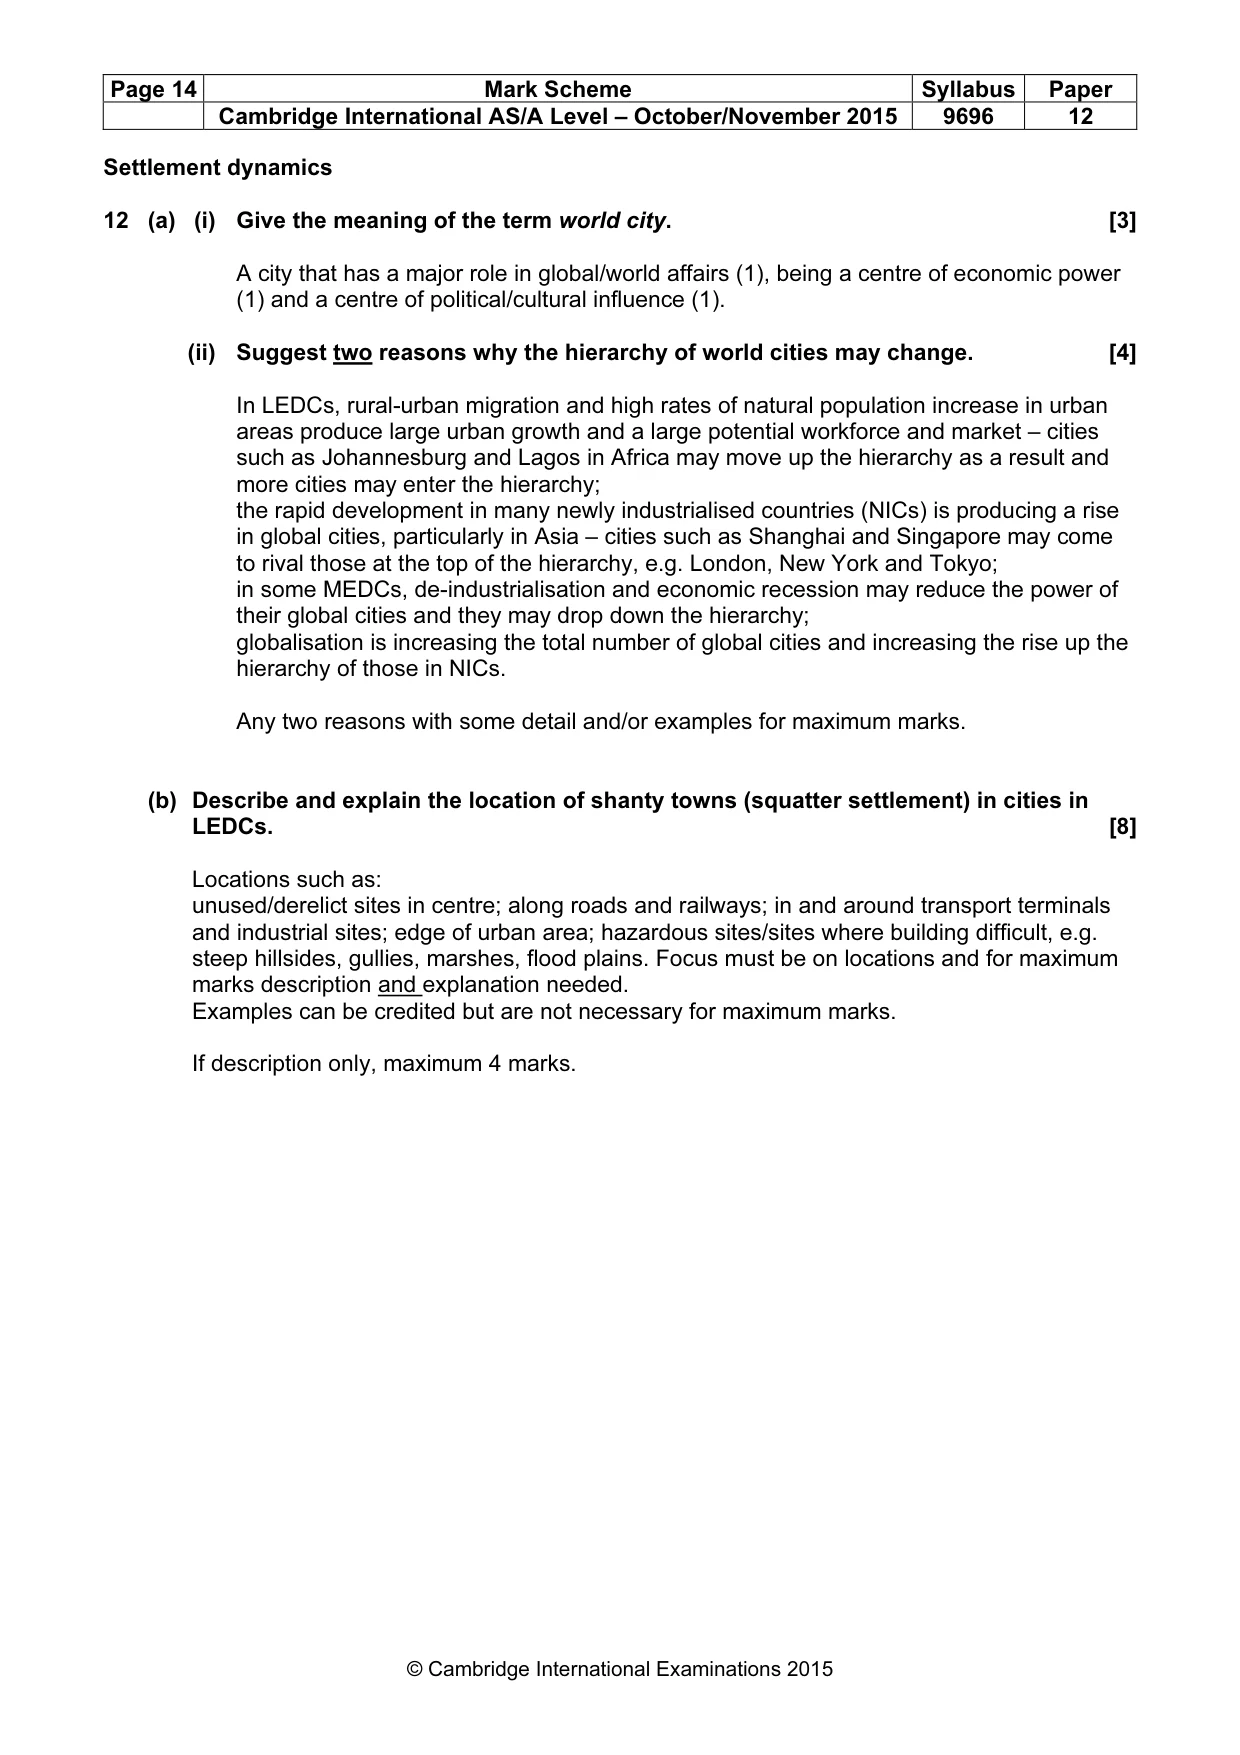
Page 14 Mark Scheme Syllabus Paper Cambridge International AS/A Level – October/November 2015 9696 12 © Cambridge International Examinations 2015 Settlement dynamics 12 (a) (i) Give the meaning of the term world city. [3] A city that has a major role in global/world affairs (1), being a centre of economic power (1) and a centre of political/cultural influence (1). (ii) Suggest two reasons why the hierarchy of world cities may change. [4] In LEDCs, rural-urban migration and high rates of natural population increase in urban areas produce large urban growth and a large potential workforce and market – cities such as Johannesburg and Lagos in Africa may move up the hierarchy as a result and more cities may enter the hierarchy; the rapid development in many newly industrialised countries (NICs) is producing a rise in global cities, particularly in Asia – cities such as Shanghai and Singapore may come to rival those at the top of the hierarchy, e.g. London, New York and Tokyo; in some MEDCs, de-industrialisation and economic recession may reduce the power of their global cities and they may drop down the hierarchy; globalisation is increasing the total number of global cities and increasing the rise up the hierarchy of those in NICs. Any two reasons with some detail and/or examples for maximum marks. (b) Describe and explain the location of shanty towns (squatter settlement) in cities in LEDCs. [8] Locations such as: unused/derelict sites in centre; along roads and railways; in and around transport terminals and industrial sites; edge of urban area; hazardous sites/sites where building difficult, e.g. steep hillsides, gullies, marshes, flood plains. Focus must be on locations and for maximum marks description and explanation needed. Examples can be credited but are not necessary for maximum marks. If description only, maximum 4 marks.
Mark scheme, page 15
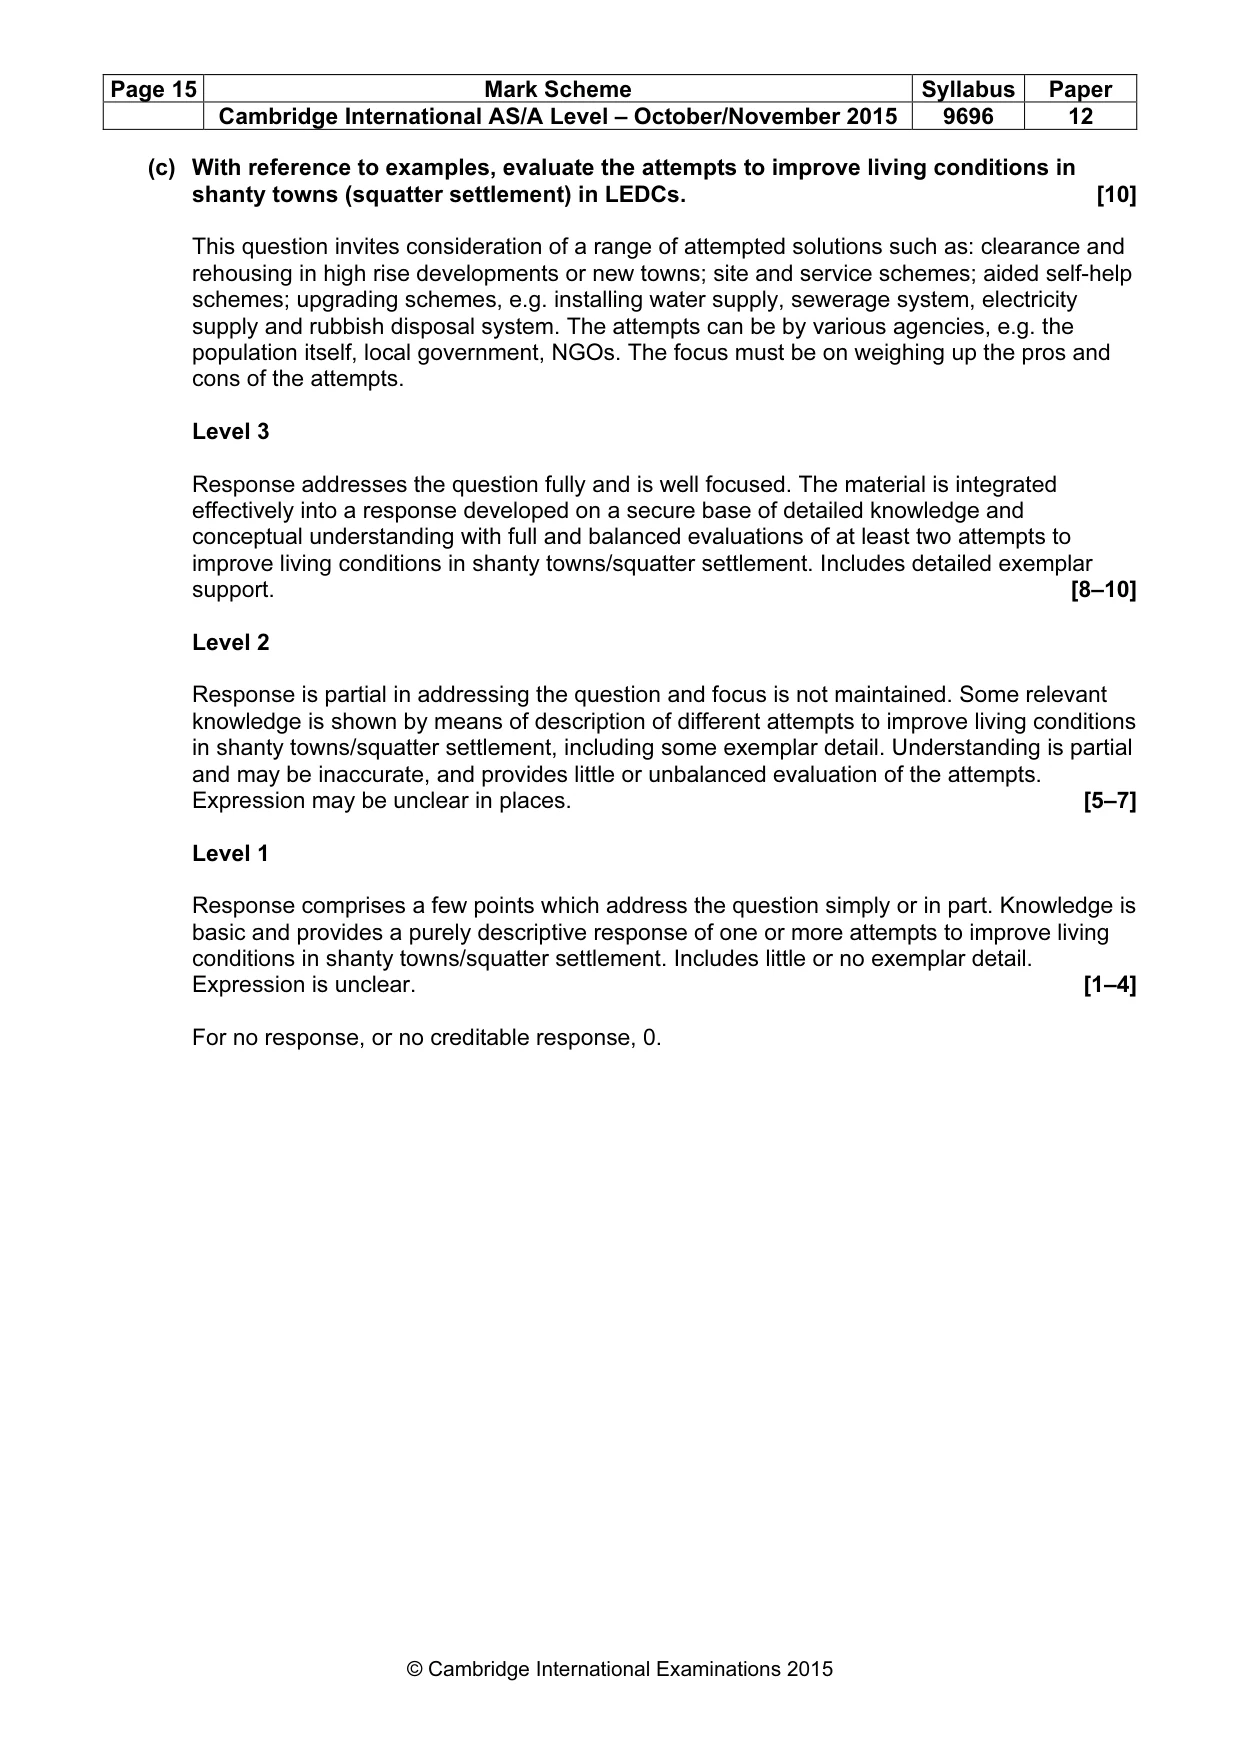
Page 15 Mark Scheme Syllabus Paper Cambridge International AS/A Level – October/November 2015 9696 12 © Cambridge International Examinations 2015 (c) With reference to examples, evaluate the attempts to improve living conditions in shanty towns (squatter settlement) in LEDCs. [10] This question invites consideration of a range of attempted solutions such as: clearance and rehousing in high rise developments or new towns; site and service schemes; aided self-help schemes; upgrading schemes, e.g. installing water supply, sewerage system, electricity supply and rubbish disposal system. The attempts can be by various agencies, e.g. the population itself, local government, NGOs. The focus must be on weighing up the pros and cons of the attempts. Level 3 Response addresses the question fully and is well focused. The material is integrated effectively into a response developed on a secure base of detailed knowledge and conceptual understanding with full and balanced evaluations of at least two attempts to improve living conditions in shanty towns/squatter settlement. Includes detailed exemplar support. [8–10] Level 2 Response is partial in addressing the question and focus is not maintained. Some relevant knowledge is shown by means of description of different attempts to improve living conditions in shanty towns/squatter settlement, including some exemplar detail. Understanding is partial and may be inaccurate, and provides little or unbalanced evaluation of the attempts. Expression may be unclear in places. [5–7] Level 1 Response comprises a few points which address the question simply or in part. Knowledge is basic and provides a purely descriptive response of one or more attempts to improve living conditions in shanty towns/squatter settlement. Includes little or no exemplar detail. Expression is unclear. [1–4] For no response, or no creditable response, 0.
What you needed in this session
Cambridge’s own grade thresholds for 2015 Oct/Nov, Paper 1 · Variant 2. A higher threshold means an easier paper — the bar moves with how the cohort did.