Cambridge A Level Environmental Management (AS only) 8291 — 2025 Oct/Nov Paper 2 · Variant 3
8291/23/O/N/25 · 5 questions · 80 marks · 105 min
The question paper and its mark scheme, free to read here and free to download. This is Cambridge’s own paper, exactly as it was sat.
Question paper24 pages



Mark scheme17 pages
Answers below. Sit the paper first if you are practising.
Questions as text
Q1 · Methane is a greenhouse gas
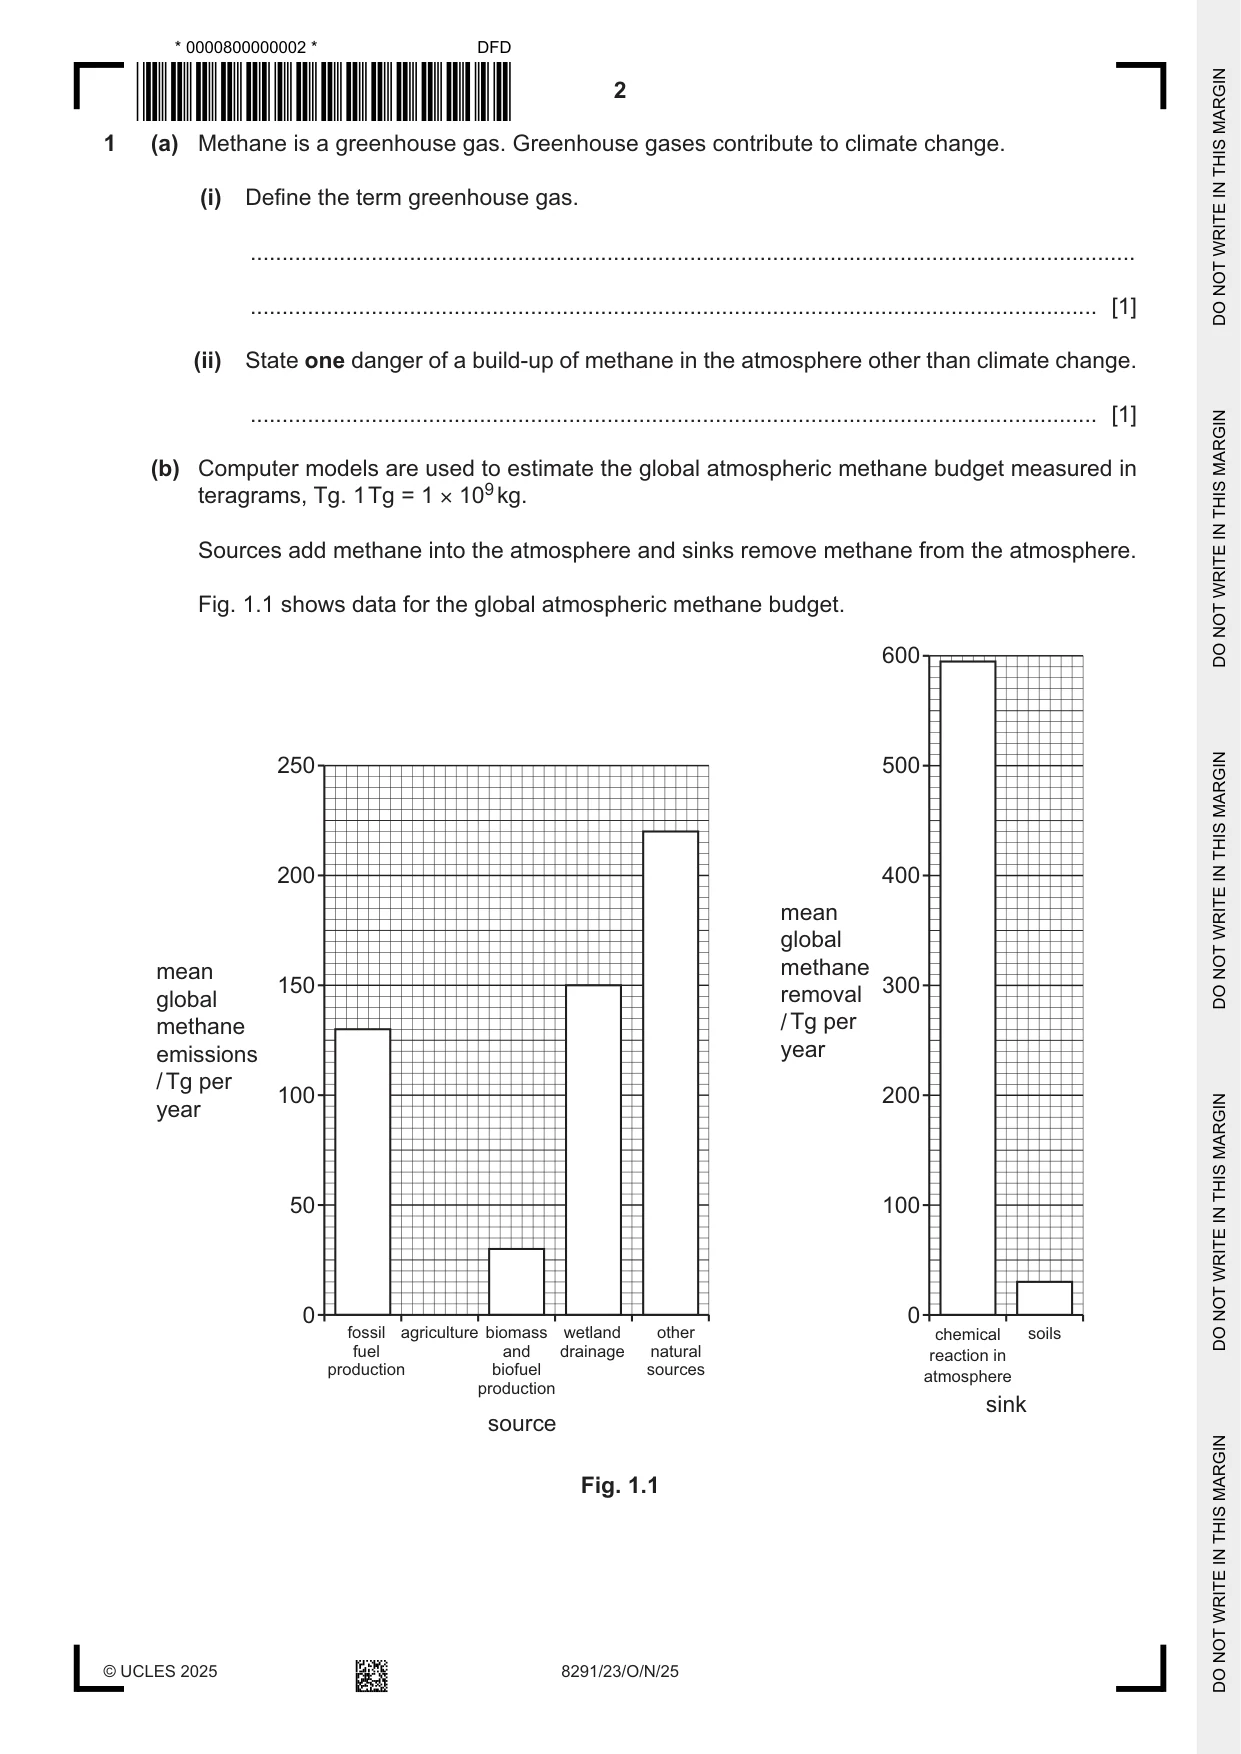
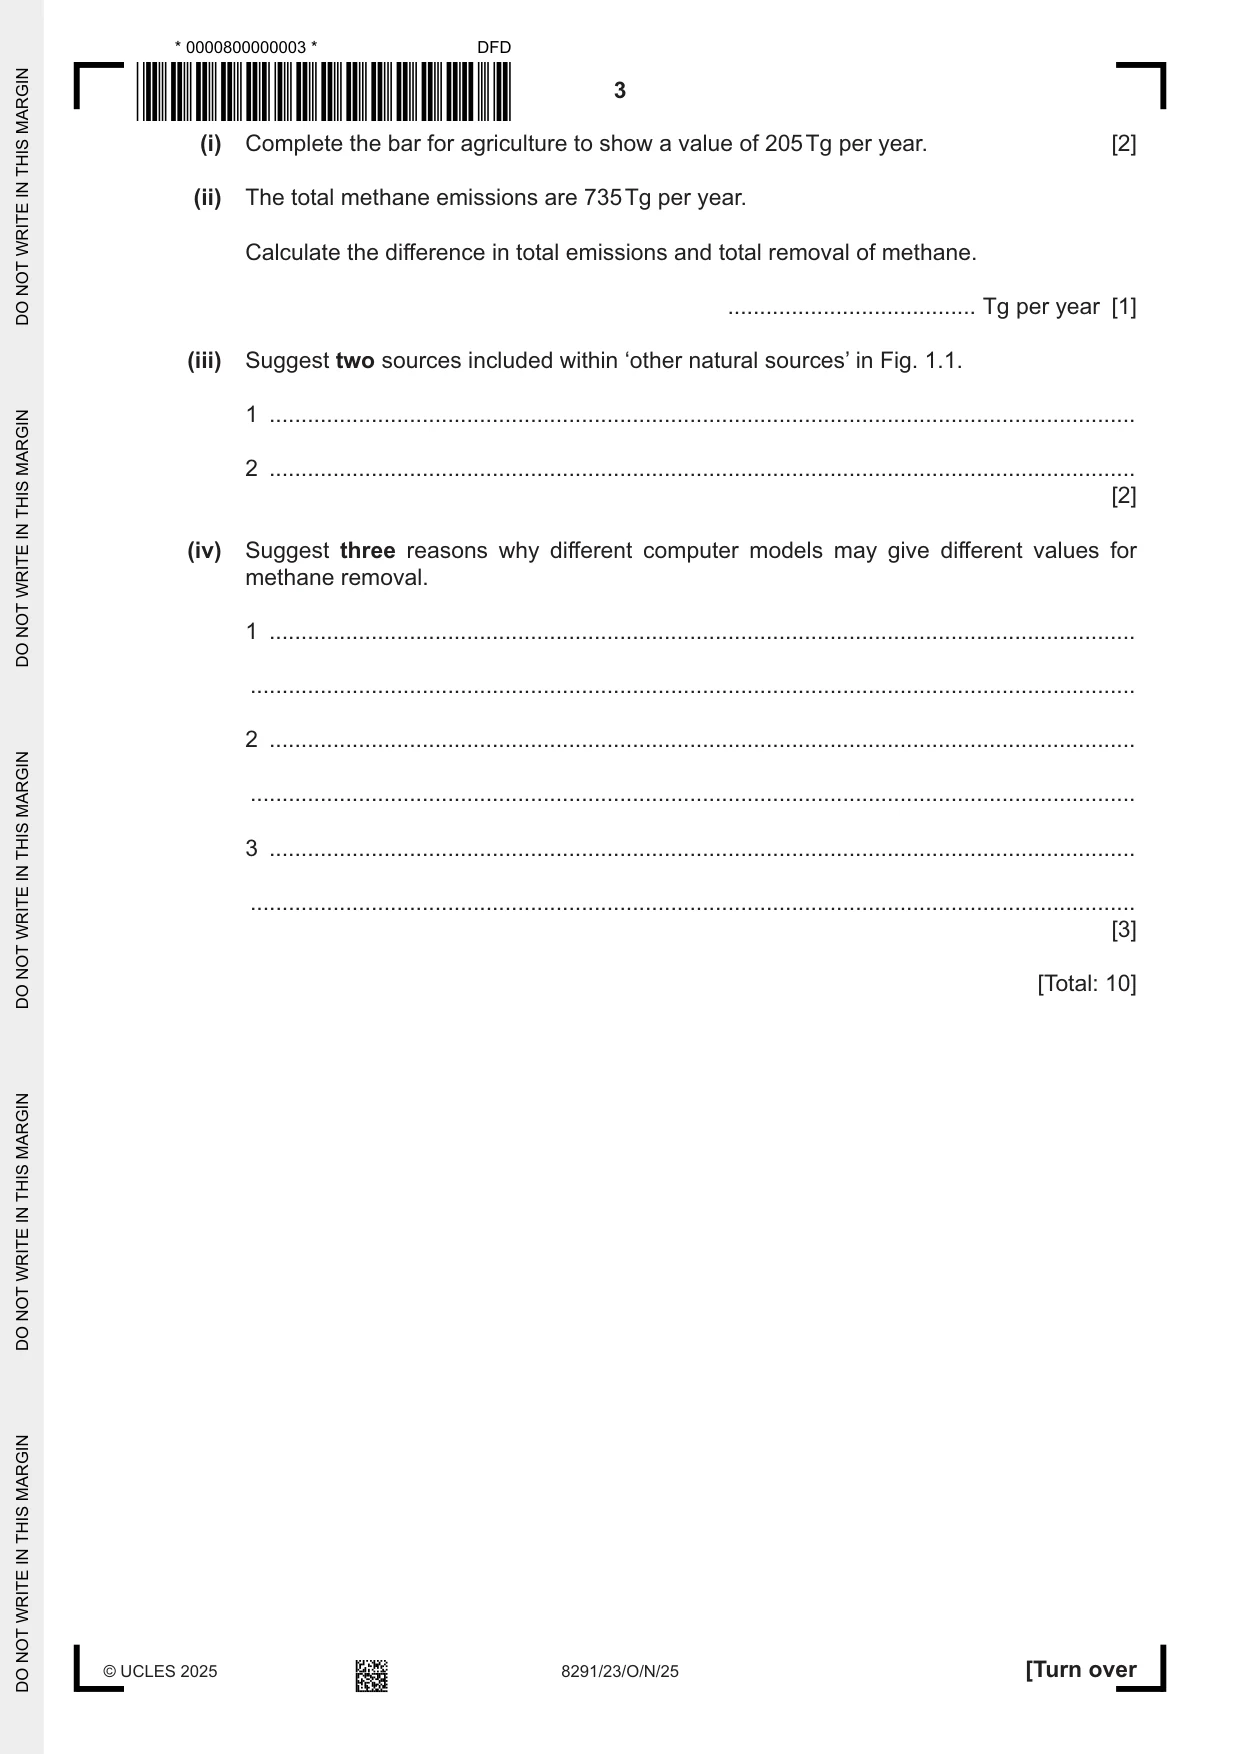
1 (a) Methane is a greenhouse gas. Greenhouse gases contribute to climate change. (i) Define the term greenhouse gas. ........................................................................................................................................... ..................................................................................................................................... [1] (ii) State one danger of a build-up of methane in the atmosphere other than climate change. ..................................................................................................................................... [1] (b) Computer models are used to estimate the global atmospheric methane budget measured in teragrams, Tg. 1 Tg = 1 × 10⁹ kg. Sources add methane into the atmosphere and sinks remove methane from the atmosphere. Fig. 1.1 shows data for the global atmospheric methane budget. 600 250 500 200 400 mean global mean methane 150 300 global removal methane / Tg per emissions year / Tg per 100 200 year 50 100 0 0 fossil agriculture biomass wetland other chemical soils fuel and drainage natural reaction in production biofuel sources atmosphere production sink source Fig. 1.1 (i) Complete the bar for agriculture to show a value of 205 Tg per year. [2] (ii) The total methane emissions are 735 Tg per year. Calculate the difference in total emissions and total removal of methane. ....................................... Tg per year [1] (iii) Suggest two sources included within ‘other natural sources’ in Fig. 1.1. 1 ........................................................................................................................................ 2 ........................................................................................................................................ [2] (iv) Suggest three reasons why different computer models may give different values for methane removal. 1 ........................................................................................................................................ ........................................................................................................................................... 2 ........................................................................................................................................ ........................................................................................................................................... 3 ........................................................................................................................................ ........................................................................................................................................... [3] [Total: 10]
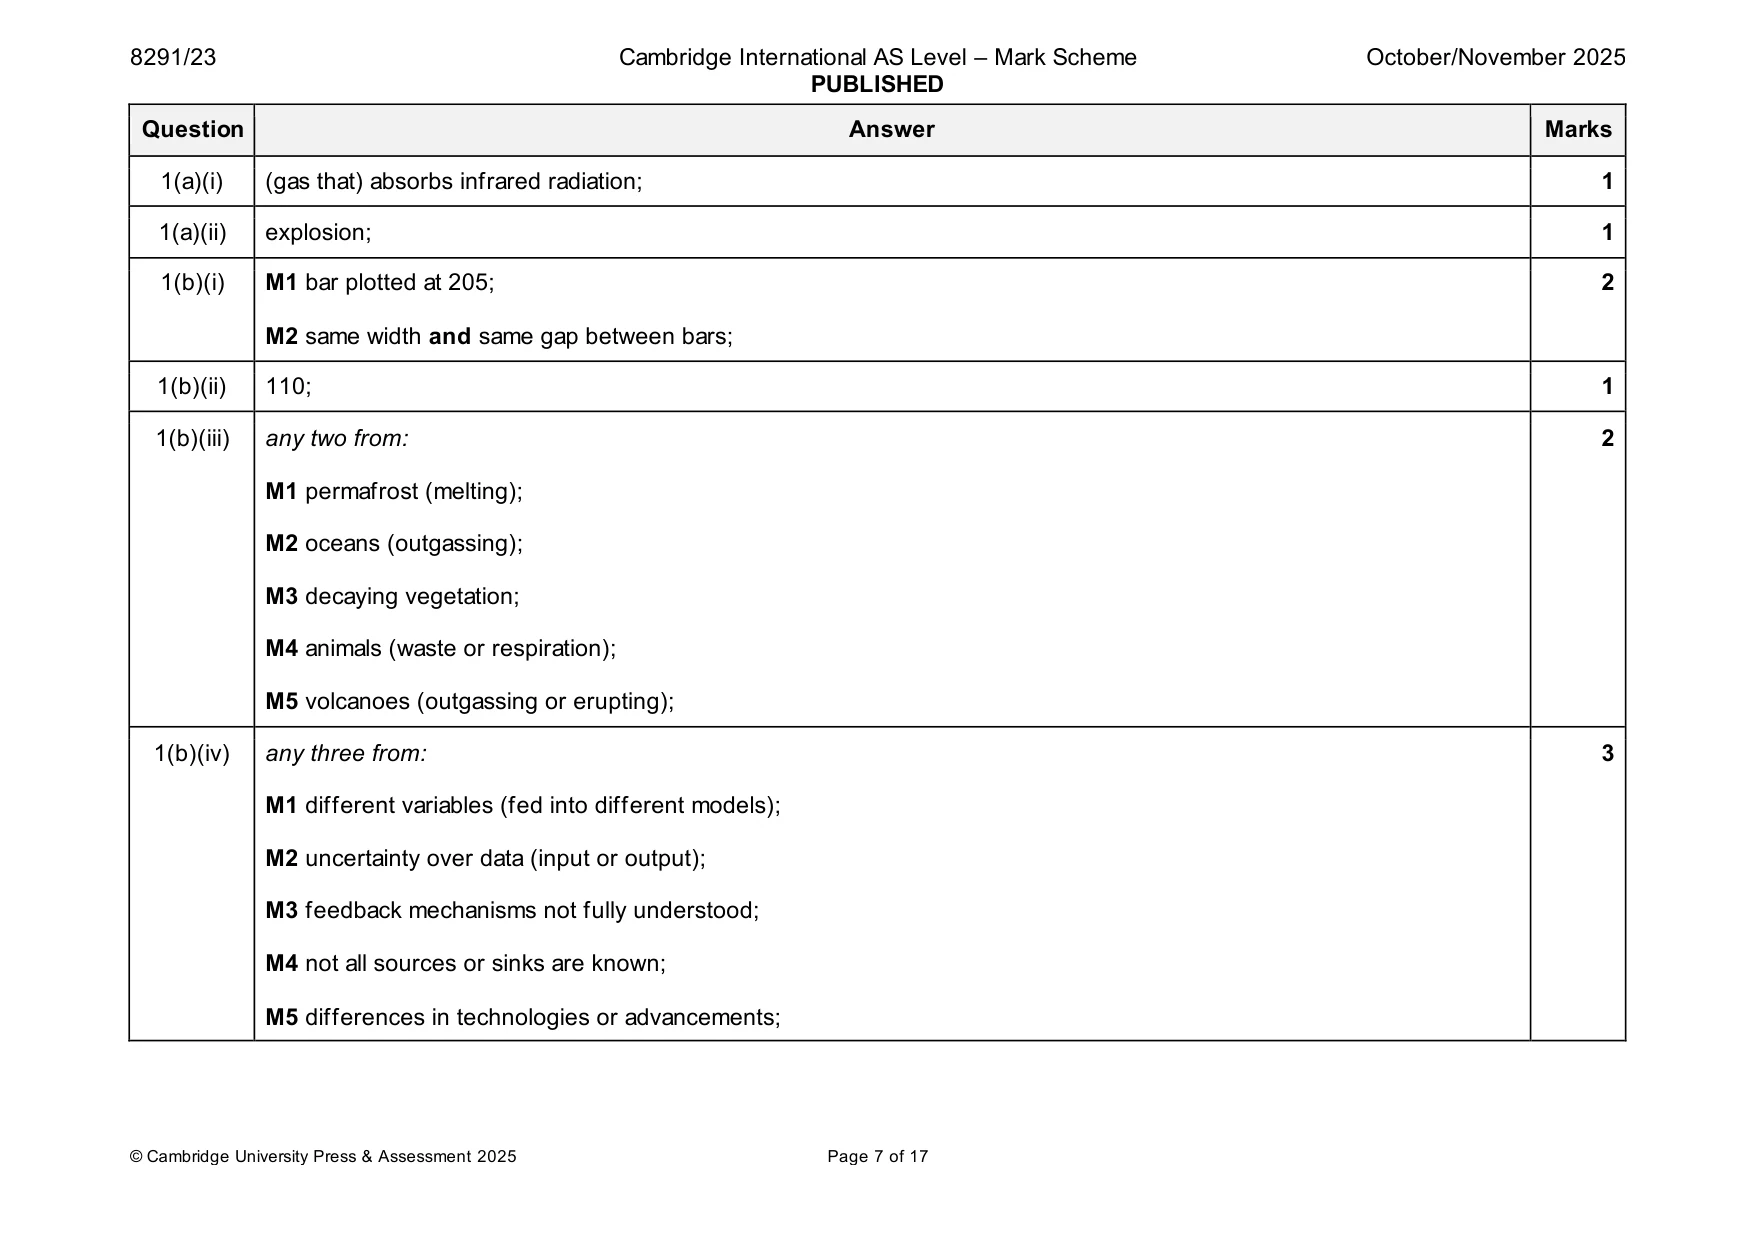
Mark scheme: Question Answer Marks 1(a)(i) (gas that) absorbs infrared radiation; 1 1(a)(ii) explosion; 1 1(b)(i) M1 bar plotted at 205; 2 M2 same width and same gap between bars; 1(b)(ii) 110; 1 1(b)(iii) any two from: 2 M1 permafrost (melting); M2 oceans (outgassing); M3 decaying vegetation; M4 animals (waste or respiration); M5 volcanoes (outgassing or erupting); 1(b)(iv) any three from: 3 M1 different variables (fed into different models); M2 uncertainty over data (input or output); M3 feedback mechanisms not fully understood; M4 not all sources or sinks are known; M5 differences in technologies or advancements;
Q2 · Rhinoceros are at risk from climate change
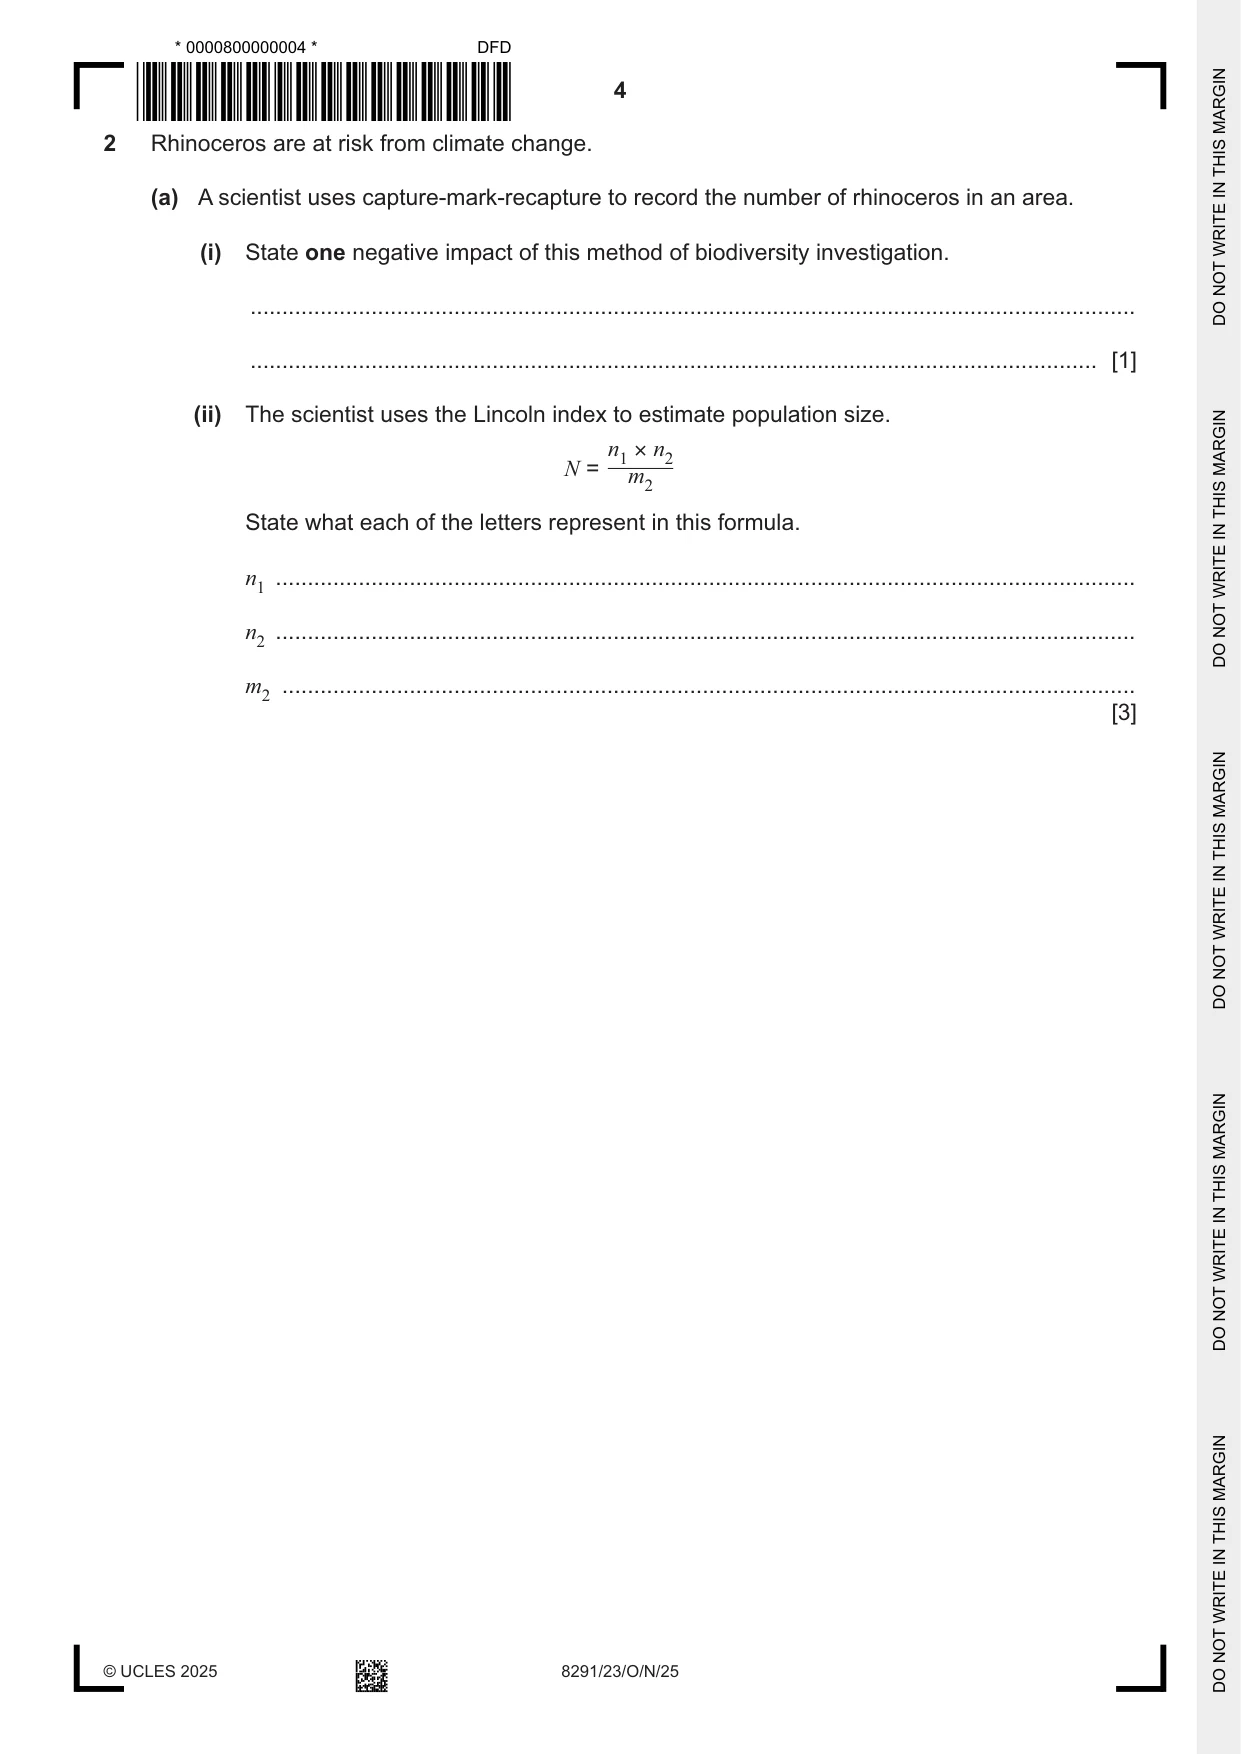
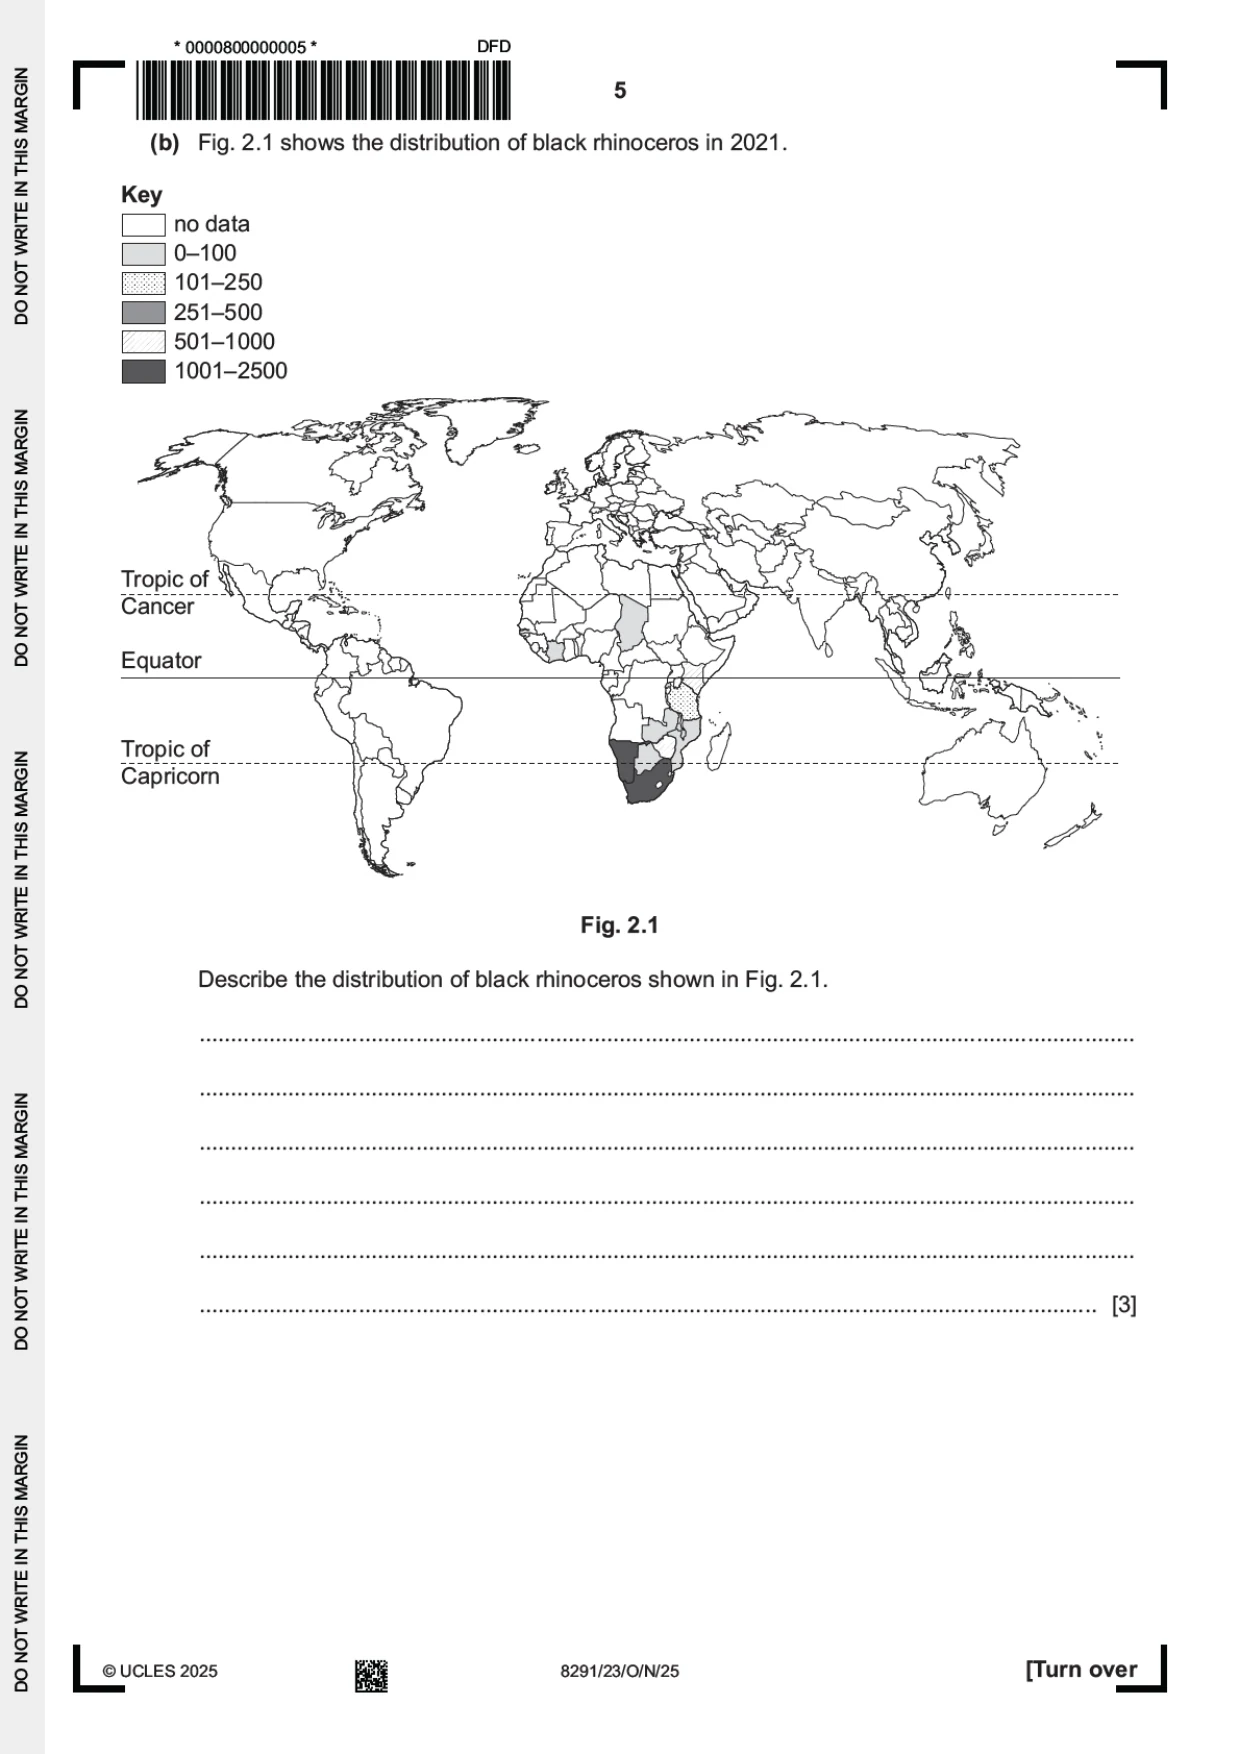
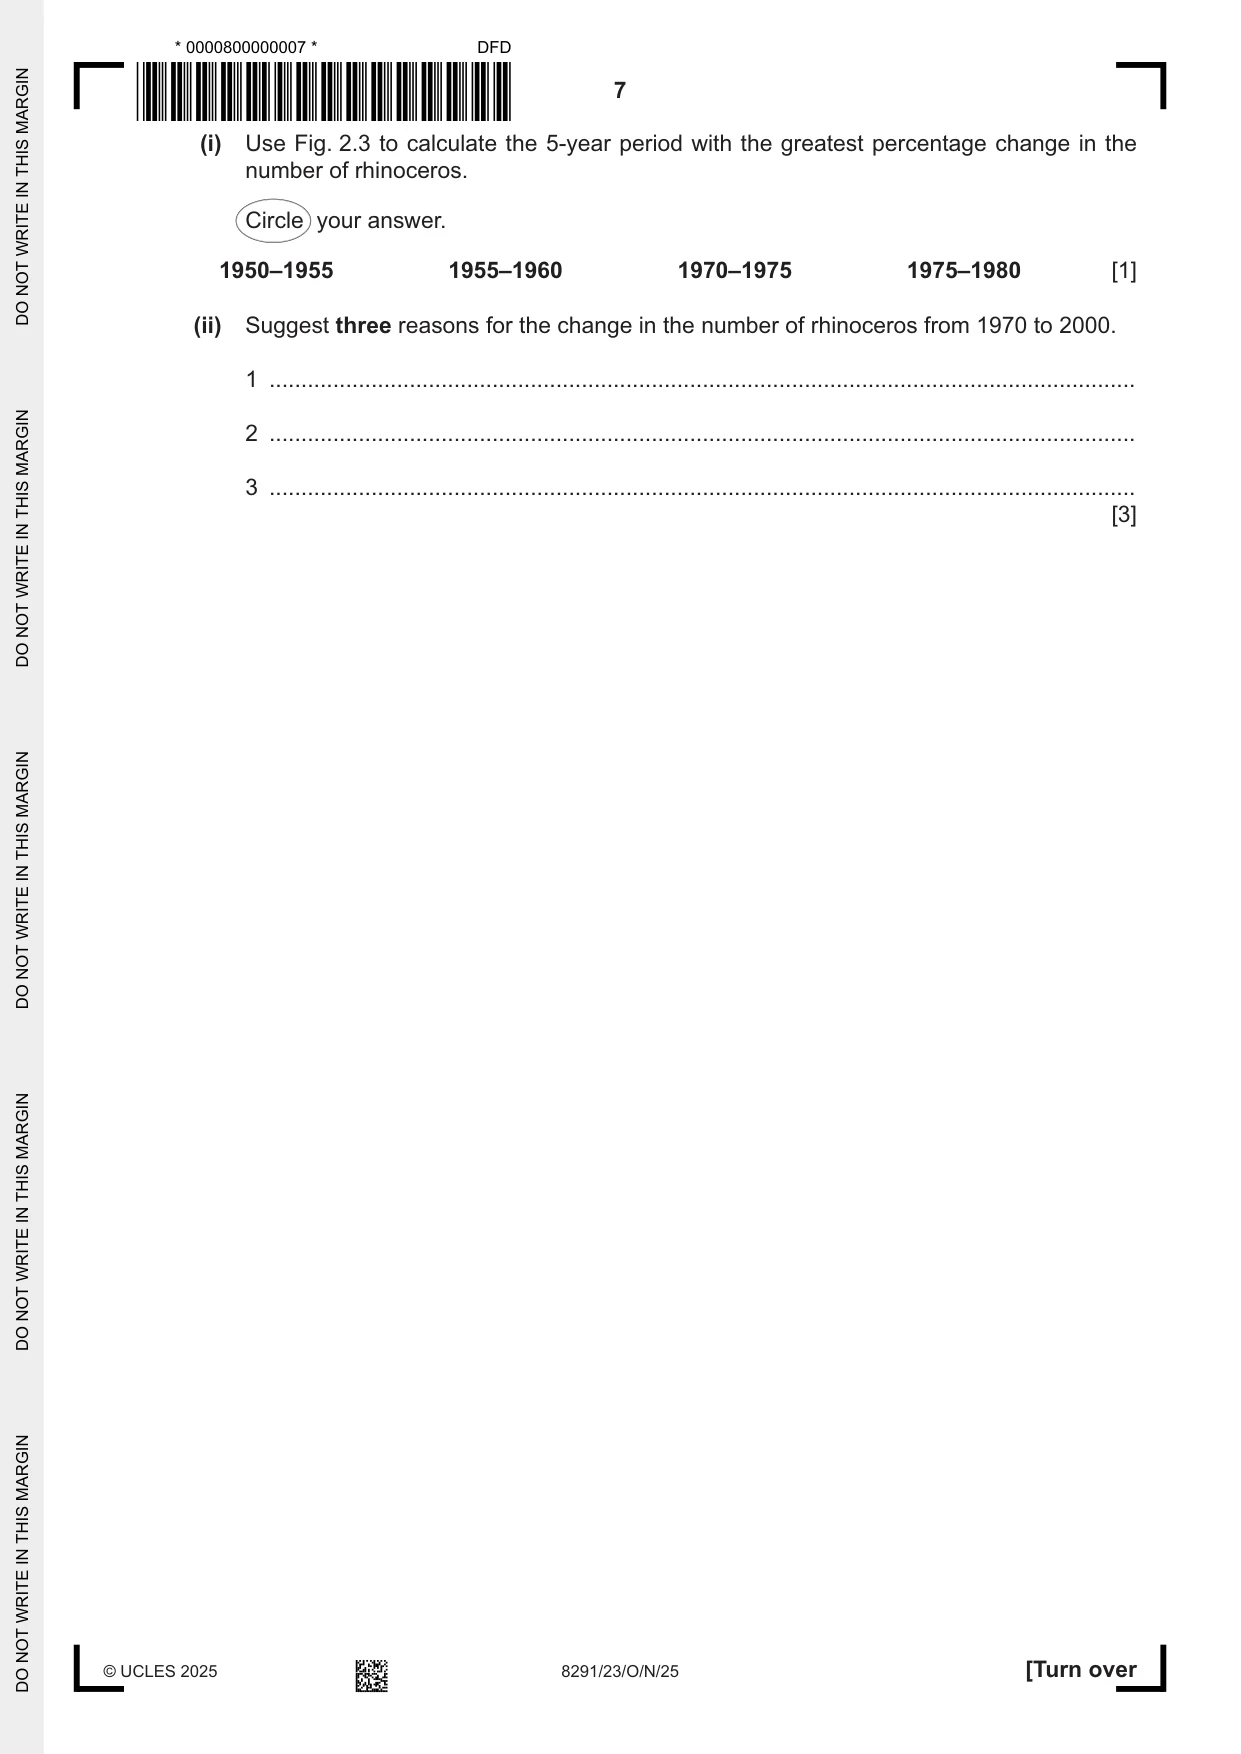
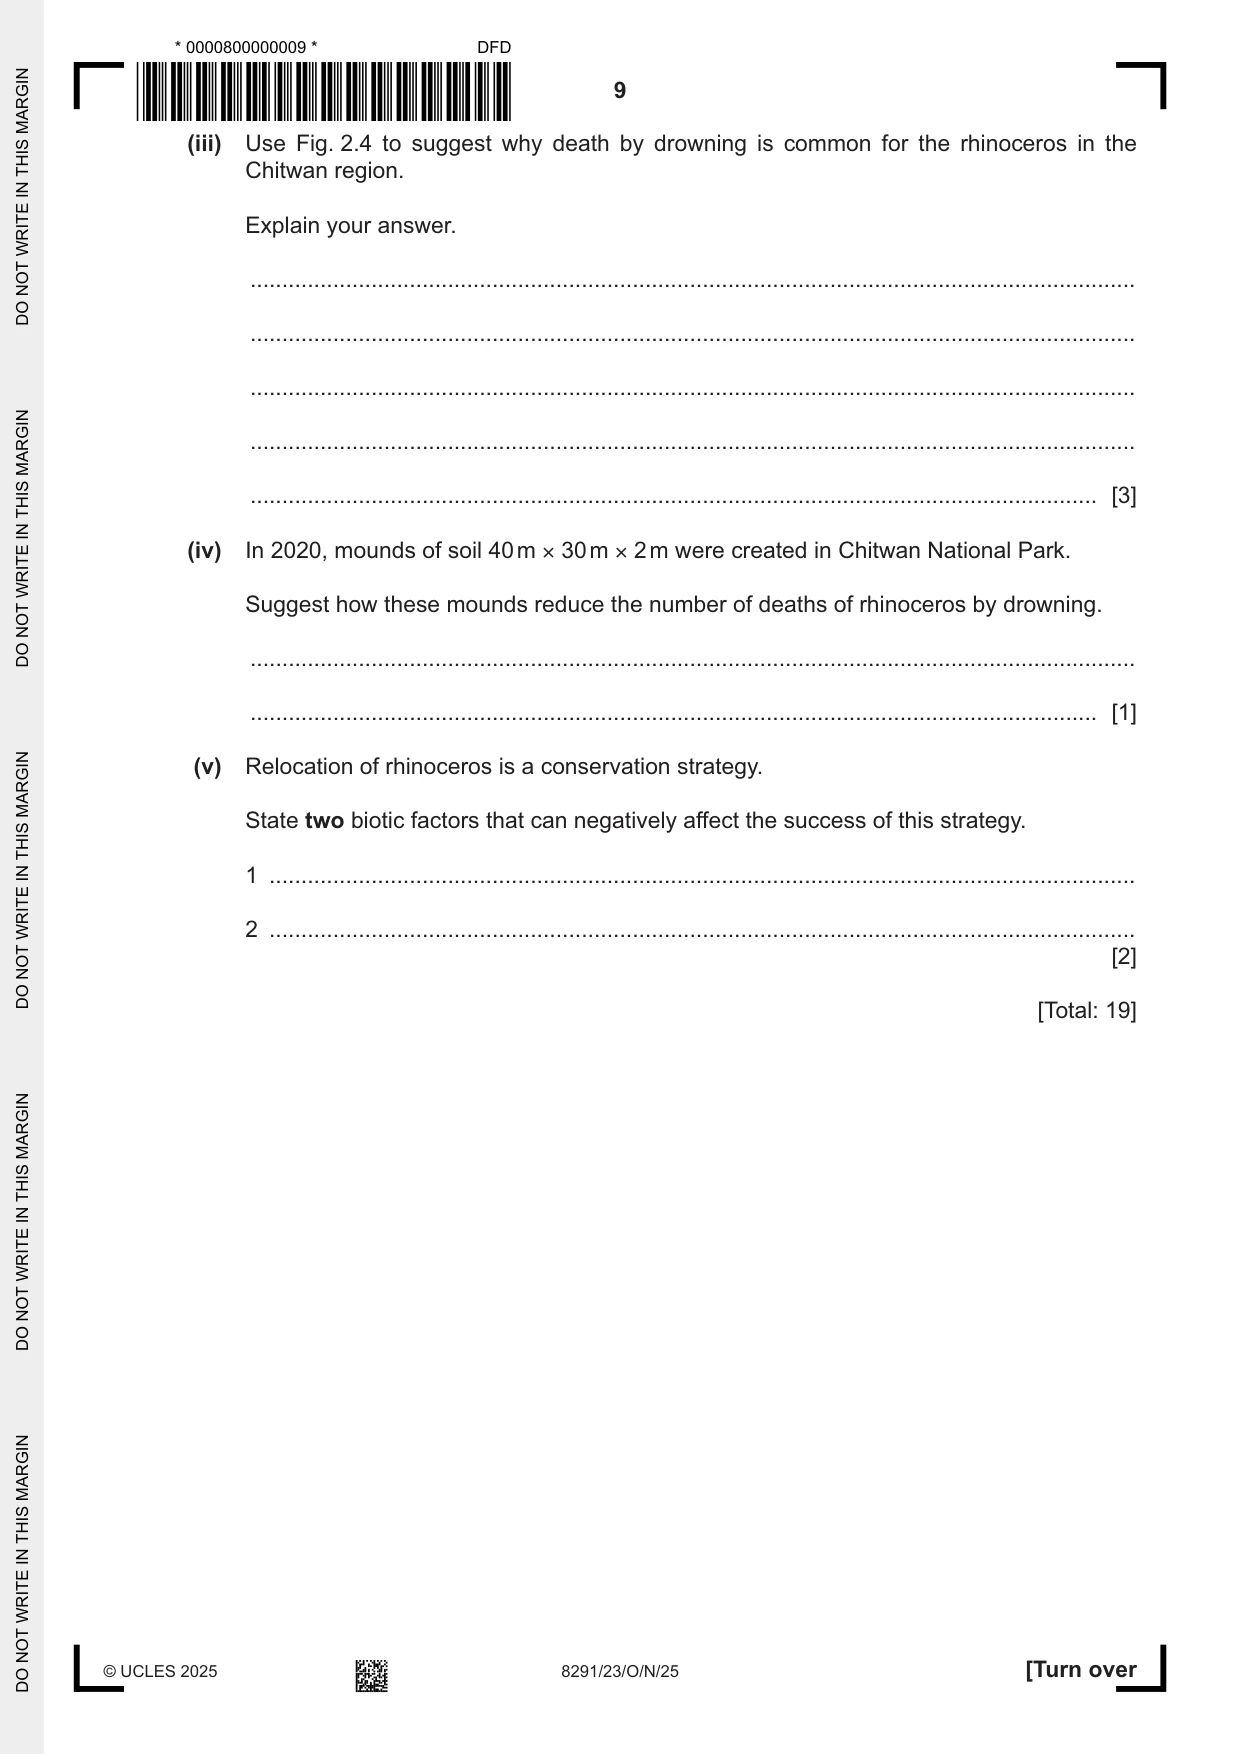
2 Rhinoceros are at risk from climate change. (a) A scientist uses capture-mark-recapture to record the number of rhinoceros in an area. (i) State one negative impact of this method of biodiversity investigation. ........................................................................................................................................... ..................................................................................................................................... [1] (ii) The scientist uses the Lincoln index to estimate population size. n1 × n2 N = m2 State what each of the letters represent in this formula. n1 ....................................................................................................................................... n2 ....................................................................................................................................... m2 ...................................................................................................................................... [3] (c) Fig. 2.2 shows the greater one-horned rhinoceros in Chitwan National Park in Nepal. Fig. 2.2 Fig. 2.3 shows the number of rhinoceros in the Chitwan region from 1950 to 2000. 900 800 700 600 500 number of rhinoceros 400 300 200 100 0 1950 1955 1960 1965 1970 1975 1980 1985 1990 1995 2000 year Fig. 2.3 (i) Use Fig. 2.3 to calculate the 5-year period with the greatest percentage change in the number of rhinoceros. Circle your answer. 1950–1955 1955–1960 1970–1975 1975–1980 [1] (ii) Suggest three reasons for the change in the number of rhinoceros from 1970 to 2000. 1 ........................................................................................................................................ 2 ........................................................................................................................................ 3 ........................................................................................................................................ [3] (d) Fig. 2.4 shows climate data for Chitwan National Park. Content removed due to copyright restrictions. Fig. 2.4 (i) Identify which month has the greatest range in temperature. ..................................................................................................................................... [1] (ii) Calculate the temperature range for September. ..................................................... °C [1] (iii) Use Fig. 2.4 to suggest why death by drowning is common for the rhinoceros in the Chitwan region. Explain your answer. ........................................................................................................................................... ........................................................................................................................................... ........................................................................................................................................... ........................................................................................................................................... ..................................................................................................................................... [3] (iv) In 2020, mounds of soil 40 m × 30 m × 2 m were created in Chitwan National Park. Suggest how these mounds reduce the number of deaths of rhinoceros by drowning. ........................................................................................................................................... ..................................................................................................................................... [1] (v) Relocation of rhinoceros is a conservation strategy. State two biotic factors that can negatively affect the success of this strategy. 1 ........................................................................................................................................ 2 ........................................................................................................................................ [2] [Total: 19]
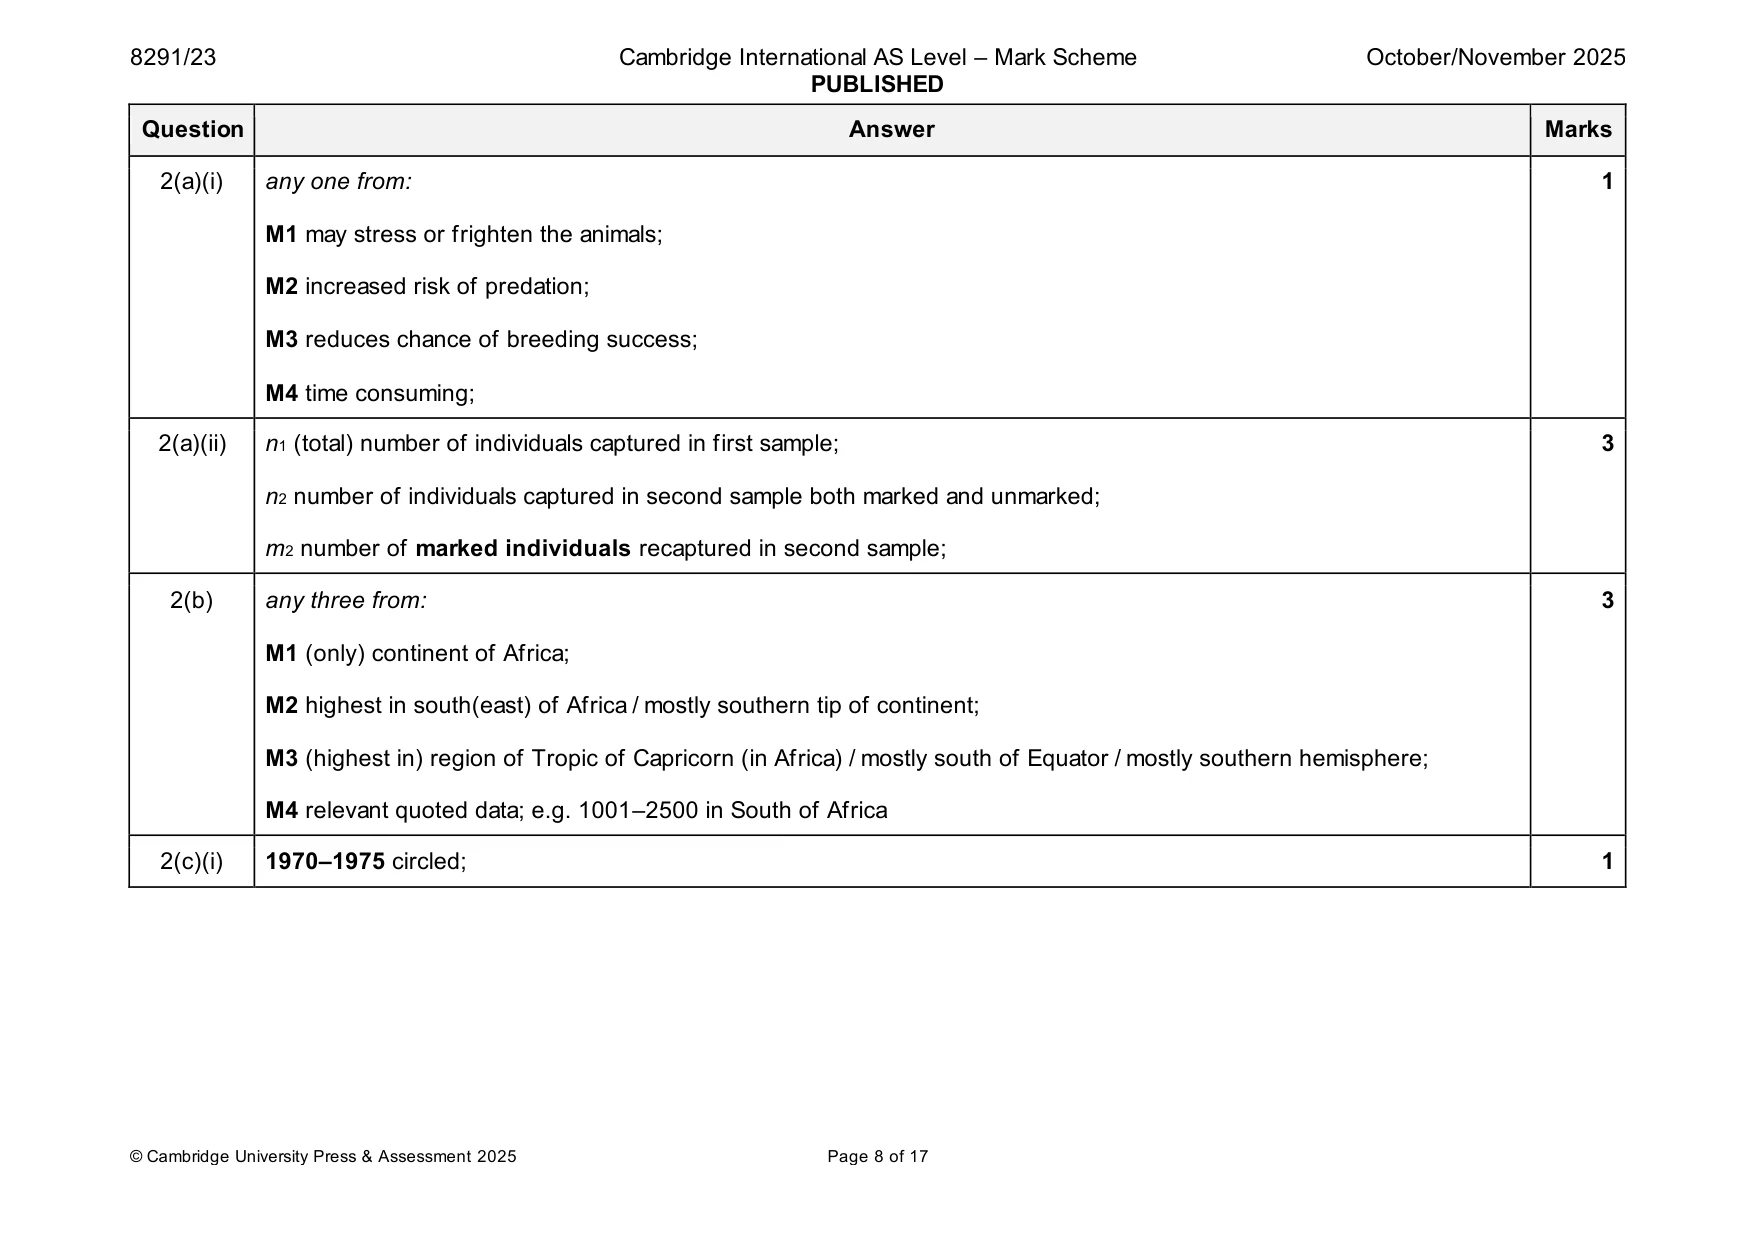
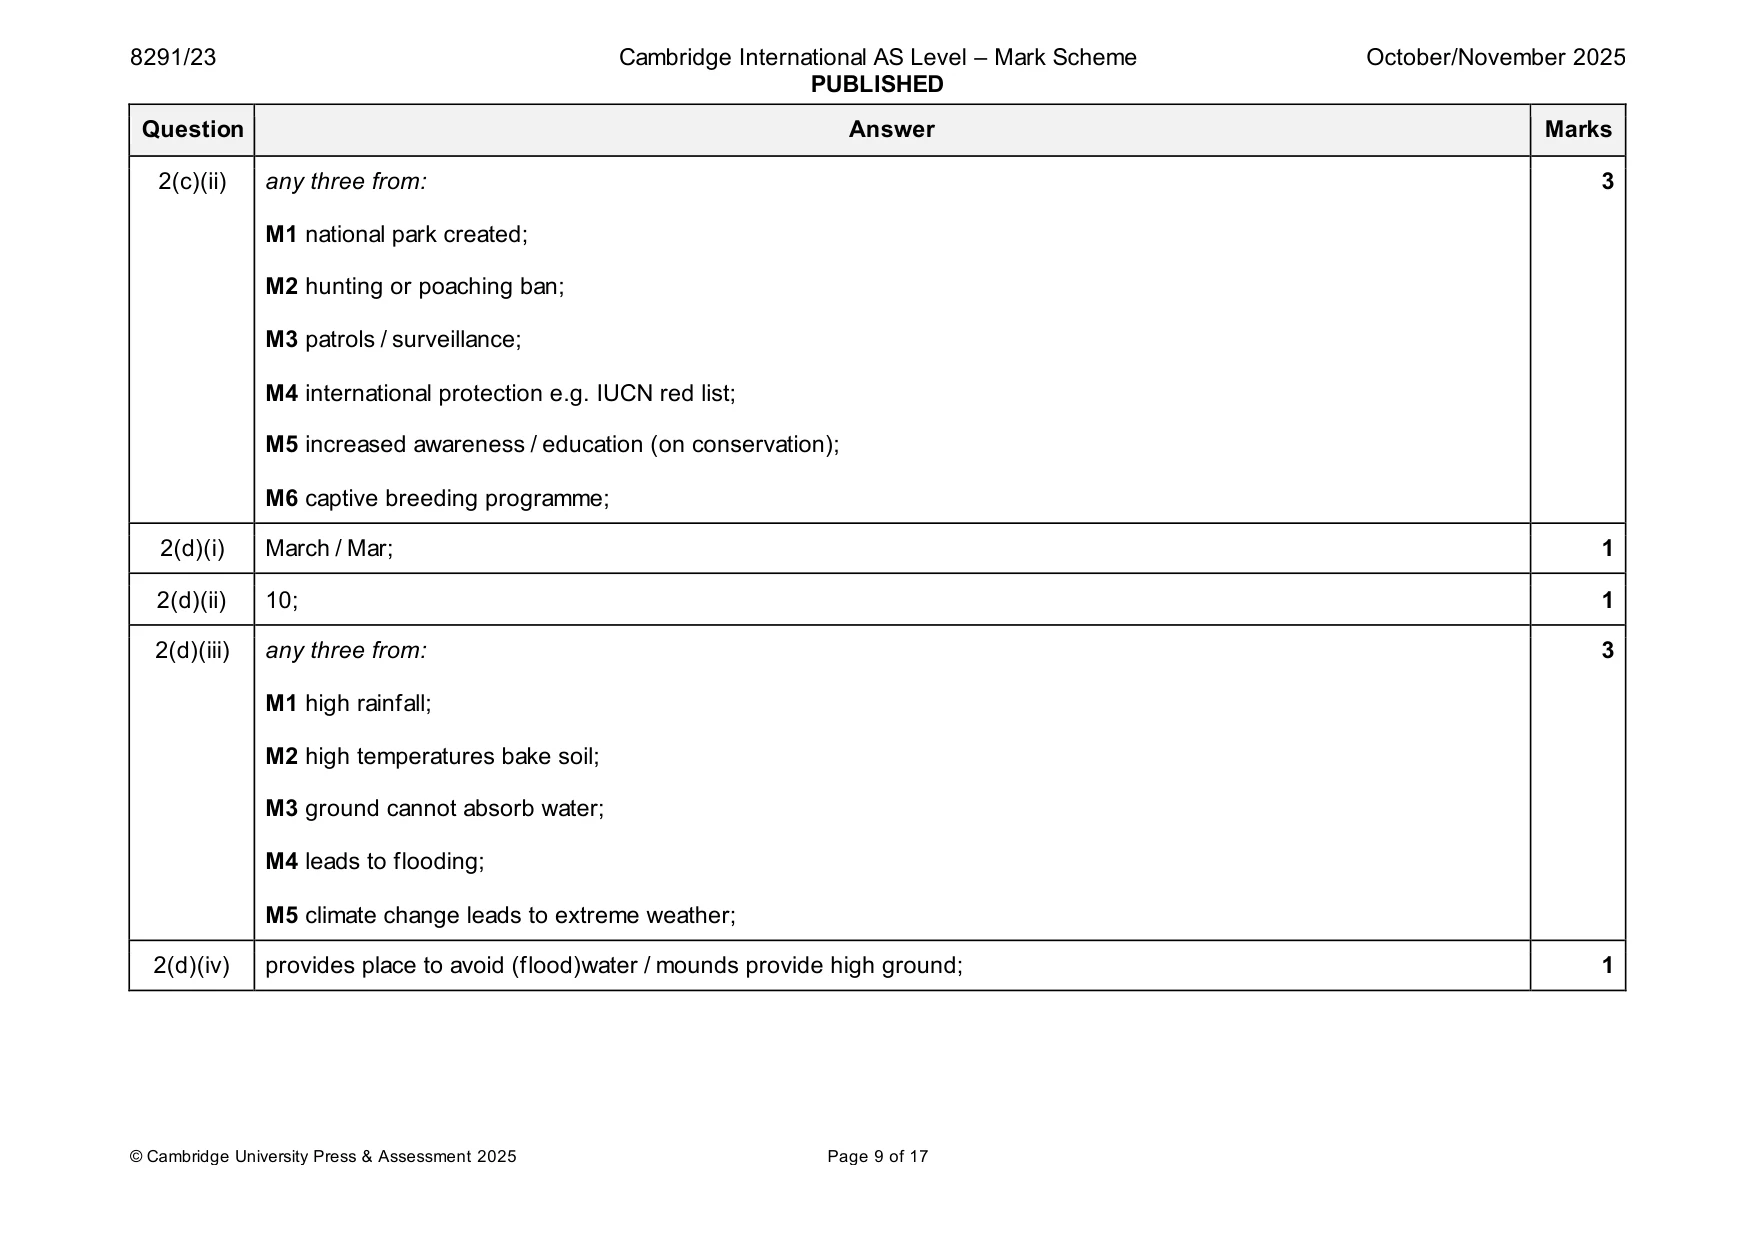
Mark scheme: 2(a)(i) any one from: 1 M1 may stress or frighten the animals; M2 increased risk of predation; M3 reduces chance of breeding success; M4 time consuming; 2(a)(ii) n1 (total) number of individuals captured in first sample; 3 n2 number of individuals captured in second sample both marked and unmarked; m2 number of marked individuals recaptured in second sample; 2(b) any three from: 3 M1 (only) continent of Africa; M2 highest in south(east) of Africa / mostly southern tip of continent; M3 (highest in) region of Tropic of Capricorn (in Africa) / mostly south of Equator / mostly southern hemisphere; M4 relevant quoted data; e.g. 1001–2500 in South of Africa 2(c)(i) 1970–1975 circled; 1 2(c)(ii) any three from: 3 M1 national park created; M2 hunting or poaching ban; M3 patrols / surveillance; M4 international protection e.g. IUCN red list; M5 increased awareness / education (on conservation); M6 captive breeding programme; 2(d)(i) March / Mar; 1 2(d)(ii) 10; 1 2(d)(iii) any three from: 3 M1 high rainfall; M2 high temperatures bake soil; M3 ground cannot absorb water; M4 leads to flooding; M5 climate change leads to extreme weather; 2(d)(iv) provides place to avoid (flood)water / mounds provide high ground; 1 2(d)(v) any two from: 2 M1 predation; M2 hunting / poaching; M3 competition for named resource, e.g., food / water / shelter / space; M4 disease / pests;
Q3 · An Arctic walrus resting on sea ice
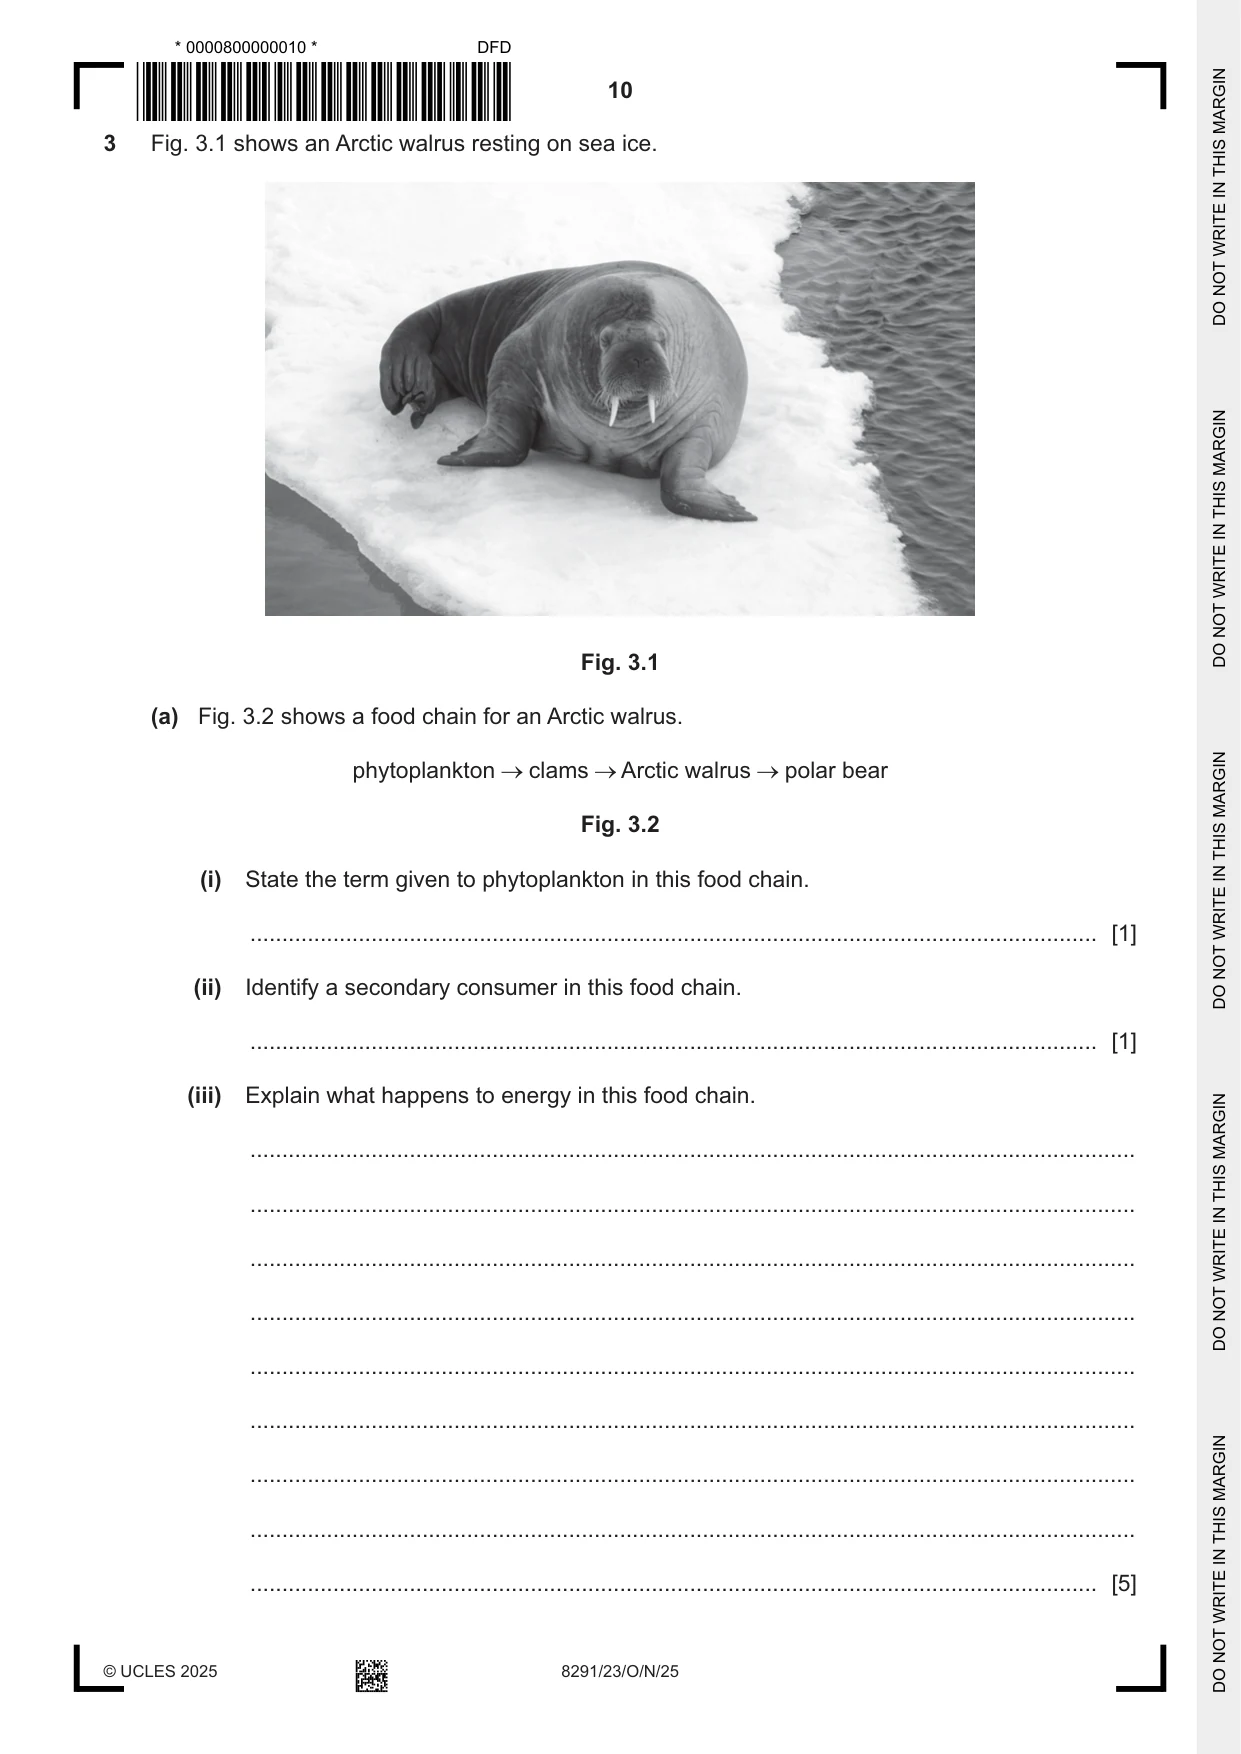
3 Fig. 3.1 shows an Arctic walrus resting on sea ice. Fig. 3.1 (a) Fig. 3.2 shows a food chain for an Arctic walrus. phytoplankton clams Arctic walrus polar bear Fig. 3.2 (i) State the term given to phytoplankton in this food chain. ..................................................................................................................................... [1] (ii) Identify a secondary consumer in this food chain. ..................................................................................................................................... [1] (iii) Explain what happens to energy in this food chain. ........................................................................................................................................... ........................................................................................................................................... ........................................................................................................................................... ........................................................................................................................................... ........................................................................................................................................... ........................................................................................................................................... ........................................................................................................................................... ........................................................................................................................................... ..................................................................................................................................... [5] (b) Walruses usually rest on sea ice between feeding. However, in the last 10 years, large numbers of walrus have been seen to travel up to 200 km to rest on land. (i) Suggest one reason for this change in behaviour. ........................................................................................................................................... ..................................................................................................................................... [1] (ii) Suggest two negative impacts on walruses due to this change in behaviour. 1 ........................................................................................................................................ ........................................................................................................................................... 2 ........................................................................................................................................ ........................................................................................................................................... [2] (c) Fig. 3.3 is a drawing of a satellite image from a project called ‘walrus from space’. Content removed due to copyright restrictions. Fig. 3.3 The project counts populations of walrus using more than 540 000 satellite images. Members of the public volunteer to help with the project. There are three stages to the project. stage 1: A satellite image of an area where walrus are expected is given to a volunteer. stage 2: The volunteer rejects any satellite image without a walrus. stage 3: The volunteer puts an electronic dot on every walrus in the satellite image. The dots are counted by a computer. (i) Suggest three limitations of this project to count walrus populations. 1 ........................................................................................................................................ ........................................................................................................................................... 2 ........................................................................................................................................ ........................................................................................................................................... 3 ........................................................................................................................................ ........................................................................................................................................... [3] (ii) Suggest two benefits of this project to count walrus populations. 1 ........................................................................................................................................ ........................................................................................................................................... 2 ........................................................................................................................................ ........................................................................................................................................... [2] (iii) State the name of this data collection method that uses data provided by members of the public. ..................................................................................................................................... [1] [Total: 16]
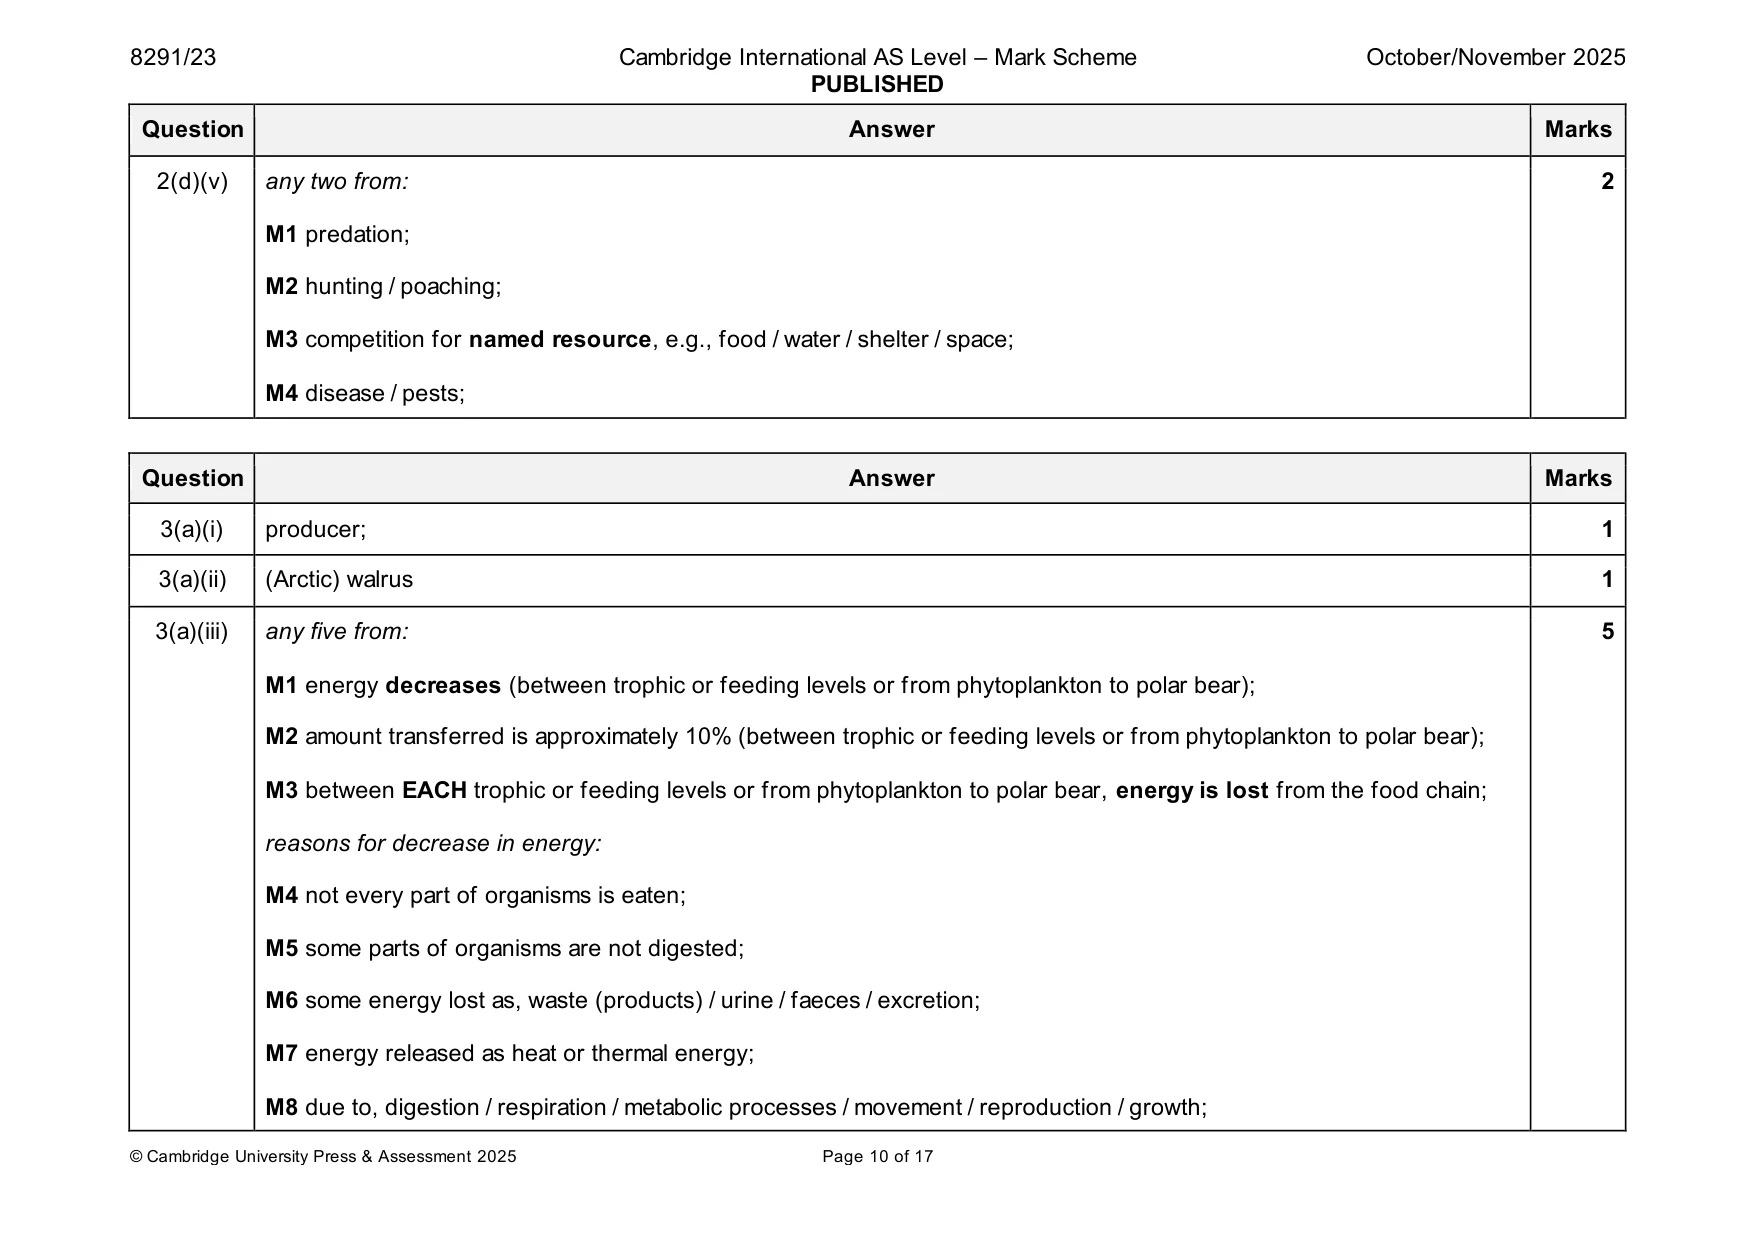
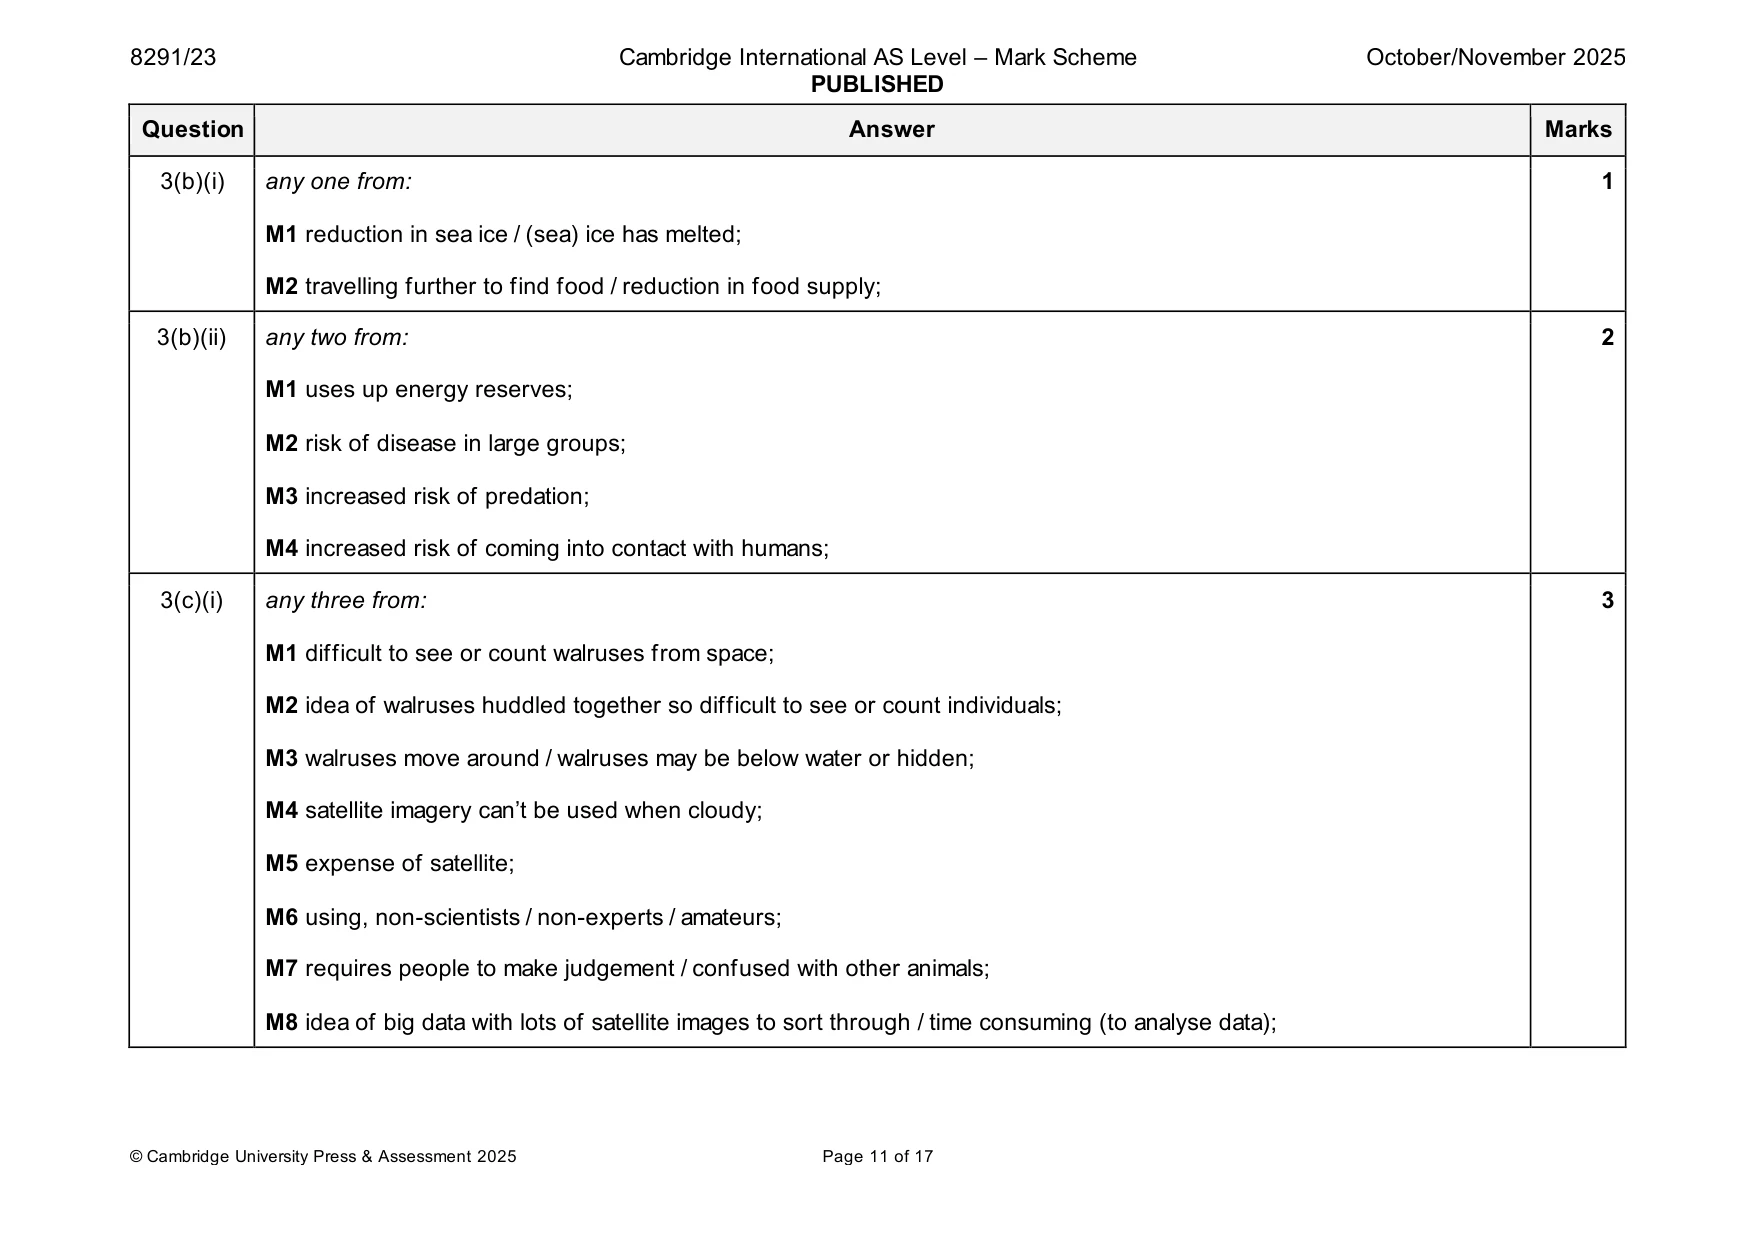
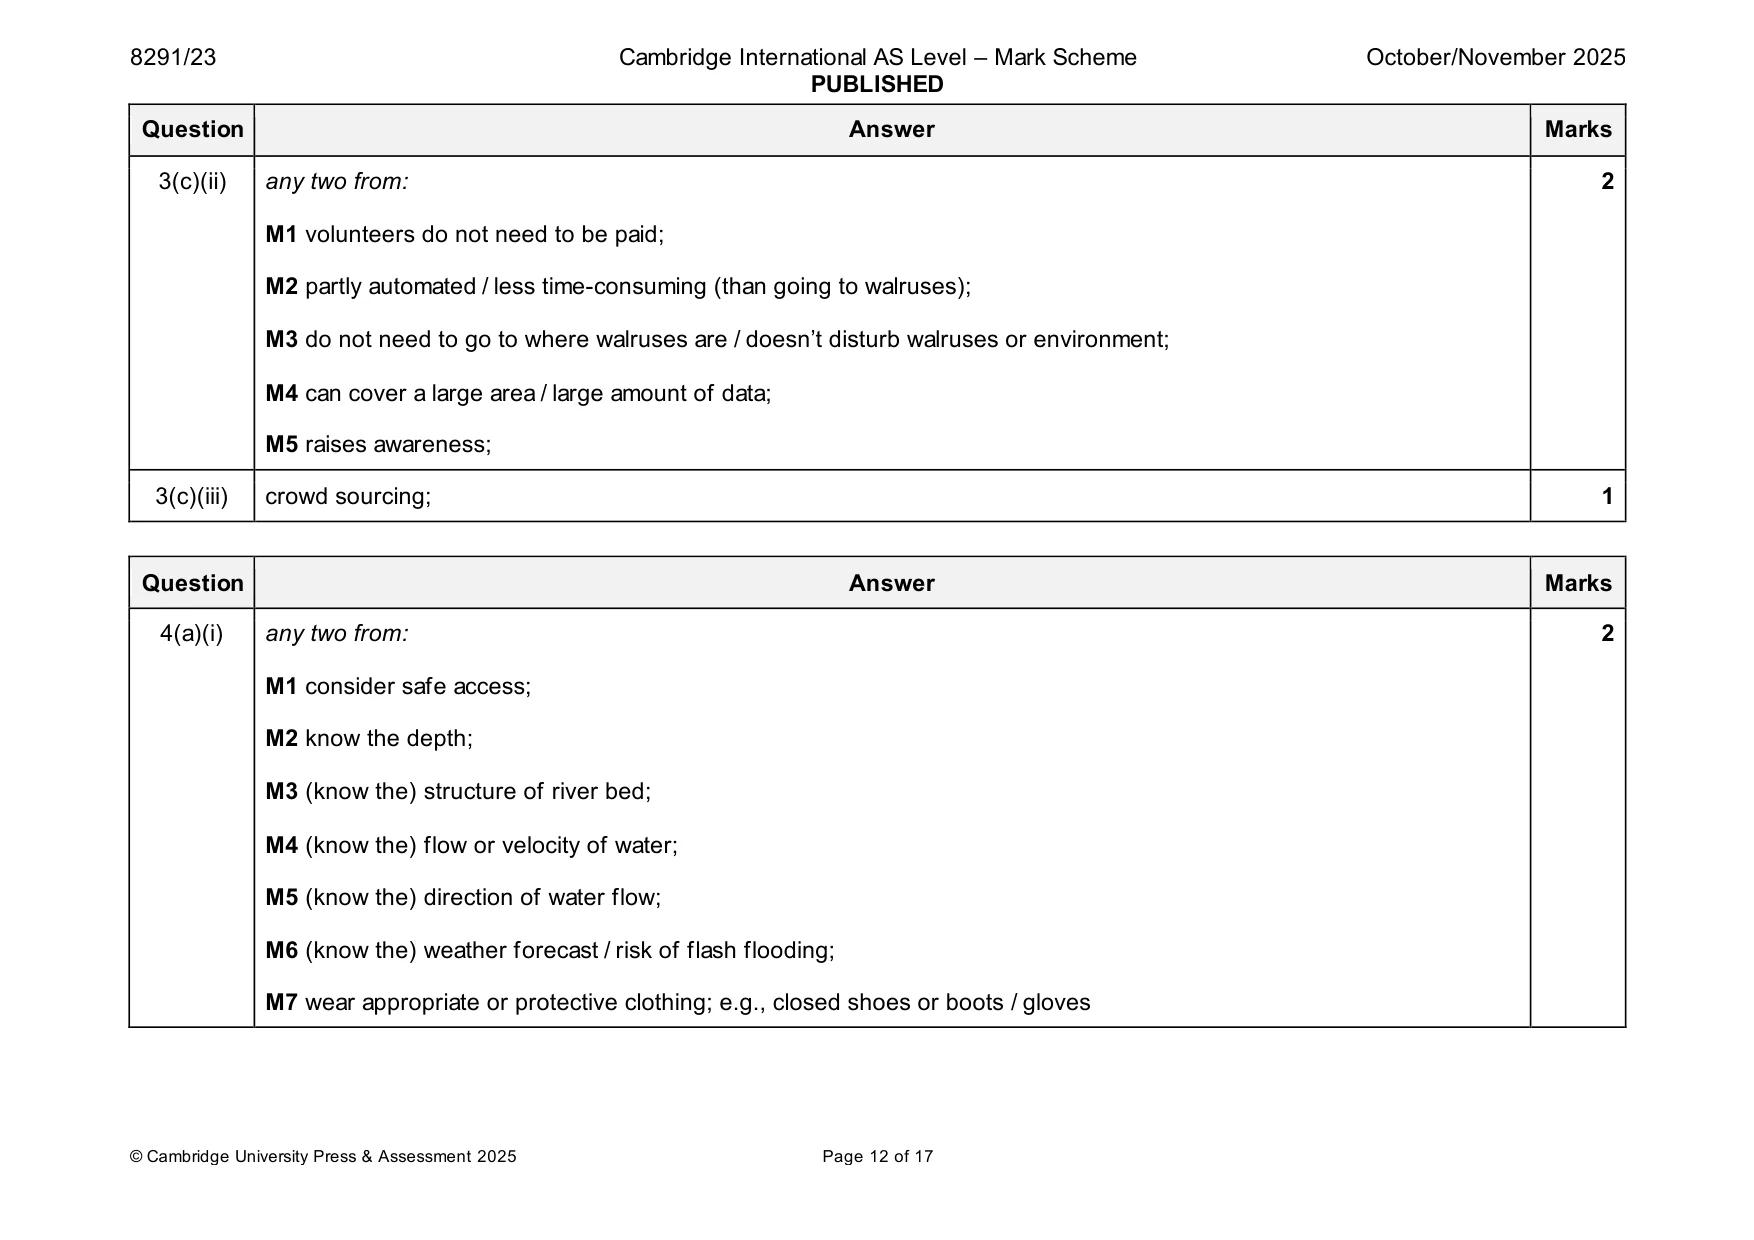
Mark scheme: 3(a)(i) producer; 1 3(a)(ii) (Arctic) walrus 1 3(a)(iii) any five from: 5 M1 energy decreases (between trophic or feeding levels or from phytoplankton to polar bear); M2 amount transferred is approximately 10% (between trophic or feeding levels or from phytoplankton to polar bear); M3 between EACH trophic or feeding levels or from phytoplankton to polar bear, energy is lost from the food chain; reasons for decrease in energy: M4 not every part of organisms is eaten; M5 some parts of organisms are not digested; M6 some energy lost as, waste (products) / urine / faeces / excretion; M7 energy released as heat or thermal energy; M8 due to, digestion / respiration / metabolic processes / movement / reproduction / growth; 3(b)(i) any one from: 1 M1 reduction in sea ice / (sea) ice has melted; M2 travelling further to find food / reduction in food supply; 3(b)(ii) any two from: 2 M1 uses up energy reserves; M2 risk of disease in large groups; M3 increased risk of predation; M4 increased risk of coming into contact with humans; 3(c)(i) any three from: 3 M1 difficult to see or count walruses from space; M2 idea of walruses huddled together so difficult to see or count individuals; M3 walruses move around / walruses may be below water or hidden; M4 satellite imagery can’t be used when cloudy; M5 expense of satellite; M6 using, non-scientists / non-experts / amateurs; M7 requires people to make judgement / confused with other animals; M8 idea of big data with lots of satellite images to sort through / time consuming (to analyse data); 3(c)(ii) any two from: 2 M1 volunteers do not need to be paid; M2 partly automated / less time-consuming (than going to walruses); M3 do not need to go to where walruses are / doesn’t disturb walruses or environment; M4 can cover a large area / large amount of data; M5 raises awareness; 3(c)(iii) crowd sourcing; 1
Q4 · A mayfly nymph in a river
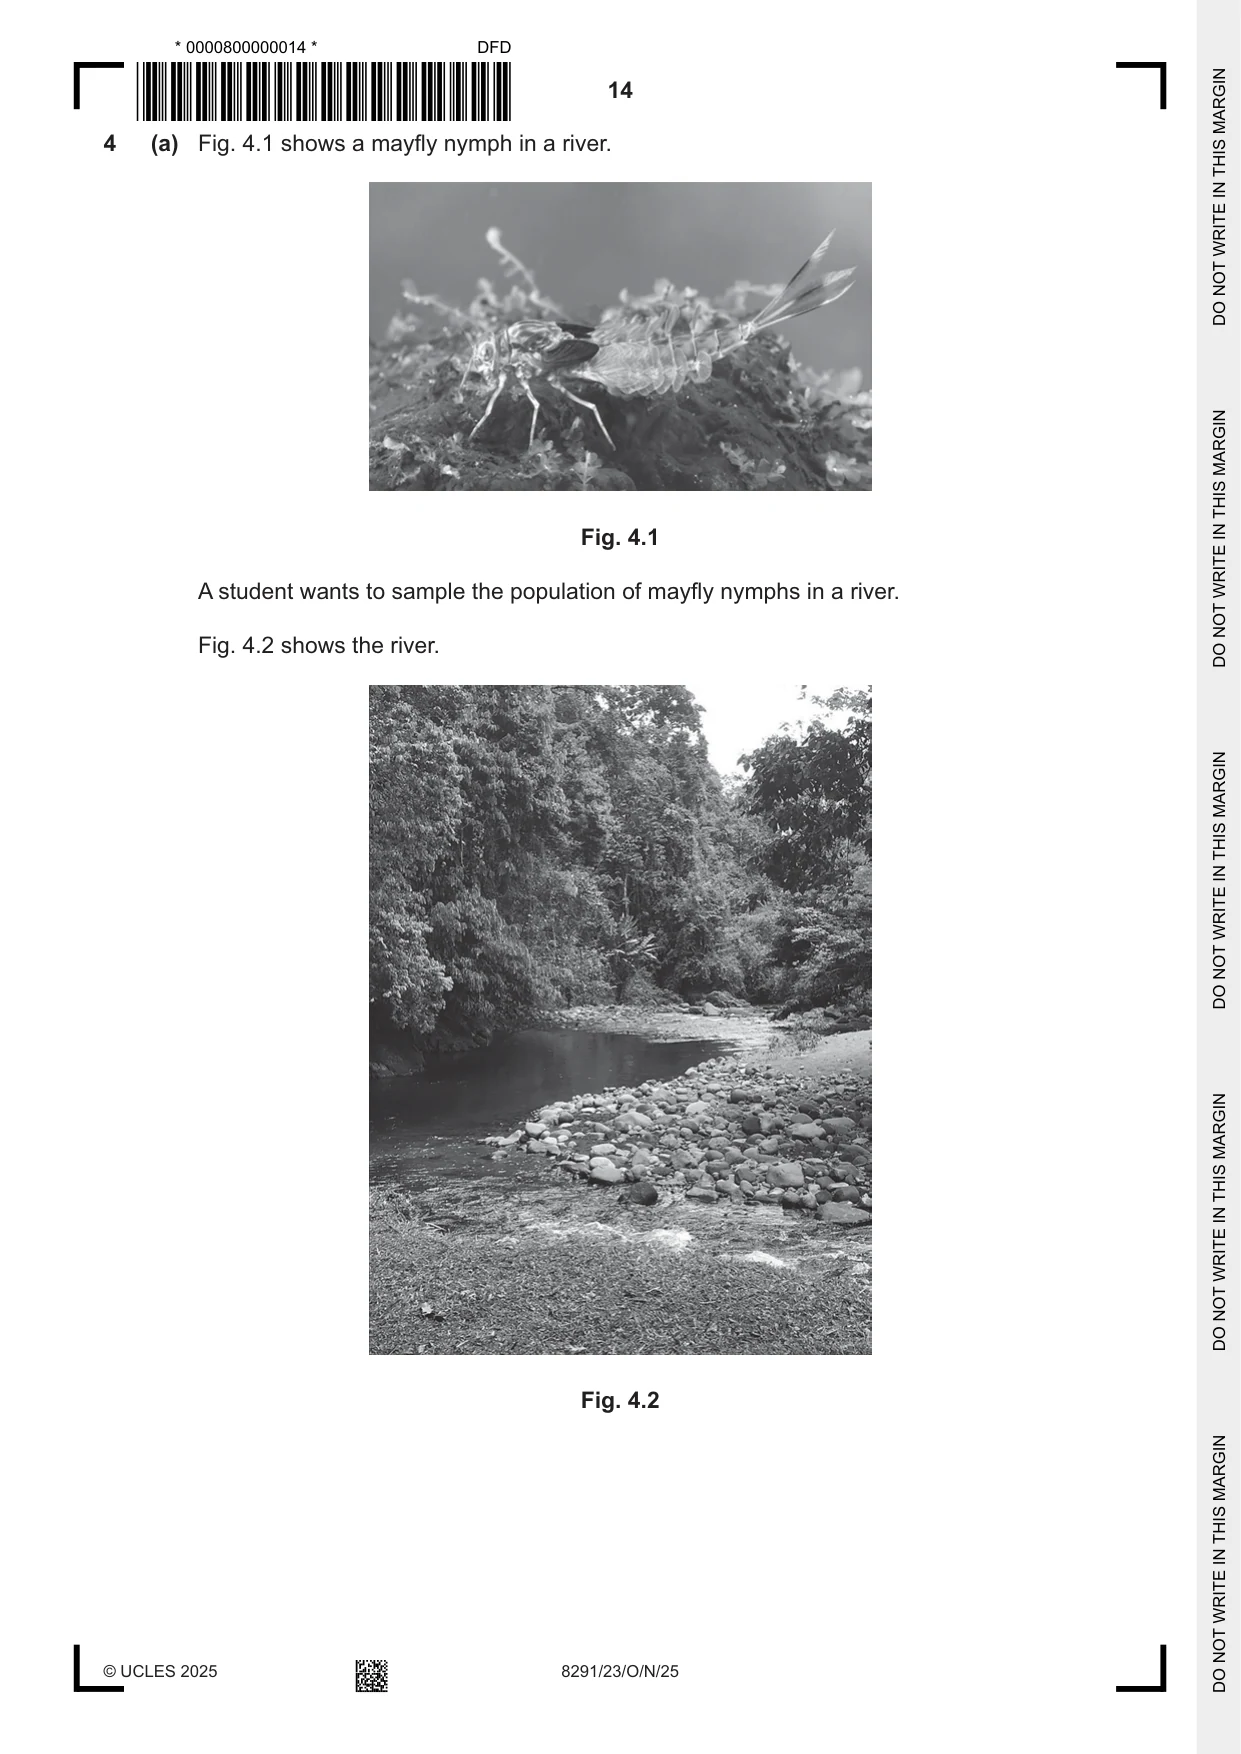
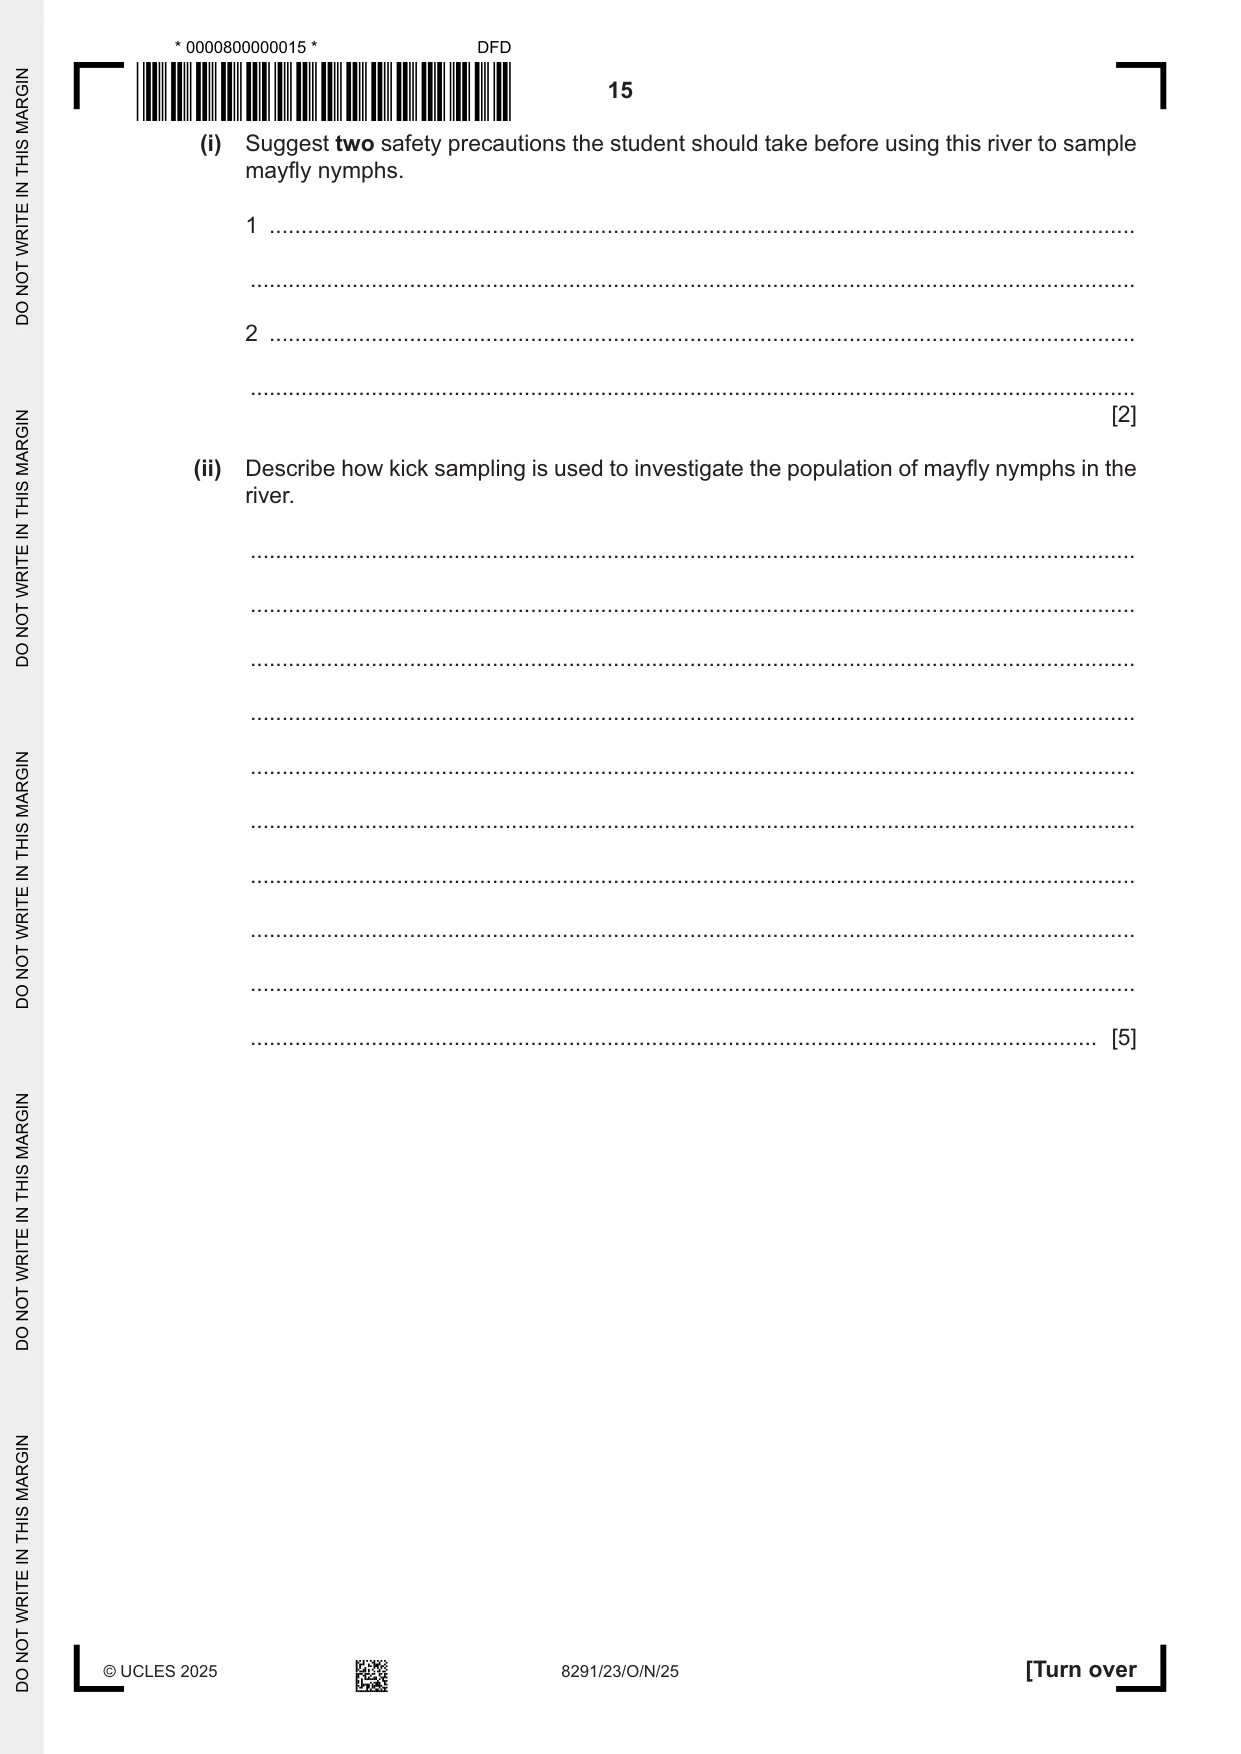
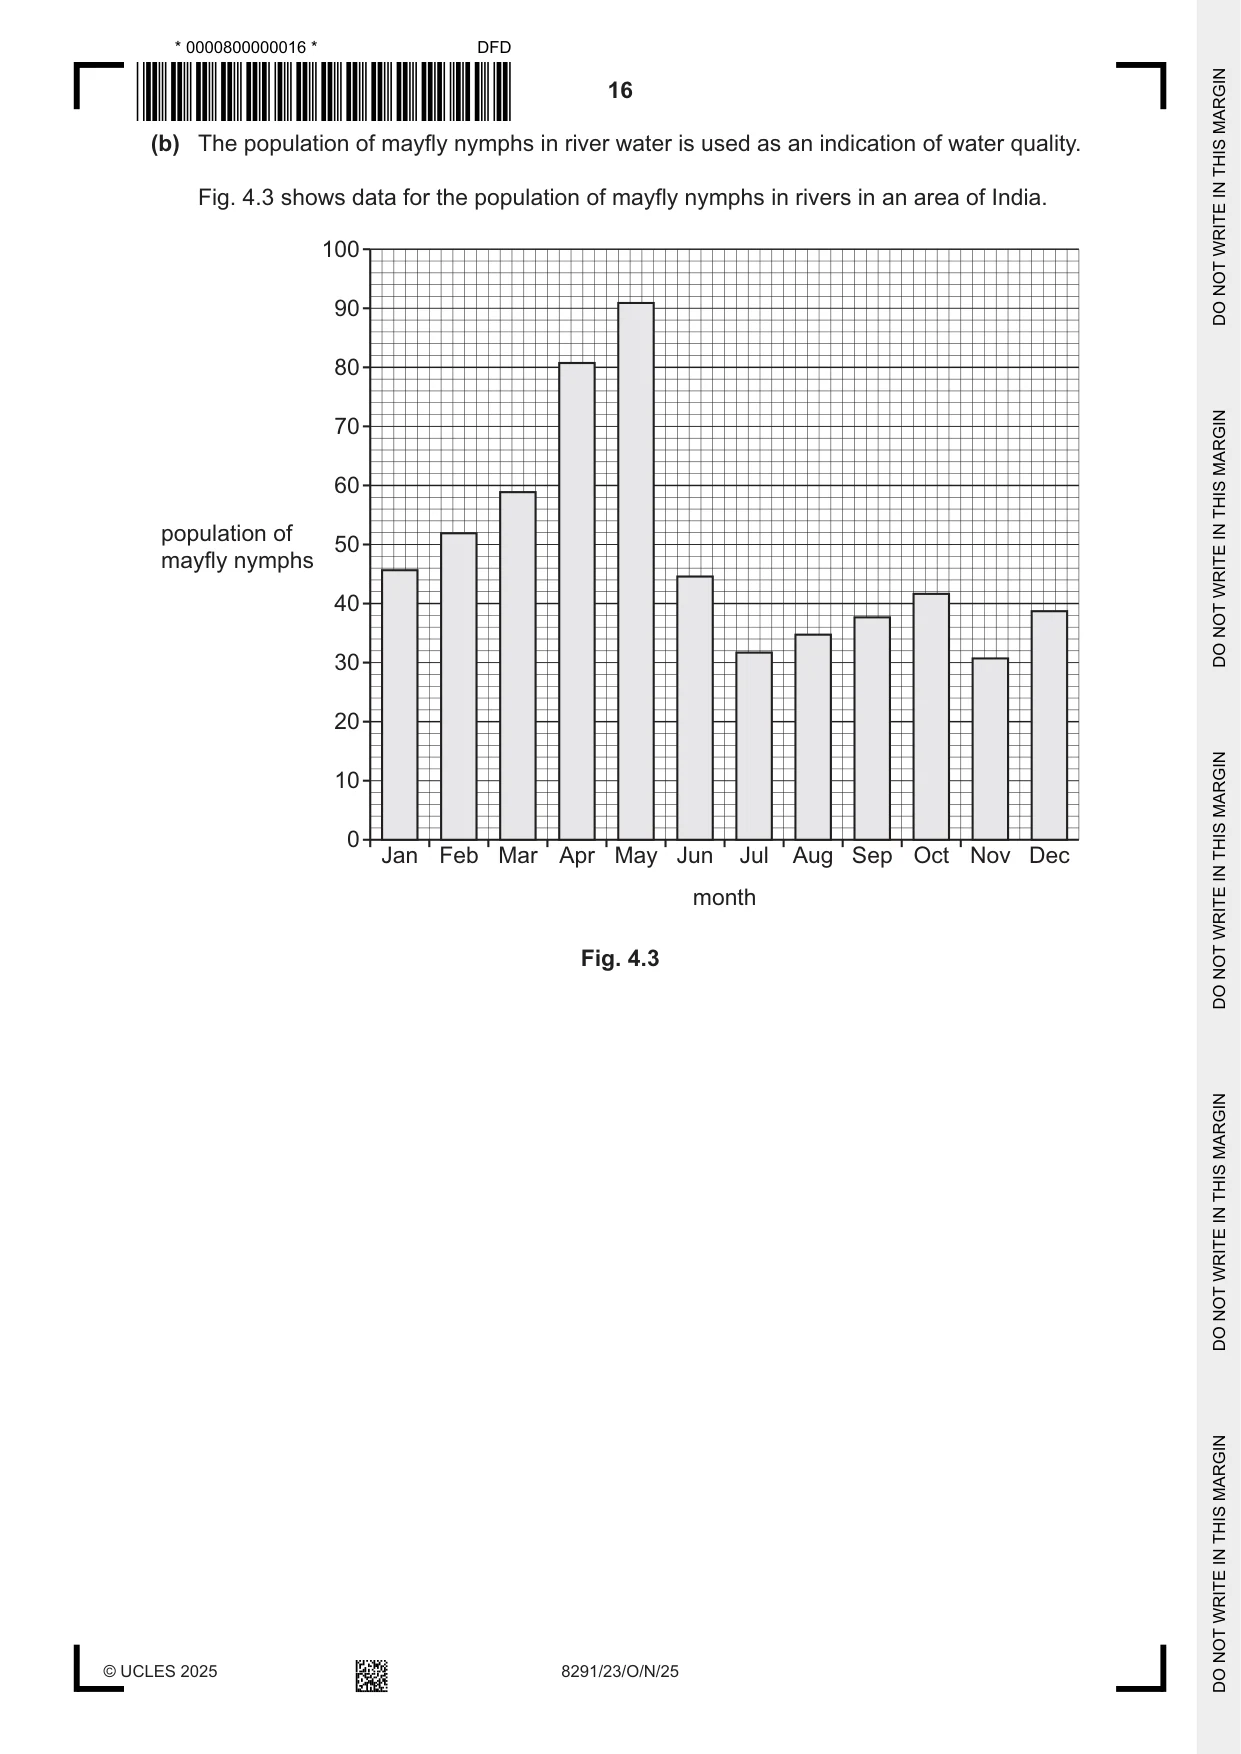
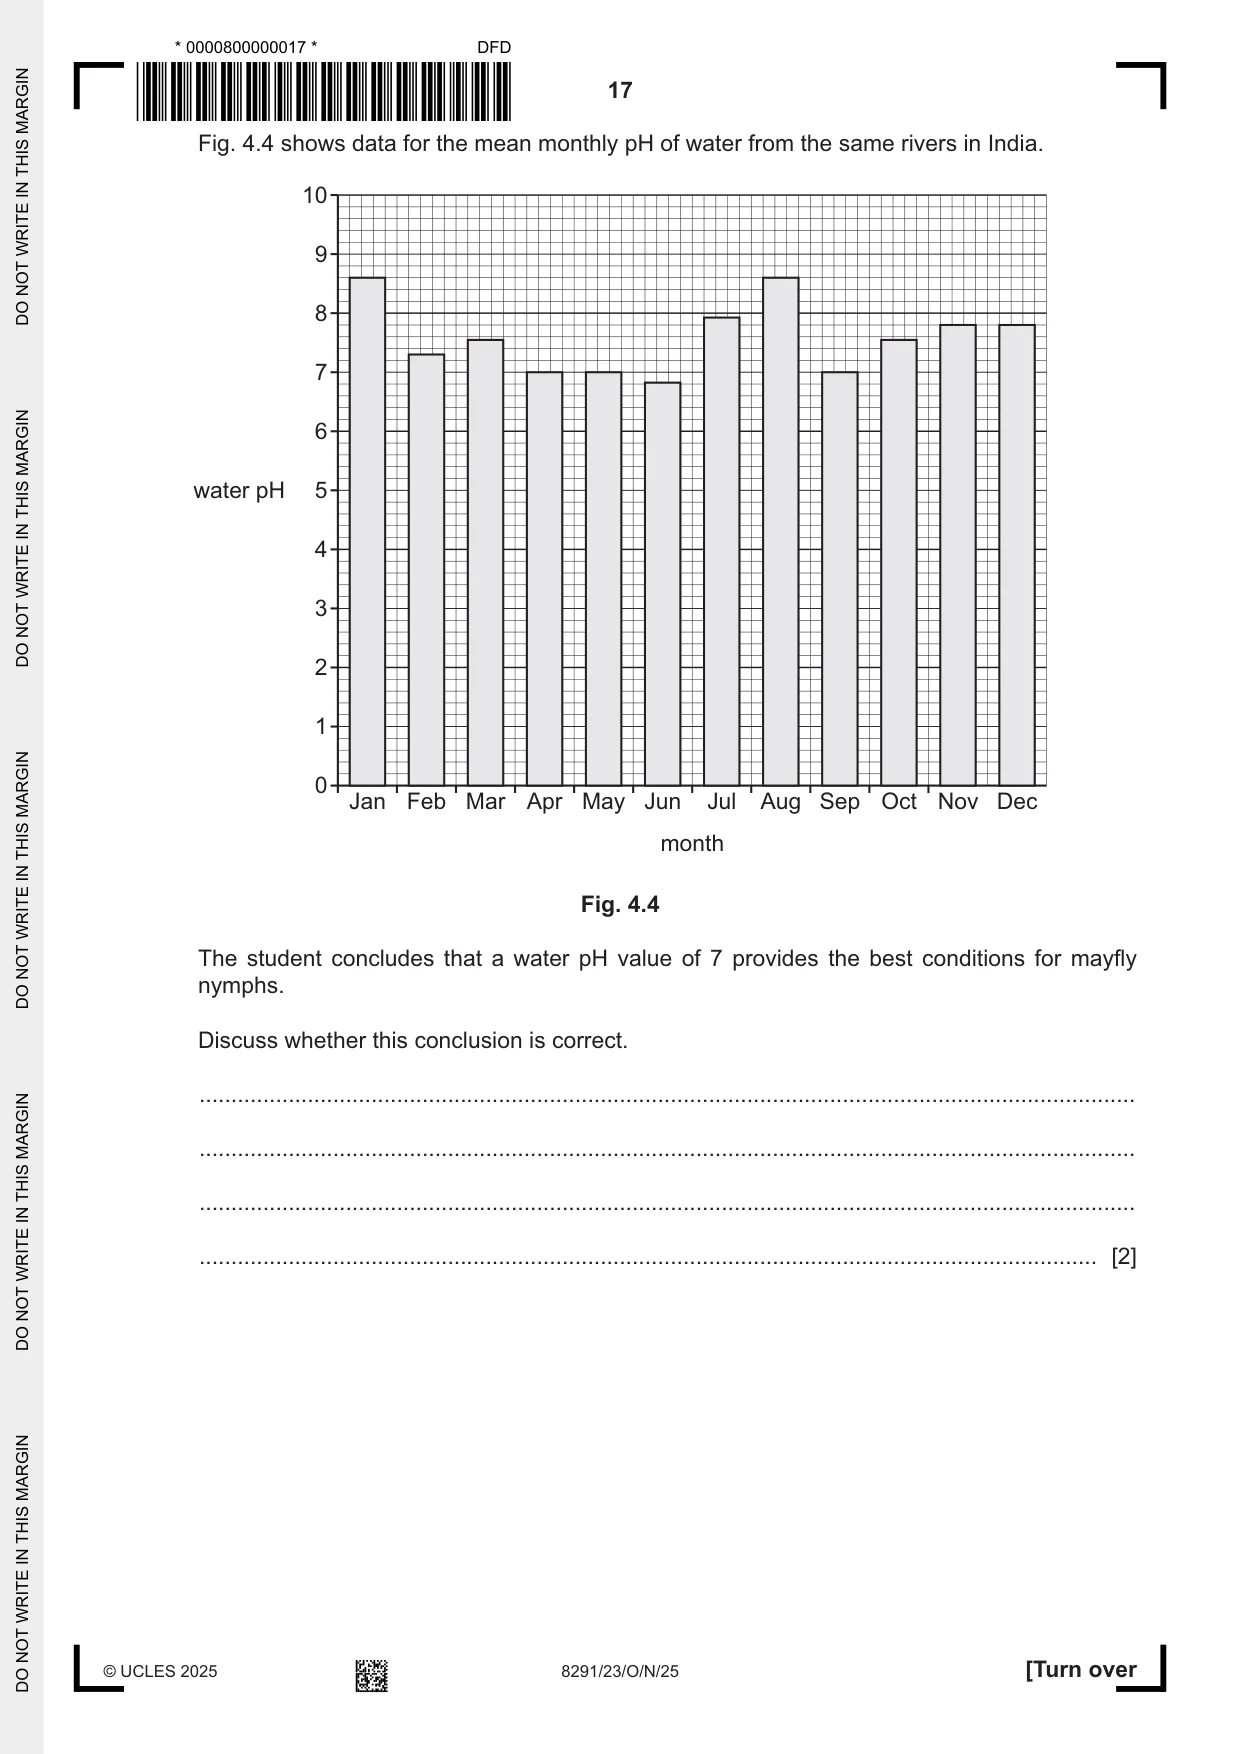
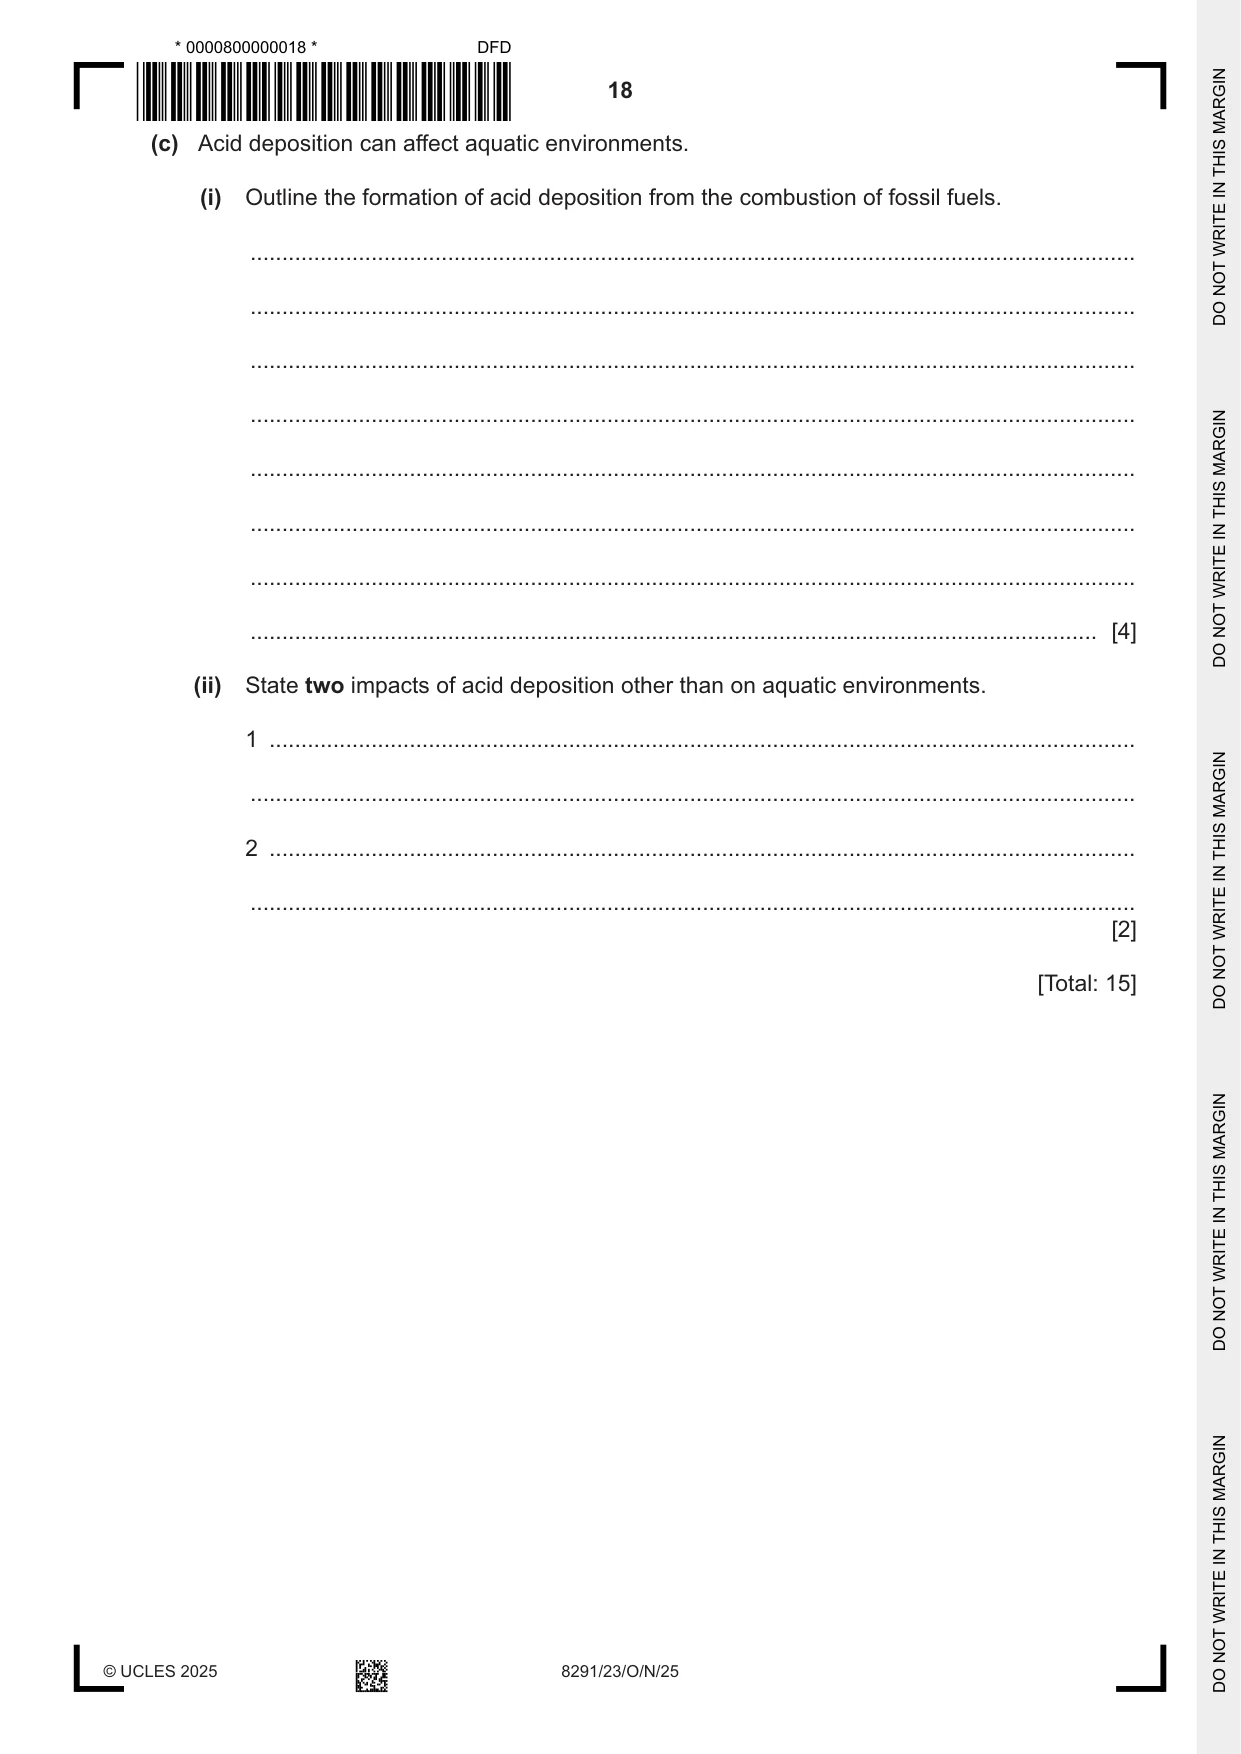
4 (a) Fig. 4.1 shows a mayfly nymph in a river. Fig. 4.1 A student wants to sample the population of mayfly nymphs in a river. Fig. 4.2 shows the river. Fig. 4.2 (i) Suggest two safety precautions the student should take before using this river to sample mayfly nymphs. 1 ........................................................................................................................................ ........................................................................................................................................... 2 ........................................................................................................................................ ........................................................................................................................................... [2] (ii) Describe how kick sampling is used to investigate the population of mayfly nymphs in the river. ........................................................................................................................................... ........................................................................................................................................... ........................................................................................................................................... ........................................................................................................................................... ........................................................................................................................................... ........................................................................................................................................... ........................................................................................................................................... ........................................................................................................................................... ........................................................................................................................................... ..................................................................................................................................... [5] (b) The population of mayfly nymphs in river water is used as an indication of water quality. Fig. 4.3 shows data for the population of mayfly nymphs in rivers in an area of India. 100 90 80 70 60 population of 50 mayfly nymphs 40 30 20 10 0 Jan Feb Mar Apr May Jun Jul Aug Sep Oct Nov Dec month Fig. 4.3 Fig. 4.4 shows data for the mean monthly pH of water from the same rivers in India. 10 9 8 7 6 water pH 5 4 3 2 1 0 Jan Feb Mar Apr May Jun Jul Aug Sep Oct Nov Dec month Fig. 4.4 The student concludes that a water pH value of 7 provides the best conditions for mayfly nymphs. Discuss whether this conclusion is correct. ................................................................................................................................................... ................................................................................................................................................... ................................................................................................................................................... ............................................................................................................................................. [2] (c) Acid deposition can affect aquatic environments. (i) Outline the formation of acid deposition from the combustion of fossil fuels. ........................................................................................................................................... ........................................................................................................................................... ........................................................................................................................................... ........................................................................................................................................... ........................................................................................................................................... ........................................................................................................................................... ........................................................................................................................................... ..................................................................................................................................... [4] (ii) State two impacts of acid deposition other than on aquatic environments. 1 ........................................................................................................................................ ........................................................................................................................................... 2 ........................................................................................................................................ ........................................................................................................................................... [2] [Total: 15]
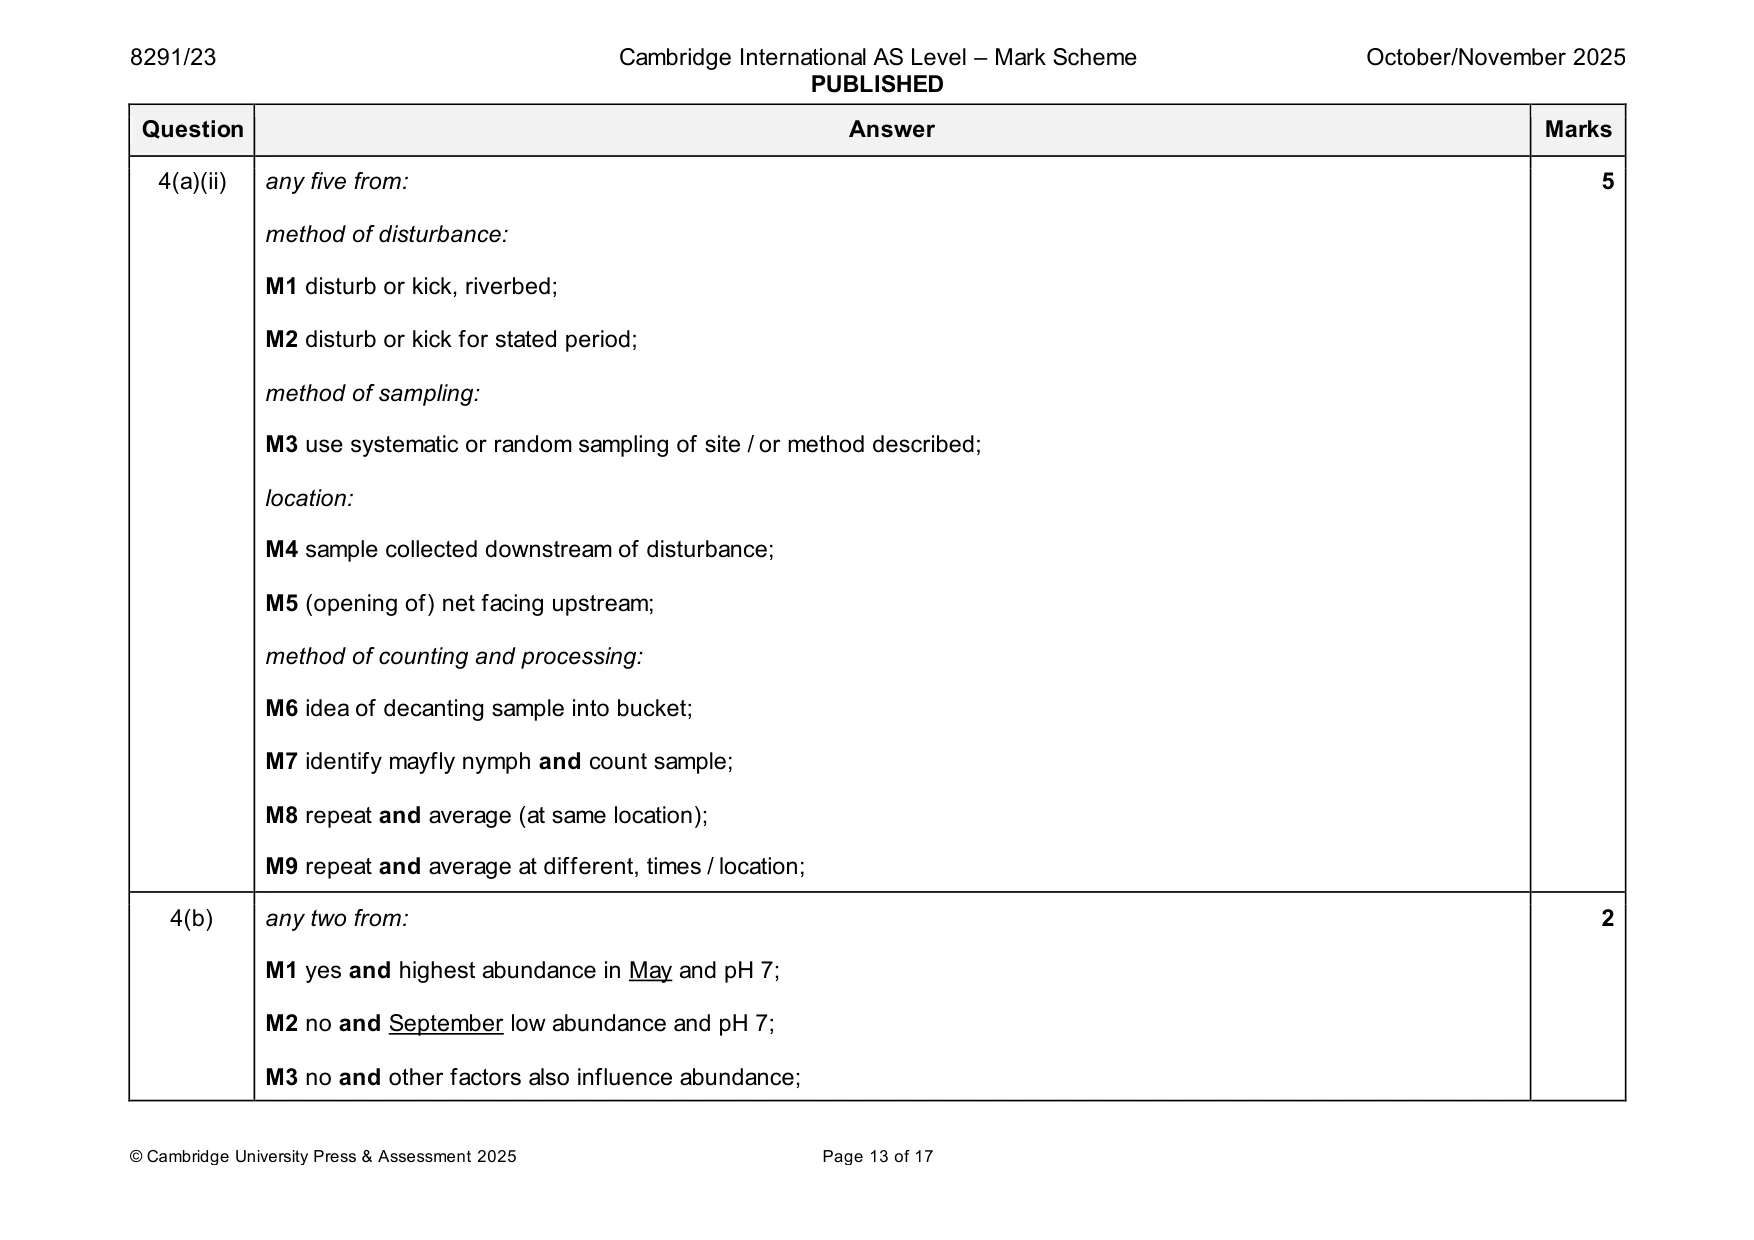
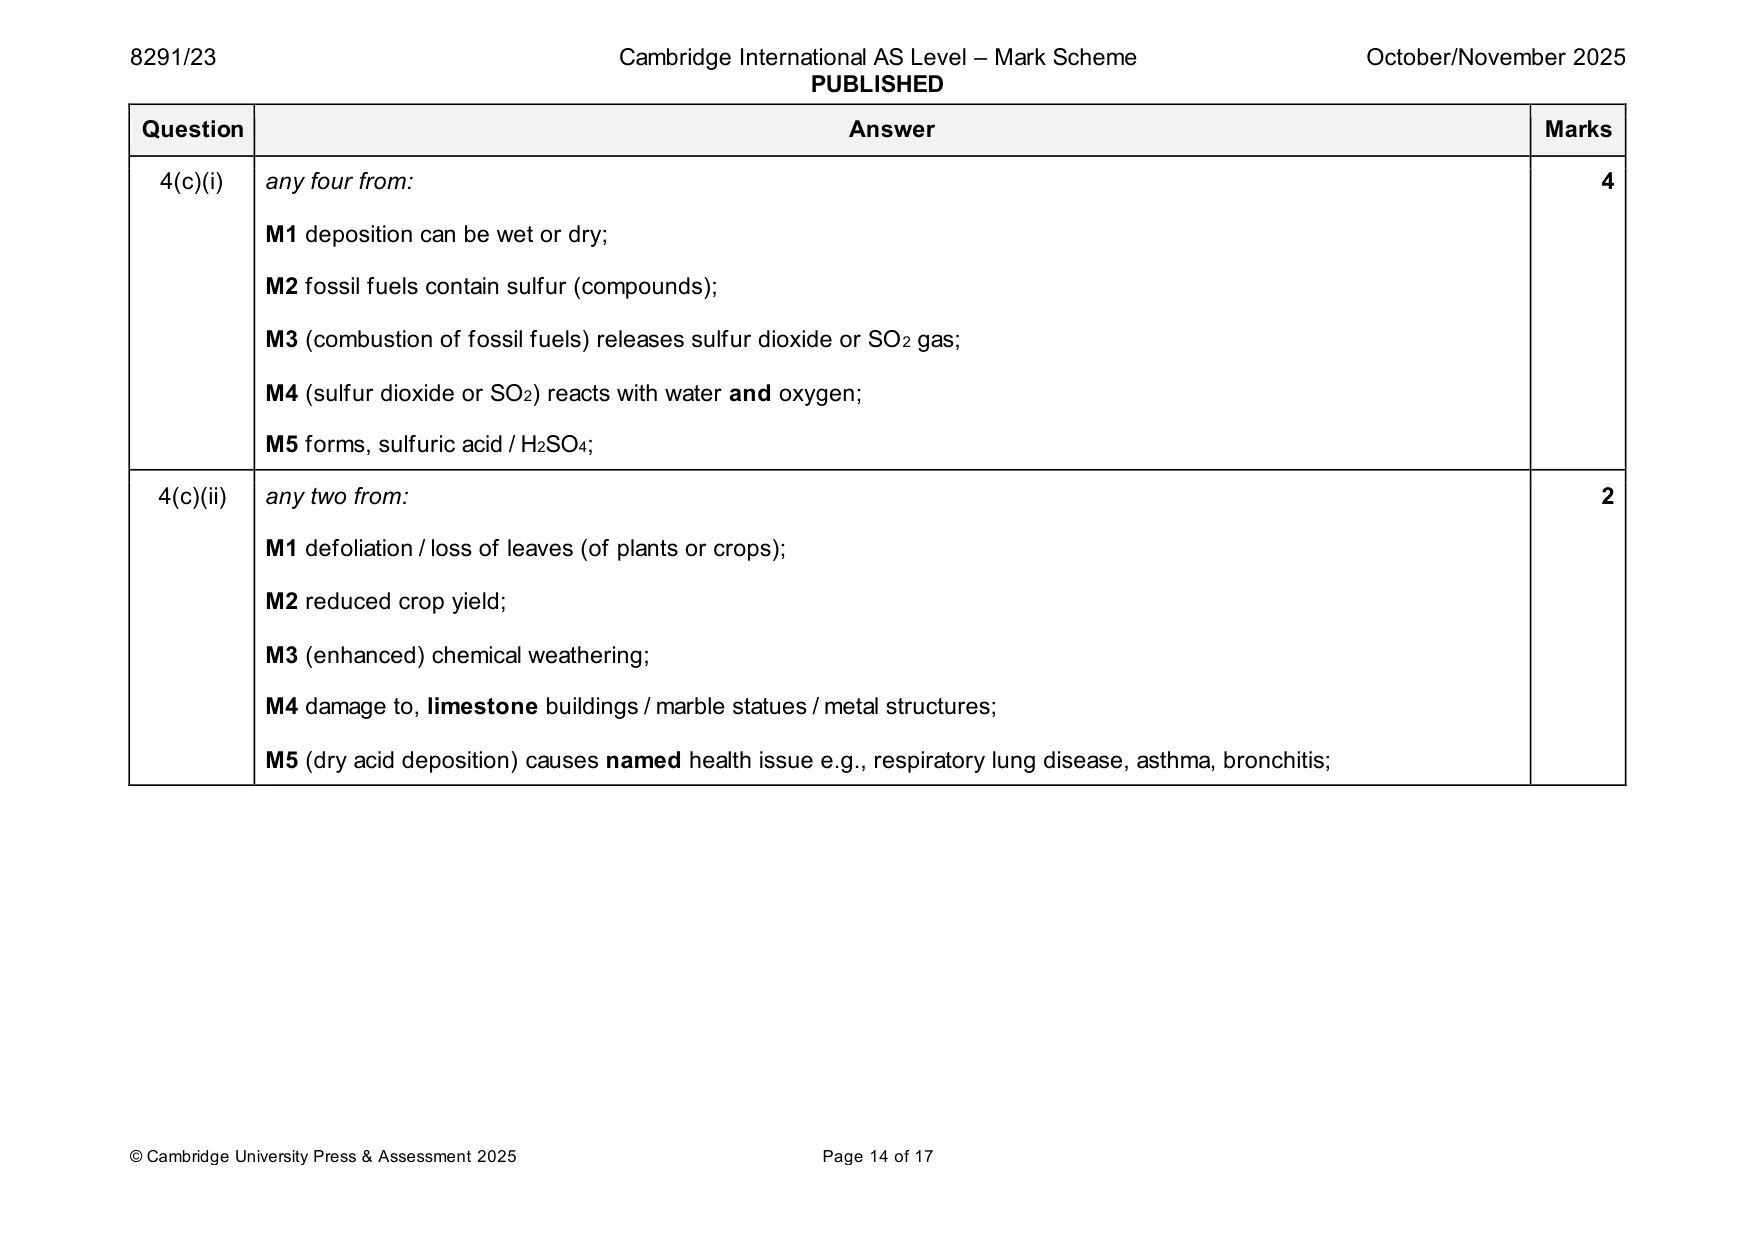
Mark scheme: 4(a)(i) any two from: 2 M1 consider safe access; M2 know the depth; M3 (know the) structure of river bed; M4 (know the) flow or velocity of water; M5 (know the) direction of water flow; M6 (know the) weather forecast / risk of flash flooding; M7 wear appropriate or protective clothing; e.g., closed shoes or boots / gloves 4(a)(ii) any five from: 5 method of disturbance: M1 disturb or kick, riverbed; M2 disturb or kick for stated period; method of sampling: M3 use systematic or random sampling of site / or method described; location: M4 sample collected downstream of disturbance; M5 (opening of) net facing upstream; method of counting and processing: M6 idea of decanting sample into bucket; M7 identify mayfly nymph and count sample; M8 repeat and average (at same location); M9 repeat and average at different, times / location; 4(b) any two from: 2 M1 yes and highest abundance in May and pH 7; M2 no and September low abundance and pH 7; M3 no and other factors also influence abundance; 4(c)(i) any four from: 4 M1 deposition can be wet or dry; M2 fossil fuels contain sulfur (compounds); M3 (combustion of fossil fuels) releases sulfur dioxide or SO2 gas; M4 (sulfur dioxide or SO2) reacts with water and oxygen; M5 forms, sulfuric acid / H2SO4; 4(c)(ii) any two from: 2 M1 defoliation / loss of leaves (of plants or crops); M2 reduced crop yield; M3 (enhanced) chemical weathering; M4 damage to, limestone buildings / marble statues / metal structures; M5 (dry acid deposition) causes named health issue e.g., respiratory lung disease, asthma, bronchitis;
Q5 · The ‘Firelight Toilet’ system
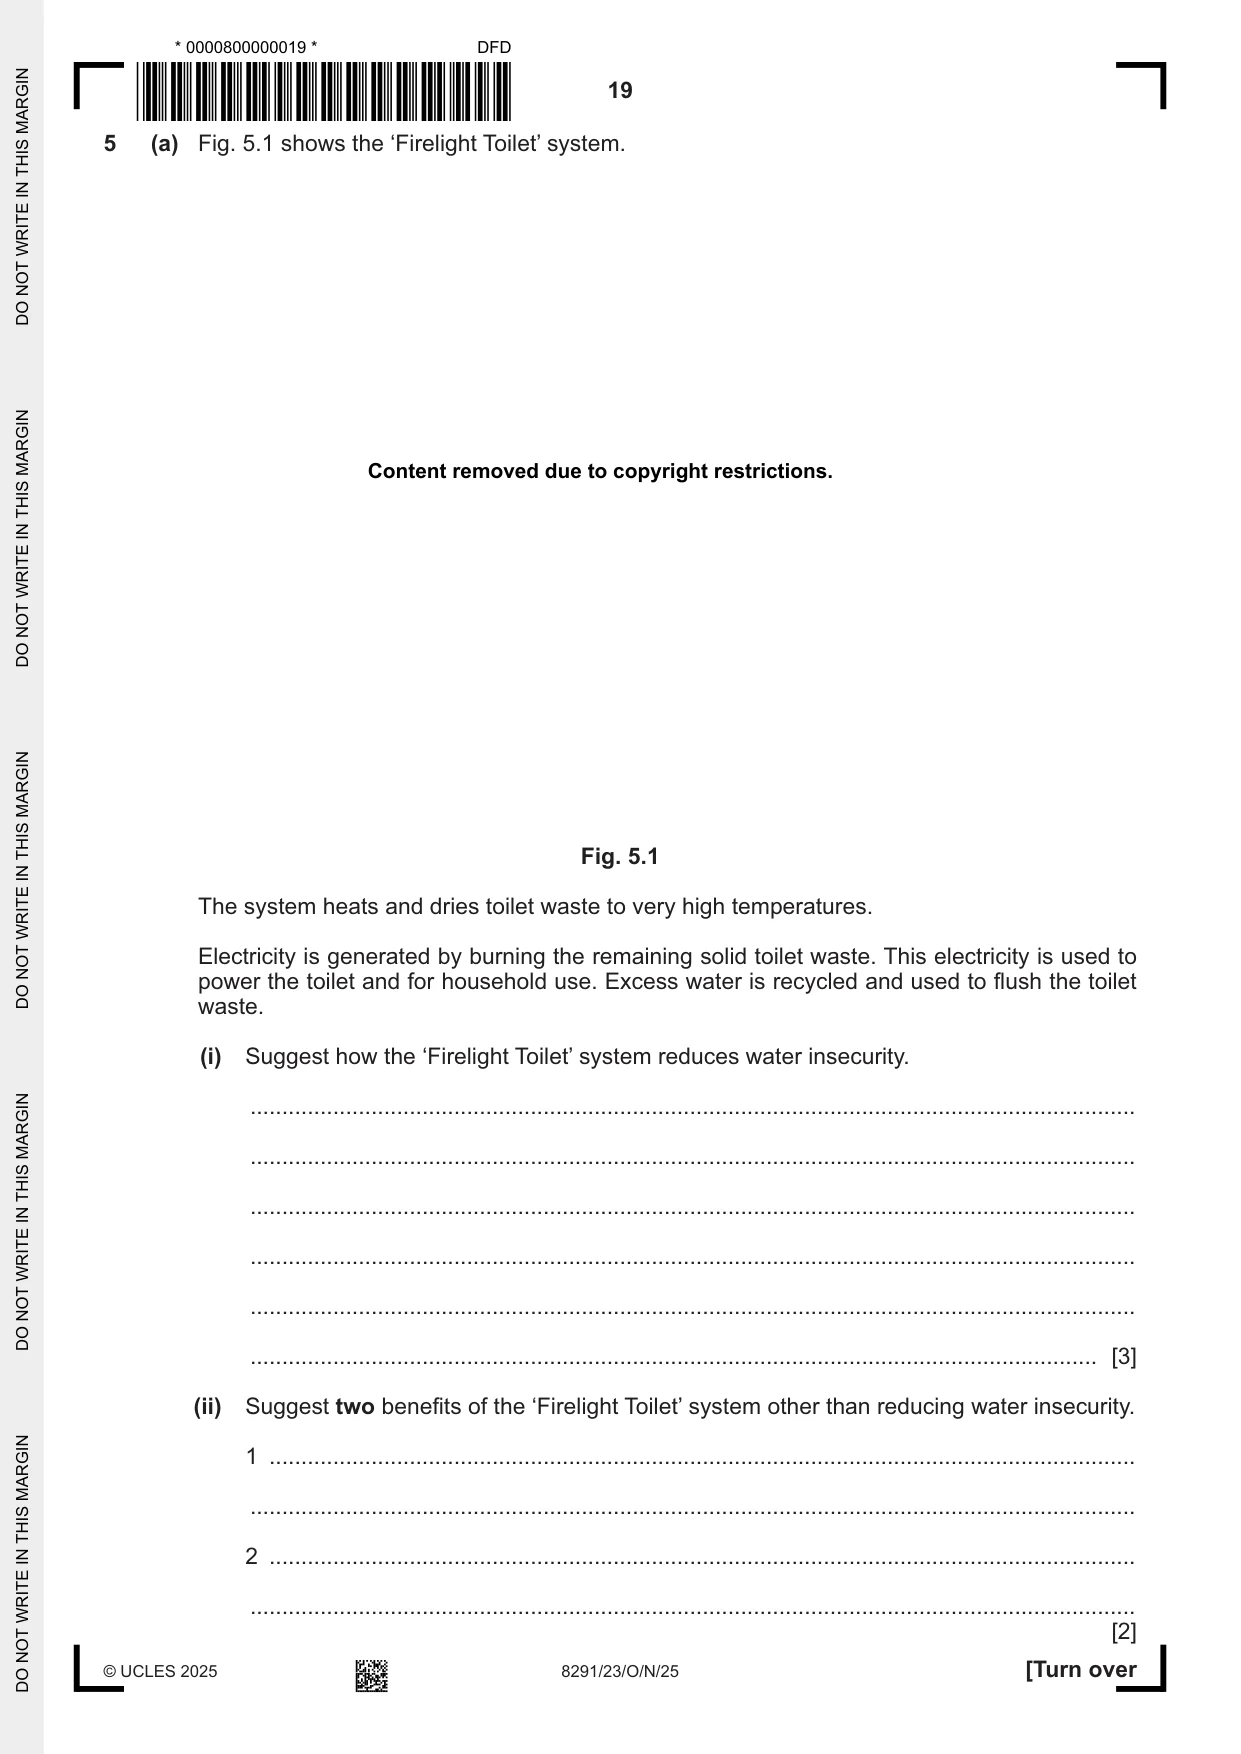
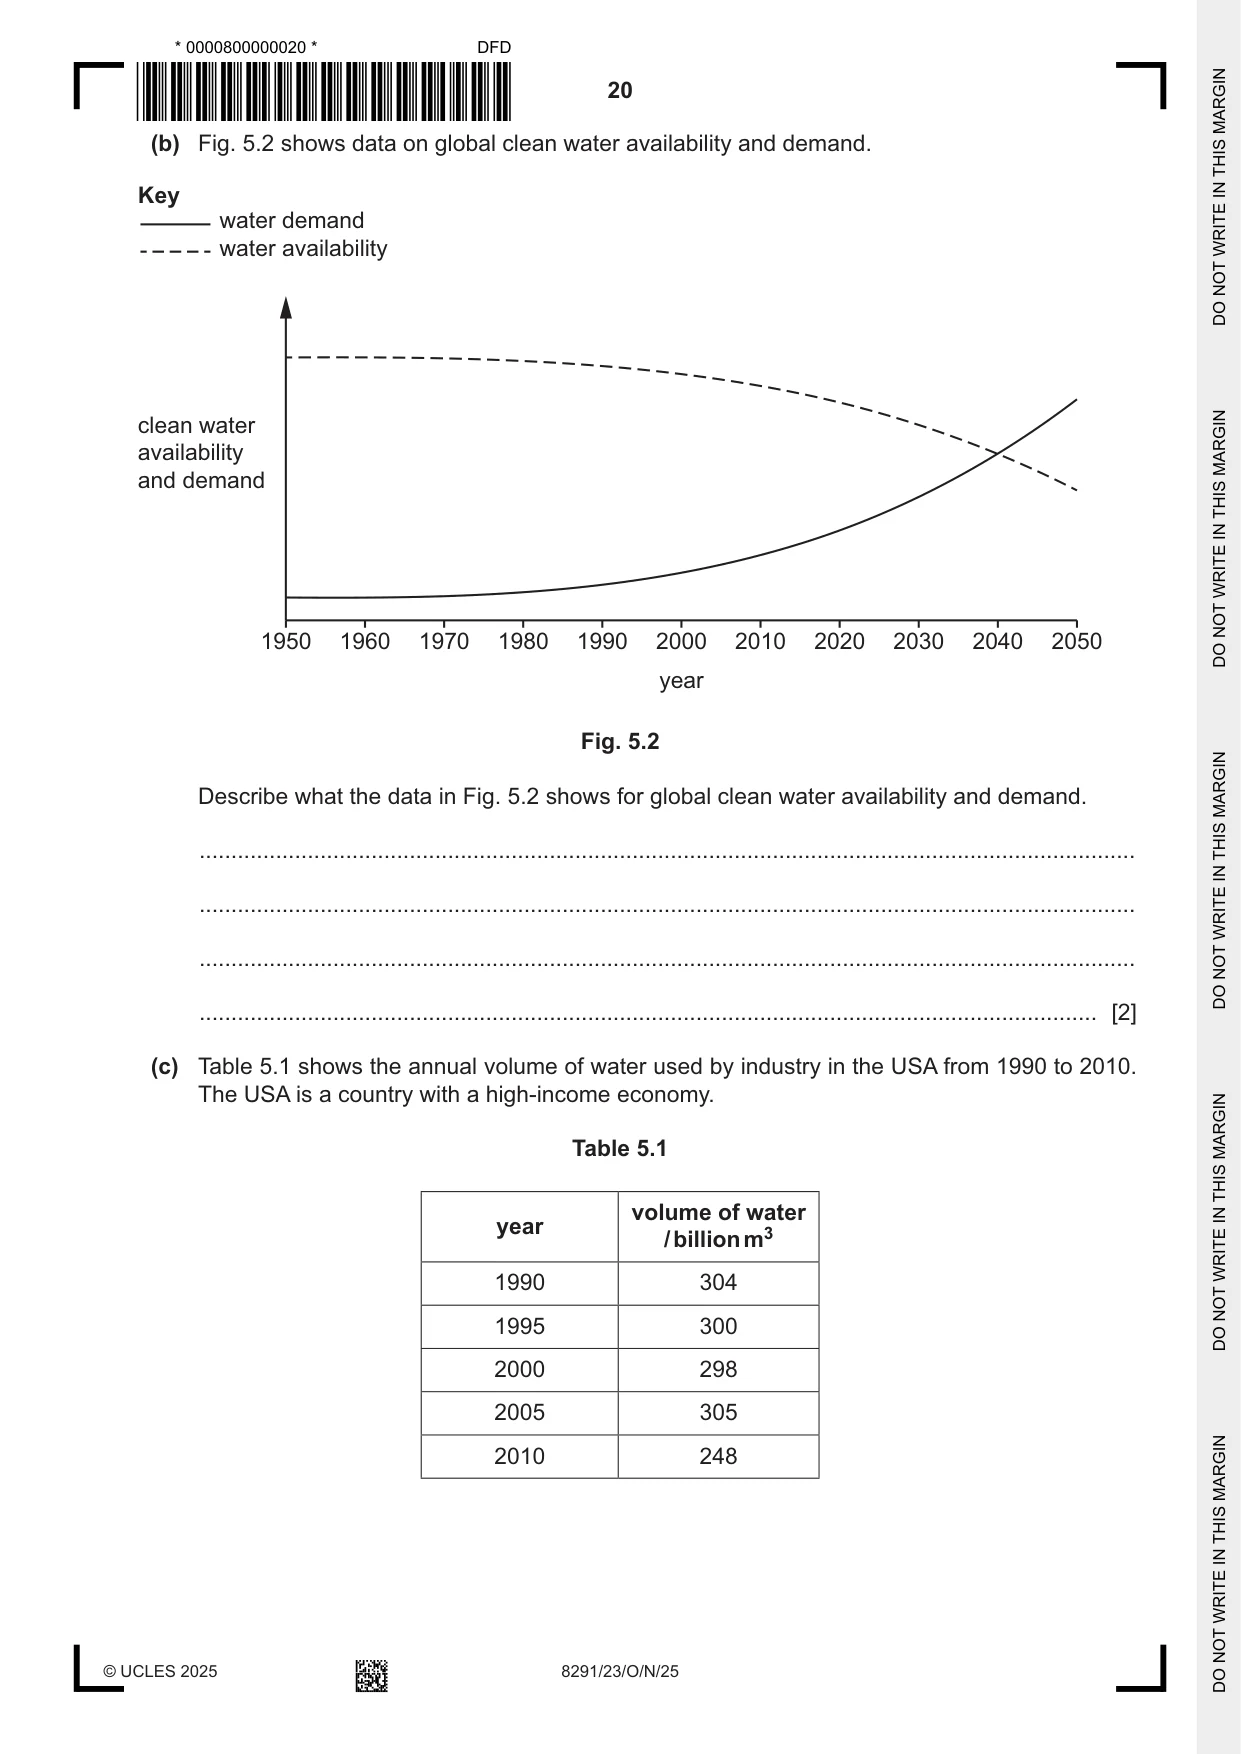
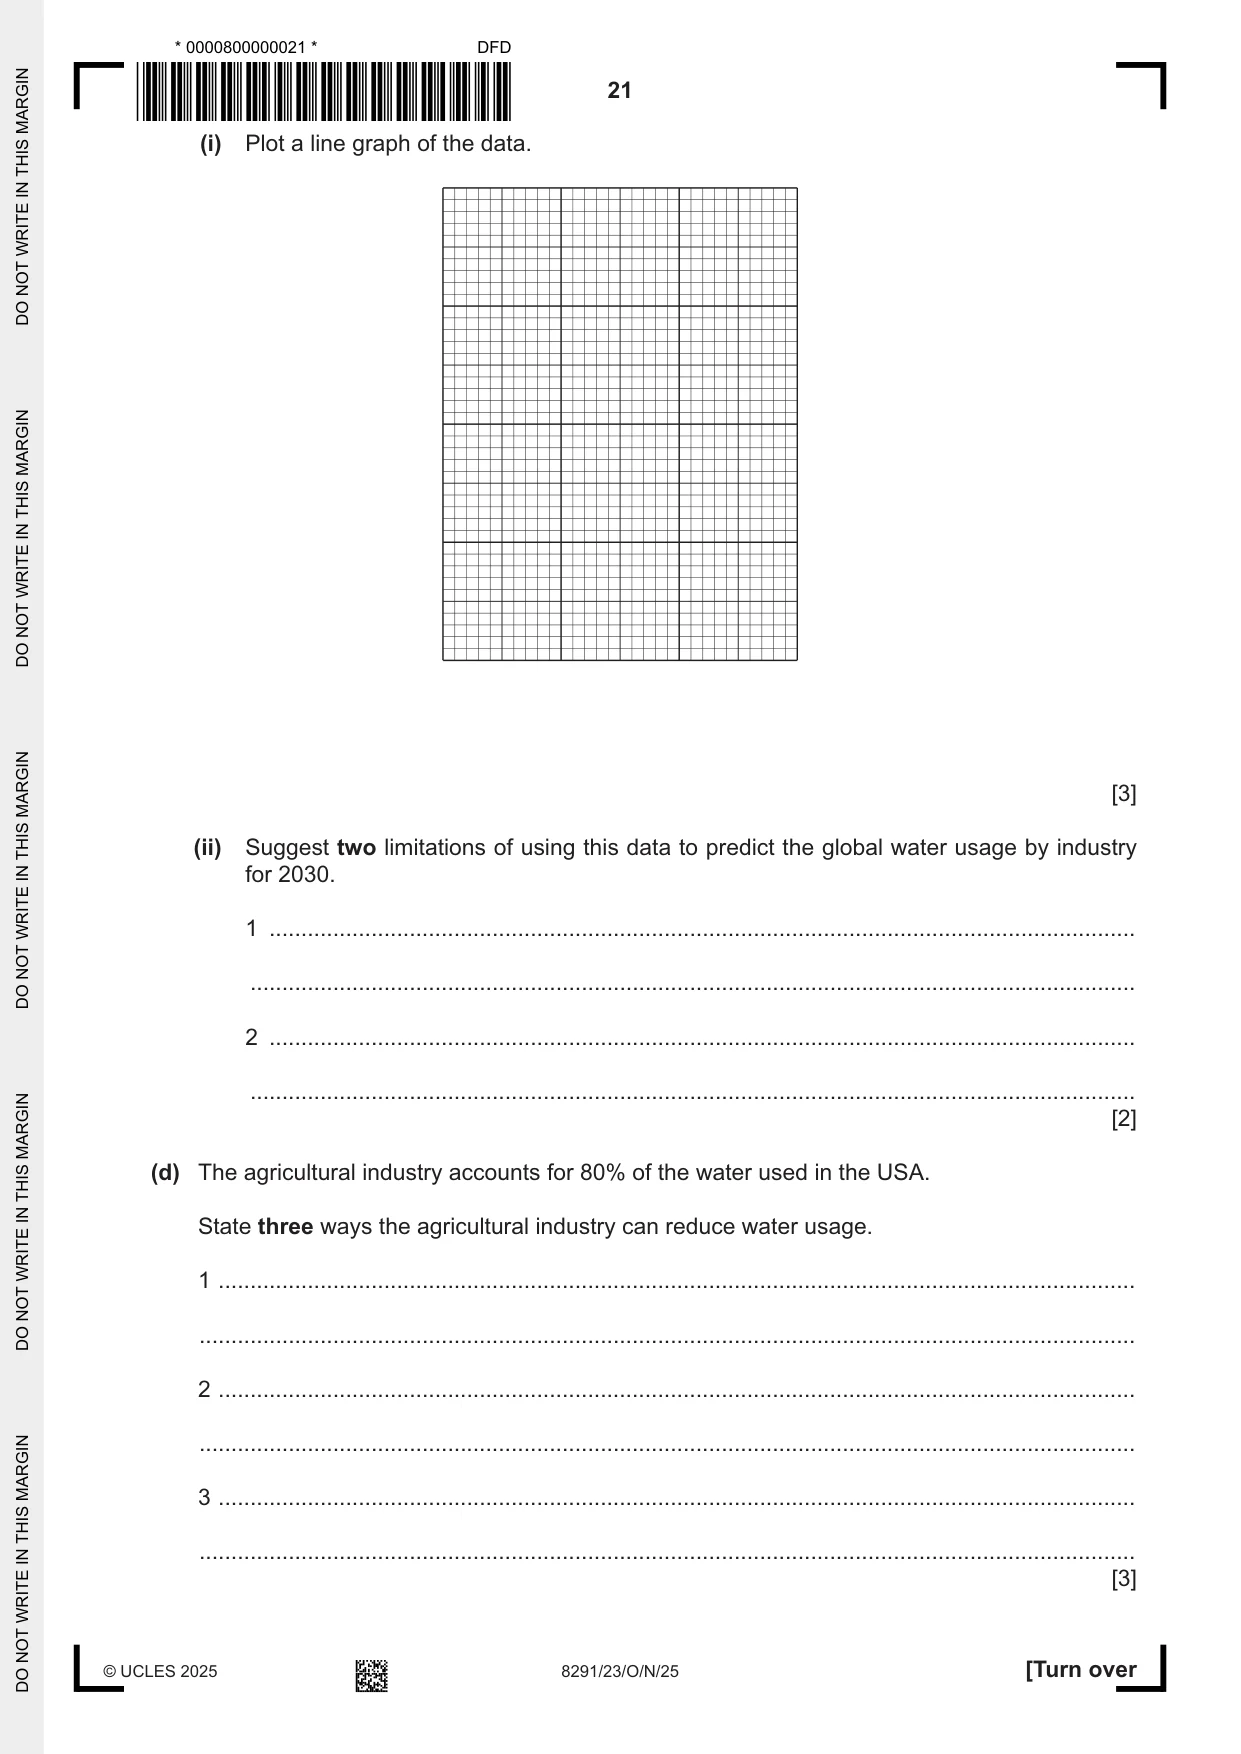
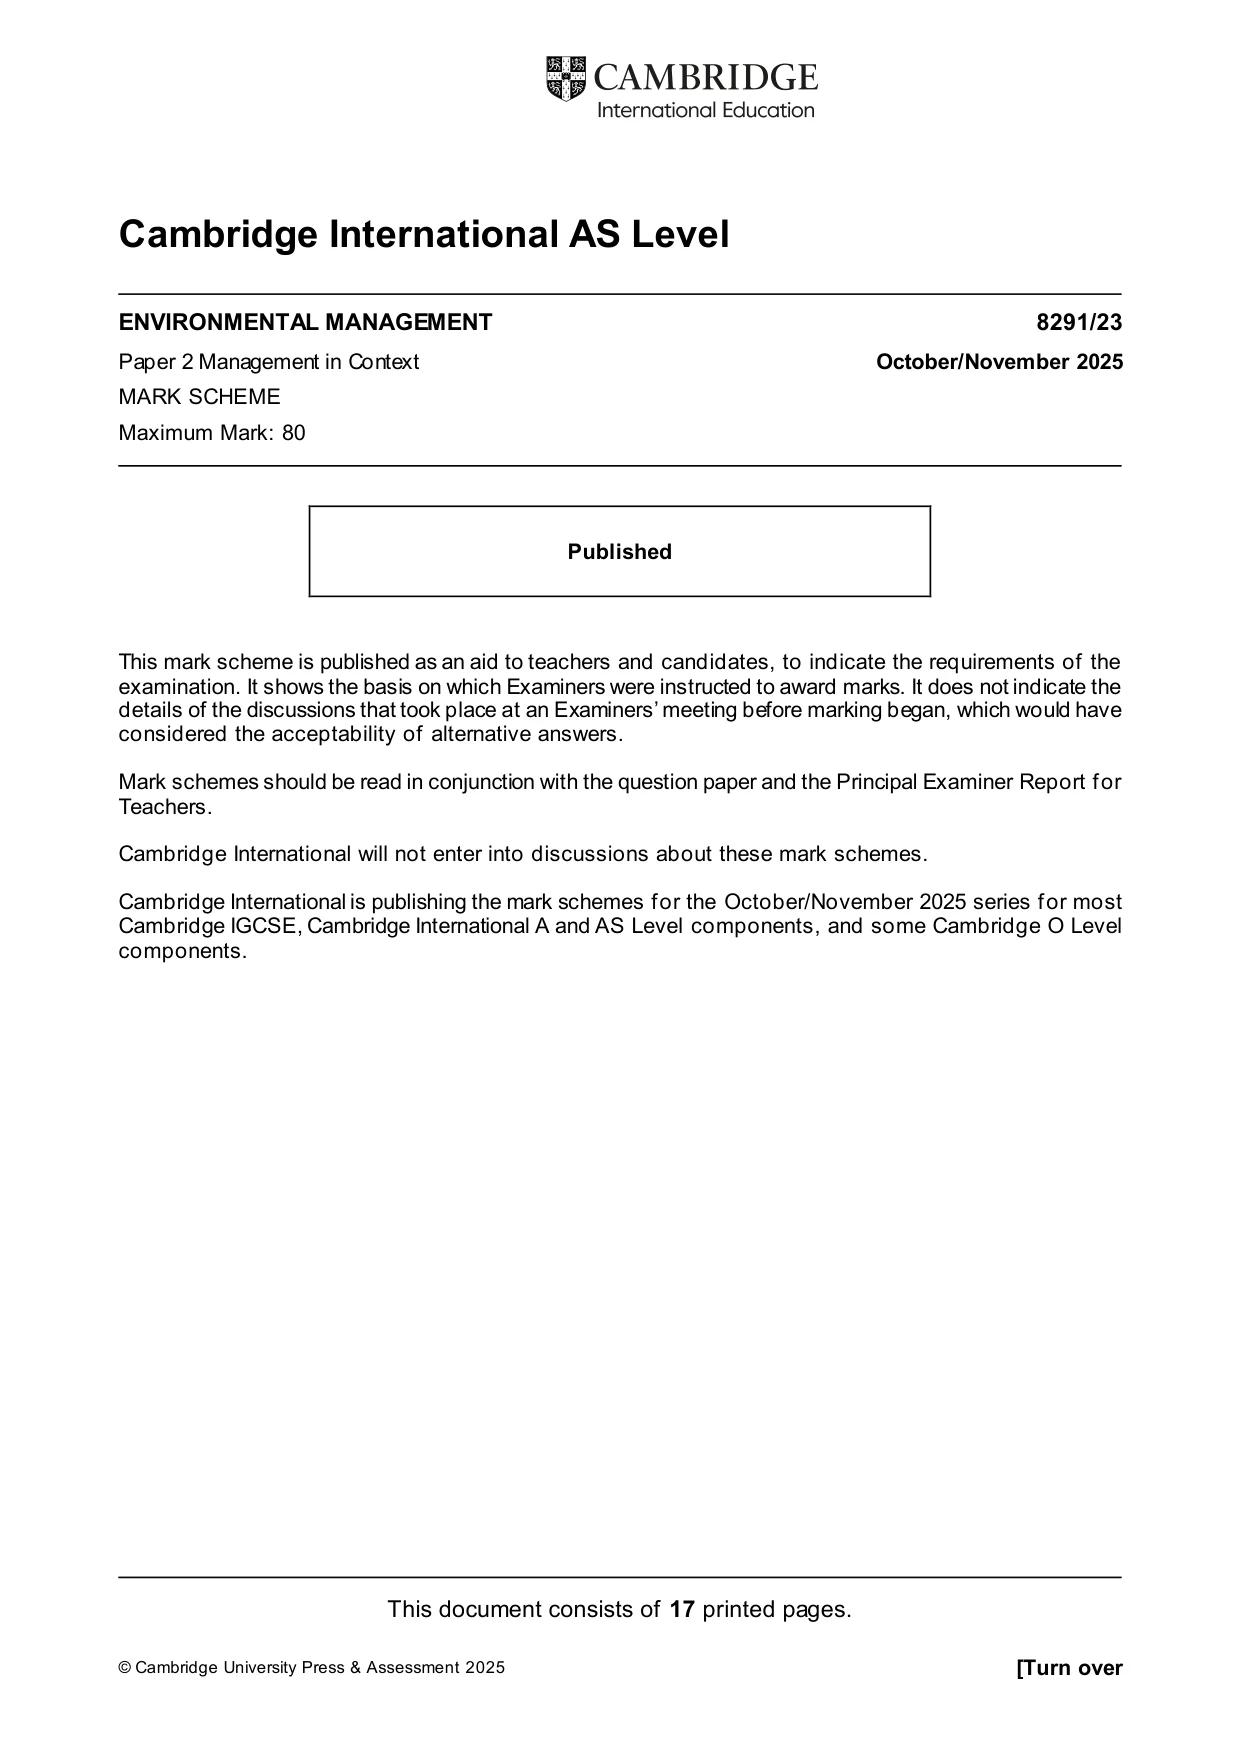
5 (a) Fig. 5.1 shows the ‘Firelight Toilet’ system. Content removed due to copyright restrictions. Fig. 5.1 The system heats and dries toilet waste to very high temperatures. Electricity is generated by burning the remaining solid toilet waste. This electricity is used to power the toilet and for household use. Excess water is recycled and used to flush the toilet waste. (i) Suggest how the ‘Firelight Toilet’ system reduces water insecurity. ........................................................................................................................................... ........................................................................................................................................... ........................................................................................................................................... ........................................................................................................................................... ........................................................................................................................................... ..................................................................................................................................... [3] (ii) Suggest two benefits of the ‘Firelight Toilet’ system other than reducing water insecurity. 1 ........................................................................................................................................ ........................................................................................................................................... 2 ........................................................................................................................................ ........................................................................................................................................... [2] (b) Fig. 5.2 shows data on global clean water availability and demand. Key water demand water availability clean water availability and demand 1950 1960 1970 1980 1990 2000 2010 2020 2030 2040 2050 year Fig. 5.2 Describe what the data in Fig. 5.2 shows for global clean water availability and demand. ................................................................................................................................................... ................................................................................................................................................... ................................................................................................................................................... ............................................................................................................................................. [2] (c) Table 5.1 shows the annual volume of water used by industry in the USA from 1990 to 2010. The USA is a country with a high-income economy. Table 5.1 volume of water year / billion m3 1990 304 1995 300 2000 298 2005 305 2010 248 (i) Plot a line graph of the data. [3] (ii) Suggest two limitations of using this data to predict the global water usage by industry for 2030. 1 ........................................................................................................................................ ........................................................................................................................................... 2 ........................................................................................................................................ ........................................................................................................................................... [2] (d) The agricultural industry accounts for 80% of the water used in the USA. State three ways the agricultural industry can reduce water usage. 1 ................................................................................................................................................ ................................................................................................................................................... 2 ................................................................................................................................................ ................................................................................................................................................... 3 ................................................................................................................................................ ................................................................................................................................................... [3] CLES 2025 8291/23/O/N/25 [Turn over
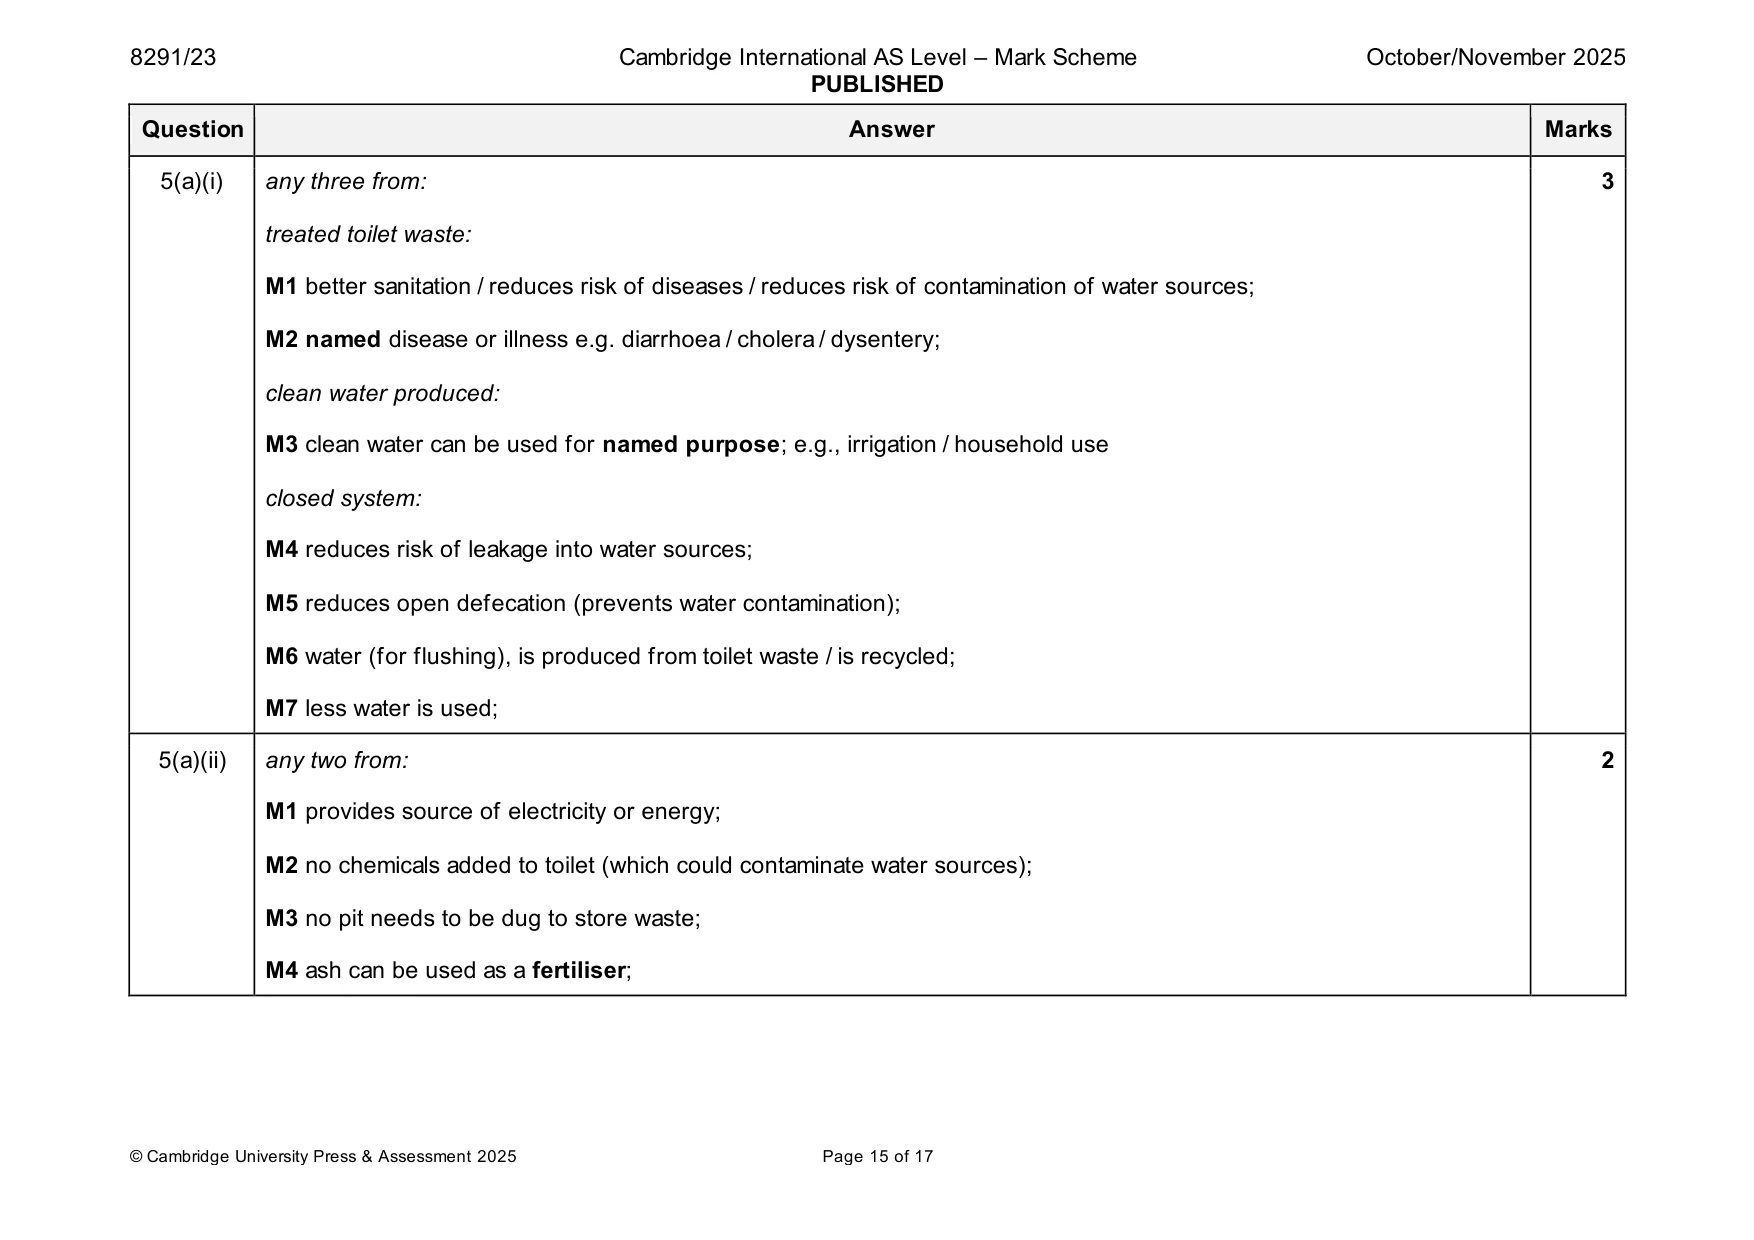
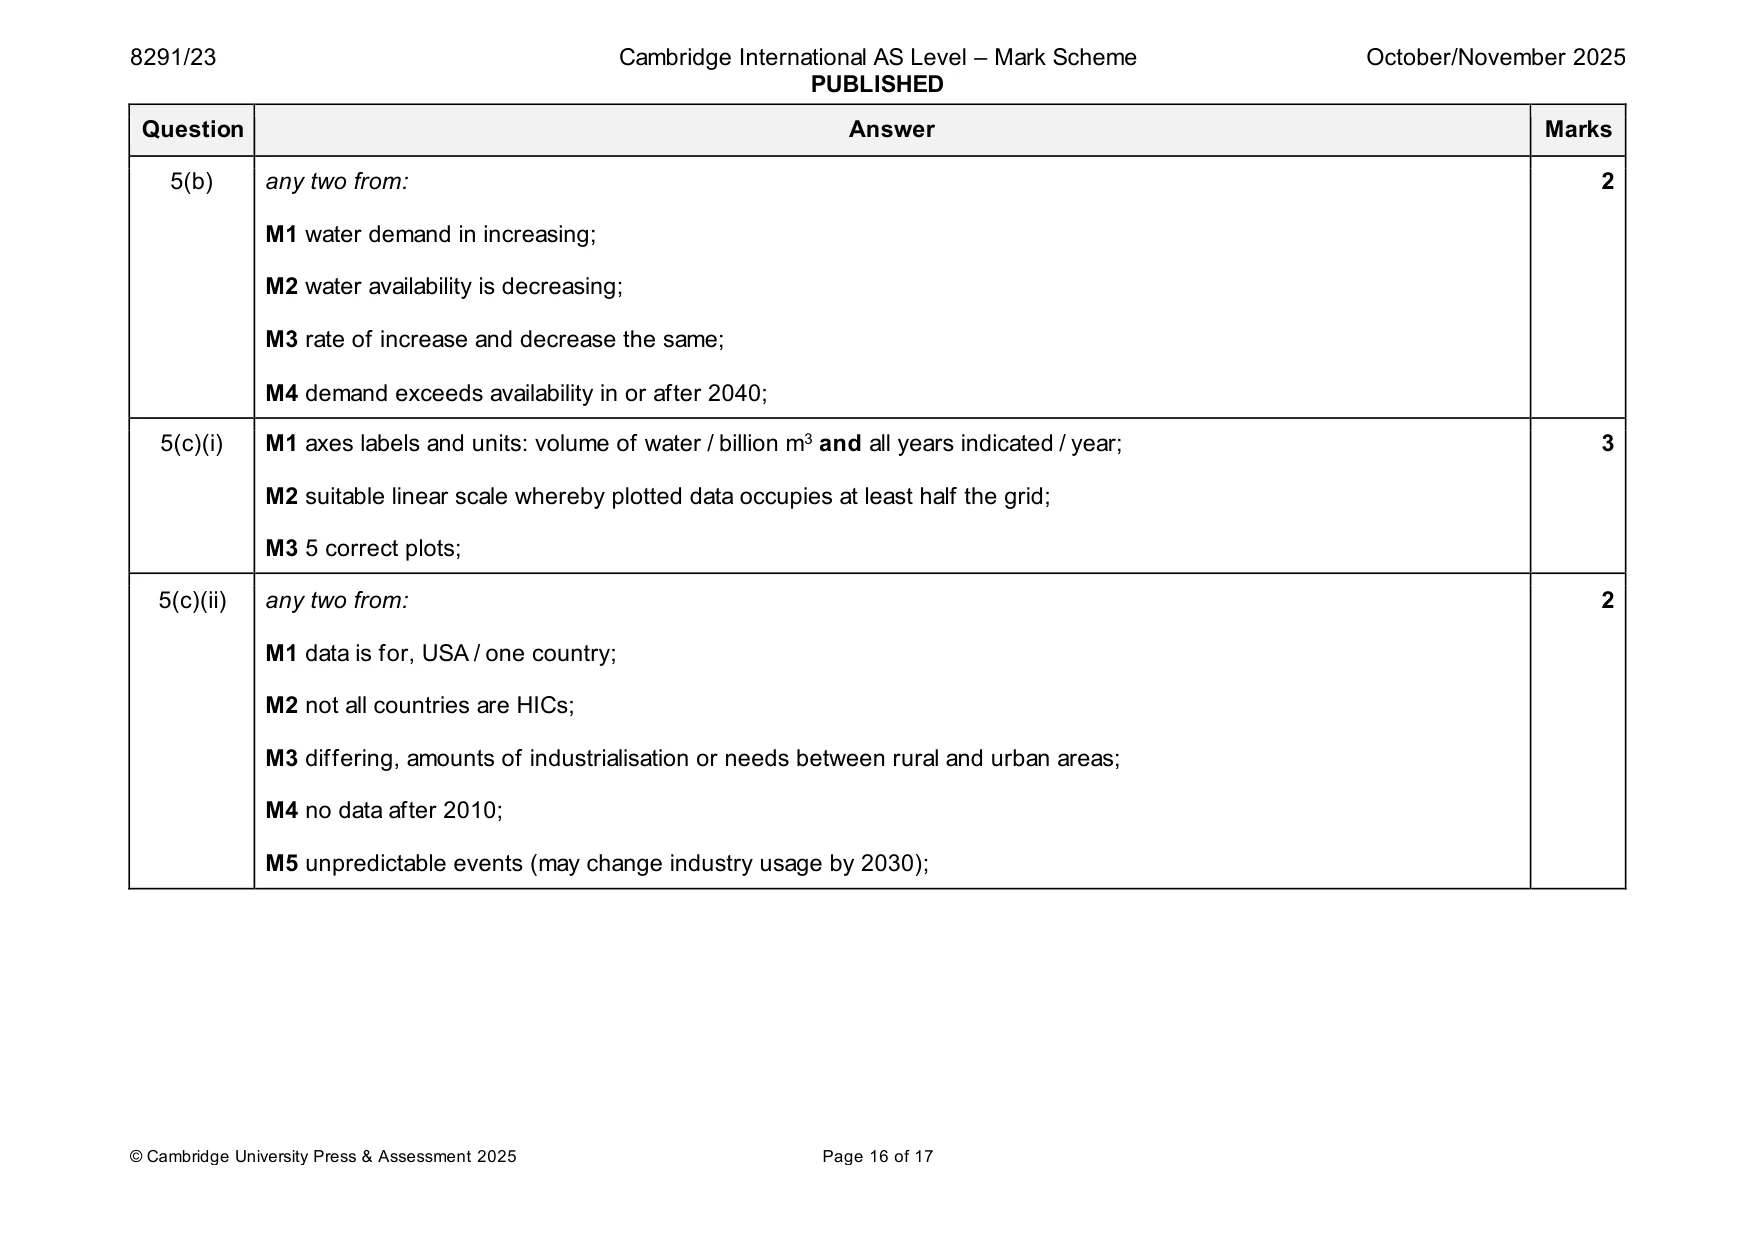
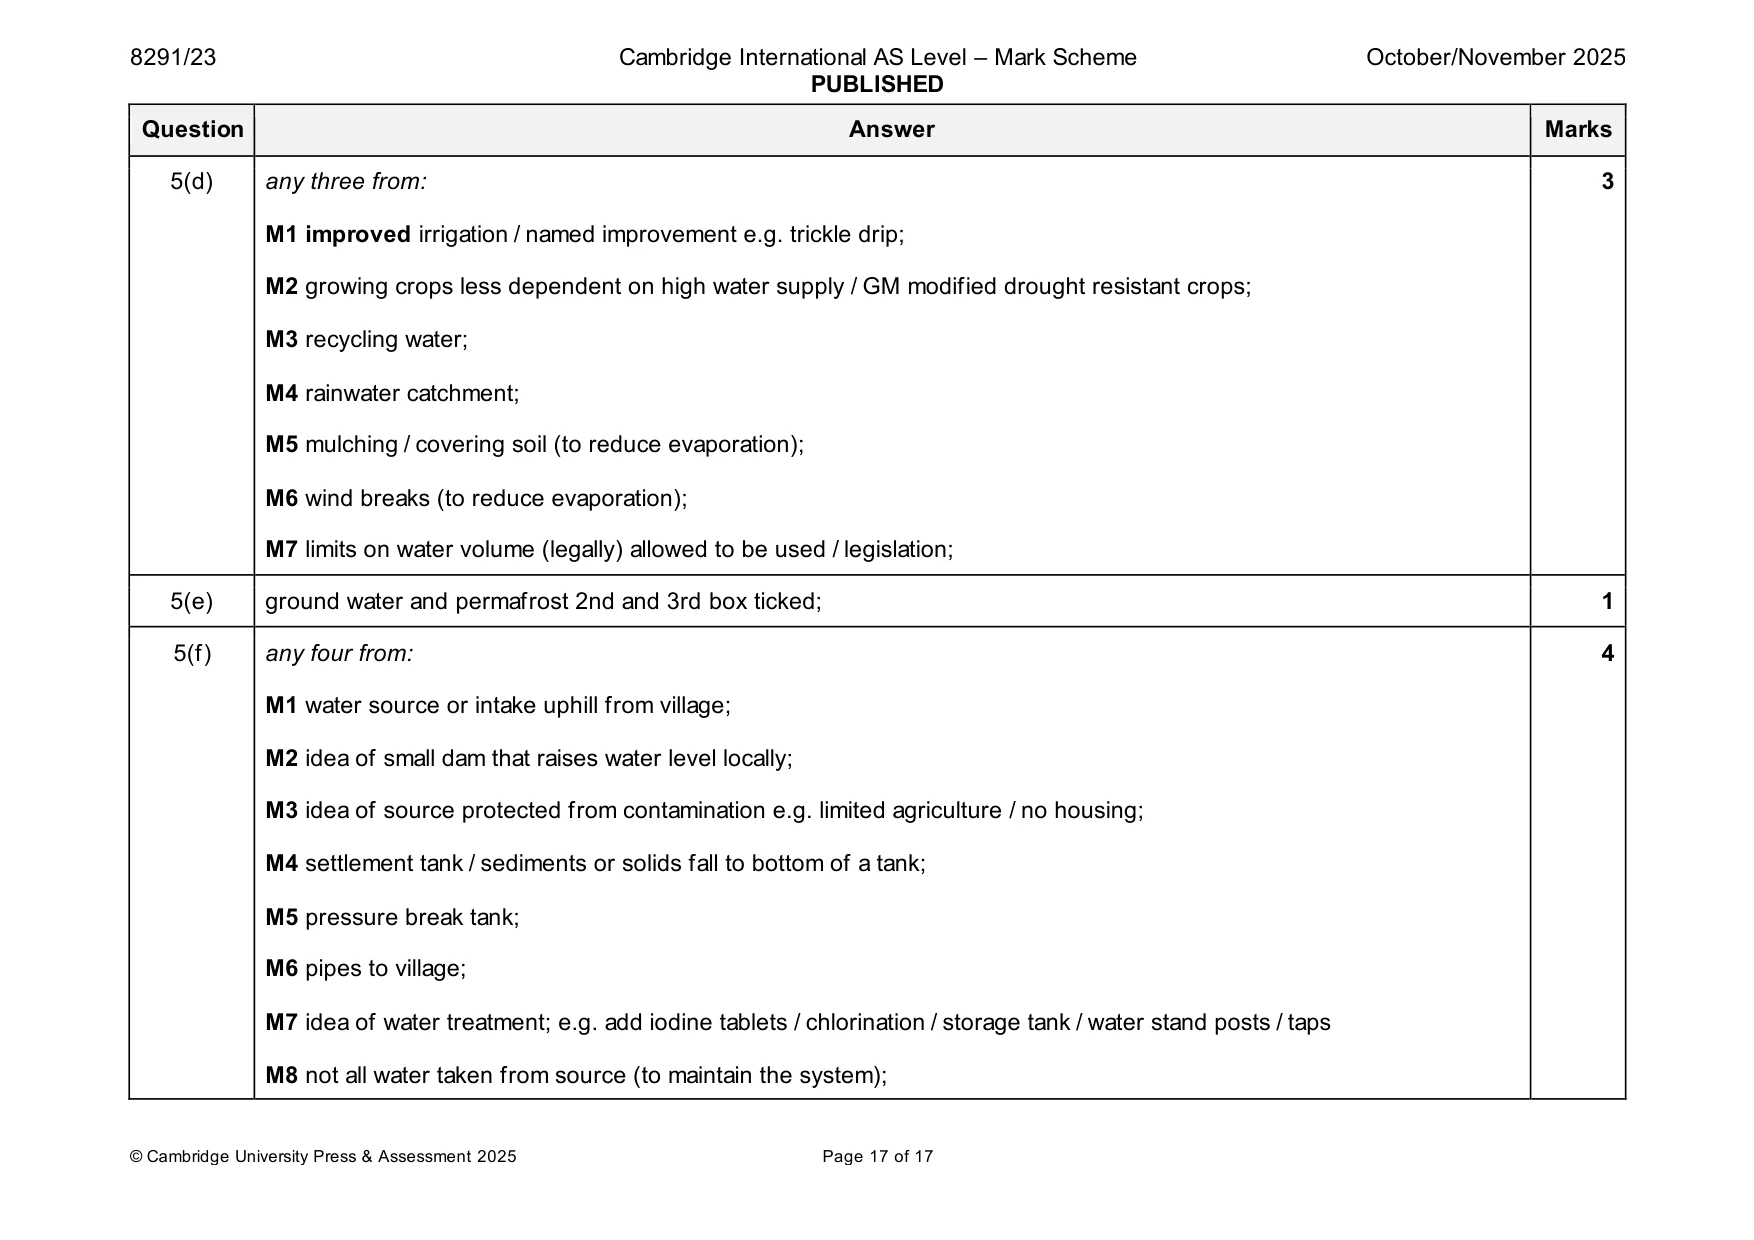
Mark scheme: 5(a)(i) any three from: 3 treated toilet waste: M1 better sanitation / reduces risk of diseases / reduces risk of contamination of water sources; M2 named disease or illness e.g. diarrhoea / cholera / dysentery; clean water produced: M3 clean water can be used for named purpose; e.g., irrigation / household use closed system: M4 reduces risk of leakage into water sources; M5 reduces open defecation (prevents water contamination); M6 water (for flushing), is produced from toilet waste / is recycled; M7 less water is used; 5(a)(ii) any two from: 2 M1 provides source of electricity or energy; M2 no chemicals added to toilet (which could contaminate water sources); M3 no pit needs to be dug to store waste; M4 ash can be used as a fertiliser; 5(b) any two from: 2 M1 water demand in increasing; M2 water availability is decreasing; M3 rate of increase and decrease the same; M4 demand exceeds availability in or after 2040; 5(c)(i) M1 axes labels and units: volume of water / billion m3 and all years indicated / year; 3 M2 suitable linear scale whereby plotted data occupies at least half the grid; M3 5 correct plots; 5(c)(ii) any two from: 2 M1 data is for, USA / one country; M2 not all countries are HICs; M3 differing, amounts of industrialisation or needs between rural and urban areas; M4 no data after 2010; M5 unpredictable events (may change industry usage by 2030); 5(d) any three from: 3 M1 improved irrigation / named improvement e.g. trickle drip; M2 growing crops less dependent on high water supply / GM modified drought resistant crops; M3 recycling water; M4 rainwater catchment; M5 mulching / covering soil (to reduce evaporation); M6 wind breaks (to reduce evaporation); M7 limits on water volume (legally) allowed to be used / legislation; 5(e) ground water and permafrost 2nd and 3rd box ticked; 1 5(f) any four from: 4 M1 water source or intake uphill from village; M2 idea of small dam that raises water level locally; M3 idea of source protected from contamination e.g. limited agriculture / no housing; M4 settlement tank / sediments or solids fall to bottom of a tank; M5 pressure break tank; M6 pipes to village; M7 idea of water treatment; e.g. add iodine tablets / chlorination / storage tank / water stand posts / taps M8 not all water taken from source (to maintain the system);
What was in this paper
The subtopics covered by these 5 questions, and how many questions each got. Open one in a new tab to see every Cambridge question on it.
What you needed in this session
Cambridge’s own grade thresholds for 2025 Oct/Nov, Paper 2 · Variant 3. A higher threshold means an easier paper — the bar moves with how the cohort did.