Cambridge A Level Environmental Management (AS only) 8291 — 2024 May/June Paper 2 · Variant 3
8291/23/M/J/24 · 4 questions · 80 marks · ≈90 min
The question paper and its mark scheme, free to read here and free to download. This is Cambridge’s own paper, exactly as it was sat.
Question paper20 pages







Mark scheme11 pages
Answers below. Sit the paper first if you are practising.






Questions as text
Q1 · The total fertility rate for 2020
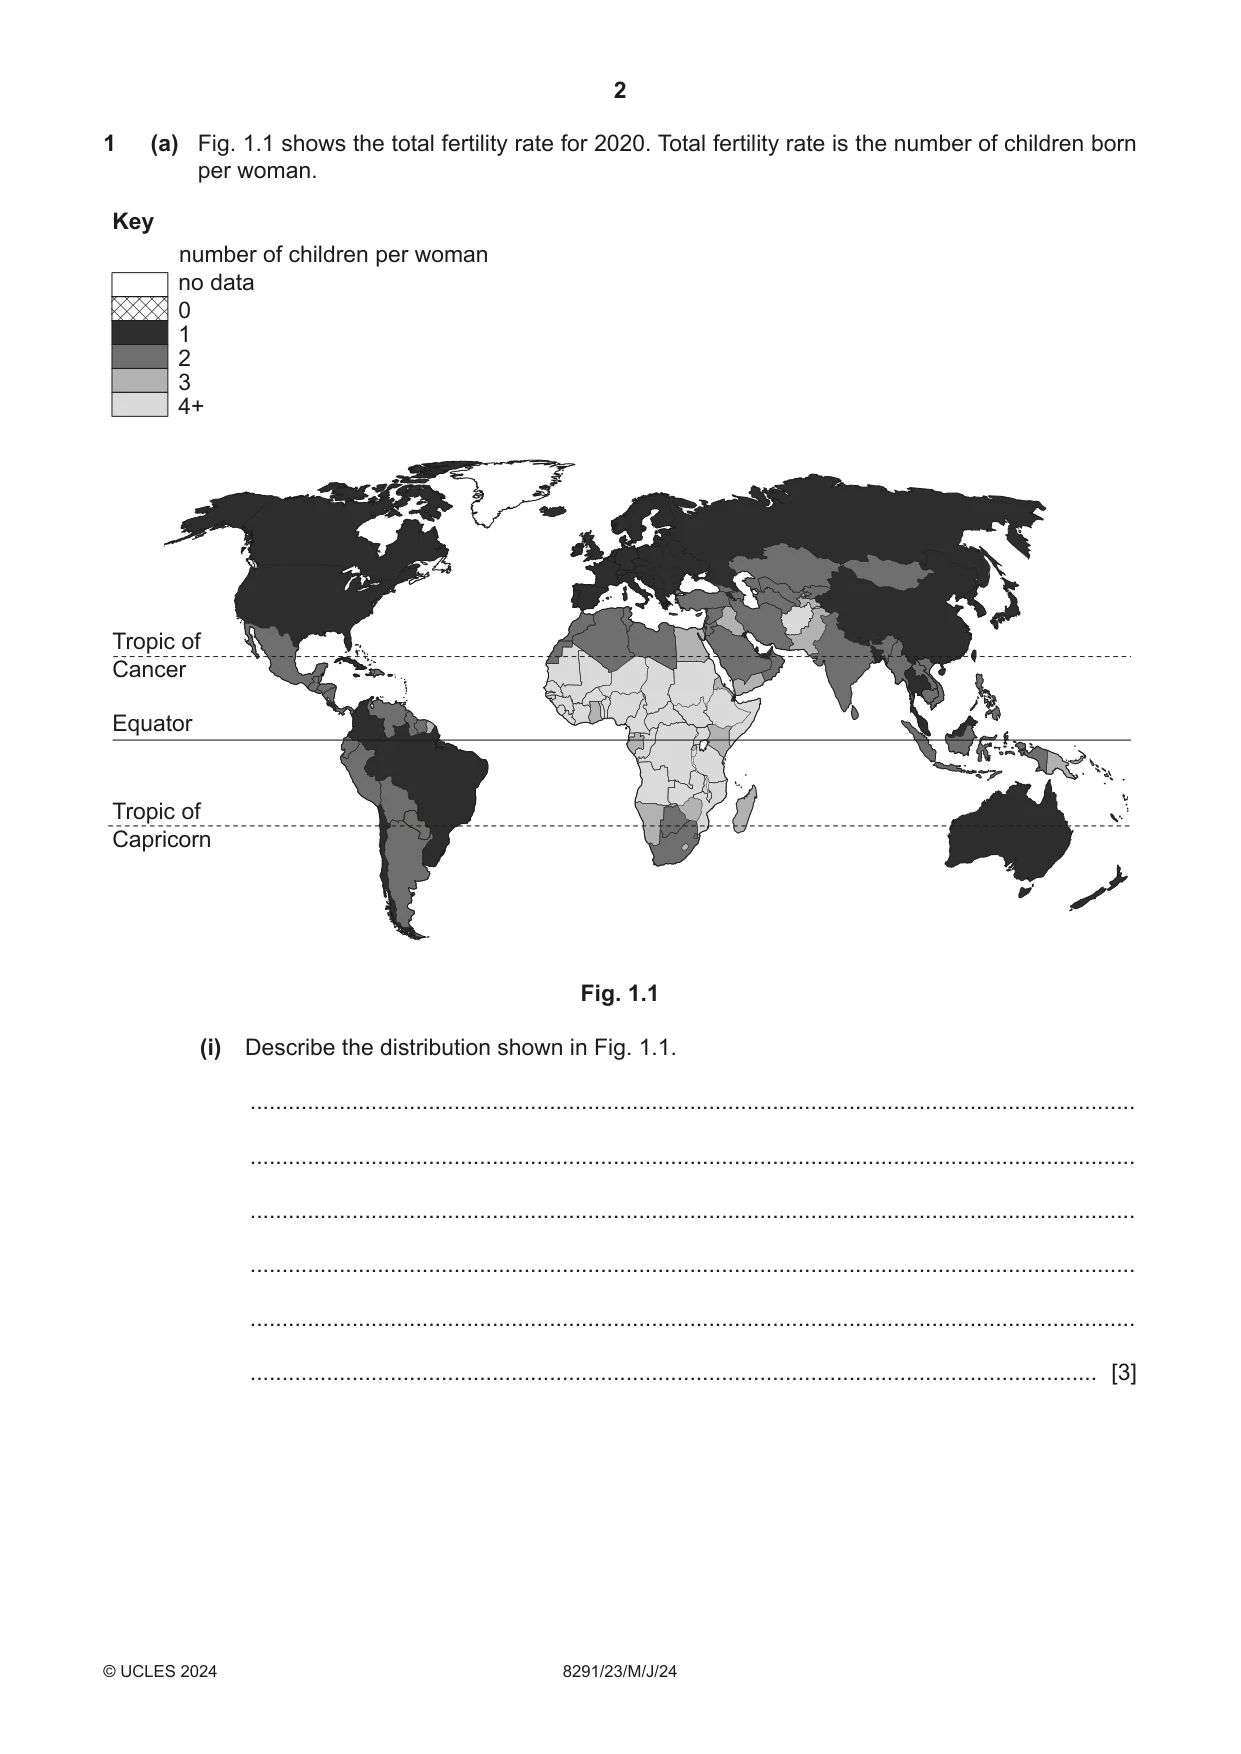
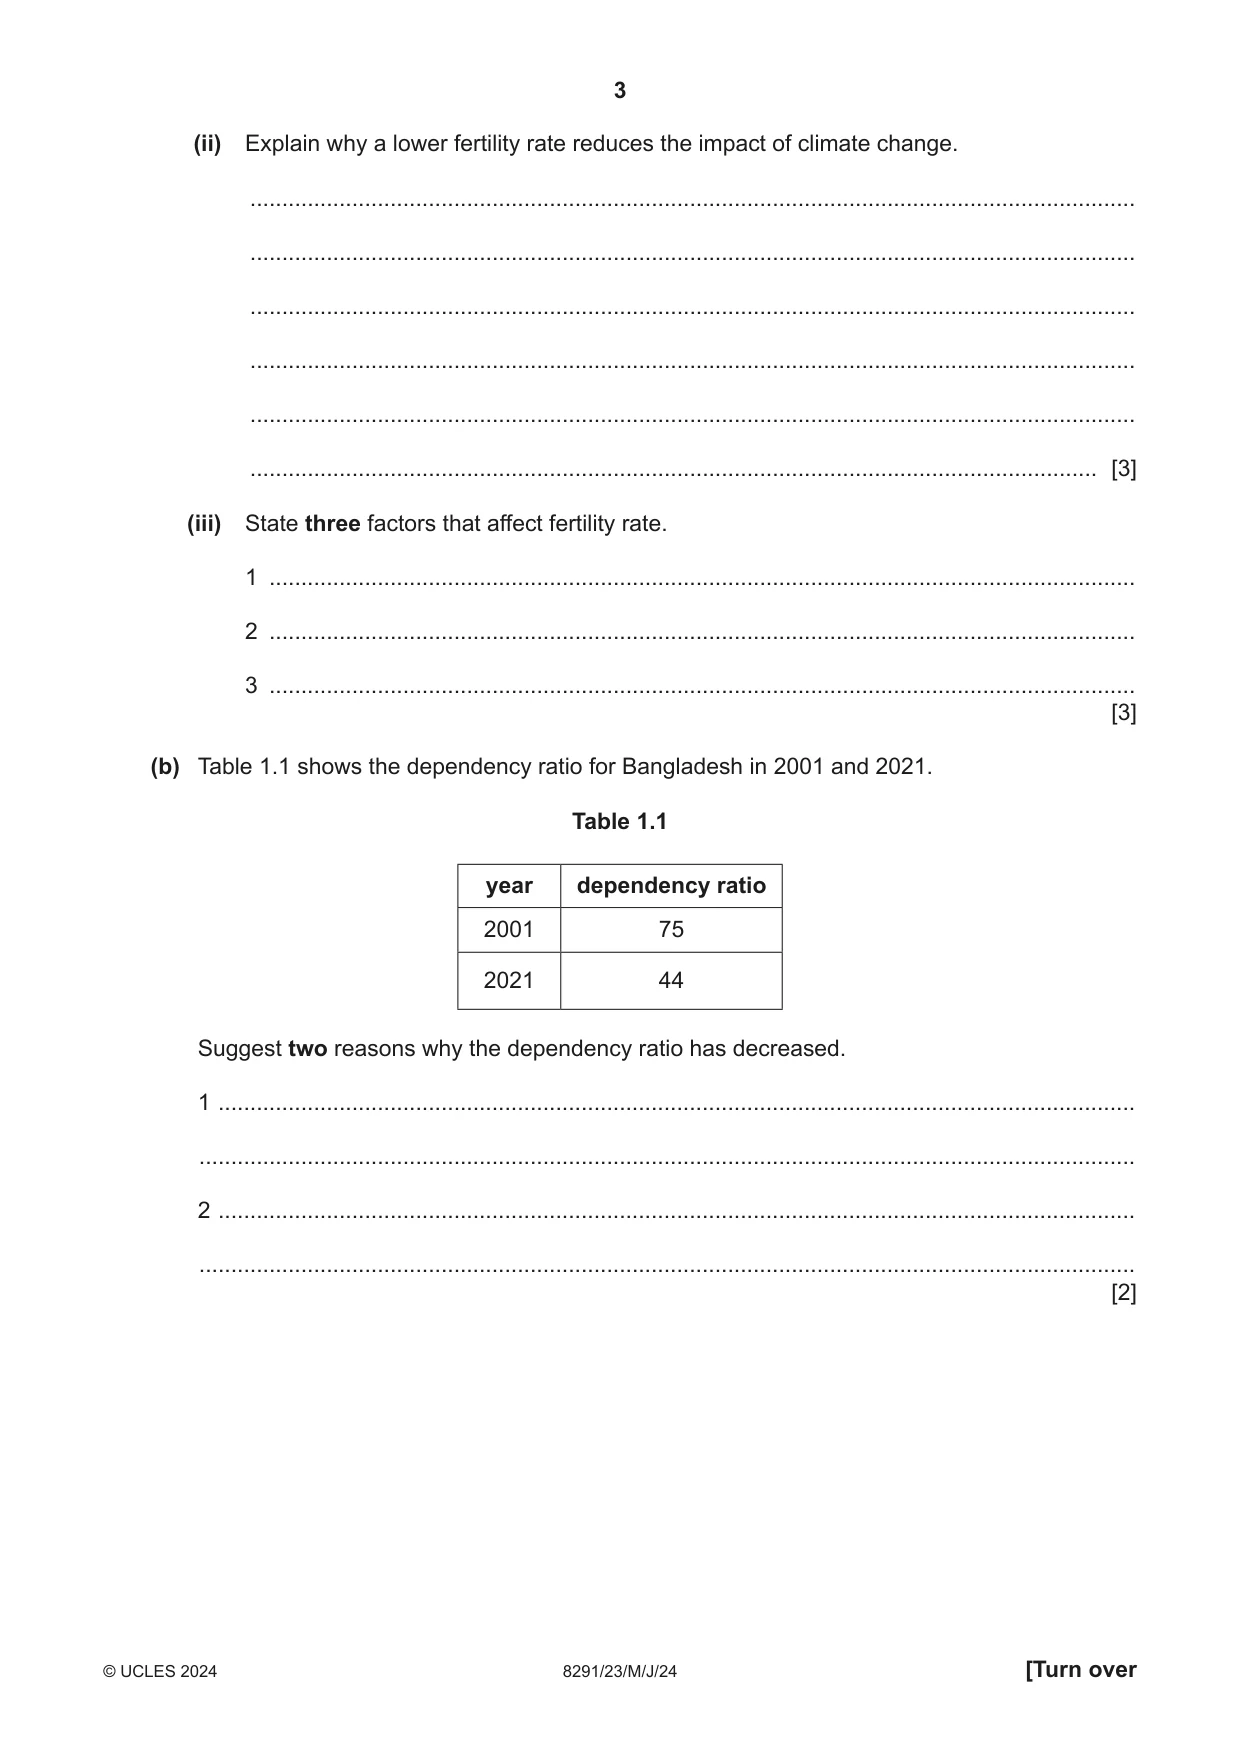
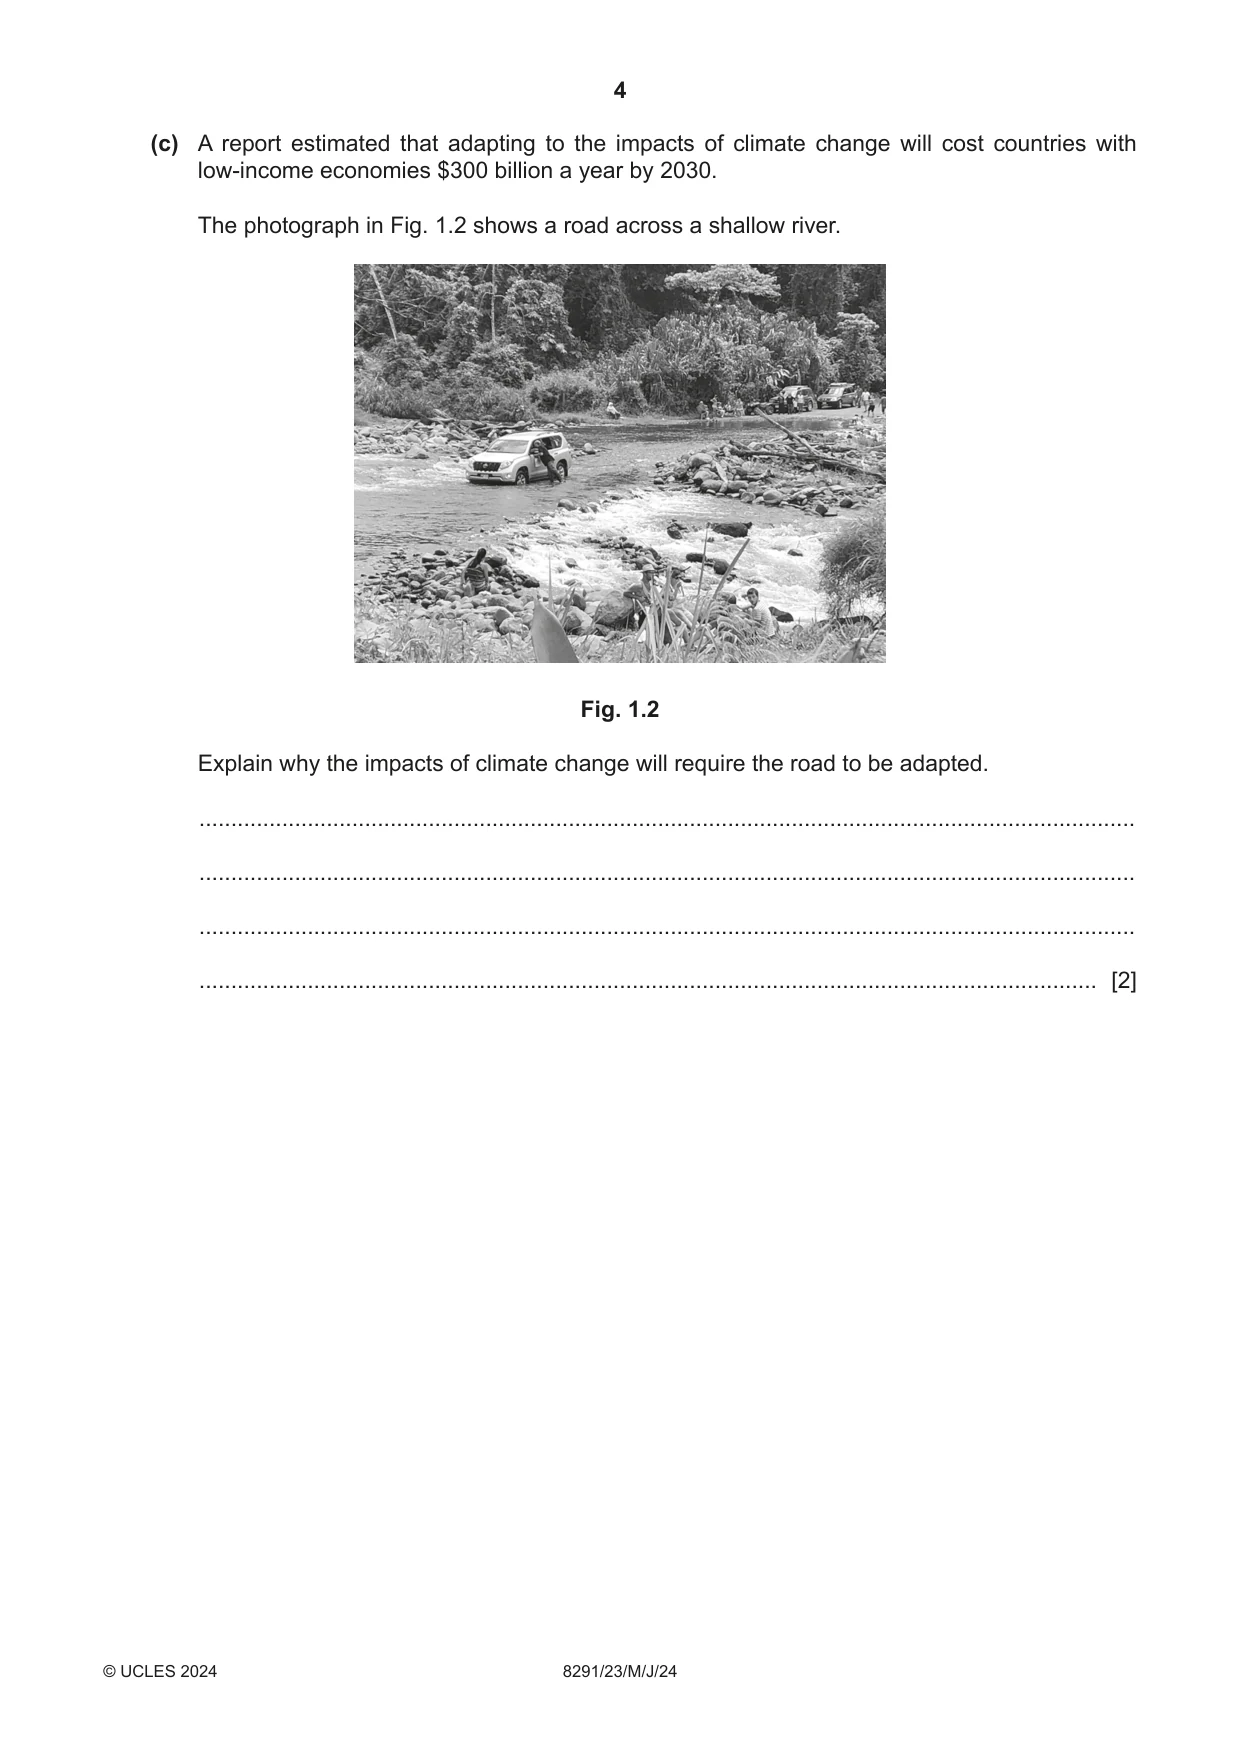
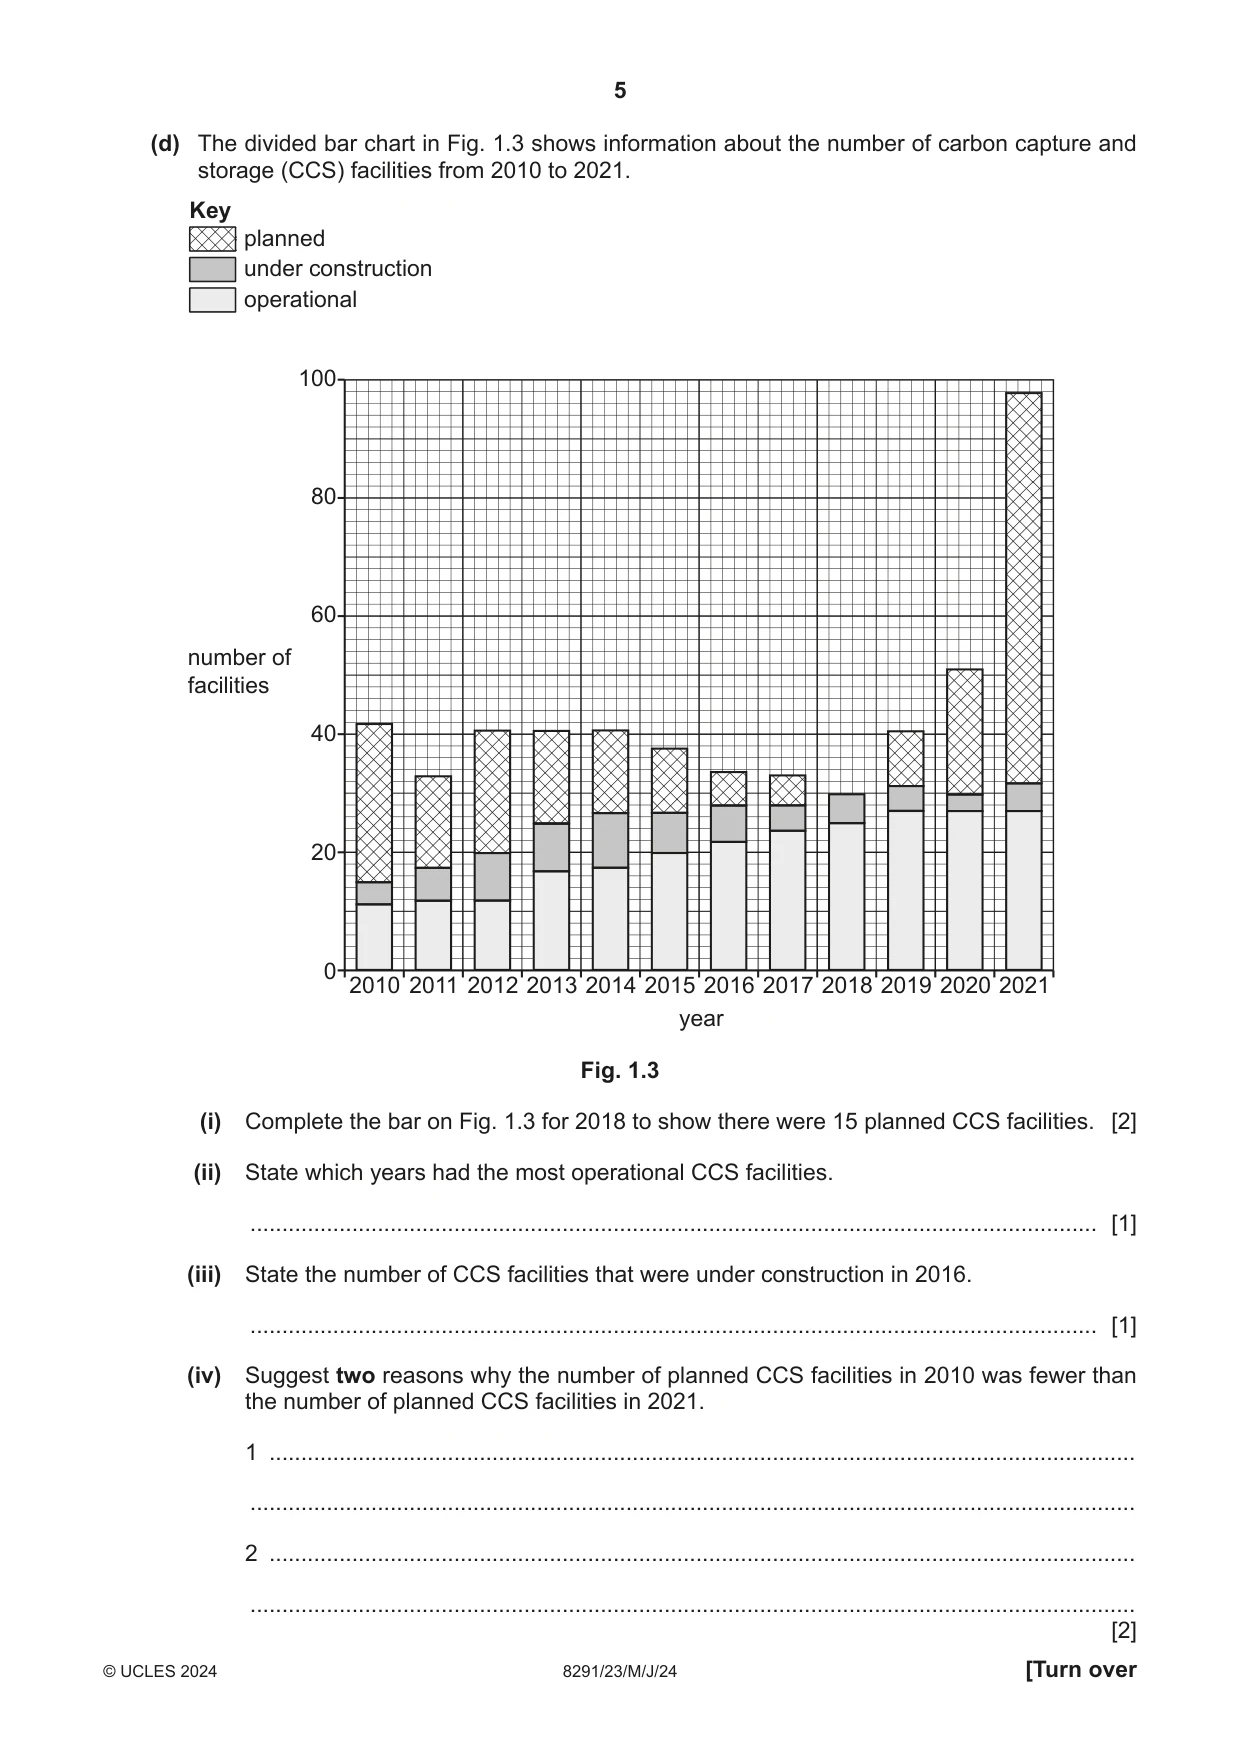
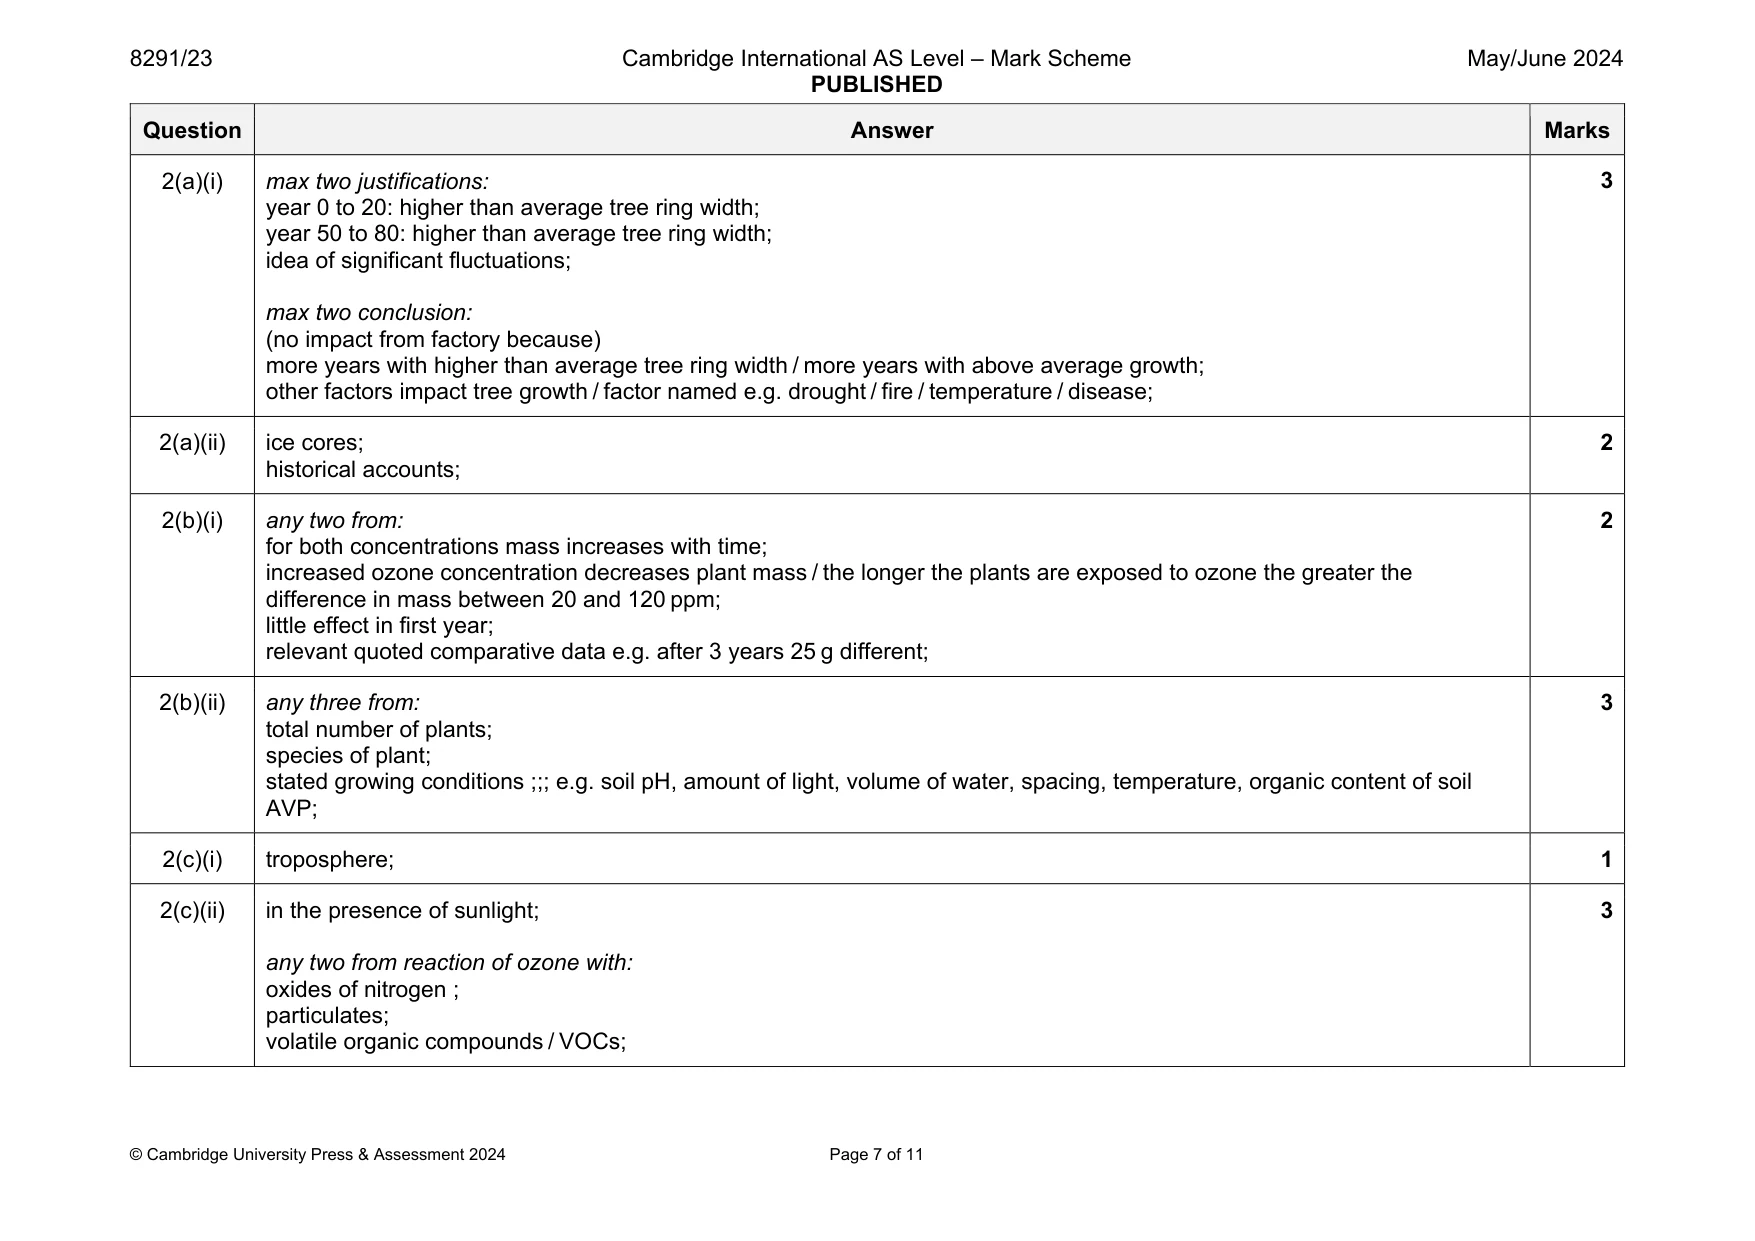
1 (a) Fig. 1.1 shows the total fertility rate for 2020. Total fertility rate is the number of children born per woman. Key number of children per woman no data 0 1 2 3 4+ Tropic of Cancer Equator Tropic of Capricorn Fig. 1.1 (i) Describe the distribution shown in Fig. 1.1. ........................................................................................................................................... ........................................................................................................................................... ........................................................................................................................................... ........................................................................................................................................... ........................................................................................................................................... ..................................................................................................................................... [3] (ii) Explain why a lower fertility rate reduces the impact of climate change. ........................................................................................................................................... ........................................................................................................................................... ........................................................................................................................................... ........................................................................................................................................... ........................................................................................................................................... ..................................................................................................................................... [3] (iii) State three factors that affect fertility rate. 1 ........................................................................................................................................ 2 ........................................................................................................................................ 3 ........................................................................................................................................ [3] (b) Table 1.1 shows the dependency ratio for Bangladesh in 2001 and 2021. Table 1.1 year dependency ratio 2001 75 2021 44 Suggest two reasons why the dependency ratio has decreased. 1 ................................................................................................................................................ ................................................................................................................................................... 2 ................................................................................................................................................ ................................................................................................................................................... [2] (c) A report estimated that adapting to the impacts of climate change will cost countries with low‑income economies $300 billion a year by 2030. The photograph in Fig. 1.2 shows a road across a shallow river. Fig. 1.2 Explain why the impacts of climate change will require the road to be adapted. ................................................................................................................................................... ................................................................................................................................................... ................................................................................................................................................... ............................................................................................................................................. [2] (d) The divided bar chart in Fig. 1.3 shows information about the number of carbon capture and storage (CCS) facilities from 2010 to 2021. Key planned under construction operational 100 80 60 number of facilities 40 20 0 2010 2011 2012 2013 2014 2015 2016 2017 2018 2019 2020 2021 year Fig. 1.3 (i) Complete the bar on Fig. 1.3 for 2018 to show there were 15 planned CCS facilities. [2] (ii) State which years had the most operational CCS facilities. ..................................................................................................................................... [1] (iii) State the number of CCS facilities that were under construction in 2016. ..................................................................................................................................... [1] (iv) Suggest two reasons why the number of planned CCS facilities in 2010 was fewer than the number of planned CCS facilities in 2021. 1 ........................................................................................................................................ ........................................................................................................................................... 2 ........................................................................................................................................ ........................................................................................................................................... [2] (e) Describe how carbon capture and storage (CCS) reduces the carbon dioxide concentration in the atmosphere. ................................................................................................................................................... ................................................................................................................................................... ................................................................................................................................................... ................................................................................................................................................... ................................................................................................................................................... ............................................................................................................................................. [3] (f) Solar radiation management (SRM) is a strategy which aims to reduce the impact of climate change. State two examples of SRM. 1 ................................................................................................................................................ 2 ................................................................................................................................................ [2] [Total: 24]
Mark scheme: 1(a)(i) any three from: highest fertility rate in Africa; west coast of Americas higher than east coast; higher numbers for LICs compared to HICs; relevant quoted data for a continent; e.g. all of Europe has 12 child per woman; relevant quoted data for a country; e.g. Niger has 67 children per woman; AVP; 1(a)(ii) any three from: (fewer people so) less stated (e.g. food) resources used / needed; less energy consumption / less fossil fuels combusted; less carbon dioxide produced / methane / greenhouse gas; reduction in (enhanced) greenhouse effect / global warming; 3 1(a)(iii) any three from: (availability or cost) of contraception; education about contraception; improved education / opportunities for women; availability or improved or cost of health care; (local, national, global) policies; cultural reasons; 3 1(b) any two from: more working age people / more 1564 people; migration of working age people into country; change in birth rate; reduction in life expectancy / death rate of older people increases; 2 1(c) any two from: water level rise; extreme weather / flooding; (surface) erosion; will need to build a bridge / find a different route across the river / divert river; 2 Question Answer Marks 1(d)(i) correct plotting; bar same width and not touching and shading to match key; 2 1(d)(ii) 2019 and 2020 and 2021; 1 1(d)(iii) 6; 1 1(d)(iv) any two from: (in 2021 the) cost to build has decreased; less public objections; more expertise to build; greater demand; increased technology / research; greater economic development; 2 1(e) three from: (carbon dioxide in the atmosphere is captured and) compressed; transported via pipelines / roads / ships; pumped; into rocks / stored underground / stored in (natural) saline aquifers; an impermeable layer of rock above the store; 3 1(f) any two from: albedo enhancement; space reflectors; stratospheric aerosols; 2
Q2 · Scientists use tree ring data to investigate tree growth in a local area
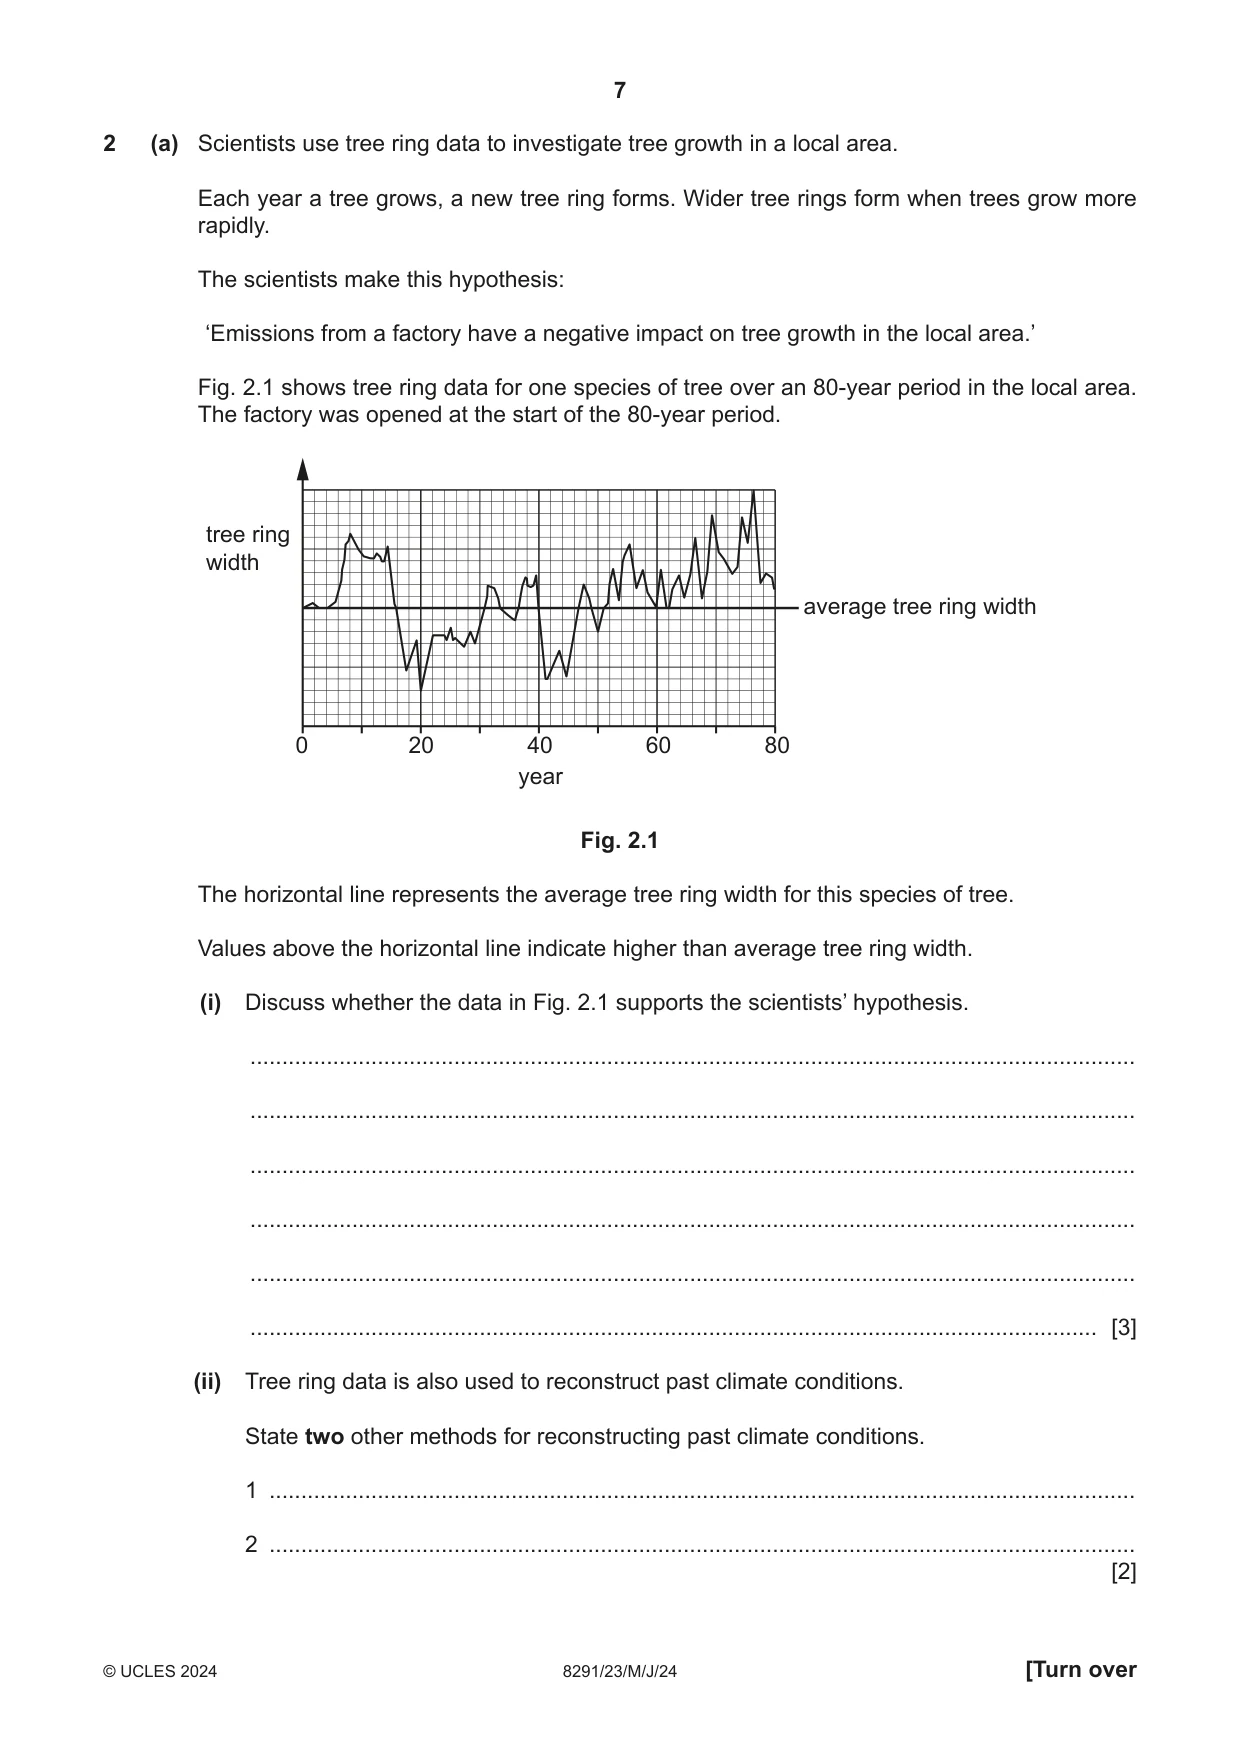
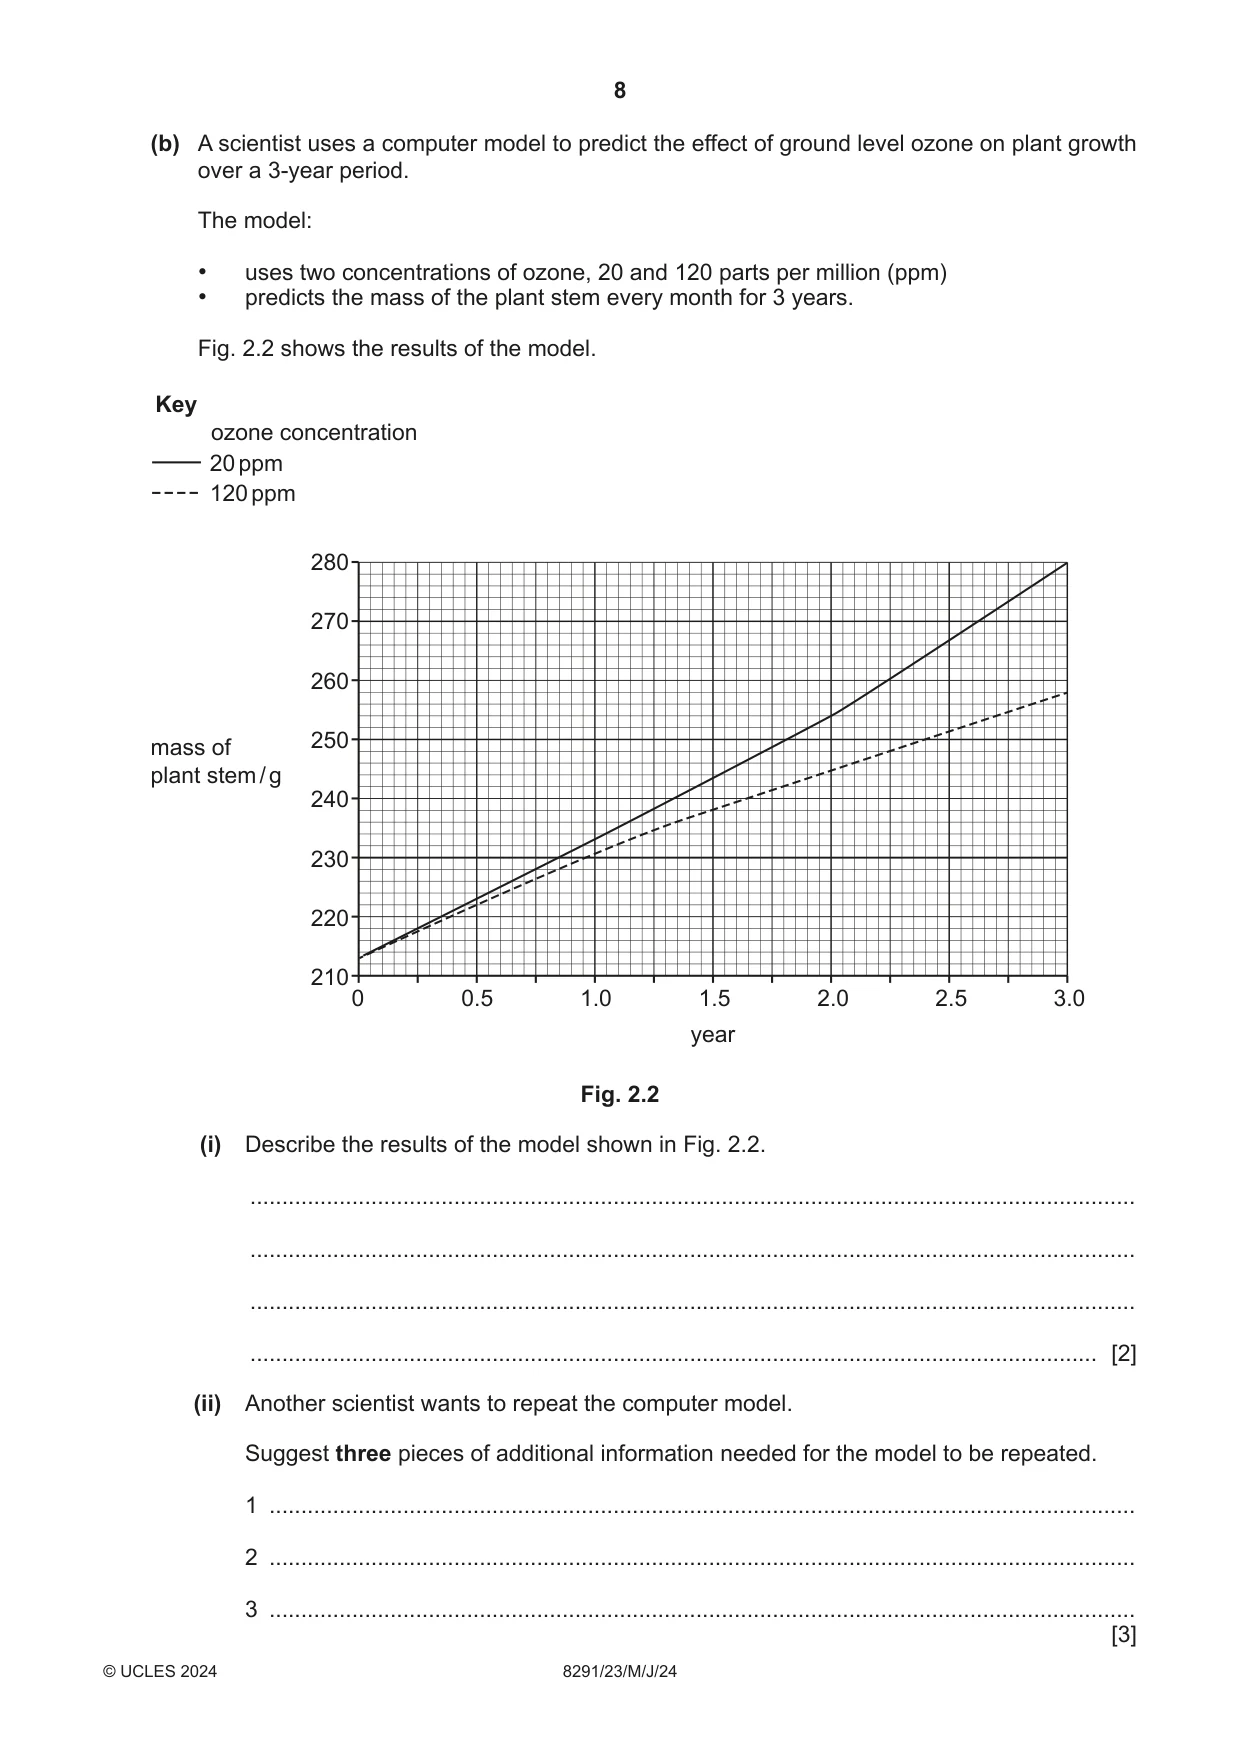
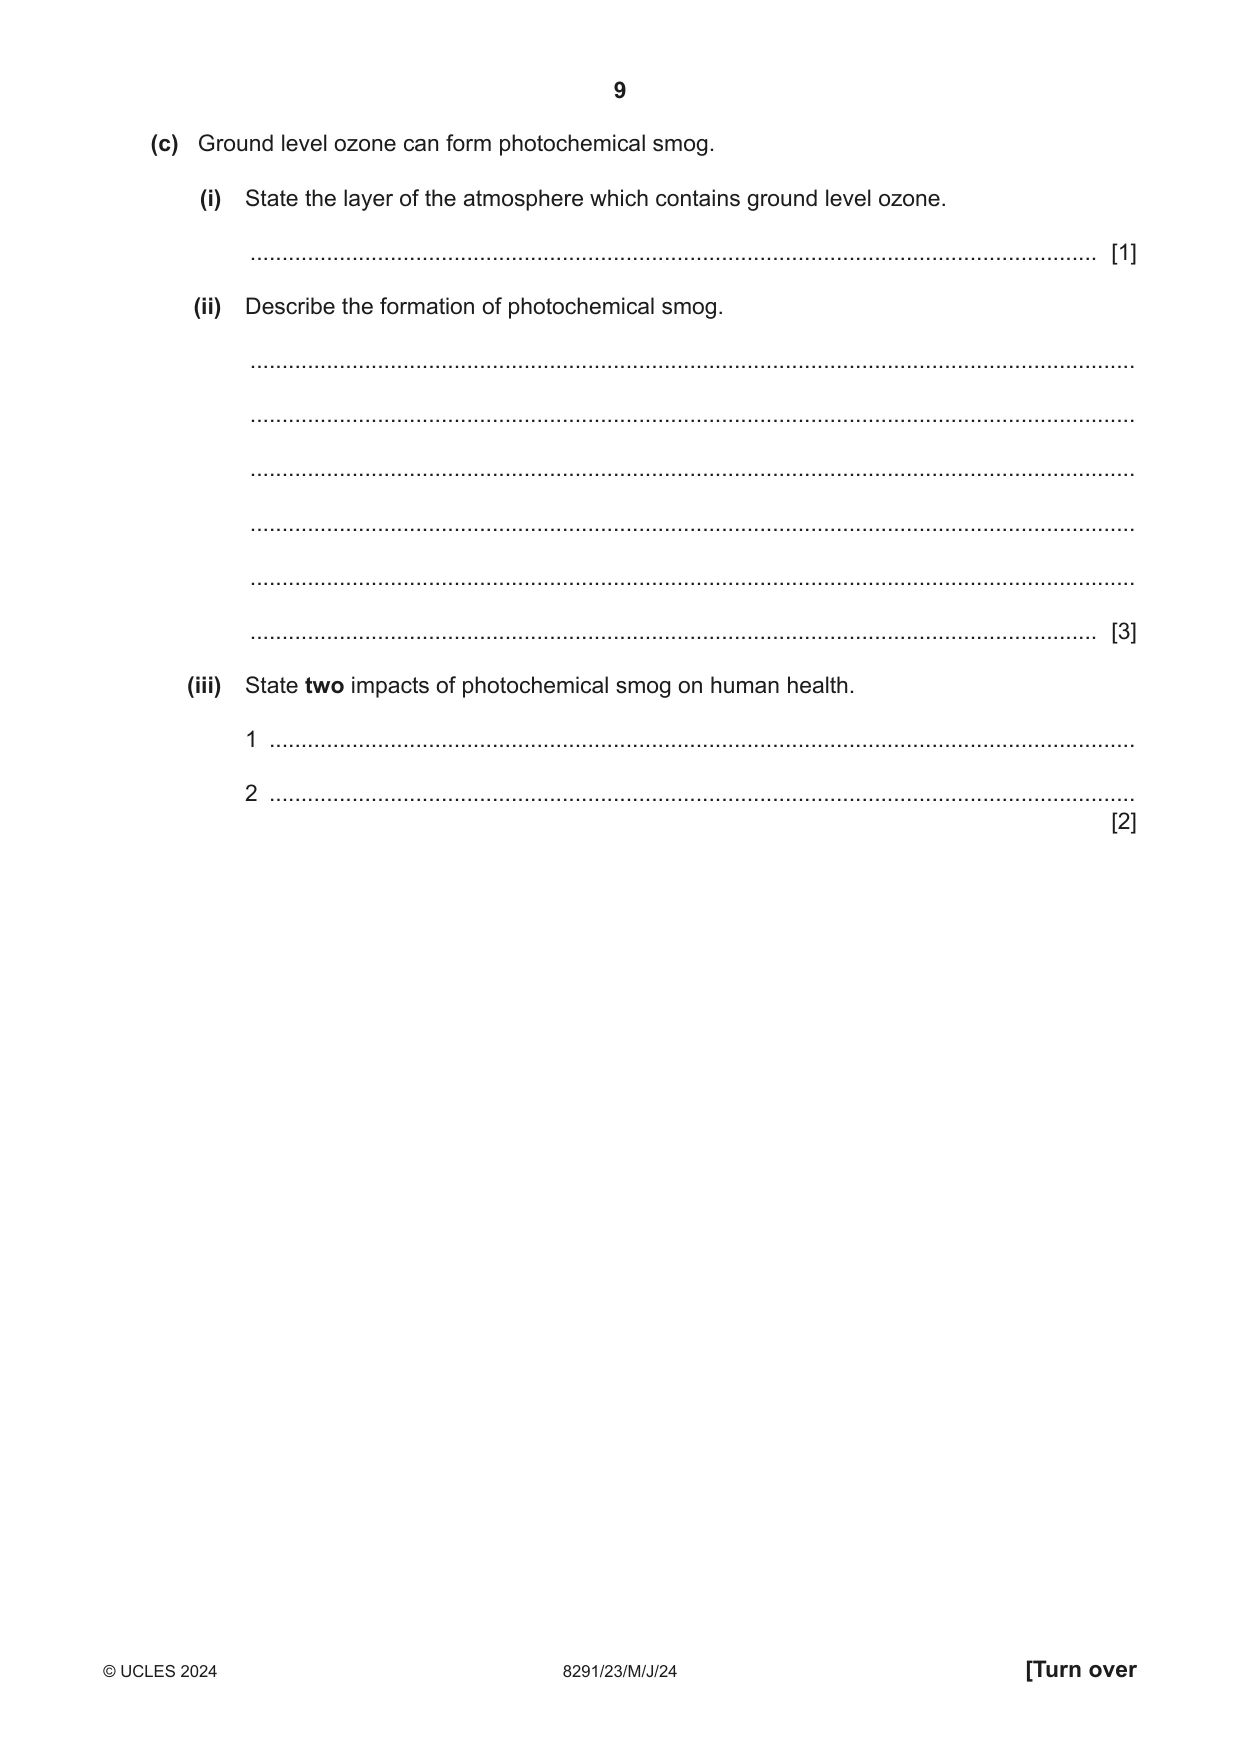
2 (a) Scientists use tree ring data to investigate tree growth in a local area. Each year a tree grows, a new tree ring forms. Wider tree rings form when trees grow more rapidly. The scientists make this hypothesis: ‘Emissions from a factory have a negative impact on tree growth in the local area.’ Fig. 2.1 shows tree ring data for one species of tree over an 80‑year period in the local area. The factory was opened at the start of the 80‑year period. tree ring width average tree ring width 0 20 40 60 80 year Fig. 2.1 The horizontal line represents the average tree ring width for this species of tree. Values above the horizontal line indicate higher than average tree ring width. (i) Discuss whether the data in Fig. 2.1 supports the scientists’ hypothesis. ........................................................................................................................................... ........................................................................................................................................... ........................................................................................................................................... ........................................................................................................................................... ........................................................................................................................................... ..................................................................................................................................... [3] (ii) Tree ring data is also used to reconstruct past climate conditions. State two other methods for reconstructing past climate conditions. 1 ........................................................................................................................................ 2 ........................................................................................................................................ [2] (b) A scientist uses a computer model to predict the effect of ground level ozone on plant growth over a 3‑year period. The model: • uses two concentrations of ozone, 20 and 120 parts per million (ppm) • predicts the mass of the plant stem every month for 3 years. Fig. 2.2 shows the results of the model. Key ozone concentration 20 ppm 120 ppm 280 270 260 250mass of plant stem / g 240 230 220 210 0 0.5 1.0 1.5 2.0 2.5 3.0 year Fig. 2.2 (i) Describe the results of the model shown in Fig. 2.2. ........................................................................................................................................... ........................................................................................................................................... ........................................................................................................................................... ..................................................................................................................................... [2] (ii) Another scientist wants to repeat the computer model. Suggest three pieces of additional information needed for the model to be repeated. 1 ........................................................................................................................................ 2 ........................................................................................................................................ 3 ........................................................................................................................................ [3] (c) Ground level ozone can form photochemical smog. (i) State the layer of the atmosphere which contains ground level ozone. ..................................................................................................................................... [1] (ii) Describe the formation of photochemical smog. ........................................................................................................................................... ........................................................................................................................................... ........................................................................................................................................... ........................................................................................................................................... ........................................................................................................................................... ..................................................................................................................................... [3] (iii) State two impacts of photochemical smog on human health. 1 ........................................................................................................................................ 2 ........................................................................................................................................ [2] (d) Table 2.1 shows the concentration of ground level ozone in ppm for a 24‑hour period in a USA city. Table 2.1 time ozone concentration / hour / ppm 0 0.10 3 0.10 6 0.30 9 0.34 12 0.62 15 0.92 18 0.84 21 0.18 24 0.10 (i) Plot the data as a line graph on the grid. Join each point with a straight line. [5] (ii) Calculate the range for ground level ozone concentration in the 24‑hour period. range = ................................................. ppm [1] (iii) A student concludes that the maximum ozone concentration in the 24‑hour period is 0.92 ppm. State whether the student’s conclusion is sensible. Justify your answer. ........................................................................................................................................... ..................................................................................................................................... [1] [Total: 23]
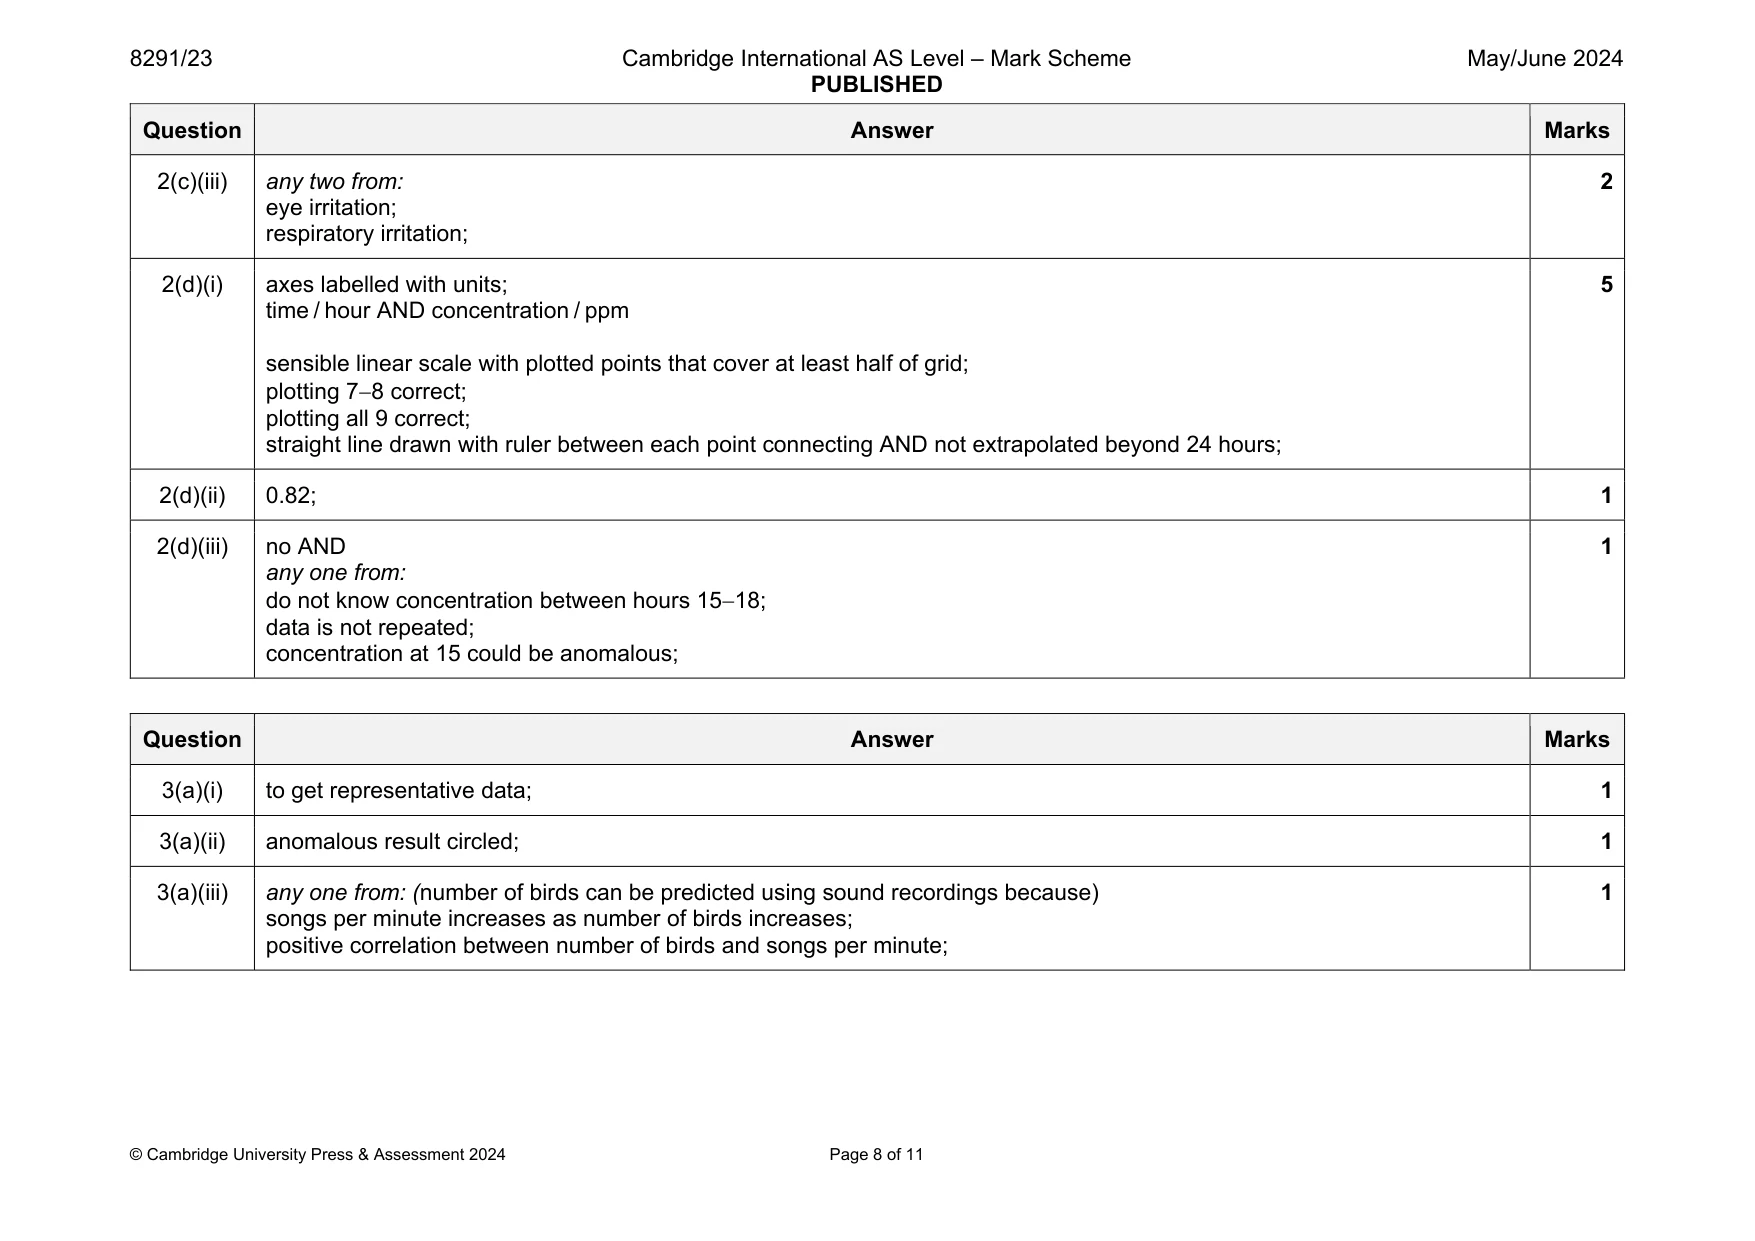
Mark scheme: 2(a)(i) max two justifications: year 0 to 20: higher than average tree ring width; year 50 to 80: higher than average tree ring width; idea of significant fluctuations; max two conclusion: (no impact from factory because) more years with higher than average tree ring width / more years with above average growth; other factors impact tree growth / factor named e.g. drought / fire / temperature / disease; 2(a)(ii) ice cores; historical accounts; 2 2(b)(i) any two from: for both concentrations mass increases with time; increased ozone concentration decreases plant mass / the longer the plants are exposed to ozone the greater the difference in mass between 20 and 120 ppm; little effect in first year; relevant quoted comparative data e.g. after 3 years 25 g different; 2 2(b)(ii) any three from: total number of plants; species of plant; stated growing conditions ;;; e.g. soil pH, amount of light, volume of water, spacing, temperature, organic content of soil AVP; 3 2(c)(i) troposphere; 1 2(c)(ii) in the presence of sunlight; any two from reaction of ozone with: oxides of nitrogen ; particulates; volatile organic compounds / VOCs; 3 Question Answer Marks 2(c)(iii) any two from: eye irritation; respiratory irritation; 2 2(d)(i) axes labelled with units; time / hour AND concentration / ppm sensible linear scale with plotted points that cover at least half of grid; plotting 78 correct; plotting all 9 correct; straight line drawn with ruler between each point connecting AND not extrapolated beyond 24 hours; 5 2(d)(ii) 0.82; 1 2(d)(iii) no AND any one from: do not know concentration between hours 1518; data is not repeated; concentration at 15 could be anomalous; 1
Q3 · The European bee‑eater bird
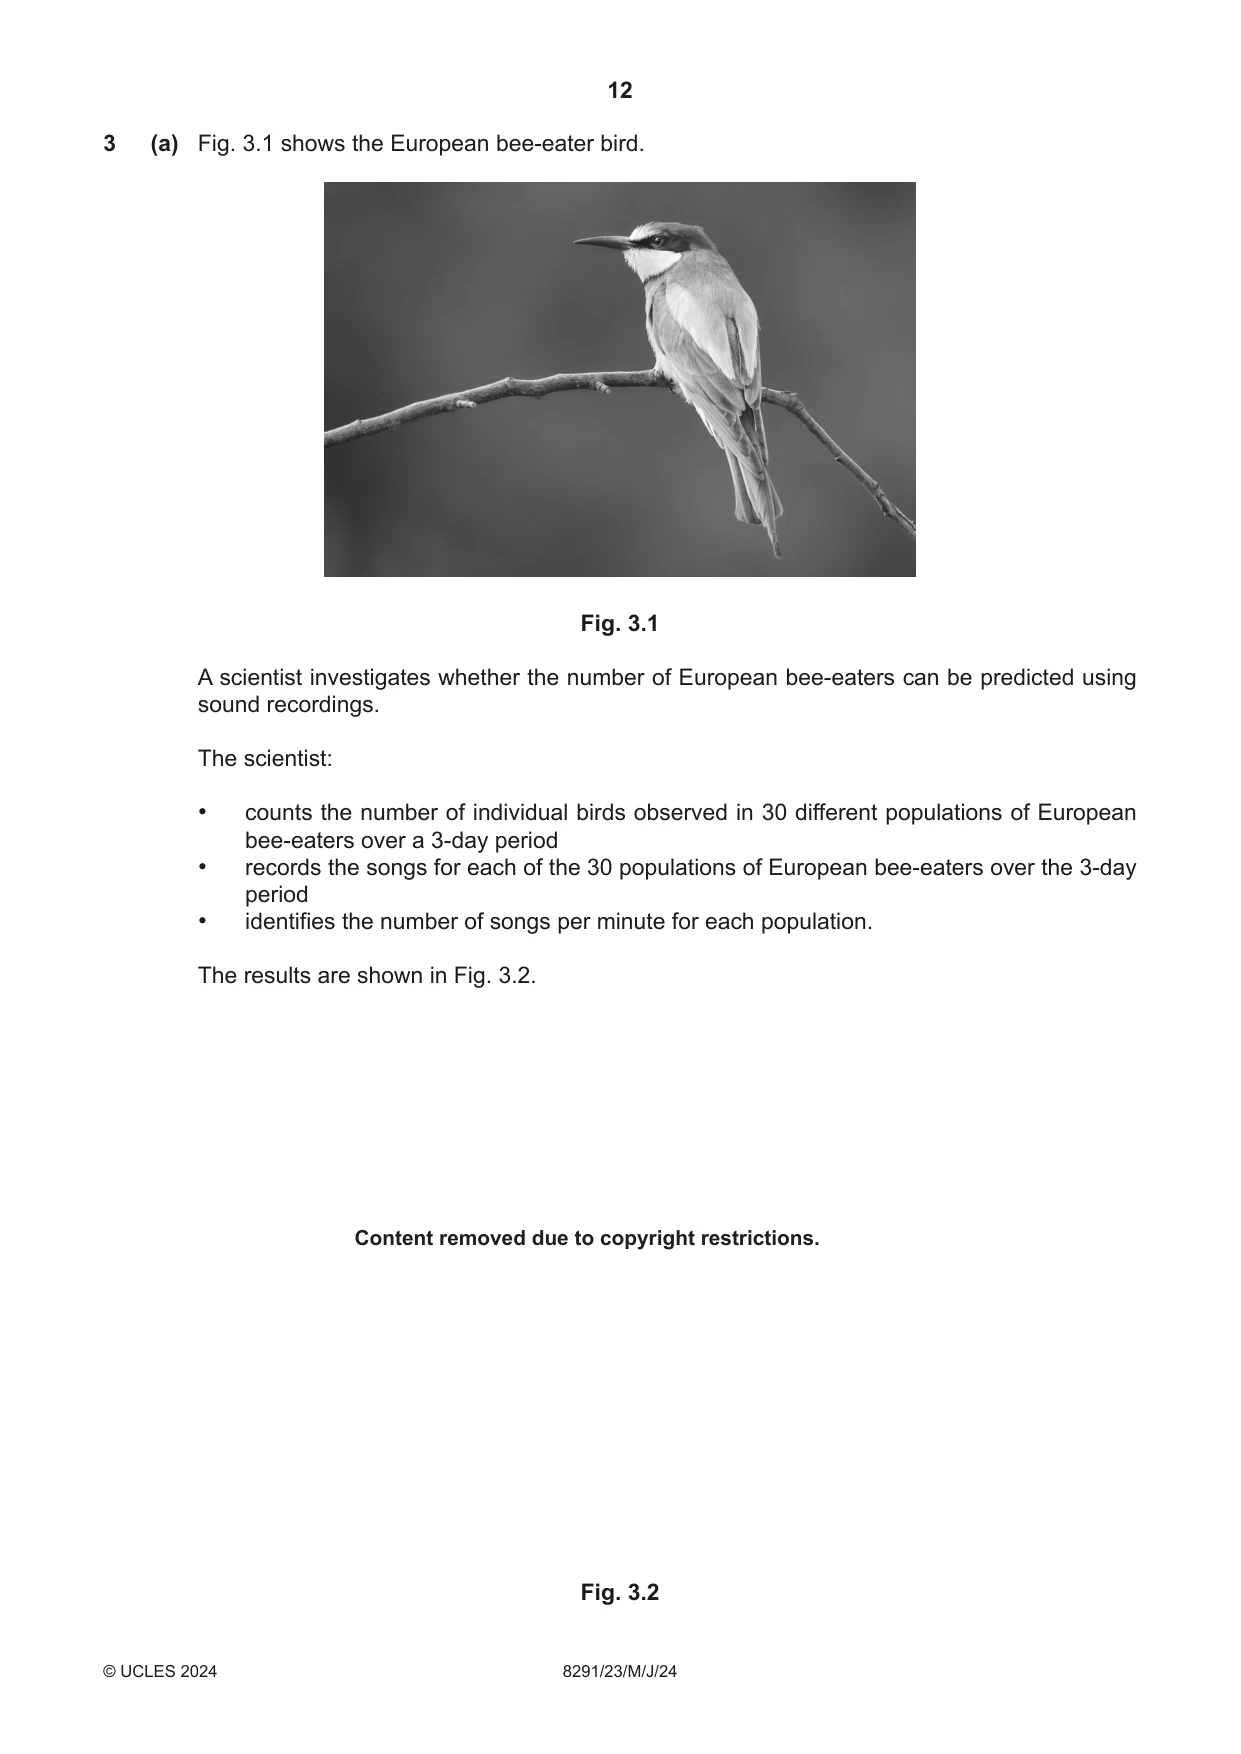
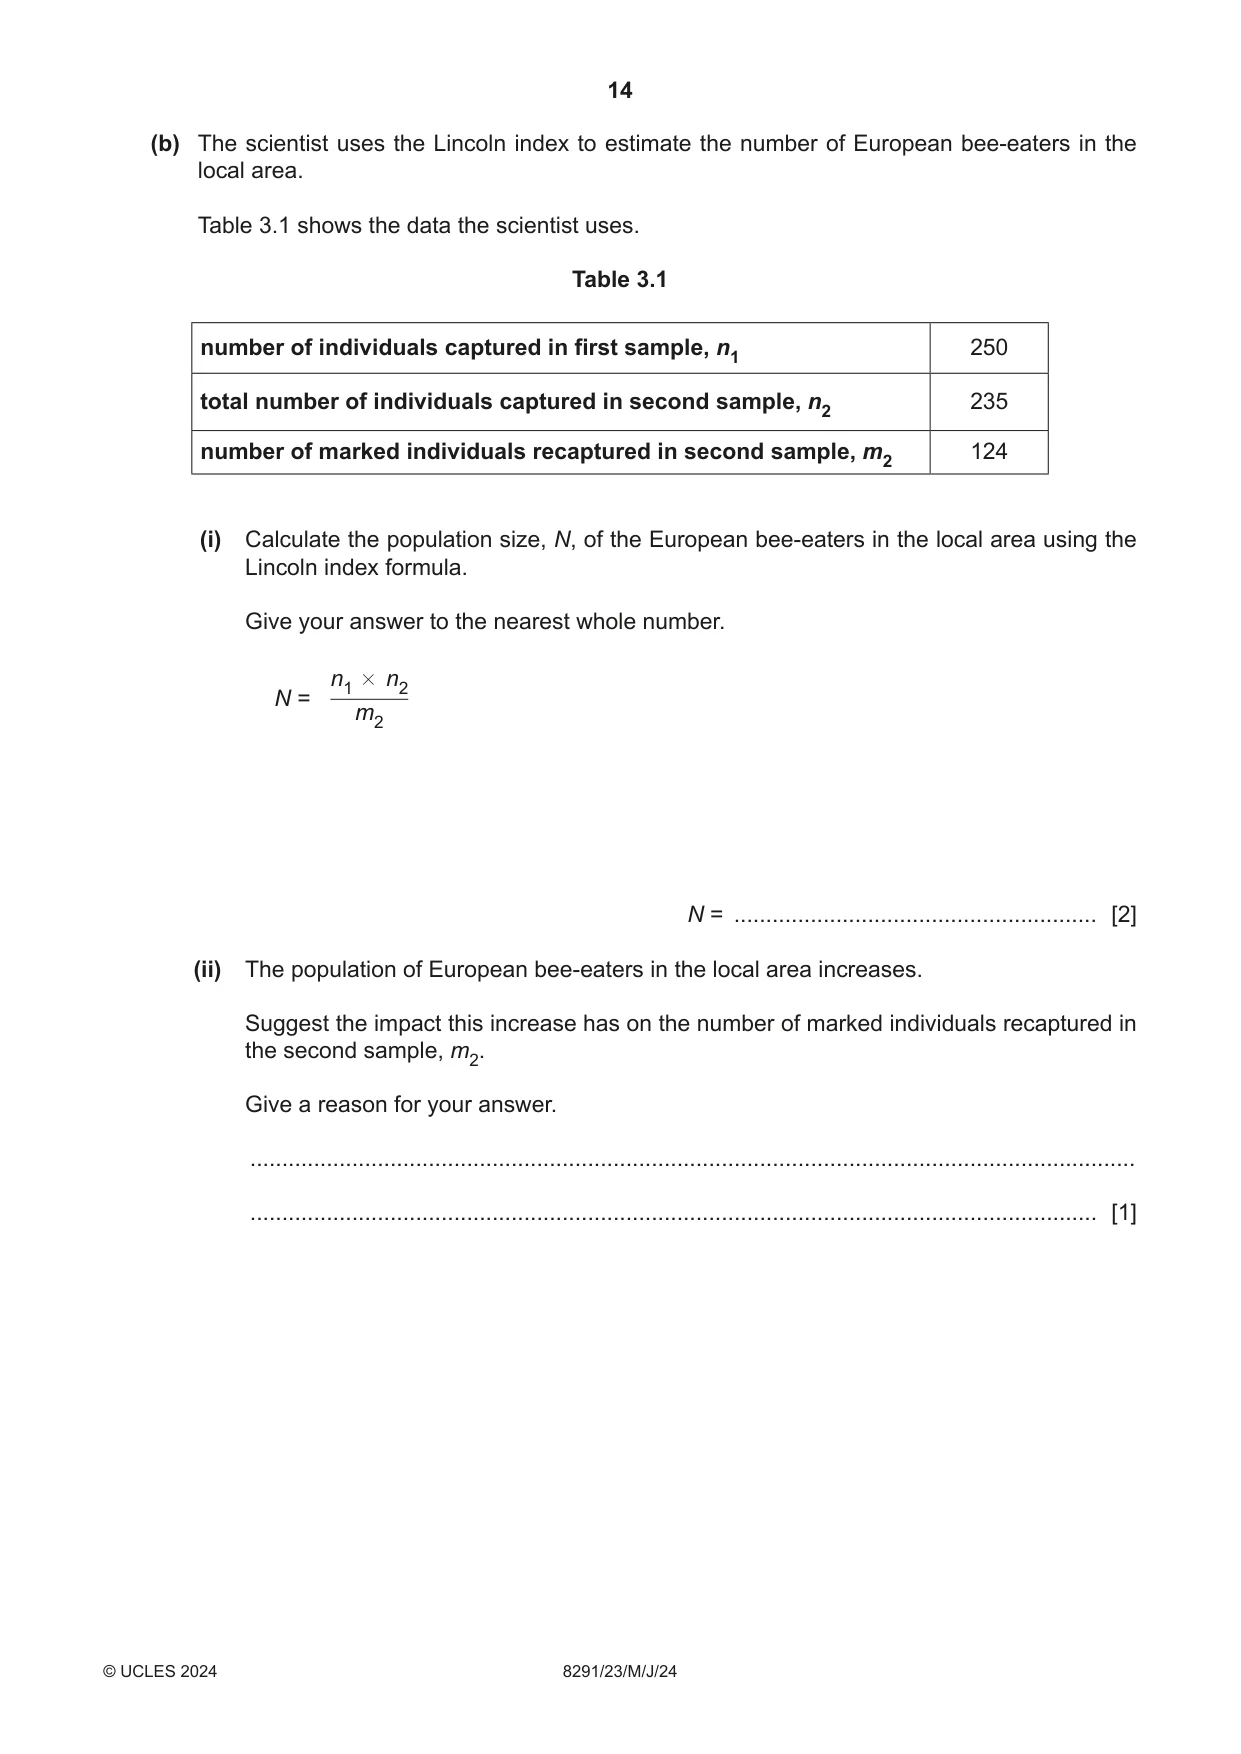
3 (a) Fig. 3.1 shows the European bee‑eater bird. Fig. 3.1 A scientist investigates whether the number of European bee‑eaters can be predicted using sound recordings. The scientist: • counts the number of individual birds observed in 30 different populations of European bee‑eaters over a 3‑day period • records the songs for each of the 30 populations of European bee‑eaters over the 3‑day period • identifies the number of songs per minute for each population. The results are shown in Fig. 3.2. Content removed due to copyright restrictions. Fig. 3.2 (i) Suggest why the scientist investigates more than one population of European bee‑eater. ........................................................................................................................................... ..................................................................................................................................... [1] (ii) Circle one result that is most likely to be anomalous on Fig. 3.2. [1] (iii) Write a suitable conclusion for the results. ........................................................................................................................................... ..................................................................................................................................... [1] (iv) The scientist identifies the number of songs per minute for each population of European bee‑eaters by listening to the recordings over the 3‑day period. Suggest the limitations of this method. ........................................................................................................................................... ........................................................................................................................................... ........................................................................................................................................... ..................................................................................................................................... [2] (v) Suggest the benefit of using sound recordings to investigate populations of endangered birds. ........................................................................................................................................... ..................................................................................................................................... [1] (b) The scientist uses the Lincoln index to estimate the number of European bee‑eaters in the local area. Table 3.1 shows the data the scientist uses. Table 3.1 number of individuals captured in first sample, n1 250 total number of individuals captured in second sample, n2 235 number of marked individuals recaptured in second sample, m2 124 (i) Calculate the population size, N, of the European bee‑eaters in the local area using the Lincoln index formula. Give your answer to the nearest whole number. n1 # n2 N = m2 N = ......................................................... [2] (ii) The population of European bee‑eaters in the local area increases. Suggest the impact this increase has on the number of marked individuals recaptured in the second sample, m2. Give a reason for your answer. ........................................................................................................................................... ..................................................................................................................................... [1] (c) Rewilding is a strategy used to increase biodiversity. (i) Explain how rewilding increases biodiversity. ........................................................................................................................................... ........................................................................................................................................... ........................................................................................................................................... ........................................................................................................................................... ........................................................................................................................................... ..................................................................................................................................... [3] (ii) Suggest two reasons why the population of European bee‑eaters in the local area increases, other than rewilding. 1 ........................................................................................................................................ 2 ........................................................................................................................................ [2] [Total: 14]
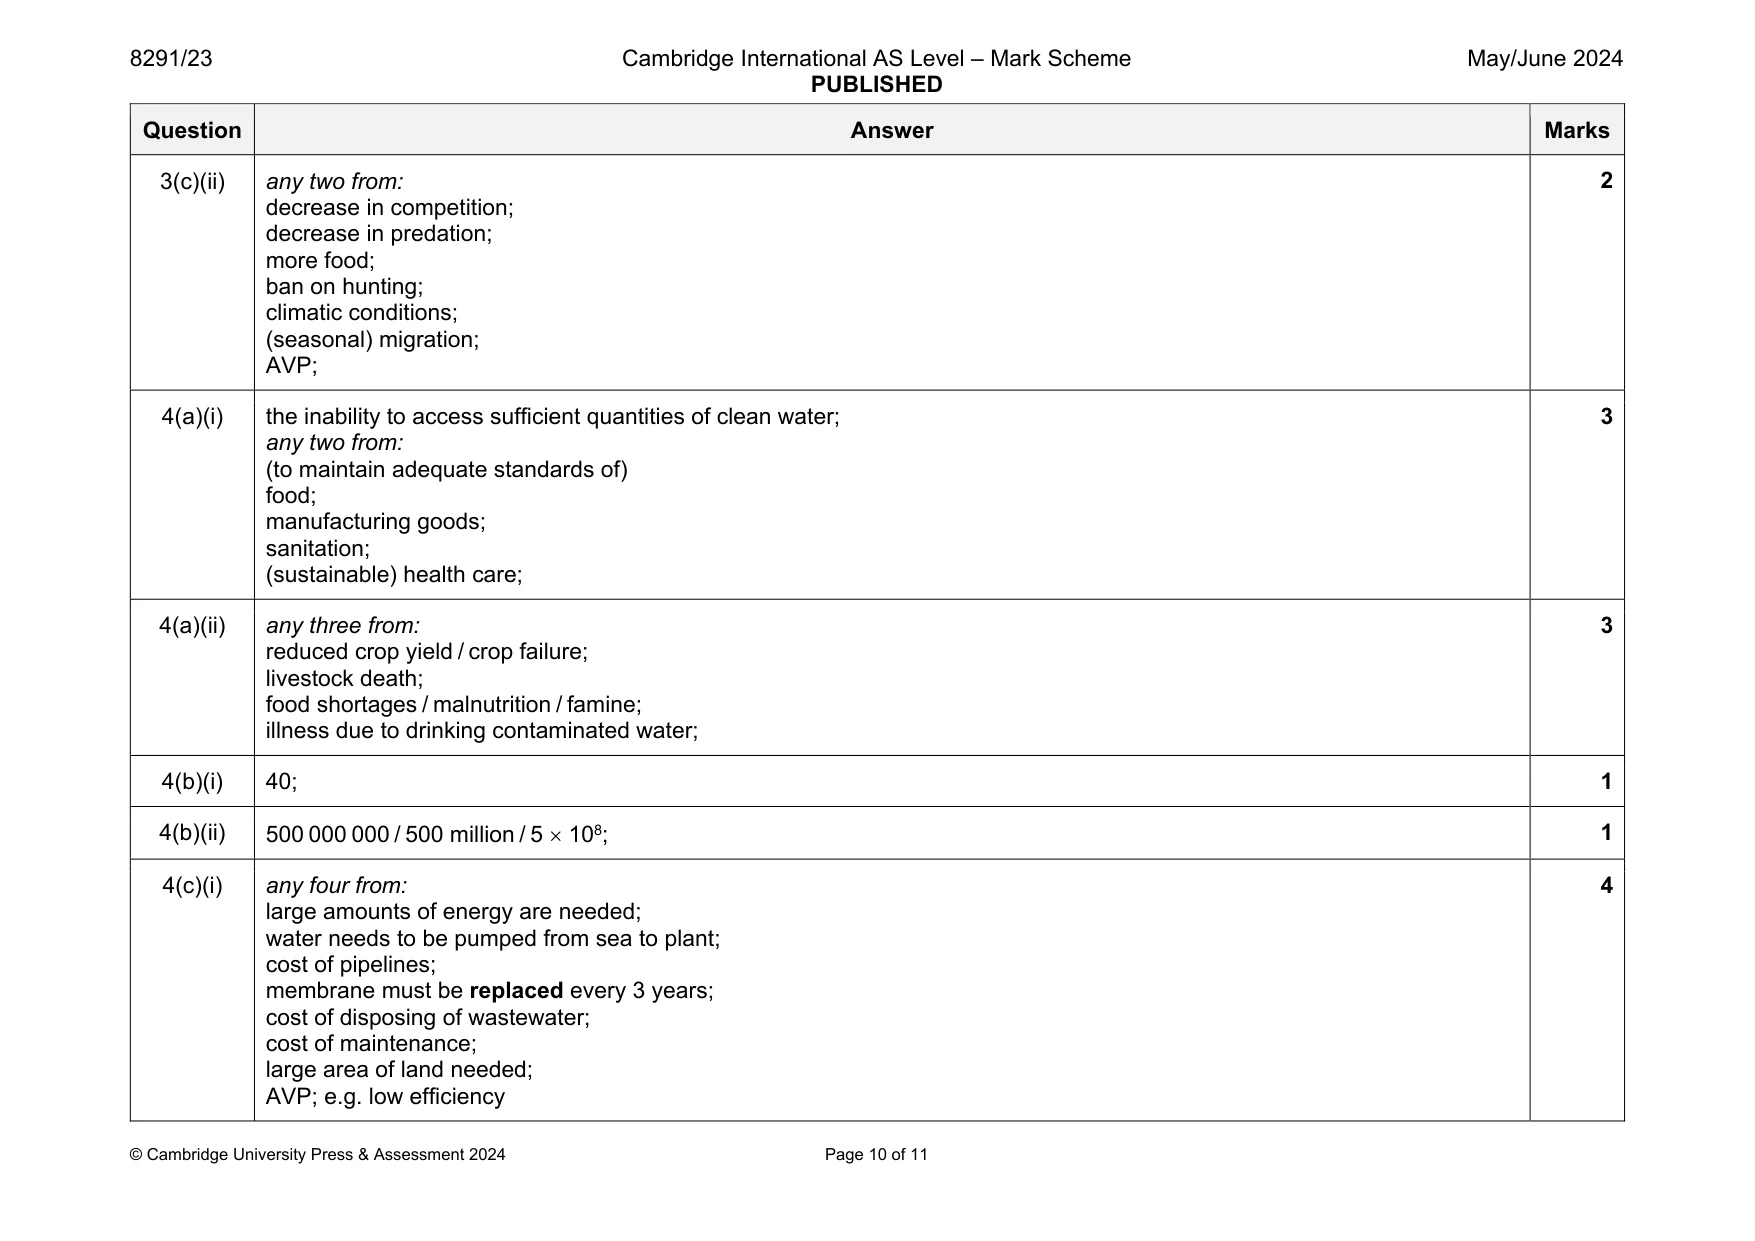
Mark scheme: 3(a)(i) to get representative data; 1 3(a)(ii) anomalous result circled; 1 3(a)(iii) any one from: (number of birds can be predicted using sound recordings because) songs per minute increases as number of birds increases; positive correlation between number of birds and songs per minute; 1 Question Answer Marks 3(a)(iv) any two from: time consuming / 3 days of recordings to listen to; difficult to identify the song of the European bee-eaters compared to other birds; other sounds other than birds might interfere with the recording; birds all singing at once; same bird could be counted more than once; AVP; 2 3(a)(v) any one from: birds not disturbed; recordings can be left for a long time to run / automated; idea of permanent record / data can be checked; big data that can be analysed by computer; eliminates error if analysed by computer; AVP; 1 3(b)(i) (250 235) 124 / 473.79; 474; 2 3(b)(ii) decreases AND any one from: lower proportion of marked birds in total population; greater mixing of marked released birds with total population; lower recapture of marked birds in second sample; 1 3(c)(i) any three from: reintroducing species; reducing active management of wildlife; allowing natural forest regeneration; idea of letting nature manage itself / idea an area reverts back to natural state; 3 Question Answer Marks 3(c)(ii) any two from: decrease in competition; decrease in predation; more food; ban on hunting; climatic conditions; (seasonal) migration; AVP; 2 3
Q4 · More than 3 billion people every year are affected by water insecurity
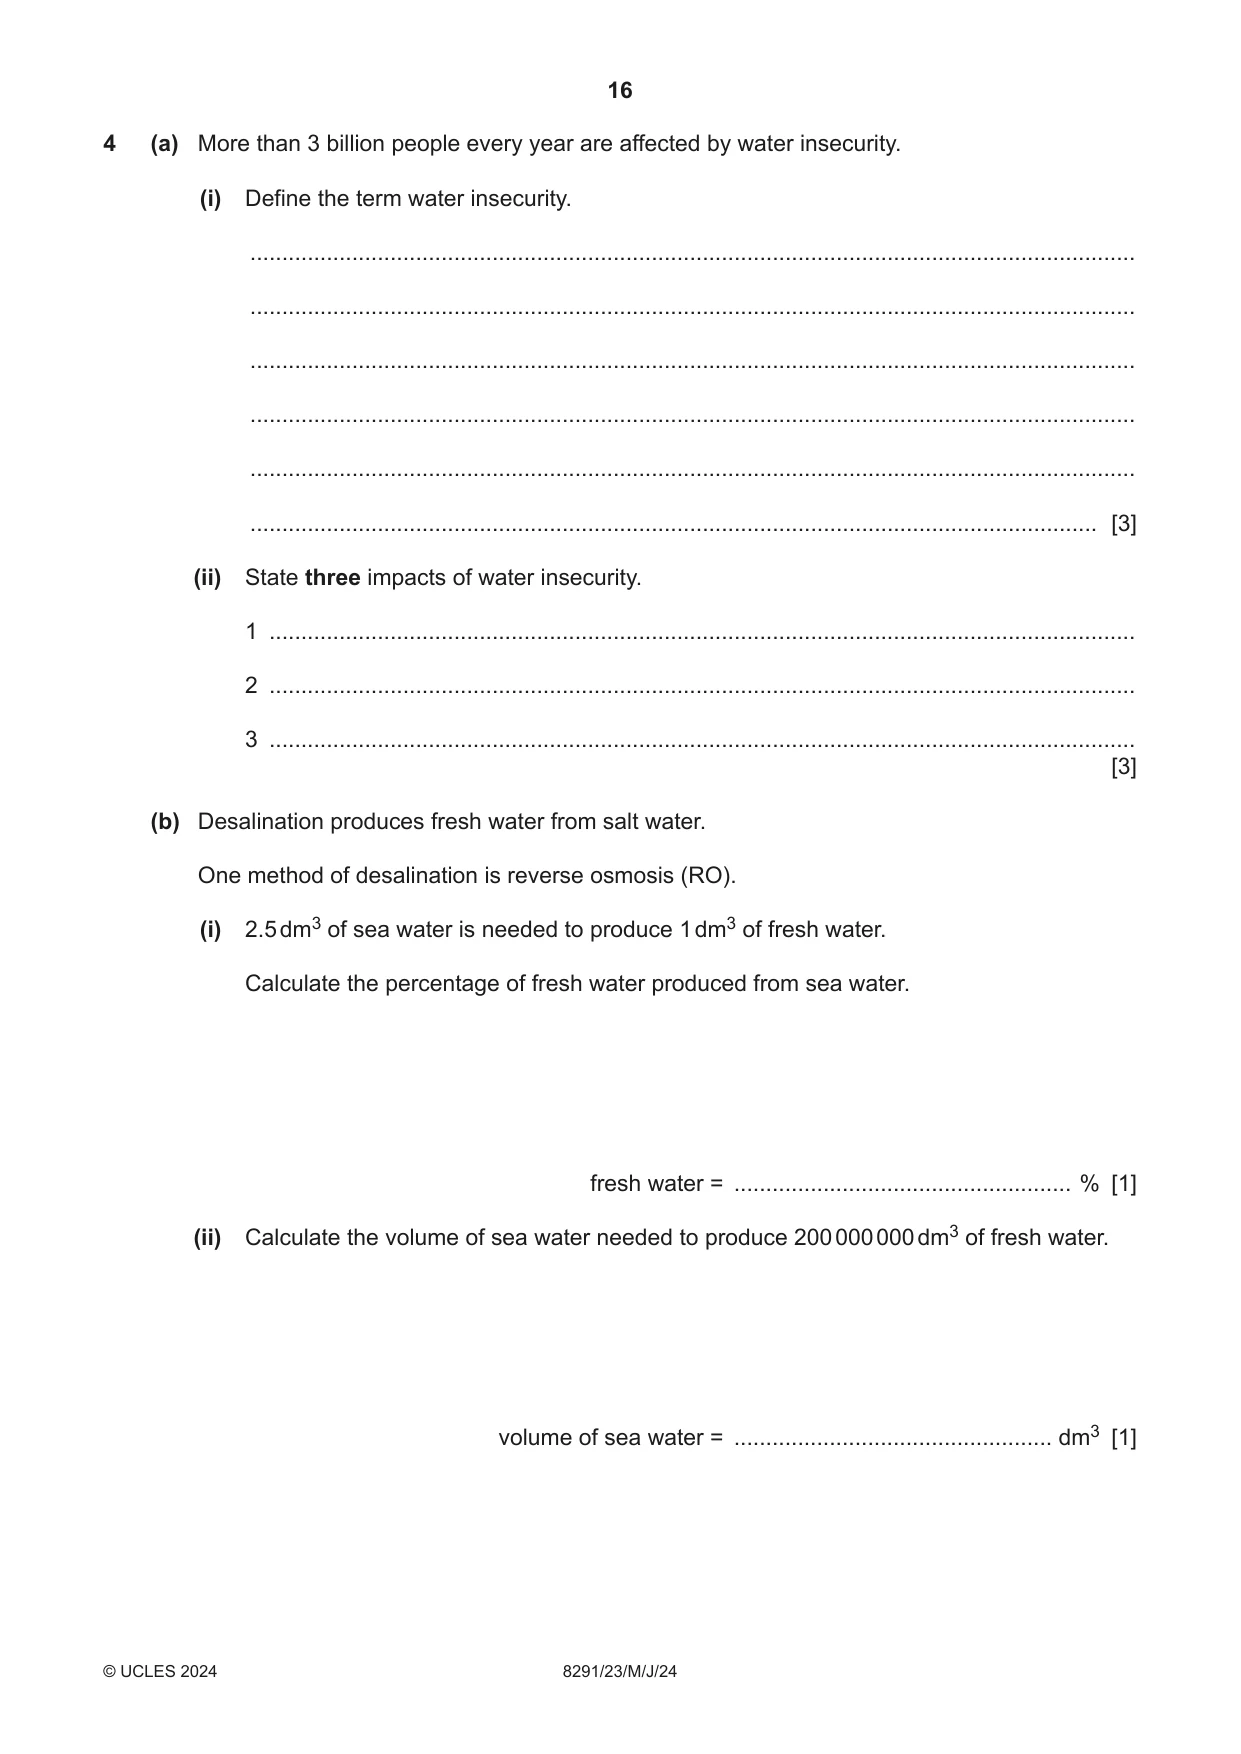
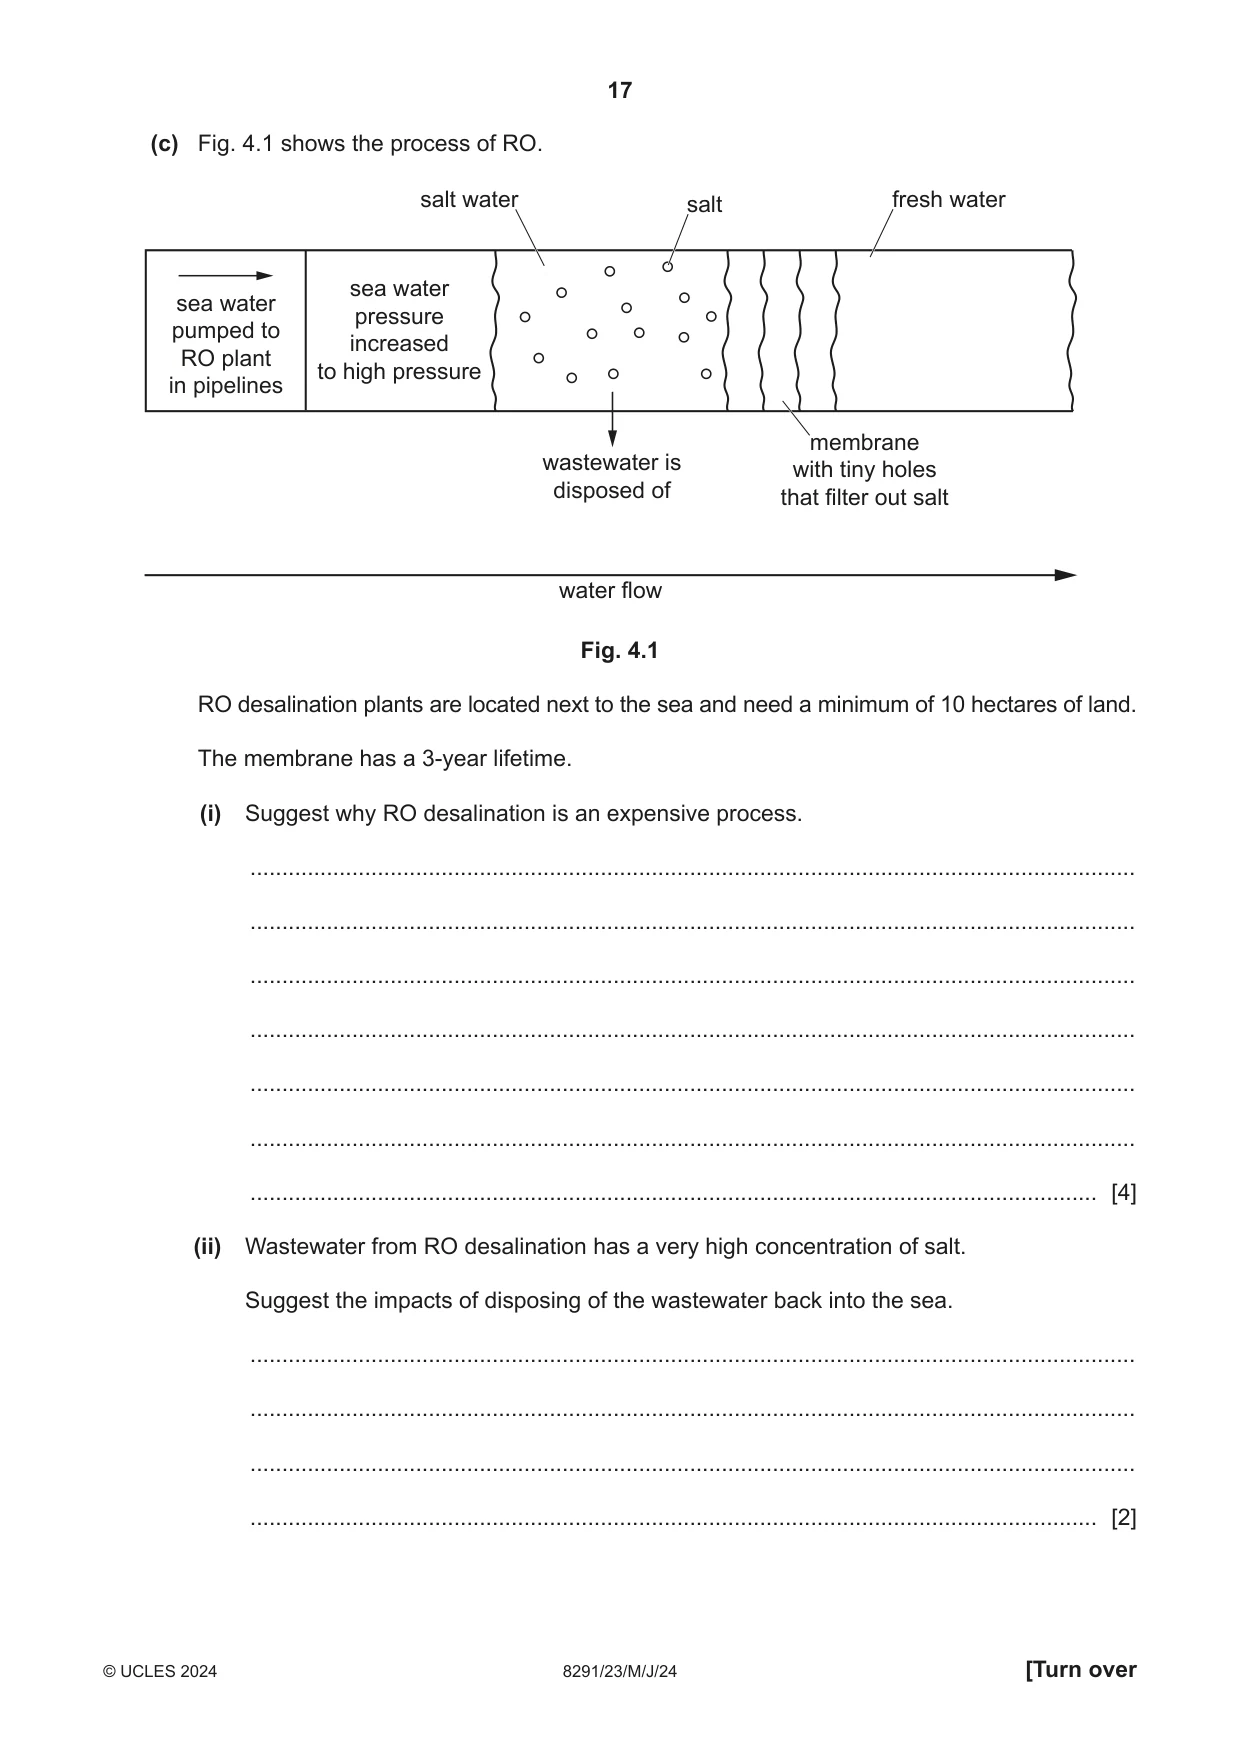
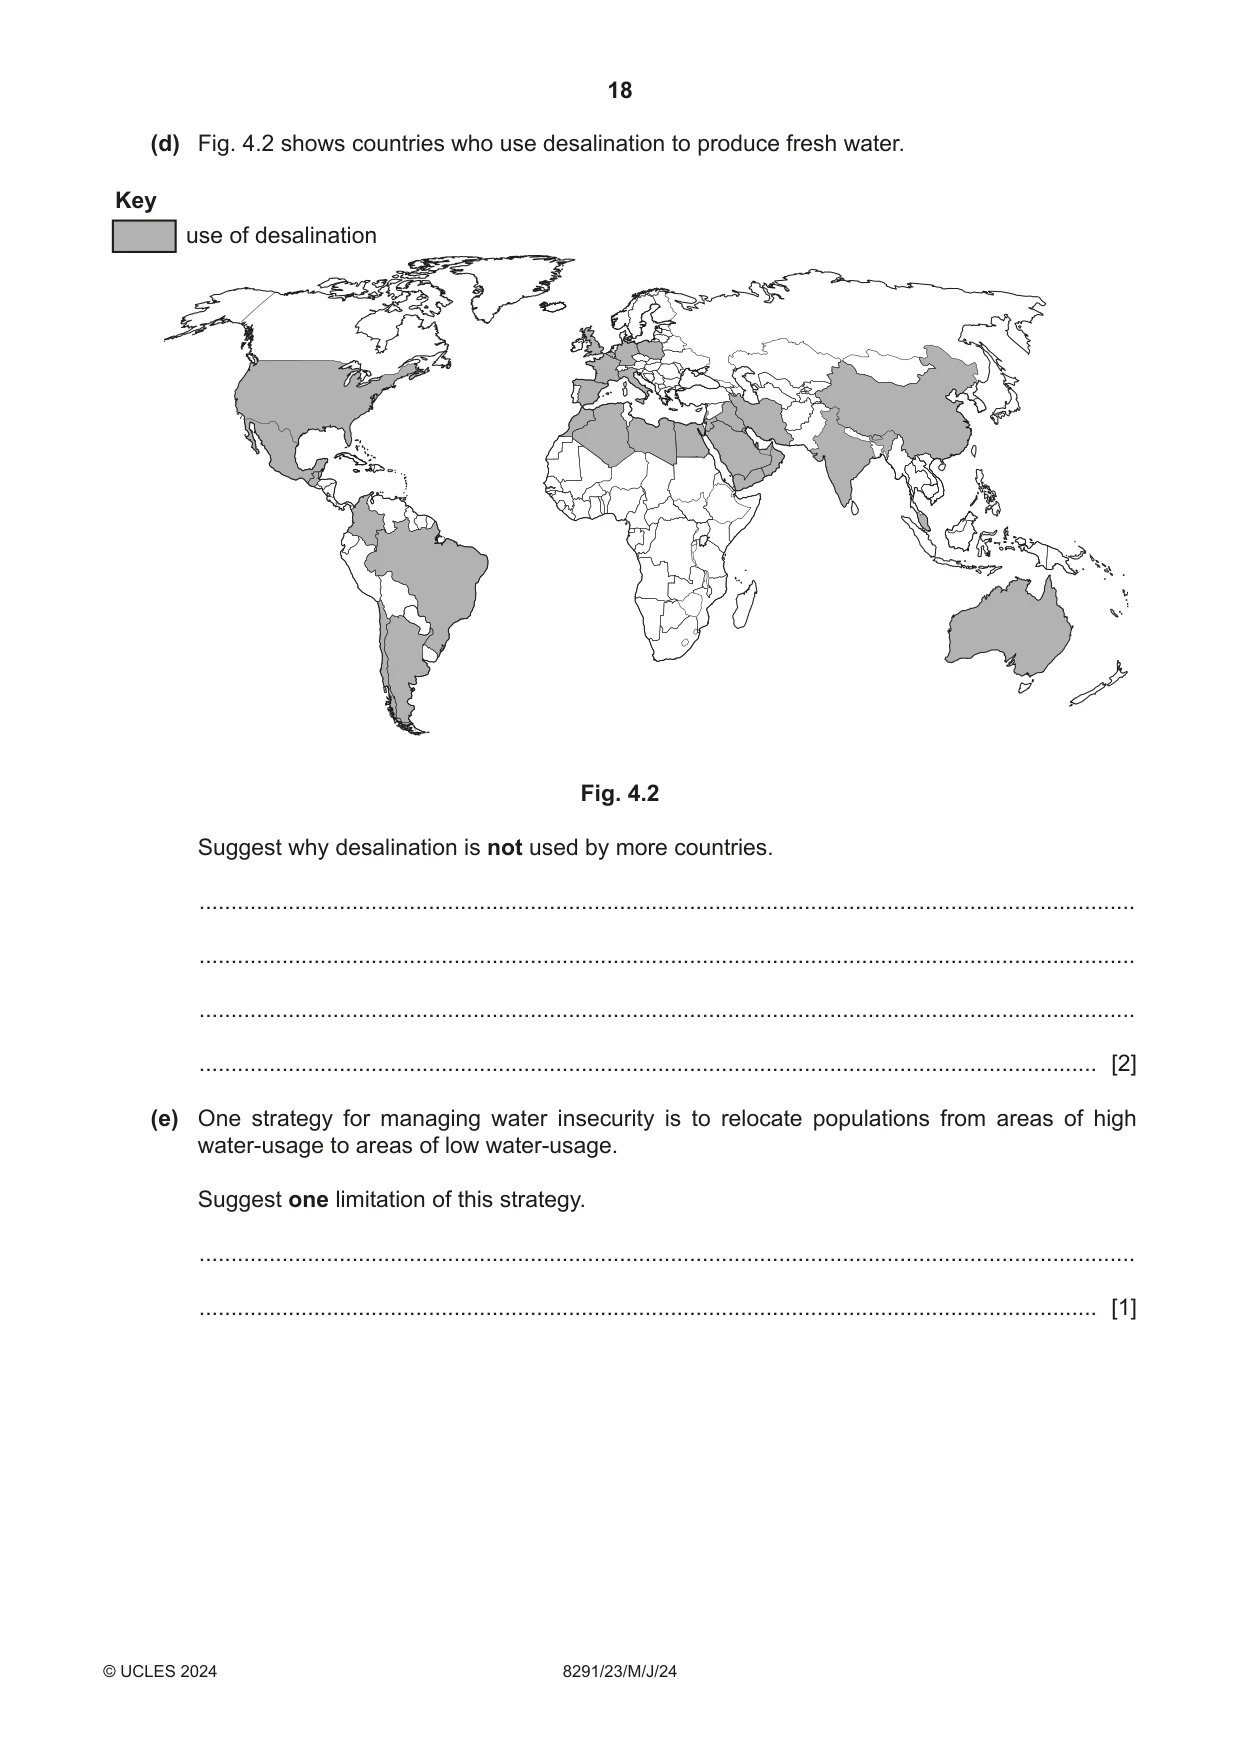
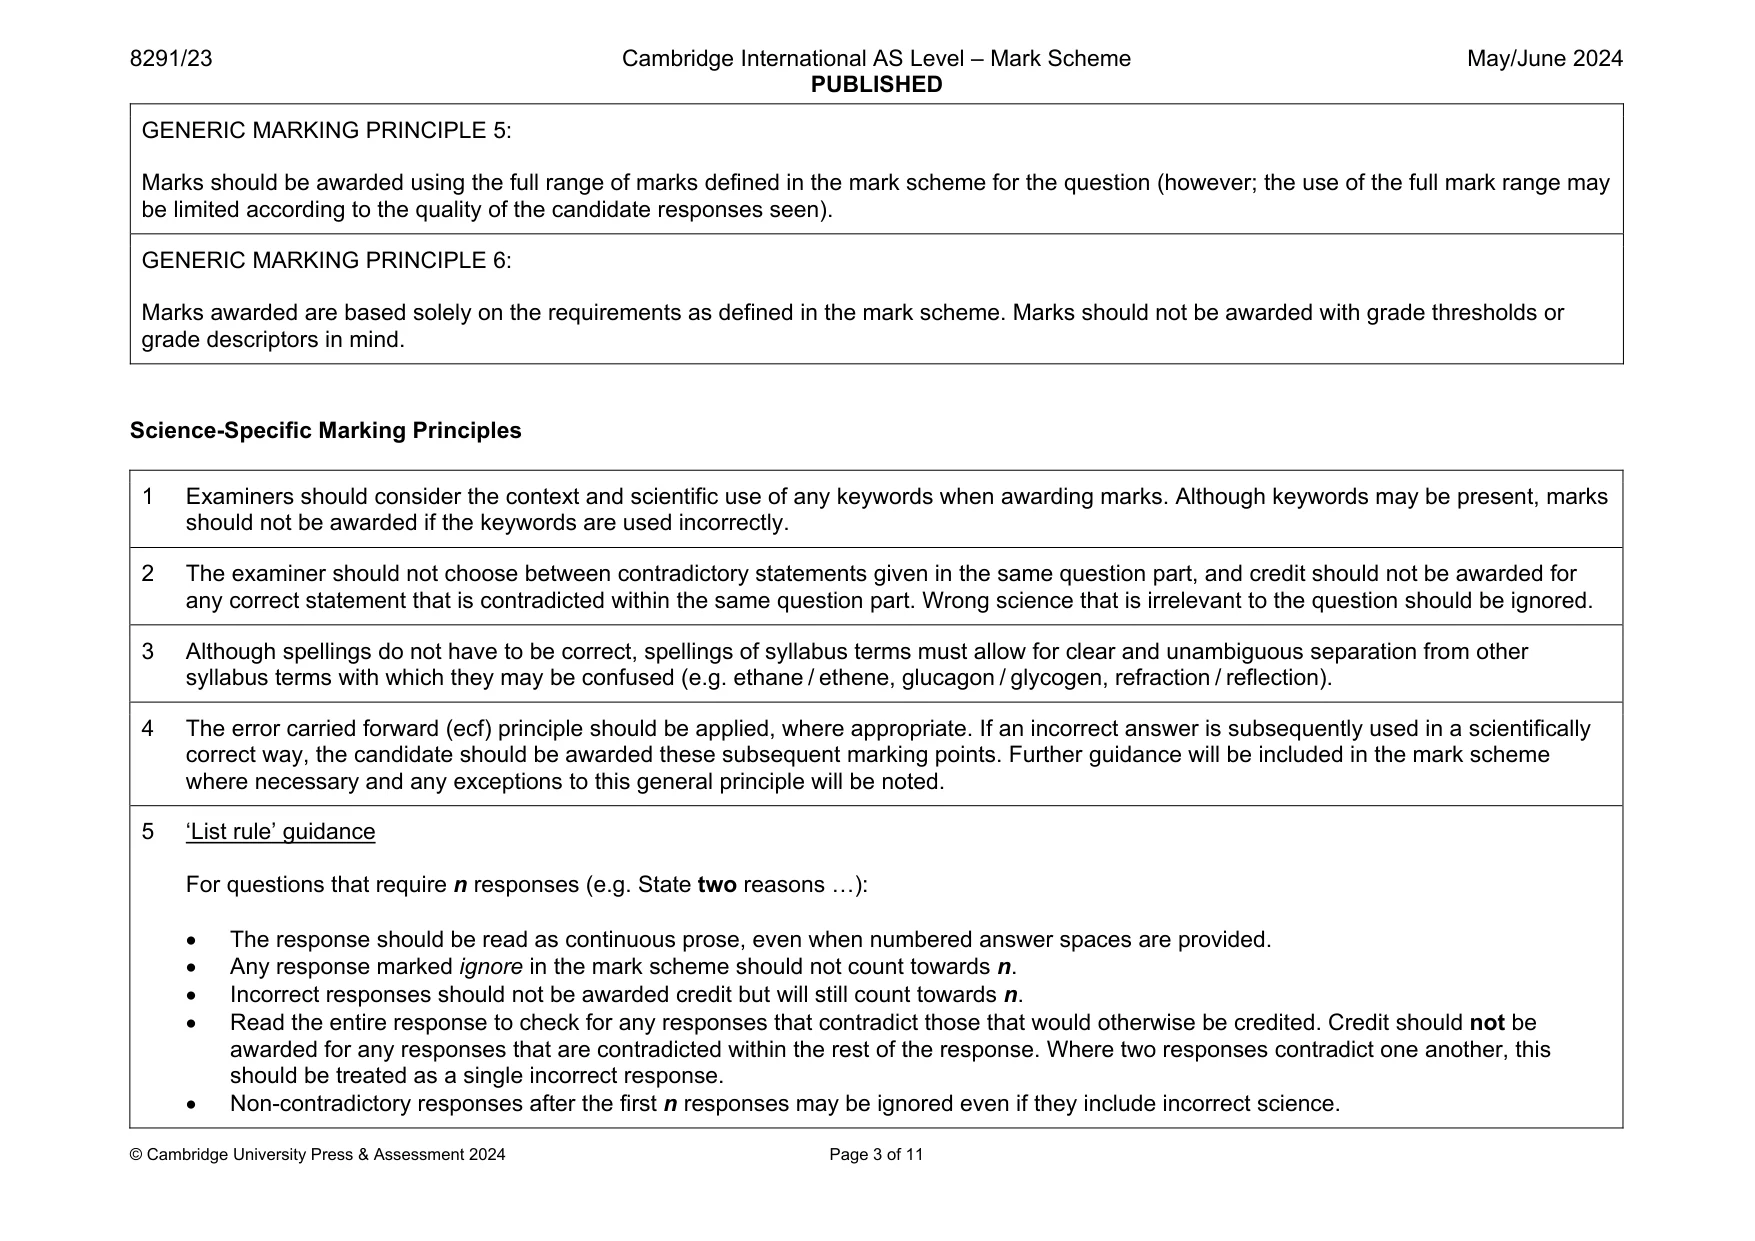
4 (a) More than 3 billion people every year are affected by water insecurity. (i) Define the term water insecurity. ........................................................................................................................................... ........................................................................................................................................... ........................................................................................................................................... ........................................................................................................................................... ........................................................................................................................................... ..................................................................................................................................... [3] (ii) State three impacts of water insecurity. 1 ........................................................................................................................................ 2 ........................................................................................................................................ 3 ........................................................................................................................................ [3] (b) Desalination produces fresh water from salt water. One method of desalination is reverse osmosis (RO). (i) 2.5 dm3 of sea water is needed to produce 1 dm3 of fresh water. Calculate the percentage of fresh water produced from sea water. fresh water = ..................................................... % [1] (ii) Calculate the volume of sea water needed to produce 200 000 000 dm3 of fresh water. volume of sea water = .................................................. dm3 [1] (c) Fig. 4.1 shows the process of RO. salt water salt fresh water sea water sea water pressure pumped to increased RO plant to high pressure in pipelines membrane wastewater is with tiny holes disposed of that filter out salt water flow Fig. 4.1 RO desalination plants are located next to the sea and need a minimum of 10 hectares of land. The membrane has a 3‑year lifetime. (i) Suggest why RO desalination is an expensive process. ........................................................................................................................................... ........................................................................................................................................... ........................................................................................................................................... ........................................................................................................................................... ........................................................................................................................................... ........................................................................................................................................... ..................................................................................................................................... [4] (ii) Wastewater from RO desalination has a very high concentration of salt. Suggest the impacts of disposing of the wastewater back into the sea. ........................................................................................................................................... ........................................................................................................................................... ........................................................................................................................................... ..................................................................................................................................... [2] (d) Fig. 4.2 shows countries who use desalination to produce fresh water. Key use of desalination Fig. 4.2 Suggest why desalination is not used by more countries. ................................................................................................................................................... ................................................................................................................................................... ................................................................................................................................................... ............................................................................................................................................. [2] (e) One strategy for managing water insecurity is to relocate populations from areas of high water‑usage to areas of low water‑usage. Suggest one limitation of this strategy. ................................................................................................................................................... ............................................................................................................................................. [1]
Mark scheme: 4(a)(i) the inability to access sufficient quantities of clean water; any two from: (to maintain adequate standards of) food; manufacturing goods; sanitation; (sustainable) health care; 4(a)(ii) any three from: reduced crop yield / crop failure; livestock death; food shortages / malnutrition / famine; illness due to drinking contaminated water; 3 4(b)(i) 40; 1 4(b)(ii) 500 000 000 / 500 million / 5 108; 1 4(c)(i) any four from: large amounts of energy are needed; water needs to be pumped from sea to plant; cost of pipelines; membrane must be replaced every 3 years; cost of disposing of wastewater; cost of maintenance; large area of land needed; AVP; e.g. low efficiency 4 Question Answer Marks 4(c)(ii) any two from: impact on future desalination of sea water / sea water becomes more salty; costs more to remove the salt from sea water; becomes toxic to marine organisms; disrupts food chains / reduces biodiversity; alters abiotic component of ecosystem; AVP; 2 4(d) any two from: location / land-locked; cost; lack of expertise; limited availability of fossil fuel to run the desalination; existing availability of fresh water supplies e.g. lakes; AVP; 2 4(e) any one from: people unwilling to leave homes; people have to leave jobs; AVP; 1 4(f) dam / reservoir; 1 4(g) ice sheets / glaciers / lakes / rivers / marshes / permafrost; 1
What was in this paper
The subtopics covered by these 4 questions, and how many questions each got. Open one in a new tab to see every Cambridge question on it.
What you needed in this session
Cambridge’s own grade thresholds for 2024 May/June, Paper 2 · Variant 3. A higher threshold means an easier paper — the bar moves with how the cohort did.