Cambridge A Level Environmental Management (AS only) 8291 — 2024 May/June Paper 2 · Variant 1
8291/21/M/J/24 · 4 questions · 80 marks · ≈90 min
The question paper and its mark scheme, free to read here and free to download. This is Cambridge’s own paper, exactly as it was sat.
Question paper24 pages


Mark scheme16 pages
Answers below. Sit the paper first if you are practising.
Questions as text
Q1 · Water usage by sector in the USA and Nigeria
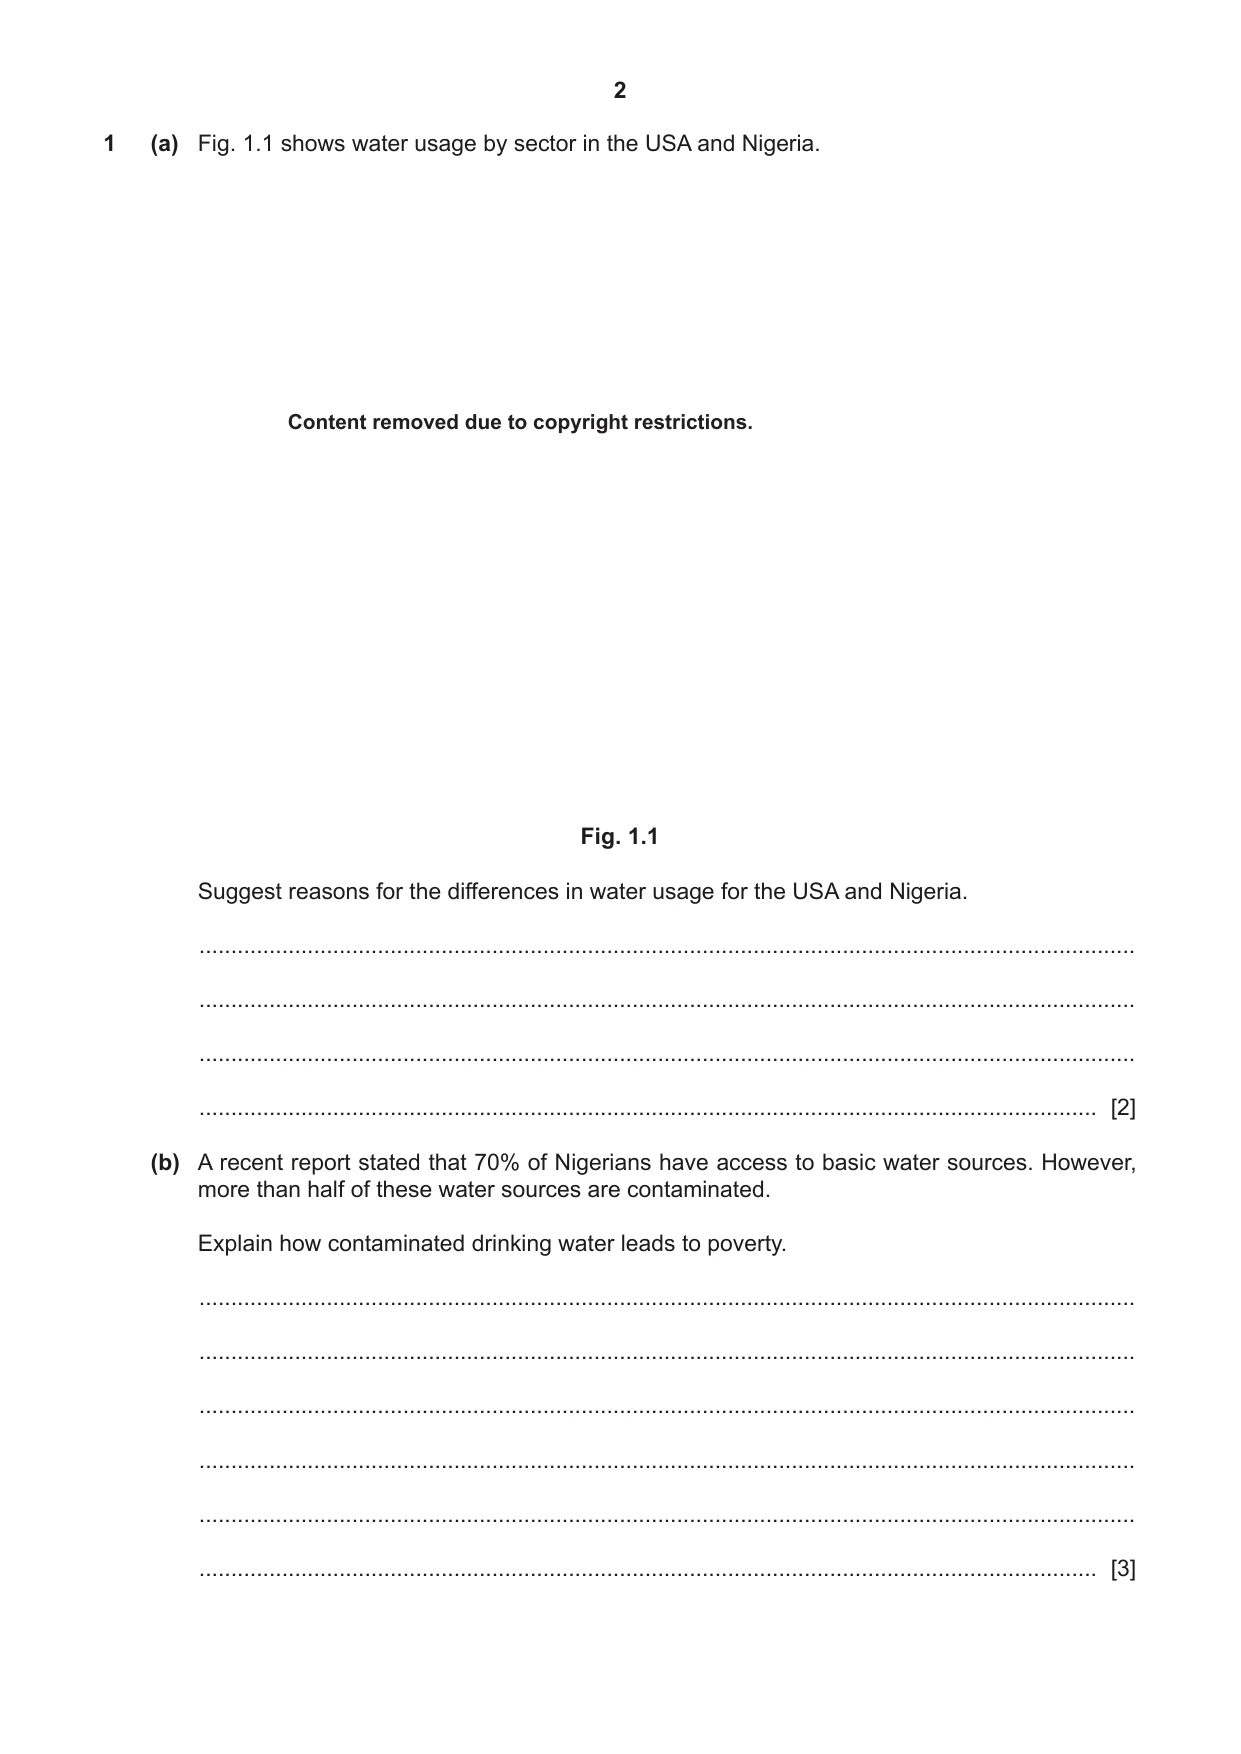
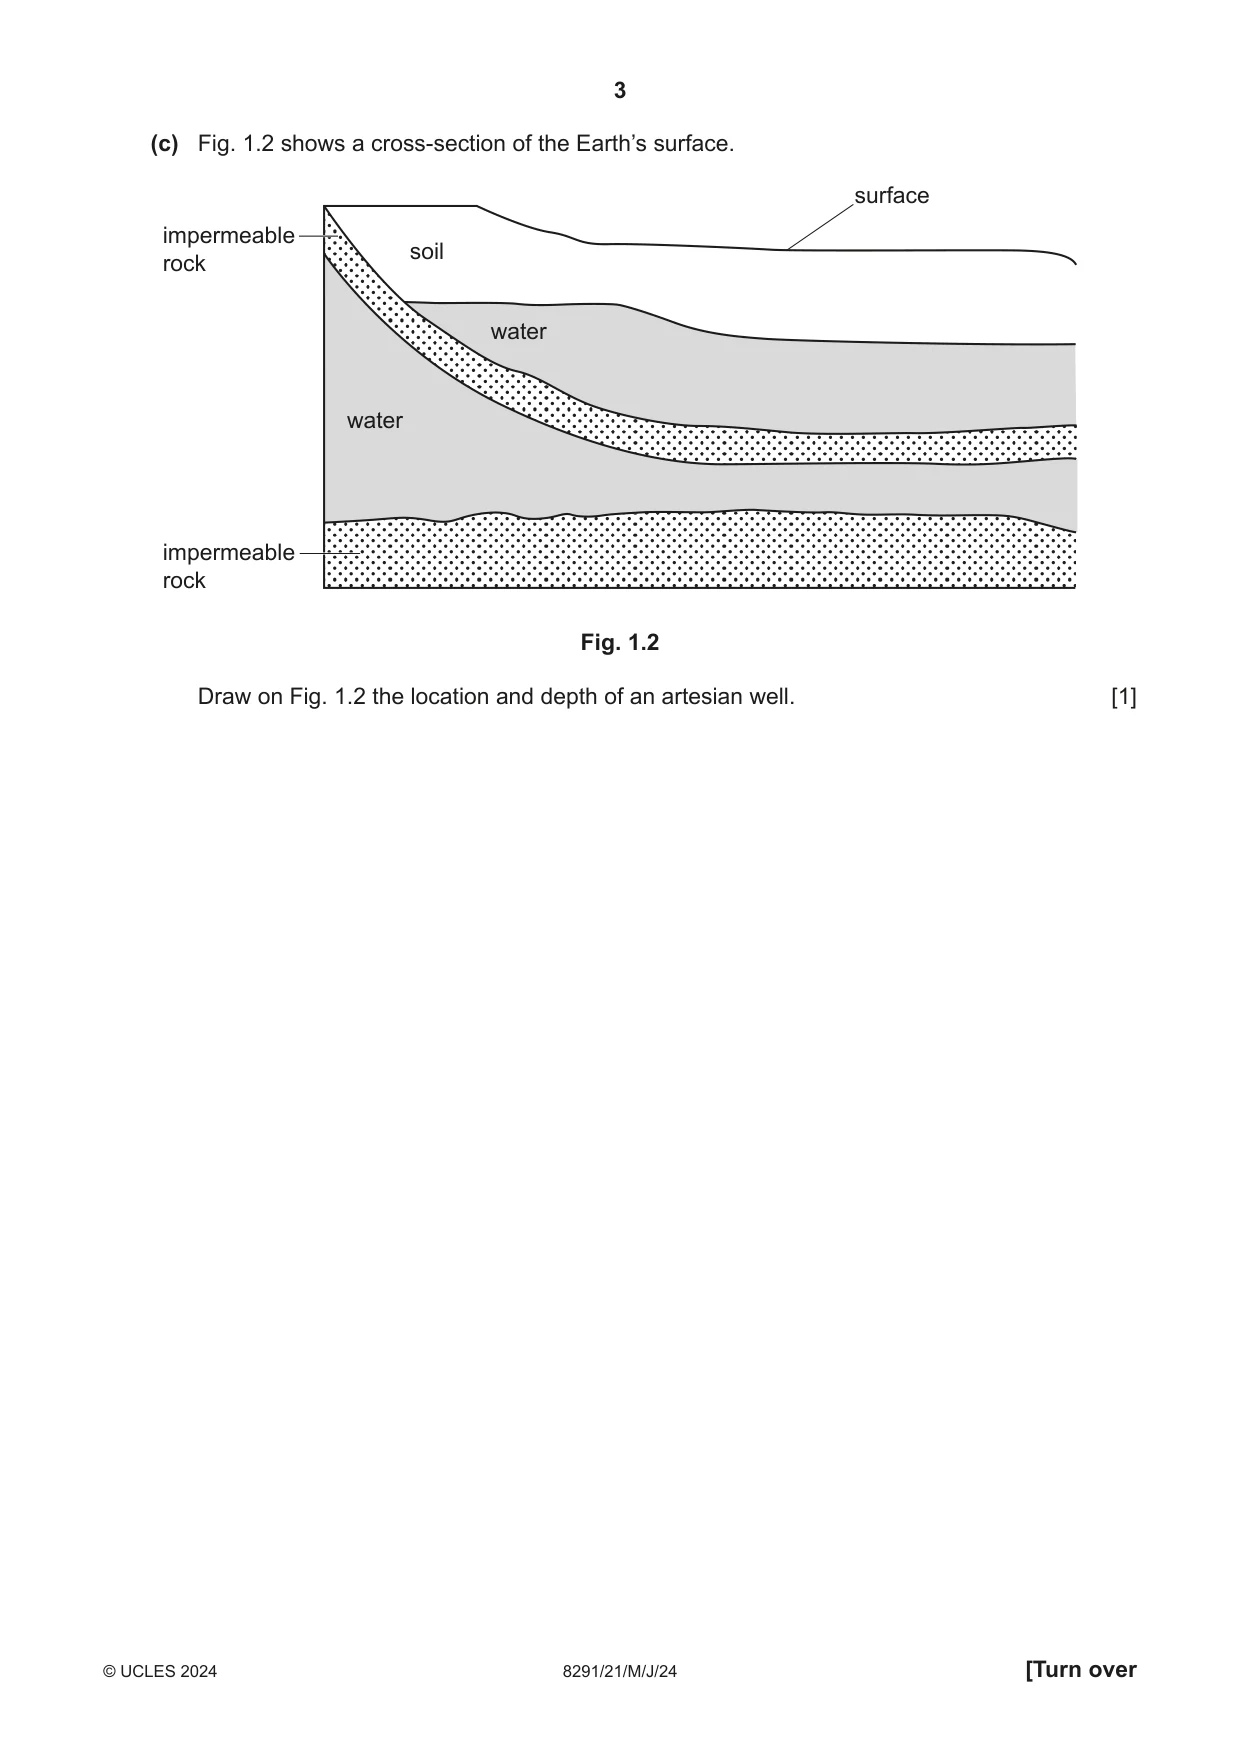
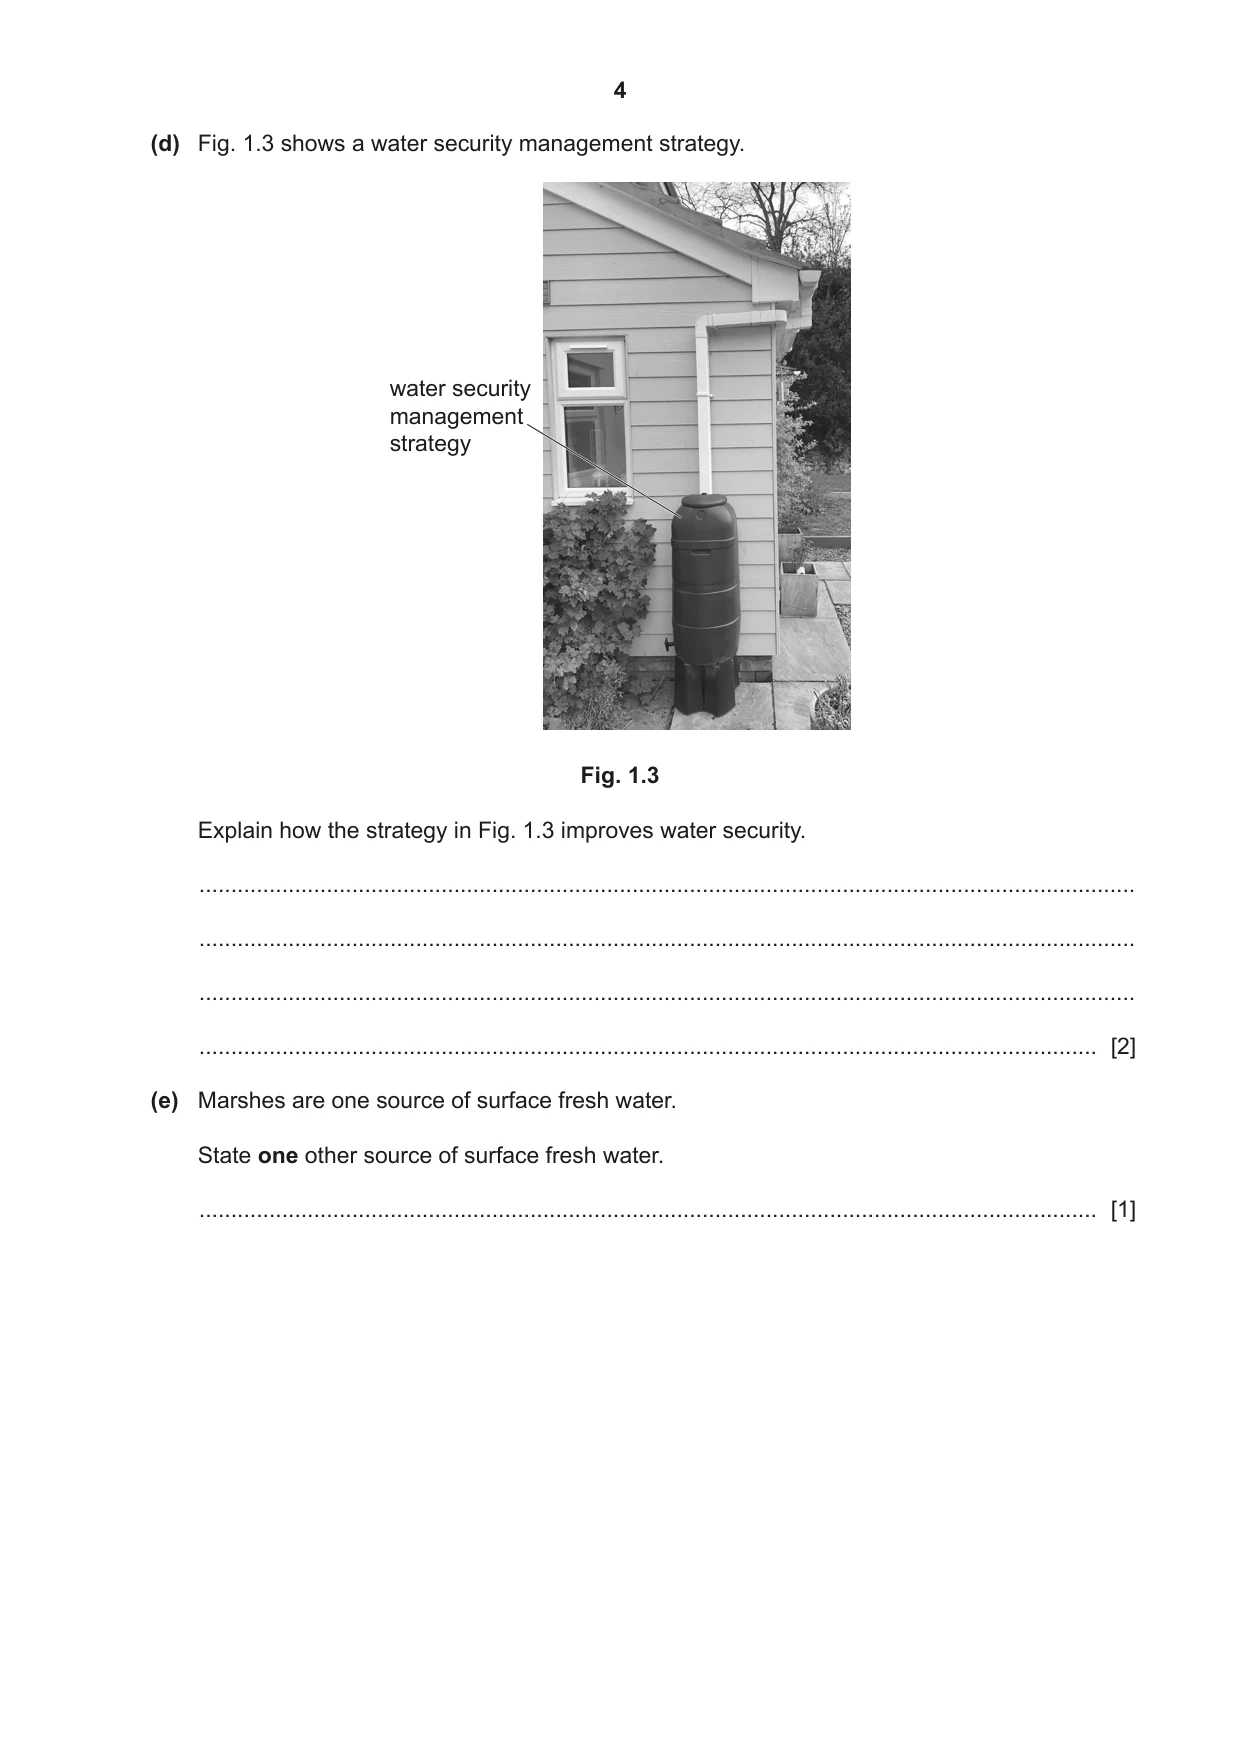
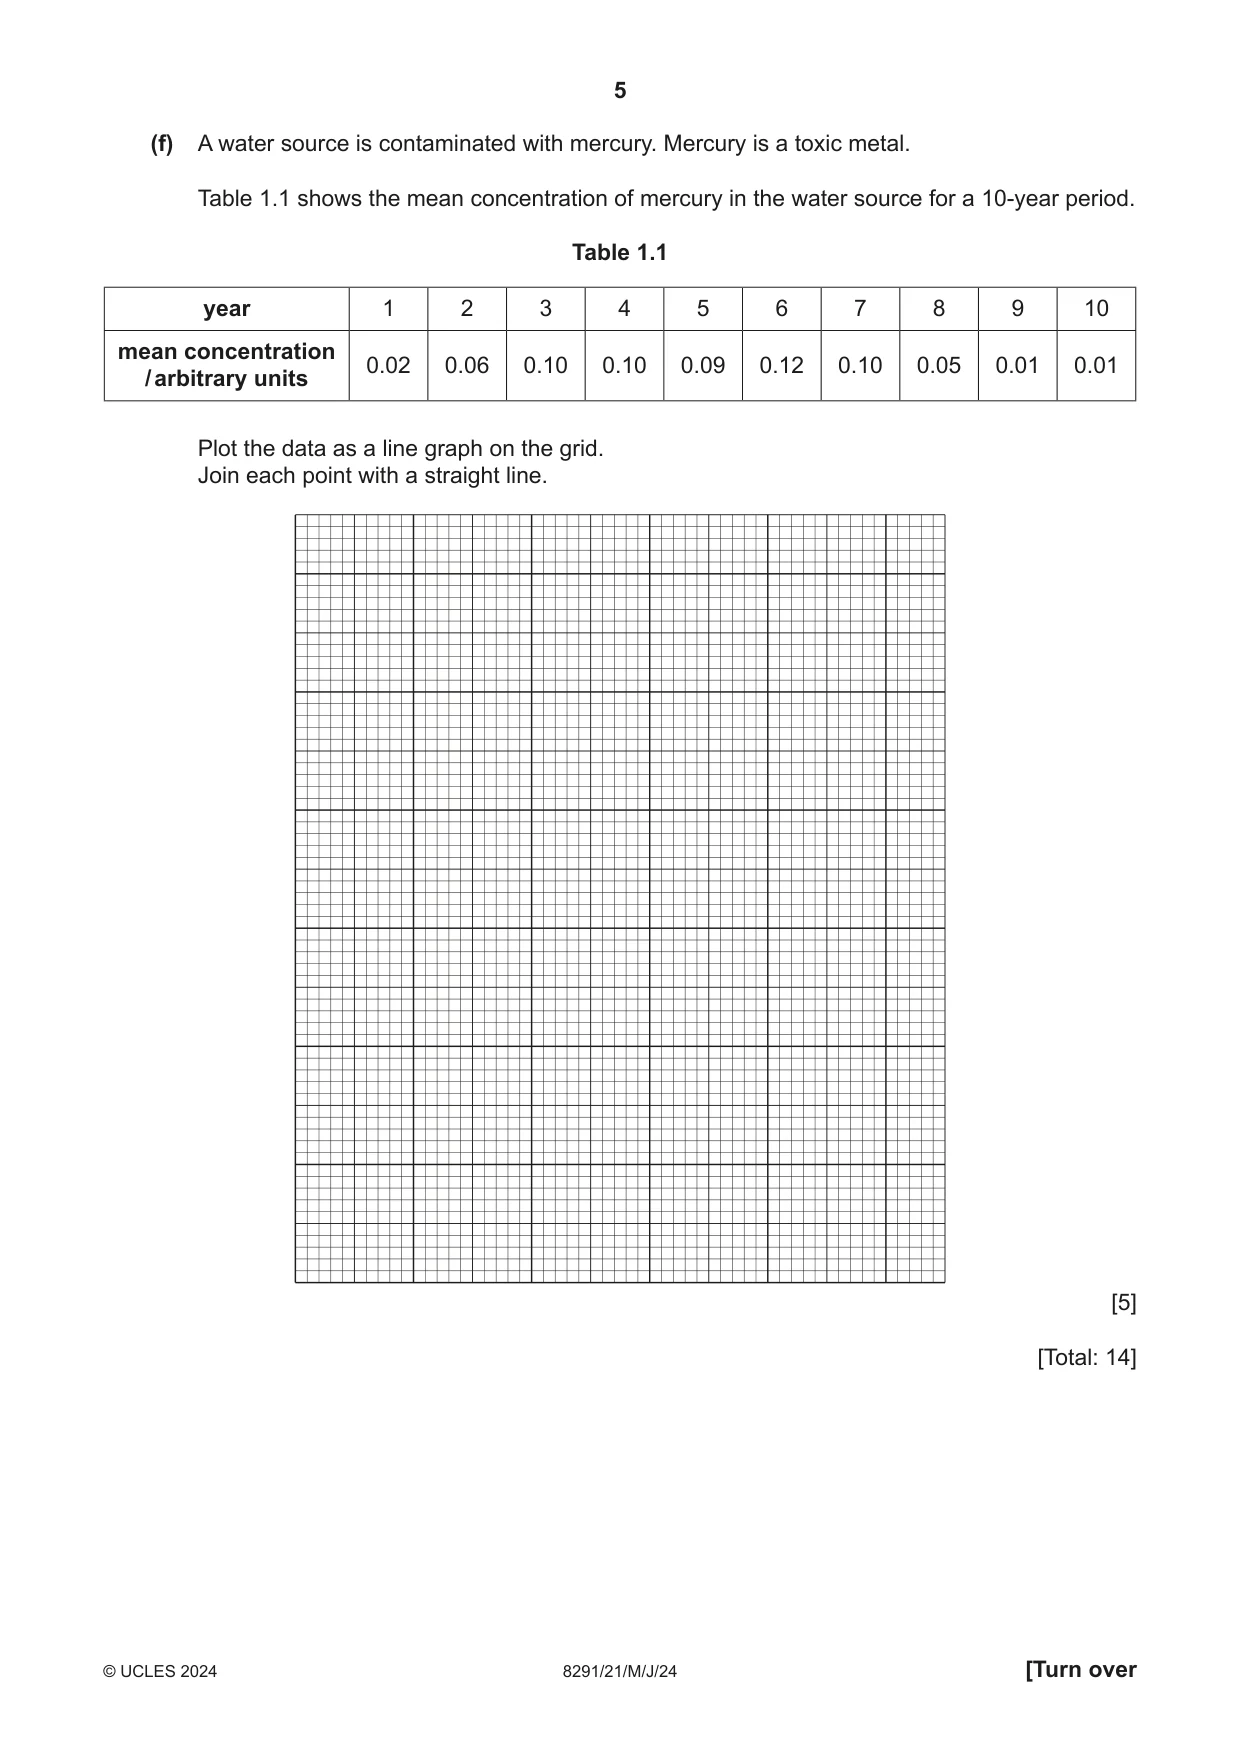
1 (a) Fig. 1.1 shows water usage by sector in the USA and Nigeria. Content removed due to copyright restrictions. Fig. 1.1 Suggest reasons for the differences in water usage for the USA and Nigeria. ................................................................................................................................................... ................................................................................................................................................... ................................................................................................................................................... ............................................................................................................................................. [2] (b) A recent report stated that 70% of Nigerians have access to basic water sources. However, more than half of these water sources are contaminated. Explain how contaminated drinking water leads to poverty. ................................................................................................................................................... ................................................................................................................................................... ................................................................................................................................................... ................................................................................................................................................... ................................................................................................................................................... ............................................................................................................................................. [3] (c) Fig. 1.2 shows a cross-section of the Earth’s surface. surface impermeable soil rock water water impermeable rock Fig. 1.2 Draw on Fig. 1.2 the location and depth of an artesian well. [1] (d) Fig. 1.3 shows a water security management strategy. water security management strategy Fig. 1.3 Explain how the strategy in Fig. 1.3 improves water security. ................................................................................................................................................... ................................................................................................................................................... ................................................................................................................................................... ............................................................................................................................................. [2] (e) Marshes are one source of surface fresh water. State one other source of surface fresh water. ............................................................................................................................................. [1] (f) A water source is contaminated with mercury. Mercury is a toxic metal. Table 1.1 shows the mean concentration of mercury in the water source for a 10-year period. Table 1.1 year 1 2 3 4 5 6 7 8 9 10 mean concentration 0.02 0.06 0.10 0.10 0.09 0.12 0.10 0.05 0.01 0.01 / arbitrary units Plot the data as a line graph on the grid. Join each point with a straight line. [5] [Total: 14]
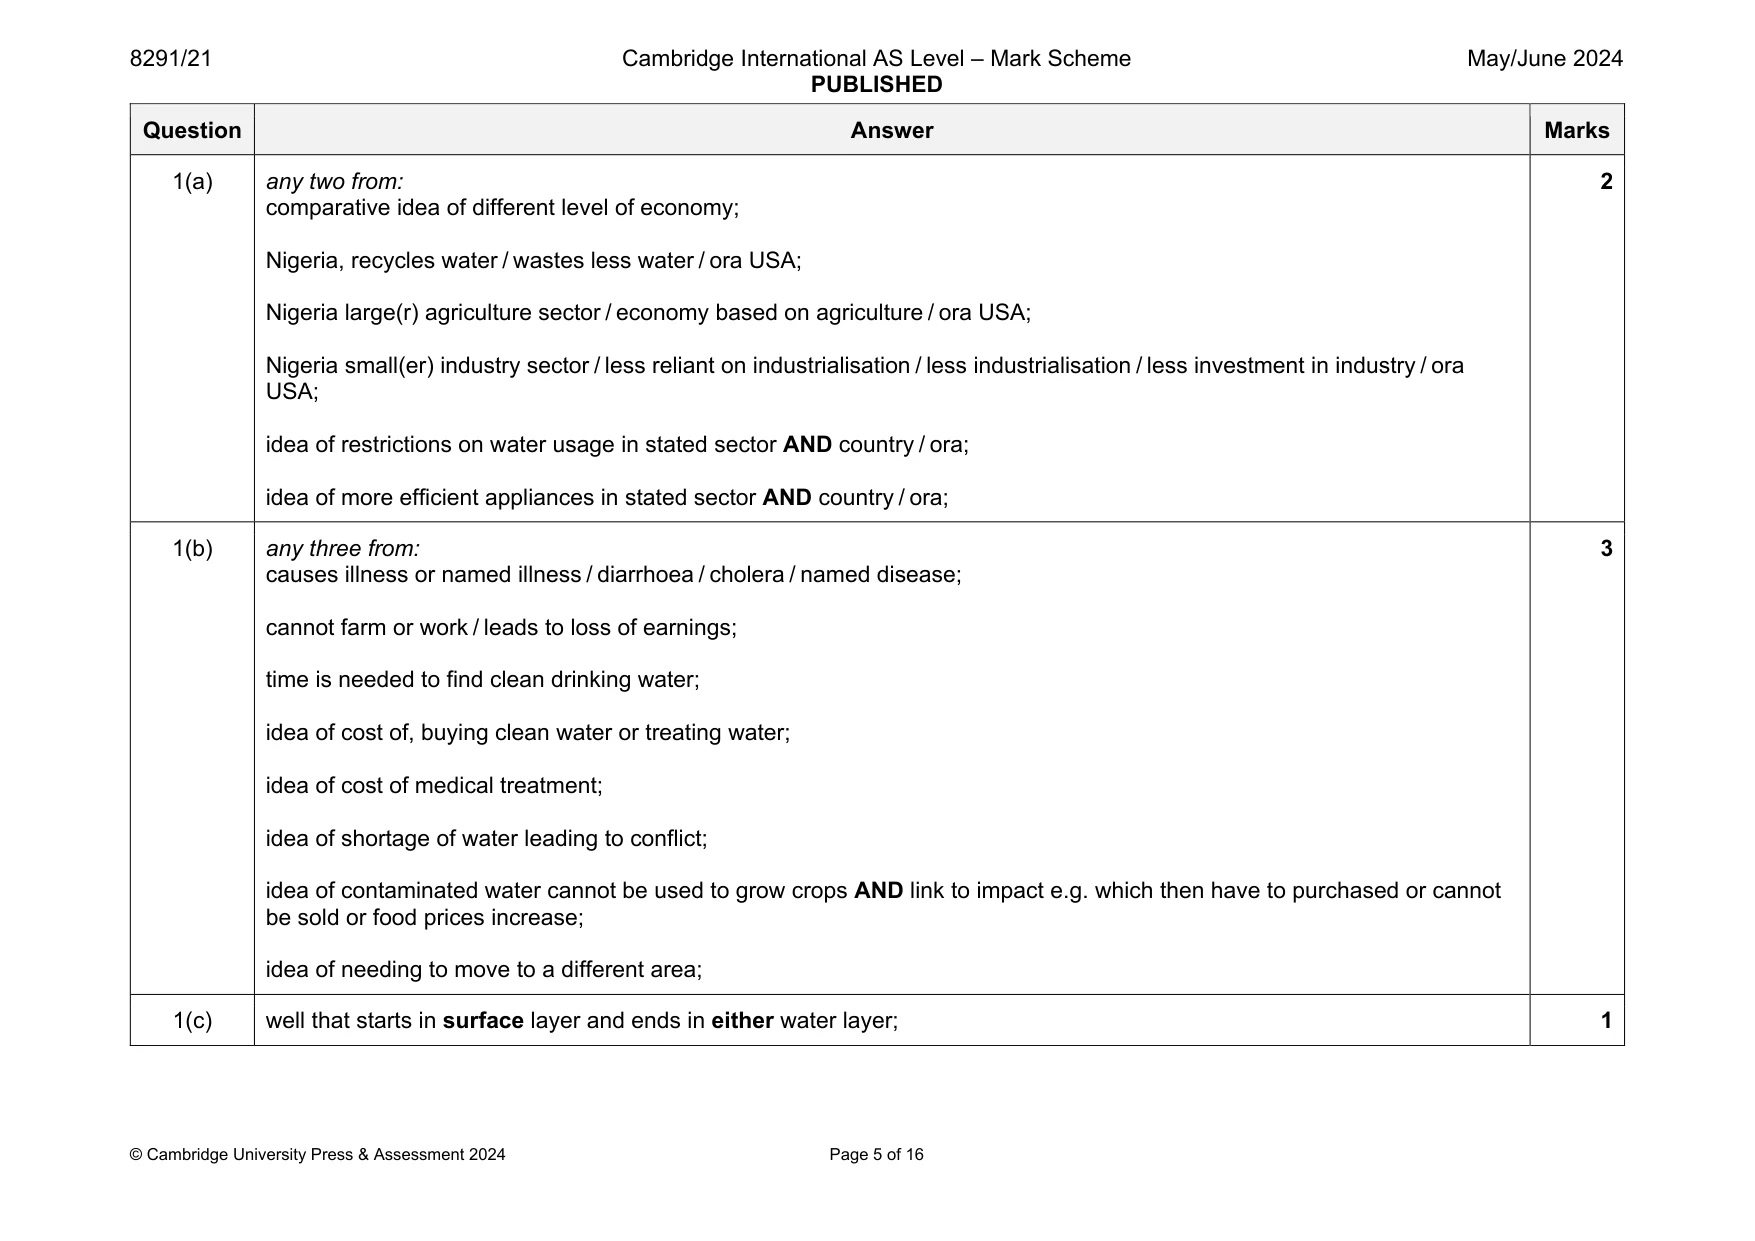
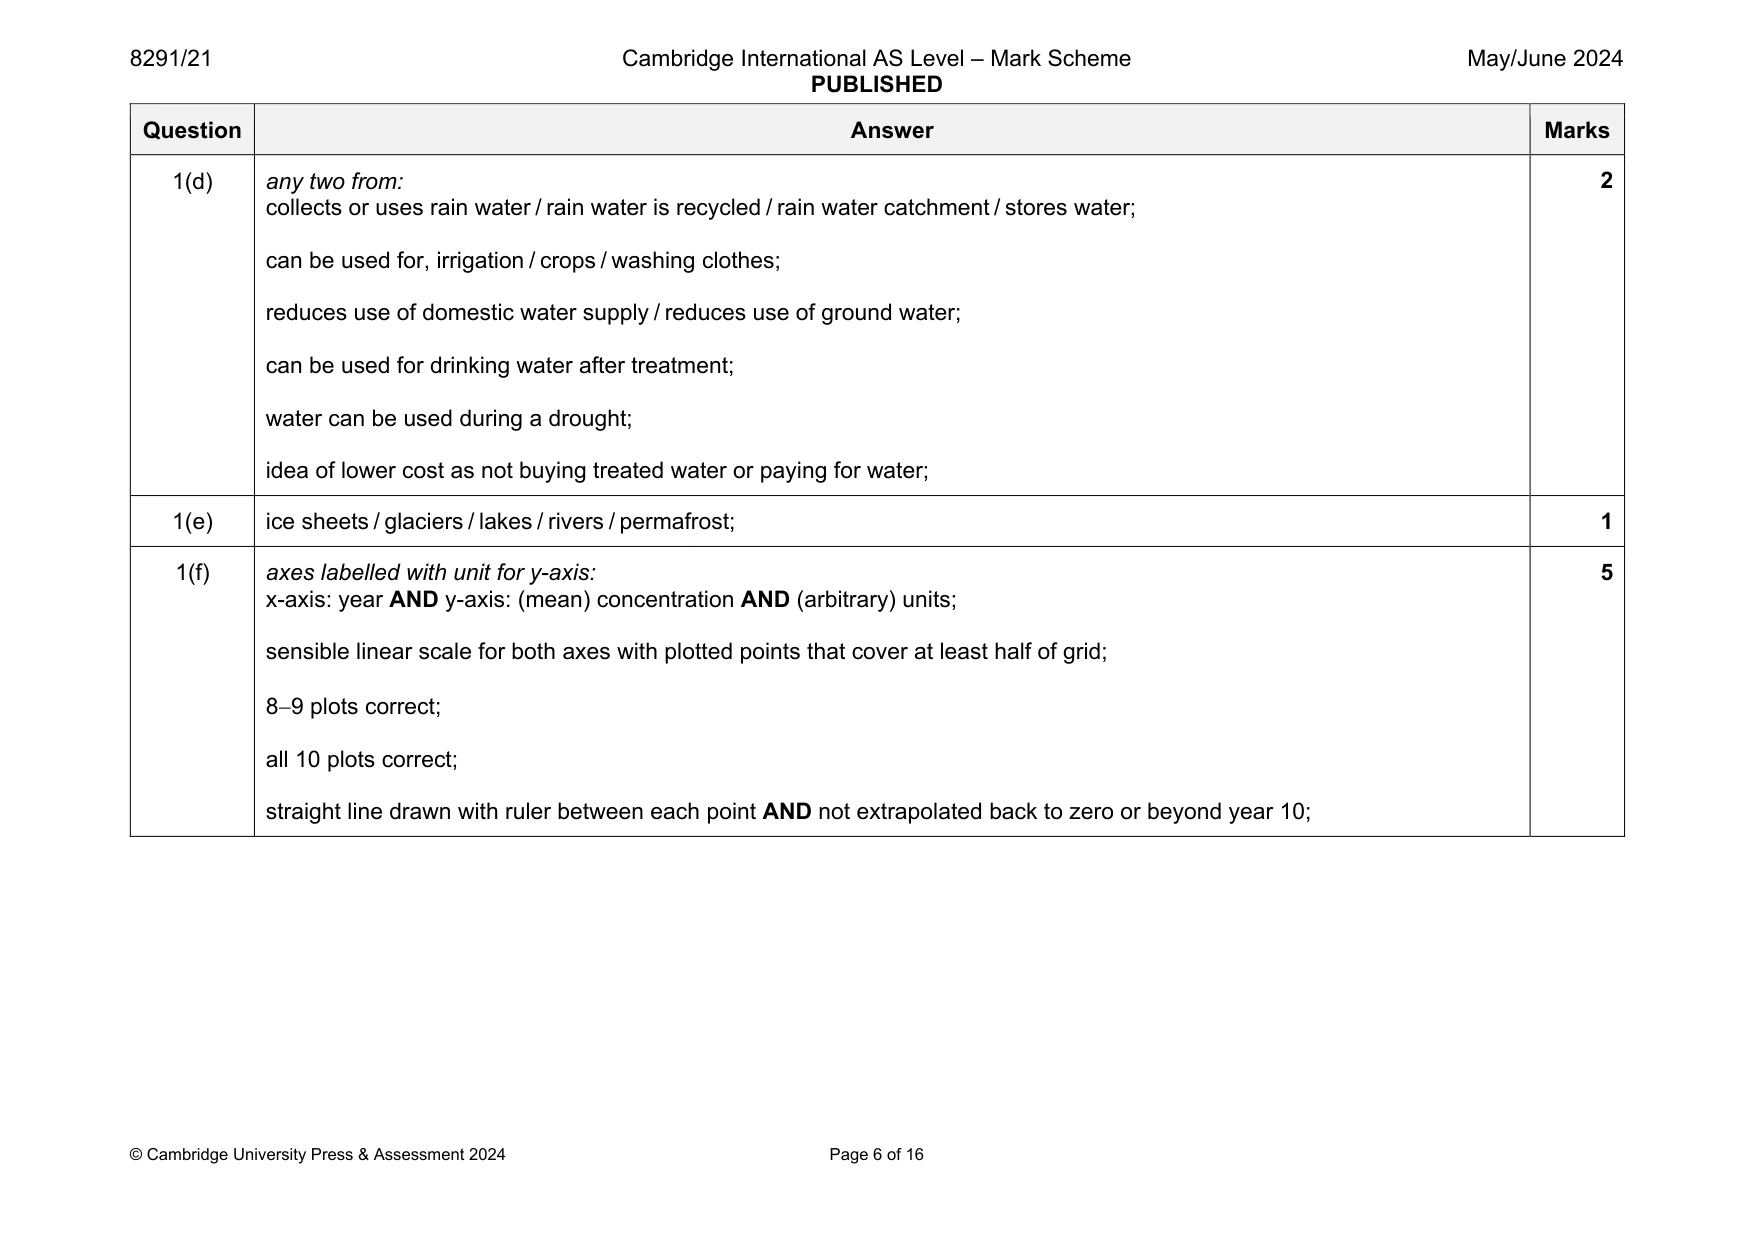
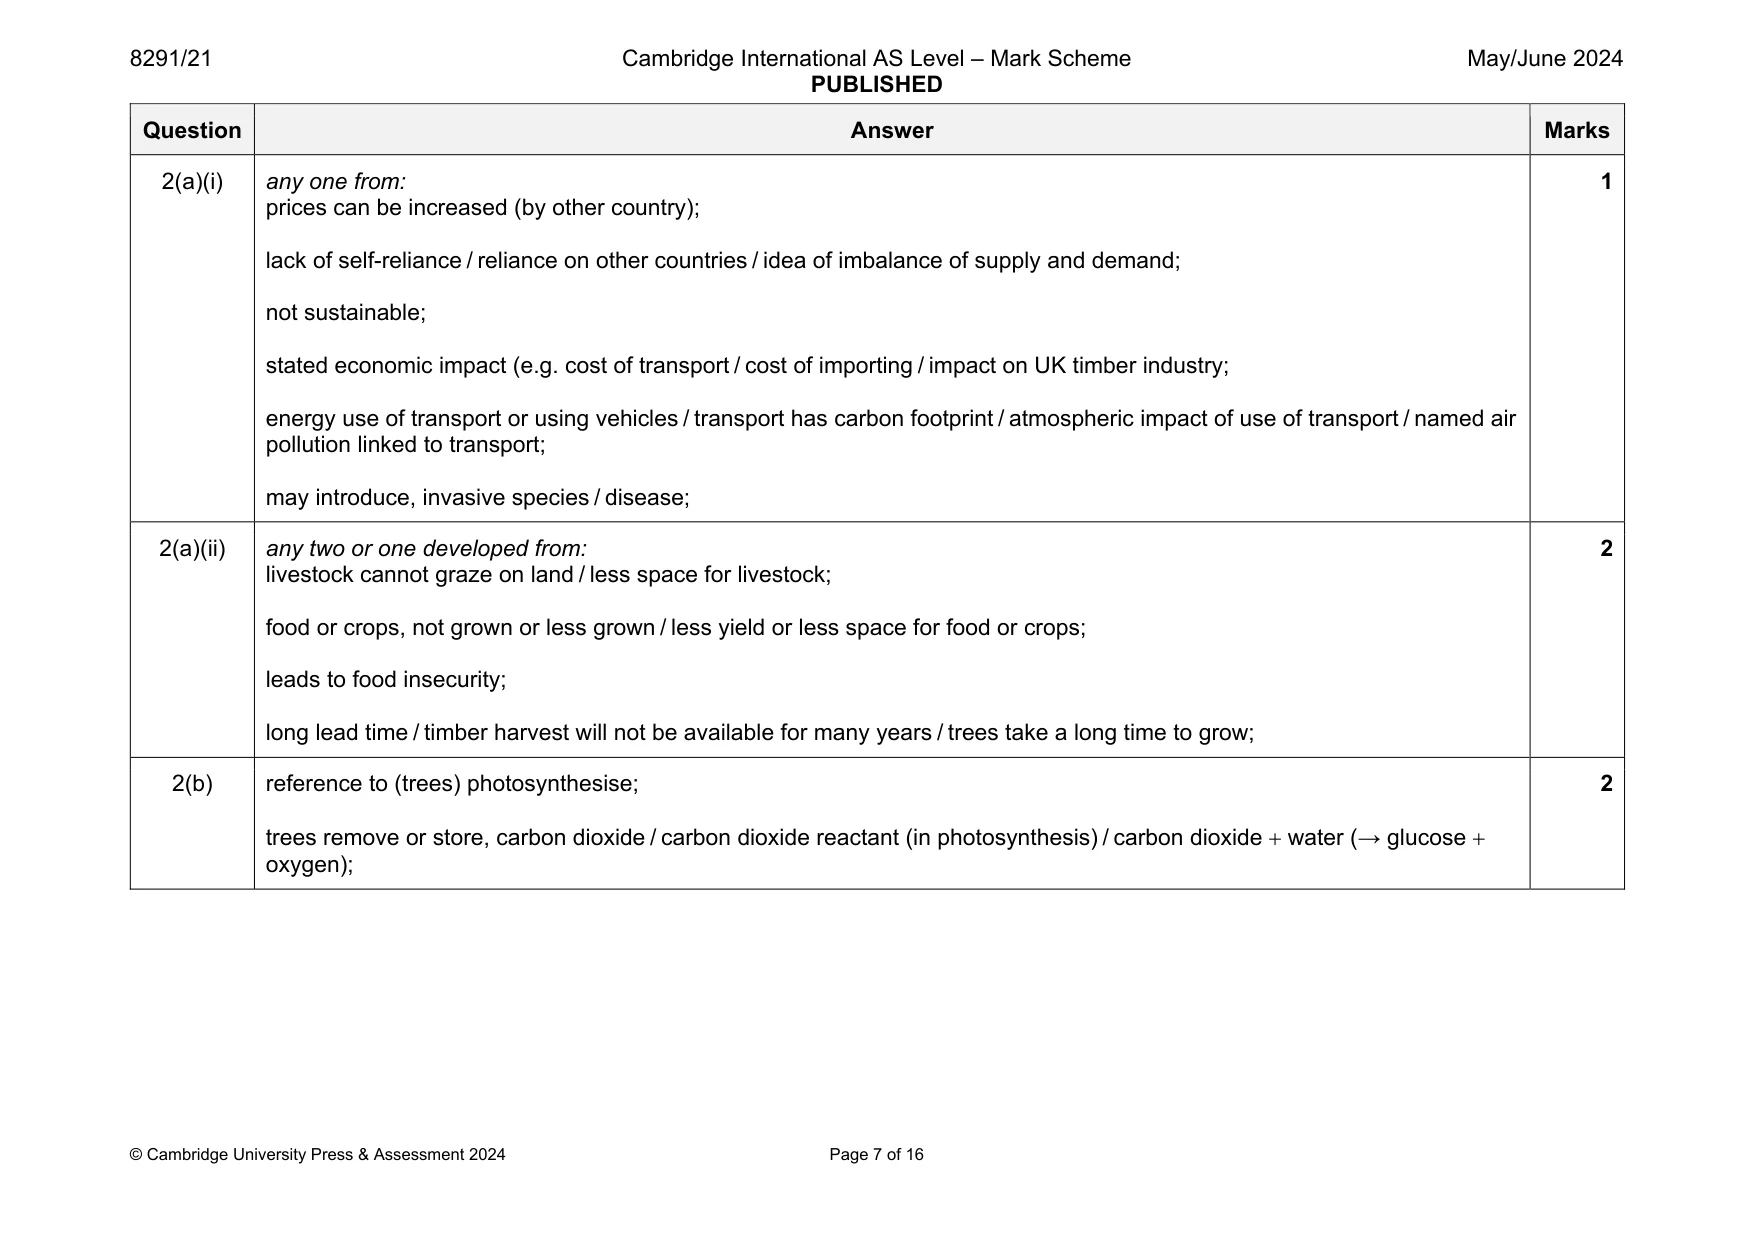
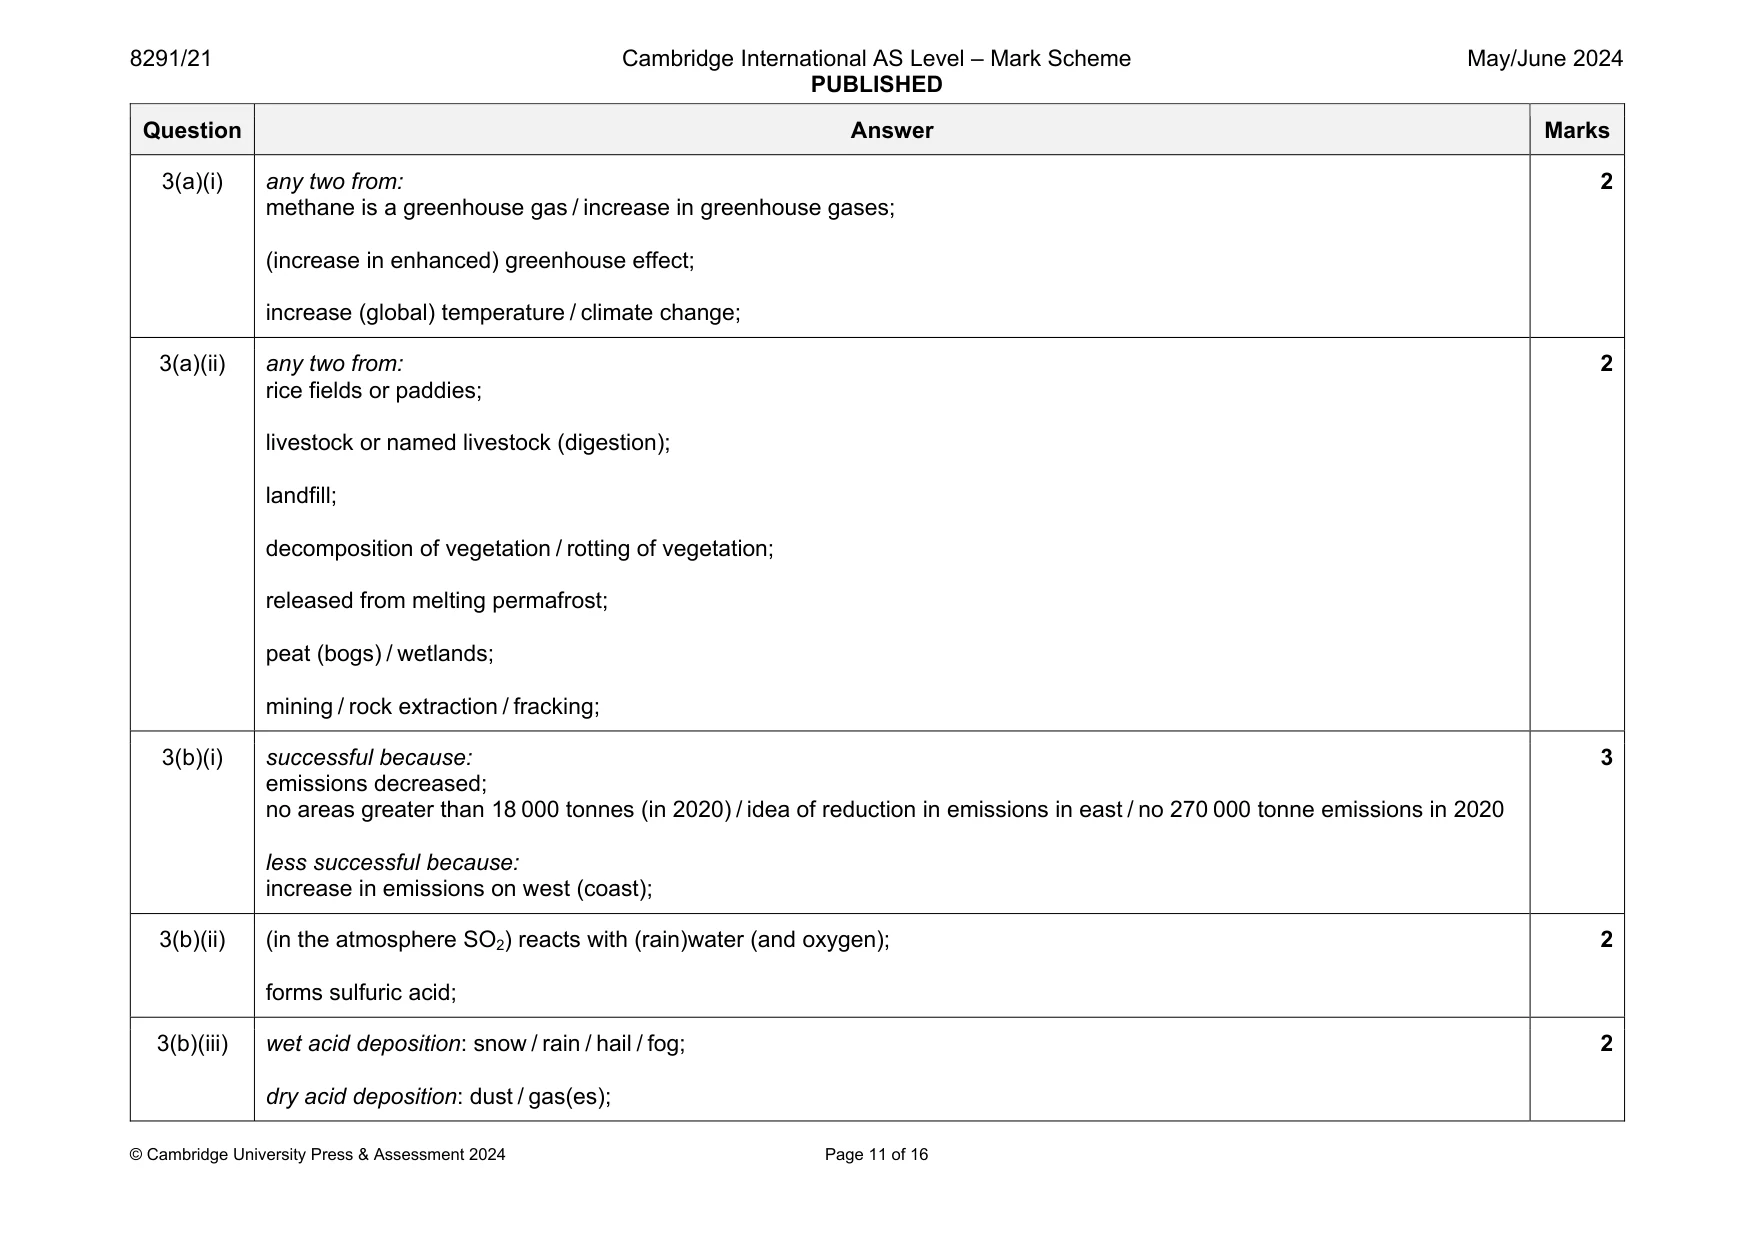
Mark scheme: 1(a) any two from: comparative idea of different level of economy; Nigeria, recycles water / wastes less water / ora USA; Nigeria large(r) agriculture sector / economy based on agriculture / ora USA; Nigeria small(er) industry sector / less reliant on industrialisation / less industrialisation / less investment in industry / ora USA; idea of restrictions on water usage in stated sector AND country / ora; idea of more efficient appliances in stated sector AND country / ora; 2 1(b) any three from: causes illness or named illness / diarrhoea / cholera / named disease; cannot farm or work / leads to loss of earnings; time is needed to find clean drinking water; idea of cost of, buying clean water or treating water; idea of cost of medical treatment; idea of shortage of water leading to conflict; idea of contaminated water cannot be used to grow crops AND link to impact e.g. which then have to purchased or cannot be sold or food prices increase; idea of needing to move to a different area; 3 1(c) well that starts in surface layer and ends in either water layer; 1 Question Answer Marks 1(d) any two from: collects or uses rain water / rain water is recycled / rain water catchment / stores water; can be used for, irrigation / crops / washing clothes; reduces use of domestic water supply / reduces use of ground water; can be used for drinking water after treatment; water can be used during a drought; idea of lower cost as not buying treated water or paying for water; 2 1(e) ice sheets / glaciers / lakes / rivers / permafrost; 1 1(f) axes labelled with unit for y-axis: x-axis: year AND y-axis: (mean) concentration AND (arbitrary) units; sensible linear scale for both axes with plotted points that cover at least half of grid; 89 plots correct; all 10 plots correct; straight line drawn with ruler between each point AND not extrapolated back to zero or beyond year 10; 5
More questions on Data collection techniques and data analysis
Q2 · In 2022, 80% of the timber used in the UK was imported
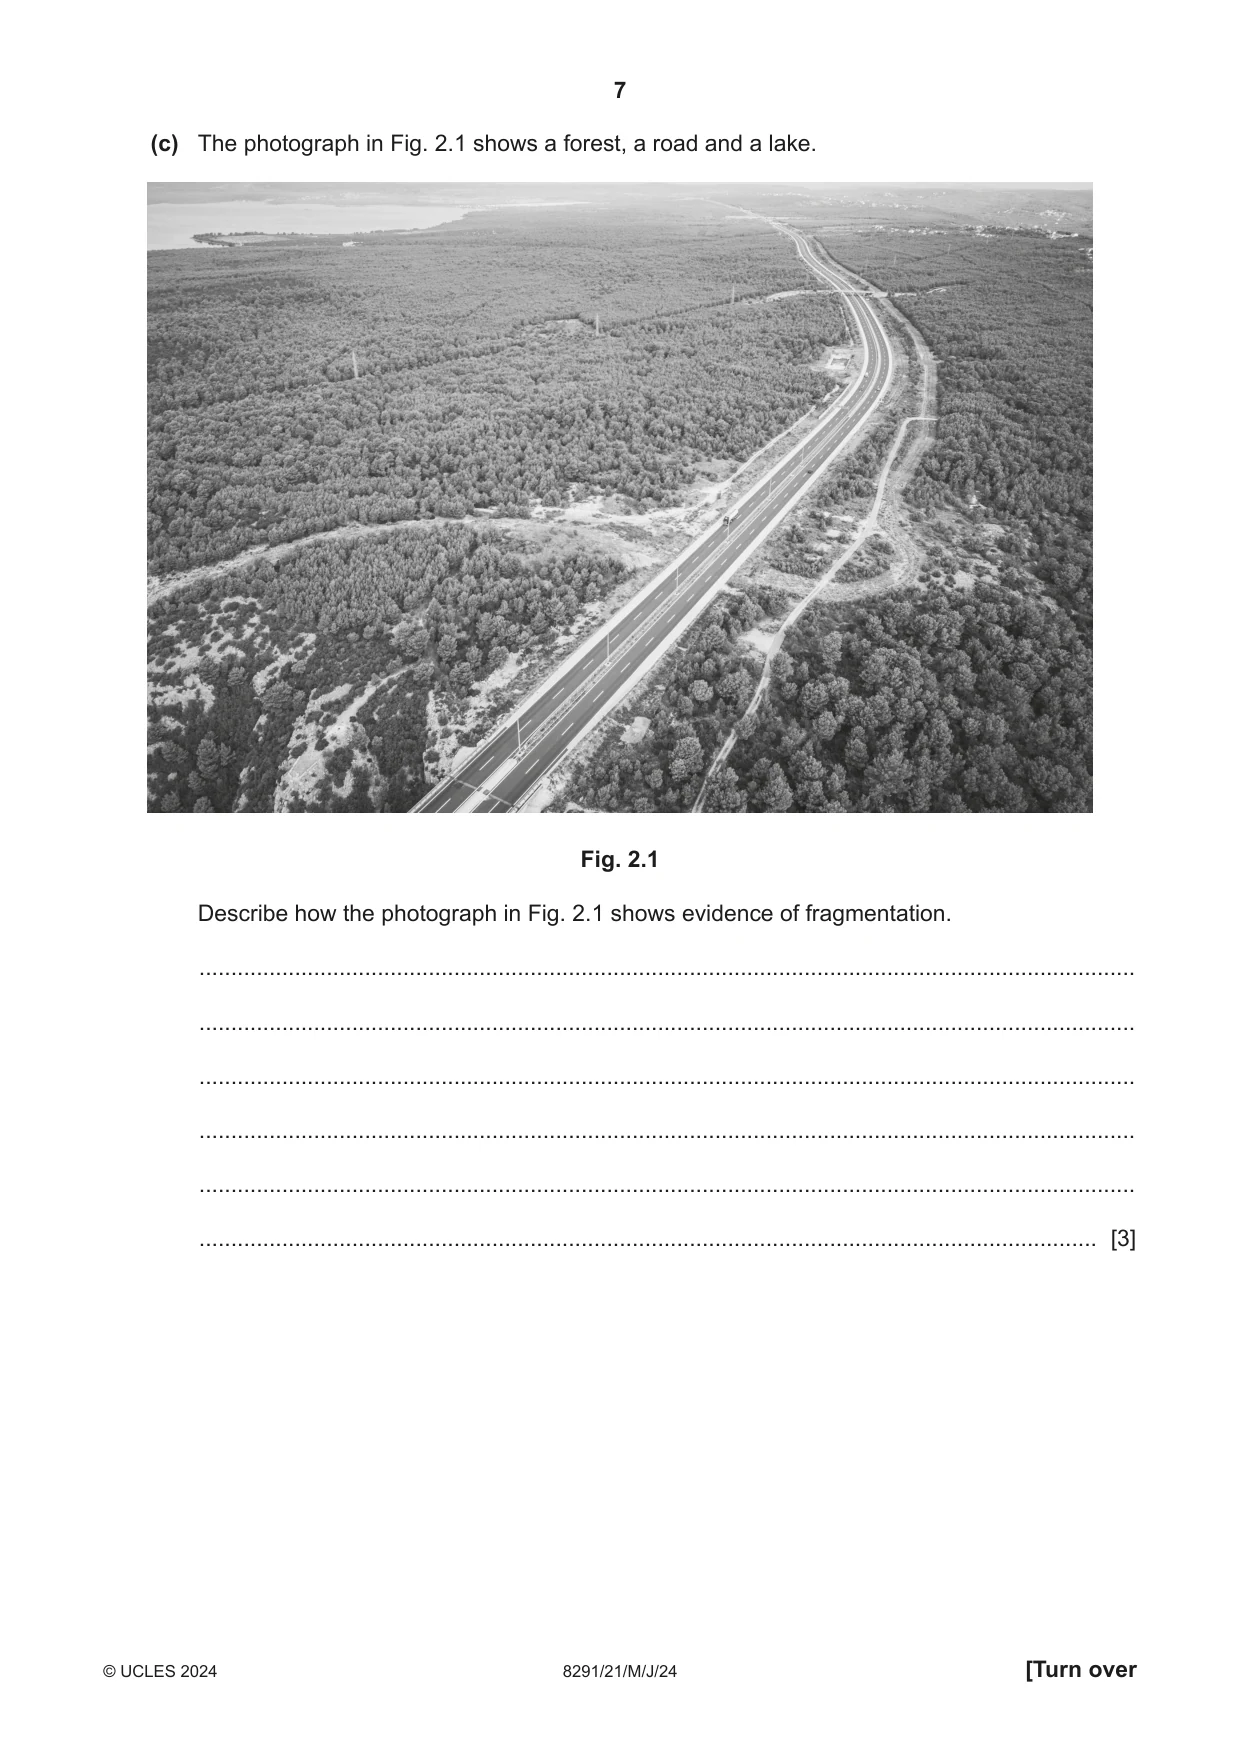
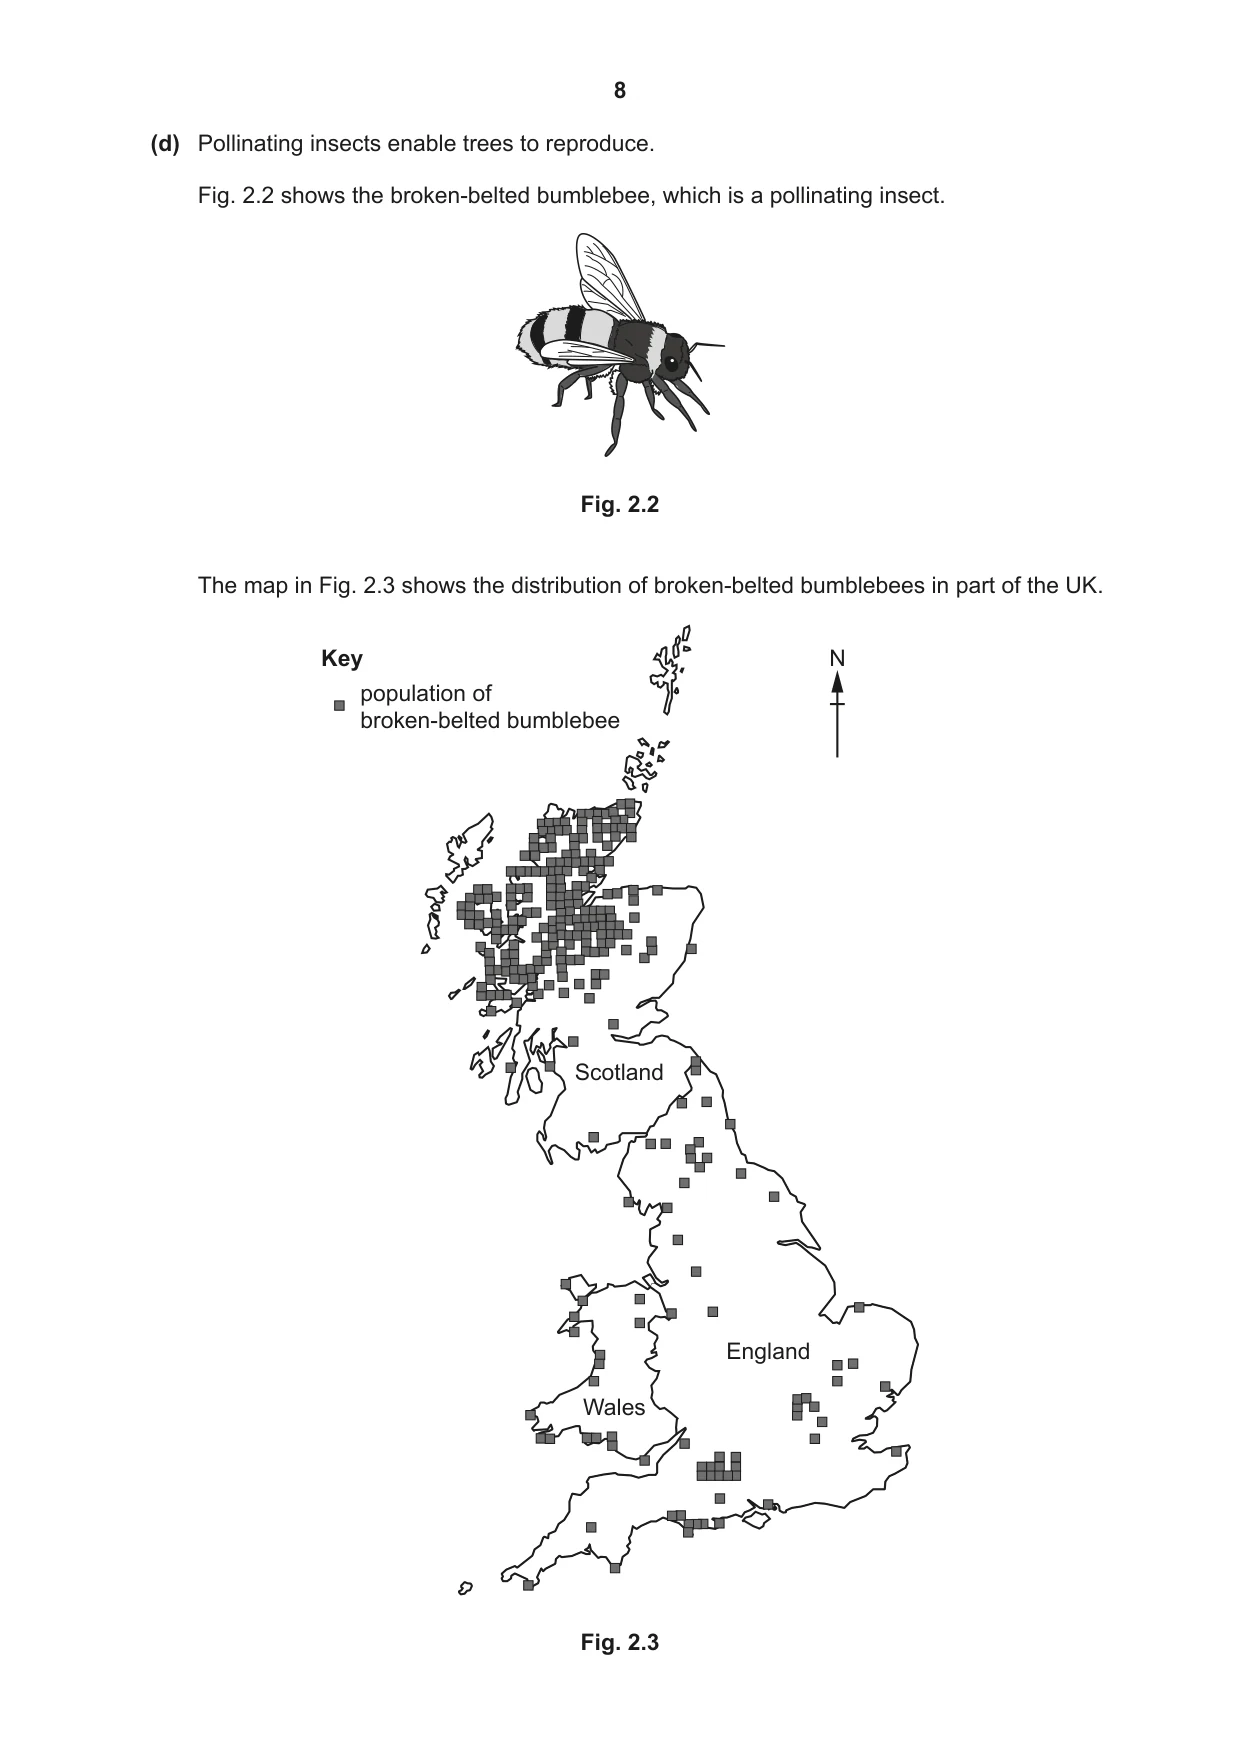
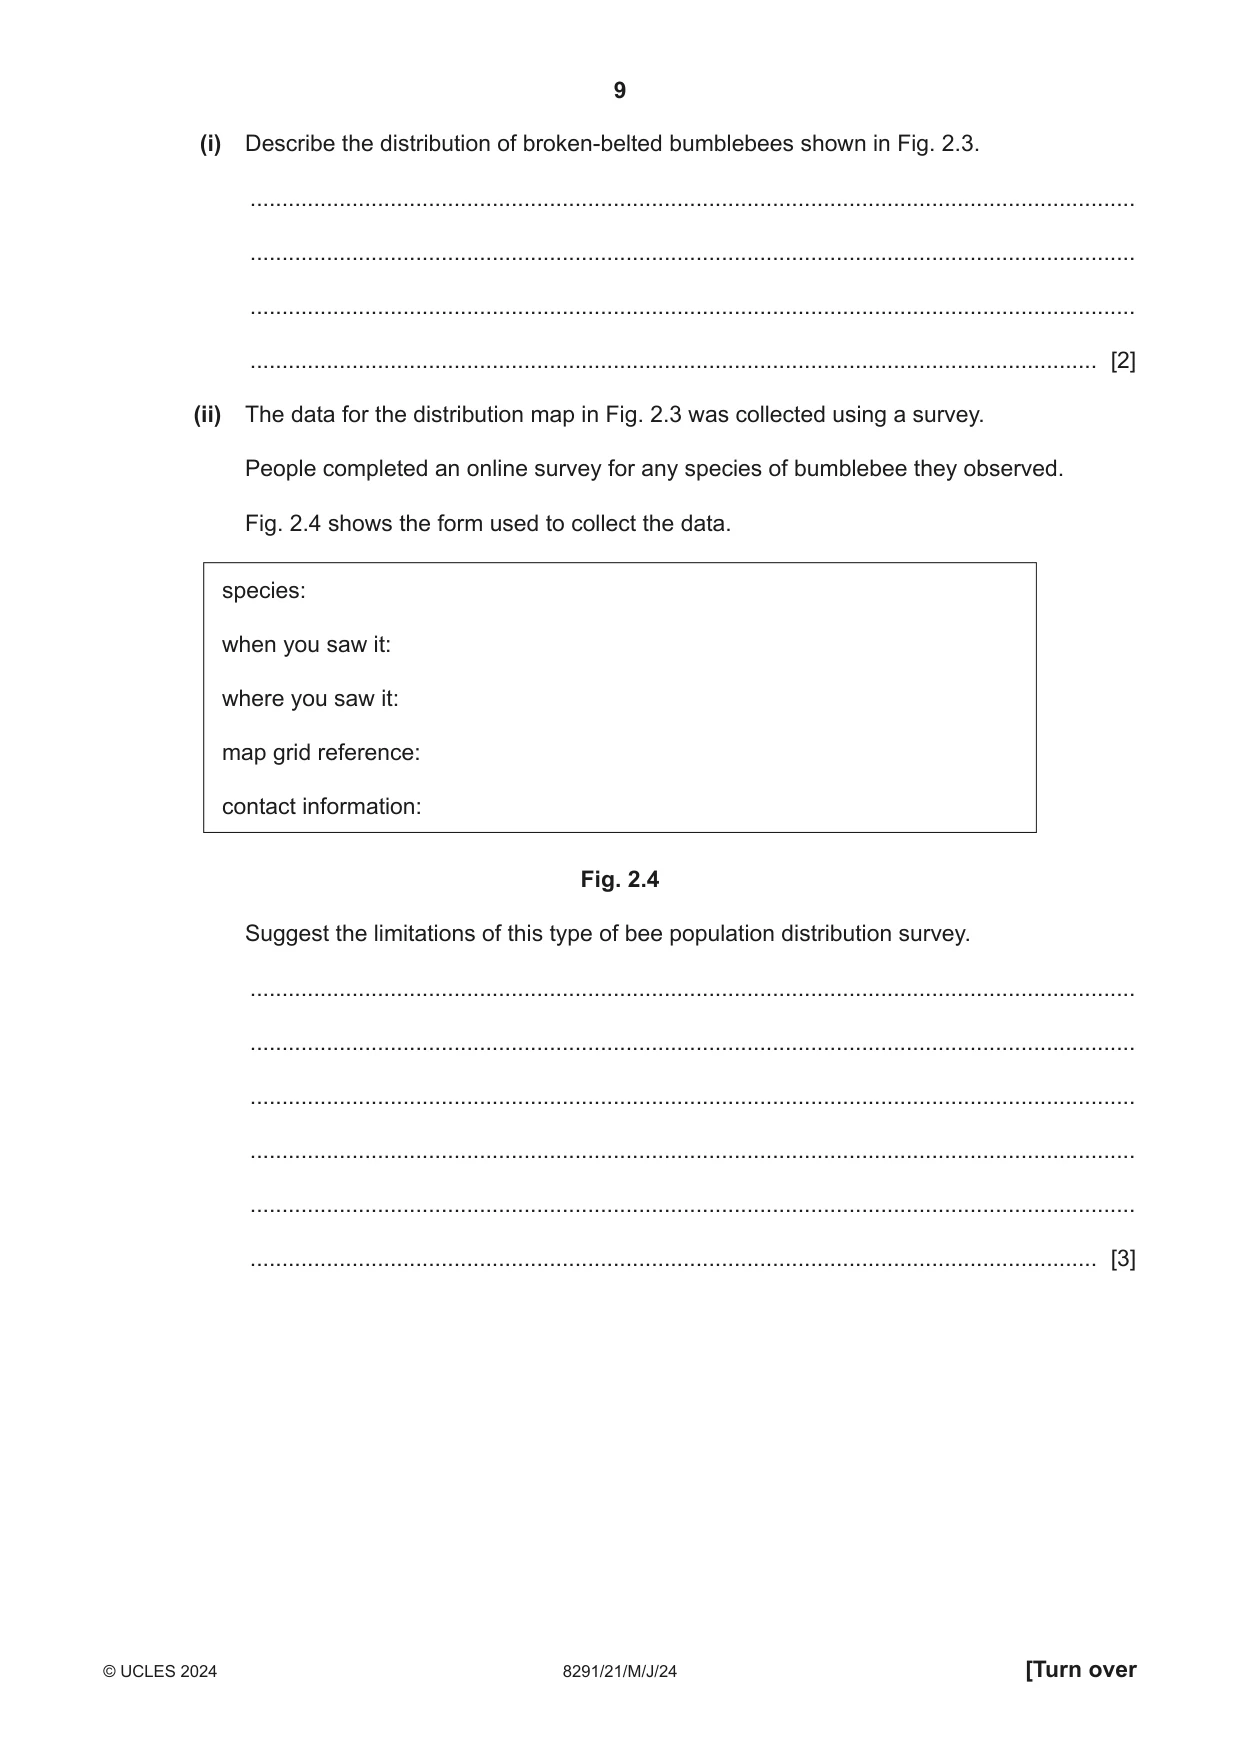
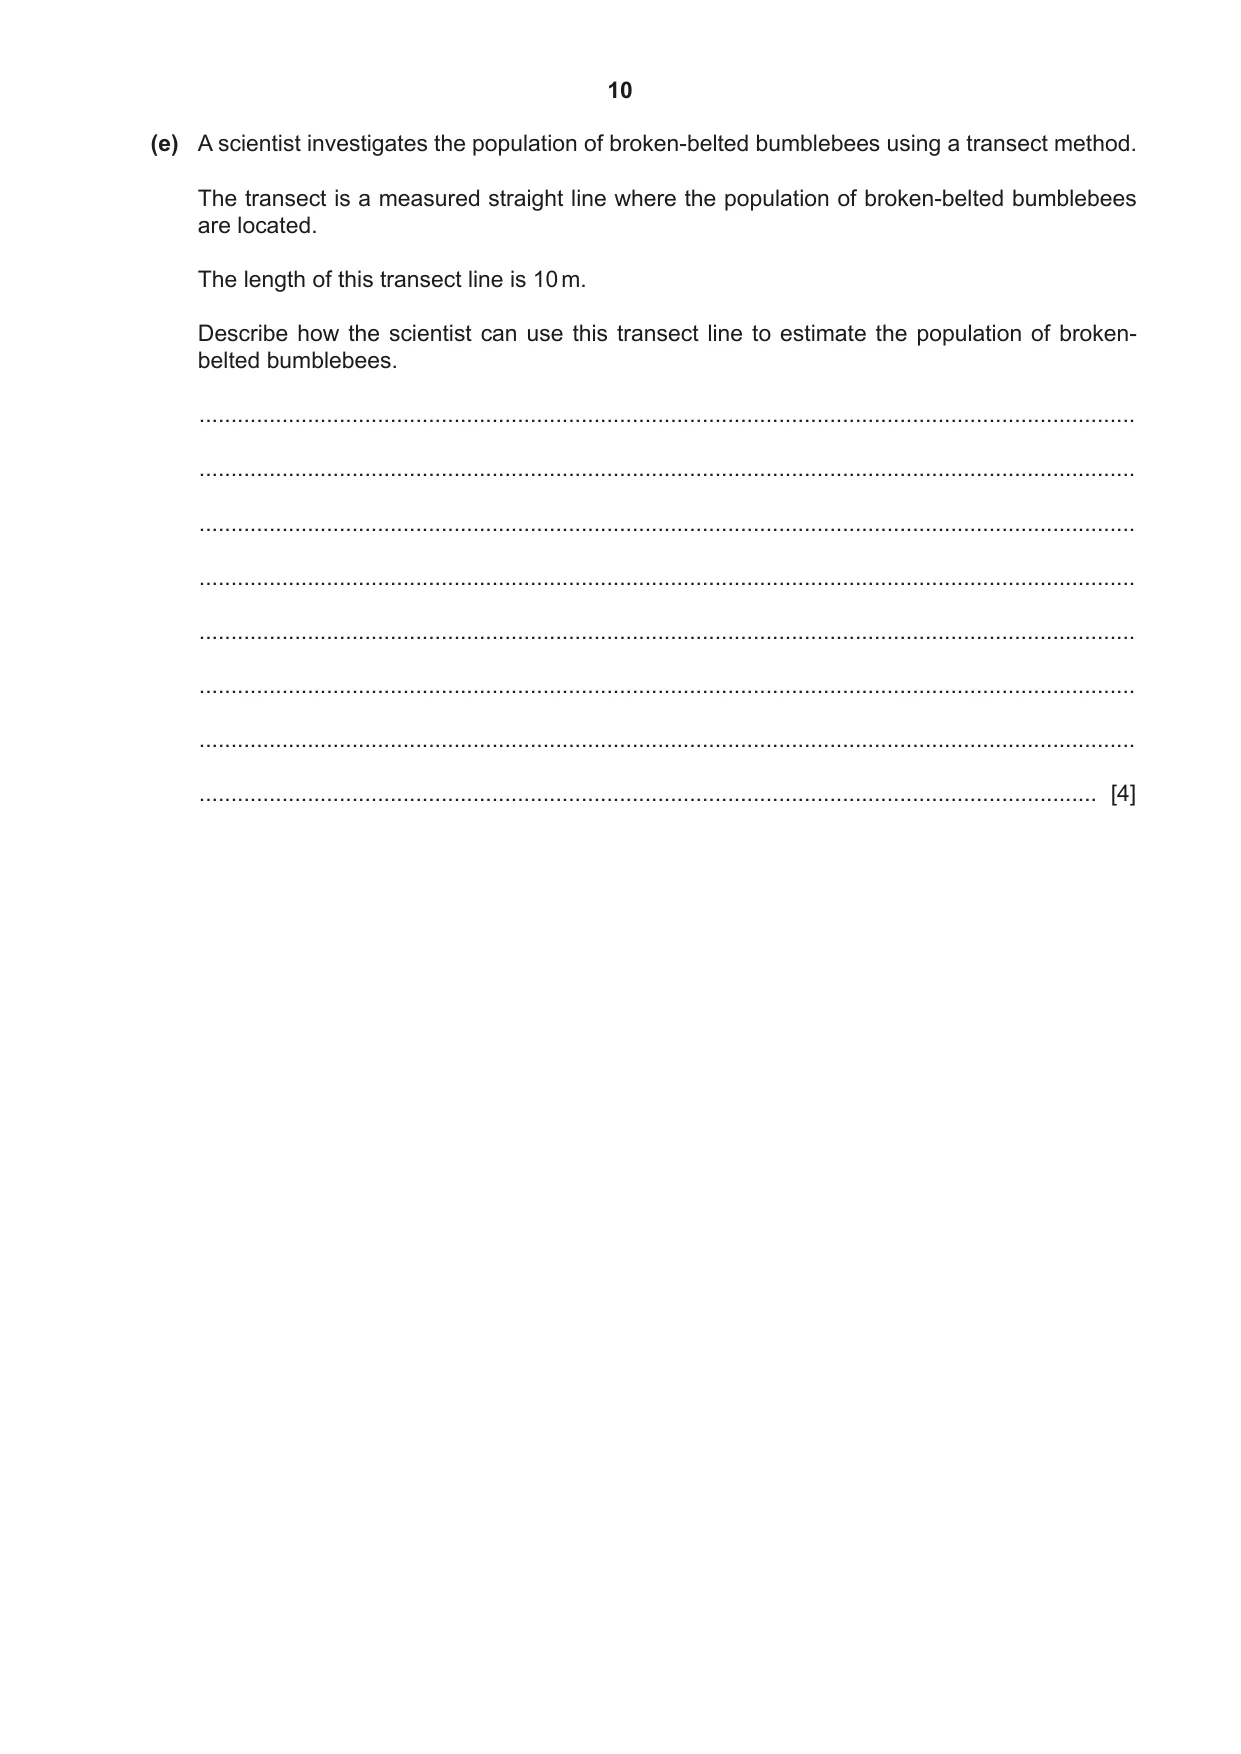
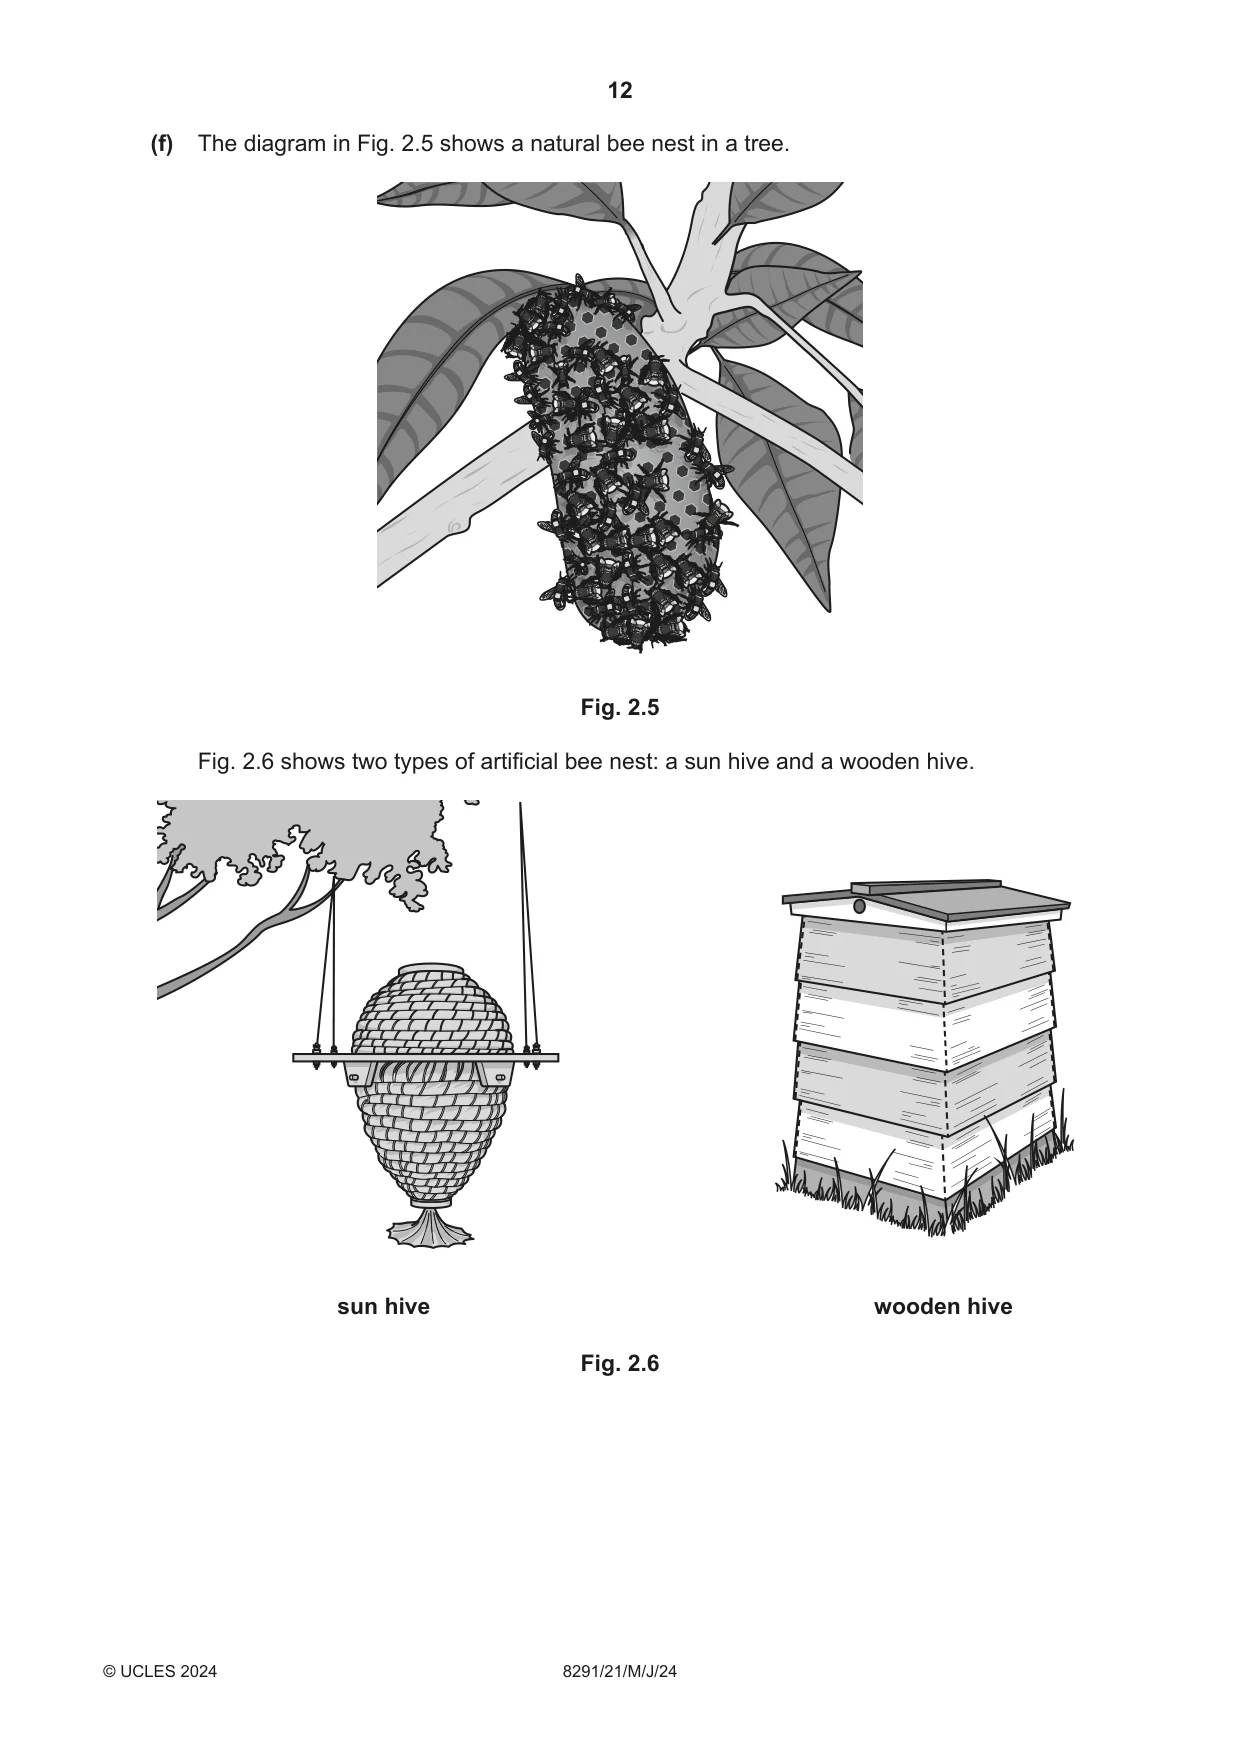
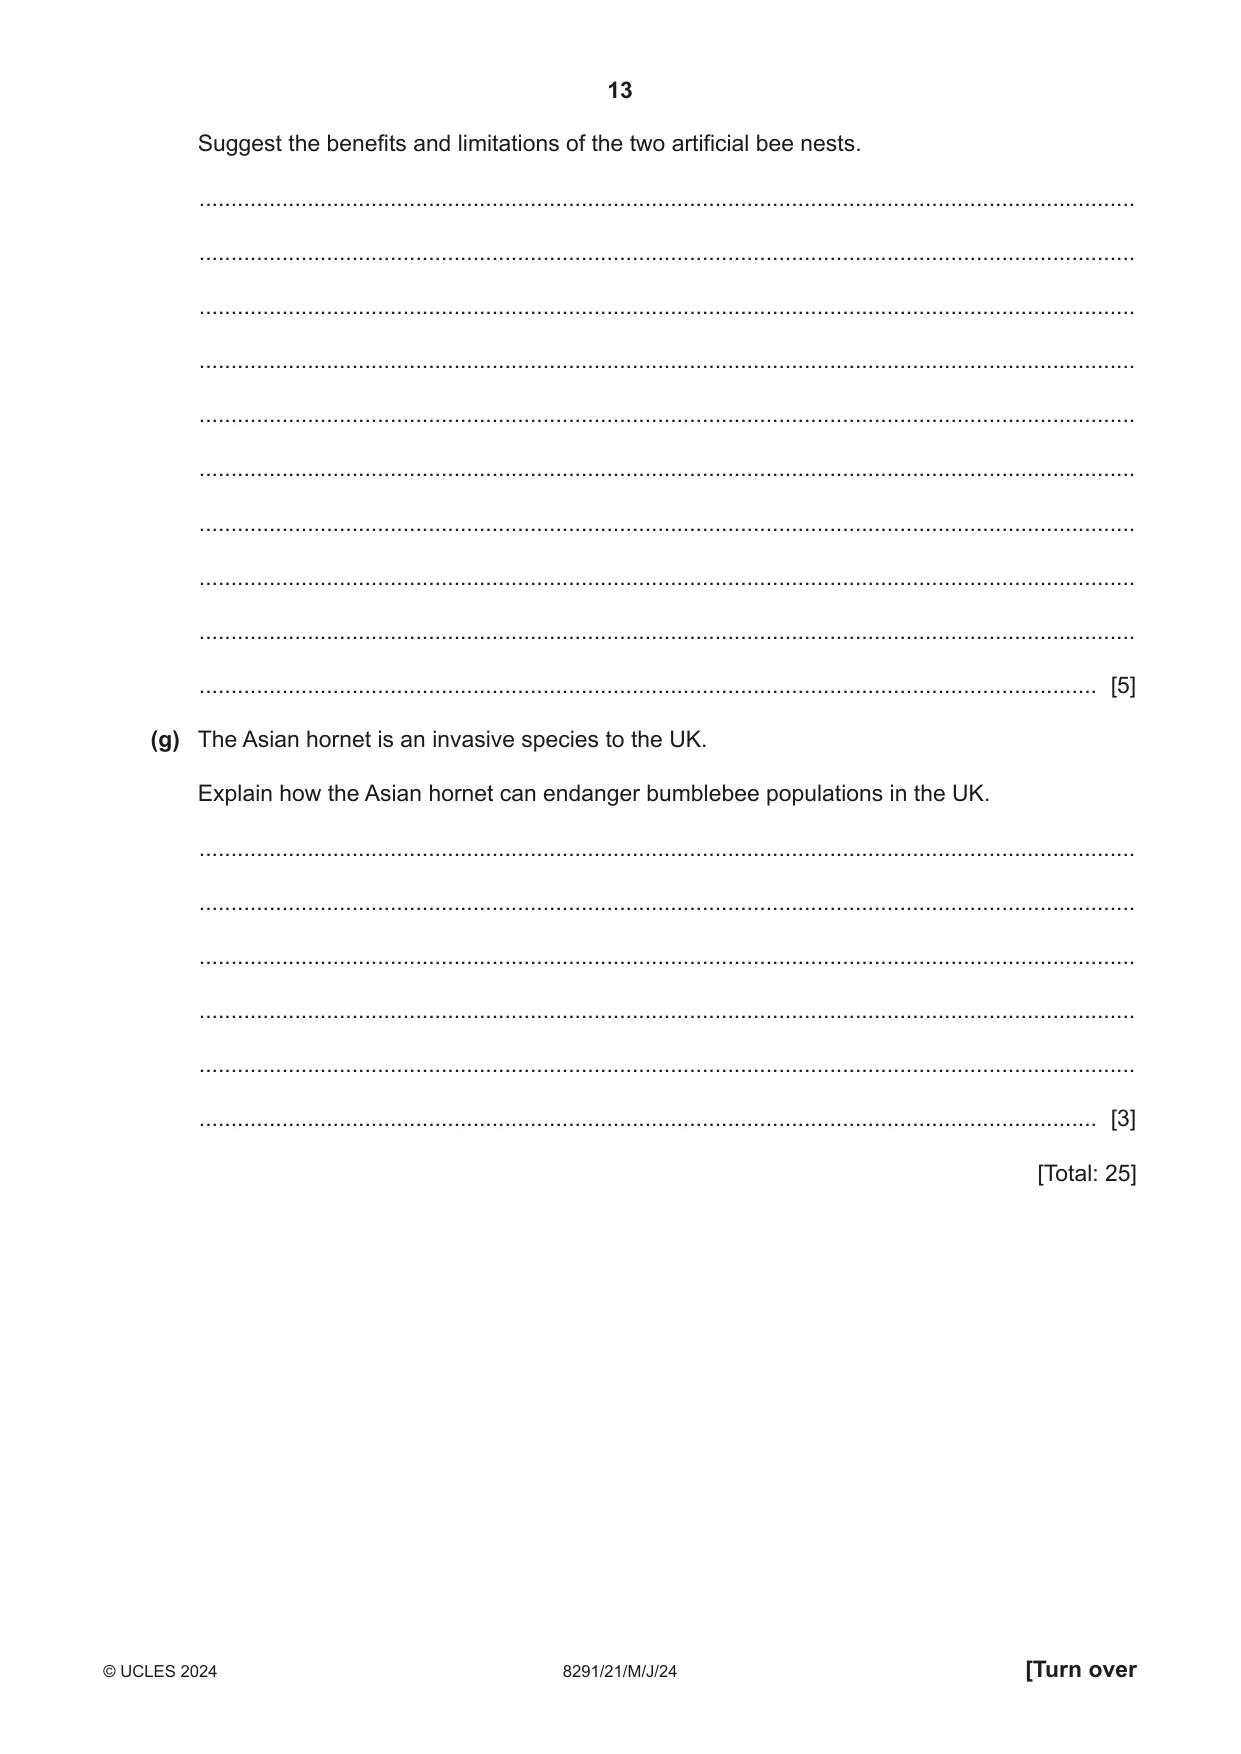
2 (a) In 2022, 80% of the timber used in the UK was imported. (i) Suggest one negative impact for the UK of importing timber. ..................................................................................................................................... [1] (ii) Financial incentives were offered to UK farmers to grow trees on agricultural land. Suggest two negative impacts of growing trees on agricultural land. 1 ........................................................................................................................................ ........................................................................................................................................... 2 ........................................................................................................................................ ........................................................................................................................................... [2] (b) Explain how growing more trees reduces the impact of carbon dioxide in the atmosphere. ................................................................................................................................................... ................................................................................................................................................... ................................................................................................................................................... ............................................................................................................................................. [2] (c) The photograph in Fig. 2.1 shows a forest, a road and a lake. Fig. 2.1 Describe how the photograph in Fig. 2.1 shows evidence of fragmentation. ................................................................................................................................................... ................................................................................................................................................... ................................................................................................................................................... ................................................................................................................................................... ................................................................................................................................................... ............................................................................................................................................. [3] (d) Pollinating insects enable trees to reproduce. Fig. 2.2 shows the broken-belted bumblebee, which is a pollinating insect. Fig. 2.2 The map in Fig. 2.3 shows the distribution of broken-belted bumblebees in part of the UK. Key N population of broken-belted bumblebee Scotland England Wales (i) Describe the distribution of broken-belted bumblebees shown in Fig. 2.3. ........................................................................................................................................... ........................................................................................................................................... ........................................................................................................................................... ..................................................................................................................................... [2] (ii) The data for the distribution map in Fig. 2.3 was collected using a survey. People completed an online survey for any species of bumblebee they observed. Fig. 2.4 shows the form used to collect the data. species: when you saw it: where you saw it: map grid reference: contact information: Fig. 2.4 Suggest the limitations of this type of bee population distribution survey. ........................................................................................................................................... ........................................................................................................................................... ........................................................................................................................................... ........................................................................................................................................... ........................................................................................................................................... ..................................................................................................................................... [3] (e) A scientist investigates the population of broken-belted bumblebees using a transect method. The transect is a measured straight line where the population of broken-belted bumblebees are located. The length of this transect line is 10 m. Describe how the scientist can use this transect line to estimate the population of broken- belted bumblebees. ................................................................................................................................................... ................................................................................................................................................... ................................................................................................................................................... ................................................................................................................................................... ................................................................................................................................................... ................................................................................................................................................... ................................................................................................................................................... ............................................................................................................................................. [4] (f) The diagram in Fig. 2.5 shows a natural bee nest in a tree. Fig. 2.5 Fig. 2.6 shows two types of artificial bee nest: a sun hive and a wooden hive. sun hive wooden hive Fig. 2.6 Suggest the benefits and limitations of the two artificial bee nests. ................................................................................................................................................... ................................................................................................................................................... ................................................................................................................................................... ................................................................................................................................................... ................................................................................................................................................... ................................................................................................................................................... ................................................................................................................................................... ................................................................................................................................................... ................................................................................................................................................... ............................................................................................................................................. [5] (g) The Asian hornet is an invasive species to the UK. Explain how the Asian hornet can endanger bumblebee populations in the UK. ................................................................................................................................................... ................................................................................................................................................... ................................................................................................................................................... ................................................................................................................................................... ................................................................................................................................................... ............................................................................................................................................. [3] [Total: 25]
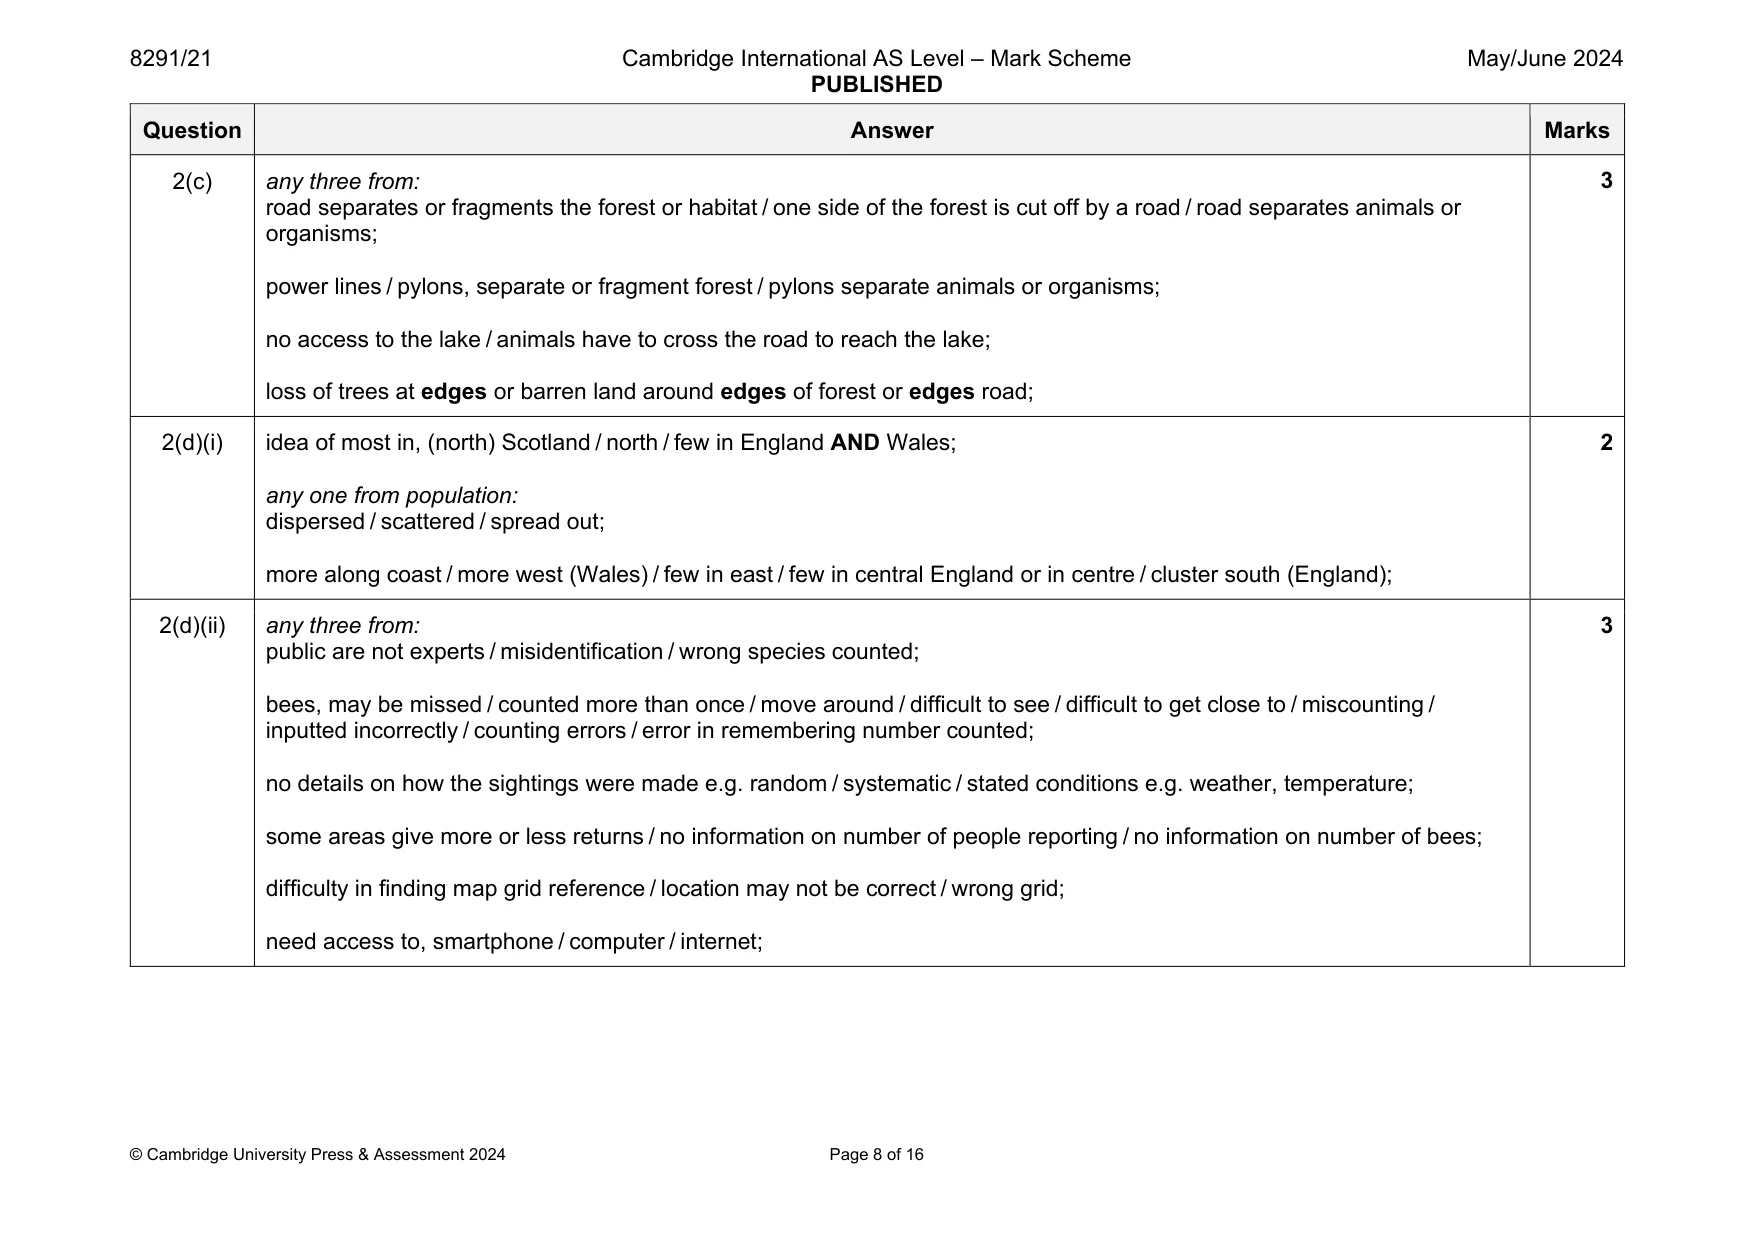
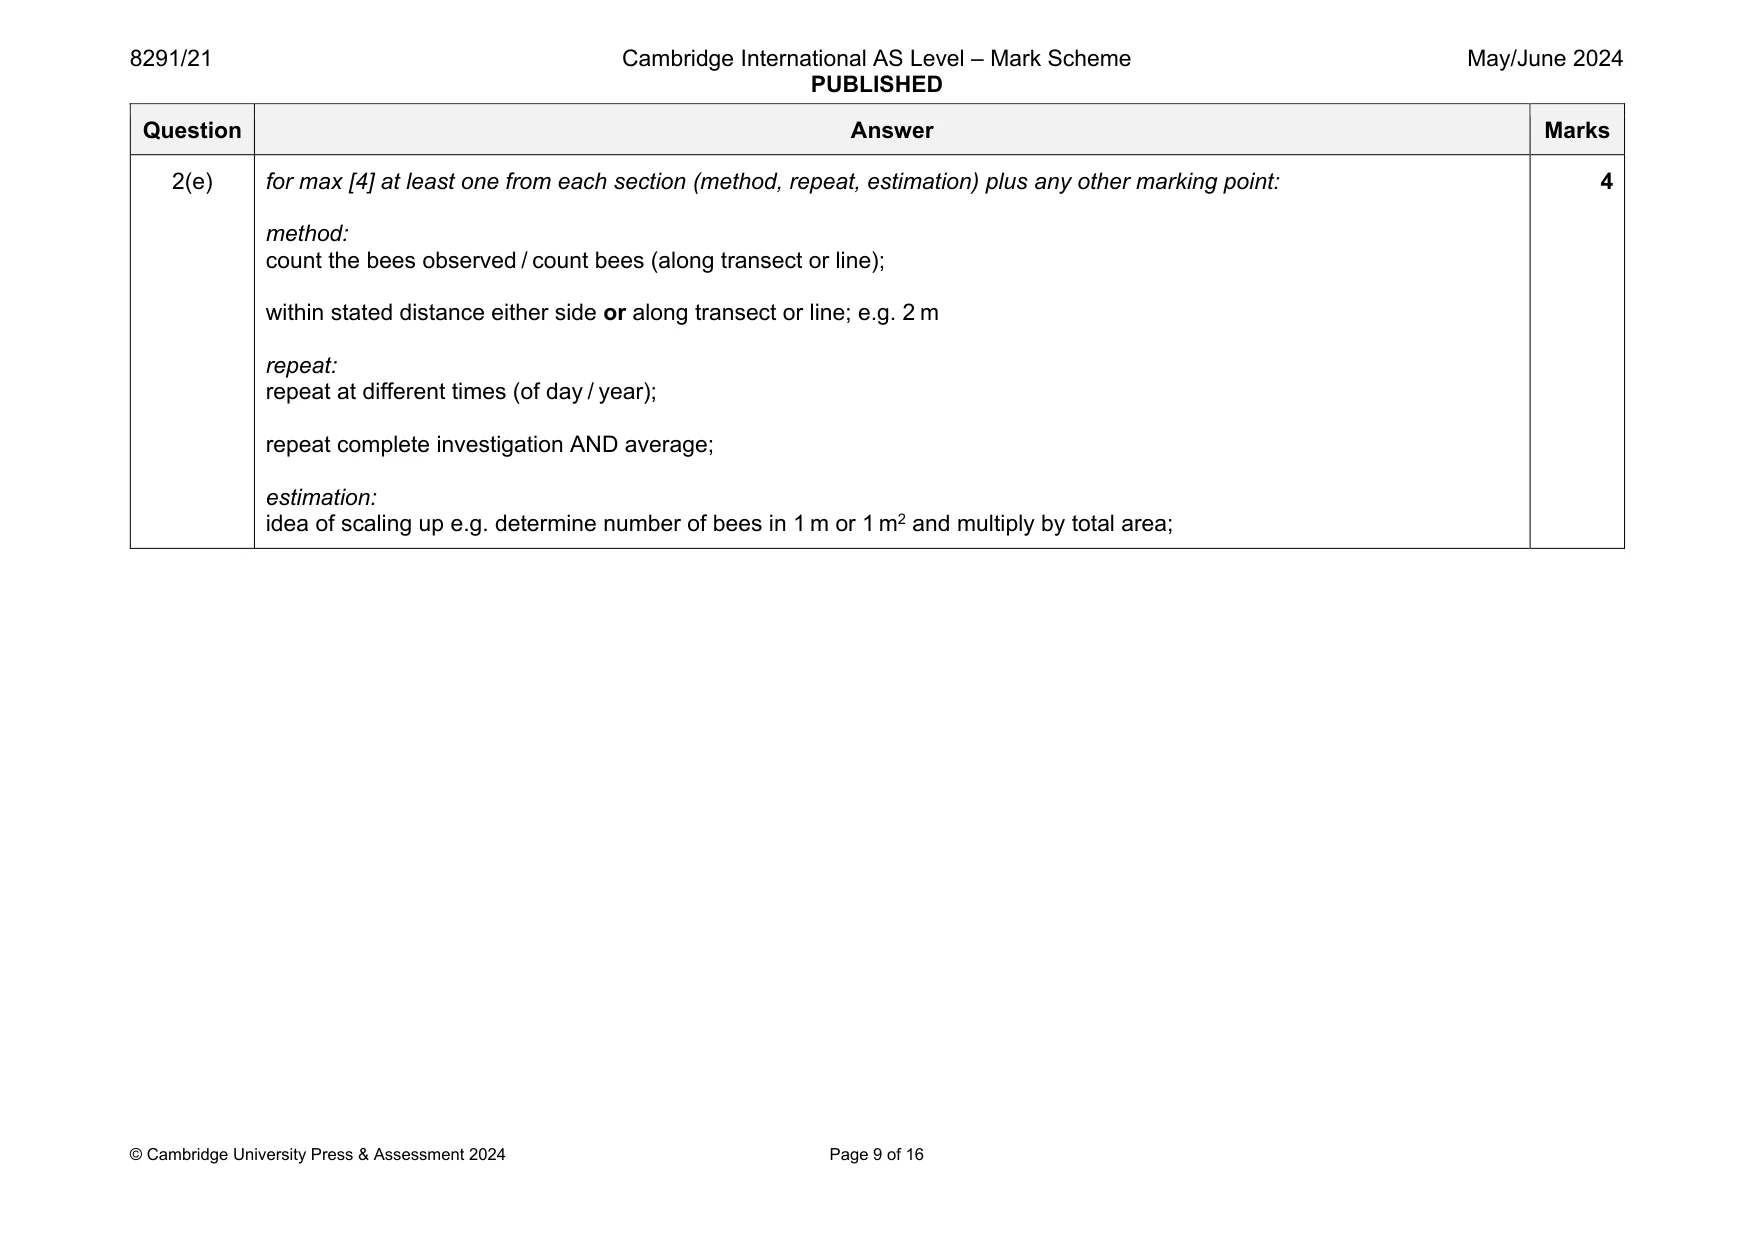
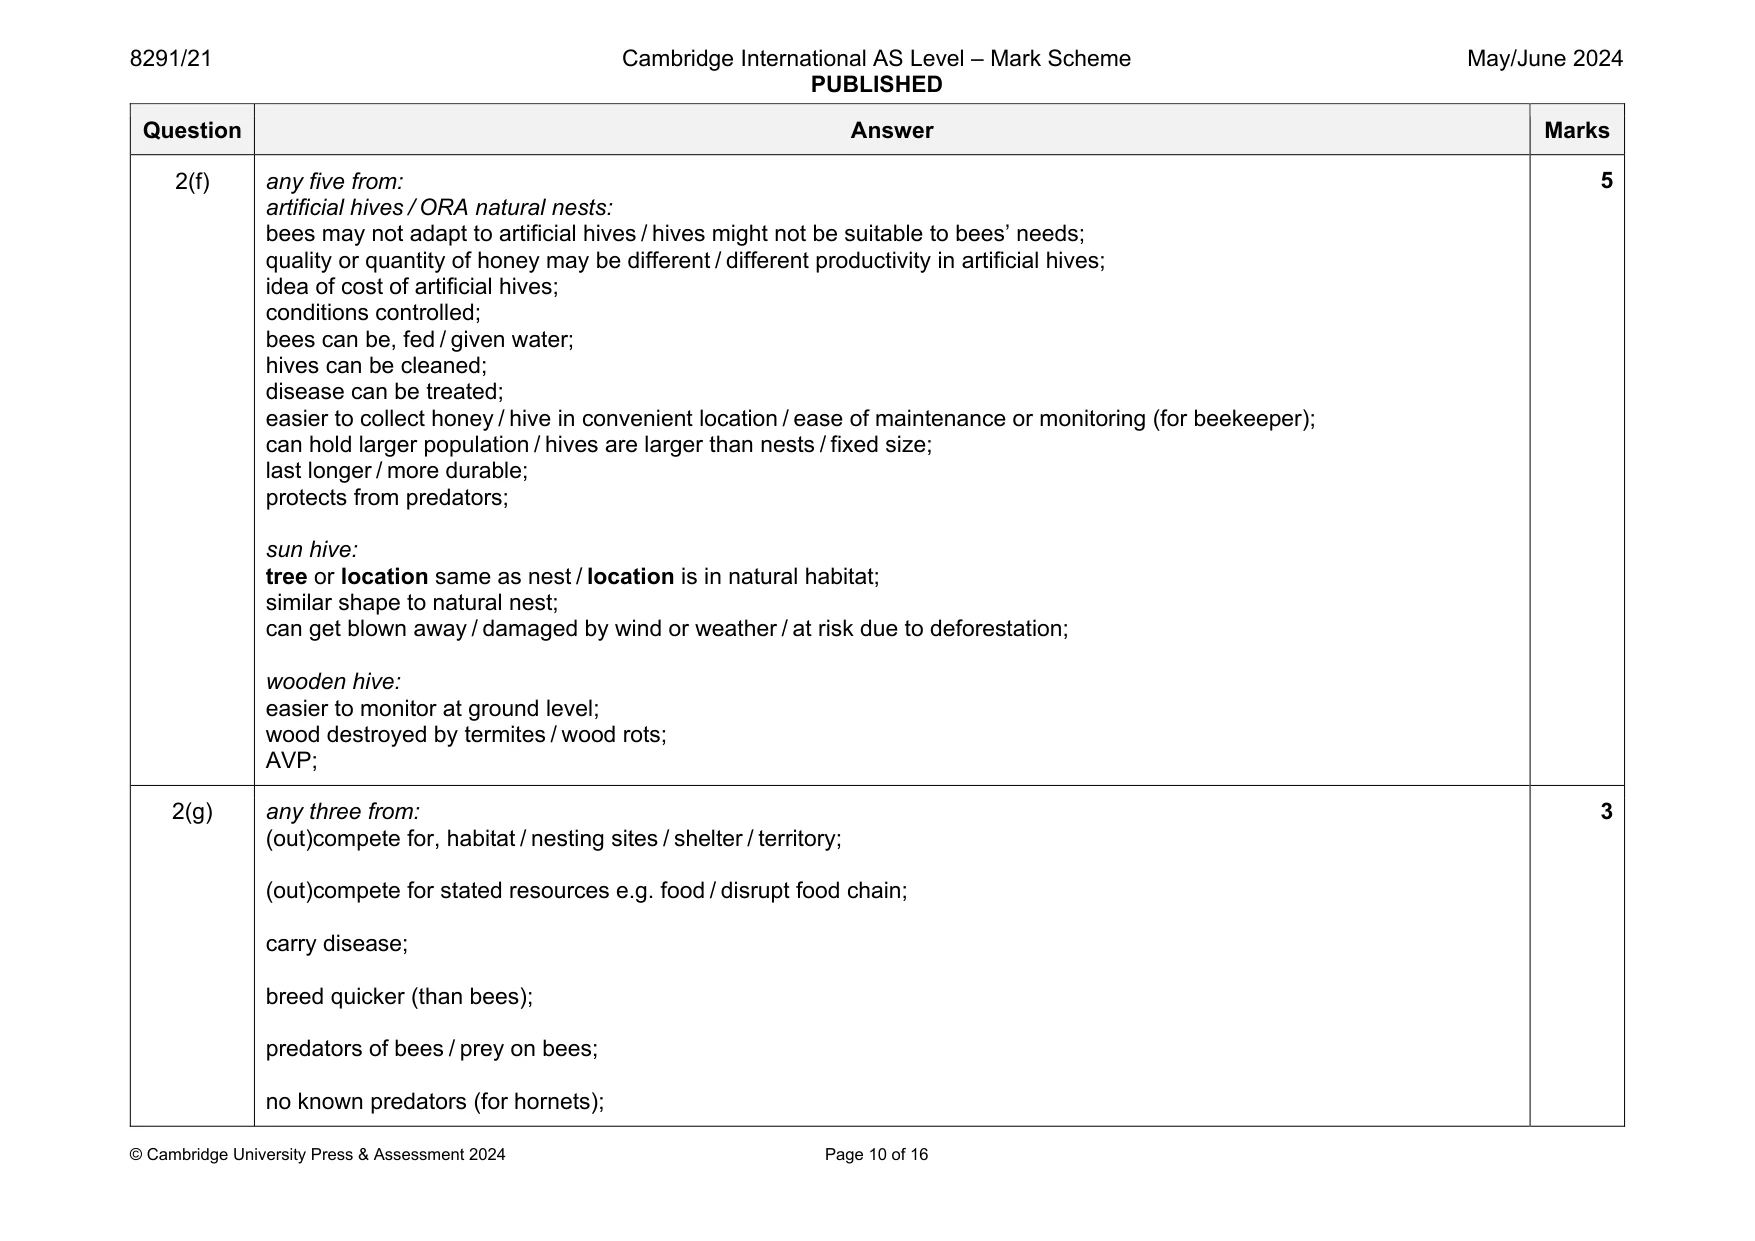
Mark scheme: 2(a)(i) any one from: prices can be increased (by other country); lack of self-reliance / reliance on other countries / idea of imbalance of supply and demand; not sustainable; stated economic impact (e.g. cost of transport / cost of importing / impact on UK timber industry; energy use of transport or using vehicles / transport has carbon footprint / atmospheric impact of use of transport / named air pollution linked to transport; may introduce, invasive species / disease; 1 2(a)(ii) any two or one developed from: livestock cannot graze on land / less space for livestock; food or crops, not grown or less grown / less yield or less space for food or crops; leads to food insecurity; long lead time / timber harvest will not be available for many years / trees take a long time to grow; 2 2(b) reference to (trees) photosynthesise; trees remove or store, carbon dioxide / carbon dioxide reactant (in photosynthesis) / carbon dioxide water (→ glucose oxygen); 2 Question Answer Marks 2(c) any three from: road separates or fragments the forest or habitat / one side of the forest is cut off by a road / road separates animals or organisms; power lines / pylons, separate or fragment forest / pylons separate animals or organisms; no access to the lake / animals have to cross the road to reach the lake; loss of trees at edges or barren land around edges of forest or edges road; 3 2(d)(i) idea of most in, (north) Scotland / north / few in England AND Wales; any one from population: dispersed / scattered / spread out; more along coast / more west (Wales) / few in east / few in central England or in centre / cluster south (England); 2 2(d)(ii) any three from: public are not experts / misidentification / wrong species counted; bees, may be missed / counted more than once / move around / difficult to see / difficult to get close to / miscounting / inputted incorrectly / counting errors / error in remembering number counted; no details on how the sightings were made e.g. random / systematic / stated conditions e.g. weather, temperature; some areas give more or less returns / no information on number of people reporting / no information on number of bees; difficulty in finding map grid reference / location may not be correct / wrong grid; need access to, smartphone / computer / internet; 3 Question Answer Marks 2(e) for max [4] at least one from each section (method, repeat, estimation) plus any other marking point: method: count the bees observed / count bees (along transect or line); within stated distance either side or along transect or line; e.g. 2 m repeat: repeat at different times (of day / year); repeat complete investigation AND average; estimation: idea of scaling up e.g. determine number of bees in 1 m or 1 m2 and multiply by total area; 4 Question Answer Marks 2(f) any five from: artificial hives / ORA natural nests: bees may not adapt to artificial hives / hives might not be suitable to bees’ needs; quality or quantity of honey may be different / different productivity in artificial hives; idea of cost of artificial hives; conditions controlled; bees can be, fed / given water; hives can be cleaned; disease can be treated; easier to collect honey / hive in convenient location / ease of maintenance or monitoring (for beekeeper); can hold larger population / hives are larger than nests / fixed size; last longer / more durable; protects from predators; sun hive: tree or location same as nest / location is in natural habitat; similar shape to natural nest; can get blown away / damaged by wind or weather / at risk due to deforestation; wooden hive: easier to monitor at ground level; wood destroyed by termites / wood rots; AVP; 5 2(g) any three from: (out)compete for, habitat / nesting sites / shelter / territory; (out)compete for stated resources e.g. food / disrupt food chain; carry disease; breed quicker (than bees); predators of bees / prey on bees; no known predators (for hornets); 3
More questions on Data collection techniques and data analysis
Q3 · Methane is an atmospheric pollutant
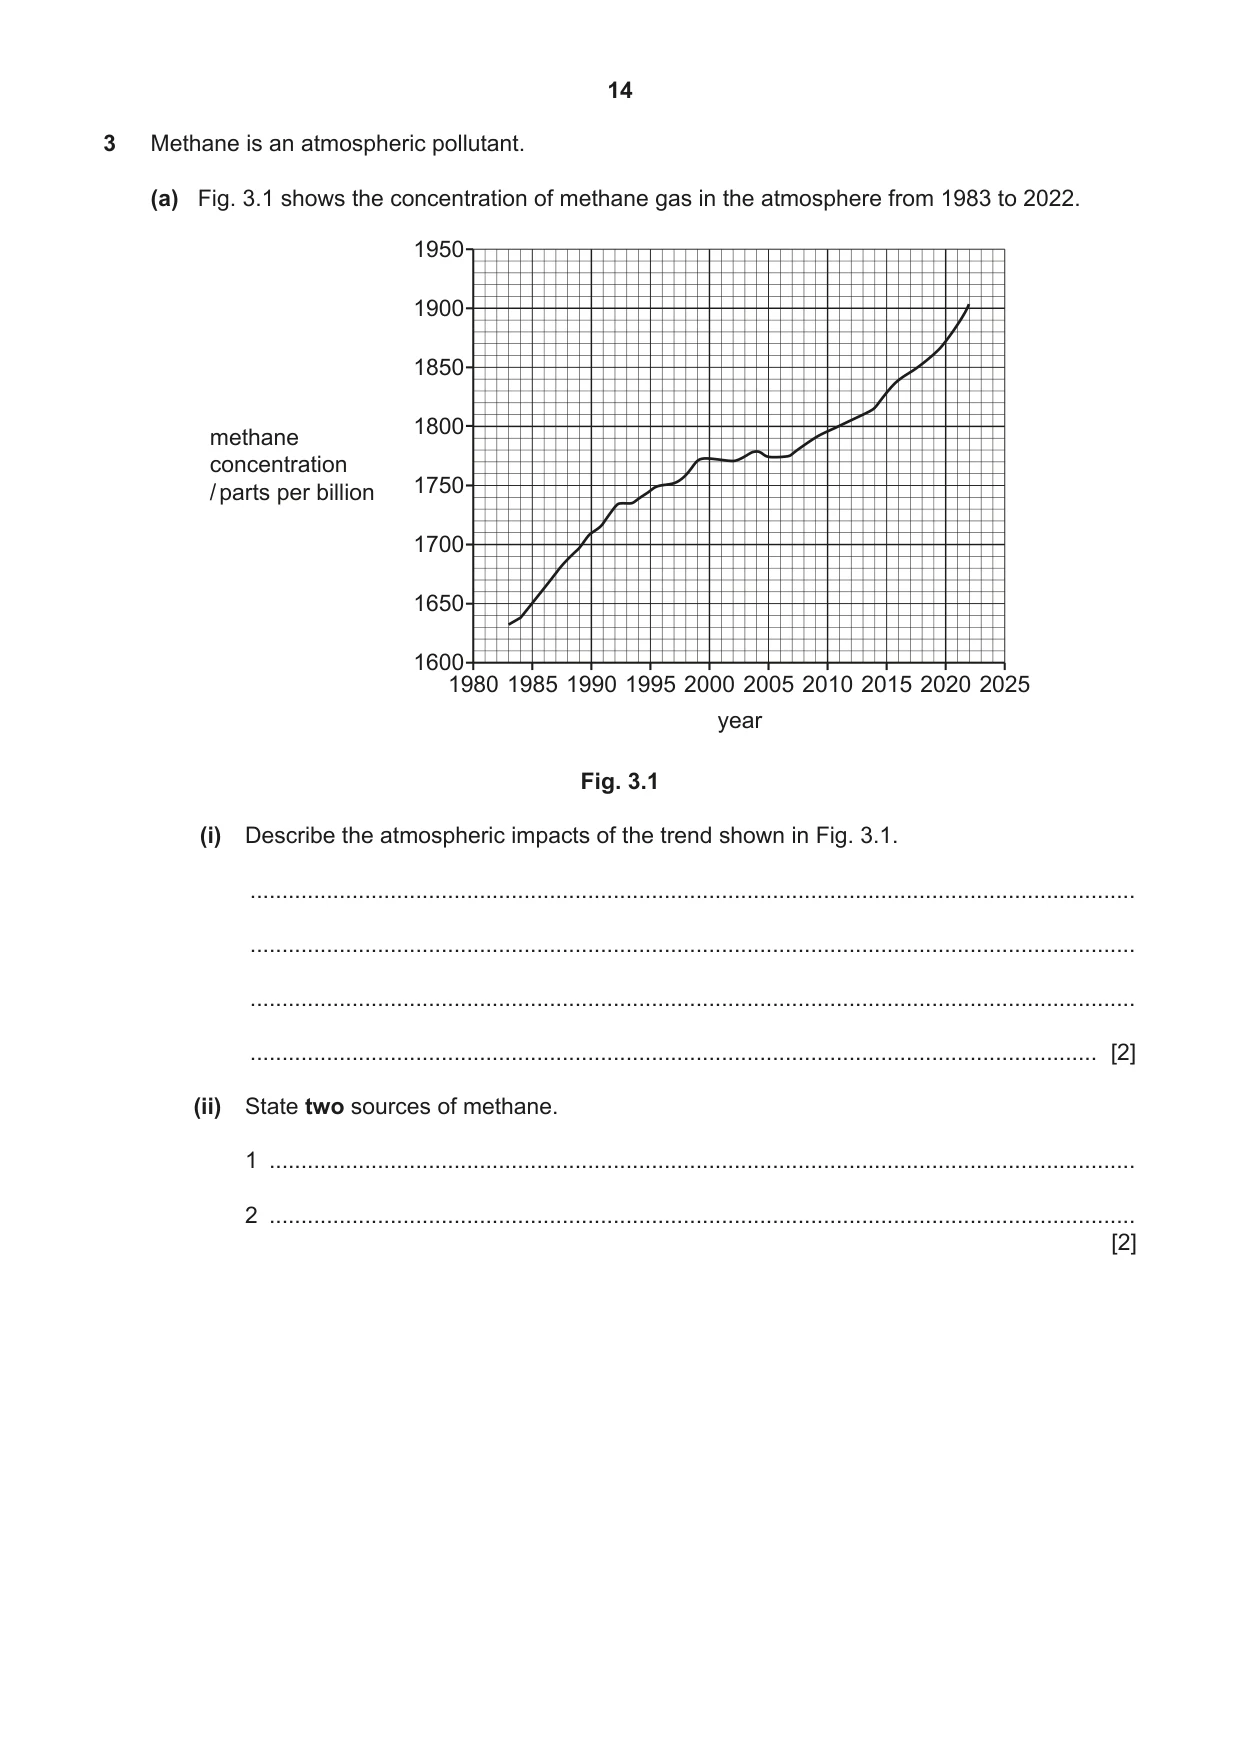
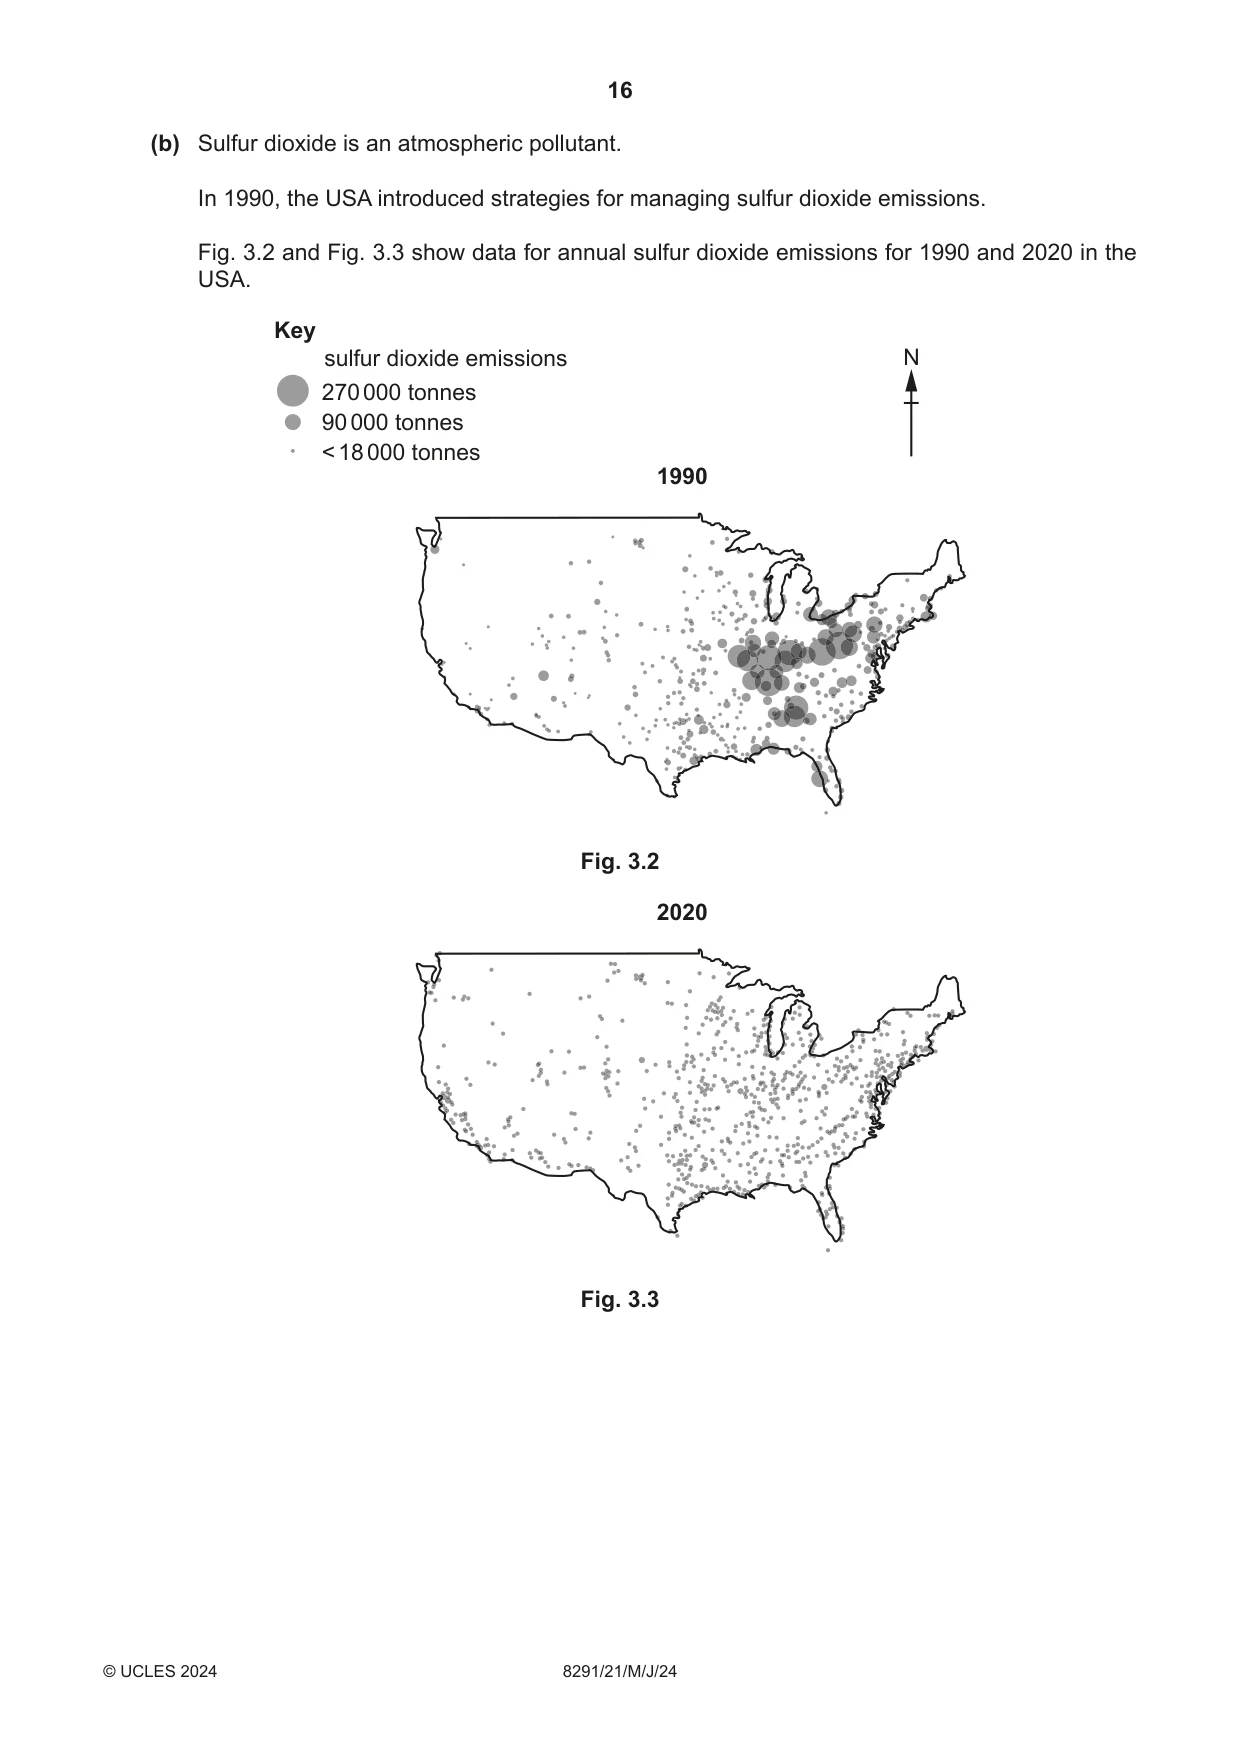
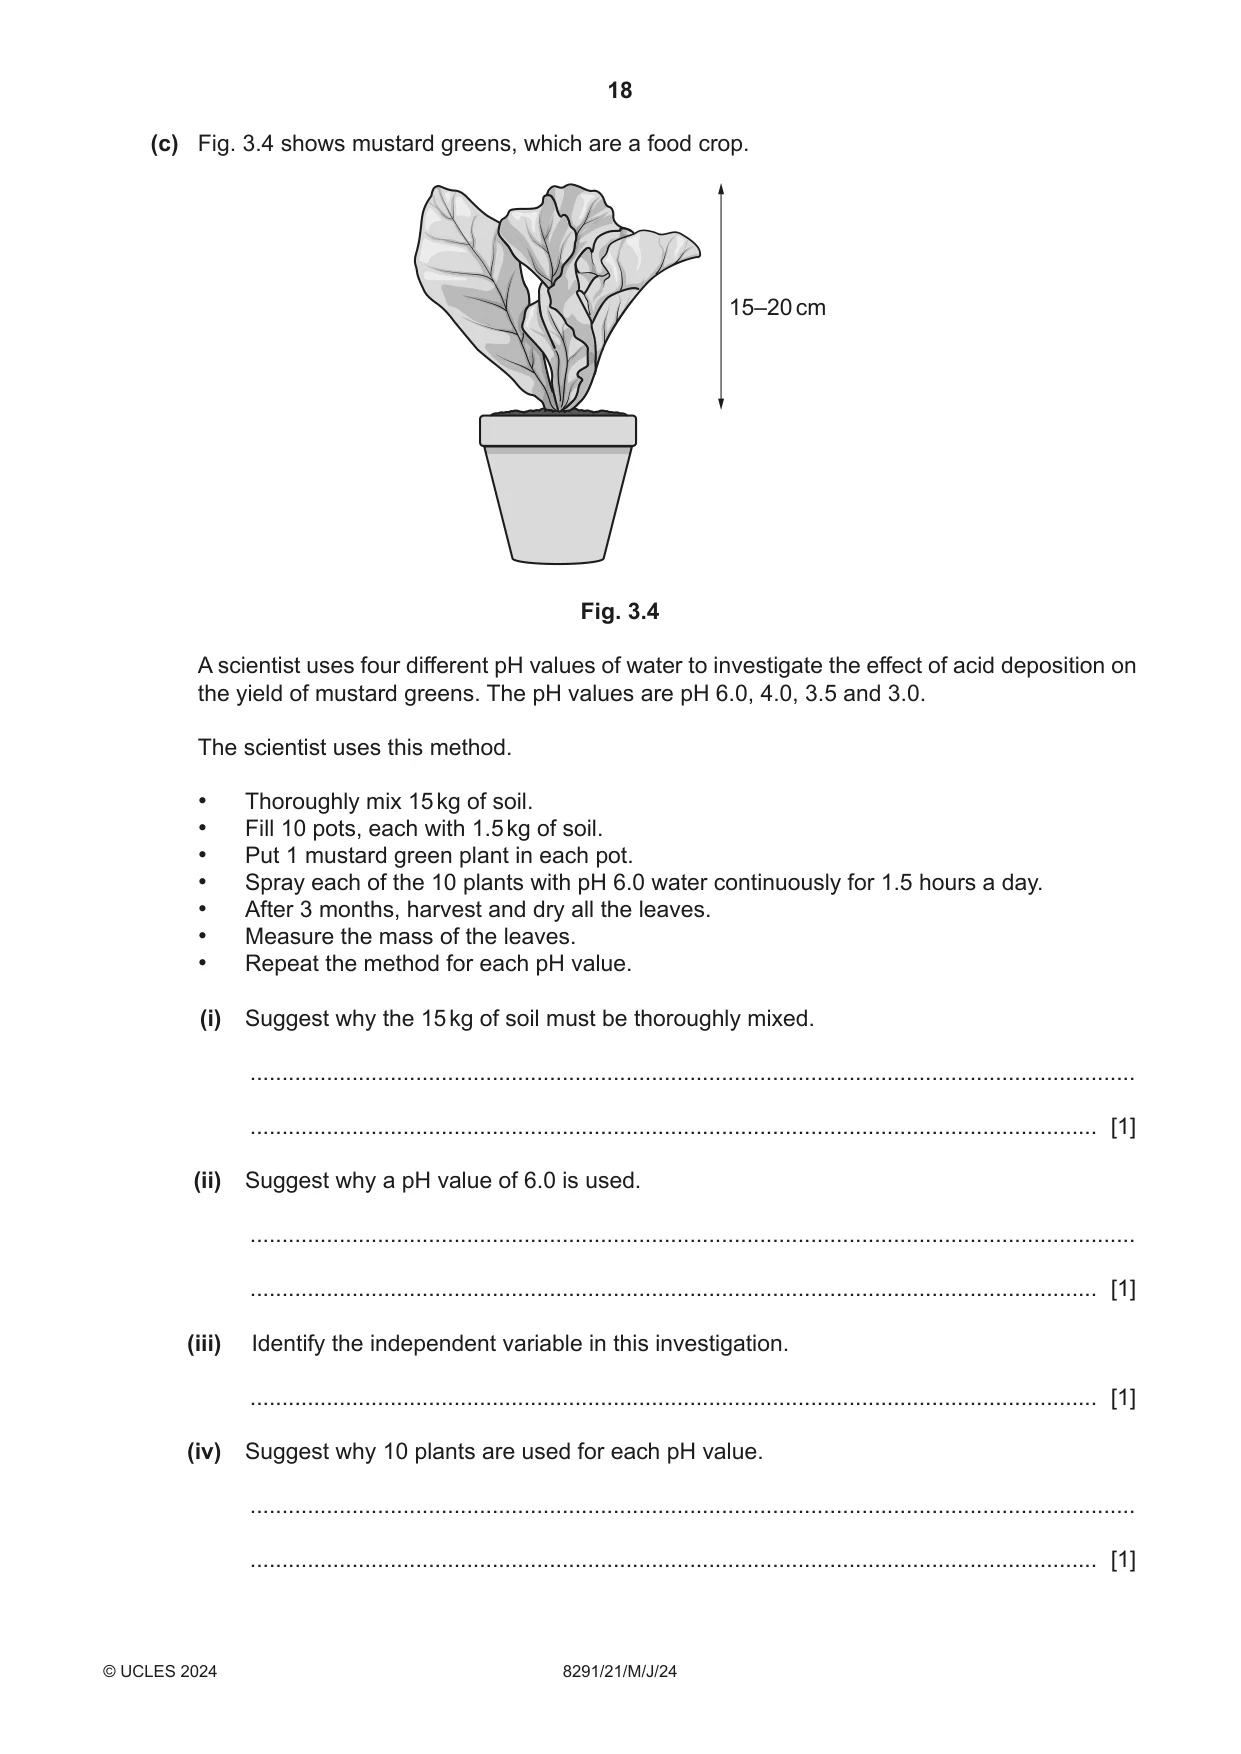
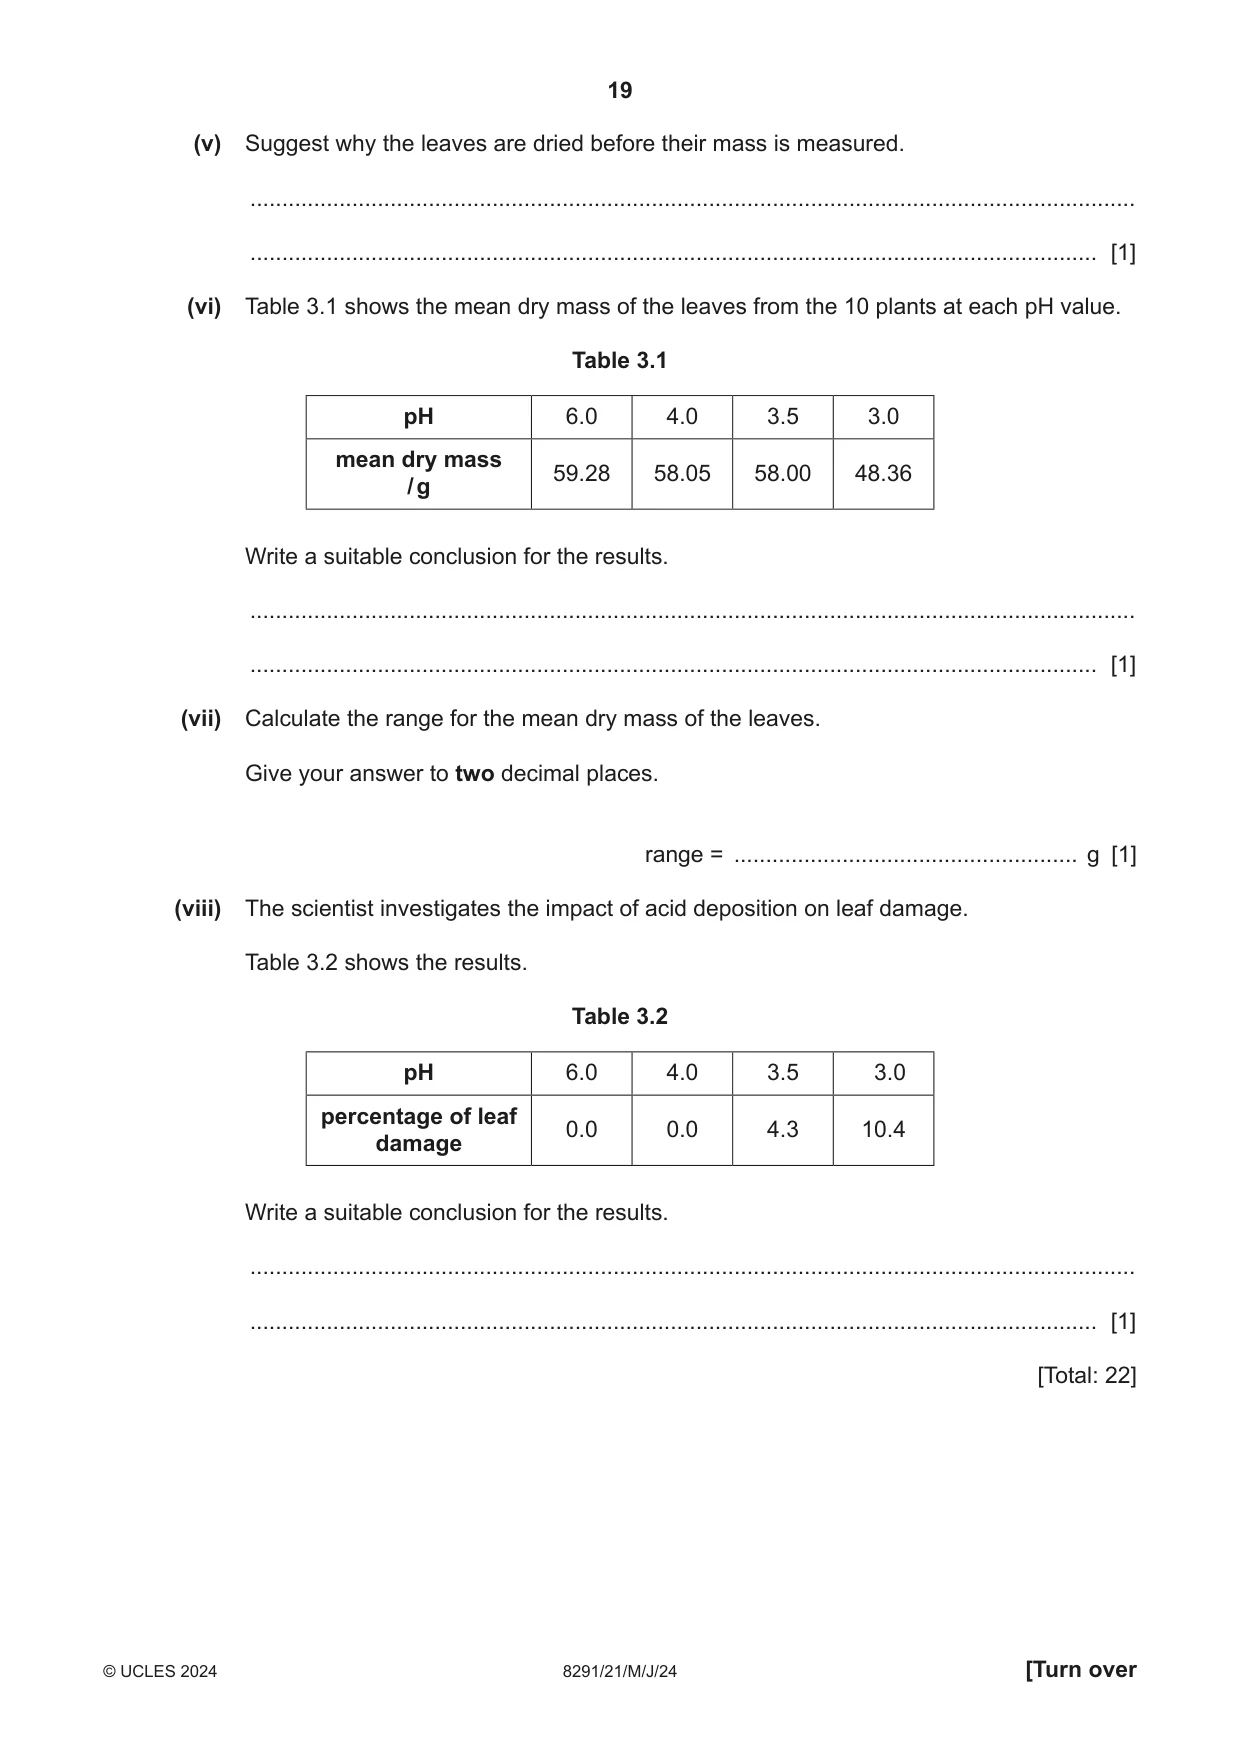
3 Methane is an atmospheric pollutant. (a) Fig. 3.1 shows the concentration of methane gas in the atmosphere from 1983 to 2022. 1950 1900 1850 1800 methane concentration 1750 / parts per billion 1700 1650 1600 1980 1985 1990 1995 2000 2005 2010 2015 2020 2025 year Fig. 3.1 (i) Describe the atmospheric impacts of the trend shown in Fig. 3.1. ........................................................................................................................................... ........................................................................................................................................... ........................................................................................................................................... ..................................................................................................................................... [2] (ii) State two sources of methane. 1 ........................................................................................................................................ 2 ........................................................................................................................................ [2] (b) Sulfur dioxide is an atmospheric pollutant. In 1990, the USA introduced strategies for managing sulfur dioxide emissions. Fig. 3.2 and Fig. 3.3 show data for annual sulfur dioxide emissions for 1990 and 2020 in the USA. Key sulfur dioxide emissions N 270000 tonnes 90000 tonnes <18000 tonnes 1990 Fig. 3.2 2020 Fig. 3.3 (i) Evaluate the success of the strategies introduced to manage sulfur dioxide emissions. ........................................................................................................................................... ........................................................................................................................................... ........................................................................................................................................... ........................................................................................................................................... ........................................................................................................................................... ..................................................................................................................................... [3] (ii) Explain how sulfur dioxide forms acid deposition. ........................................................................................................................................... ........................................................................................................................................... ........................................................................................................................................... ..................................................................................................................................... [2] (iii) State one type of wet acid deposition and one type of dry acid deposition. wet acid deposition ............................................................................................................ dry acid deposition ............................................................................................................ [2] (iv) Combustion of fossil fuels contributes to acid deposition. Describe strategies to reduce the impact of acid deposition from the combustion of fossil fuels. ........................................................................................................................................... ........................................................................................................................................... ........................................................................................................................................... ........................................................................................................................................... ........................................................................................................................................... ..................................................................................................................................... [3] (c) Fig. 3.4 shows mustard greens, which are a food crop. 15–20cm Fig. 3.4 A scientist uses four different pH values of water to investigate the effect of acid deposition on the yield of mustard greens. The pH values are pH 6.0, 4.0, 3.5 and 3.0. The scientist uses this method. • Thoroughly mix 15 kg of soil. • Fill 10 pots, each with 1.5 kg of soil. • Put 1 mustard green plant in each pot. • Spray each of the 10 plants with pH 6.0 water continuously for 1.5 hours a day. • After 3 months, harvest and dry all the leaves. • Measure the mass of the leaves. • Repeat the method for each pH value. (i) Suggest why the 15 kg of soil must be thoroughly mixed. ........................................................................................................................................... ..................................................................................................................................... [1] (ii) Suggest why a pH value of 6.0 is used. ........................................................................................................................................... ..................................................................................................................................... [1] (iii) Identify the independent variable in this investigation. ..................................................................................................................................... [1] (iv) Suggest why 10 plants are used for each pH value. ........................................................................................................................................... ..................................................................................................................................... [1] (v) Suggest why the leaves are dried before their mass is measured. ........................................................................................................................................... ..................................................................................................................................... [1] (vi) Table 3.1 shows the mean dry mass of the leaves from the 10 plants at each pH value. Table 3.1 pH 6.0 4.0 3.5 3.0 mean dry mass 59.28 58.05 58.00 48.36 / g Write a suitable conclusion for the results. ........................................................................................................................................... ..................................................................................................................................... [1] (vii) Calculate the range for the mean dry mass of the leaves. Give your answer to two decimal places. range = ...................................................... g [1] (viii) The scientist investigates the impact of acid deposition on leaf damage. Table 3.2 shows the results. Table 3.2 pH 6.0 4.0 3.5 3.0 percentage of leaf 0.0 0.0 4.3 10.4 damage Write a suitable conclusion for the results. ........................................................................................................................................... ..................................................................................................................................... [1] [Total: 22]
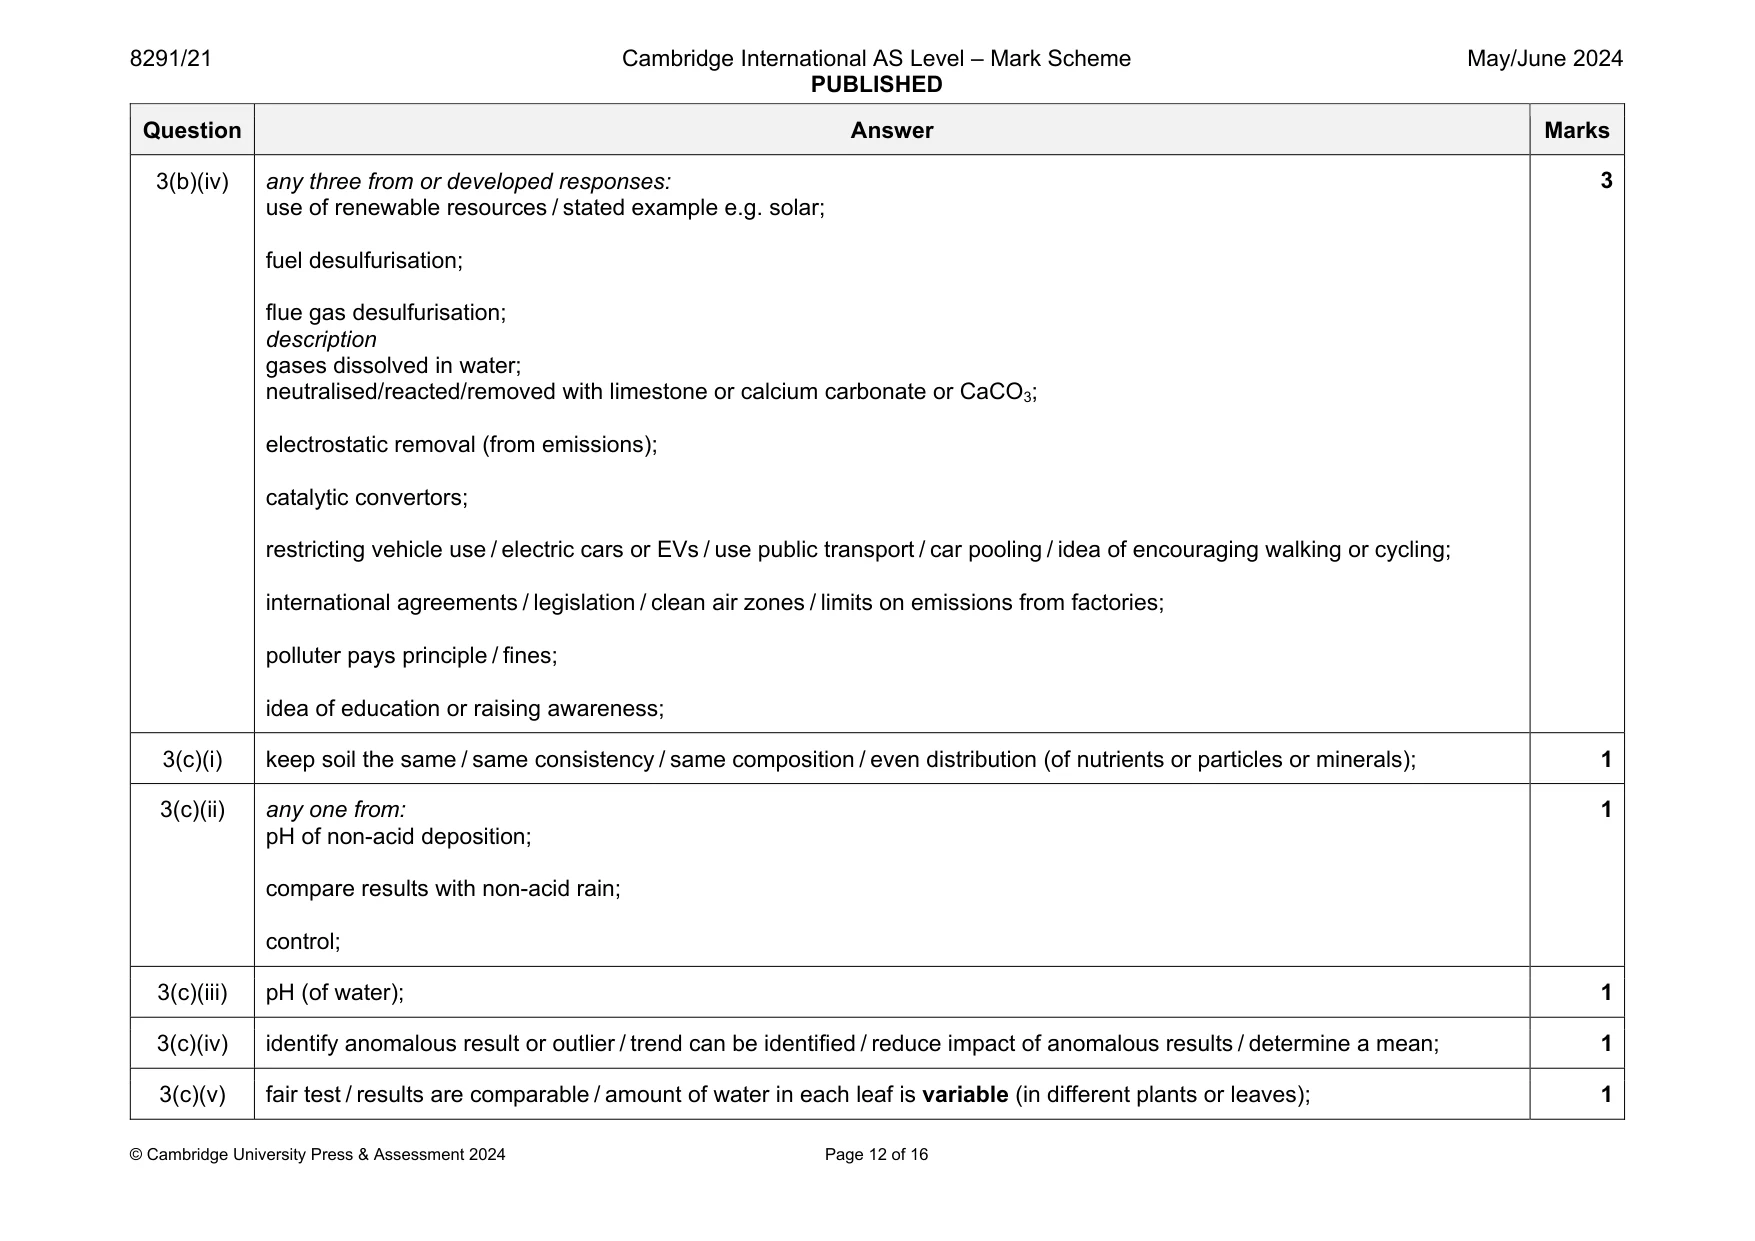
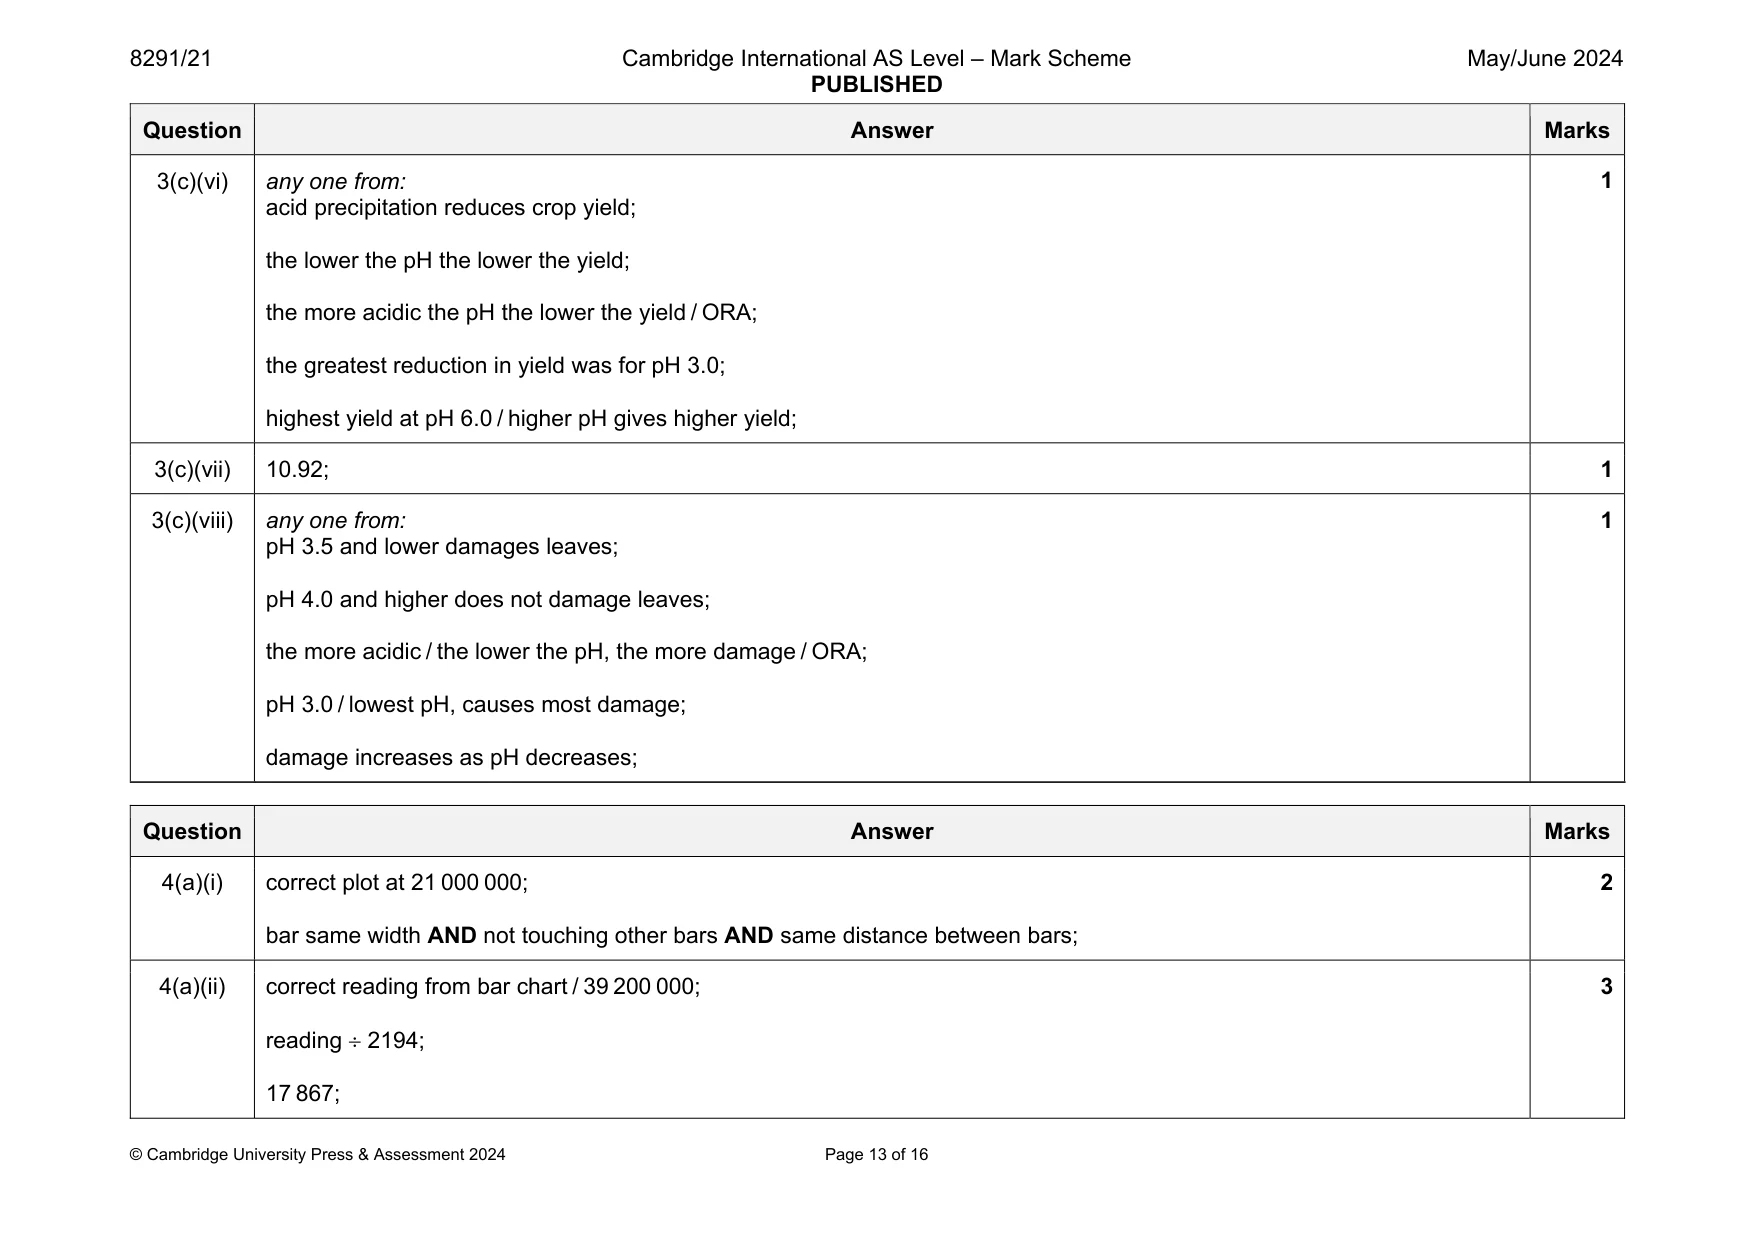
Mark scheme: 3(a)(i) any two from: methane is a greenhouse gas / increase in greenhouse gases; (increase in enhanced) greenhouse effect; increase (global) temperature / climate change; 2 3(a)(ii) any two from: rice fields or paddies; livestock or named livestock (digestion); landfill; decomposition of vegetation / rotting of vegetation; released from melting permafrost; peat (bogs) / wetlands; mining / rock extraction / fracking; 2 3(b)(i) successful because: emissions decreased; no areas greater than 18 000 tonnes (in 2020) / idea of reduction in emissions in east / no 270 000 tonne emissions in 2020 less successful because: increase in emissions on west (coast); 3 3(b)(ii) (in the atmosphere SO2) reacts with (rain)water (and oxygen); forms sulfuric acid; 2 3(b)(iii) wet acid deposition: snow / rain / hail / fog; dry acid deposition: dust / gas(es); 2 Question Answer Marks 3(b)(iv) any three from or developed responses: use of renewable resources / stated example e.g. solar; fuel desulfurisation; flue gas desulfurisation; description gases dissolved in water; neutralised/reacted/removed with limestone or calcium carbonate or CaCO3; electrostatic removal (from emissions); catalytic convertors; restricting vehicle use / electric cars or EVs / use public transport / car pooling / idea of encouraging walking or cycling; international agreements / legislation / clean air zones / limits on emissions from factories; polluter pays principle / fines; idea of education or raising awareness; 3 3(c)(i) keep soil the same / same consistency / same composition / even distribution (of nutrients or particles or minerals); 1 3(c)(ii) any one from: pH of non-acid deposition; compare results with non-acid rain; control; 1 3(c)(iii) pH (of water); 1 3(c)(iv) identify anomalous result or outlier / trend can be identified / reduce impact of anomalous results / determine a mean; 1 3(c)(v) fair test / results are comparable / amount of water in each leaf is variable (in different plants or leaves); 1 Question Answer Marks 3(c)(vi) any one from: acid precipitation reduces crop yield; the lower the pH the lower the yield; the more acidic the pH the lower the yield / ORA; the greatest reduction in yield was for pH 3.0; highest yield at pH 6.0 / higher pH gives higher yield; 1 3(c)(vii) 10.92; 1 3(c)(viii) any one from: pH 3.5 and lower damages leaves; pH 4.0 and higher does not damage leaves; the more acidic / the lower the pH, the more damage / ORA; pH 3.0 / lowest pH, causes most damage; damage increases as pH decreases; 1
Q4 · A megacity is an urban centre with more than 10 million people
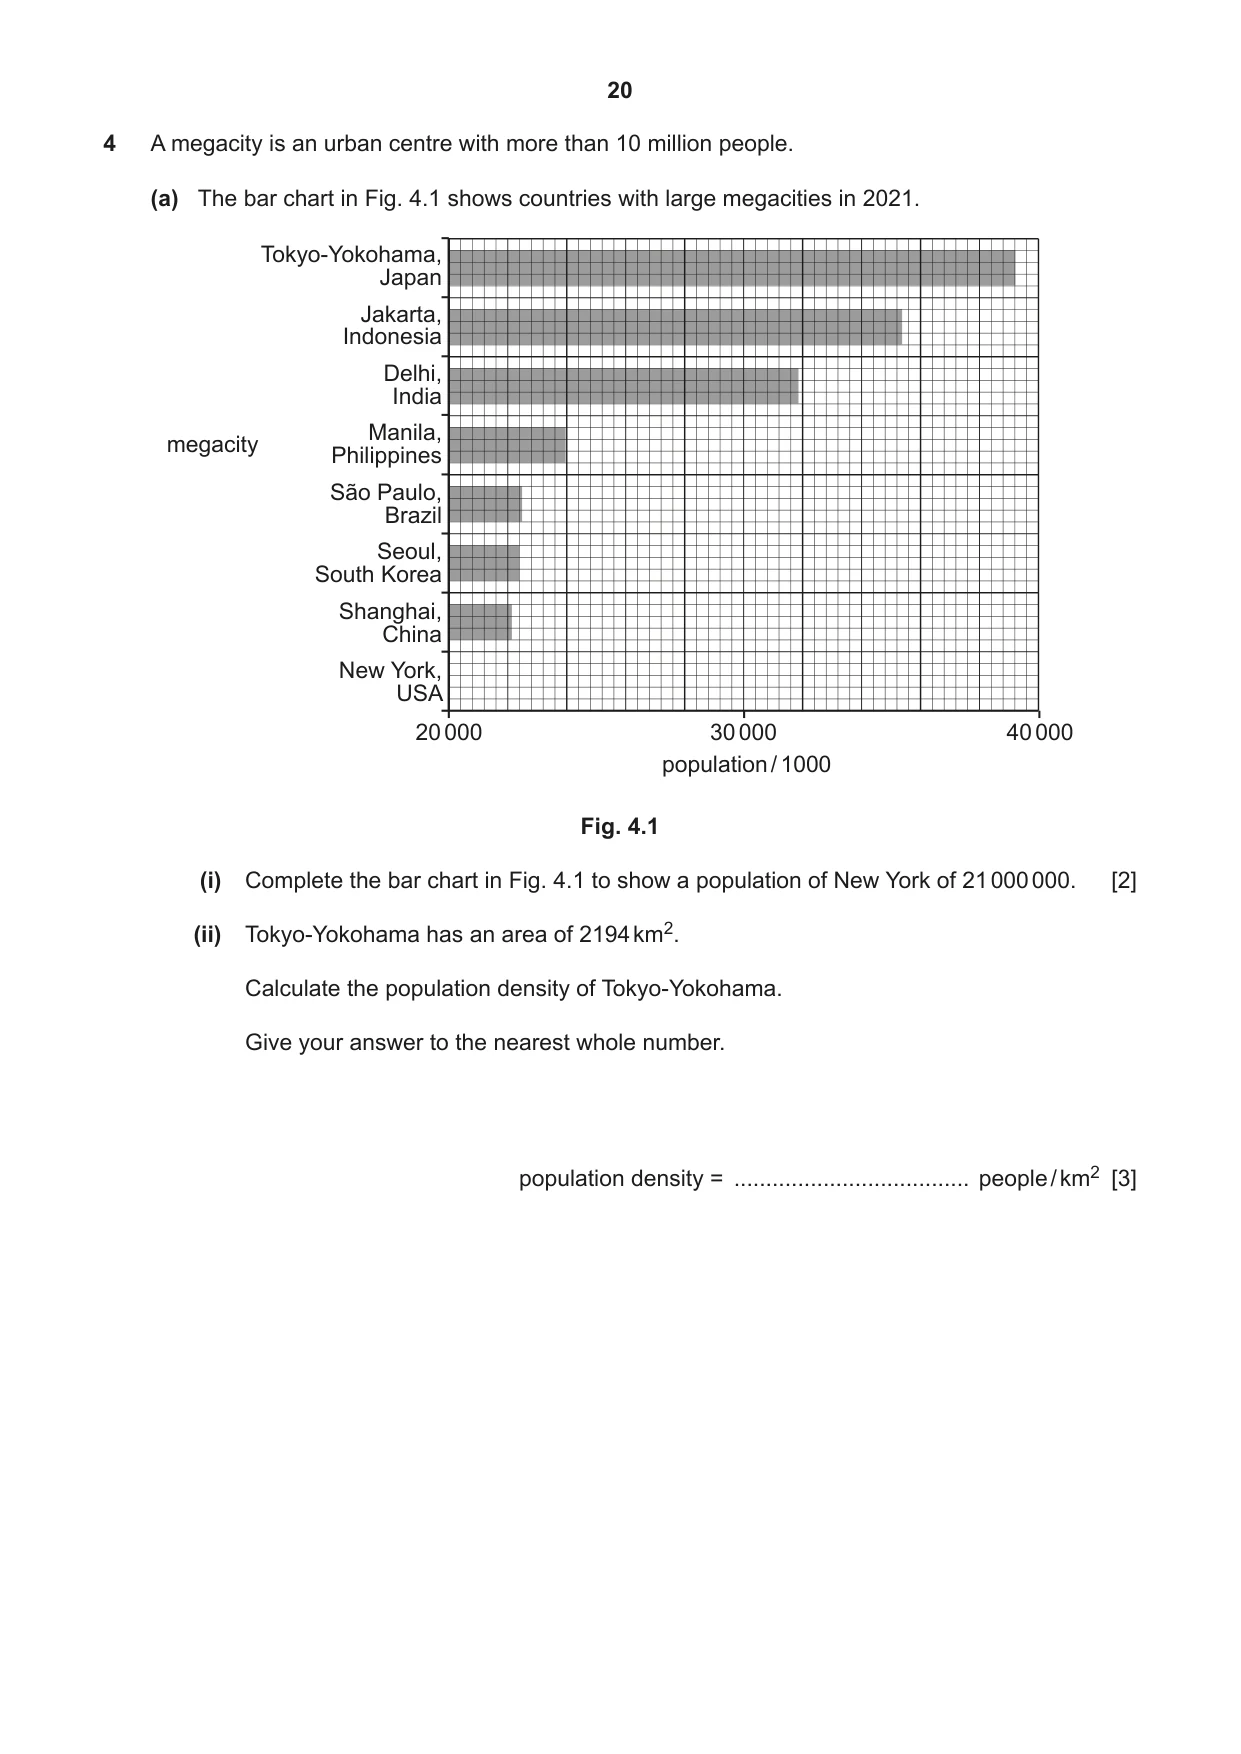
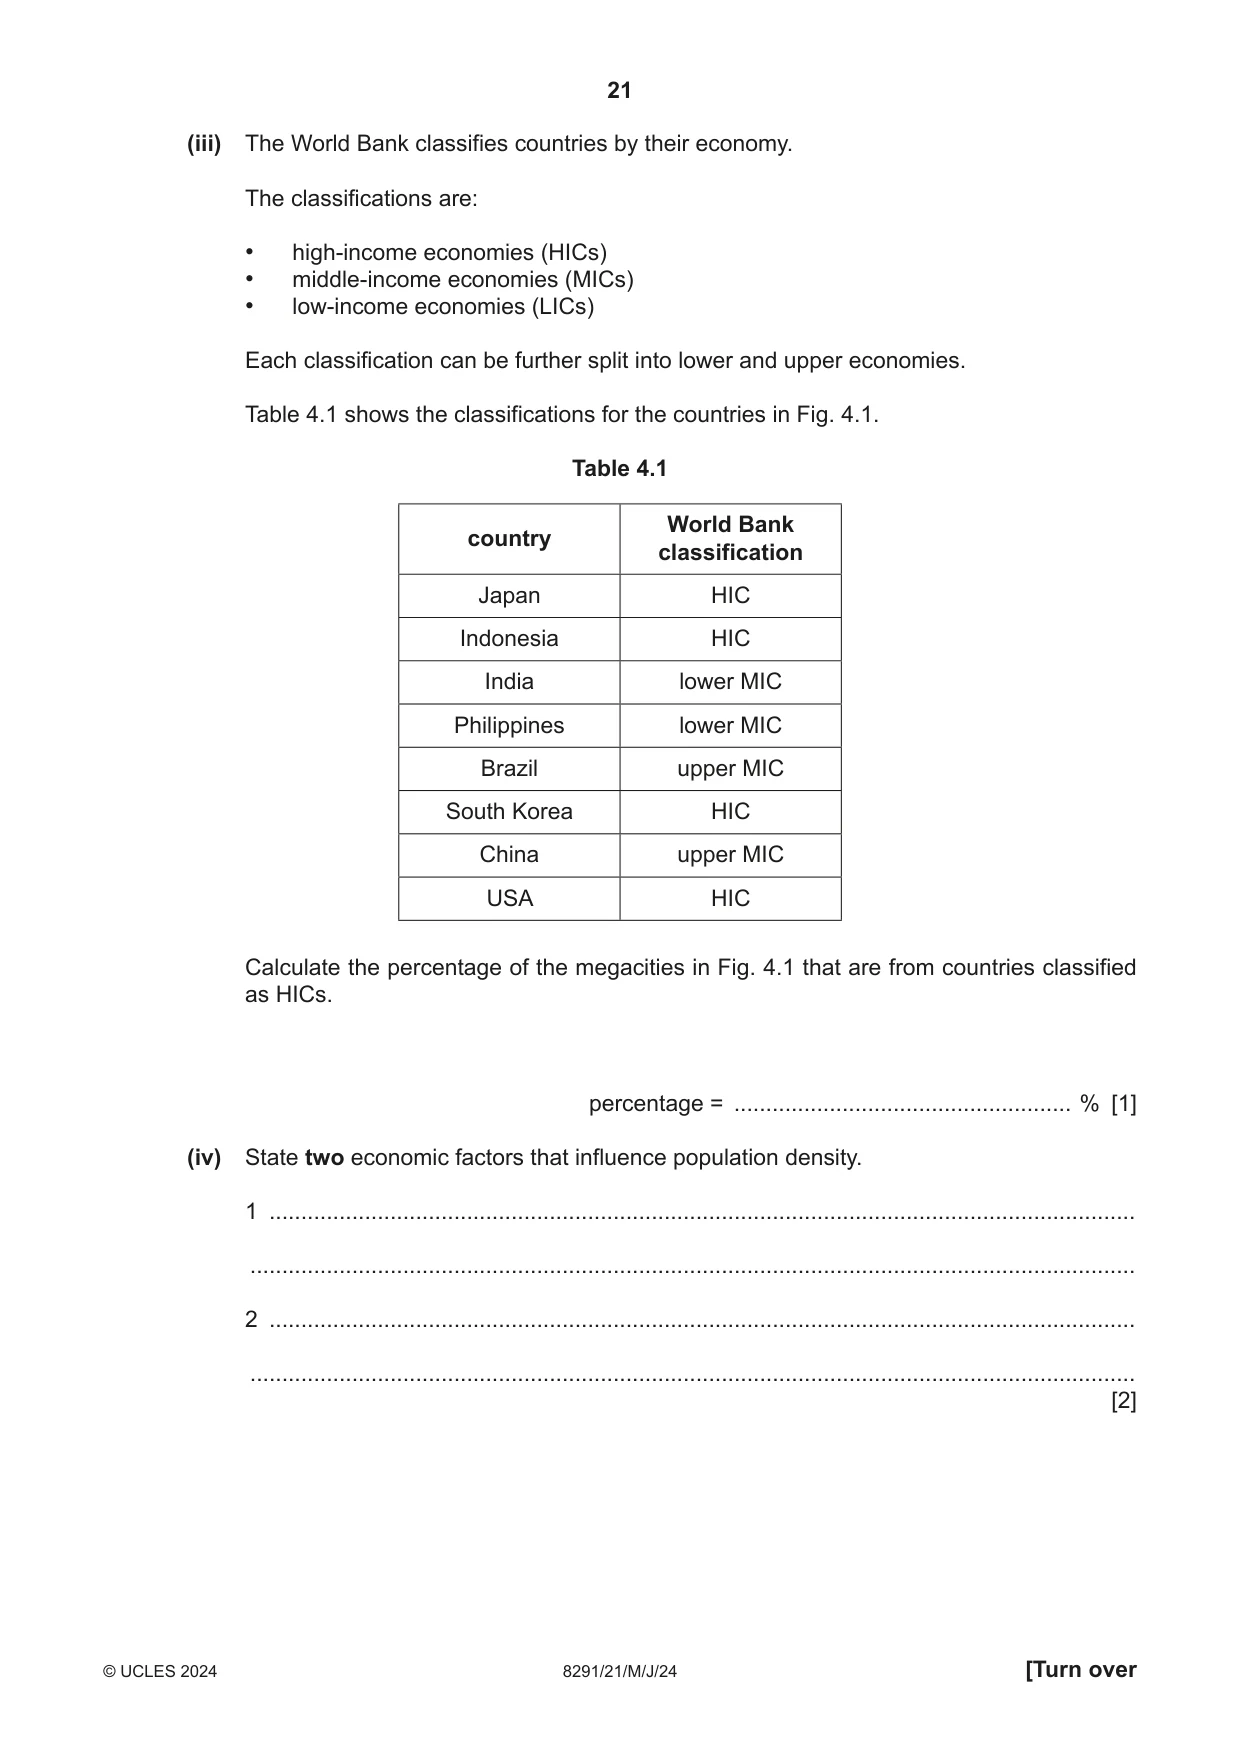
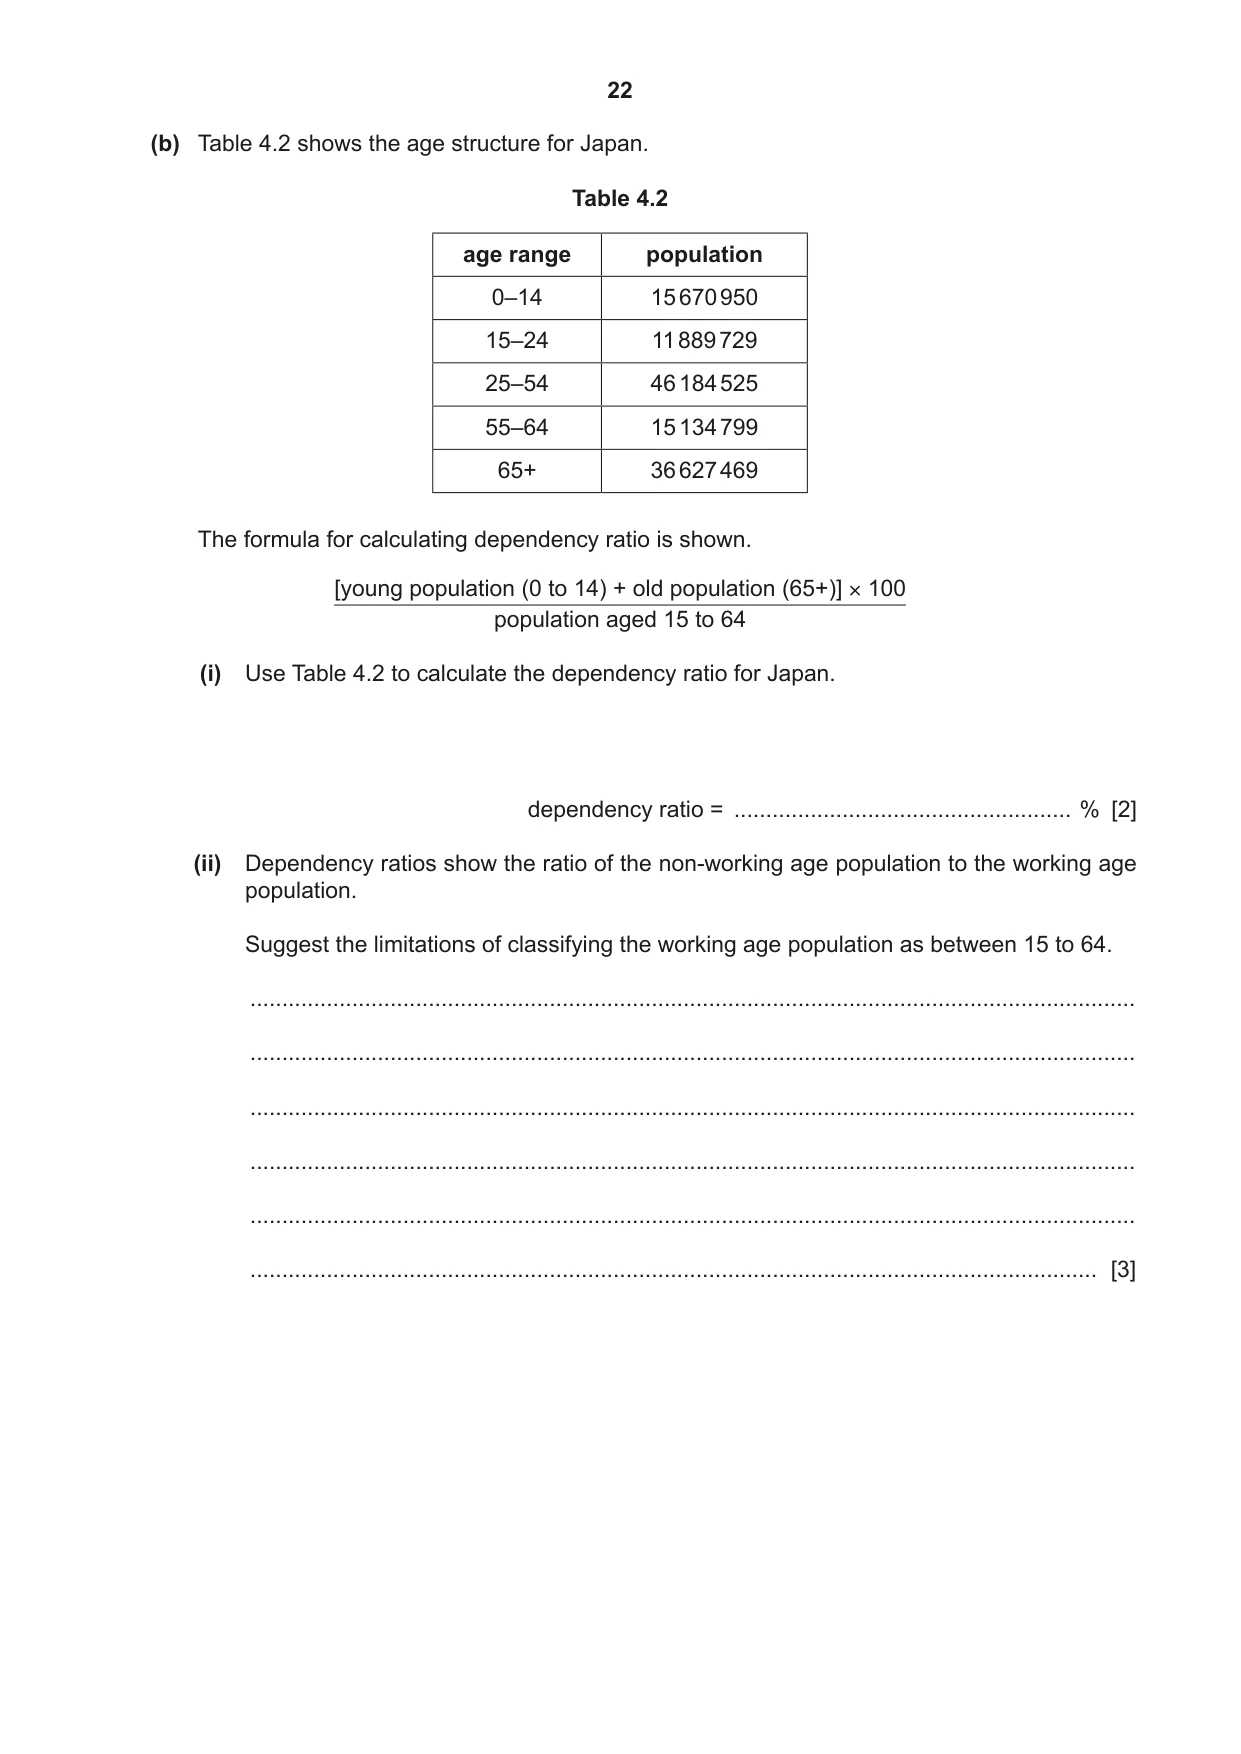
4 A megacity is an urban centre with more than 10 million people. (a) The bar chart in Fig. 4.1 shows countries with large megacities in 2021. Tokyo-Yokohama, Japan Jakarta, Indonesia Delhi, India Manila, megacity Philippines São Paulo, Brazil Seoul, South Korea Shanghai, China New York, USA 20 000 30 000 40 000 population / 1000 Fig. 4.1 (i) Complete the bar chart in Fig. 4.1 to show a population of New York of 21 000 000. [2] (ii) Tokyo-Yokohama has an area of 2194 km2. Calculate the population density of Tokyo-Yokohama. Give your answer to the nearest whole number. population density = ..................................... people / km2 [3] (iii) The World Bank classifies countries by their economy. The classifications are: • high-income economies (HICs) • middle-income economies (MICs) • low-income economies (LICs) Each classification can be further split into lower and upper economies. Table 4.1 shows the classifications for the countries in Fig. 4.1. Table 4.1 World Bank country classification Japan HIC Indonesia HIC India lower MIC Philippines lower MIC Brazil upper MIC South Korea HIC China upper MIC USA HIC Calculate the percentage of the megacities in Fig. 4.1 that are from countries classified as HICs. percentage = ..................................................... % [1] (iv) State two economic factors that influence population density. 1 ........................................................................................................................................ ........................................................................................................................................... 2 ........................................................................................................................................ ........................................................................................................................................... [2] (b) Table 4.2 shows the age structure for Japan. Table 4.2 age range population 0–14 15 670 950 15–24 11 889 729 25–54 46 184 525 55–64 15 134 799 65+ 36 627 469 The formula for calculating dependency ratio is shown. [young population (0 to 14) + old population (65+)] × 100 population aged 15 to 64 (i) Use Table 4.2 to calculate the dependency ratio for Japan. dependency ratio = ..................................................... % [2] (ii) Dependency ratios show the ratio of the non-working age population to the working age population. Suggest the limitations of classifying the working age population as between 15 to 64. ........................................................................................................................................... ........................................................................................................................................... ........................................................................................................................................... ........................................................................................................................................... ........................................................................................................................................... ..................................................................................................................................... [3]
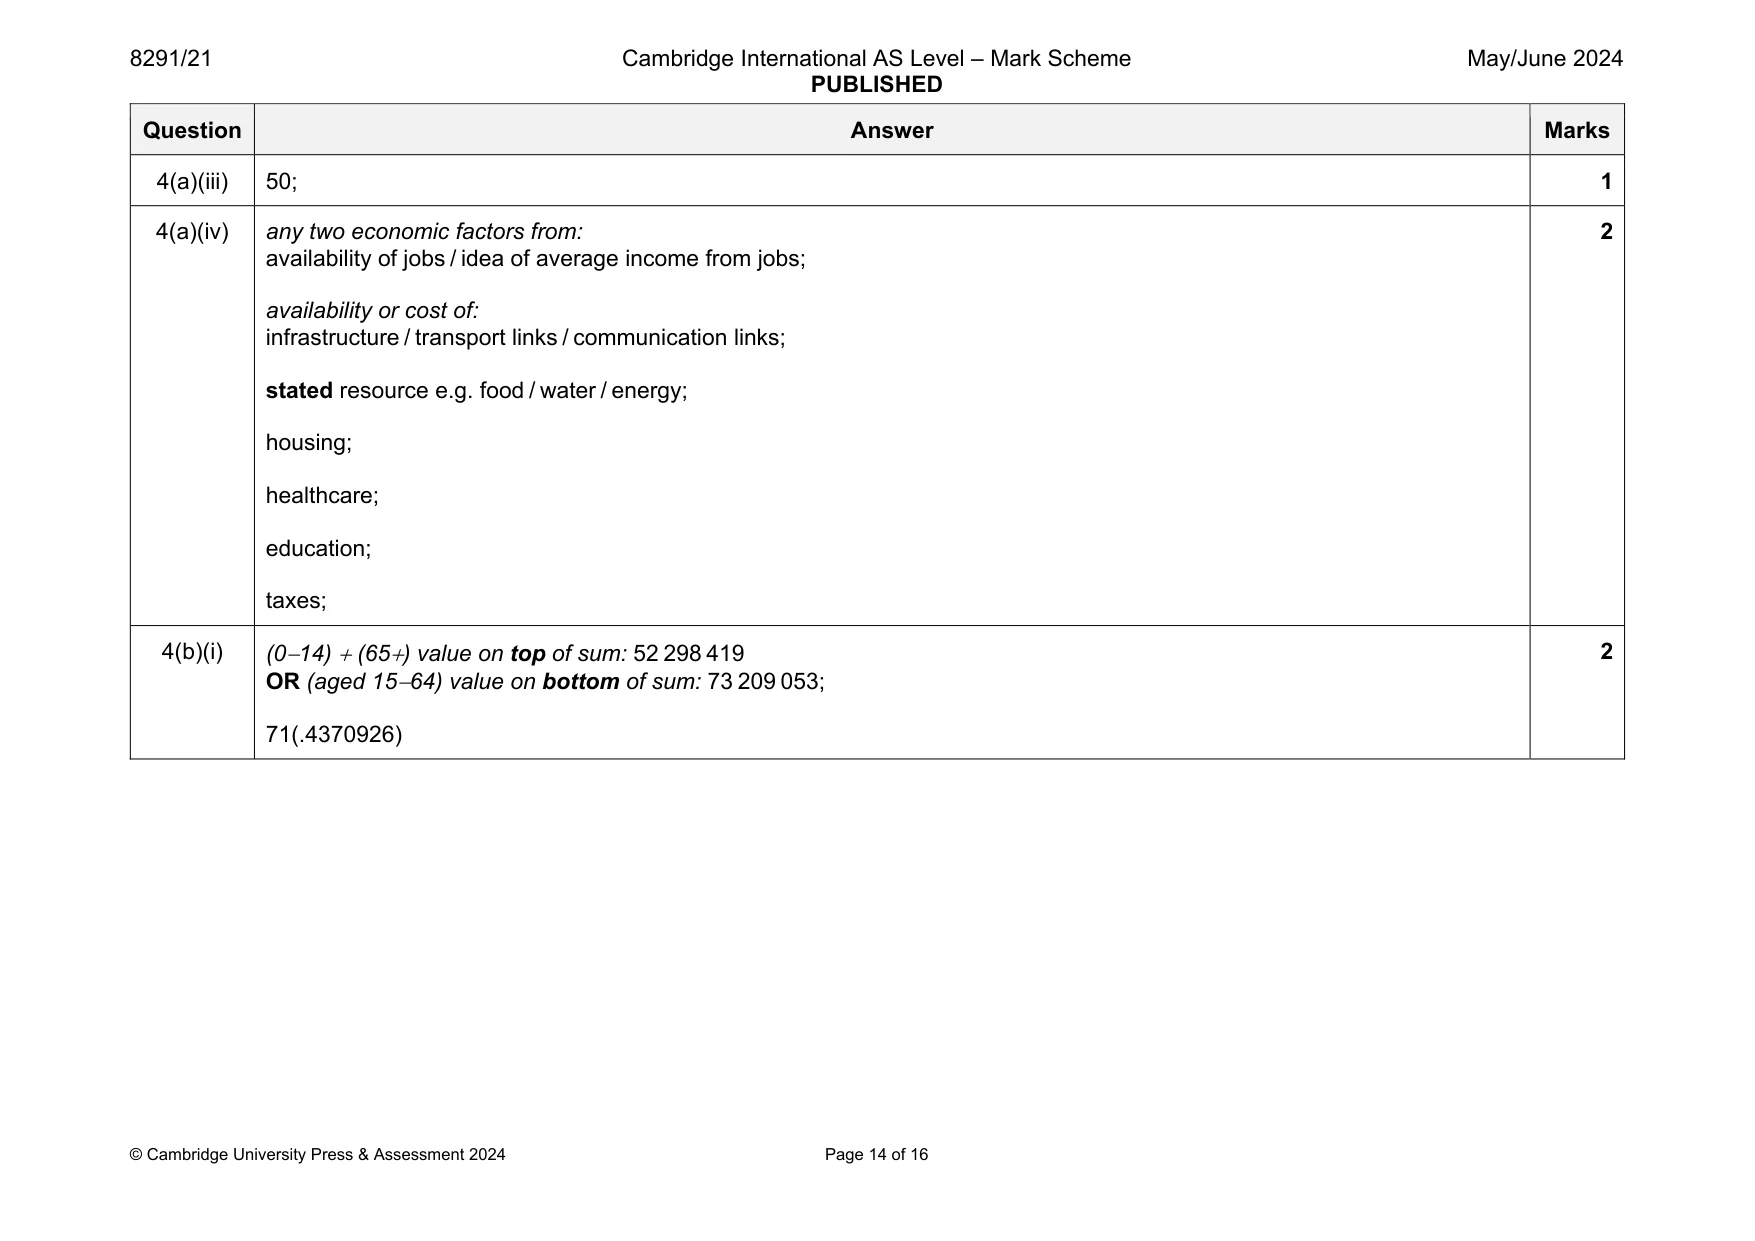
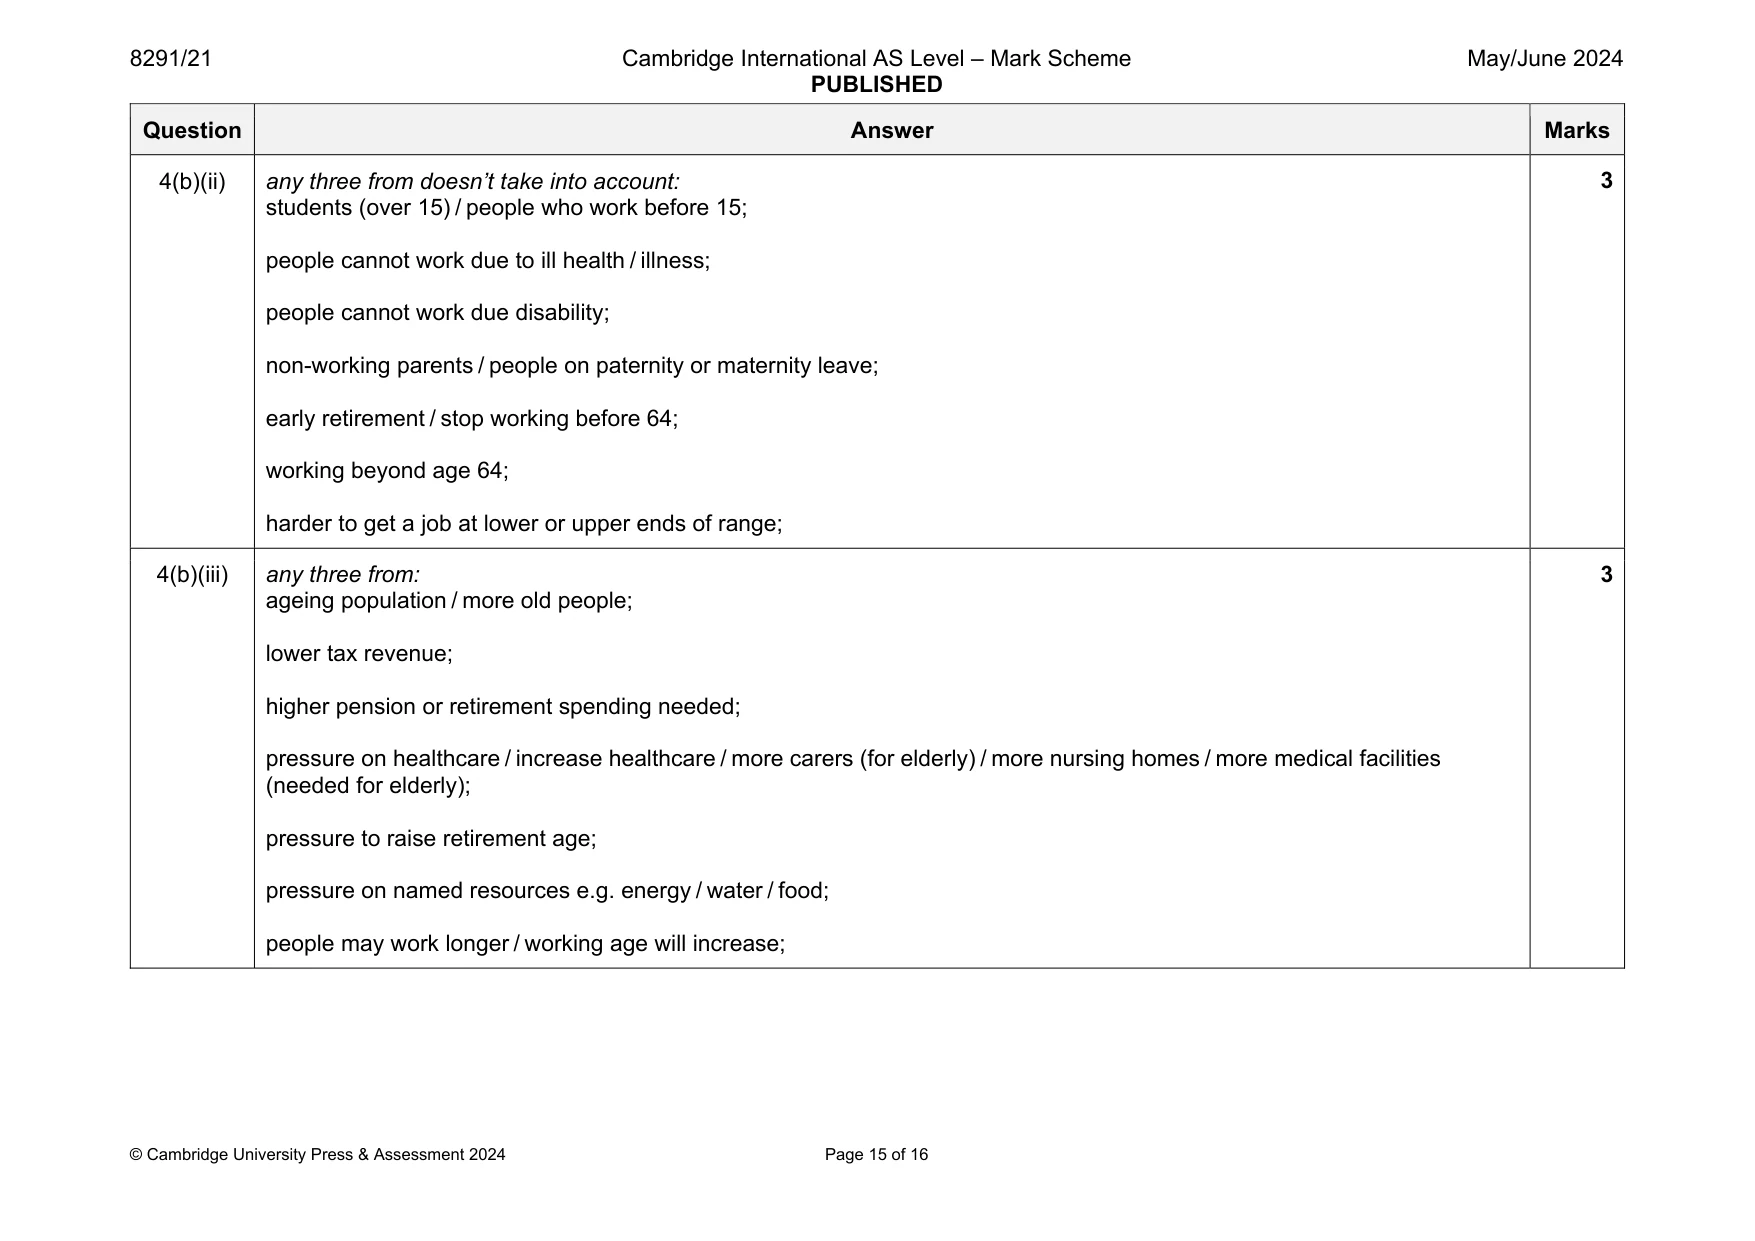
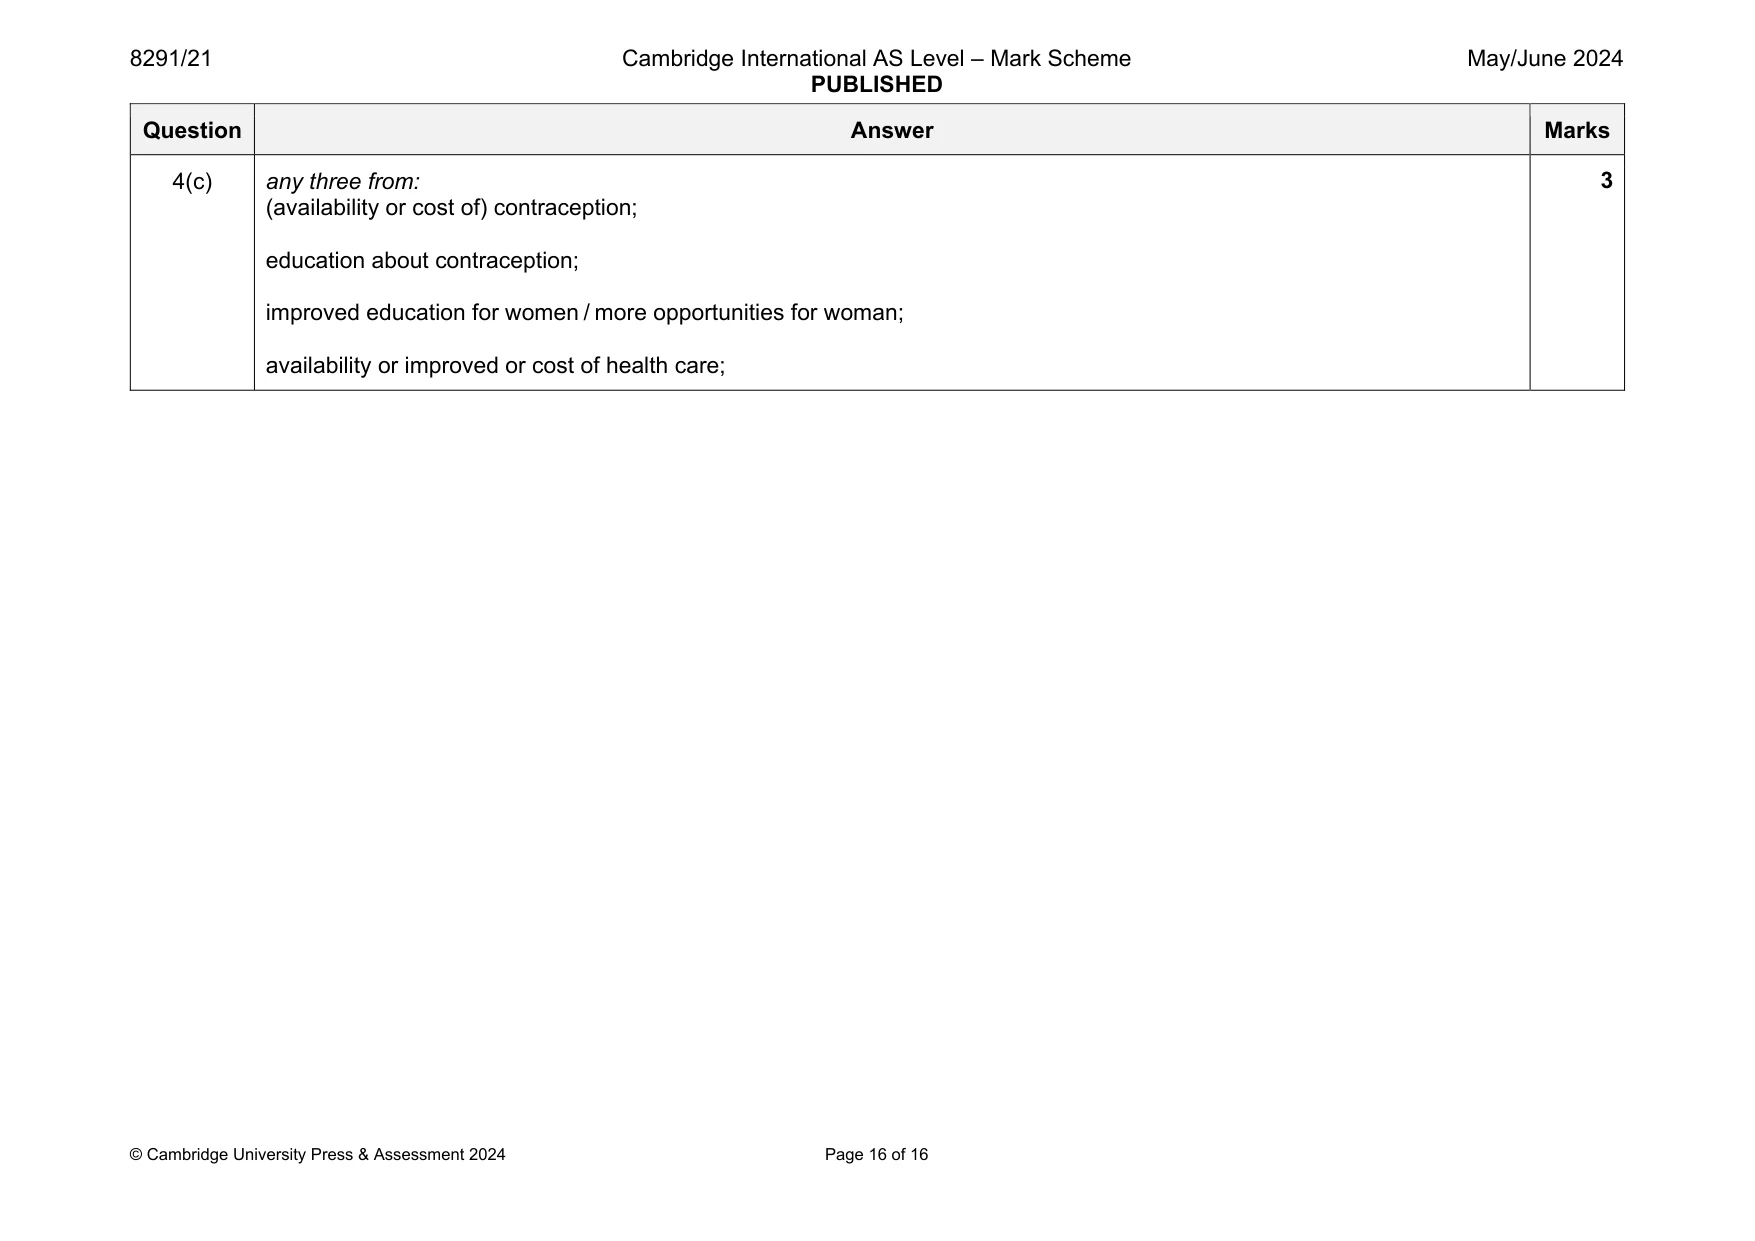
Mark scheme: 4(a)(i) correct plot at 21 000 000; bar same width AND not touching other bars AND same distance between bars; 2 4(a)(ii) correct reading from bar chart / 39 200 000; reading 2194; 17 867; 3 Question Answer Marks 4(a)(iii) 50; 1 4(a)(iv) any two economic factors from: availability of jobs / idea of average income from jobs; availability or cost of: infrastructure / transport links / communication links; stated resource e.g. food / water / energy; housing; healthcare; education; taxes; 2 4(b)(i) (014) (65) value on top of sum: 52 298 419 OR (aged 1564) value on bottom of sum: 73 209 053; 71(.4370926) 2 Question Answer Marks 4(b)(ii) any three from doesn’t take into account: students (over 15) / people who work before 15; people cannot work due to ill health / illness; people cannot work due disability; non-working parents / people on paternity or maternity leave; early retirement / stop working before 64; working beyond age 64; harder to get a job at lower or upper ends of range; 3 4(b)(iii) any three from: ageing population / more old people; lower tax revenue; higher pension or retirement spending needed; pressure on healthcare / increase healthcare / more carers (for elderly) / more nursing homes / more medical facilities (needed for elderly); pressure to raise retirement age; pressure on named resources e.g. energy / water / food; people may work longer / working age will increase; 3 Question Answer Marks 4(c) any three from: (availability or cost of) contraception; education about contraception; improved education for women / more opportunities for woman; availability or improved or cost of health care; 3
What was in this paper
The subtopics covered by these 4 questions, and how many questions each got. Open one in a new tab to see every Cambridge question on it.
What you needed in this session
Cambridge’s own grade thresholds for 2024 May/June, Paper 2 · Variant 1. A higher threshold means an easier paper — the bar moves with how the cohort did.