Cambridge A Level Environmental Management (AS only) 8291 — 2020 May/June Paper 2 · Variant 3
8291/23/M/J/20 · 5 questions · 160 marks · ≈180 min
The question paper and its mark scheme, free to read here and free to download. This is Cambridge’s own paper, exactly as it was sat.
Question paper12 pages

Mark scheme16 pages
Answers below. Sit the paper first if you are practising.
Questions as text
Q1 · Aerial views of the Theewaterskloof Dam and Reservoir near Cape Town, South Africa taken…
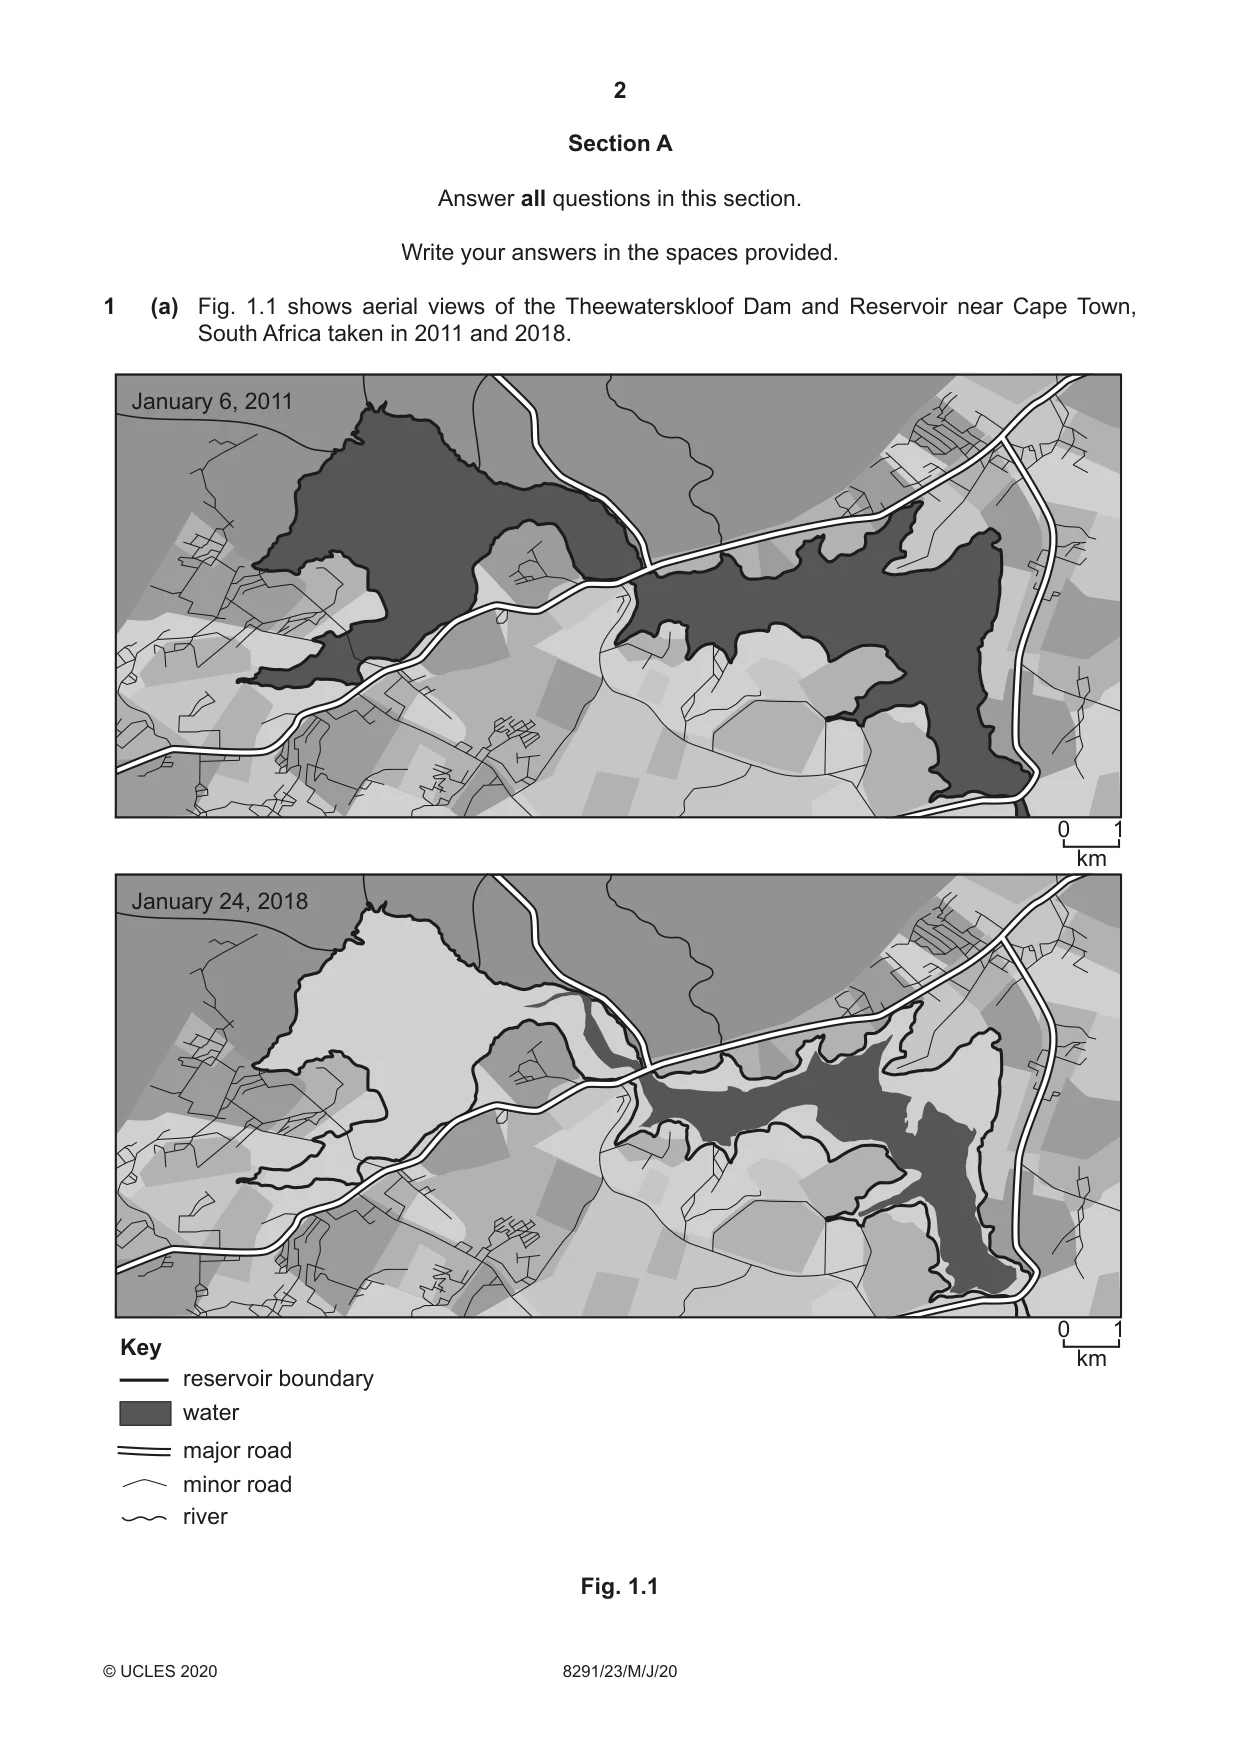
1 (a) Fig. 1.1 shows aerial views of the Theewaterskloof Dam and Reservoir near Cape Town, South Africa taken in 2011 and 2018. January 6, 2011 0 1 km January 24, 2018 0 1 Key km reservoir boundary water major road minor road river Fig. 1.1 (i) Describe changes to the Theewaterskloof Dam and Reservoir shown in Fig. 1.1 between January 2011 and January 2018. ........................................................................................................................................... ........................................................................................................................................... ........................................................................................................................................... ..................................................................................................................................... [2] (ii) Suggest two causes of the changes to the Theewaterskloof Dam and Reservoir shown in Fig. 1.1. Give reasons for your answer. ........................................................................................................................................... ........................................................................................................................................... ........................................................................................................................................... ........................................................................................................................................... ........................................................................................................................................... ........................................................................................................................................... ........................................................................................................................................... ..................................................................................................................................... [4] (iii) Describe two effects on the local habitats as a result of the changes to the Theewaterskloof Dam and Reservoir shown in Fig. 1.1. ........................................................................................................................................... ........................................................................................................................................... ........................................................................................................................................... ........................................................................................................................................... ........................................................................................................................................... ........................................................................................................................................... ........................................................................................................................................... ..................................................................................................................................... [4] (b) In 2018 Cape Town was close to running out of water. (i) Suggest strategies which the population and the authorities of Cape Town might have used in an attempt to conserve the rapidly diminishing water supply. ........................................................................................................................................... ........................................................................................................................................... ........................................................................................................................................... ........................................................................................................................................... ........................................................................................................................................... ........................................................................................................................................... ........................................................................................................................................... ..................................................................................................................................... [4] (ii) Describe the advantages and disadvantages of building dams to create reservoirs for the supply of water to cities such as Cape Town. advantages ........................................................................................................................ ........................................................................................................................................... ........................................................................................................................................... ........................................................................................................................................... ........................................................................................................................................... ........................................................................................................................................... disadvantages ................................................................................................................... ........................................................................................................................................... ........................................................................................................................................... ........................................................................................................................................... ........................................................................................................................................... ........................................................................................................................................... [6] [Total: 20]
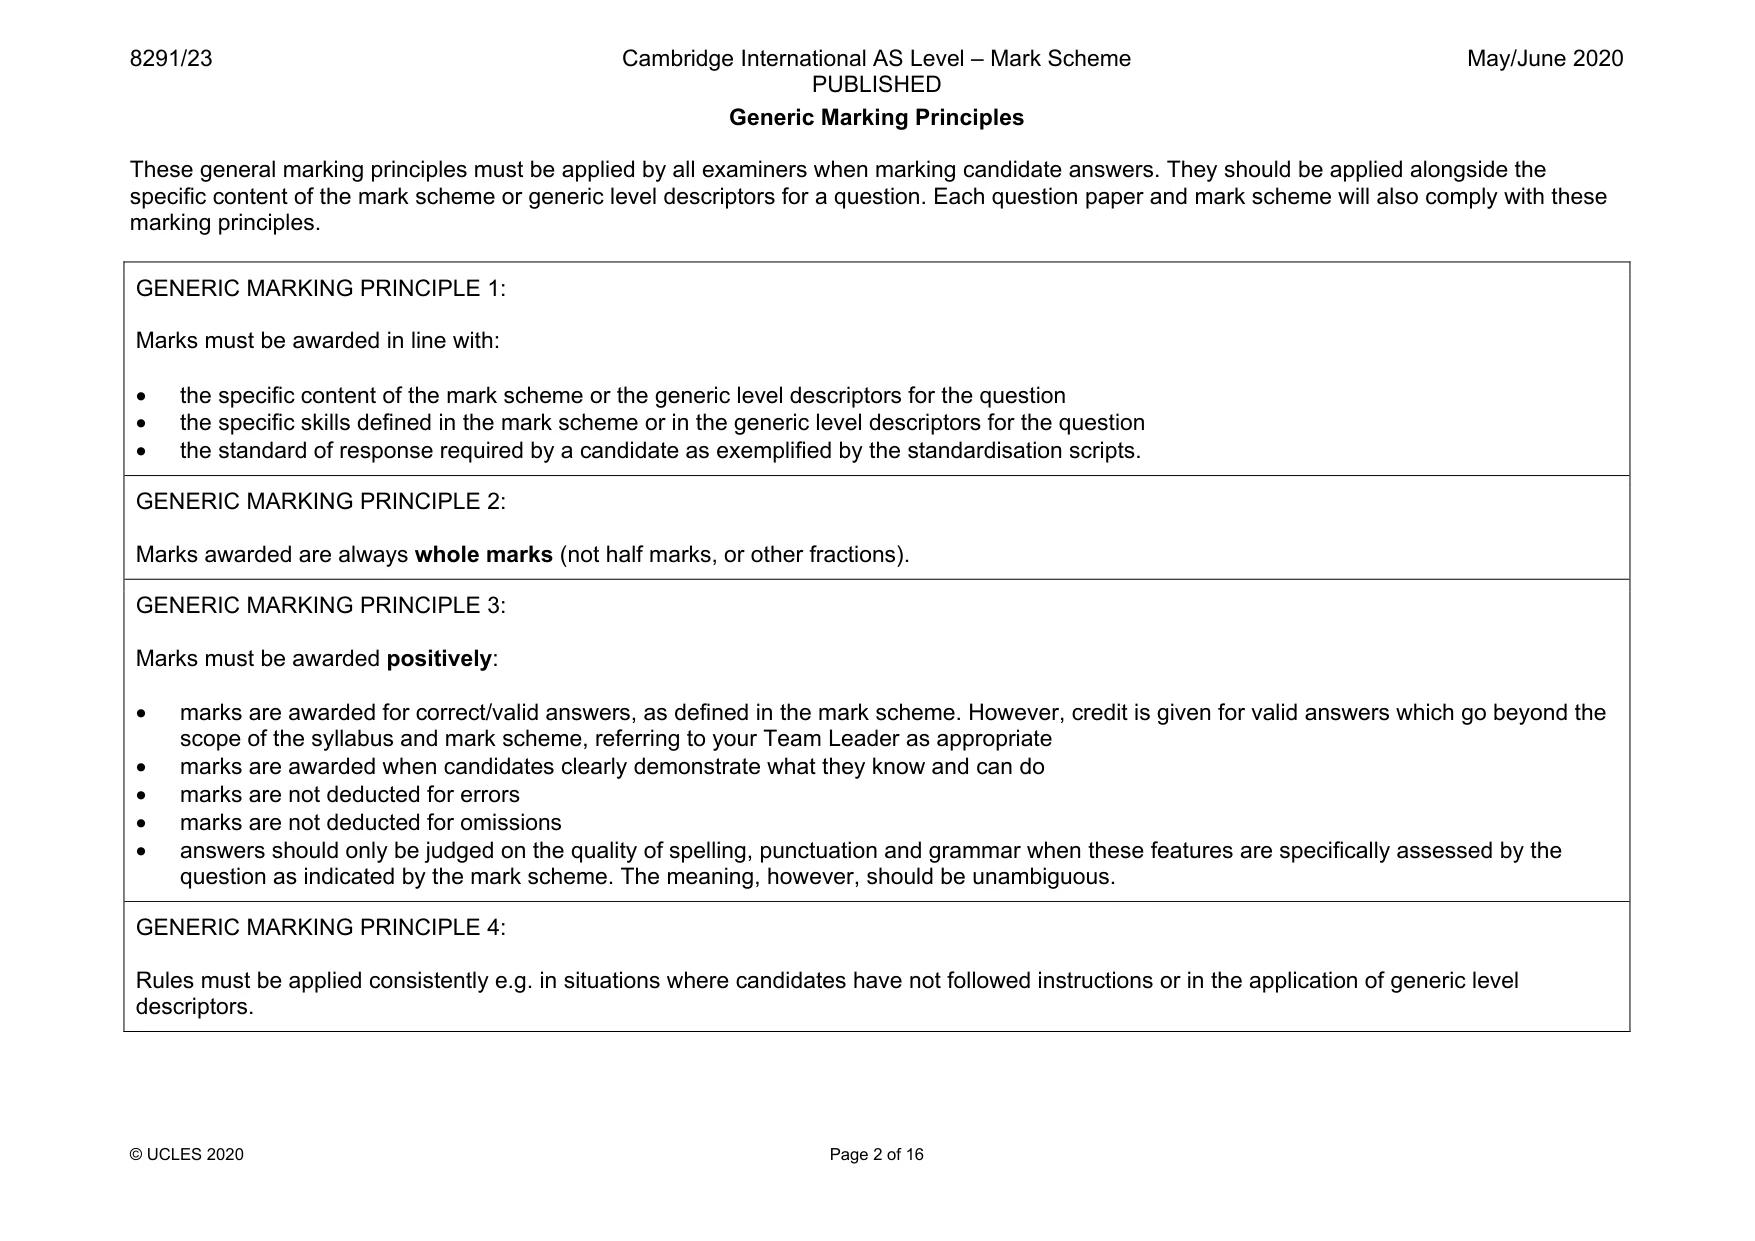
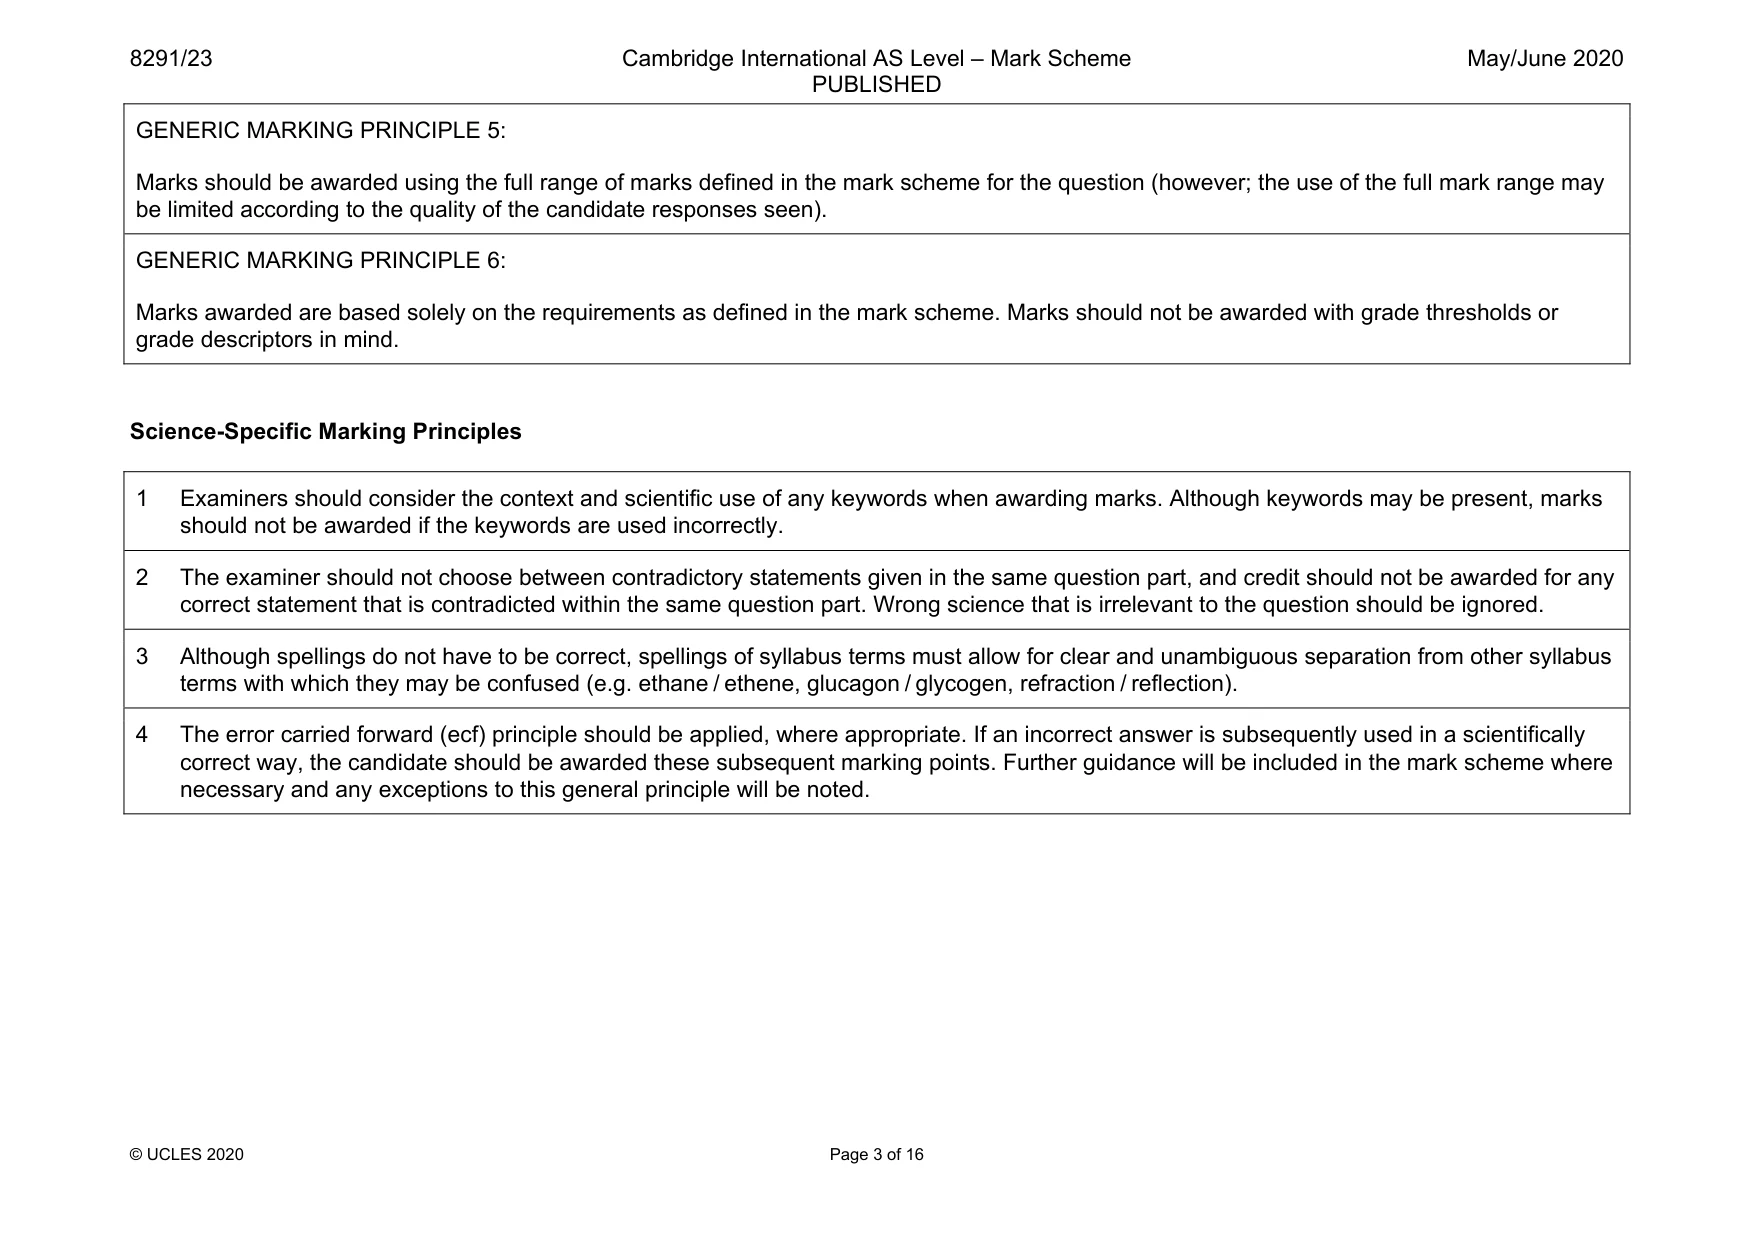
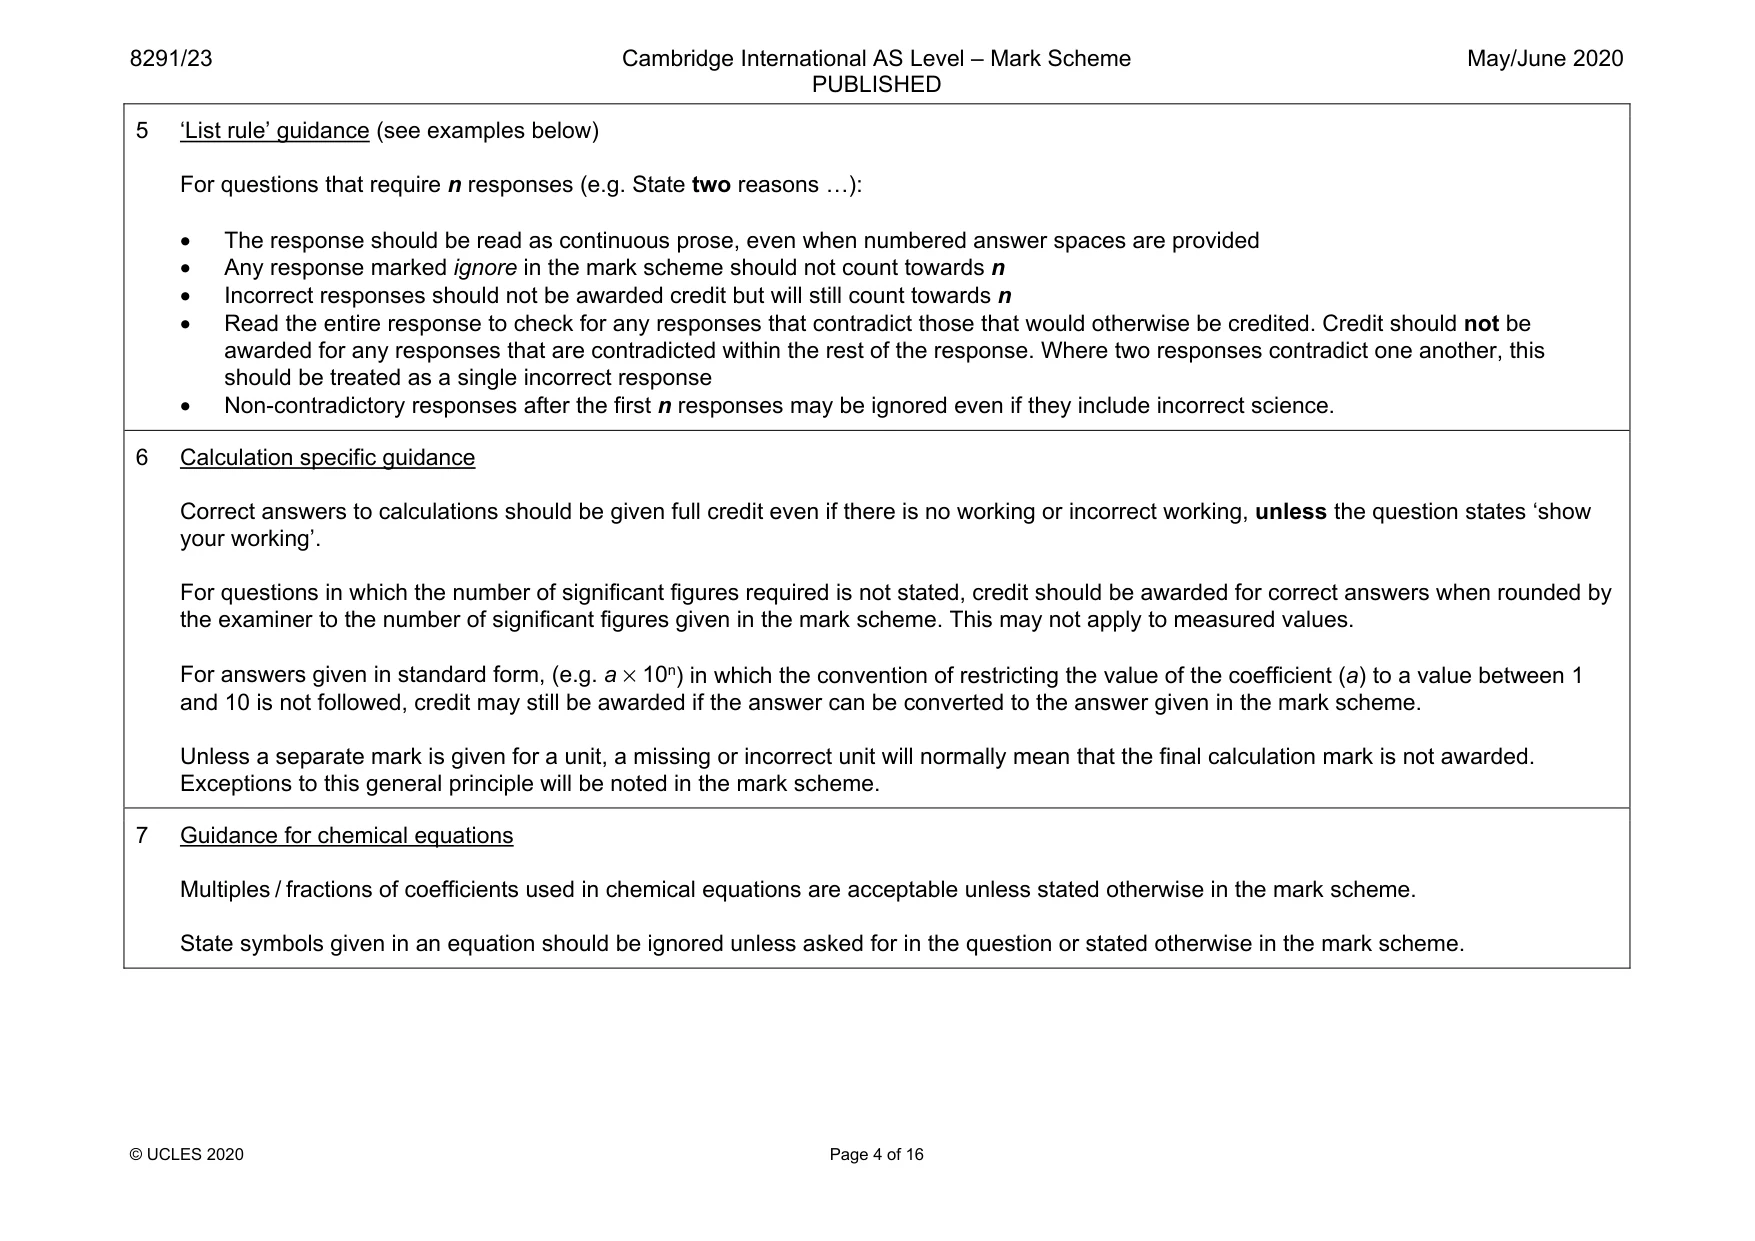
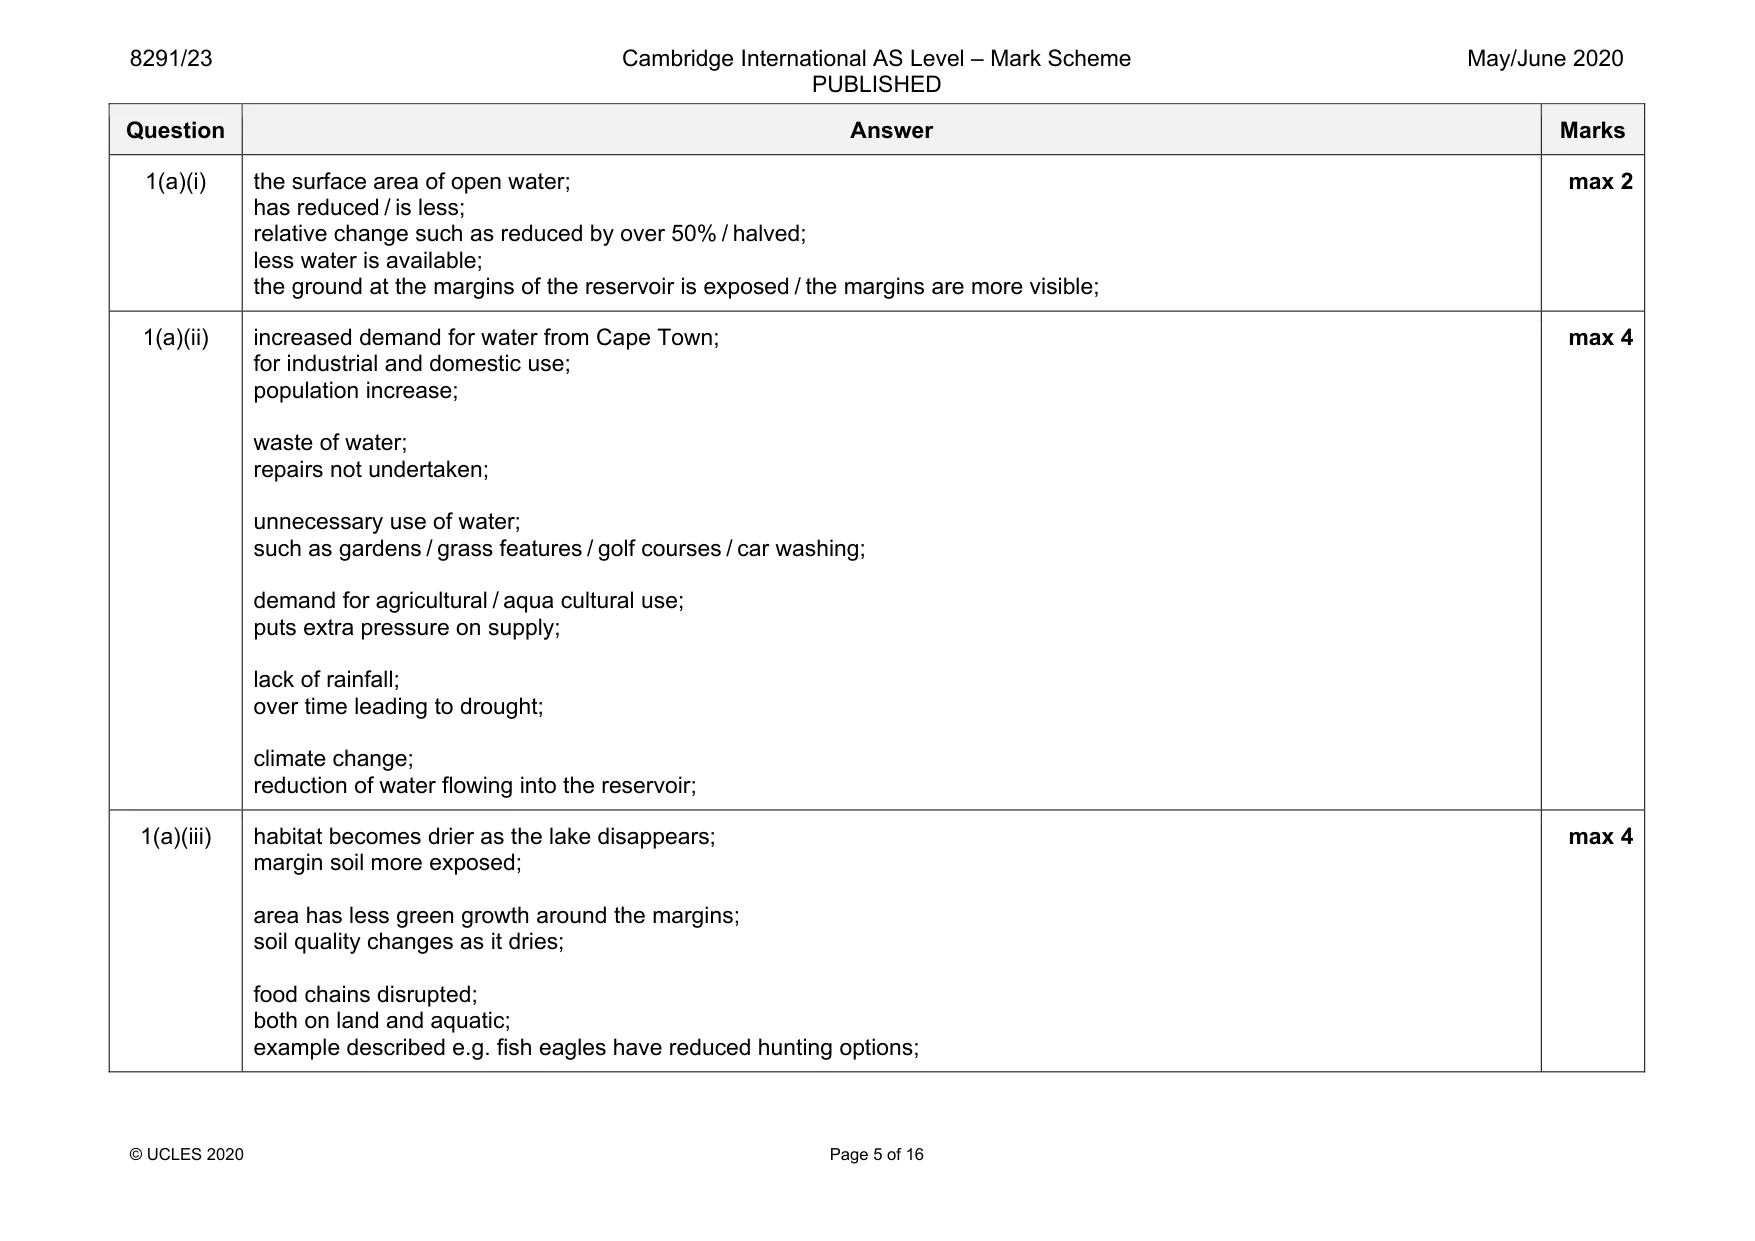
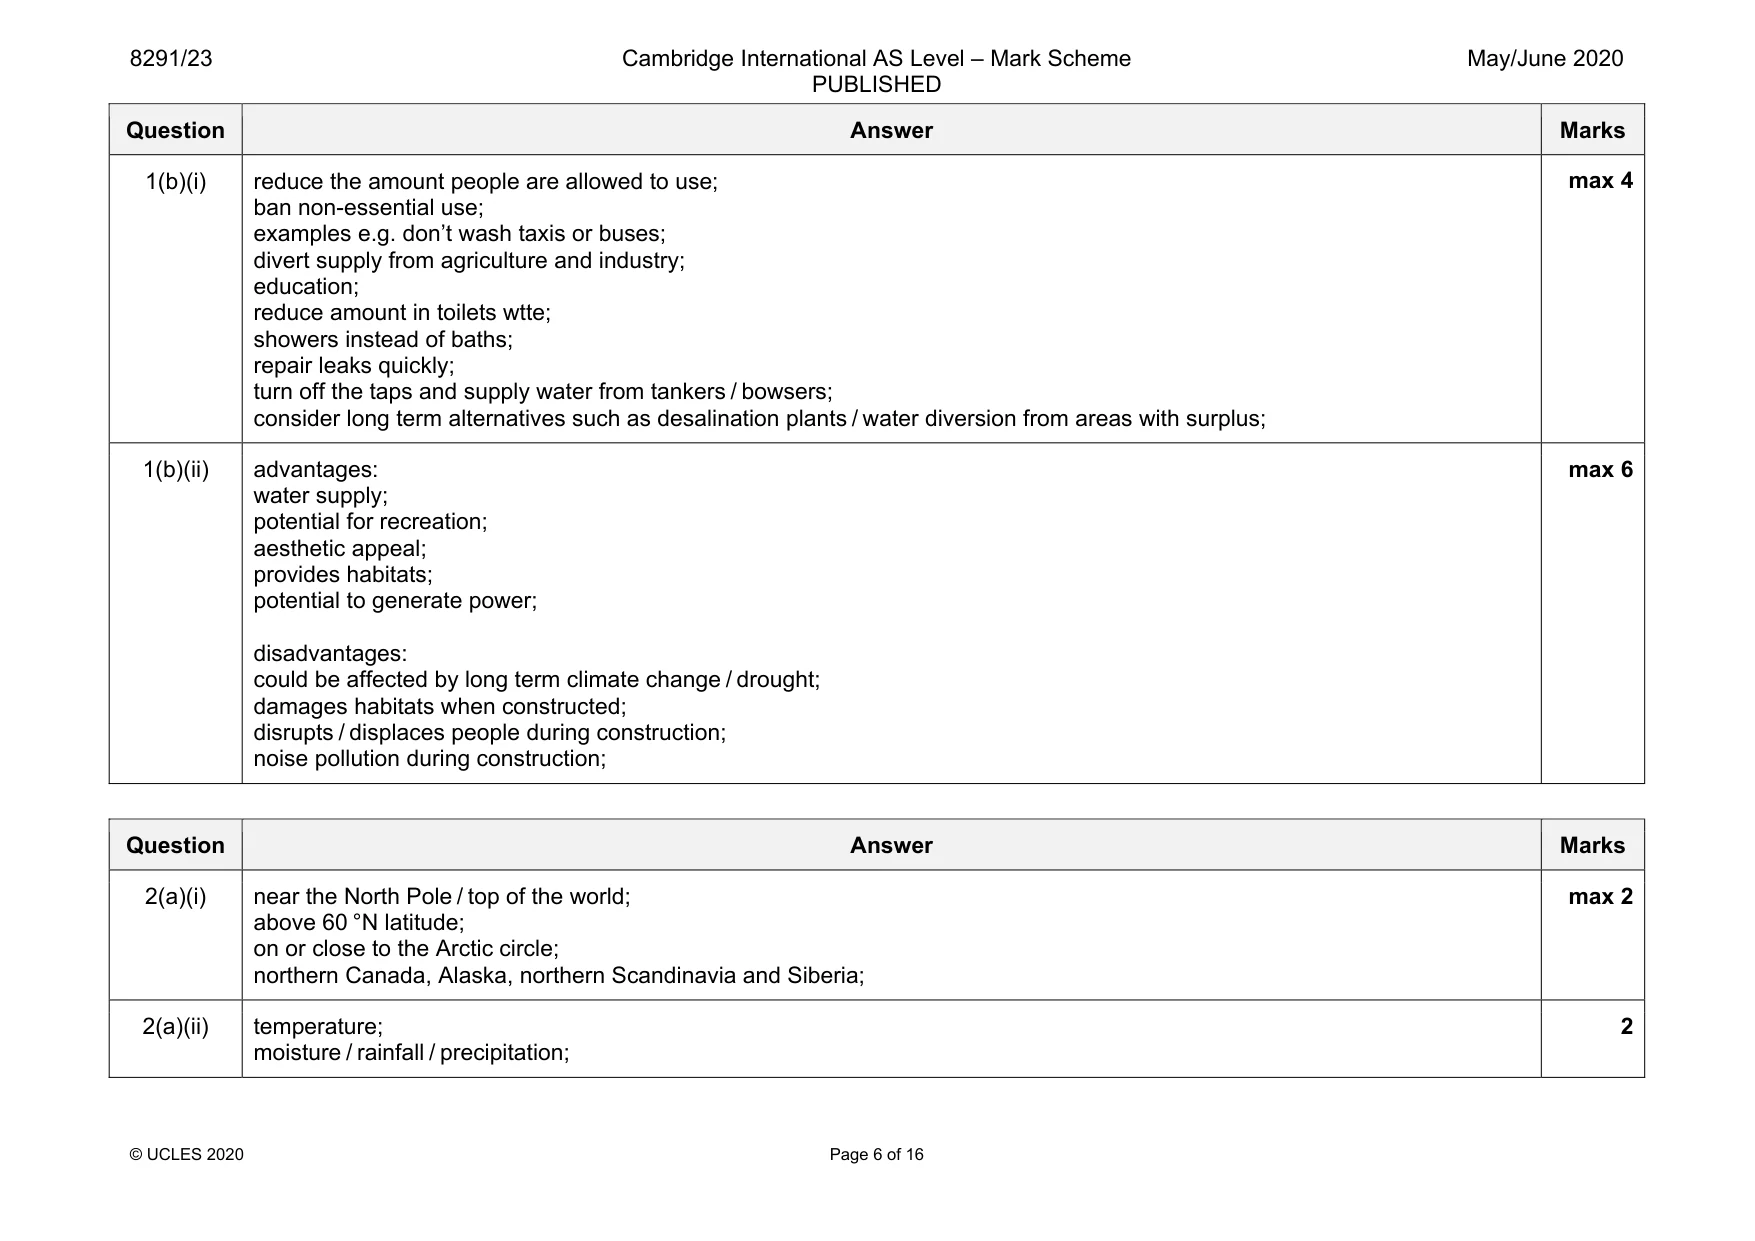
Mark scheme: 1(a)(i) the surface area of open water; has reduced / is less; relative change such as reduced by over 50% / halved; less water is available; the ground at the margins of the reservoir is exposed / the margins are more visible; max 2 1(a)(ii) increased demand for water from Cape Town; for industrial and domestic use; population increase; waste of water; repairs not undertaken; unnecessary use of water; such as gardens / grass features / golf courses / car washing; demand for agricultural / aqua cultural use; puts extra pressure on supply; lack of rainfall; over time leading to drought; climate change; reduction of water flowing into the reservoir; max 4 1(a)(iii) habitat becomes drier as the lake disappears; margin soil more exposed; area has less green growth around the margins; soil quality changes as it dries; food chains disrupted; both on land and aquatic; example described e.g. fish eagles have reduced hunting options; max 4 Question Answer Marks 1(b)(i) reduce the amount people are allowed to use; ban non-essential use; examples e.g. don’t wash taxis or buses; divert supply from agriculture and industry; education; reduce amount in toilets wtte; showers instead of baths; repair leaks quickly; turn off the taps and supply water from tankers / bowsers; consider long term alternatives such as desalination plants / water diversion from areas with surplus; max 4 1(b)(ii) advantages: water supply; potential for recreation; aesthetic appeal; provides habitats; potential to generate power; disadvantages: could be affected by long term climate change / drought; damages habitats when constructed; disrupts / displaces people during construction; noise pollution during construction; max 6
Q2 · The distribution of the tundra biome
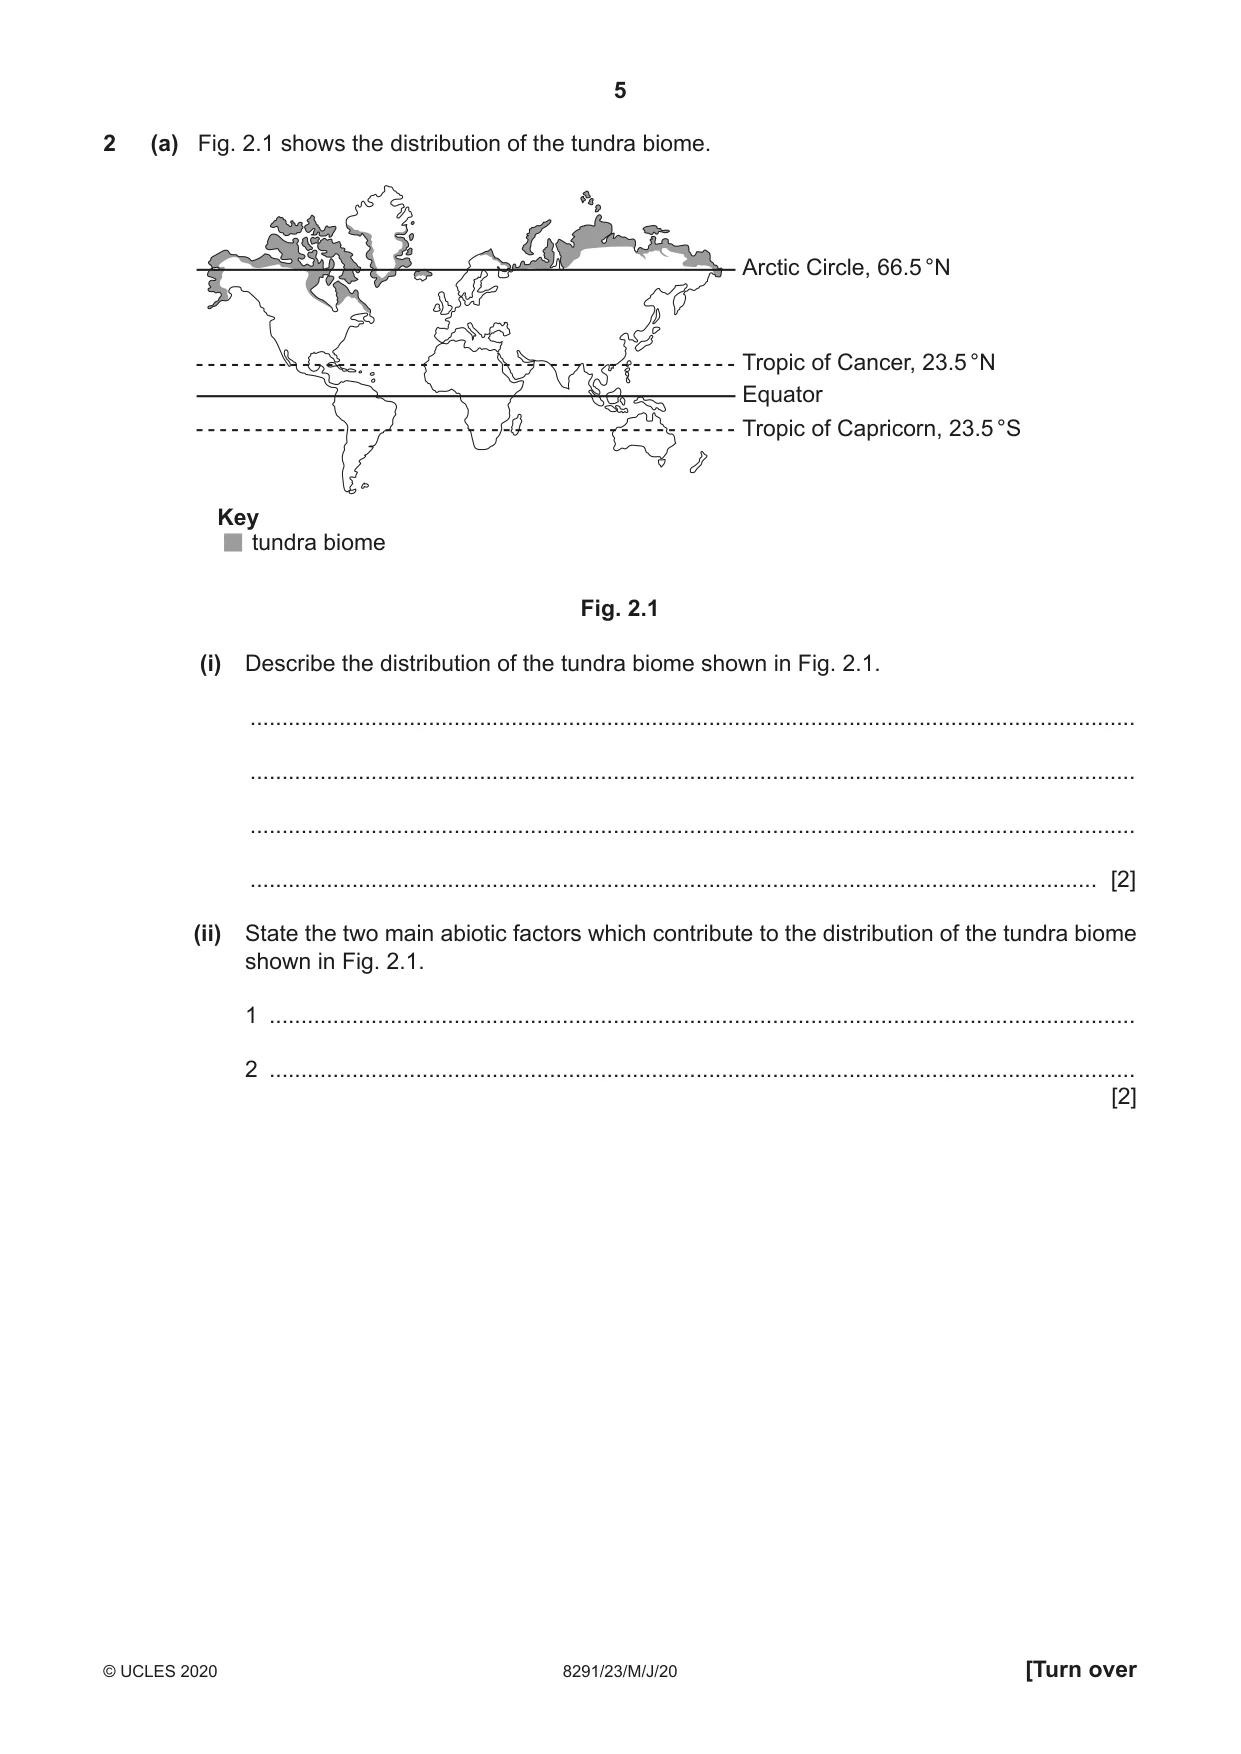
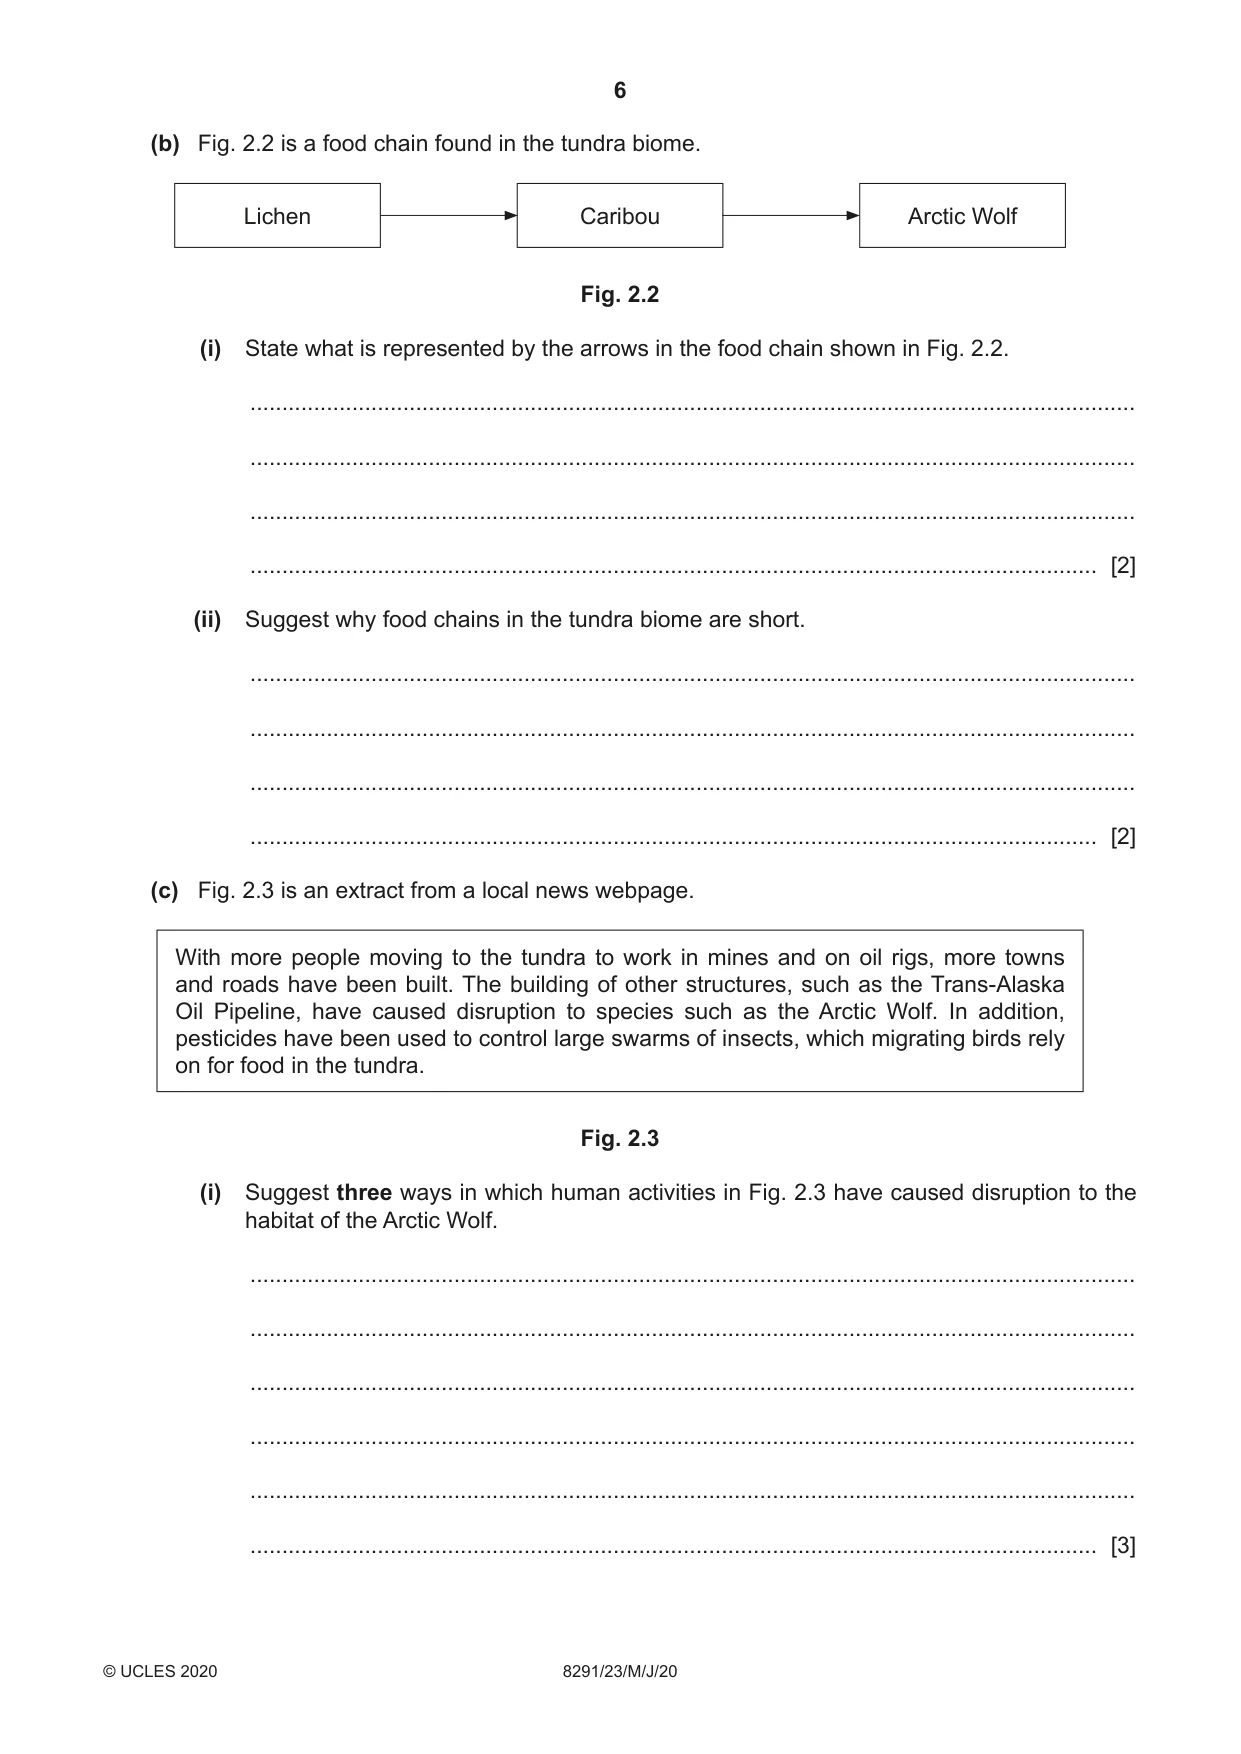
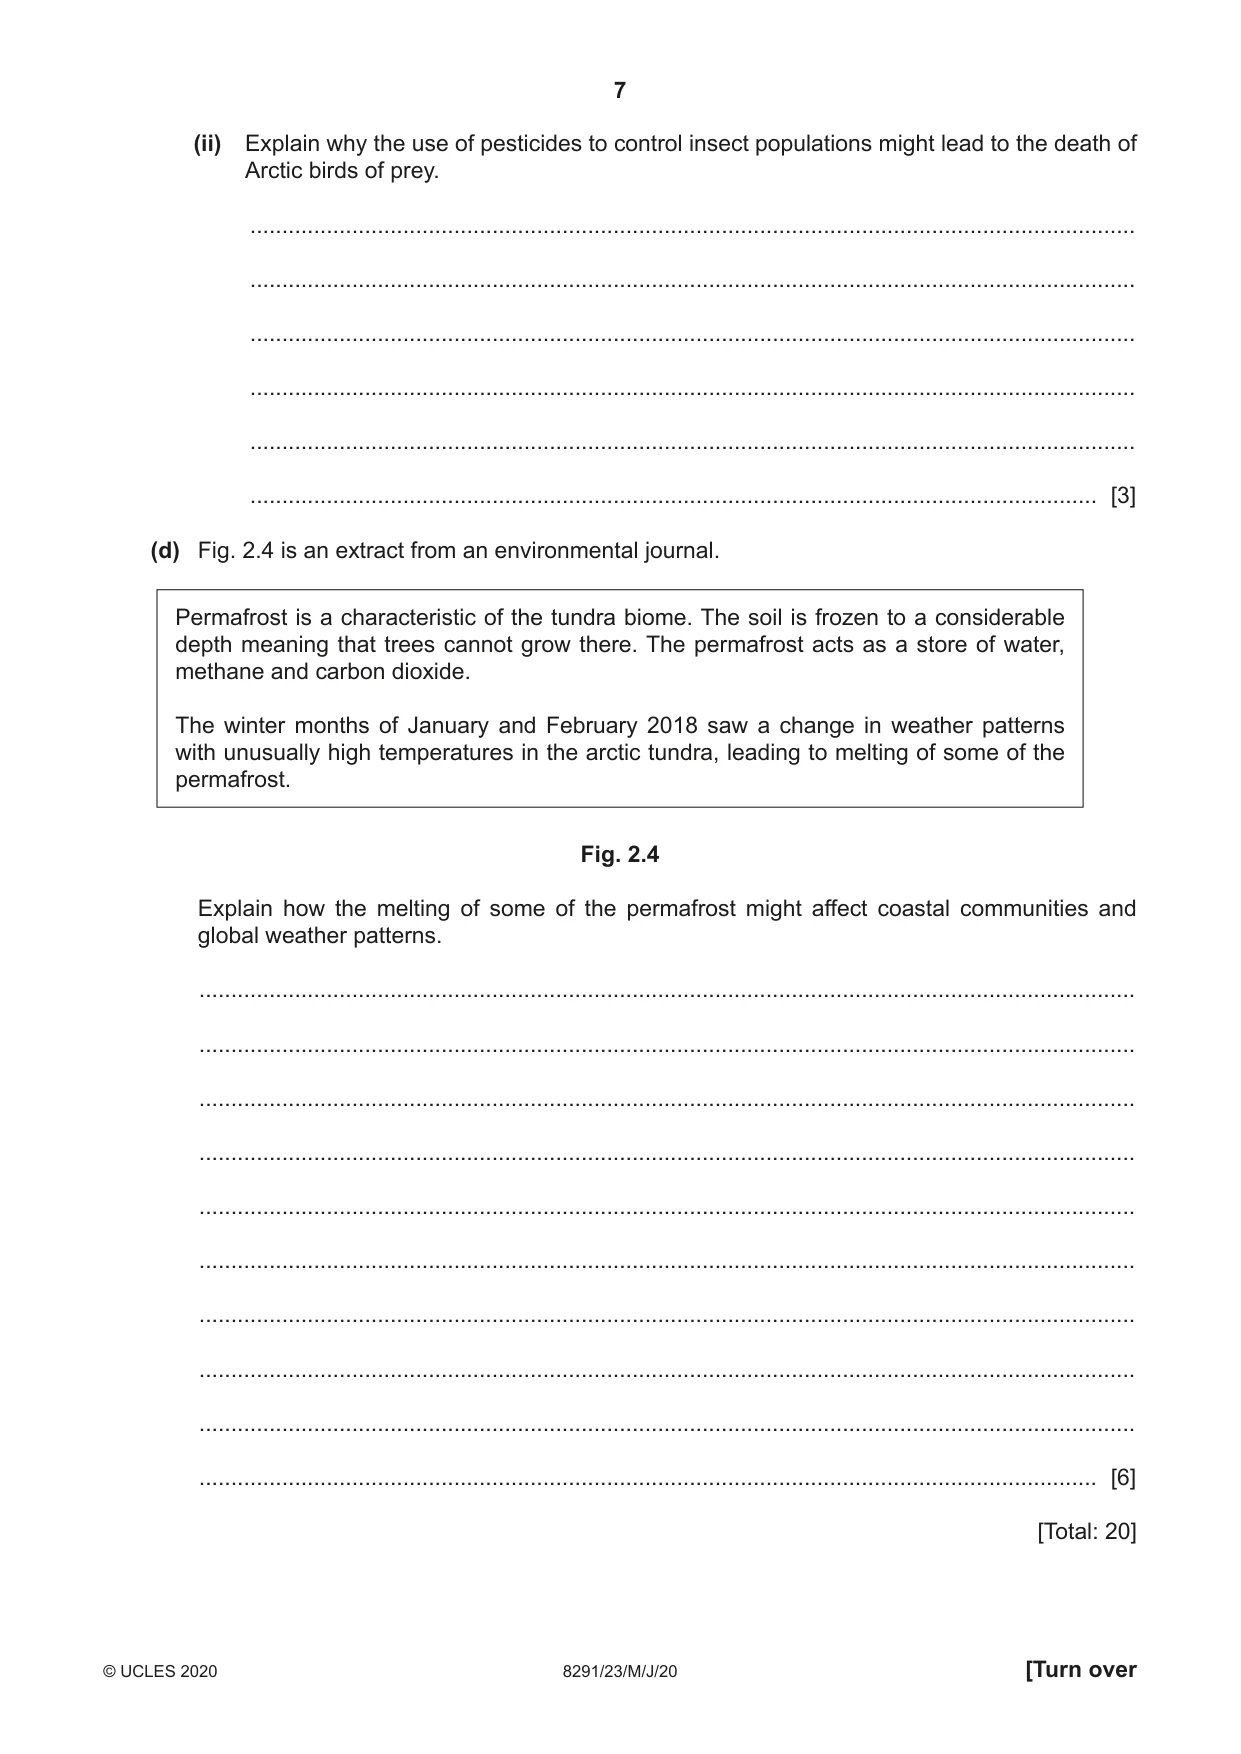
2 (a) Fig. 2.1 shows the distribution of the tundra biome. Arctic Circle, 66.5 °N Tropic of Cancer, 23.5 °N Equator Tropic of Capricorn, 23.5 °S Key tundra biome Fig. 2.1 (i) Describe the distribution of the tundra biome shown in Fig. 2.1. ........................................................................................................................................... ........................................................................................................................................... ........................................................................................................................................... ..................................................................................................................................... [2] (ii) State the two main abiotic factors which contribute to the distribution of the tundra biome shown in Fig. 2.1. 1 ........................................................................................................................................ 2 ........................................................................................................................................ [2] (b) Fig. 2.2 is a food chain found in the tundra biome. Lichen Caribou Arctic Wolf Fig. 2.2 (i) State what is represented by the arrows in the food chain shown in Fig. 2.2. ........................................................................................................................................... ........................................................................................................................................... ........................................................................................................................................... ..................................................................................................................................... [2] (ii) Suggest why food chains in the tundra biome are short. ........................................................................................................................................... ........................................................................................................................................... ........................................................................................................................................... ..................................................................................................................................... [2] (c) Fig. 2.3 is an extract from a local news webpage. With more people moving to the tundra to work in mines and on oil rigs, more towns and roads have been built. The building of other structures, such as the Trans-Alaska Oil Pipeline, have caused disruption to species such as the Arctic Wolf. In addition, pesticides have been used to control large swarms of insects, which migrating birds rely on for food in the tundra. Fig. 2.3 (i) Suggest three ways in which human activities in Fig. 2.3 have caused disruption to the habitat of the Arctic Wolf. ........................................................................................................................................... ........................................................................................................................................... ........................................................................................................................................... ........................................................................................................................................... ........................................................................................................................................... ..................................................................................................................................... [3] (ii) Explain why the use of pesticides to control insect populations might lead to the death of Arctic birds of prey. ........................................................................................................................................... ........................................................................................................................................... ........................................................................................................................................... ........................................................................................................................................... ........................................................................................................................................... ..................................................................................................................................... [3] (d) Fig. 2.4 is an extract from an environmental journal. Permafrost is a characteristic of the tundra biome. The soil is frozen to a considerable depth meaning that trees cannot grow there. The permafrost acts as a store of water, methane and carbon dioxide. The winter months of January and February 2018 saw a change in weather patterns with unusually high temperatures in the arctic tundra, leading to melting of some of the permafrost. Fig. 2.4 Explain how the melting of some of the permafrost might affect coastal communities and global weather patterns. ................................................................................................................................................... ................................................................................................................................................... ................................................................................................................................................... ................................................................................................................................................... ................................................................................................................................................... ................................................................................................................................................... ................................................................................................................................................... ................................................................................................................................................... ................................................................................................................................................... ............................................................................................................................................. [6] [Total: 20]
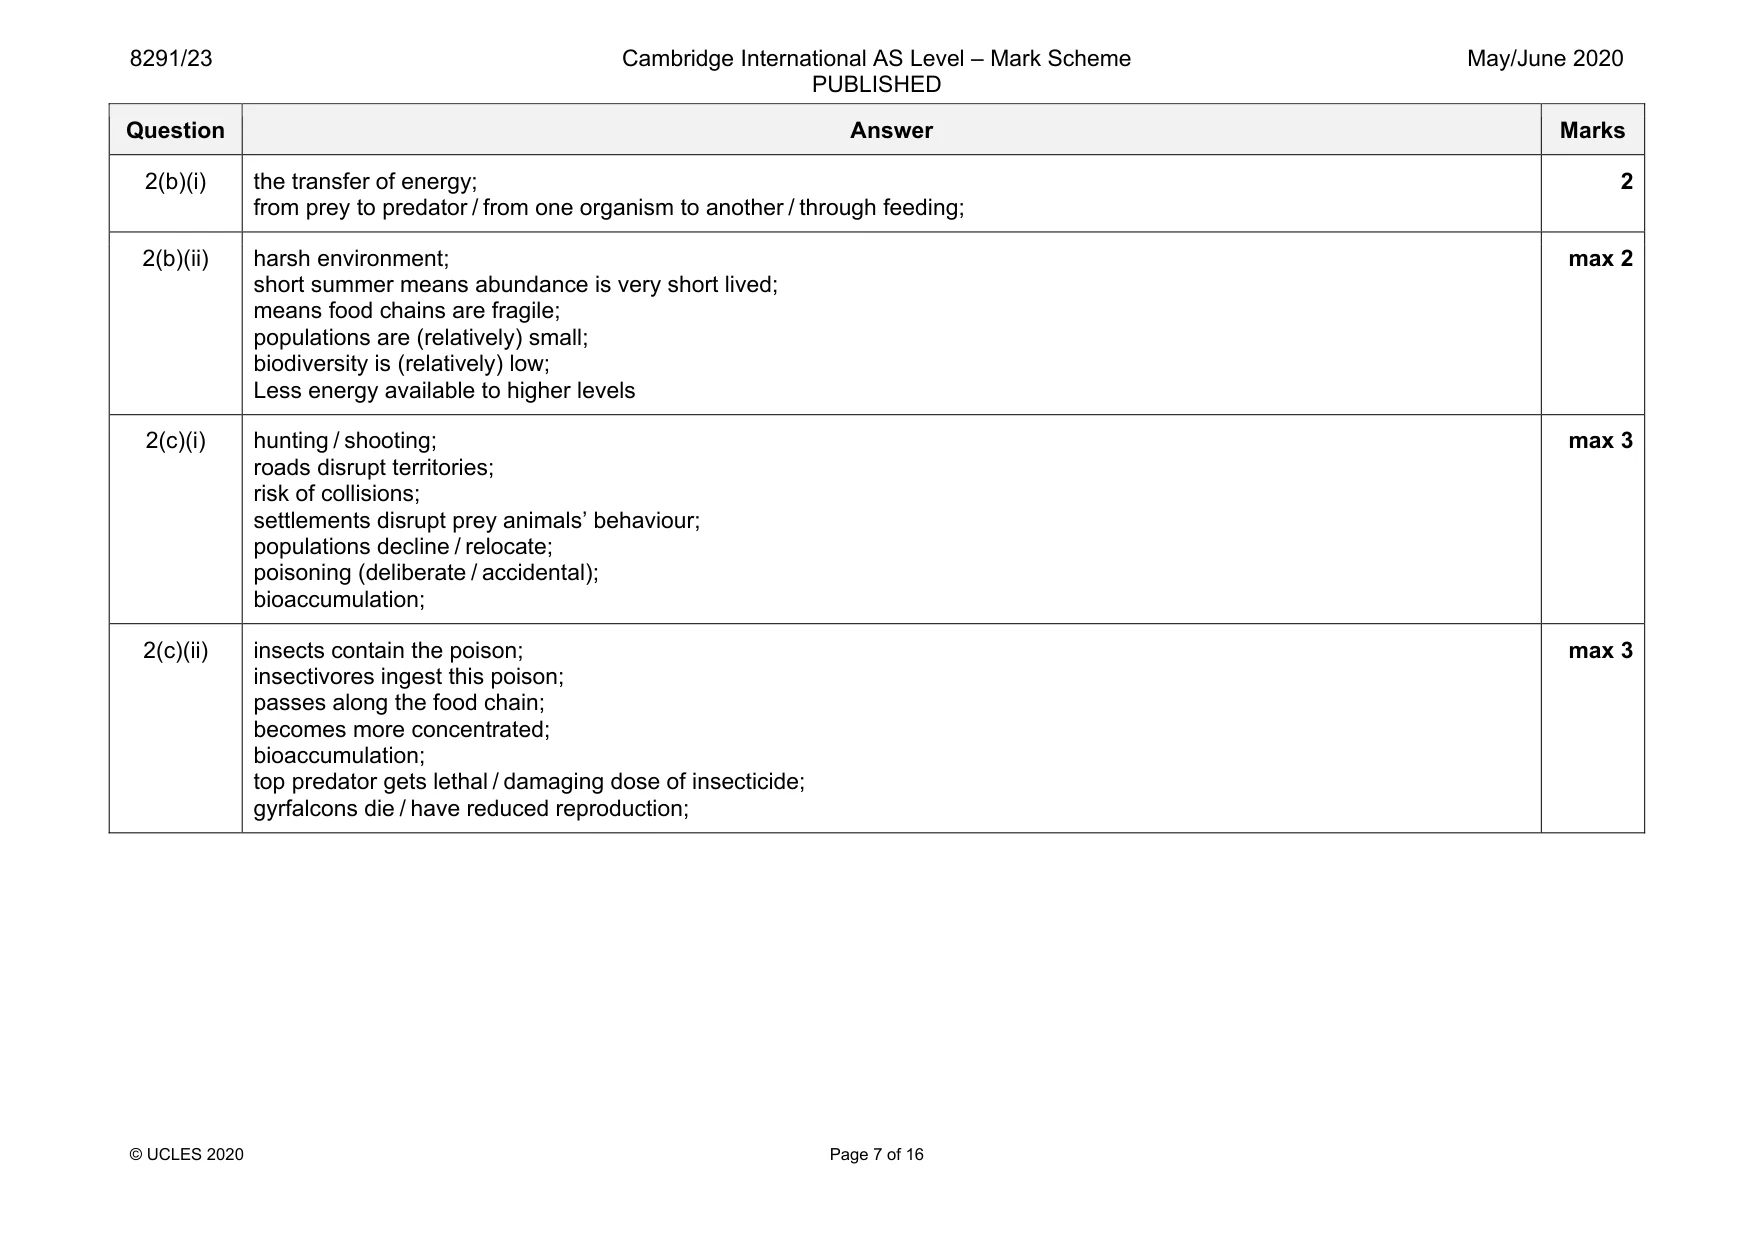
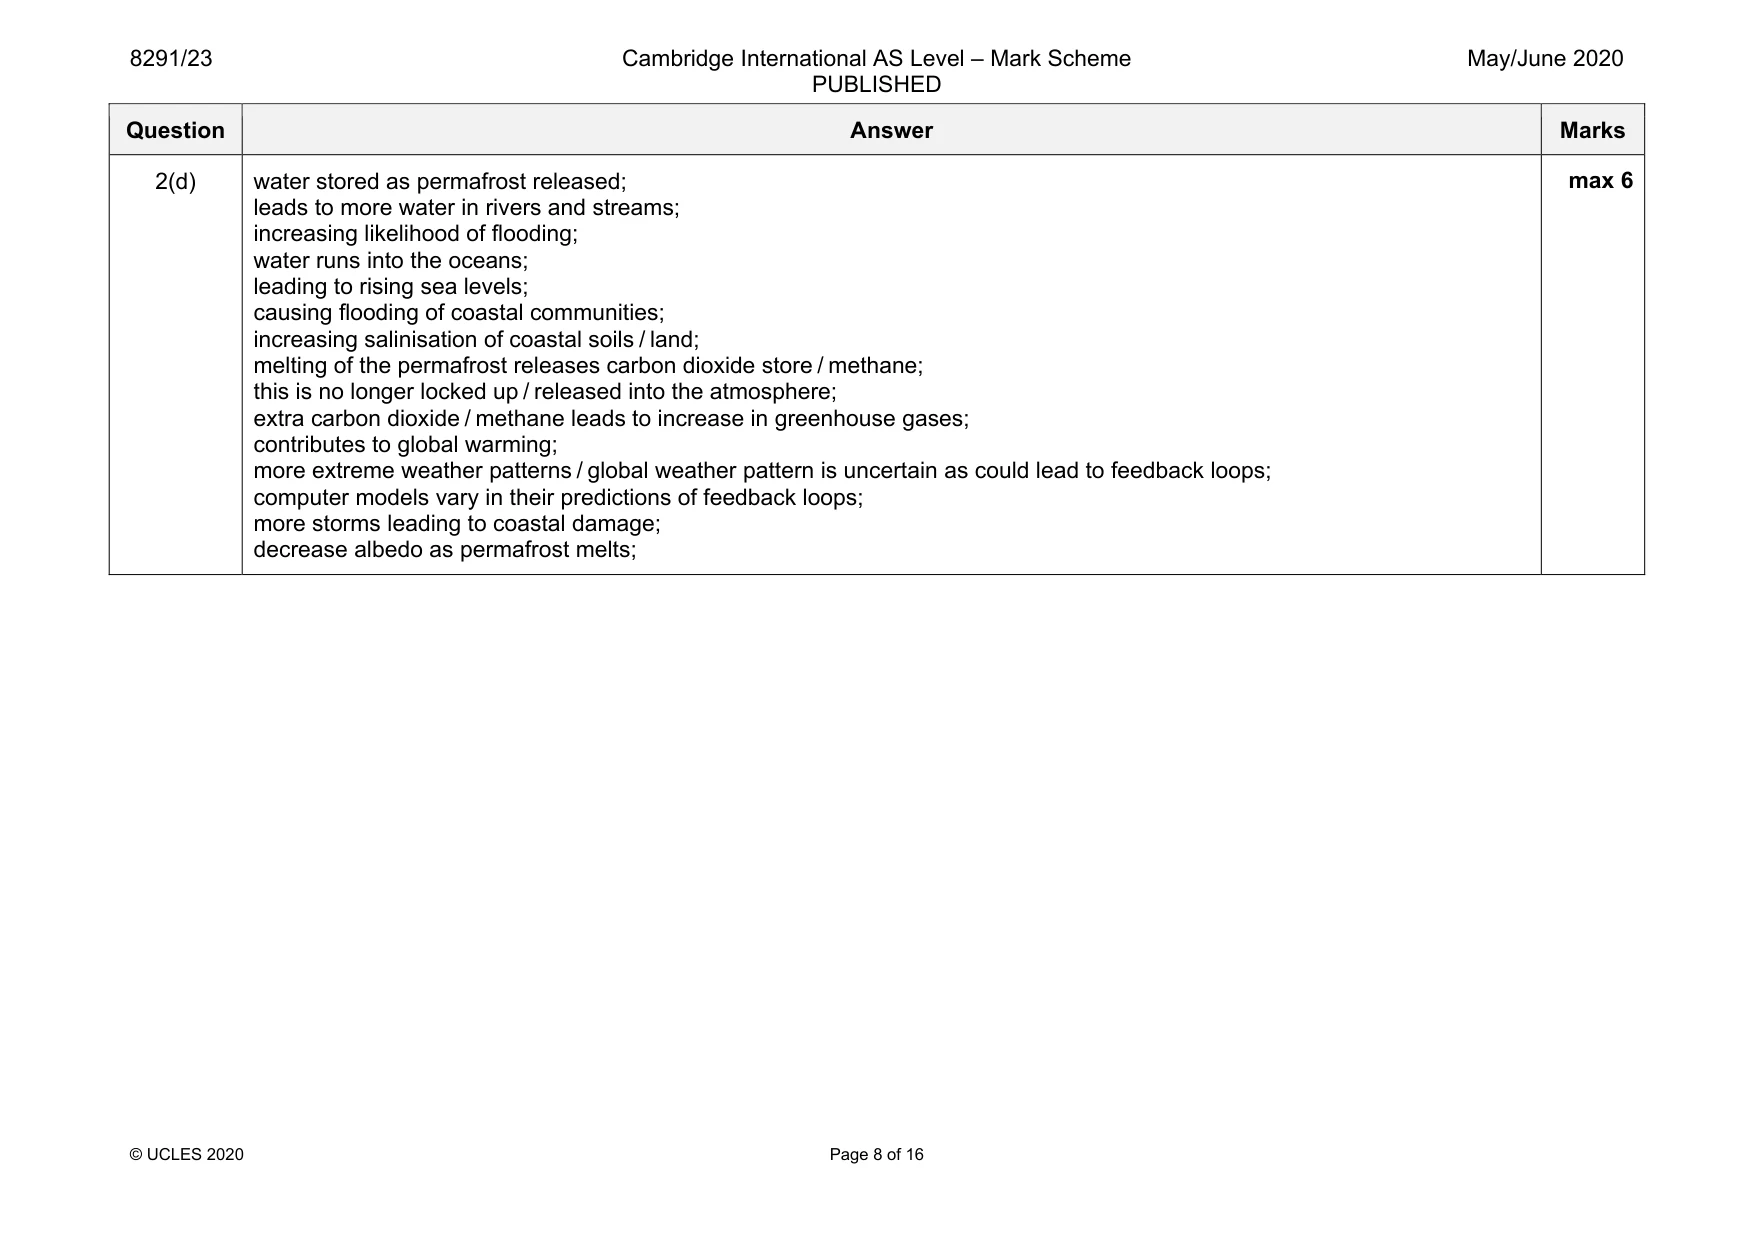
Mark scheme: 2(a)(i) near the North Pole / top of the world; above 60 °N latitude; on or close to the Arctic circle; northern Canada, Alaska, northern Scandinavia and Siberia; 2(a)(ii) temperature; moisture / rainfall / precipitation; 2 Question Answer Marks 2(b)(i) the transfer of energy; from prey to predator / from one organism to another / through feeding; 2 2(b)(ii) harsh environment; short summer means abundance is very short lived; means food chains are fragile; populations are (relatively) small; biodiversity is (relatively) low; Less energy available to higher levels max 2 2(c)(i) hunting / shooting; roads disrupt territories; risk of collisions; settlements disrupt prey animals’ behaviour; populations decline / relocate; poisoning (deliberate / accidental); bioaccumulation; max 3 2(c)(ii) insects contain the poison; insectivores ingest this poison; passes along the food chain; becomes more concentrated; bioaccumulation; top predator gets lethal / damaging dose of insecticide; gyrfalcons die / have reduced reproduction; max 3 Question Answer Marks 2(d) water stored as permafrost released; leads to more water in rivers and streams; increasing likelihood of flooding; water runs into the oceans; leading to rising sea levels; causing flooding of coastal communities; increasing salinisation of coastal soils / land; melting of the permafrost releases carbon dioxide store / methane; this is no longer locked up / released into the atmosphere; extra carbon dioxide / methane leads to increase in greenhouse gases; contributes to global warming; more extreme weather patterns / global weather pattern is uncertain as could lead to feedback loops; computer models vary in their predictions of feedback loops; more storms leading to coastal damage; decrease albedo as permafrost melts; max 6
Q3 · A graph showing the different stages in human population growth (a demographic transition…
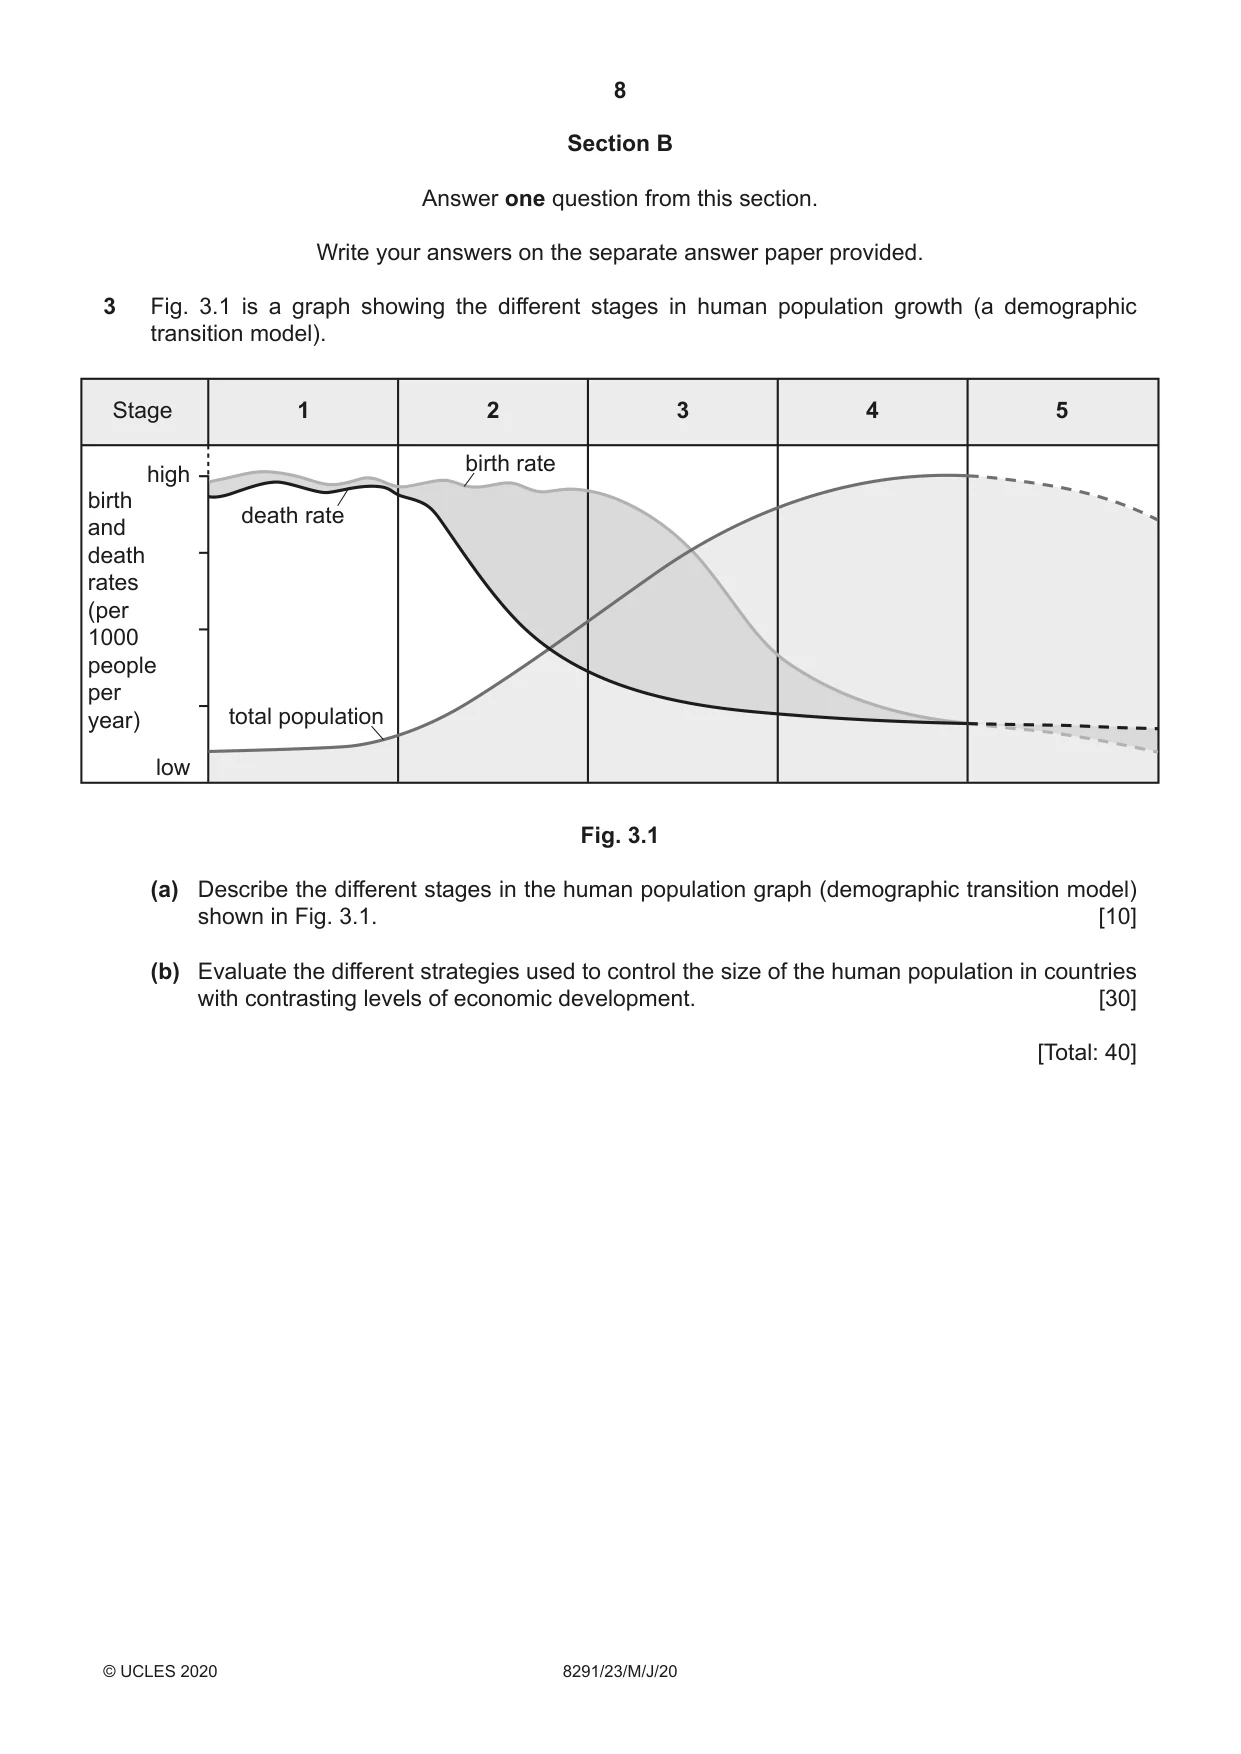
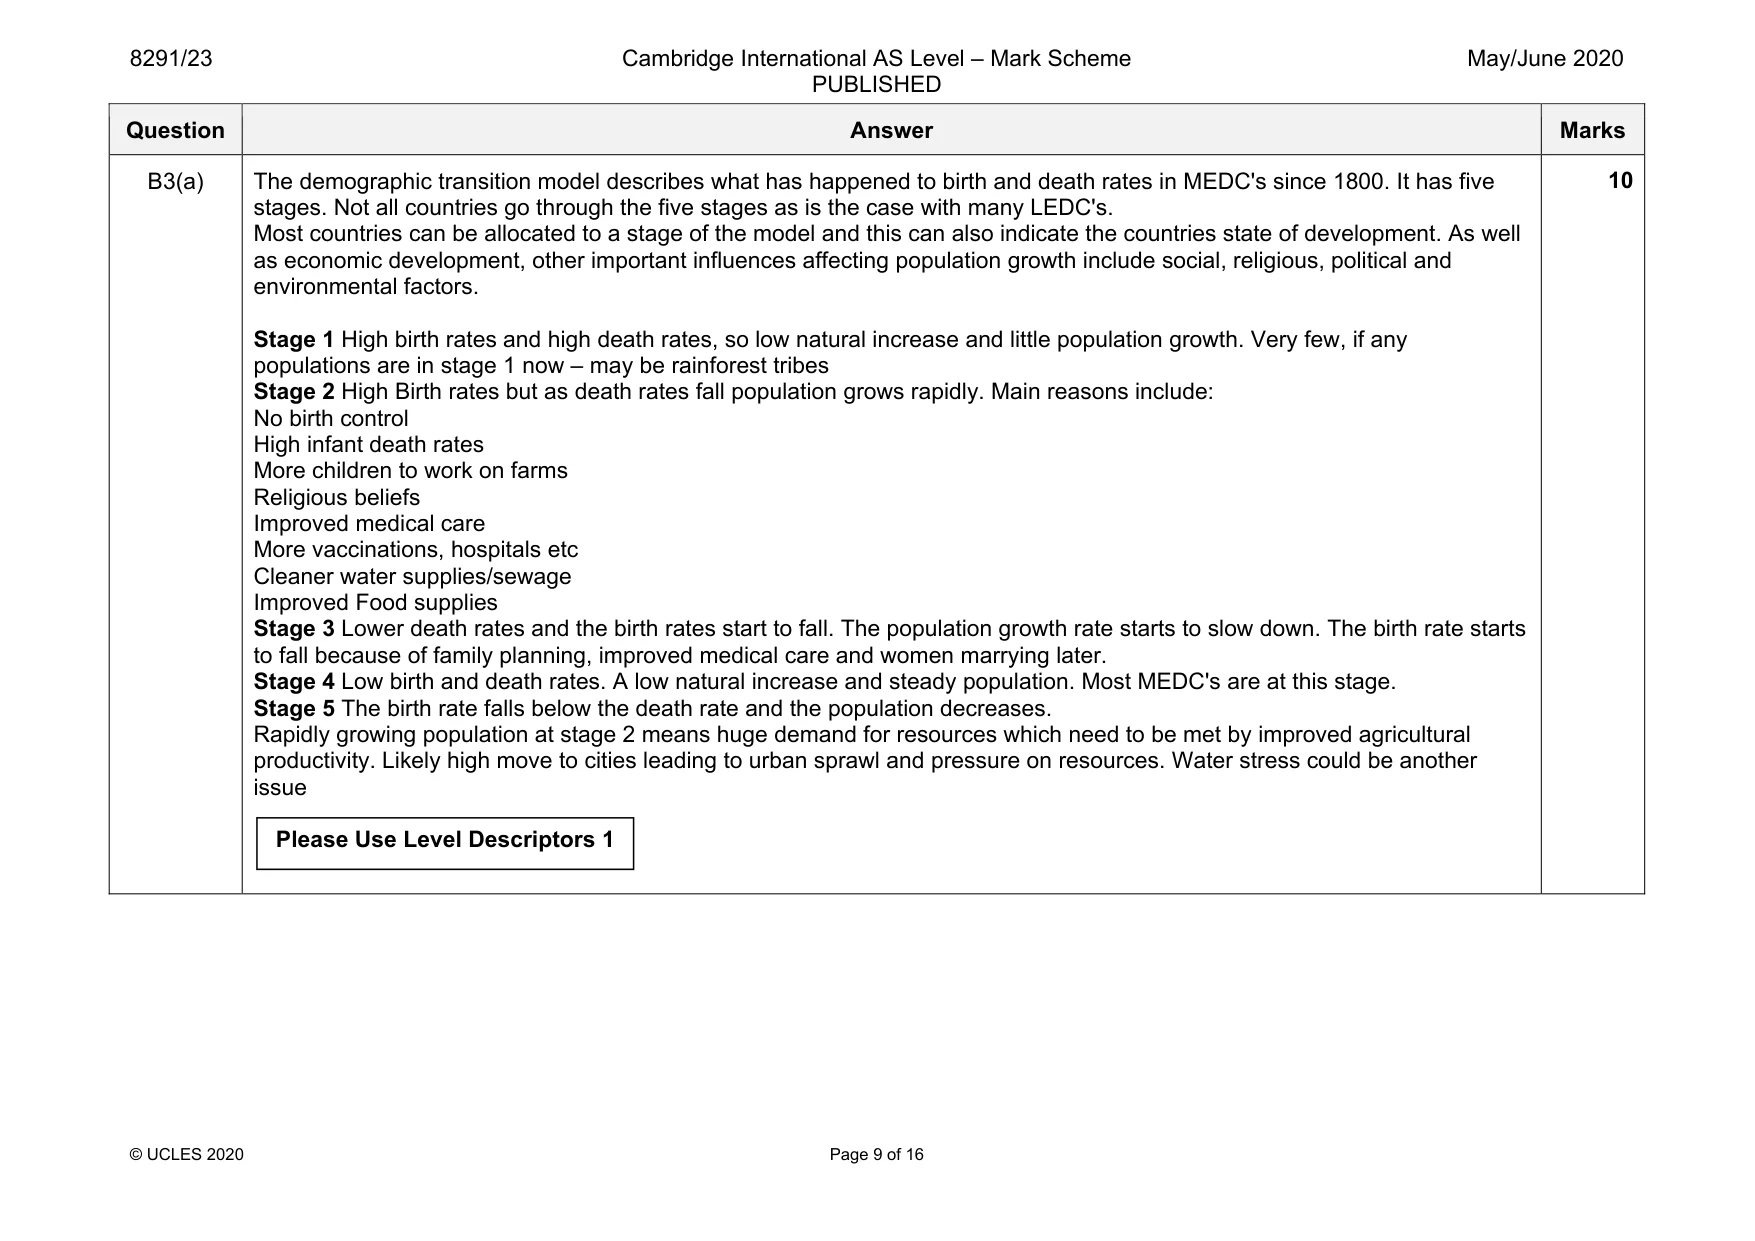
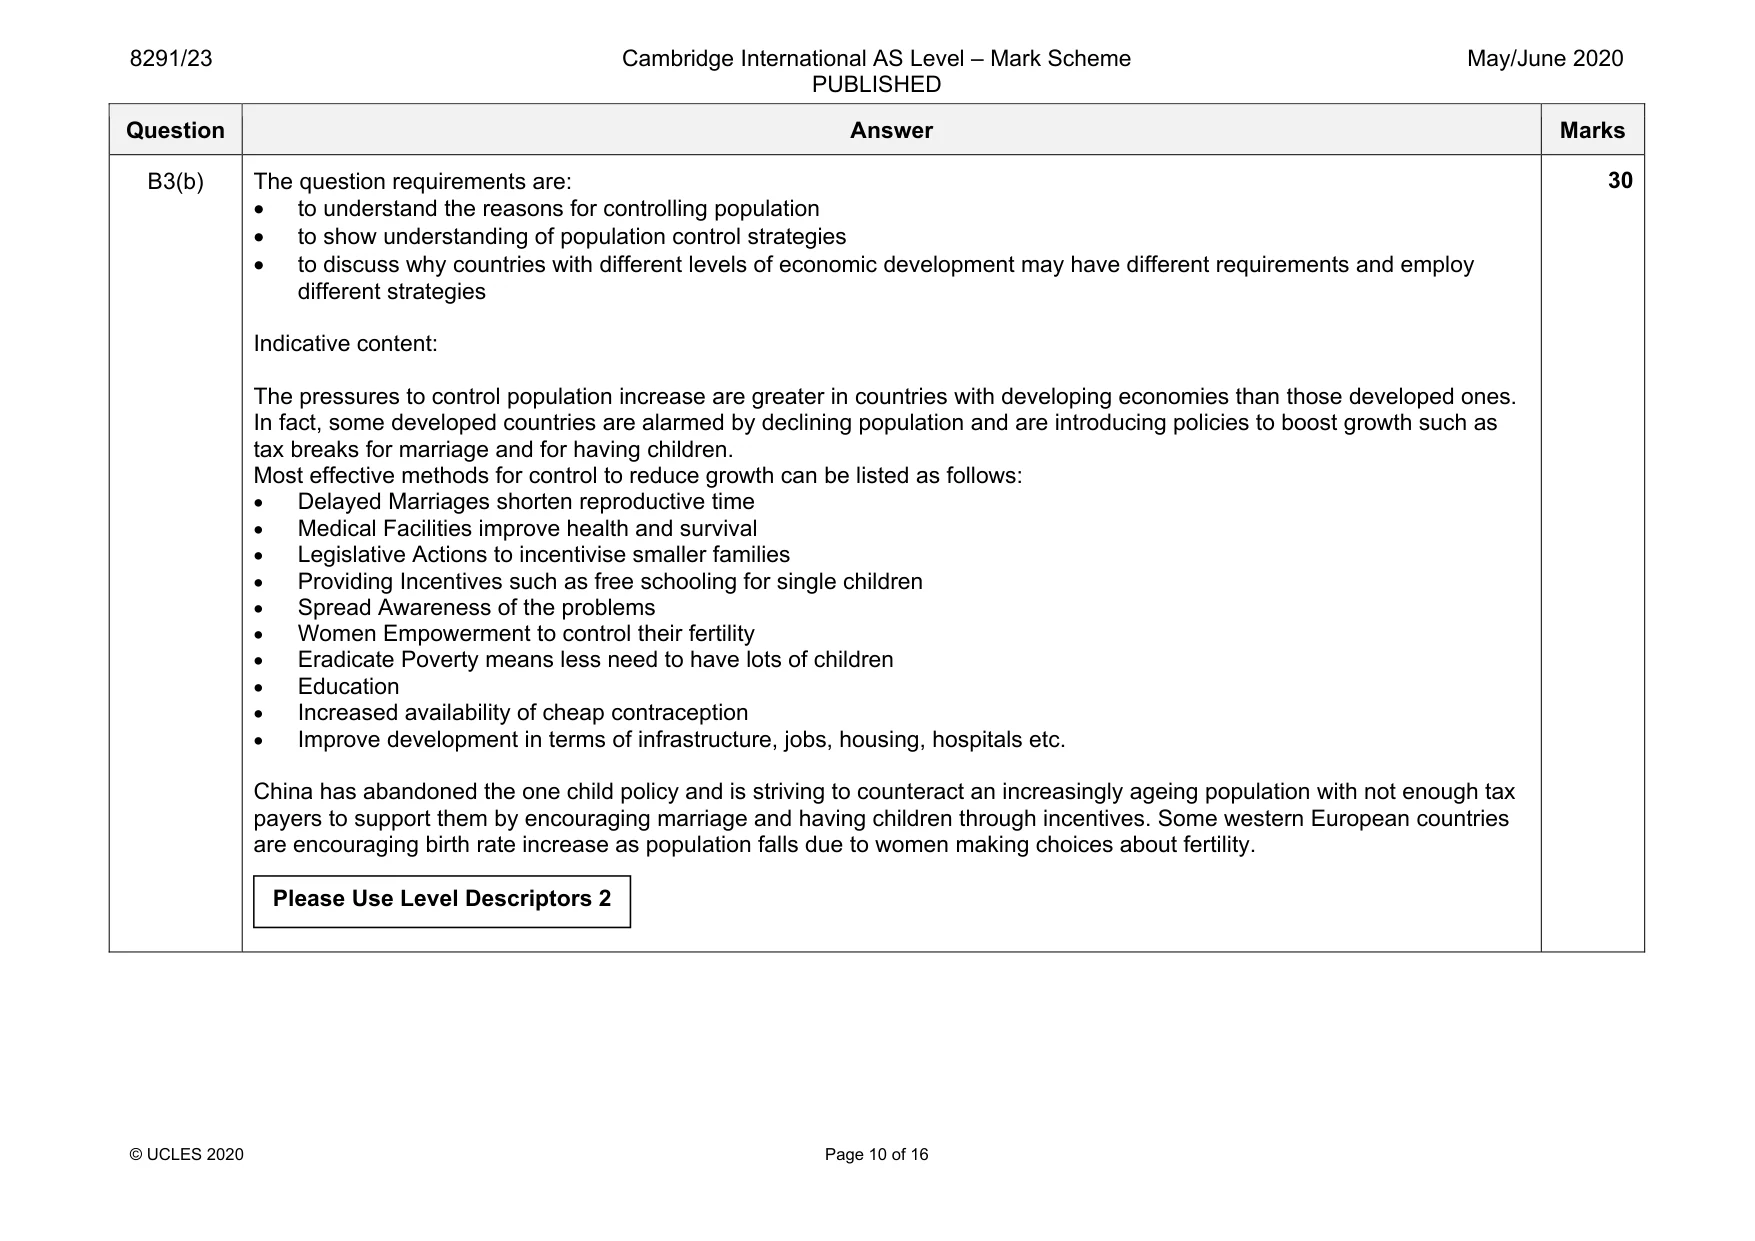
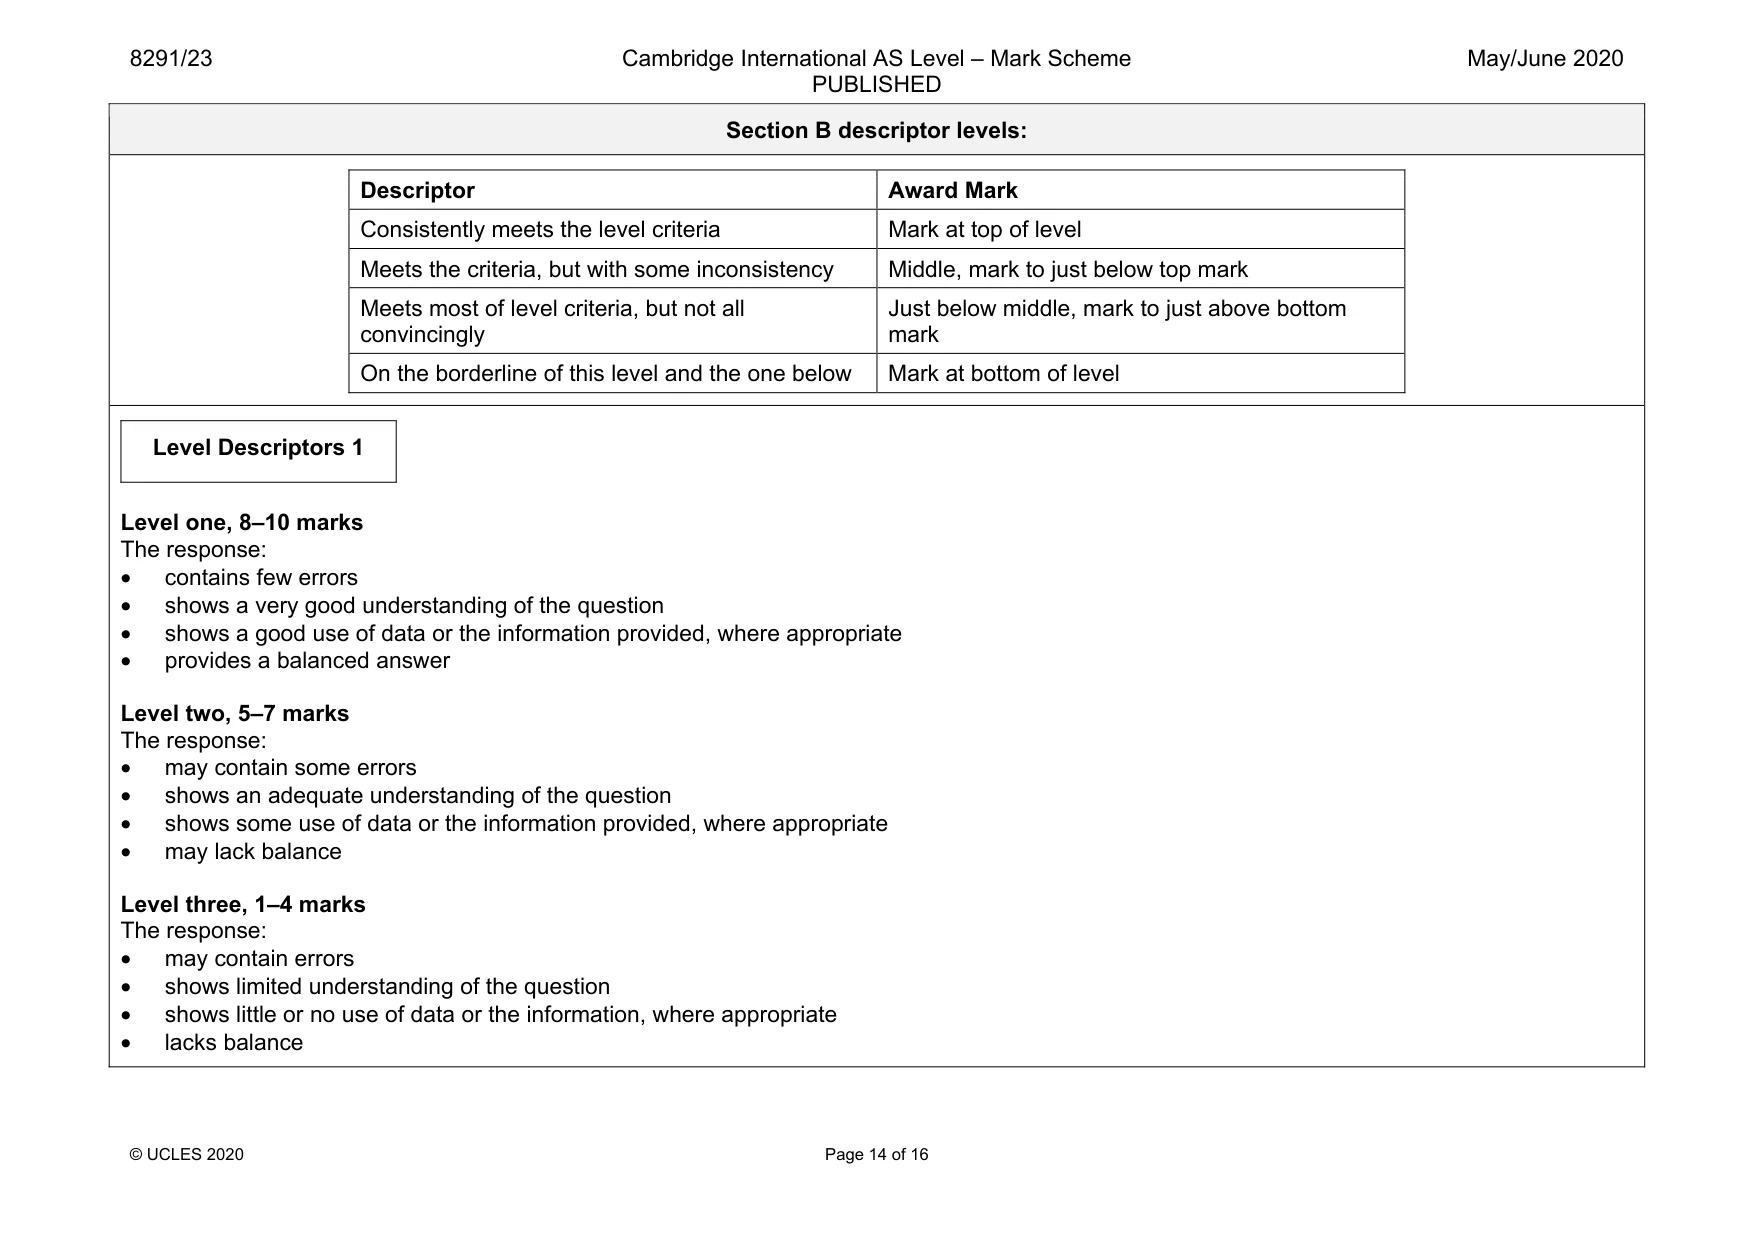
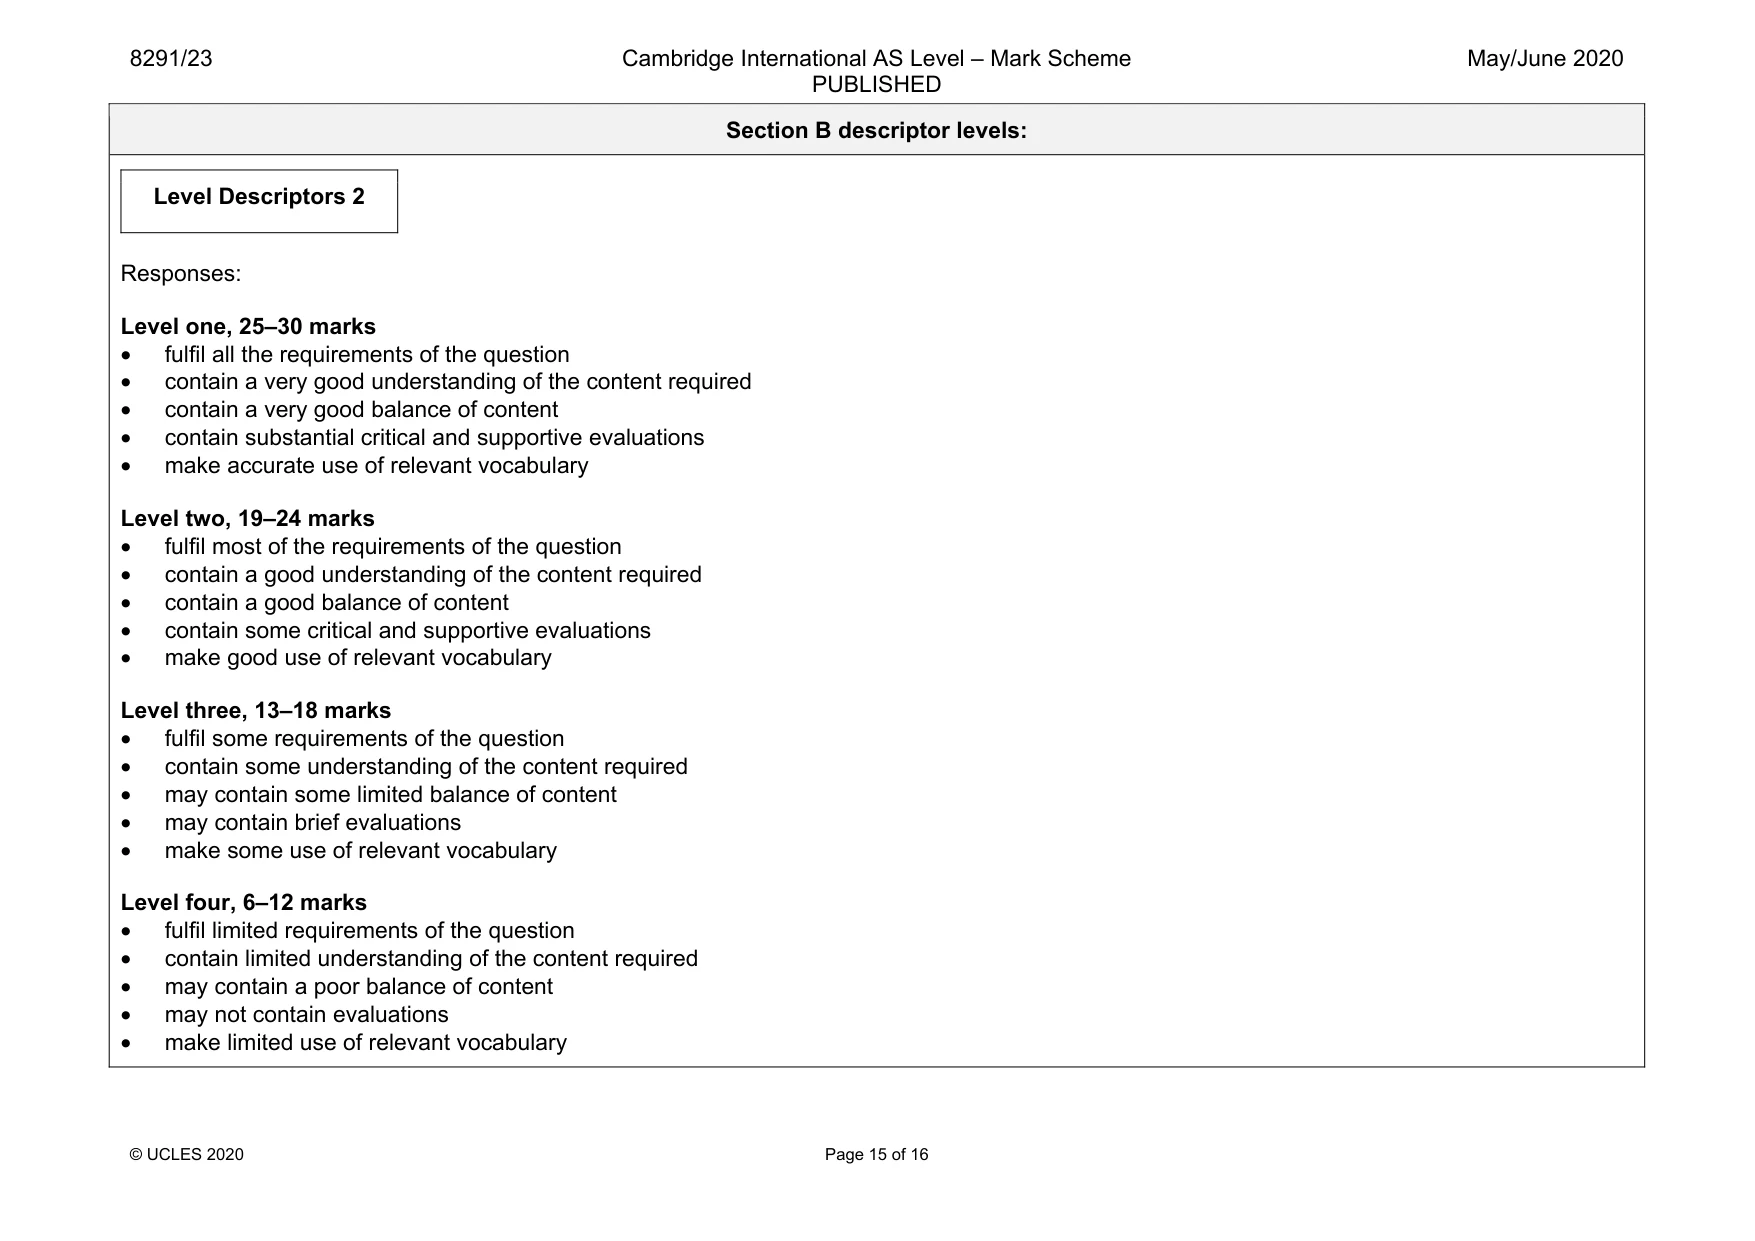
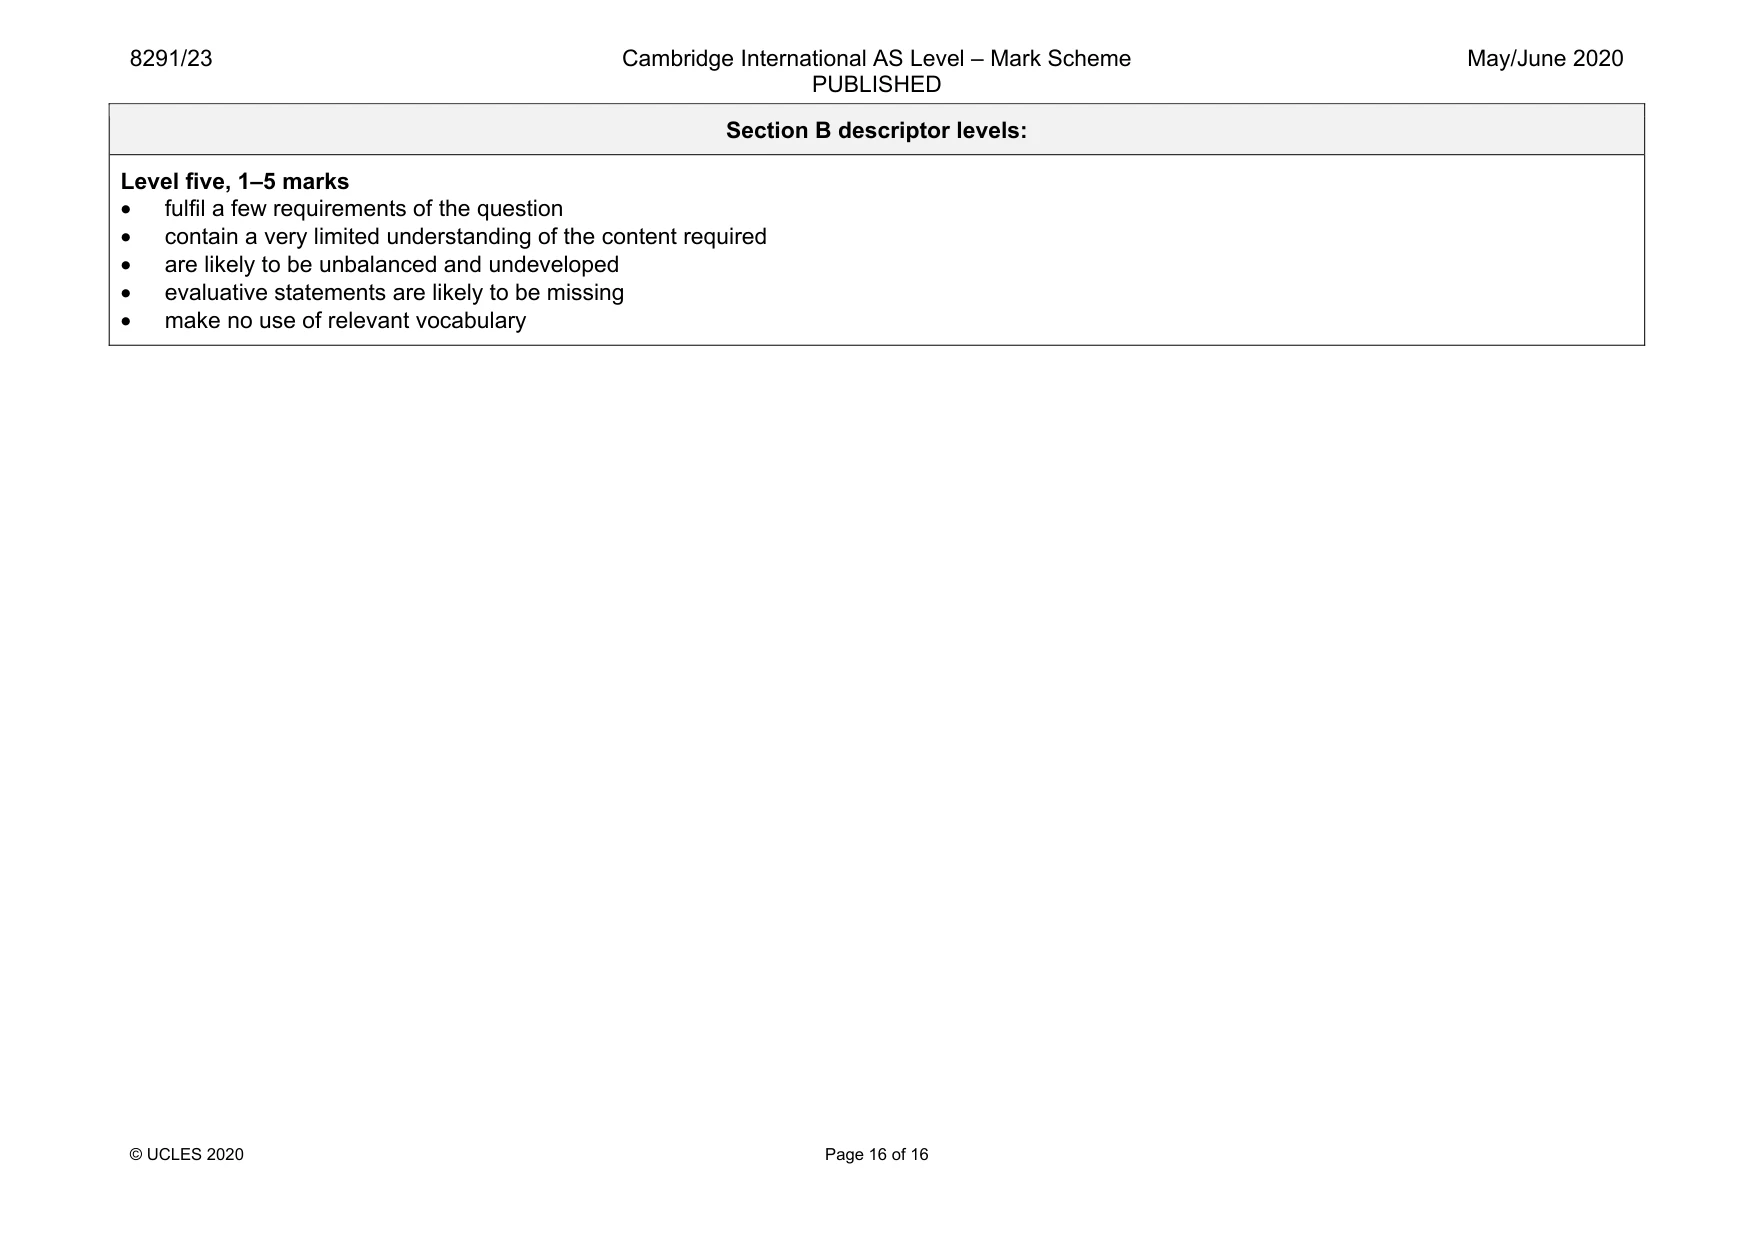
3 Fig. 3.1 is a graph showing the different stages in human population growth (a demographic transition model). Stage 1 2 3 4 5 birth rate high birth death rateand death rates (per 1000 people per year) total population low Fig. 3.1 (a) Describe the different stages in the human population graph (demographic transition model) shown in Fig. 3.1. [10] (b) Evaluate the different strategies used to control the size of the human population in countries with contrasting levels of economic development. [30] [Total: 40]
Q4 · A series of maps showing the spread of lionfish, an invasive marine species, following…
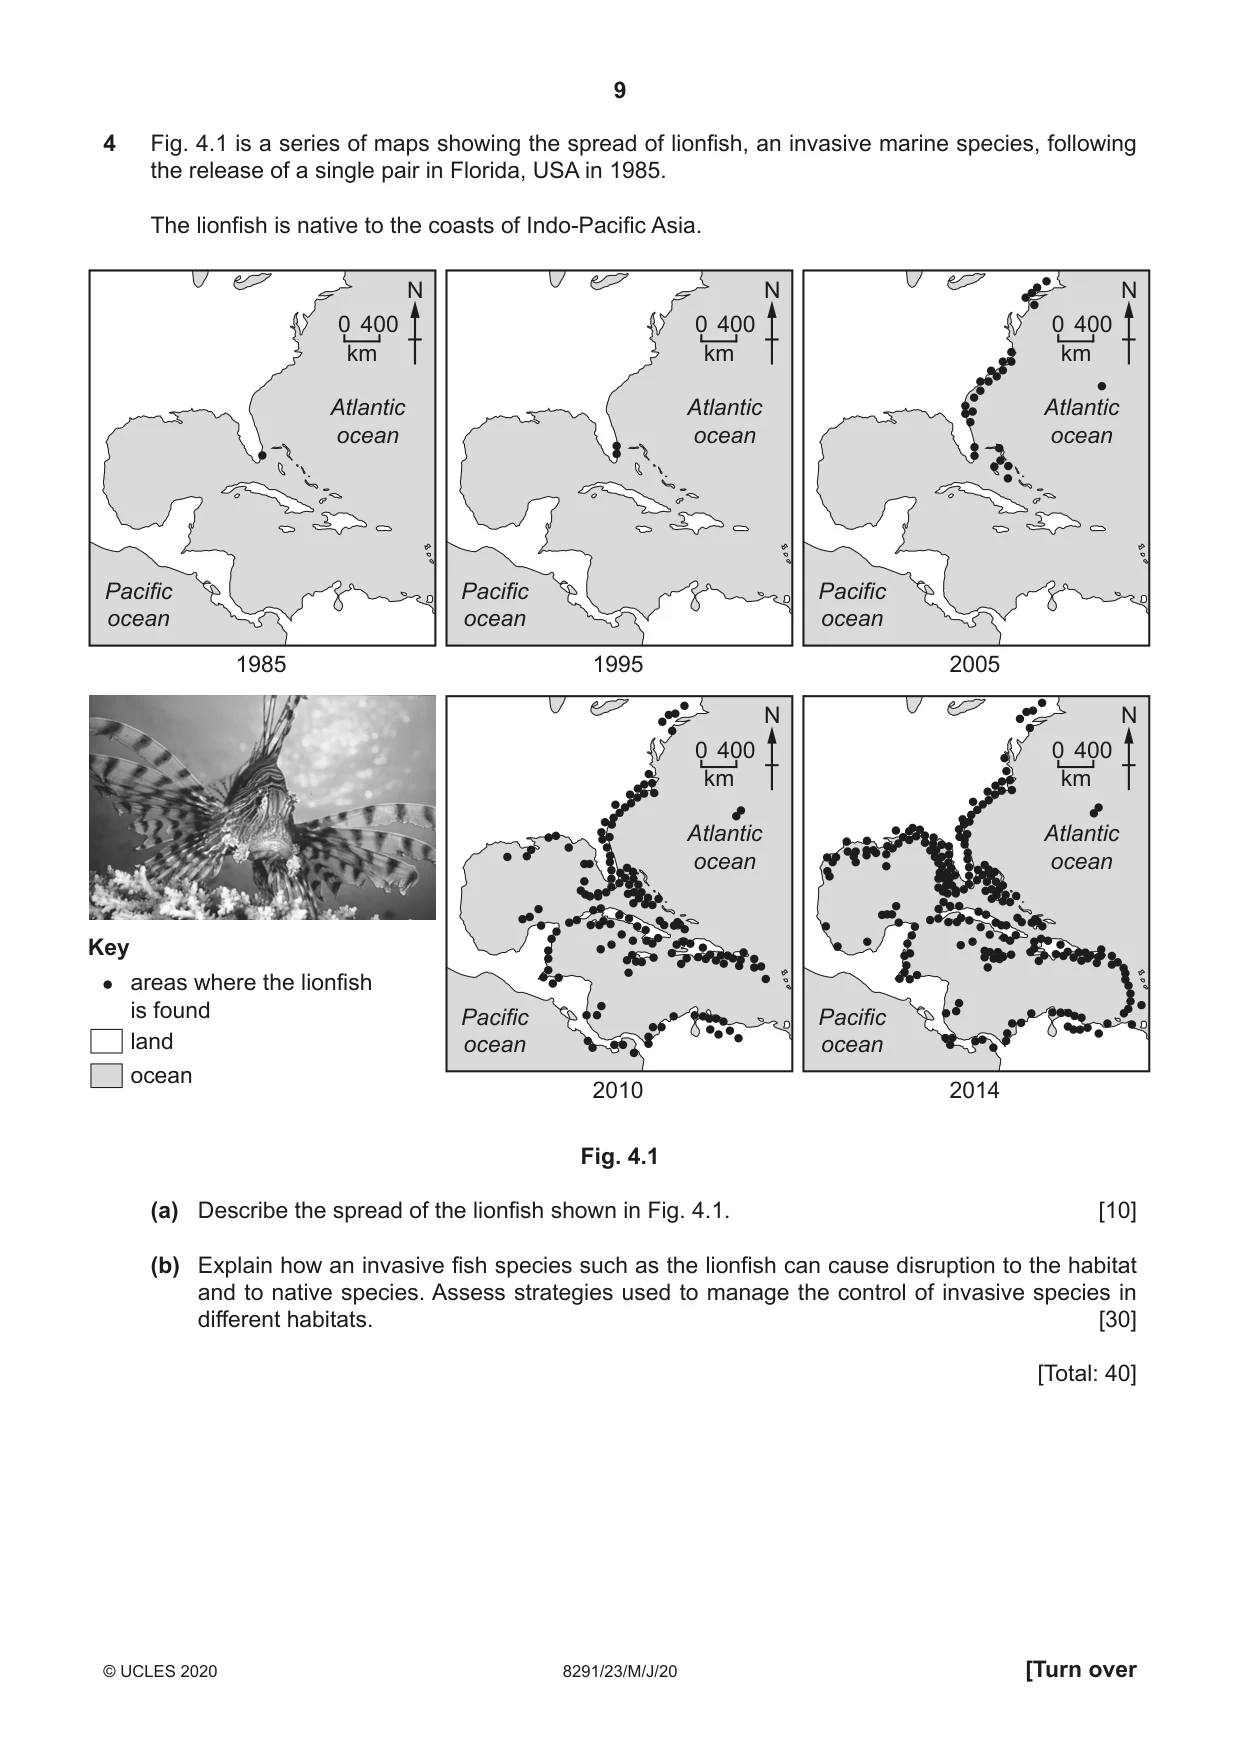
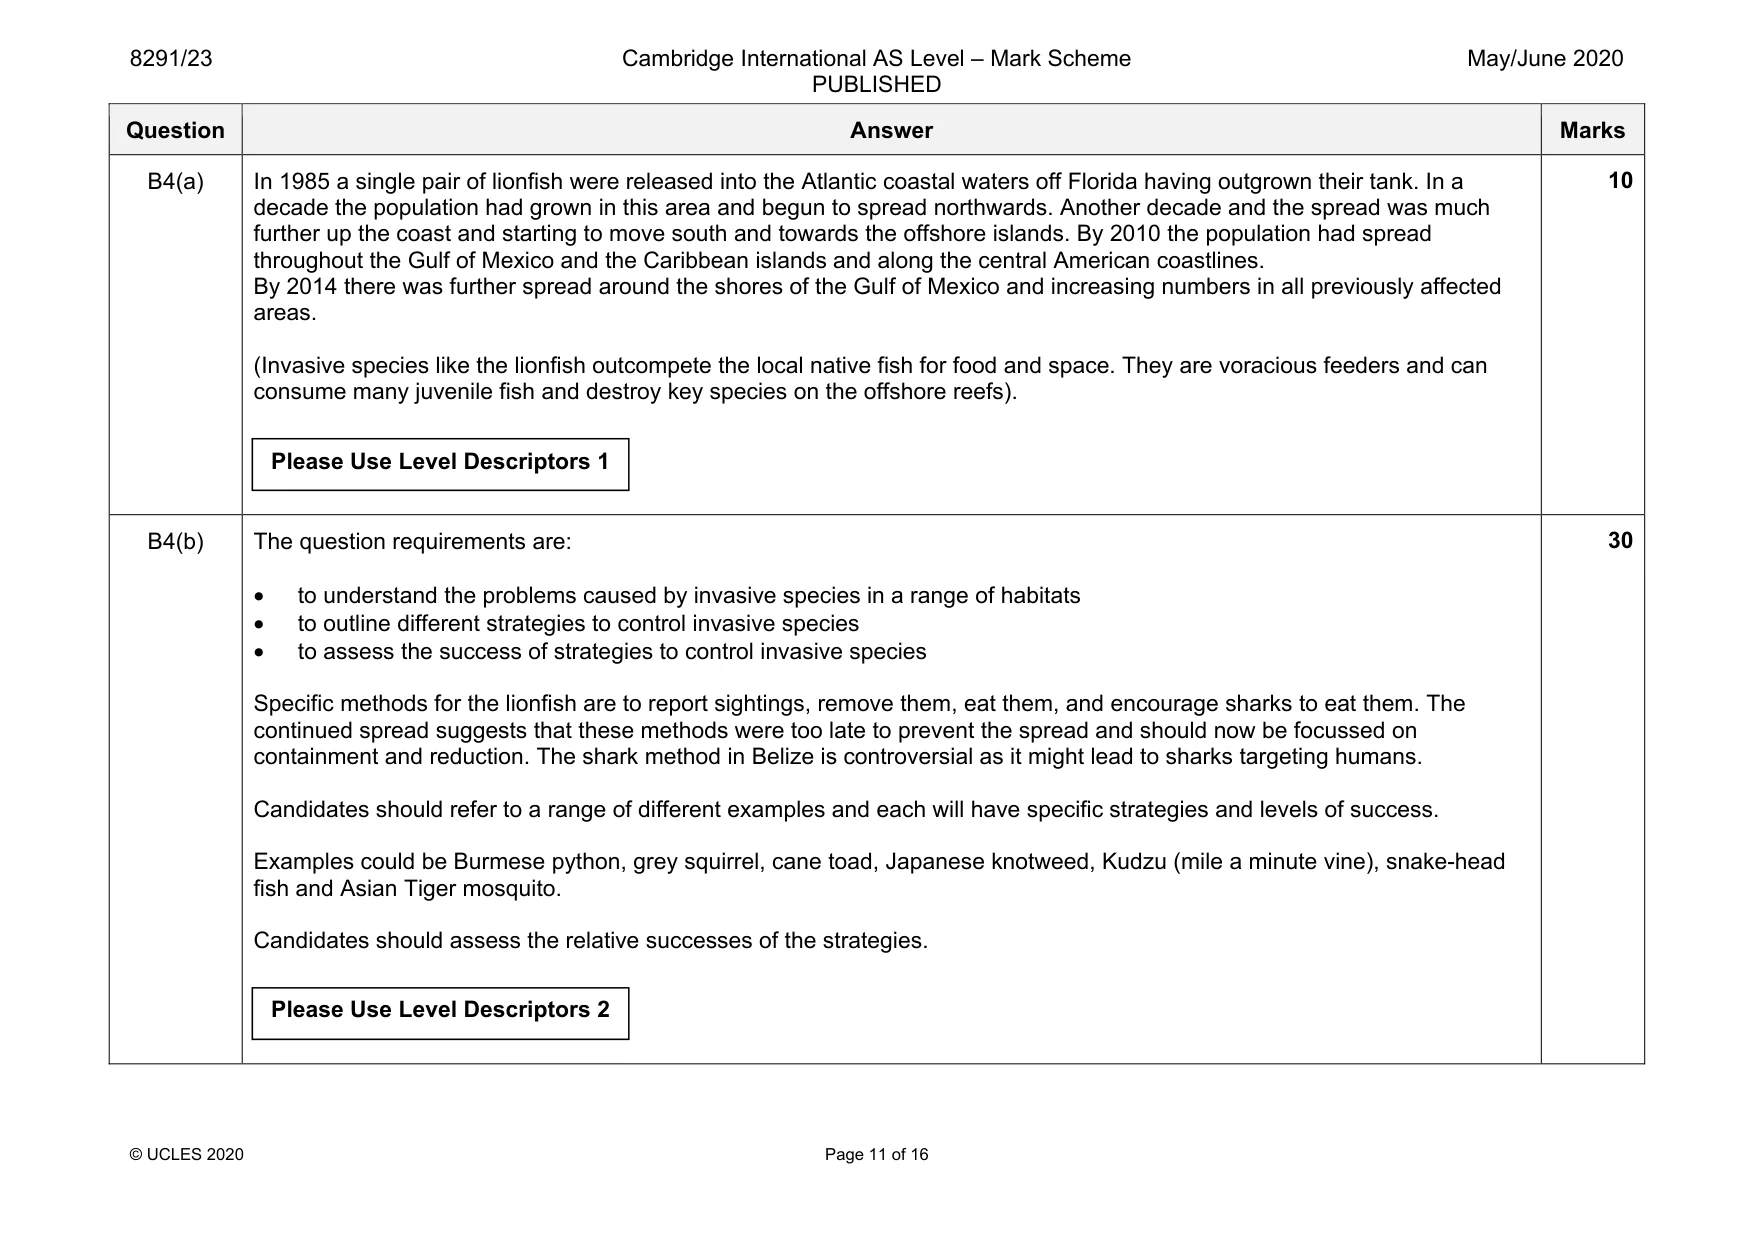
4 Fig. 4.1 is a series of maps showing the spread of lionfish, an invasive marine species, following the release of a single pair in Florida, USA in 1985. The lionfish is native to the coasts of Indo-Pacific Asia. N N N 0 400 0 400 0 400 km km km Atlantic Atlantic Atlantic ocean ocean ocean Pacific Pacific Pacific ocean ocean ocean 1985 1995 2005 N N 0 400 0 400 km km Atlantic Atlantic ocean ocean Key areas where the lionfish is found Pacific Pacific land ocean ocean ocean 2010 2014 Fig. 4.1 (a) Describe the spread of the lionfish shown in Fig. 4.1. [10] (b) Explain how an invasive fish species such as the lionfish can cause disruption to the habitat and to native species. Assess strategies used to manage the control of invasive species in different habitats. [30] [Total: 40]
Q5 · A suggested model for the establishment of marine conservation areas worldwide
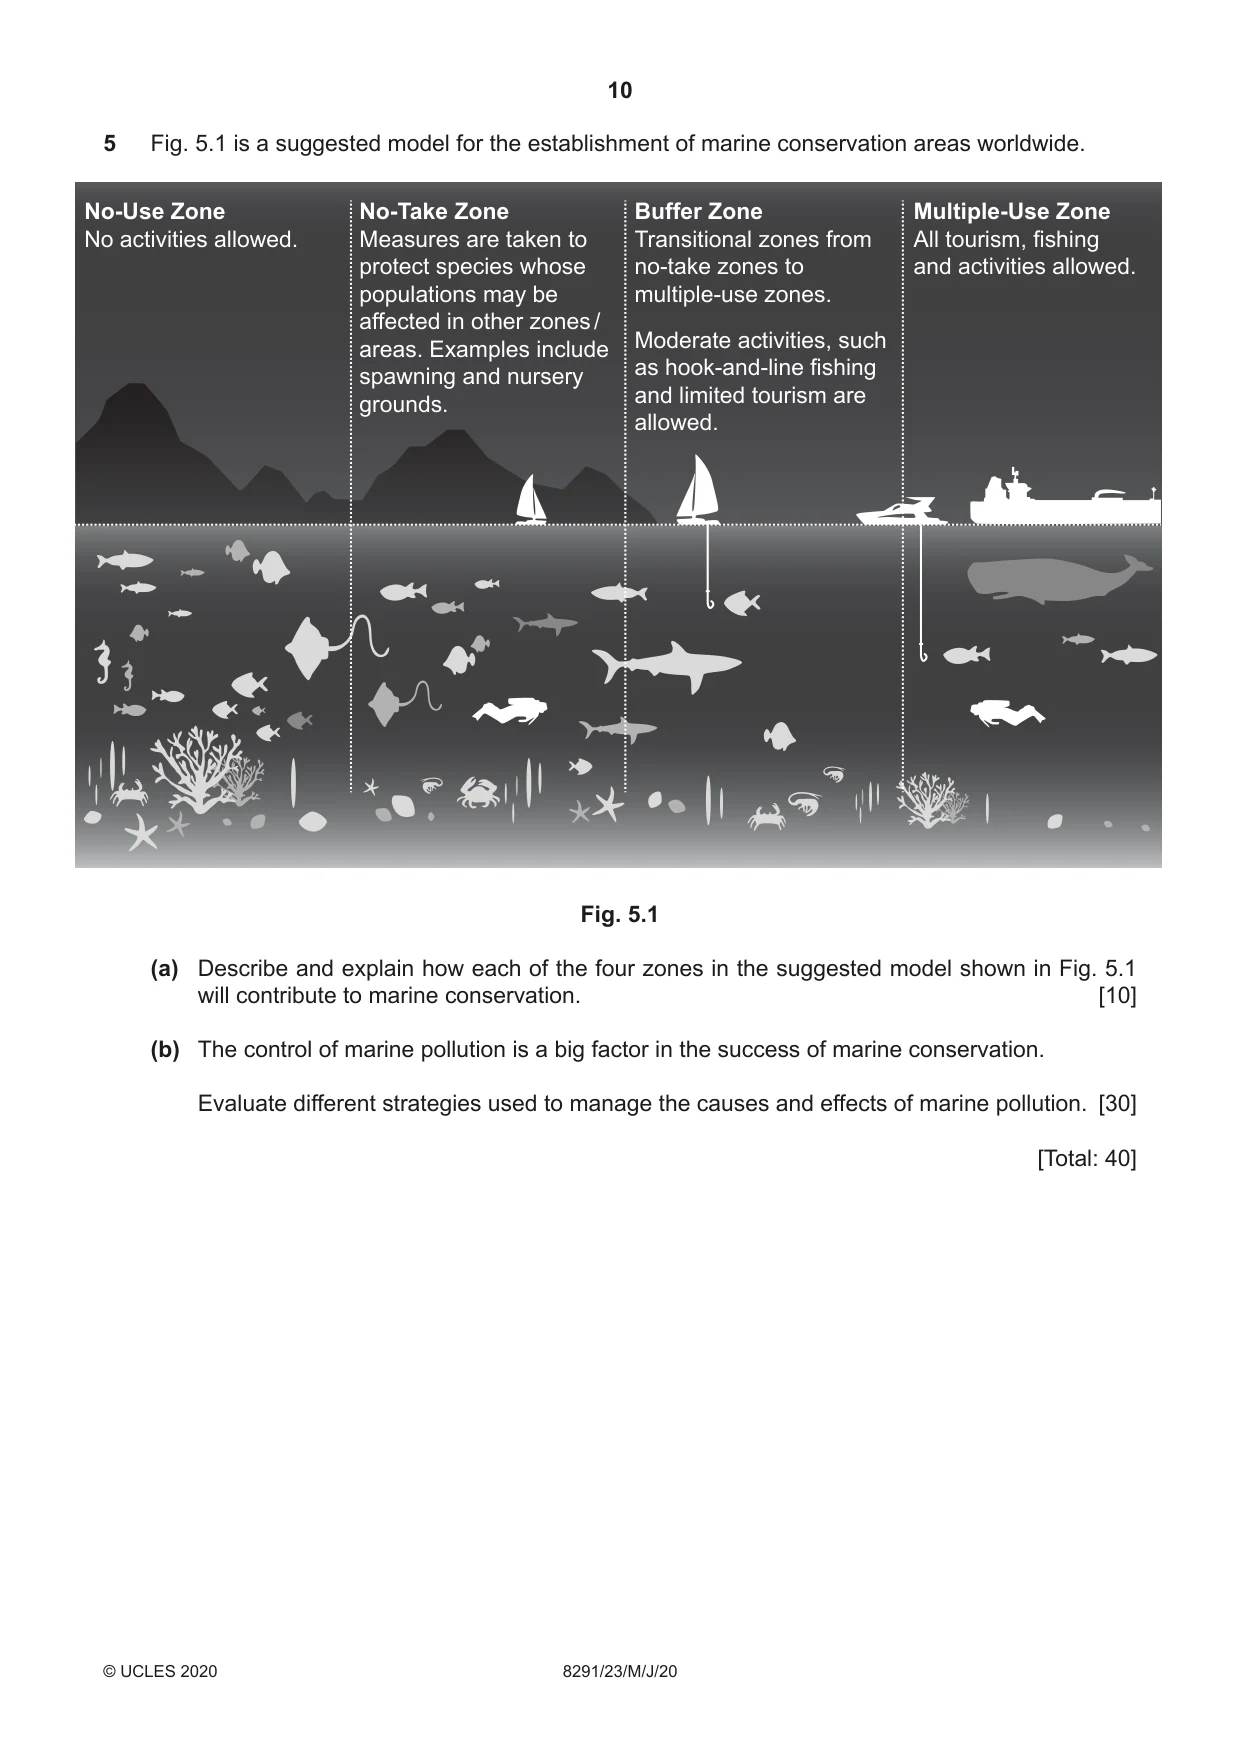
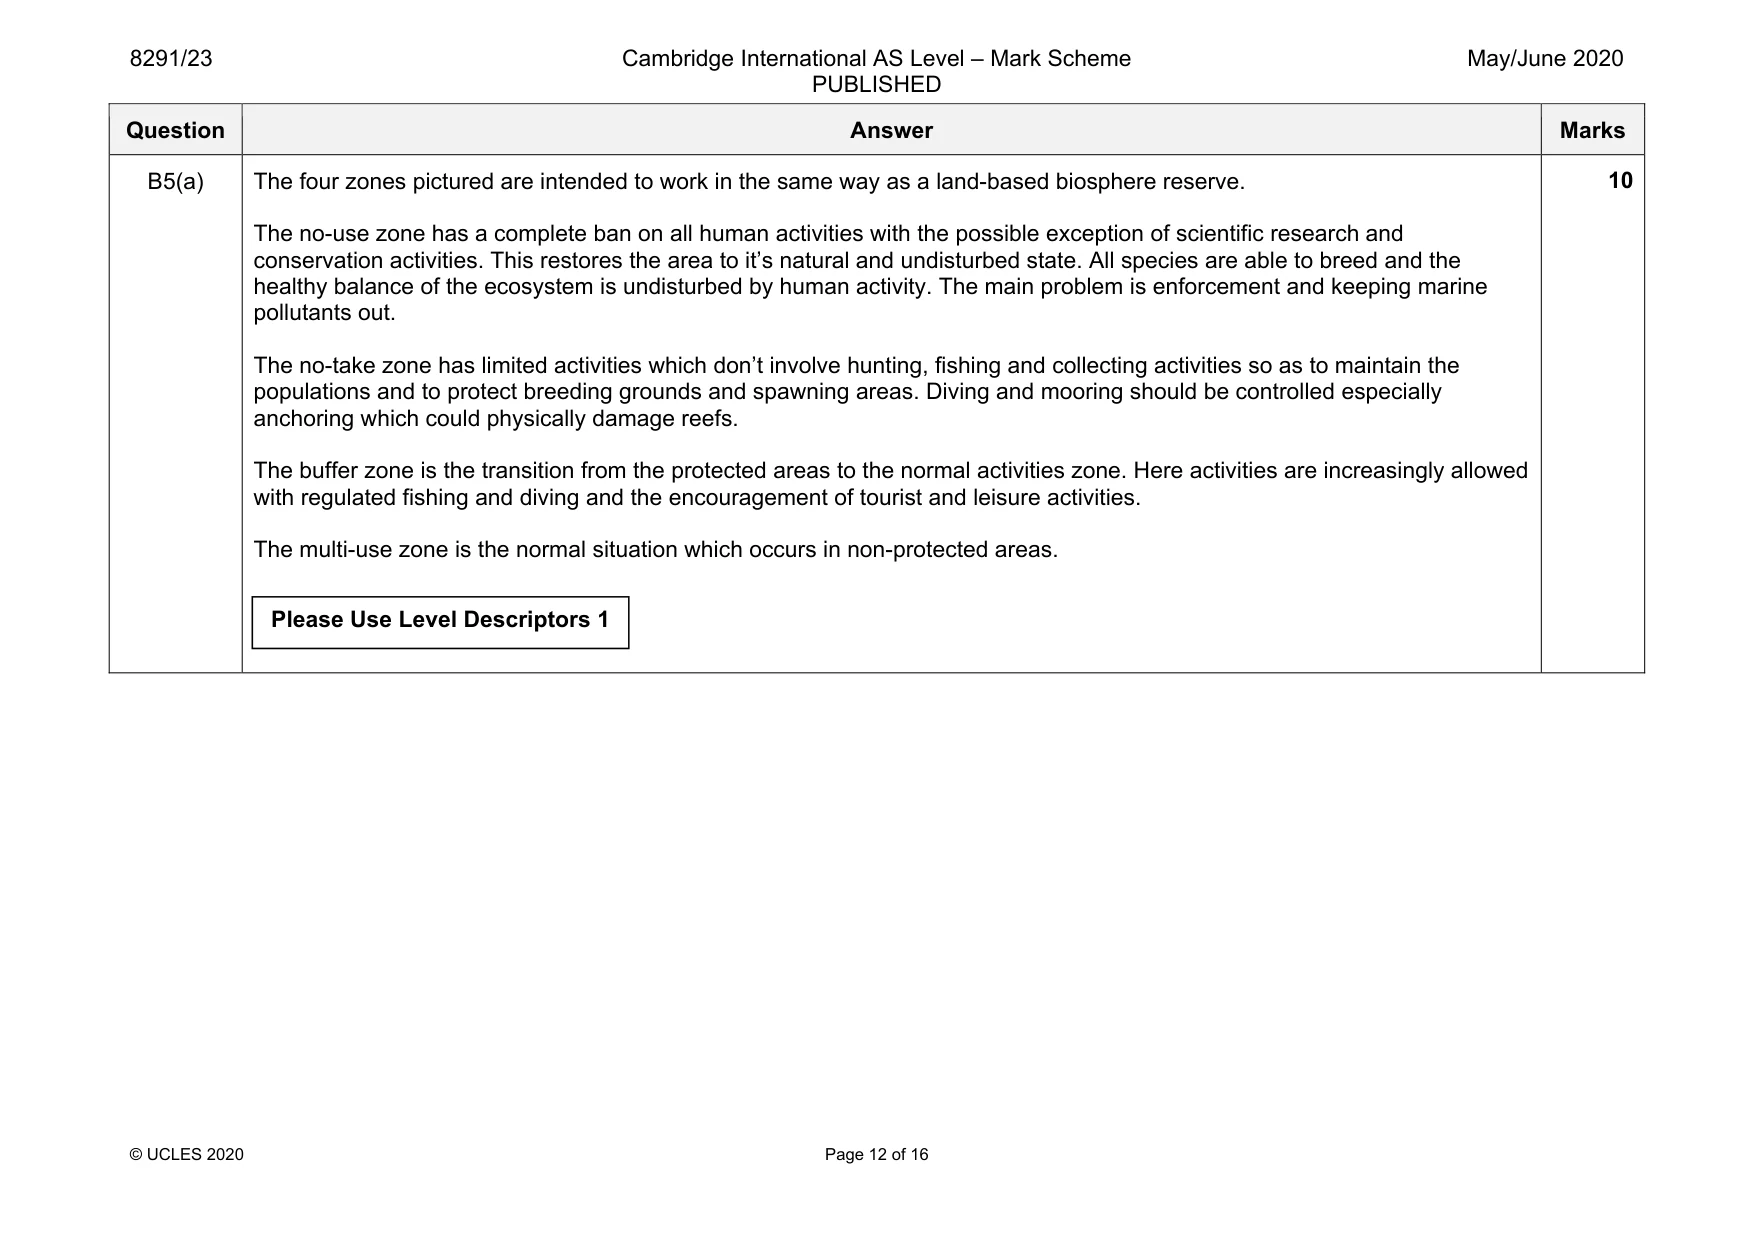
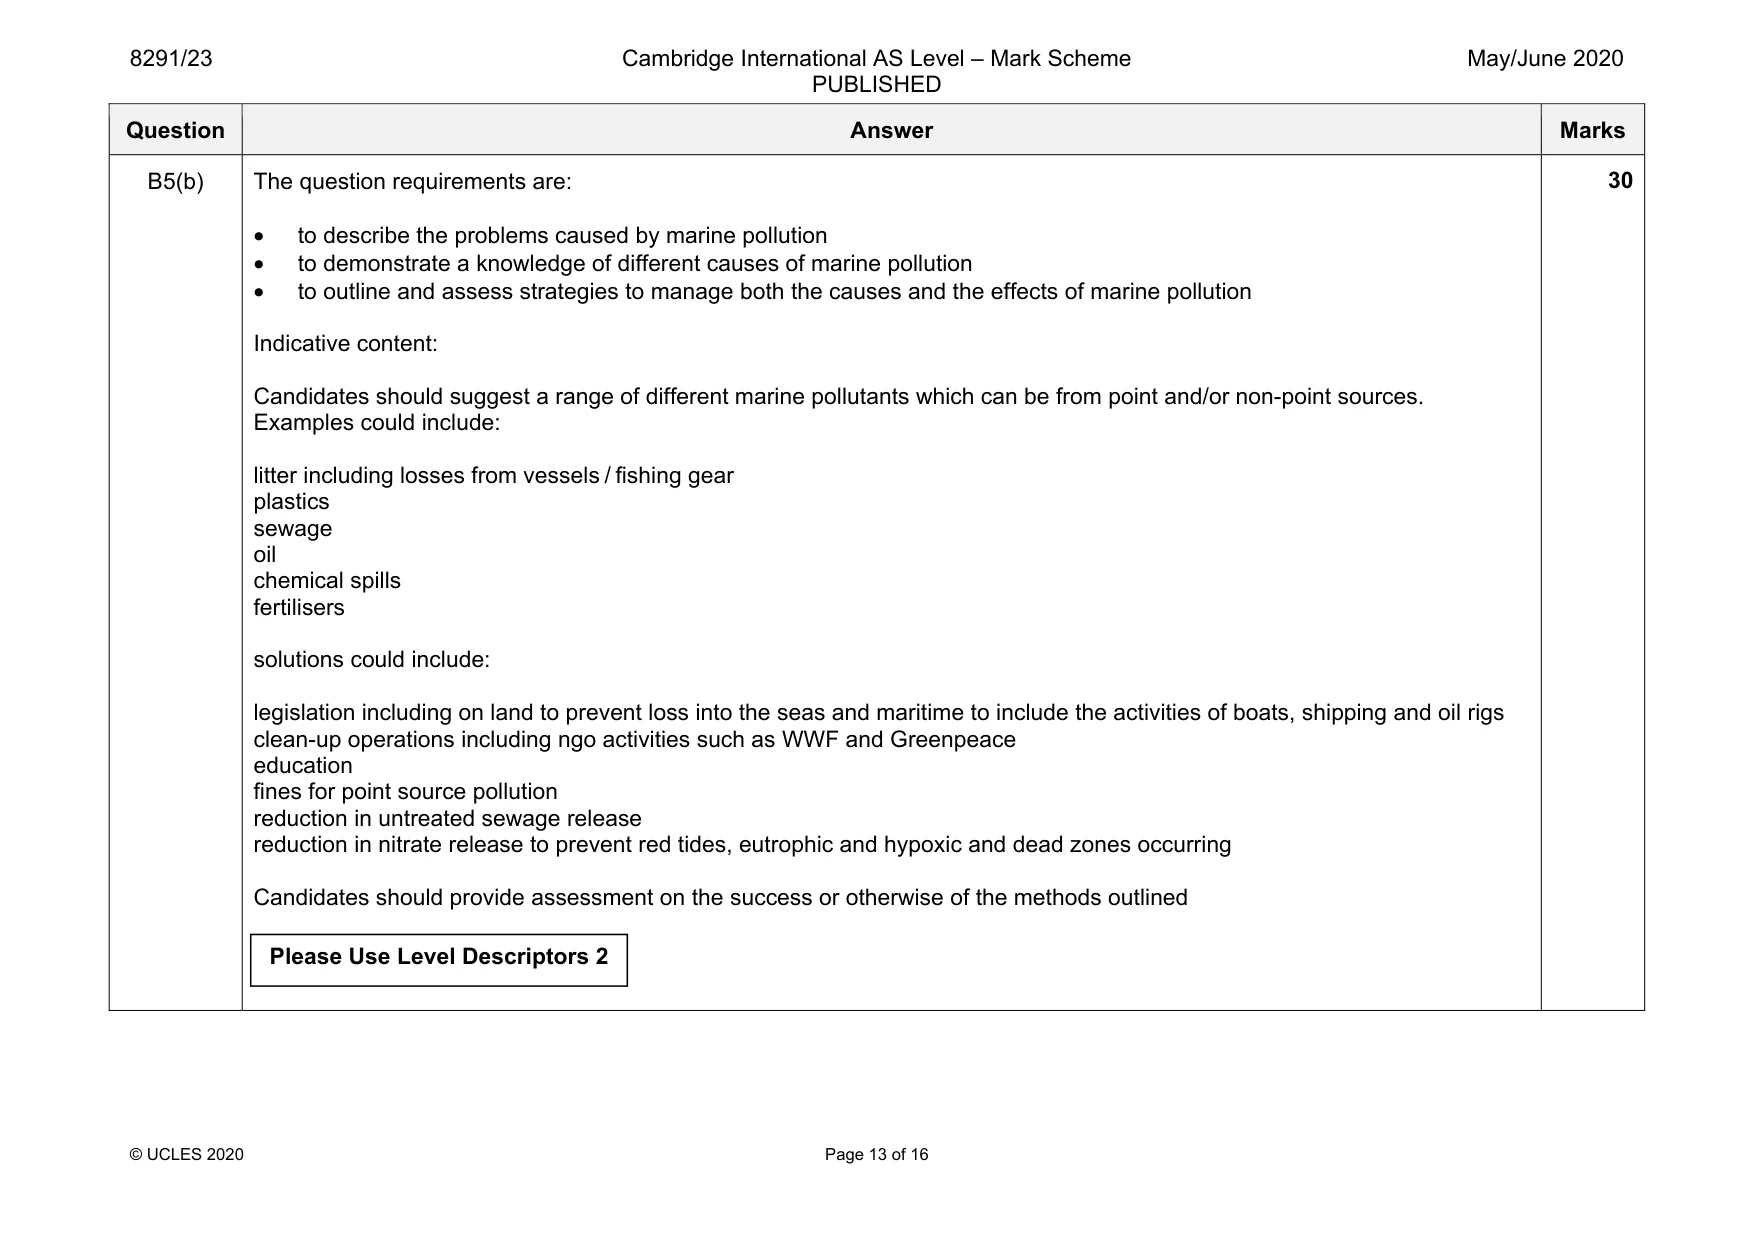
5 Fig. 5.1 is a suggested model for the establishment of marine conservation areas worldwide. No-Use Zone No-Take Zone Buffer Zone Multiple-Use Zone No activities allowed. Measures are taken to Transitional zones from All tourism, fishing protect species whose no-take zones to and activities allowed. populations may be multiple-use zones. affected in other zones / Moderate activities, such areas. Examples include as hook-and-line fishing spawning and nursery and limited tourism are grounds. allowed. Fig. 5.1 (a) Describe and explain how each of the four zones in the suggested model shown in Fig. 5.1 will contribute to marine conservation. [10] (b) The control of marine pollution is a big factor in the success of marine conservation. Evaluate different strategies used to manage the causes and effects of marine pollution. [30] [Total: 40]
What was in this paper
The subtopics covered by these 5 questions, and how many questions each got. Open one in a new tab to see every Cambridge question on it.