Cambridge A Level Environmental Management (AS only) 8291 — 2020 May/June Paper 2 · Variant 1
8291/21/M/J/20 · 5 questions · 160 marks · ≈180 min
The question paper and its mark scheme, free to read here and free to download. This is Cambridge’s own paper, exactly as it was sat.
Question paper12 pages

Mark scheme15 pages
Answers below. Sit the paper first if you are practising.
Questions as text
Q1 · The relationships between nutrient flows and stores for three biomes, P, Q and R
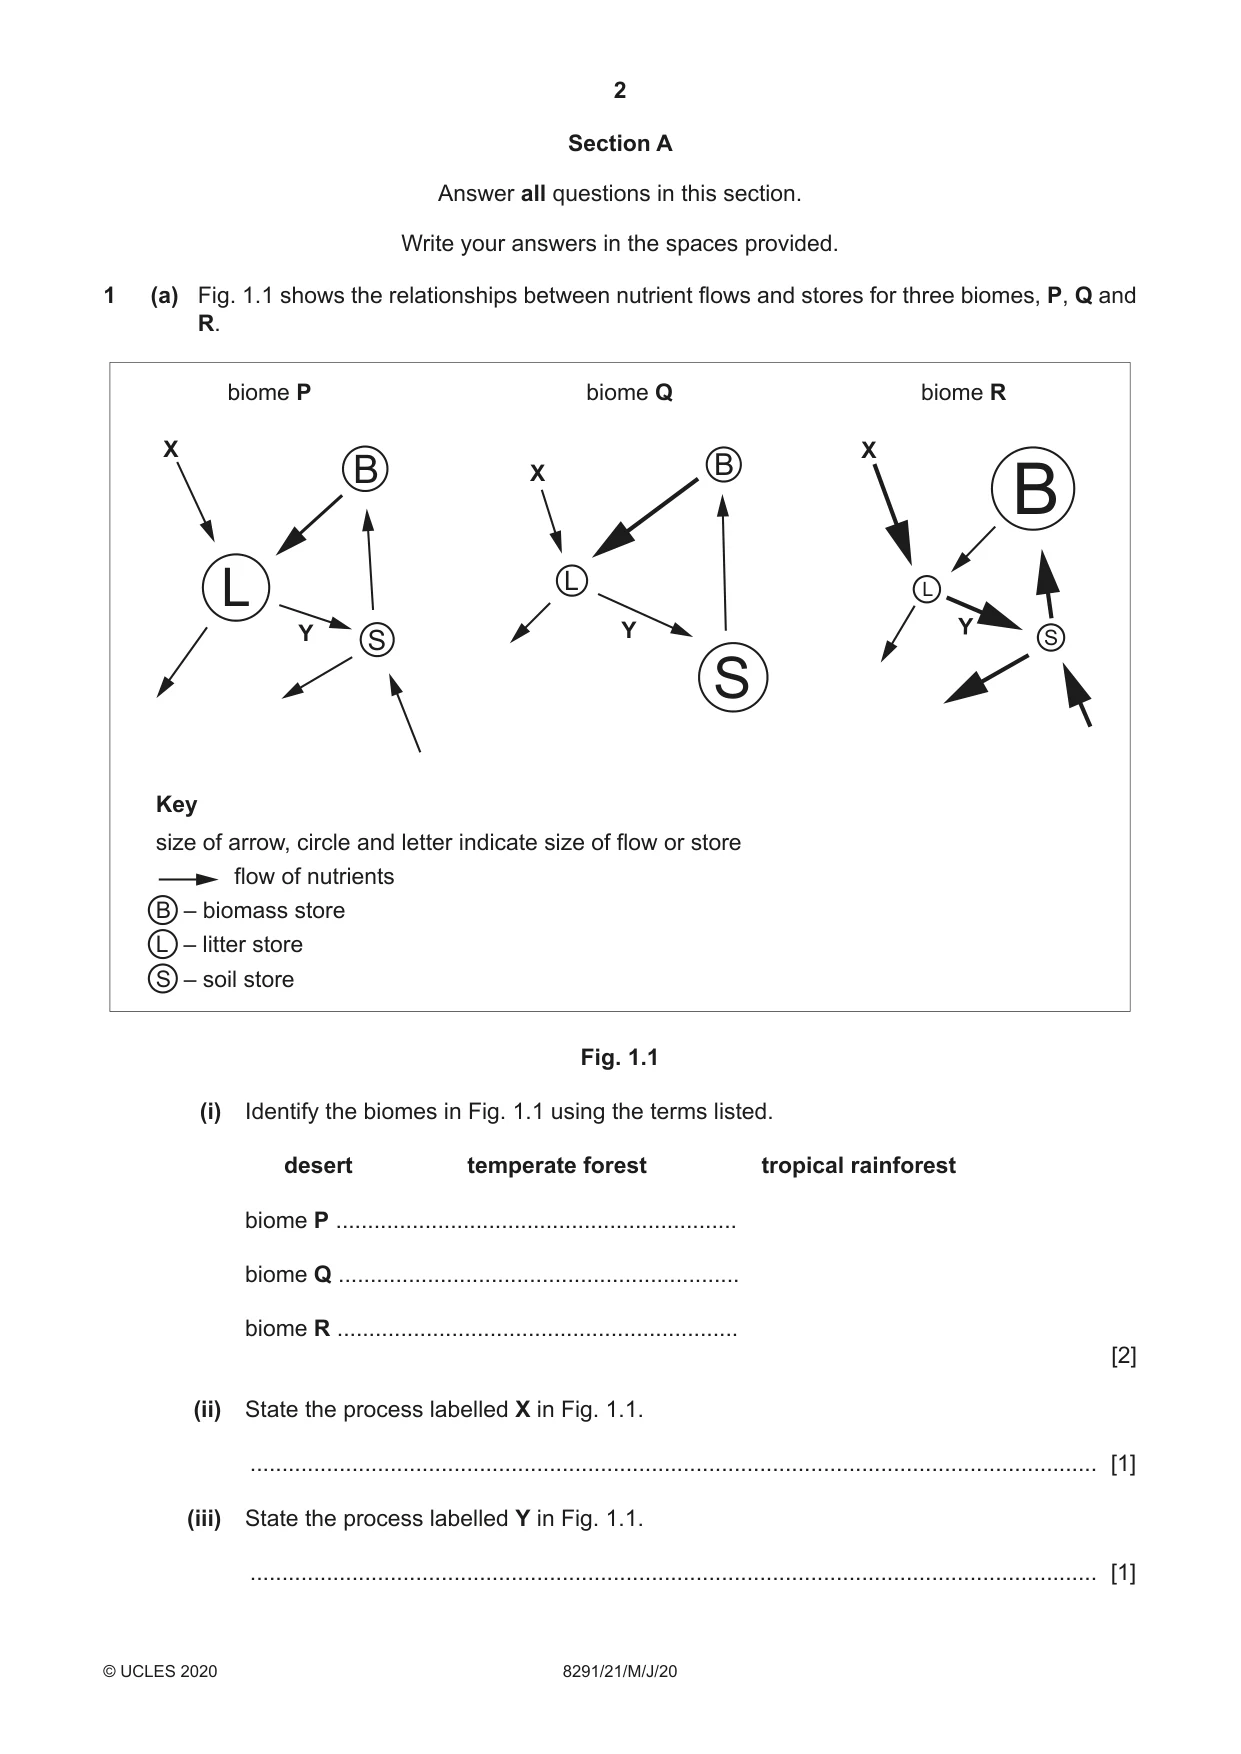
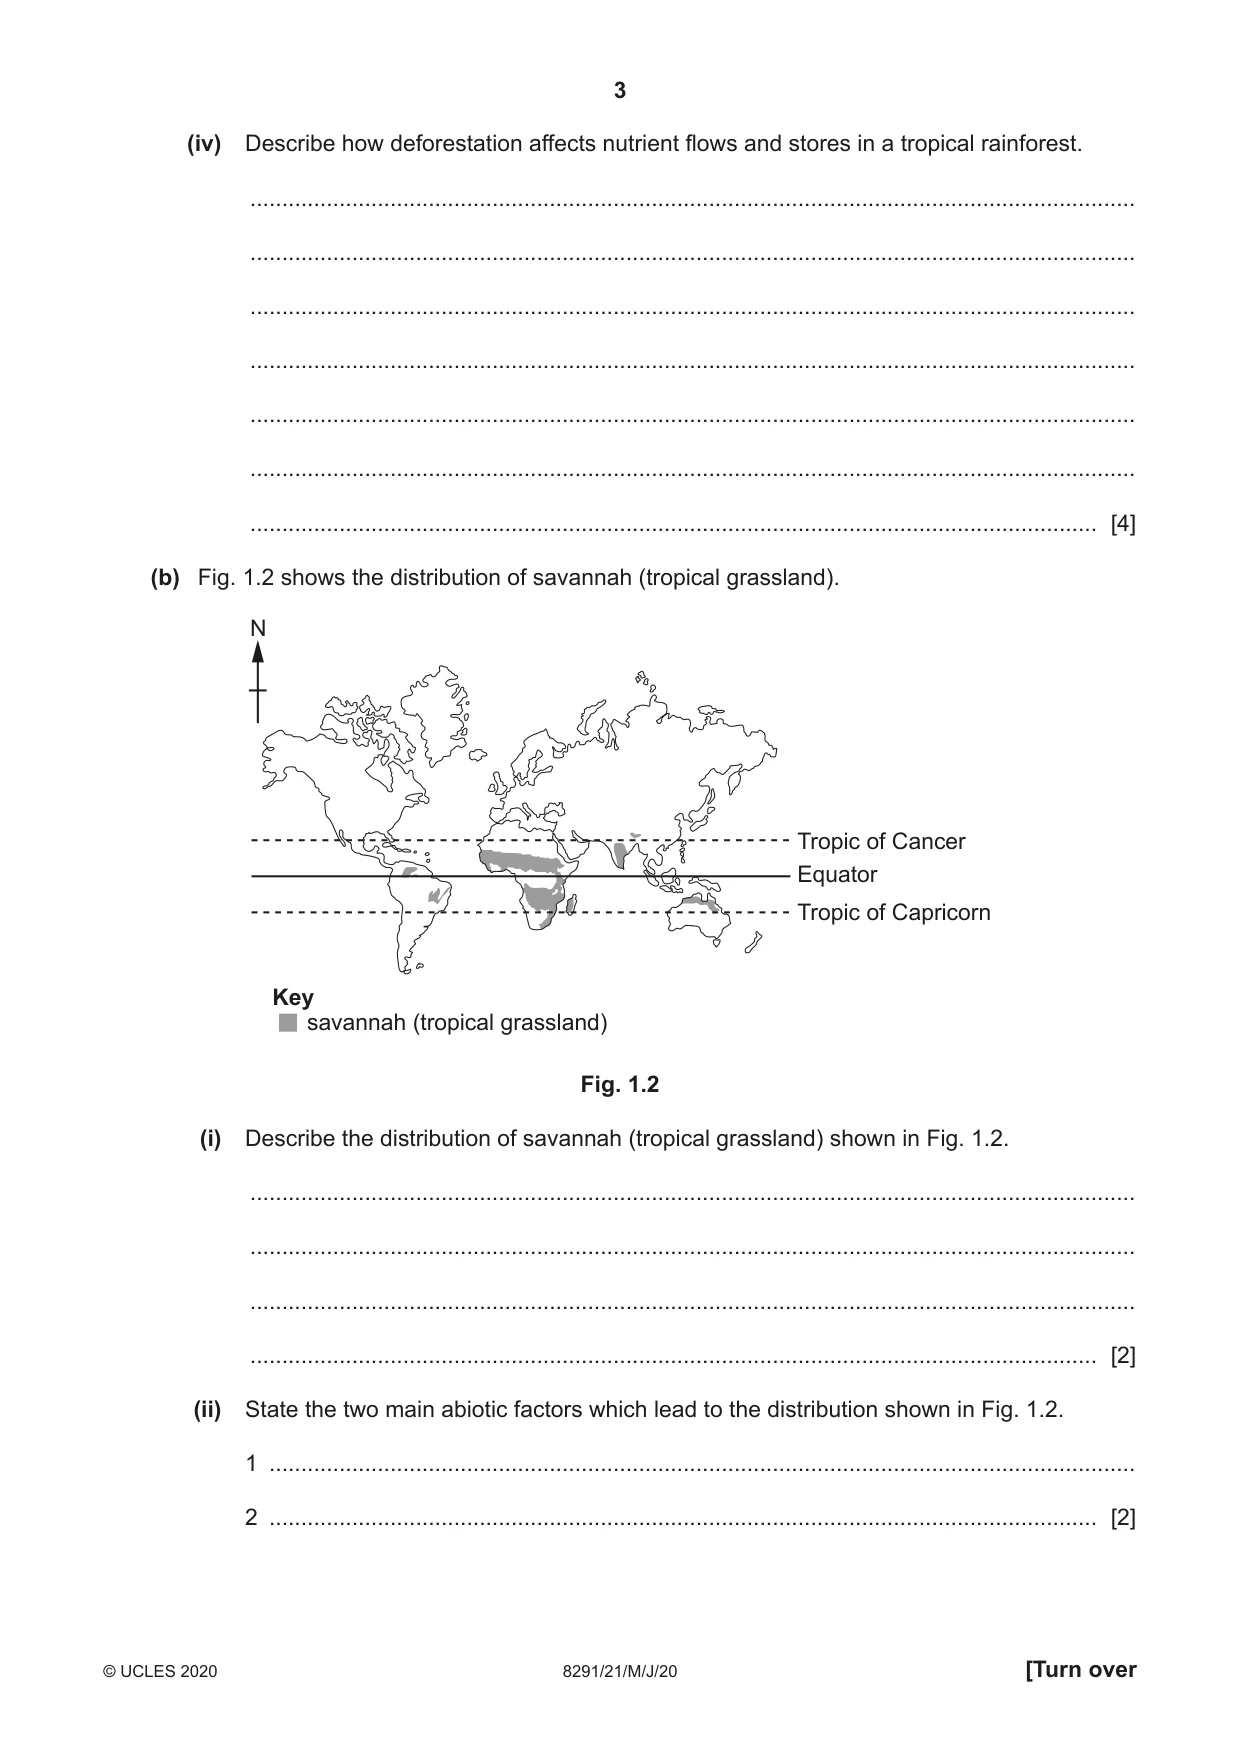
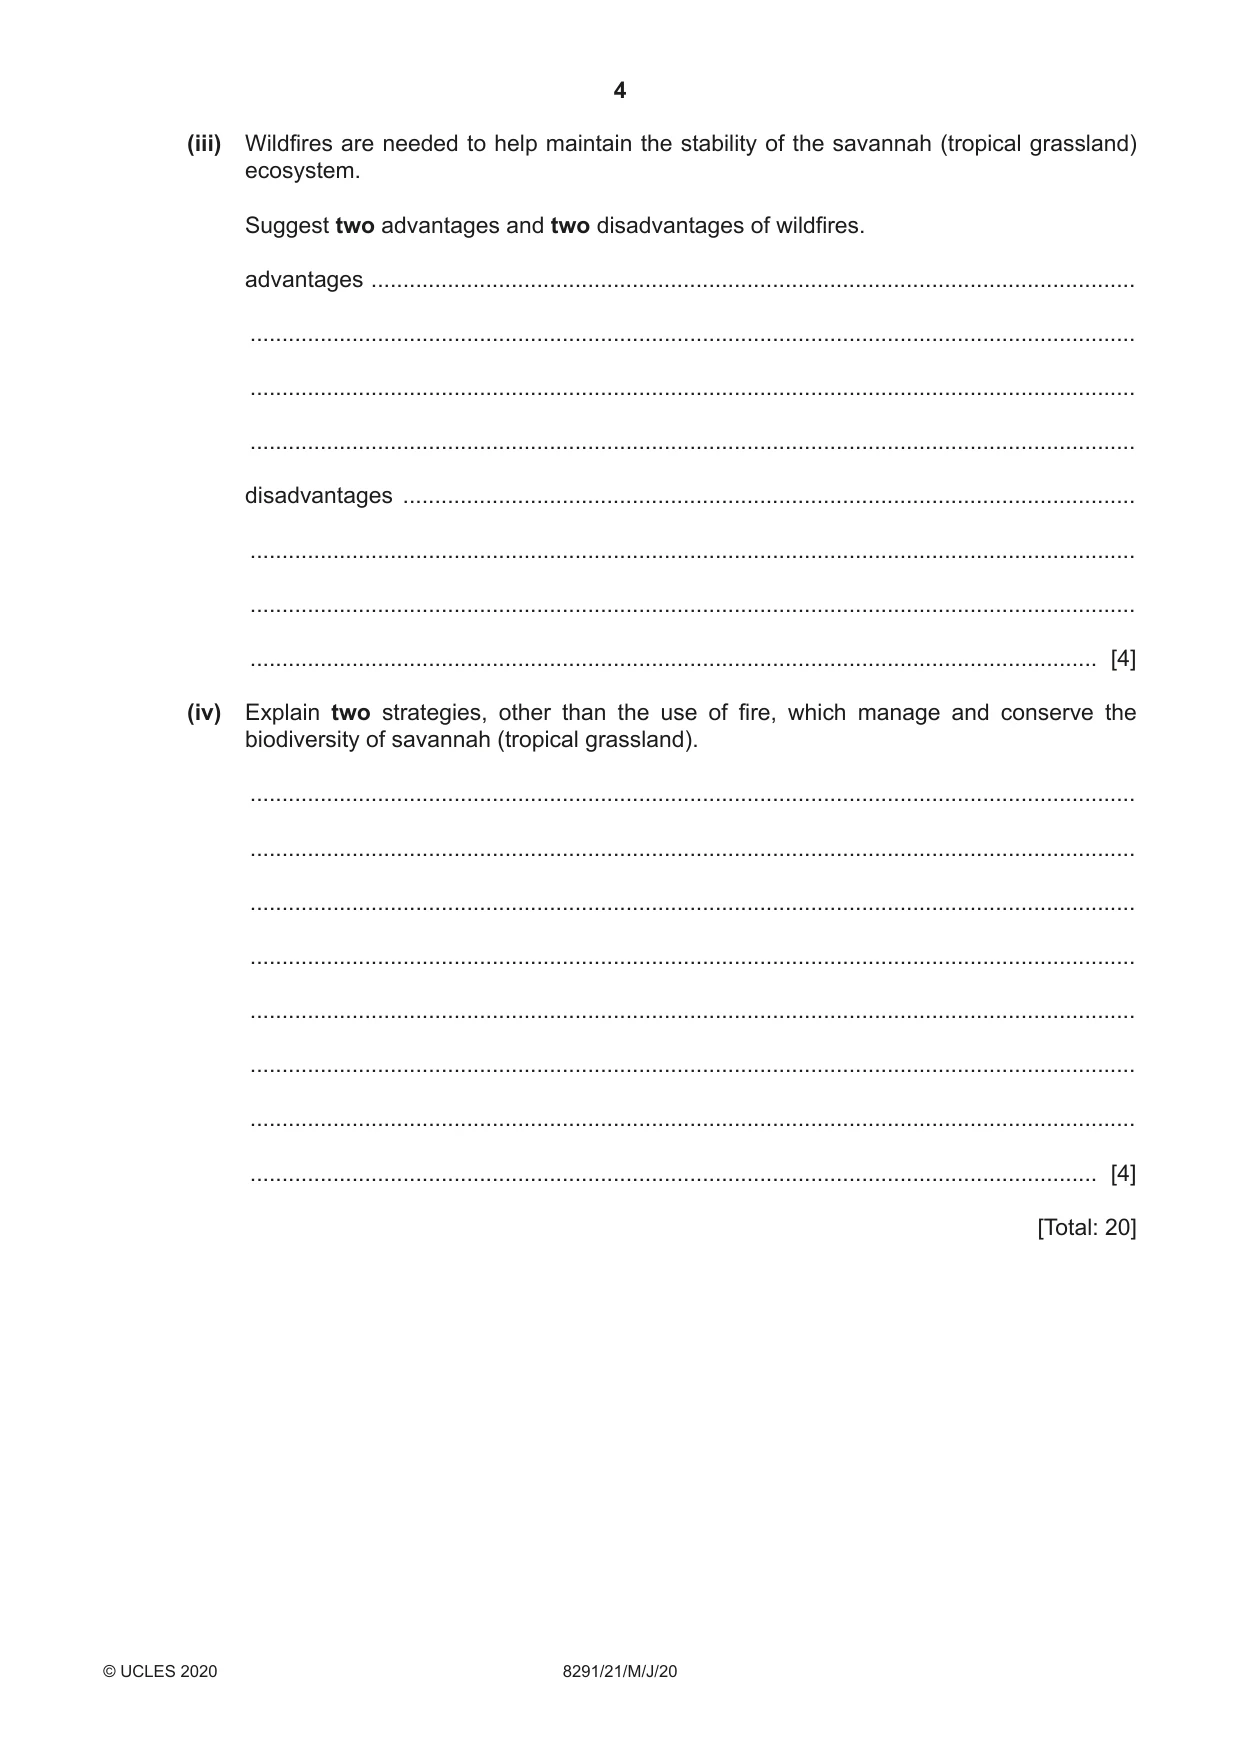
1 (a) Fig. 1.1 shows the relationships between nutrient flows and stores for three biomes, P, Q and R. biome P biome Q biome R X X B X B B L L L Y Y Y S S S Key size of arrow, circle and letter indicate size of flow or store flow of nutrients B – biomass store L – litter store S – soil store Fig. 1.1 (i) Identify the biomes in Fig. 1.1 using the terms listed. desert temperate forest tropical rainforest biome P ............................................................... biome Q ............................................................... biome R ............................................................... [2] (ii) State the process labelled X in Fig. 1.1. ..................................................................................................................................... [1] (iii) State the process labelled Y in Fig. 1.1. ..................................................................................................................................... [1] (iv) Describe how deforestation affects nutrient flows and stores in a tropical rainforest. ........................................................................................................................................... ........................................................................................................................................... ........................................................................................................................................... ........................................................................................................................................... ........................................................................................................................................... ........................................................................................................................................... ..................................................................................................................................... [4] (b) Fig. 1.2 shows the distribution of savannah (tropical grassland). N Tropic of Cancer Equator Tropic of Capricorn Key savannah (tropical grassland) Fig. 1.2 (i) Describe the distribution of savannah (tropical grassland) shown in Fig. 1.2. ........................................................................................................................................... ........................................................................................................................................... ........................................................................................................................................... ..................................................................................................................................... [2] (ii) State the two main abiotic factors which lead to the distribution shown in Fig. 1.2. 1 ........................................................................................................................................ 2 .................................................................................................................................. [2] (iii) Wildfires are needed to help maintain the stability of the savannah (tropical grassland) ecosystem. Suggest two advantages and two disadvantages of wildfires. advantages ........................................................................................................................ ........................................................................................................................................... ........................................................................................................................................... ........................................................................................................................................... disadvantages ................................................................................................................... ........................................................................................................................................... ........................................................................................................................................... ..................................................................................................................................... [4] (iv) Explain two strategies, other than the use of fire, which manage and conserve the biodiversity of savannah (tropical grassland). ........................................................................................................................................... ........................................................................................................................................... ........................................................................................................................................... ........................................................................................................................................... ........................................................................................................................................... ........................................................................................................................................... ........................................................................................................................................... ..................................................................................................................................... [4] [Total: 20]
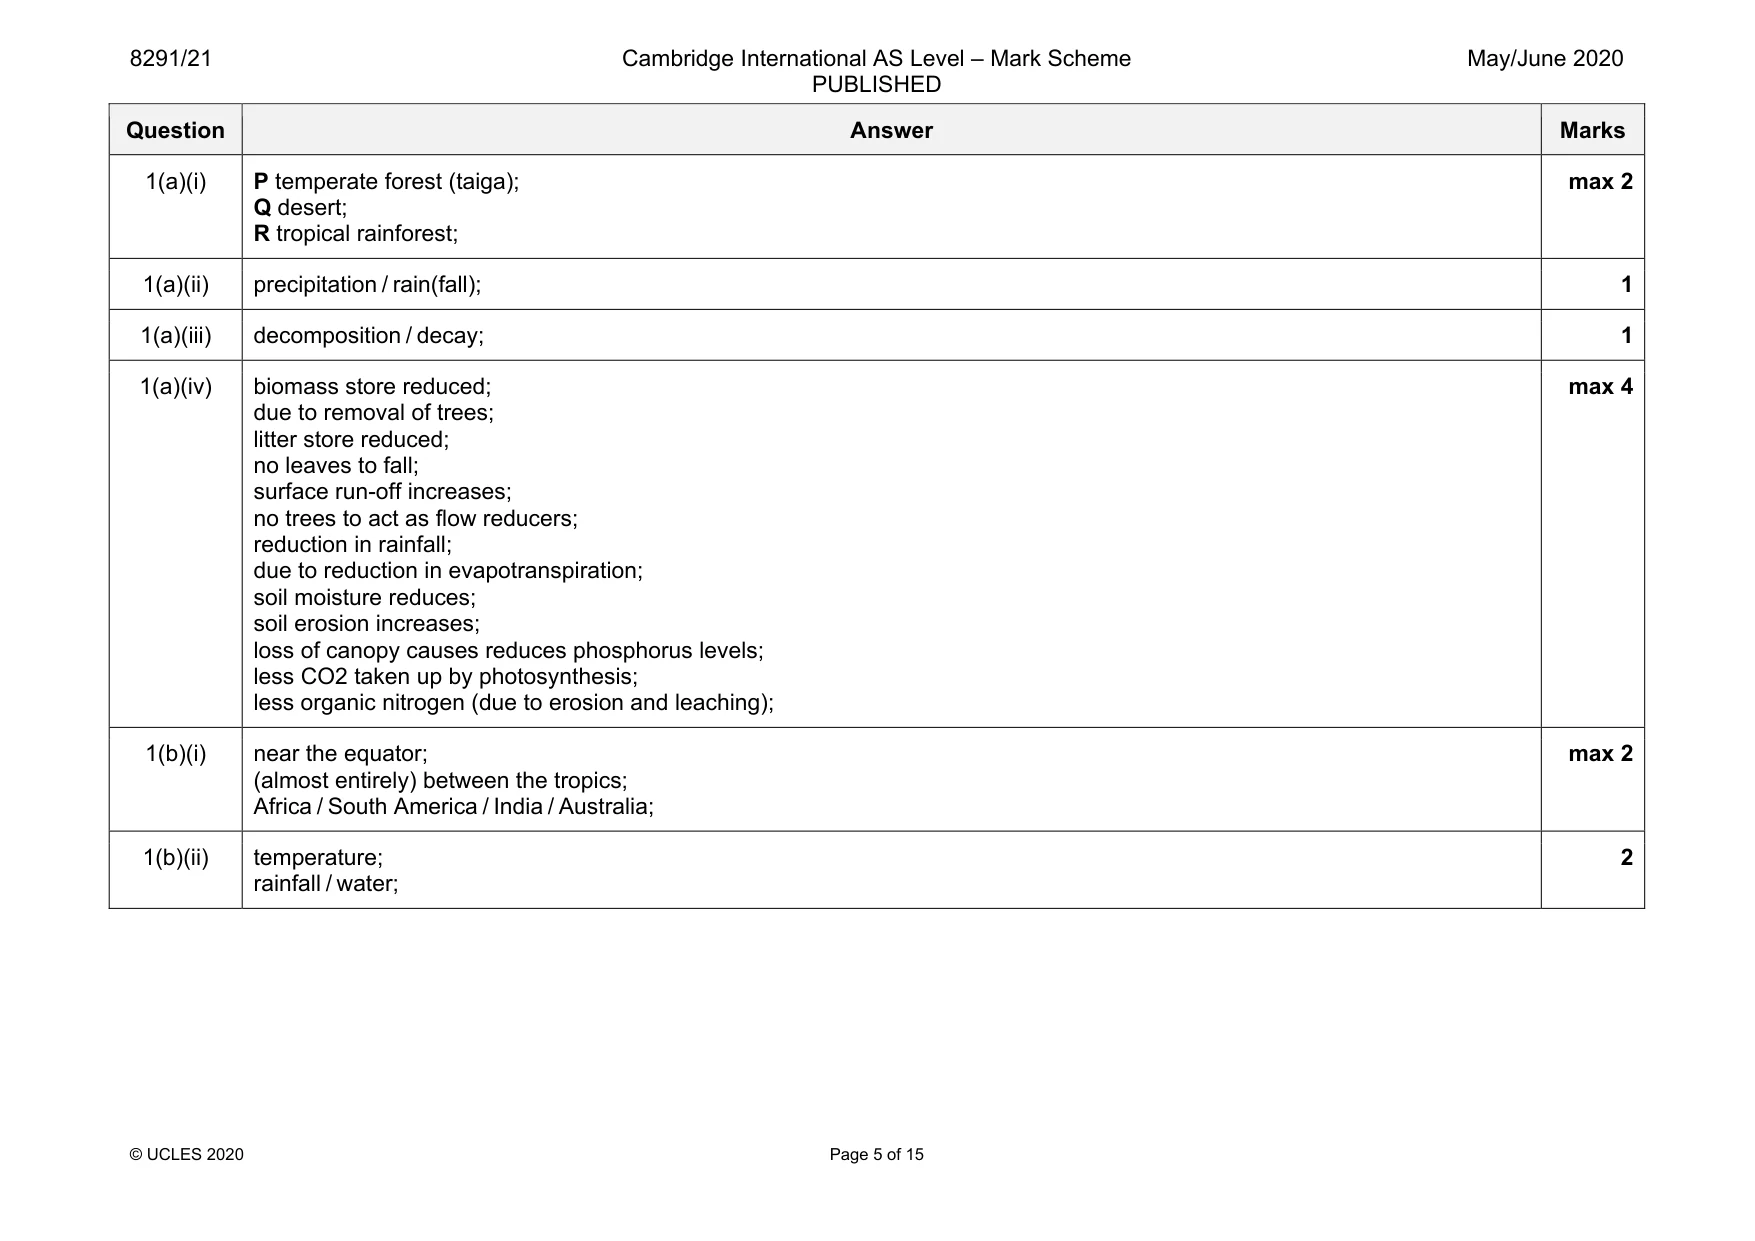
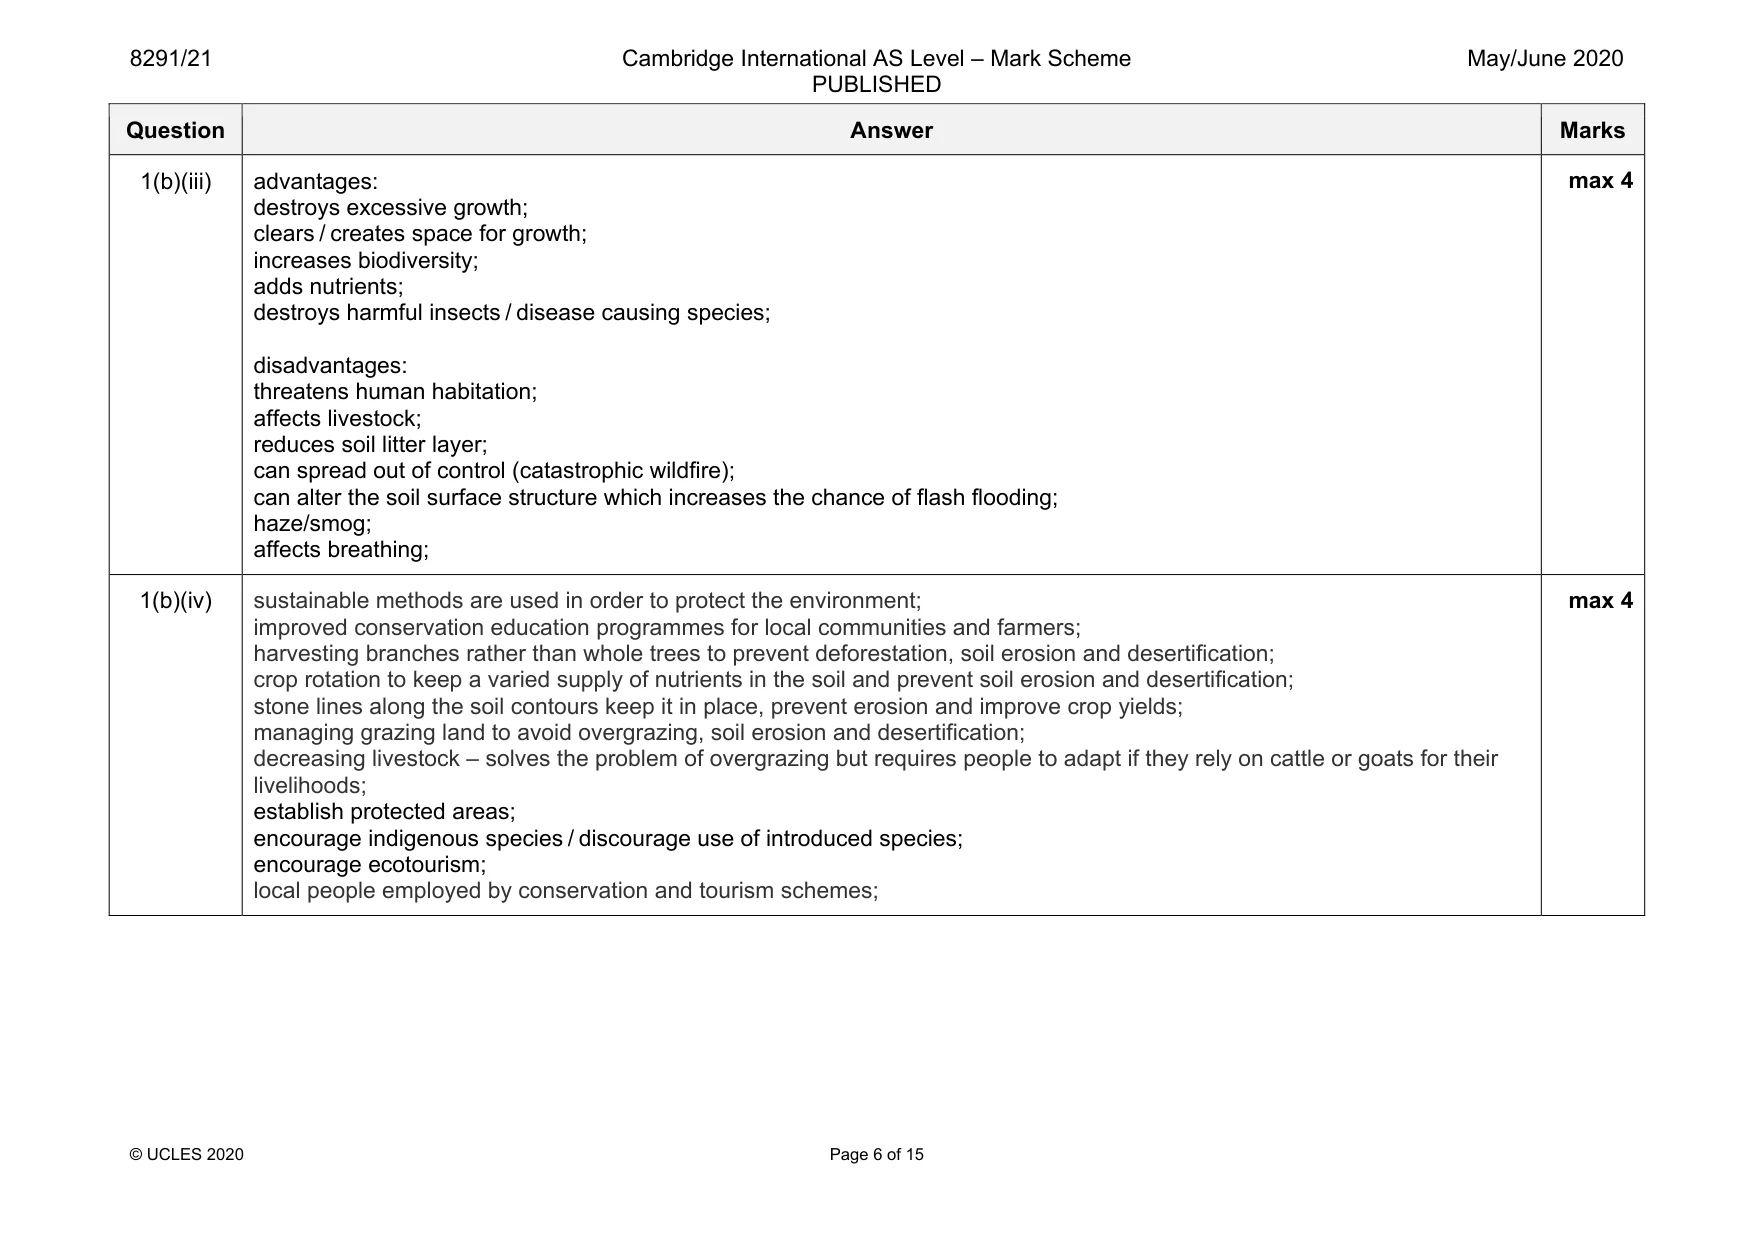
Mark scheme: 1(a)(i) P temperate forest (taiga); Q desert; R tropical rainforest; max 2 1(a)(ii) precipitation / rain(fall); 1 1(a)(iii) decomposition / decay; 1 1(a)(iv) biomass store reduced; due to removal of trees; litter store reduced; no leaves to fall; surface run-off increases; no trees to act as flow reducers; reduction in rainfall; due to reduction in evapotranspiration; soil moisture reduces; soil erosion increases; loss of canopy causes reduces phosphorus levels; less CO2 taken up by photosynthesis; less organic nitrogen (due to erosion and leaching); max 4 1(b)(i) near the equator; (almost entirely) between the tropics; Africa / South America / India / Australia; max 2 1(b)(ii) temperature; rainfall / water; 2 Question Answer Marks 1(b)(iii) advantages: destroys excessive growth; clears / creates space for growth; increases biodiversity; adds nutrients; destroys harmful insects / disease causing species; disadvantages: threatens human habitation; affects livestock; reduces soil litter layer; can spread out of control (catastrophic wildfire); can alter the soil surface structure which increases the chance of flash flooding; haze/smog; affects breathing; max 4 1(b)(iv) sustainable methods are used in order to protect the environment; improved conservation education programmes for local communities and farmers; harvesting branches rather than whole trees to prevent deforestation, soil erosion and desertification; crop rotation to keep a varied supply of nutrients in the soil and prevent soil erosion and desertification; stone lines along the soil contours keep it in place, prevent erosion and improve crop yields; managing grazing land to avoid overgrazing, soil erosion and desertification; decreasing livestock – solves the problem of overgrazing but requires people to adapt if they rely on cattle or goats for their livelihoods; establish protected areas; encourage indigenous species / discourage use of introduced species; encourage ecotourism; local people employed by conservation and tourism schemes; max 4
Q2 · A graph showing the demand for water by sector in China for 2005, 2015 and predicted…
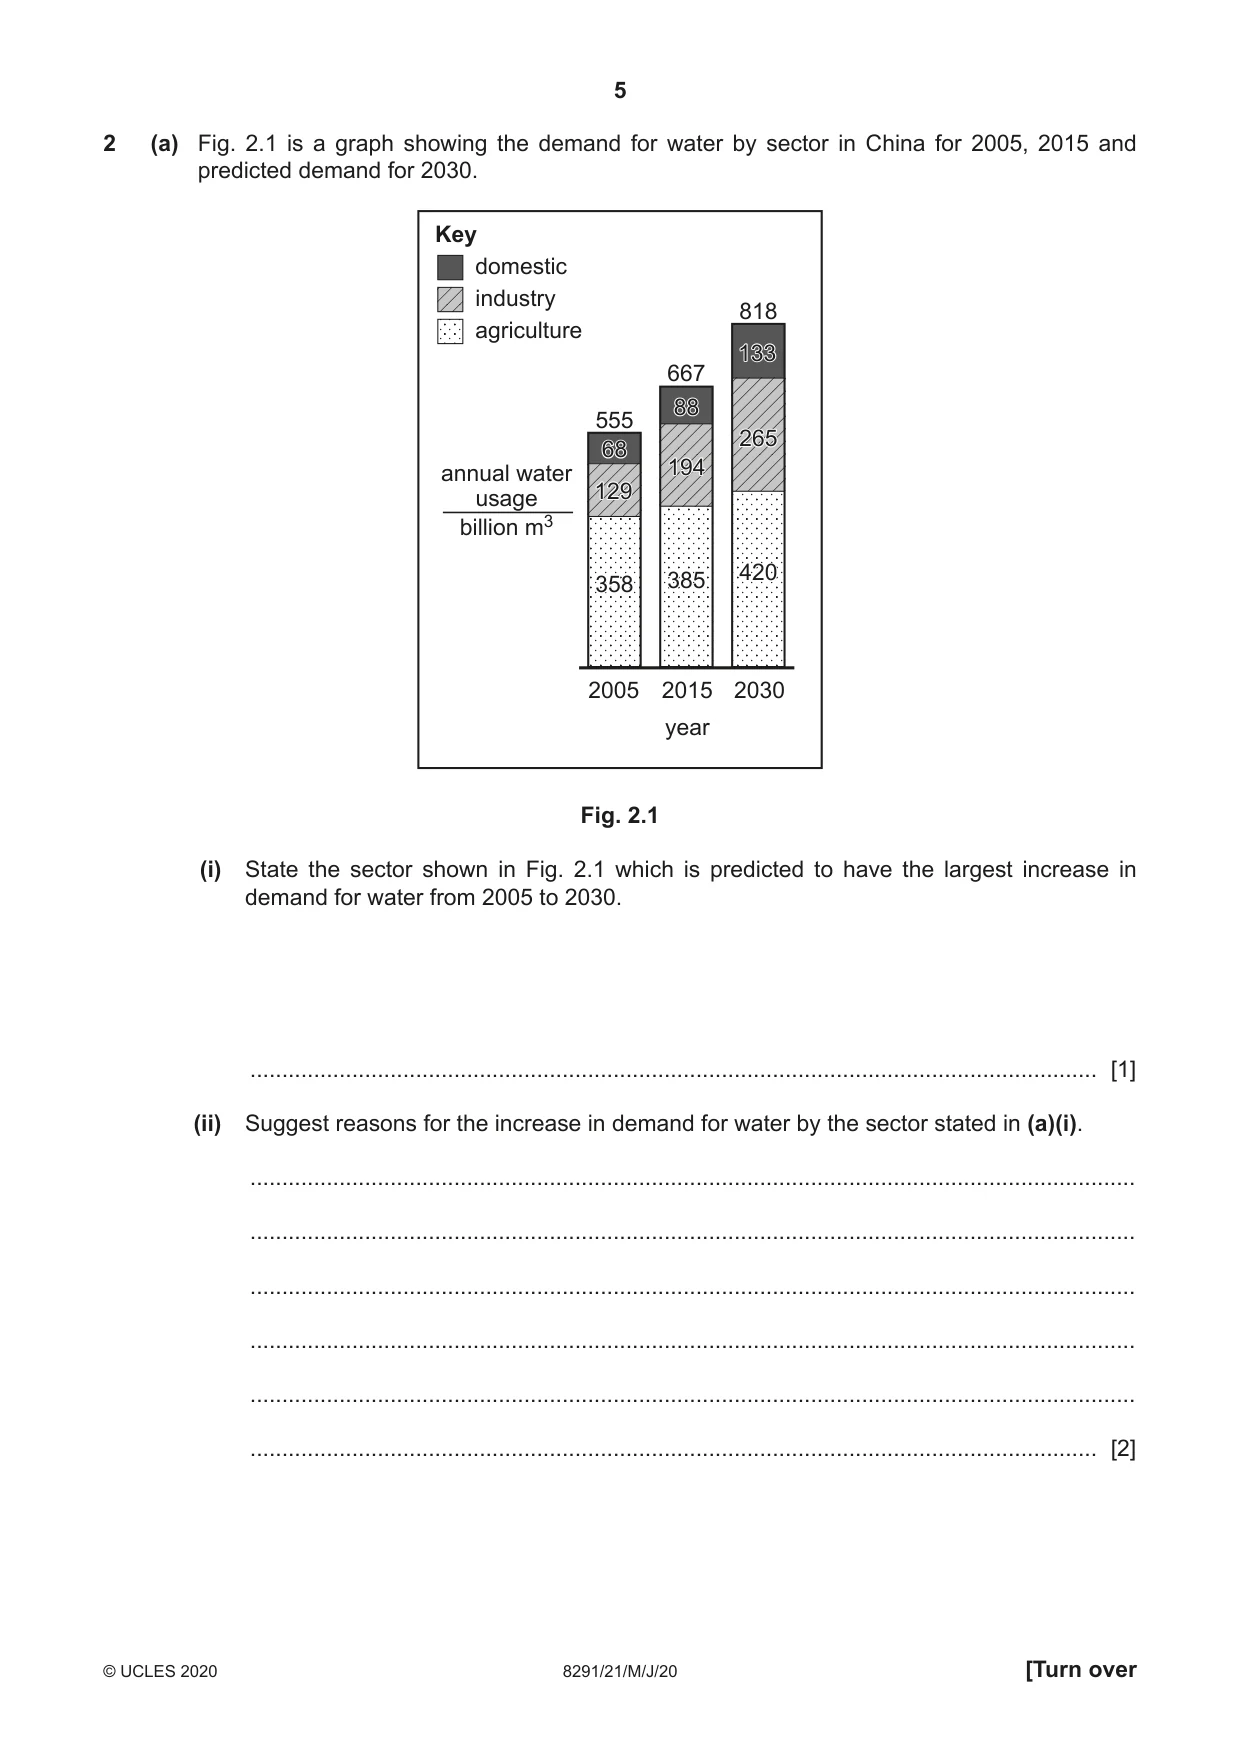
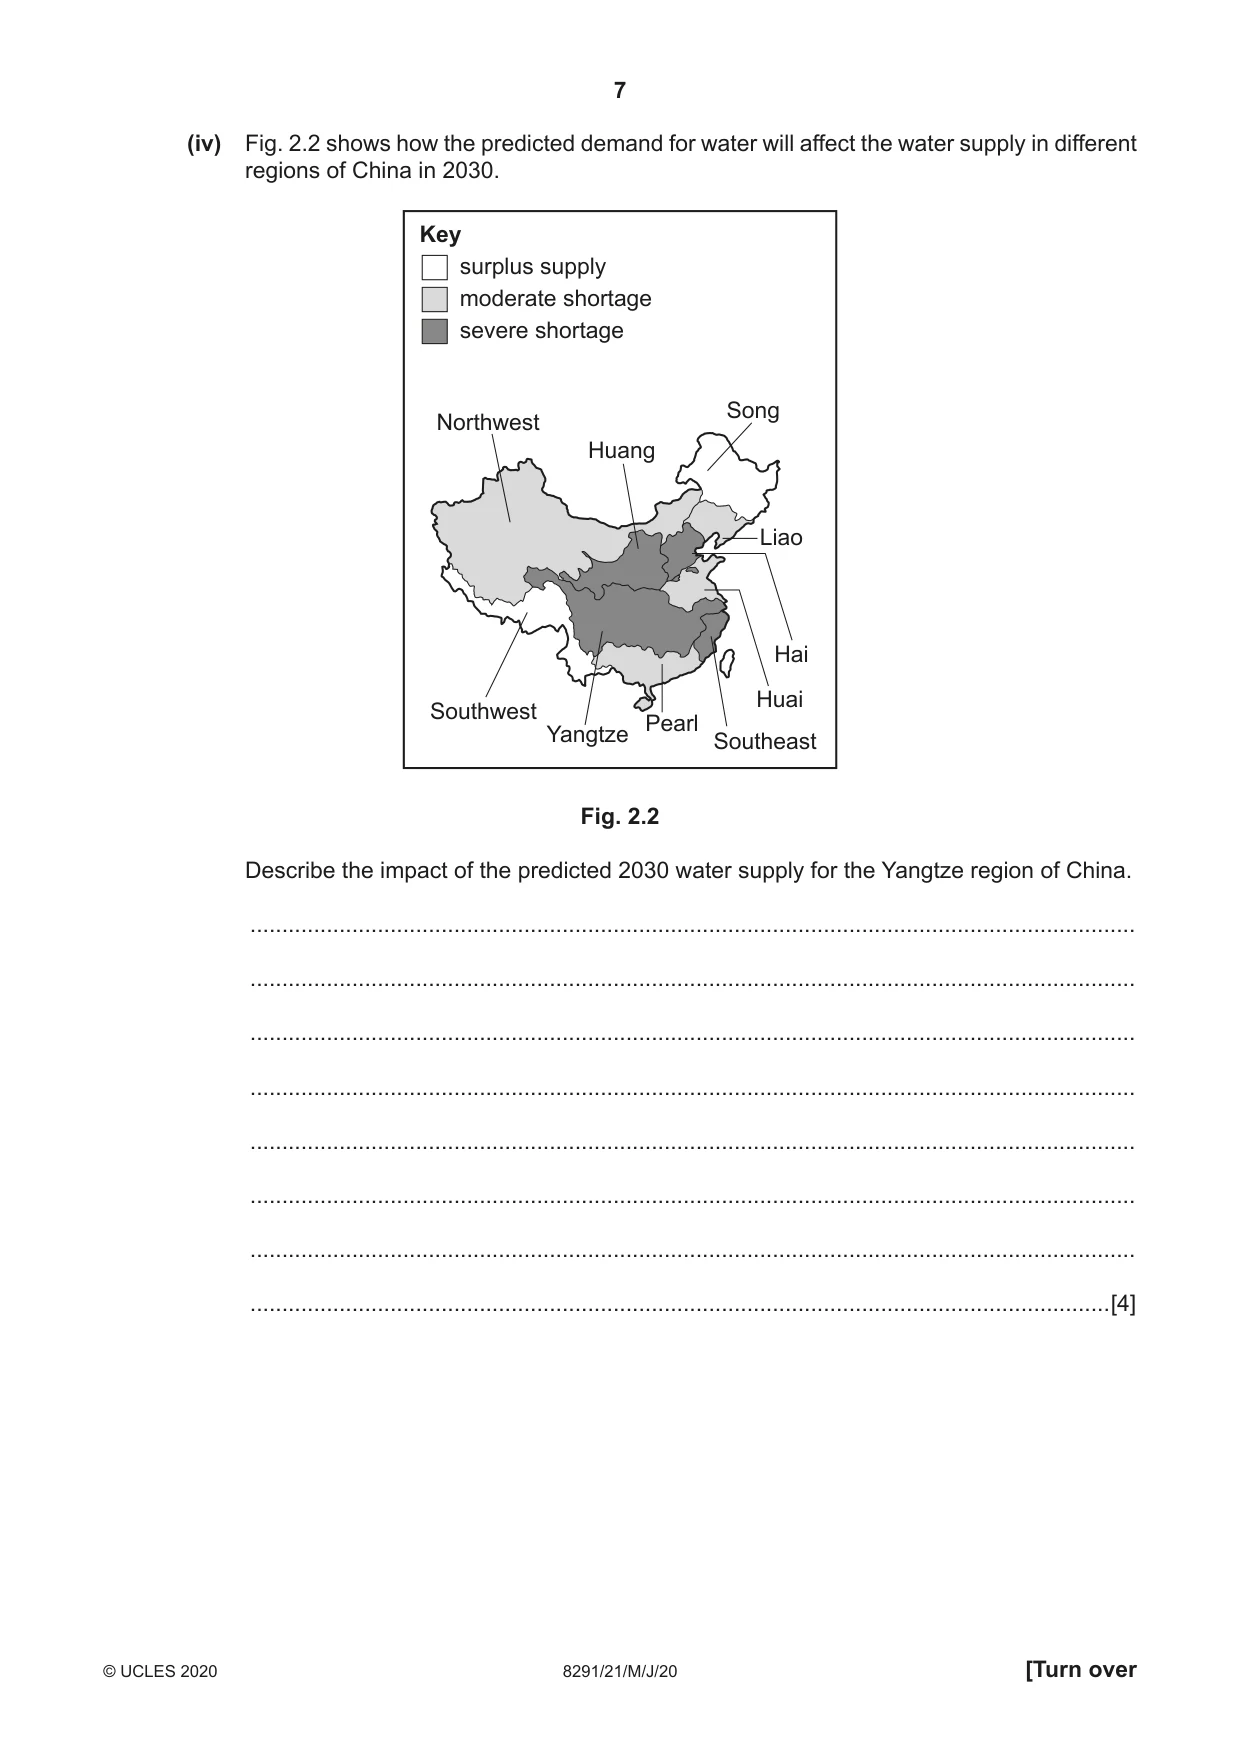
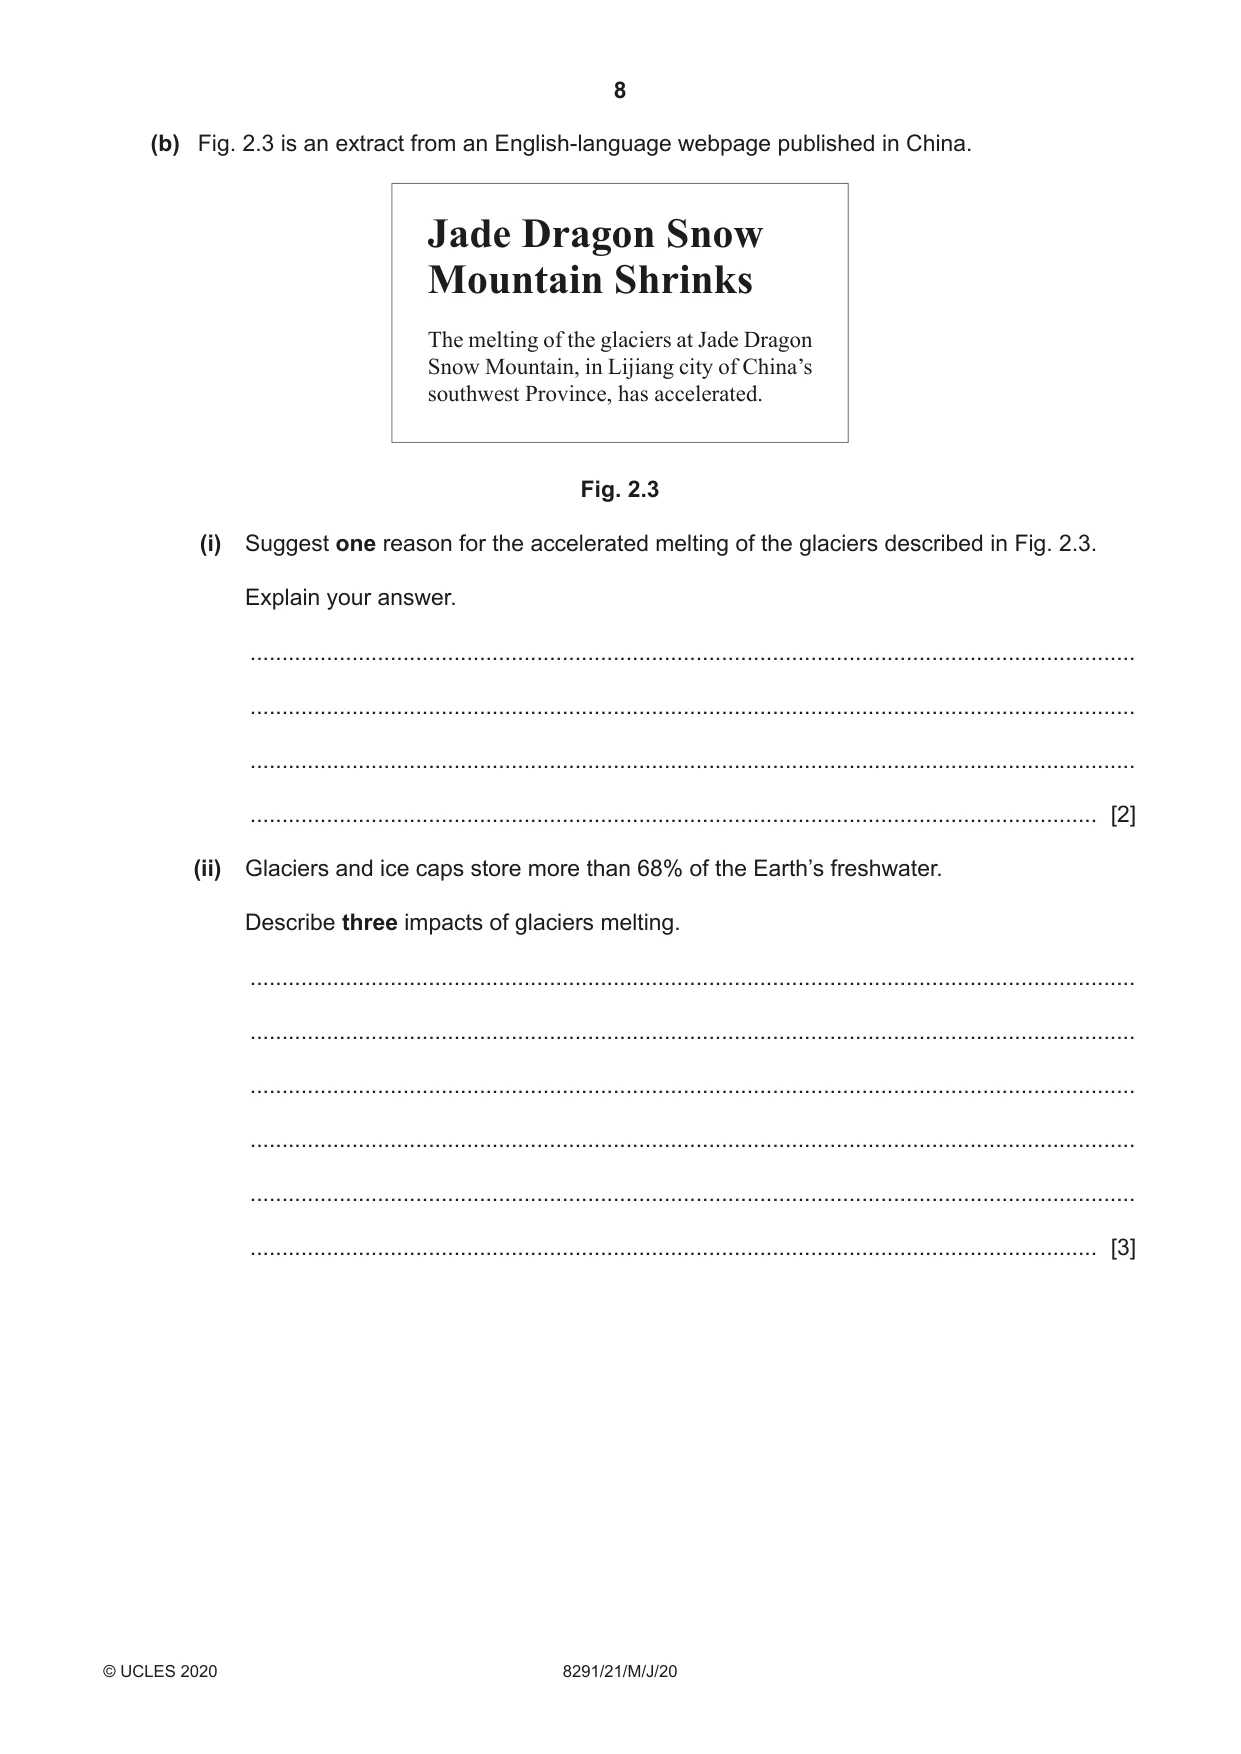
2 (a) Fig. 2.1 is a graph showing the demand for water by sector in China for 2005, 2015 and predicted demand for 2030. Key domestic industry 818 agriculture 133133 667 8888 555 265265 6868 194194 annual water 129129 usage billion m3 420420 358358 385385 2005 2015 2030 year Fig. 2.1 (i) State the sector shown in Fig. 2.1 which is predicted to have the largest increase in demand for water from 2005 to 2030. ..................................................................................................................................... [1] (ii) Suggest reasons for the increase in demand for water by the sector stated in (a)(i). ........................................................................................................................................... ........................................................................................................................................... ........................................................................................................................................... ........................................................................................................................................... ........................................................................................................................................... ..................................................................................................................................... [2] (iii) Describe four ways China might manage the increase in demand for water shown in Fig. 2.1. ........................................................................................................................................... ........................................................................................................................................... ........................................................................................................................................... ........................................................................................................................................... ........................................................................................................................................... ........................................................................................................................................... ........................................................................................................................................... ..................................................................................................................................... [4] (iv) Fig. 2.2 shows how the predicted demand for water will affect the water supply in different regions of China in 2030. Key surplus supply moderate shortage severe shortage Song Northwest Huang Liao Hai Huai Southwest Pearl Yangtze Southeast Fig. 2.2 Describe the impact of the predicted 2030 water supply for the Yangtze region of China. ........................................................................................................................................... ........................................................................................................................................... ........................................................................................................................................... ........................................................................................................................................... ........................................................................................................................................... ........................................................................................................................................... ........................................................................................................................................... .......................................................................................................................................[4] (b) Fig. 2.3 is an extract from an English-language webpage published in China. Jade Dragon Snow Mountain Shrinks The melting of the glaciers at Jade Dragon Snow Mountain, in Lijiang city of China’s southwest Province, has accelerated. Fig. 2.3 (i) Suggest one reason for the accelerated melting of the glaciers described in Fig. 2.3. Explain your answer. ........................................................................................................................................... ........................................................................................................................................... ........................................................................................................................................... ..................................................................................................................................... [2] (ii) Glaciers and ice caps store more than 68% of the Earth’s freshwater. Describe three impacts of glaciers melting. ........................................................................................................................................... ........................................................................................................................................... ........................................................................................................................................... ........................................................................................................................................... ........................................................................................................................................... ..................................................................................................................................... [3] (c) Describe the impacts of pollution due to human activity on a named water store. Include the source of this pollution in your answer. ................................................................................................................................................... ................................................................................................................................................... ................................................................................................................................................... ................................................................................................................................................... ................................................................................................................................................... ................................................................................................................................................... ................................................................................................................................................... ............................................................................................................................................. [4] [Total: 20]
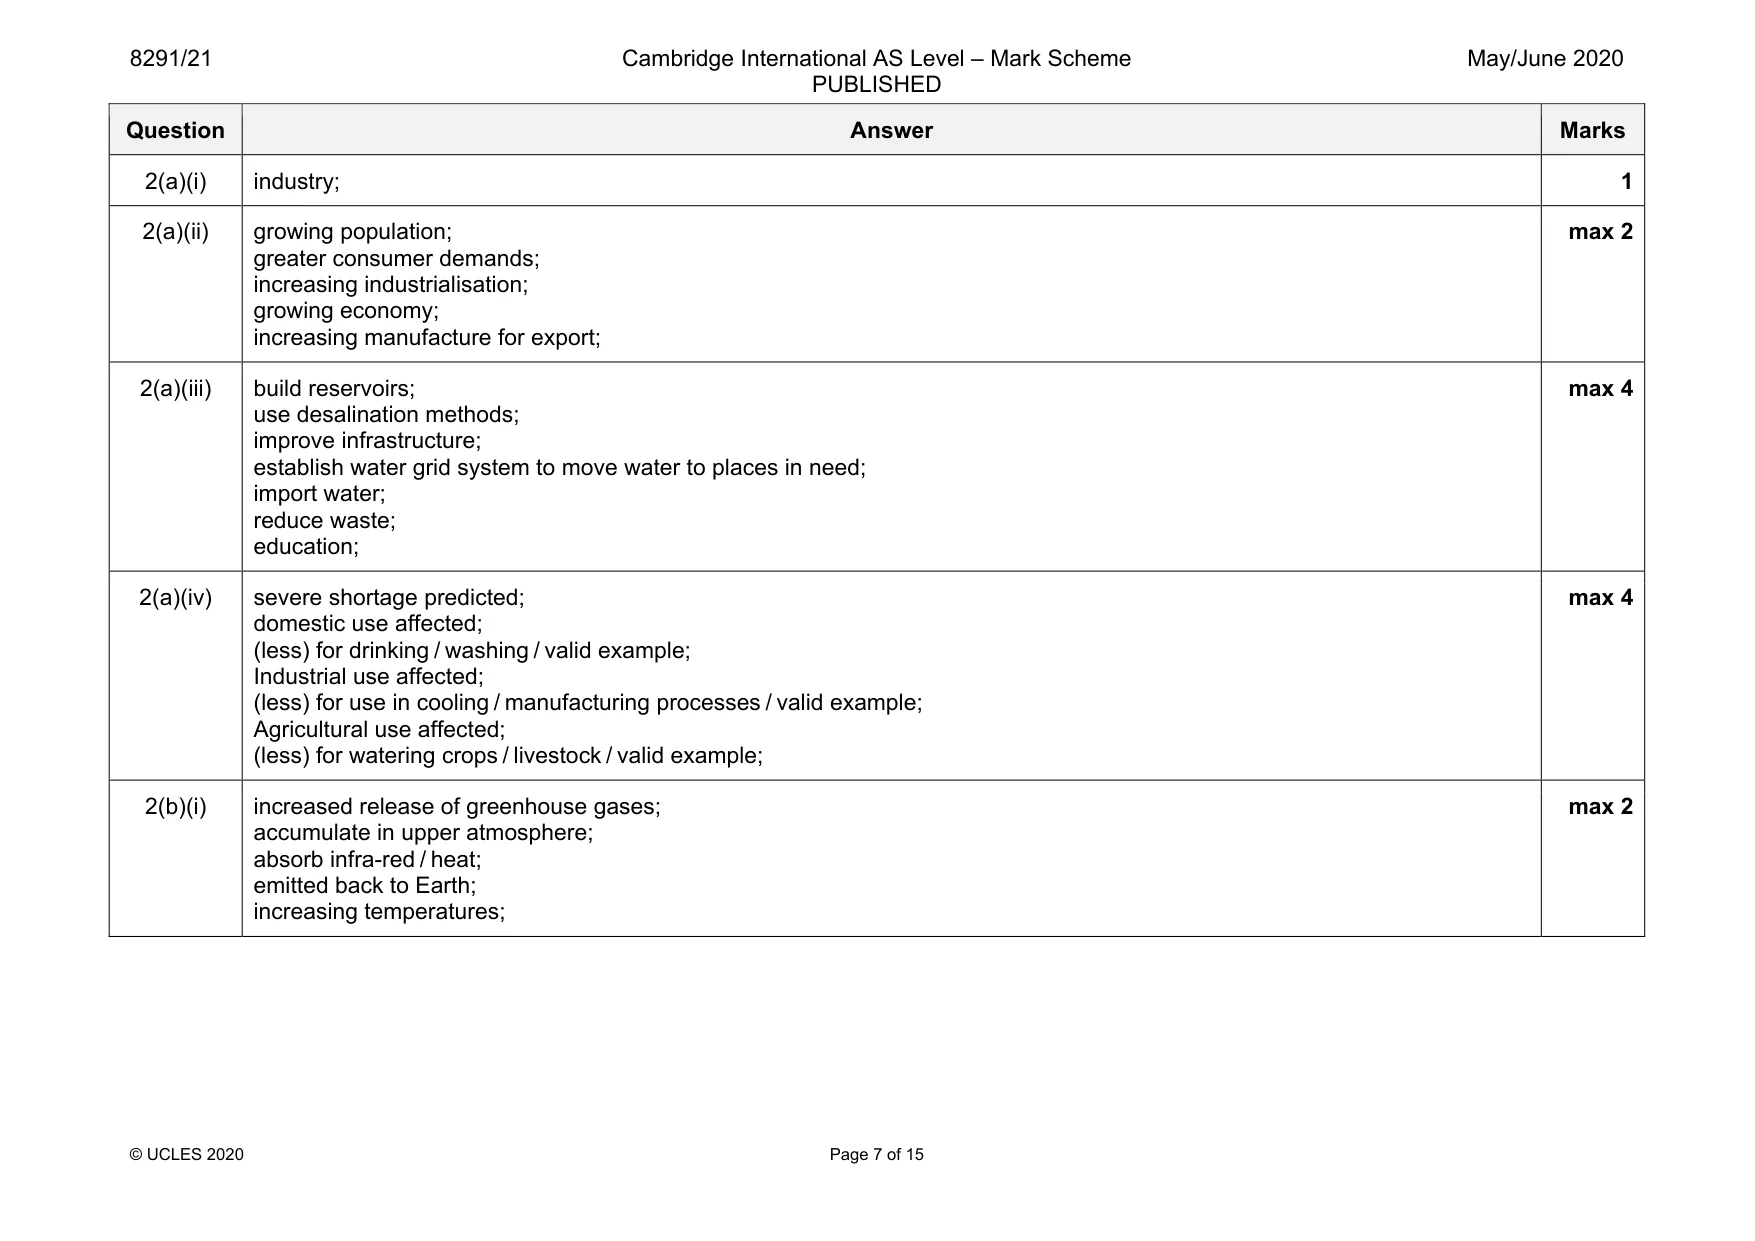
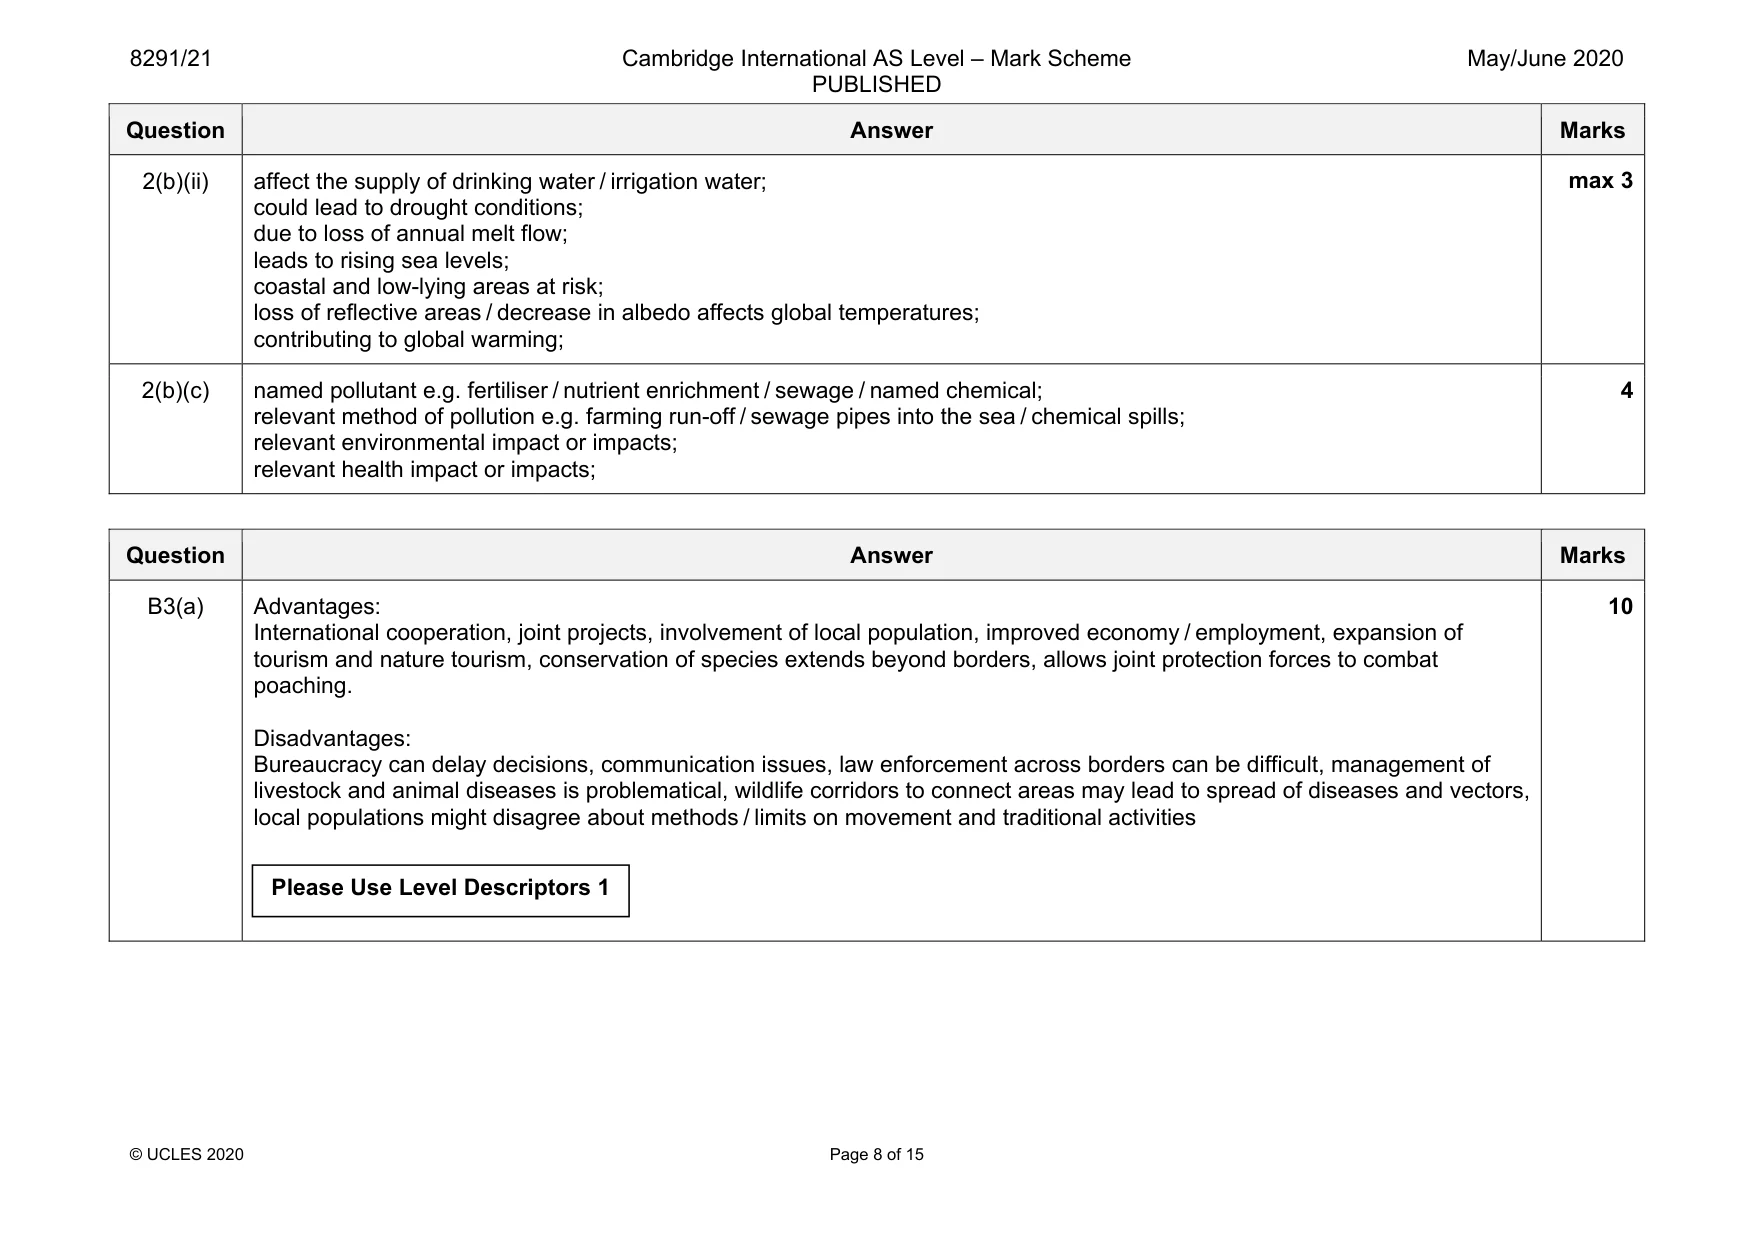
Mark scheme: 2(a)(i) industry; 1 2(a)(ii) growing population; greater consumer demands; increasing industrialisation; growing economy; increasing manufacture for export; max 2 2(a)(iii) build reservoirs; use desalination methods; improve infrastructure; establish water grid system to move water to places in need; import water; reduce waste; education; max 4 2(a)(iv) severe shortage predicted; domestic use affected; (less) for drinking / washing / valid example; Industrial use affected; (less) for use in cooling / manufacturing processes / valid example; Agricultural use affected; (less) for watering crops / livestock / valid example; max 4 2(b)(i) increased release of greenhouse gases; accumulate in upper atmosphere; absorb infra-red / heat; emitted back to Earth; increasing temperatures; max 2 Question Answer Marks 2(b)(ii) affect the supply of drinking water / irrigation water; could lead to drought conditions; due to loss of annual melt flow; leads to rising sea levels; coastal and low-lying areas at risk; loss of reflective areas / decrease in albedo affects global temperatures; contributing to global warming; max 3 2(b)(c) named pollutant e.g. fertiliser / nutrient enrichment / sewage / named chemical; relevant method of pollution e.g. farming run-off / sewage pipes into the sea / chemical spills; relevant environmental impact or impacts; relevant health impact or impacts; 4
Q3 · The Great Limpopo Trans-Frontier Park and Conservation Area, a joint project between…
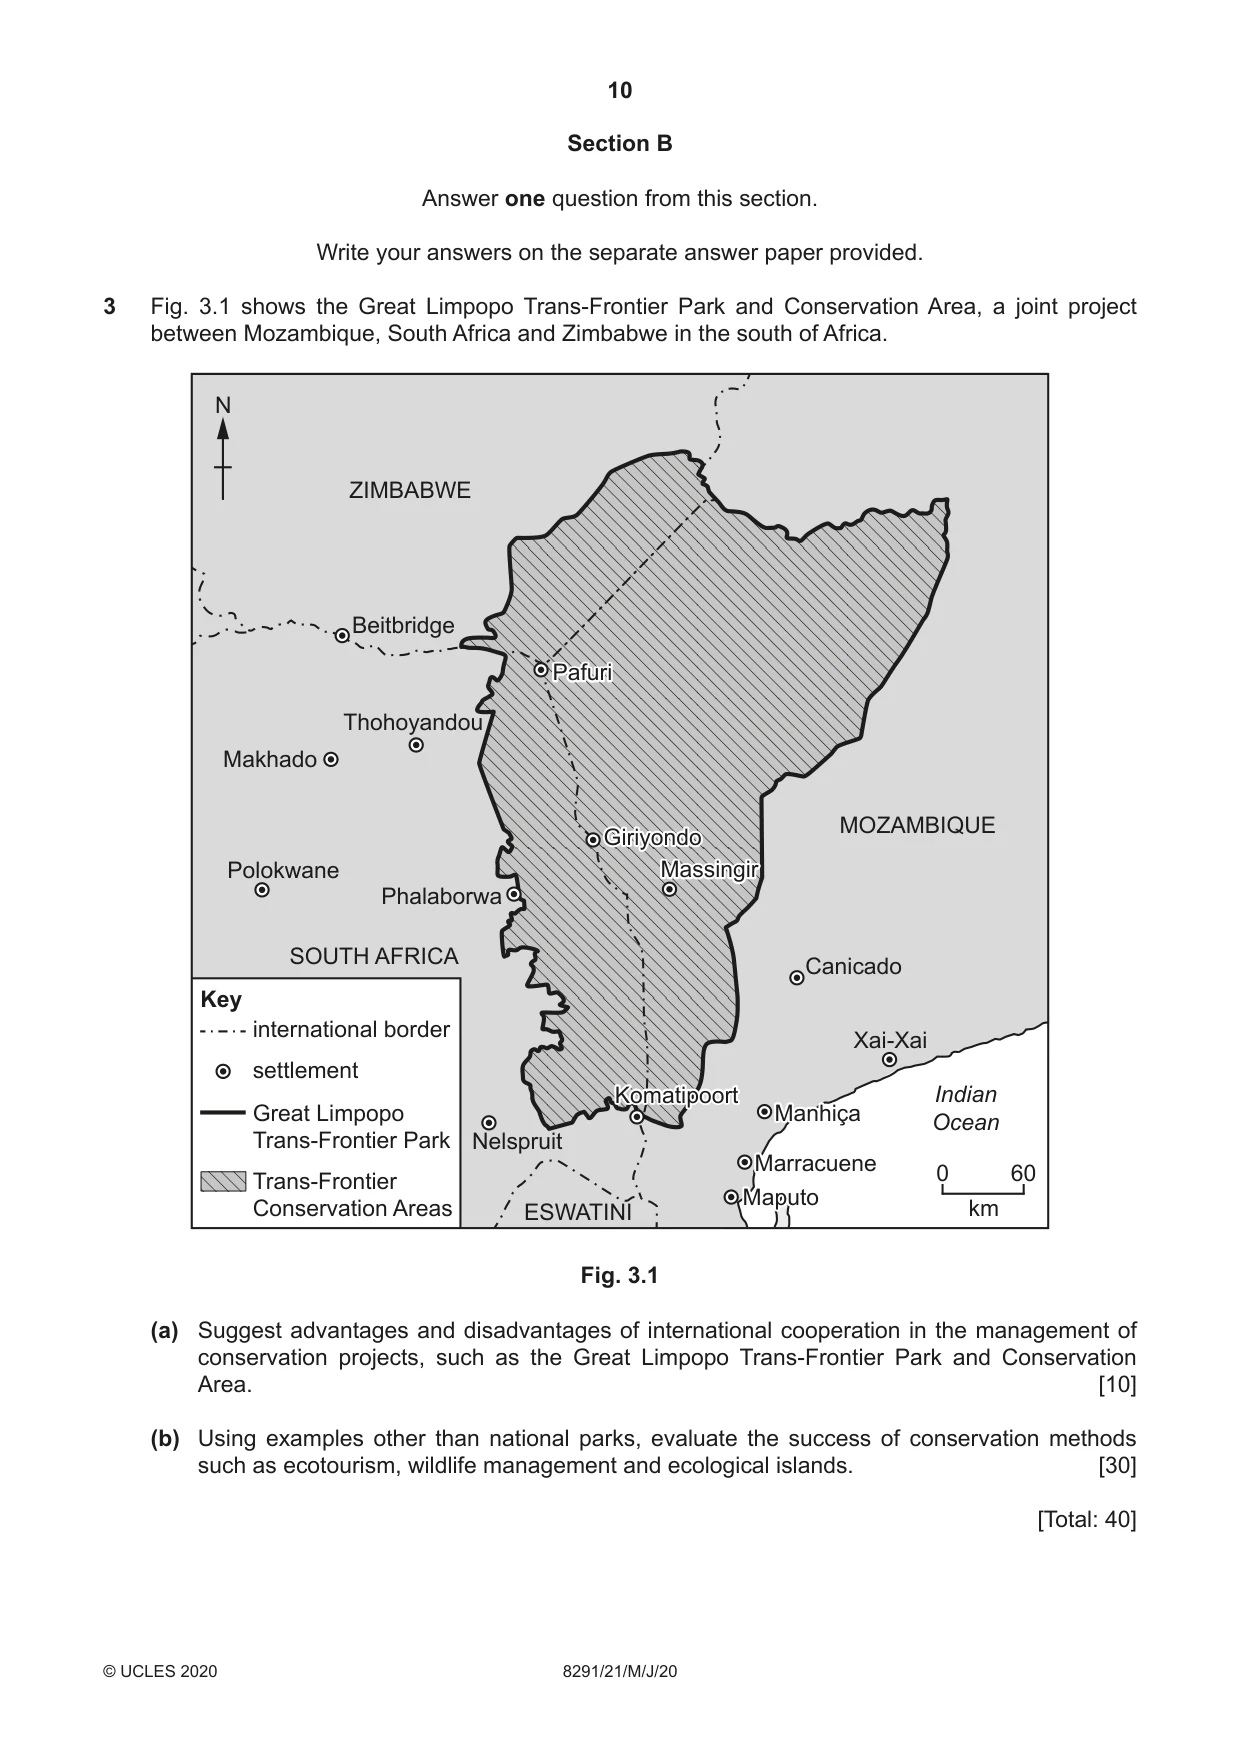
3 Fig. 3.1 shows the Great Limpopo Trans-Frontier Park and Conservation Area, a joint project between Mozambique, South Africa and Zimbabwe in the south of Africa. N ZIMBABWE Beitbridge PafuriPafuri Thohoyandou Makhado MOZAMBIQUE GiriyondoGiriyondo Polokwane MassingirMassingir Phalaborwa SOUTH AFRICA Canicado Key international border Xai-Xai settlement KomatipoortKomatipoort Indian Great Limpopo ManhiçaManhiça Ocean Trans-Frontier Park Nelspruit MarracueneMarracuene 0 60 Trans-Frontier MaputoMaputo Conservation Areas ESWATINI km Fig. 3.1 (a) Suggest advantages and disadvantages of international cooperation in the management of conservation projects, such as the Great Limpopo Trans-Frontier Park and Conservation Area. [10] (b) Using examples other than national parks, evaluate the success of conservation methods such as ecotourism, wildlife management and ecological islands. [30] [Total: 40]
Q4 · The major types of waste found in marine ecosystems and information about the potential…
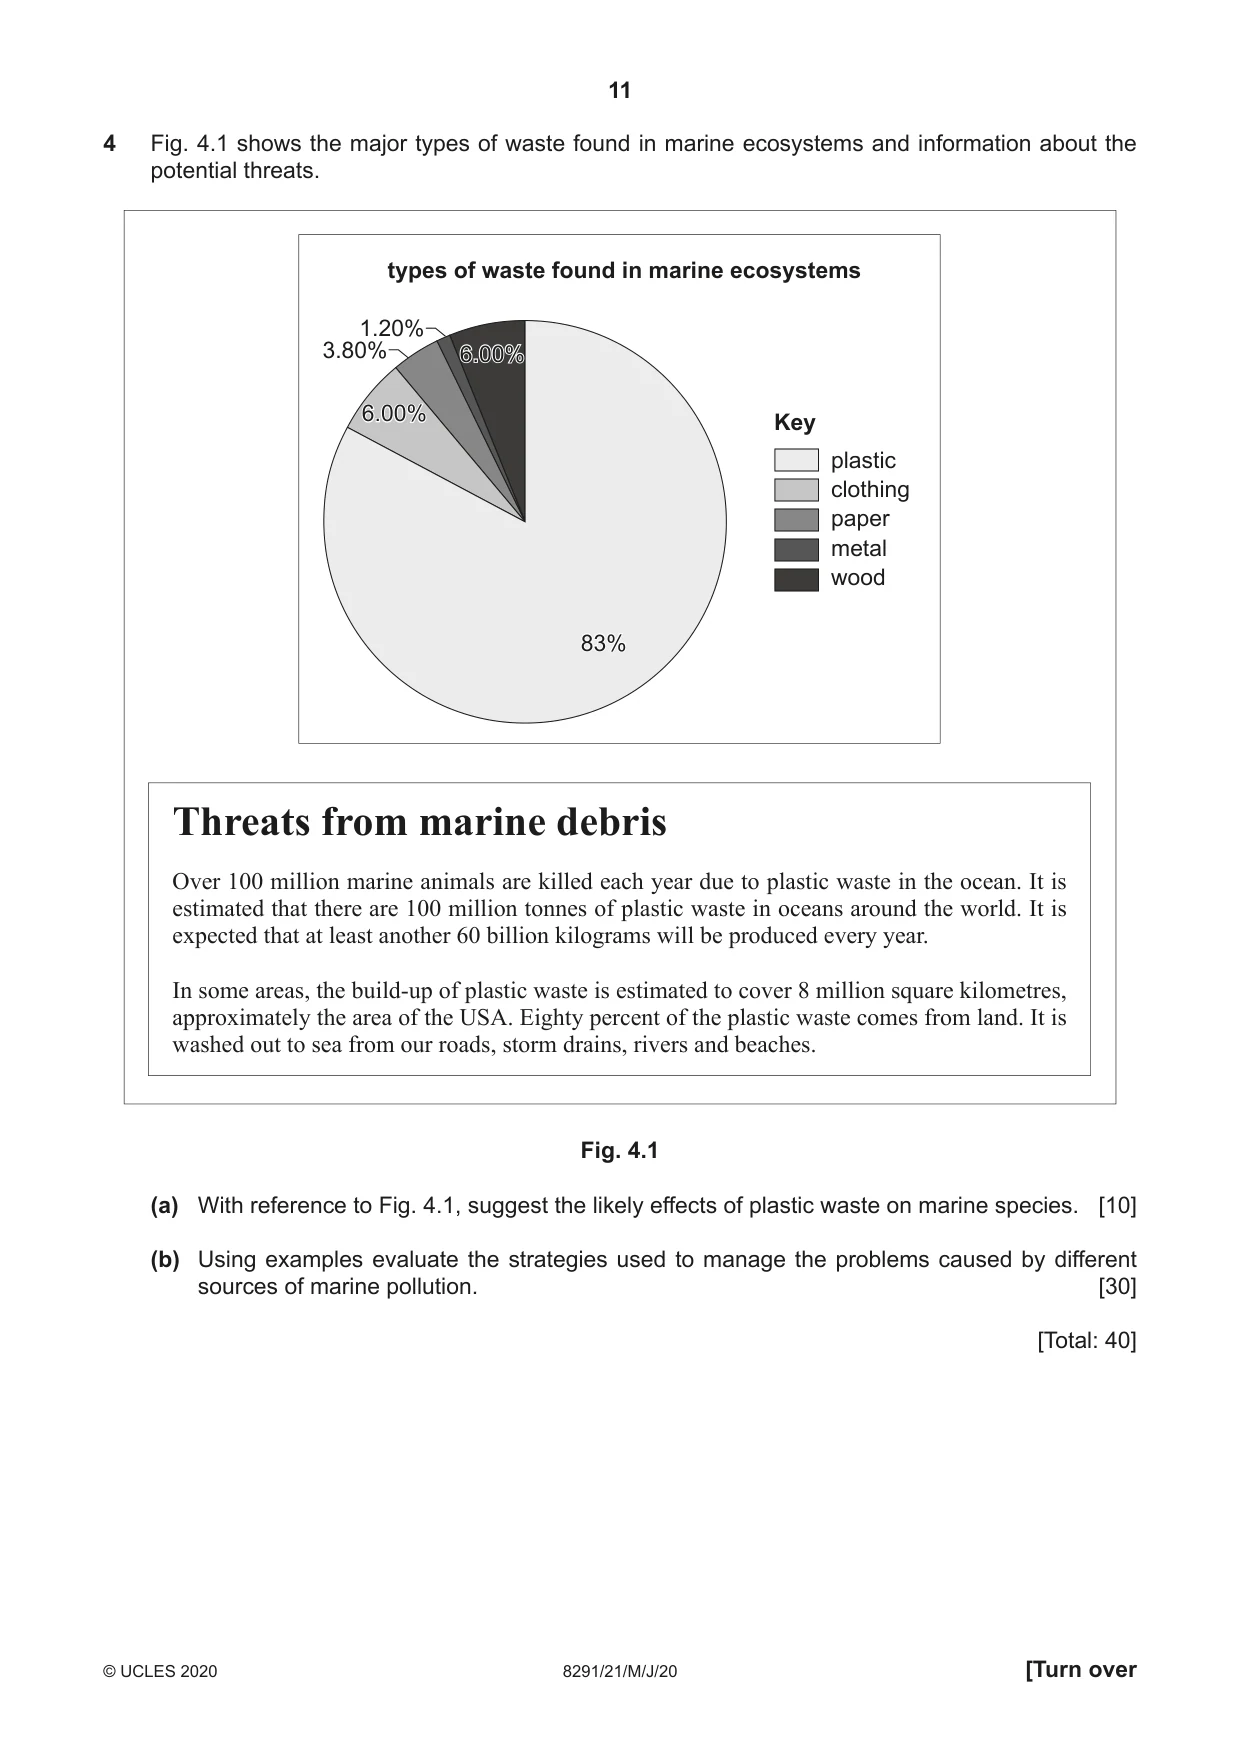
4 Fig. 4.1 shows the major types of waste found in marine ecosystems and information about the potential threats. types of waste found in marine ecosystems 1.20% 3.80% 6.00%6.00% 6.00%6.00% Key plastic clothing paper metal wood 83%83% Threats from marine debris Over 100 million marine animals are killed each year due to plastic waste in the ocean. It is estimated that there are 100 million tonnes of plastic waste in oceans around the world. It is expected that at least another 60 billion kilograms will be produced every year. In some areas, the build-up of plastic waste is estimated to cover 8 million square kilometres, approximately the area of the USA. Eighty percent of the plastic waste comes from land. It is washed out to sea from our roads, storm drains, rivers and beaches. Fig. 4.1 (a) With reference to Fig. 4.1, suggest the likely effects of plastic waste on marine species. [10] (b) Using examples evaluate the strategies used to manage the problems caused by different sources of marine pollution. [30] [Total: 40]
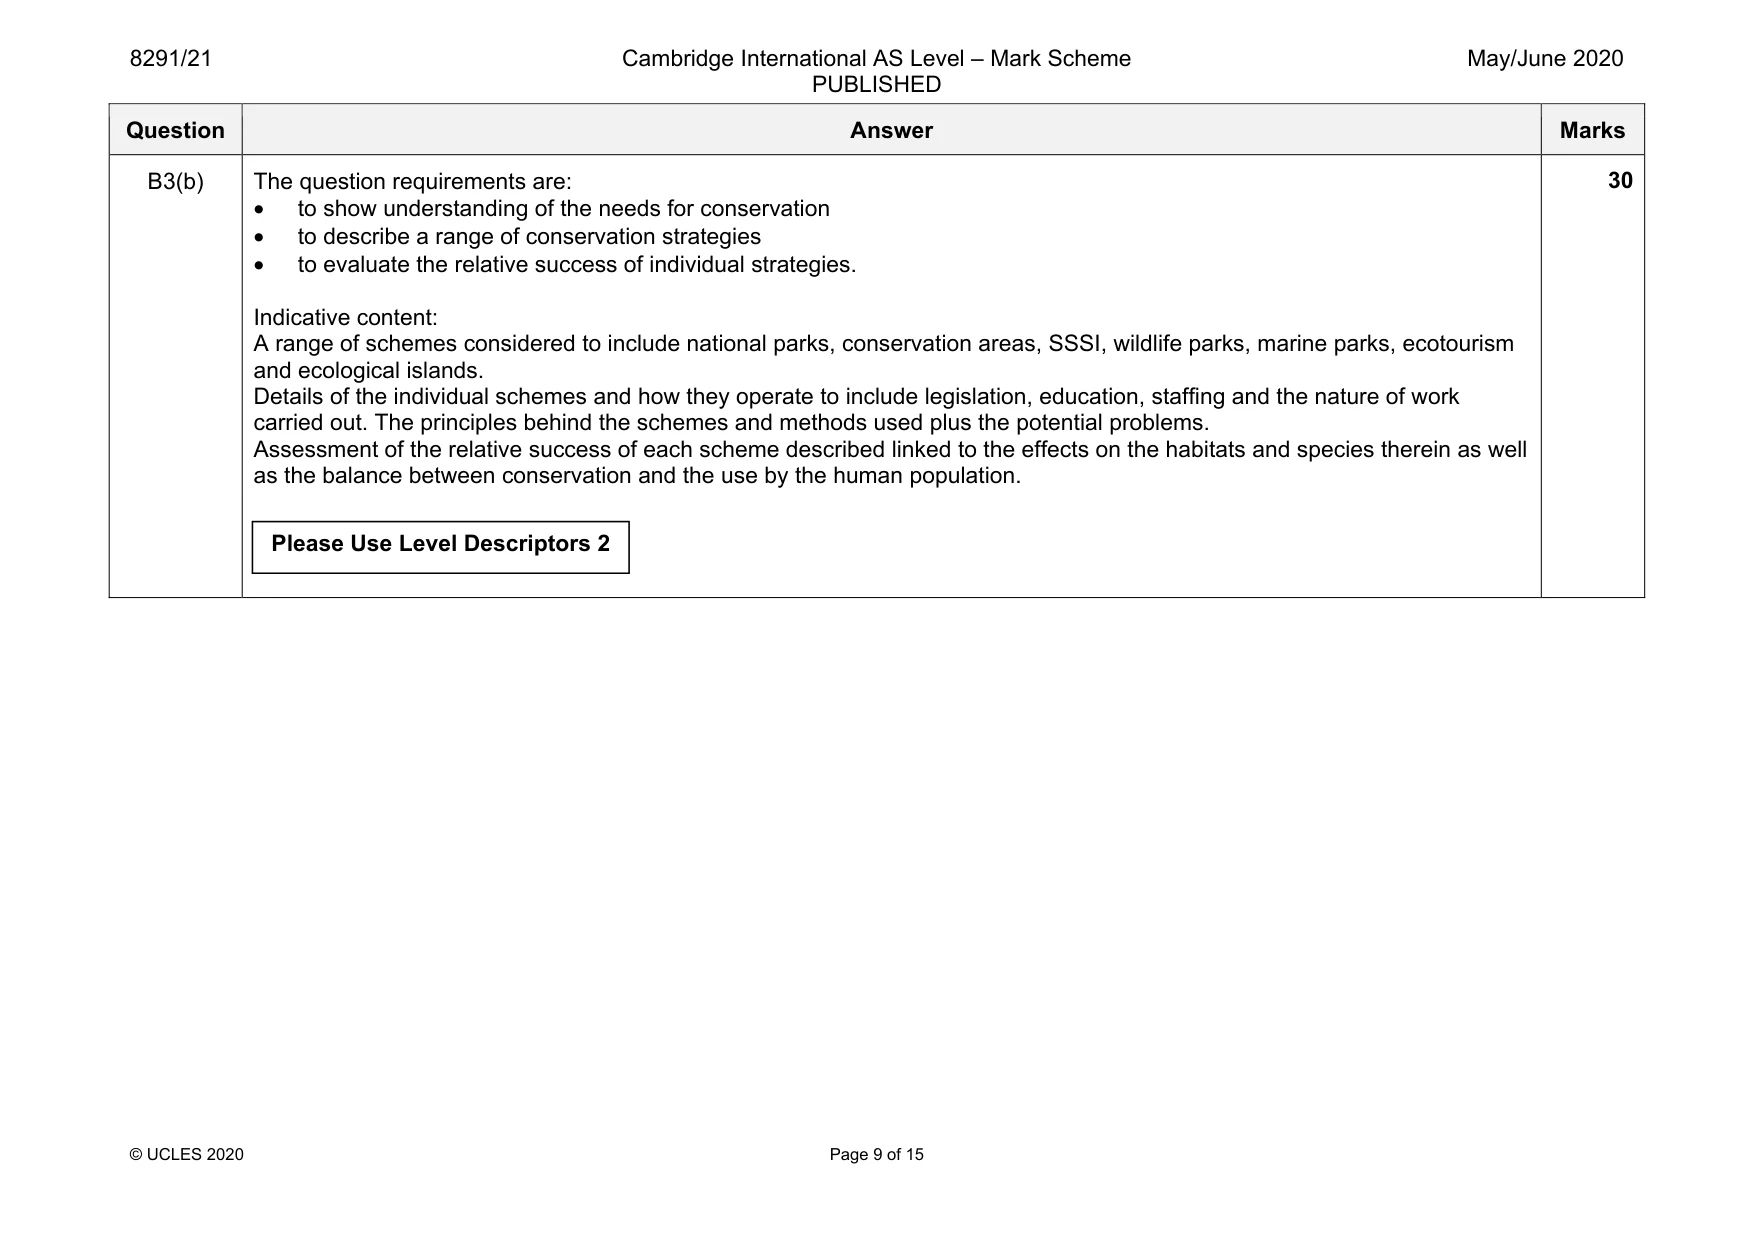
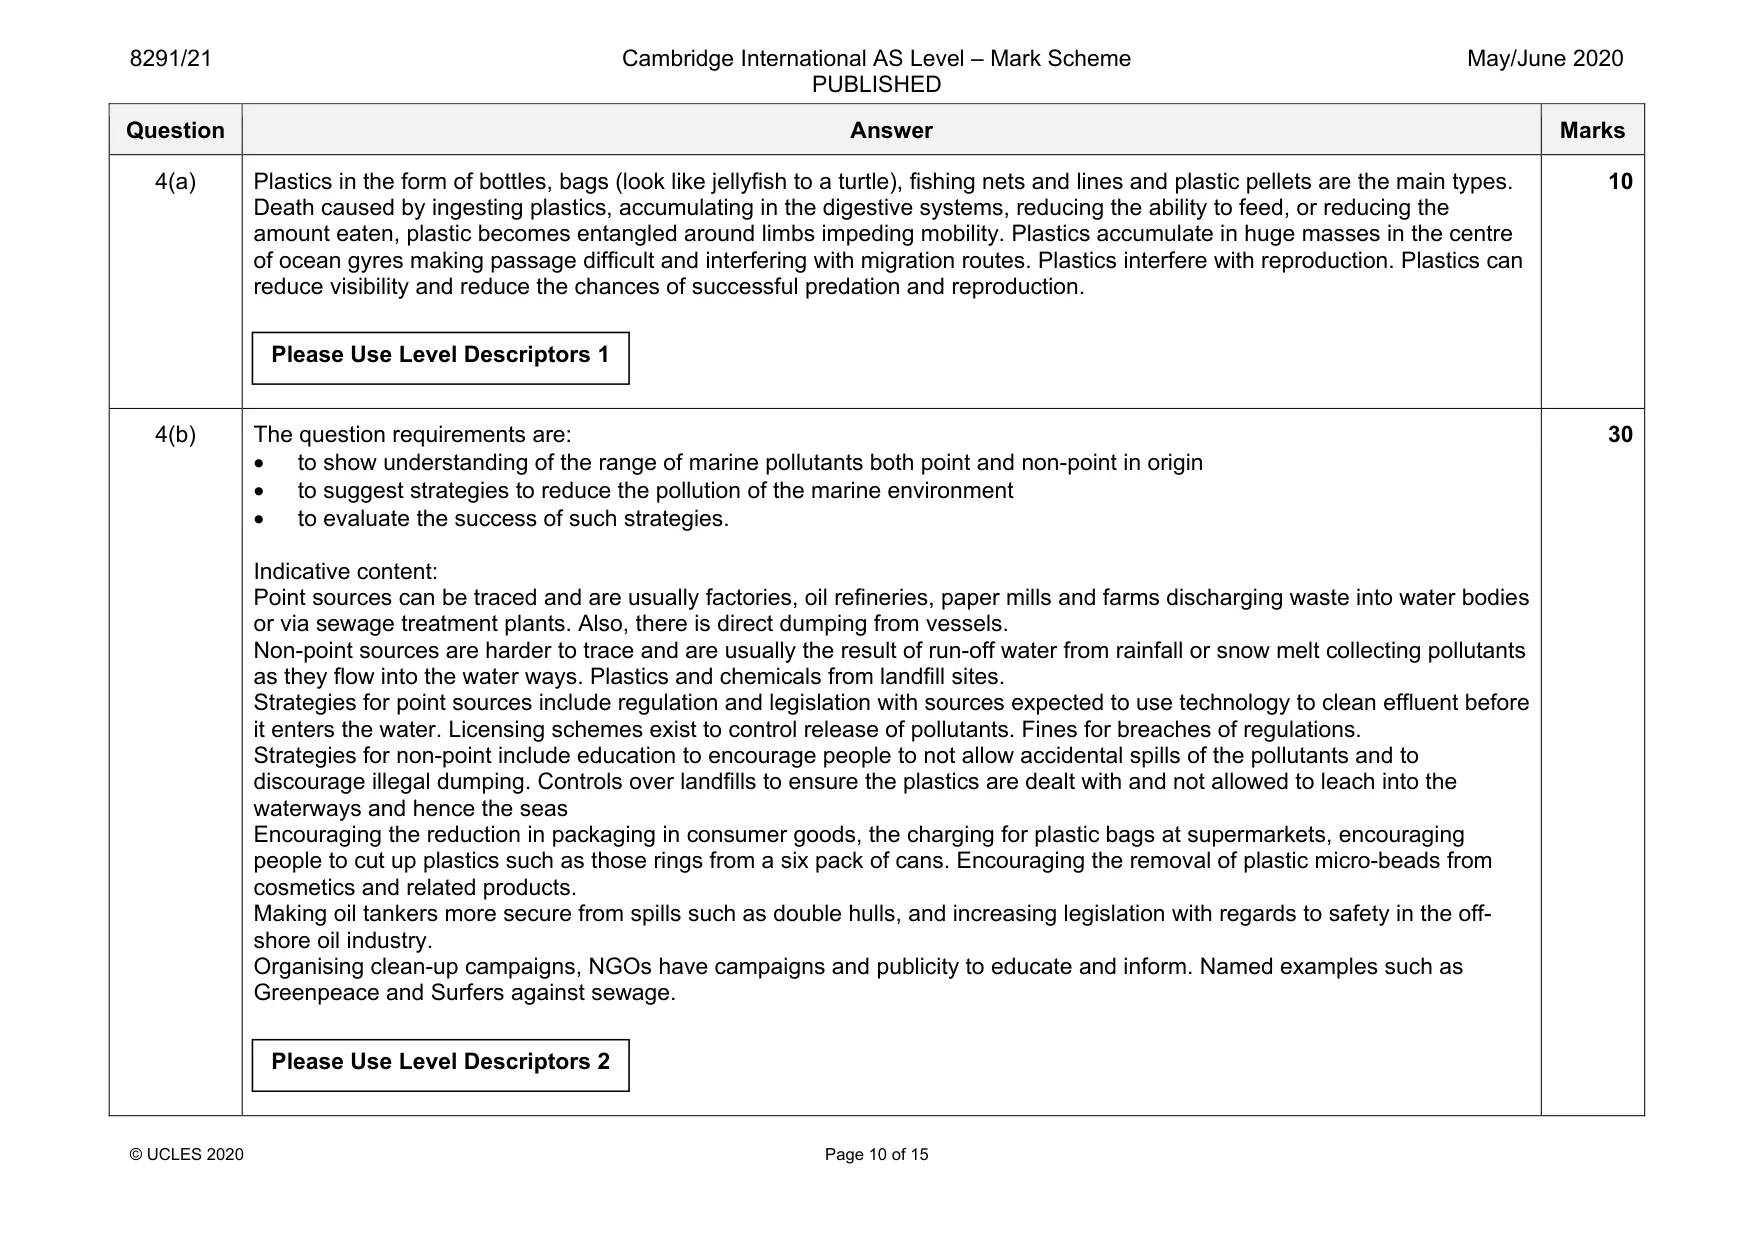
Mark scheme: 4(a) Plastics in the form of bottles, bags (look like jellyfish to a turtle), fishing nets and lines and plastic pellets are the main types. Death caused by ingesting plastics, accumulating in the digestive systems, reducing the ability to feed, or reducing the amount eaten, plastic becomes entangled around limbs impeding mobility. Plastics accumulate in huge masses in the centre of ocean gyres making passage difficult and interfering with migration routes. Plastics interfere with reproduction. Plastics can reduce visibility and reduce the chances of successful predation and reproduction. 10 4(b) The question requirements are: • to show understanding of the range of marine pollutants both point and non-point in origin • to suggest strategies to reduce the pollution of the marine environment • to evaluate the success of such strategies. Indicative content: Point sources can be traced and are usually factories, oil refineries, paper mills and farms discharging waste into water bodies or via sewage treatment plants. Also, there is direct dumping from vessels. Non-point sources are harder to trace and are usually the result of run-off water from rainfall or snow melt collecting pollutants as they flow into the water ways. Plastics and chemicals from landfill sites. Strategies for point sources include regulation and legislation with sources expected to use technology to clean effluent before it enters the water. Licensing schemes exist to control release of pollutants. Fines for breaches of regulations. Strategies for non-point include education to encourage people to not allow accidental spills of the pollutants and to discourage illegal dumping. Controls over landfills to ensure the plastics are dealt with and not allowed to leach into the waterways and hence the seas Encouraging the reduction in packaging in consumer goods, the charging for plastic bags at supermarkets, encouraging people to cut up plastics such as those rings from a six pack of cans. Encouraging the removal of plastic micro-beads from cosmetics and related products. Making oil tankers more secure from spills such as double hulls, and increasing legislation with regards to safety in the off- shore oil industry. Organising clean-up campaigns, NGOs have campaigns and publicity to educate and inform. Named examples such as Greenpeace and Surfers against sewage. 30 Please Use Level Descriptors 1 Please Use Level Descriptors 2
Q5 · The area of susceptible drylands in each continent, and the main causes of soil…
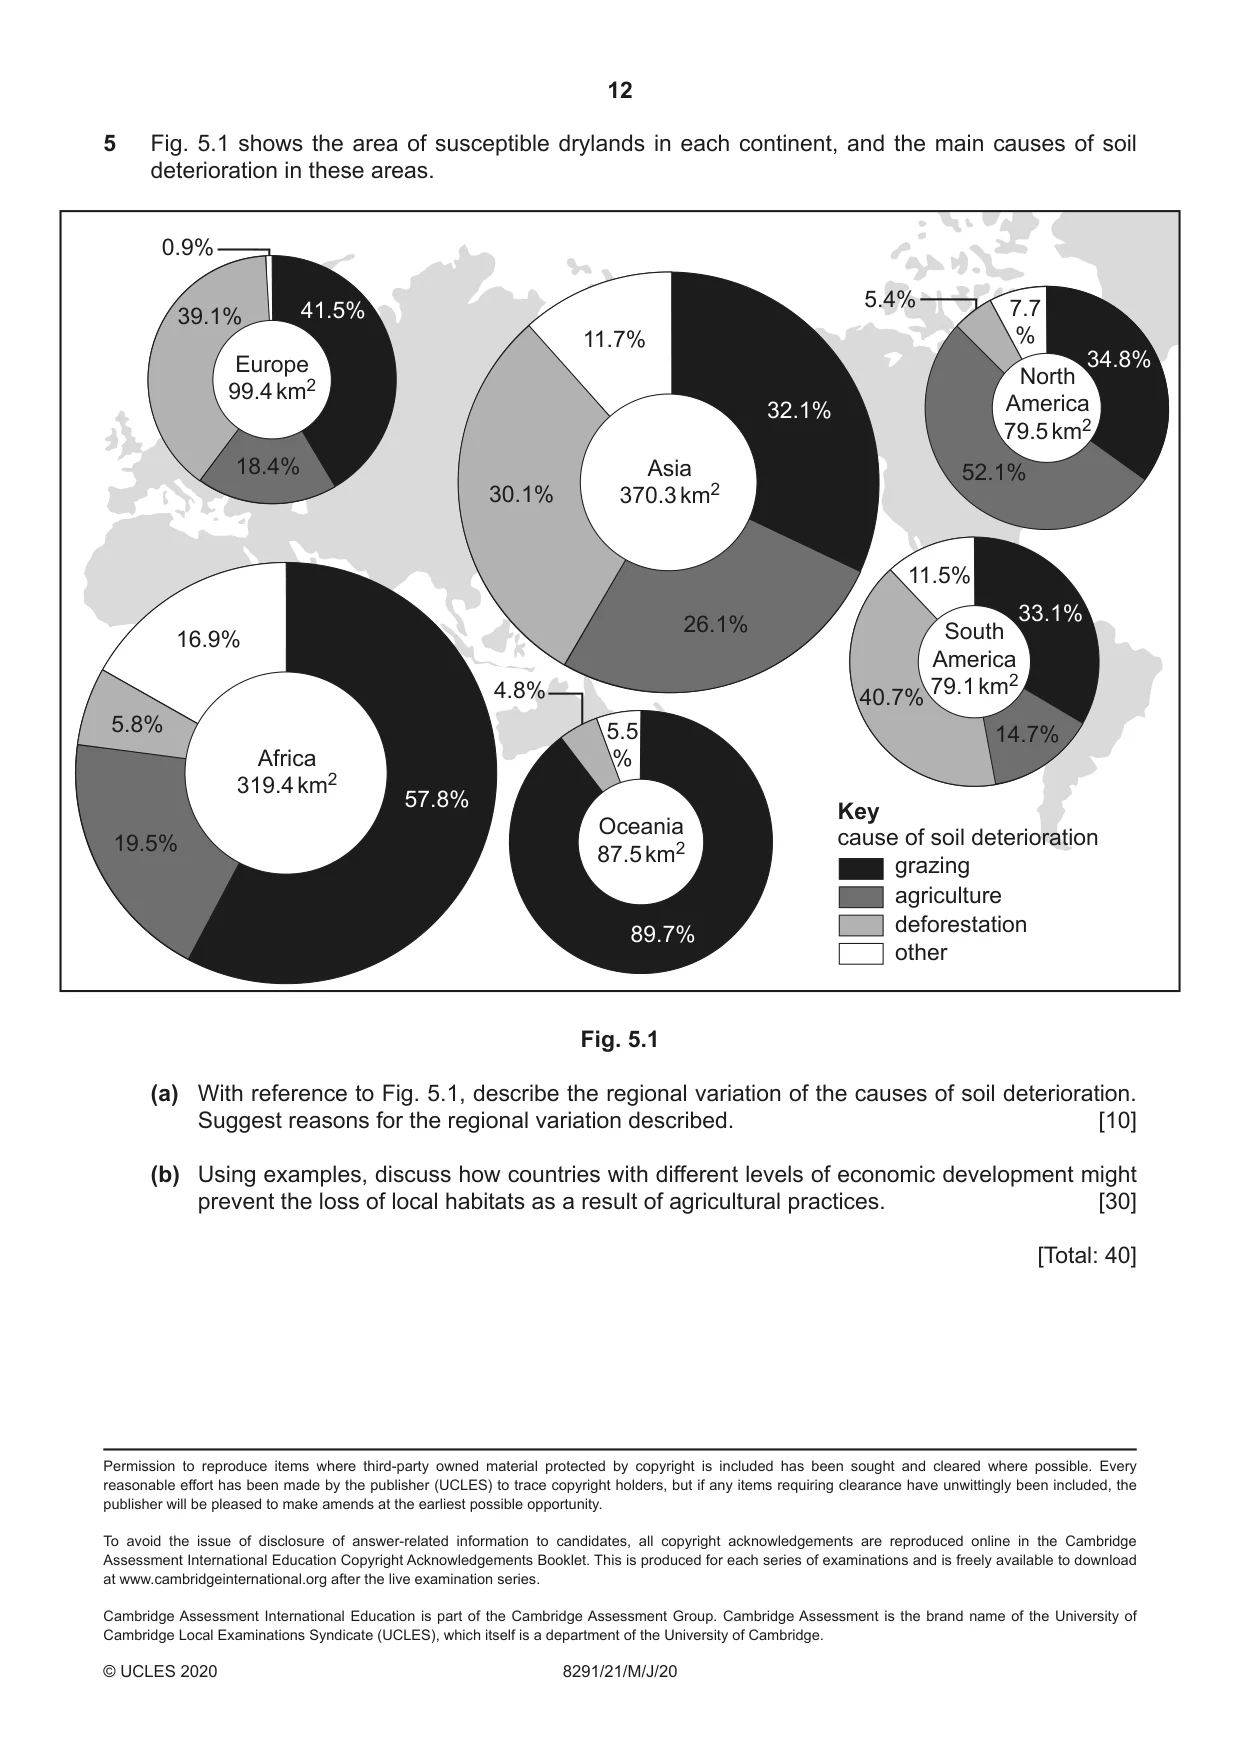
5 Fig. 5.1 shows the area of susceptible drylands in each continent, and the main causes of soil deterioration in these areas. 0.9% 5.4% 39.1% 41.5% 7.7 11.7% % Europe 34.8% North 99.4 km2 America 32.1% 79.5 km2 18.4% Asia 52.1% 30.1% 370.3 km2 11.5% 33.1% 26.1% South 16.9% America 4.8% 79.1 km2 40.7% 5.8% 5.5 14.7% Africa % 319.4 km2 57.8% Key Oceania 19.5% cause of soil deterioration 87.5 km2 grazing agriculture deforestation 89.7% other Fig. 5.1 (a) With reference to Fig. 5.1, describe the regional variation of the causes of soil deterioration. Suggest reasons for the regional variation described. [10] (b) Using examples, discuss how countries with different levels of economic development might prevent the loss of local habitats as a result of agricultural practices. [30] [Total: 40]
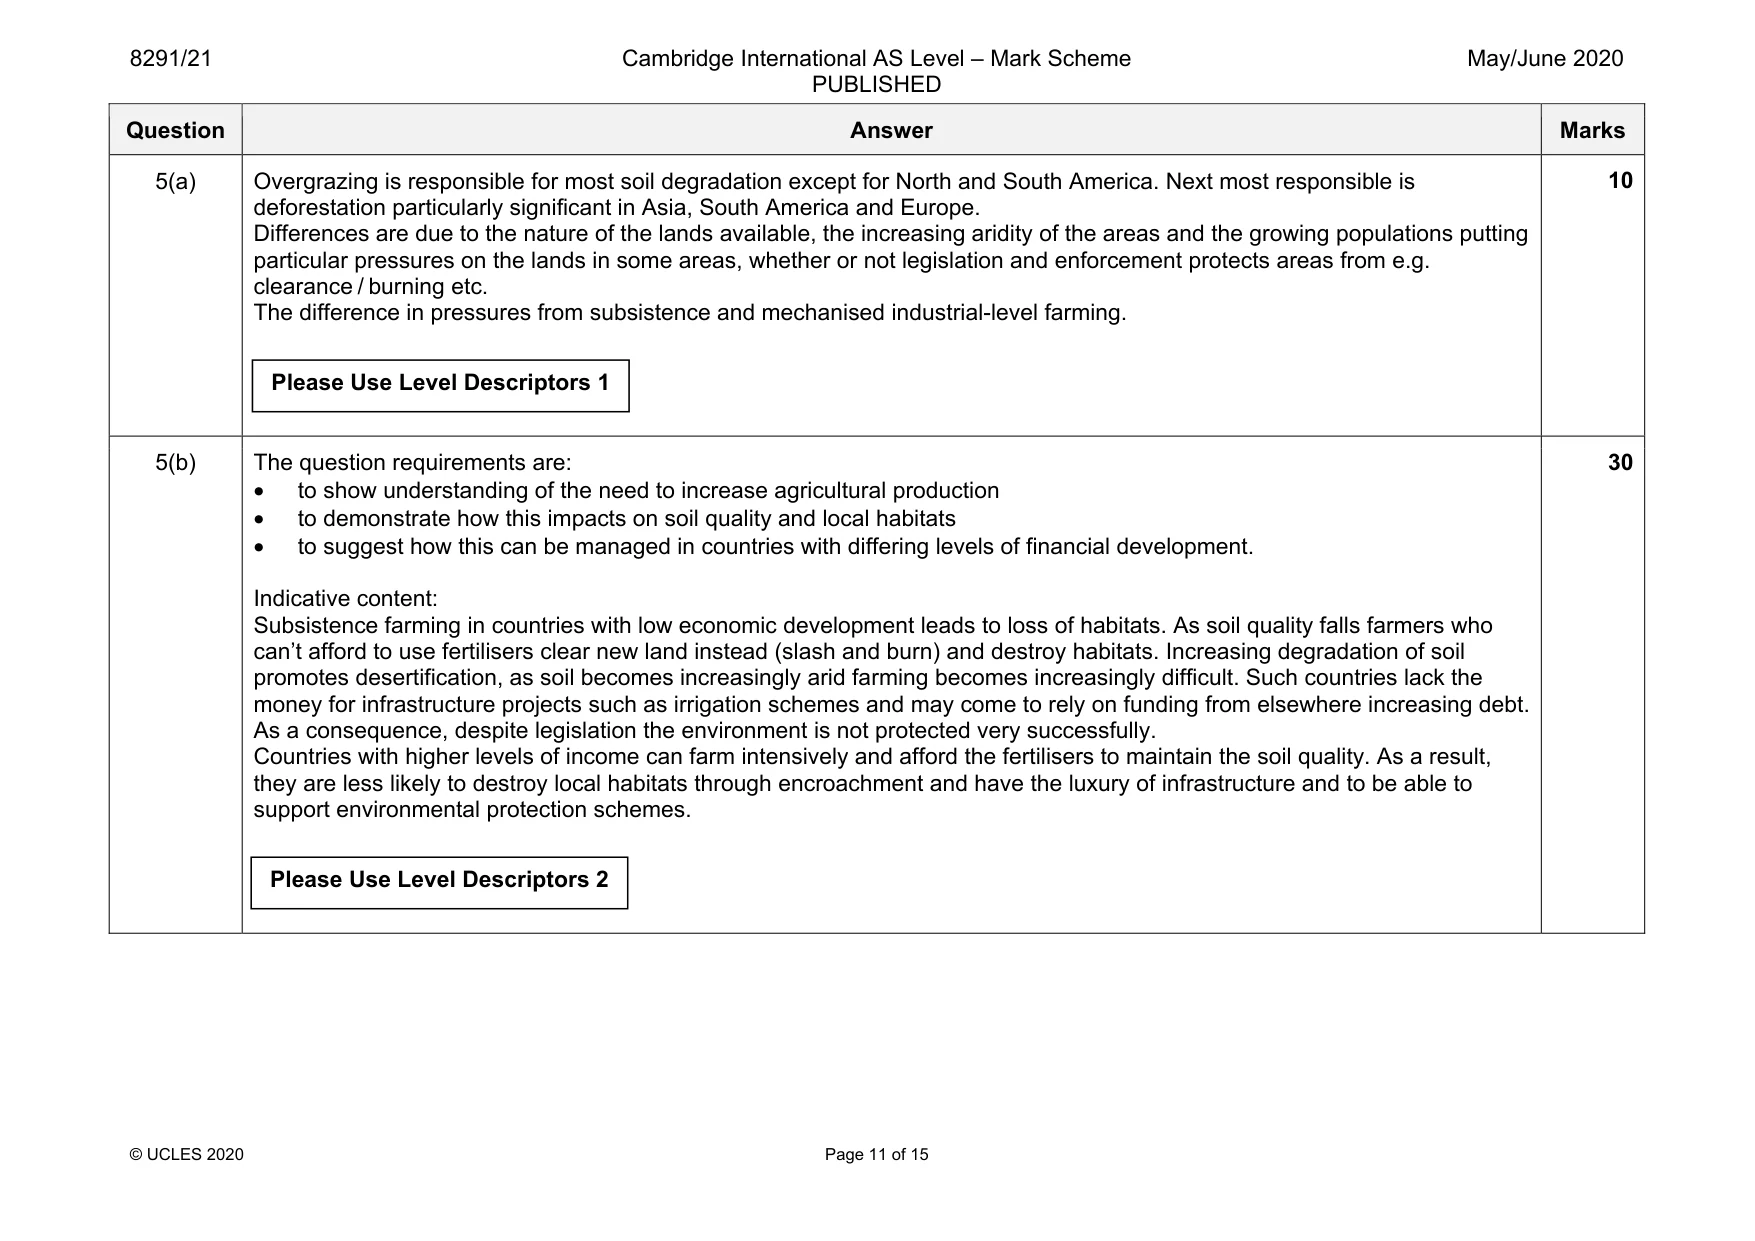
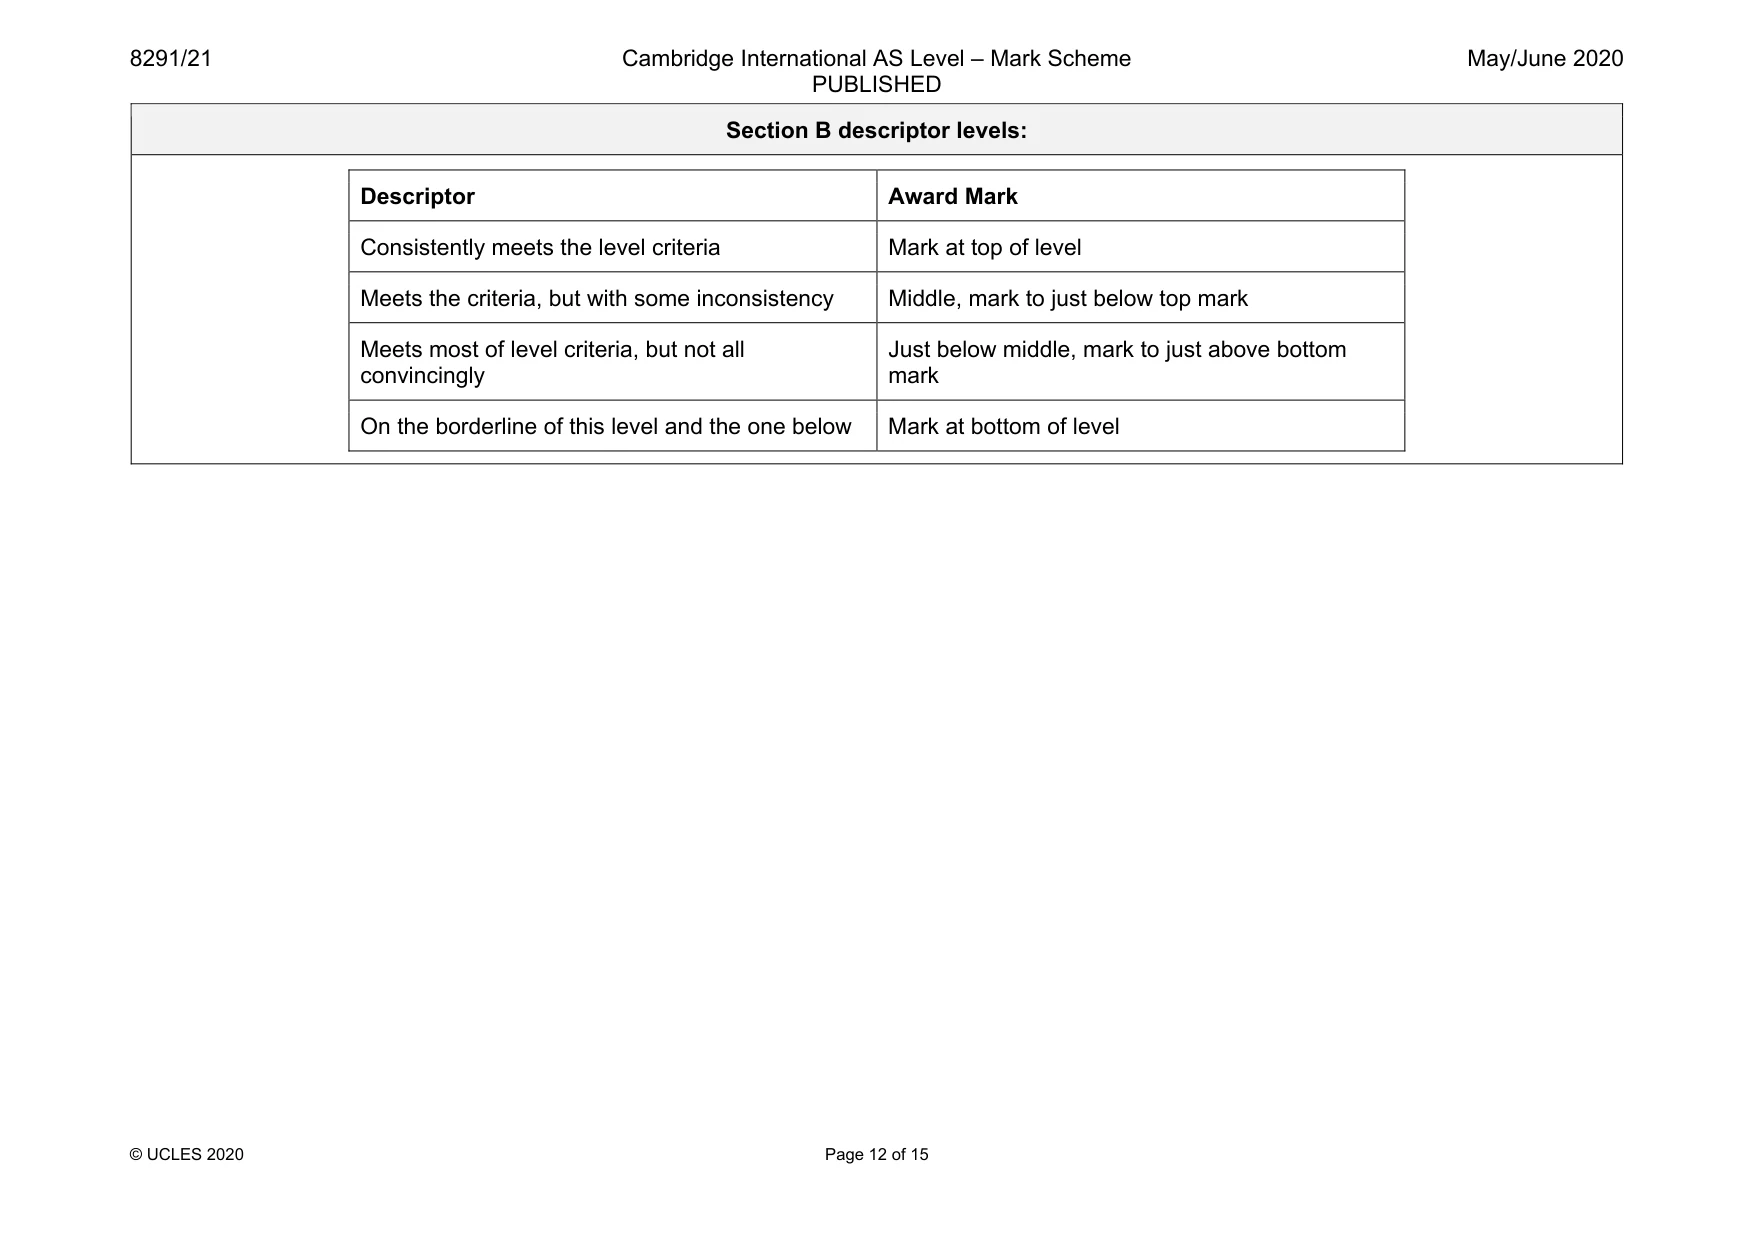
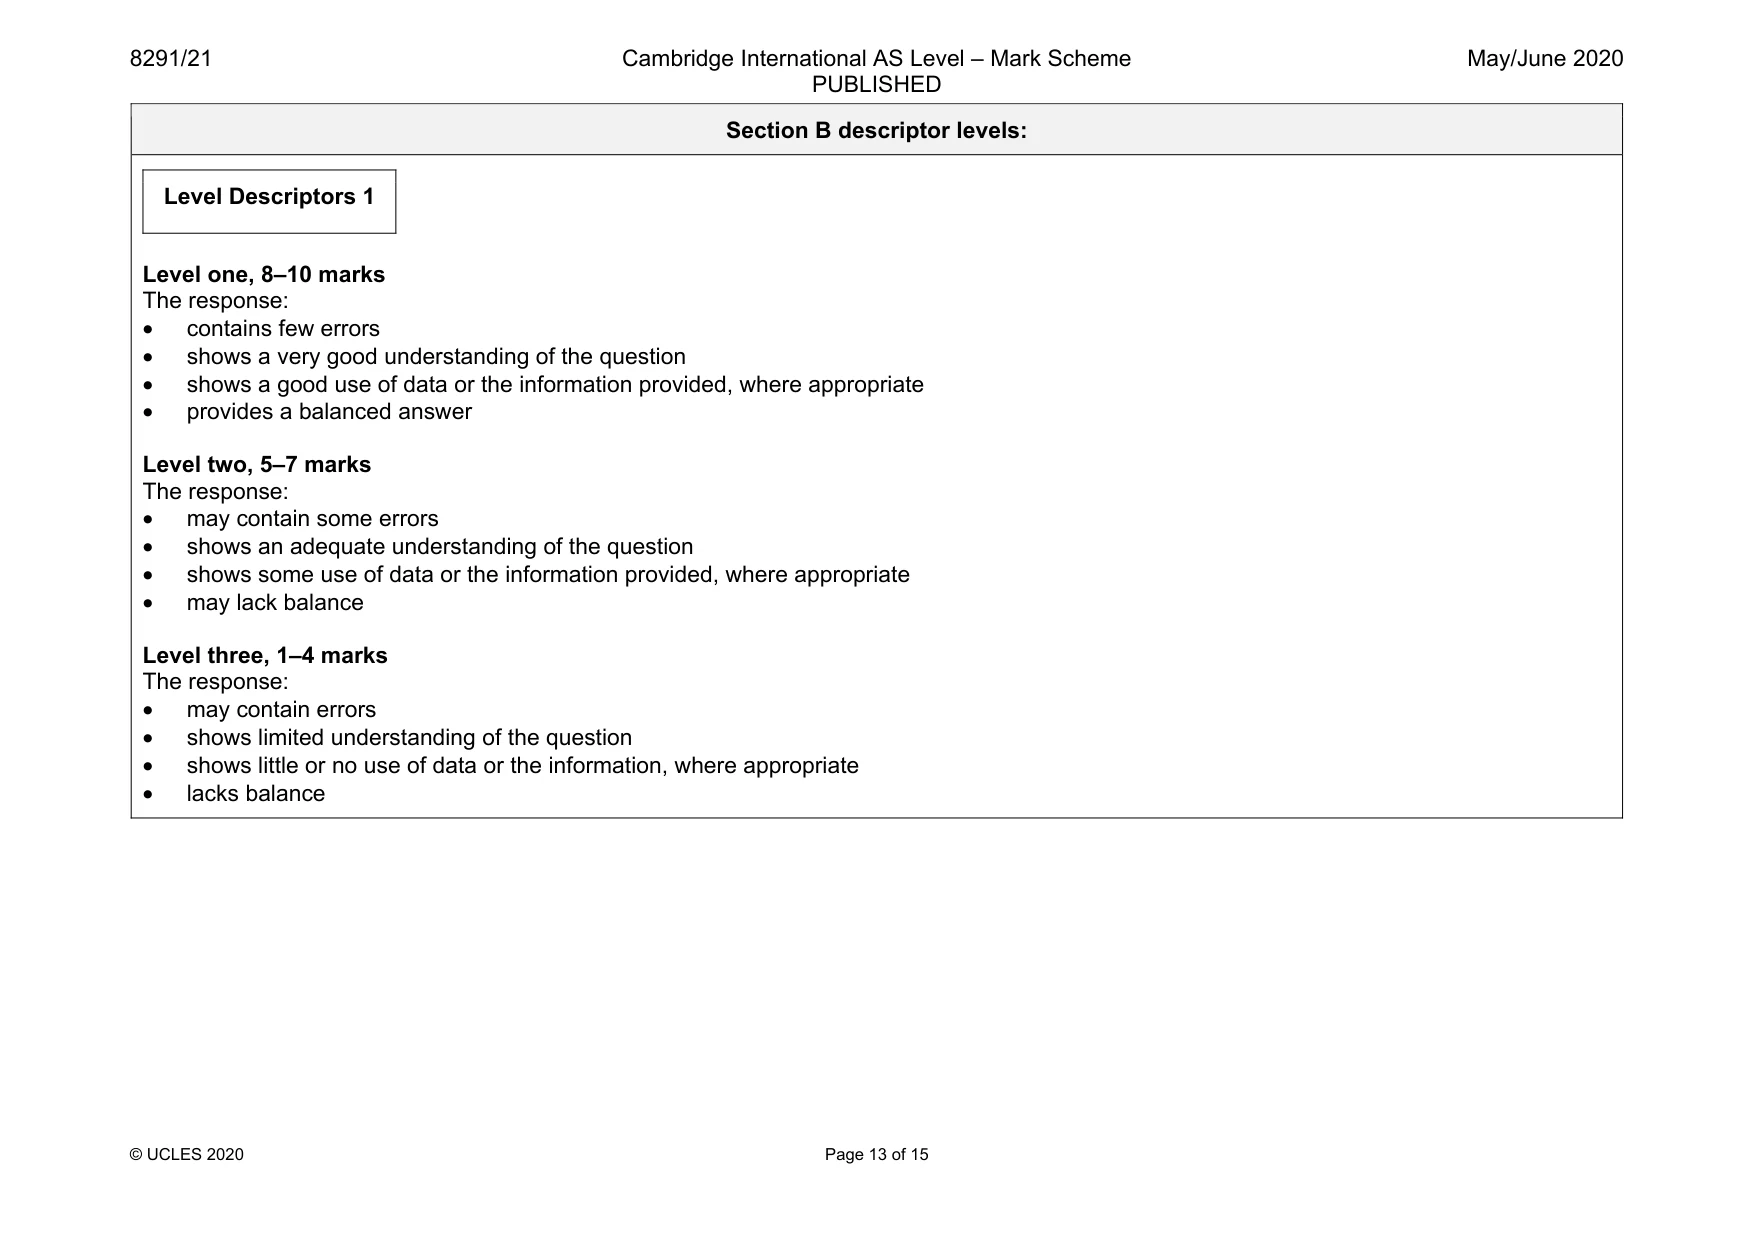
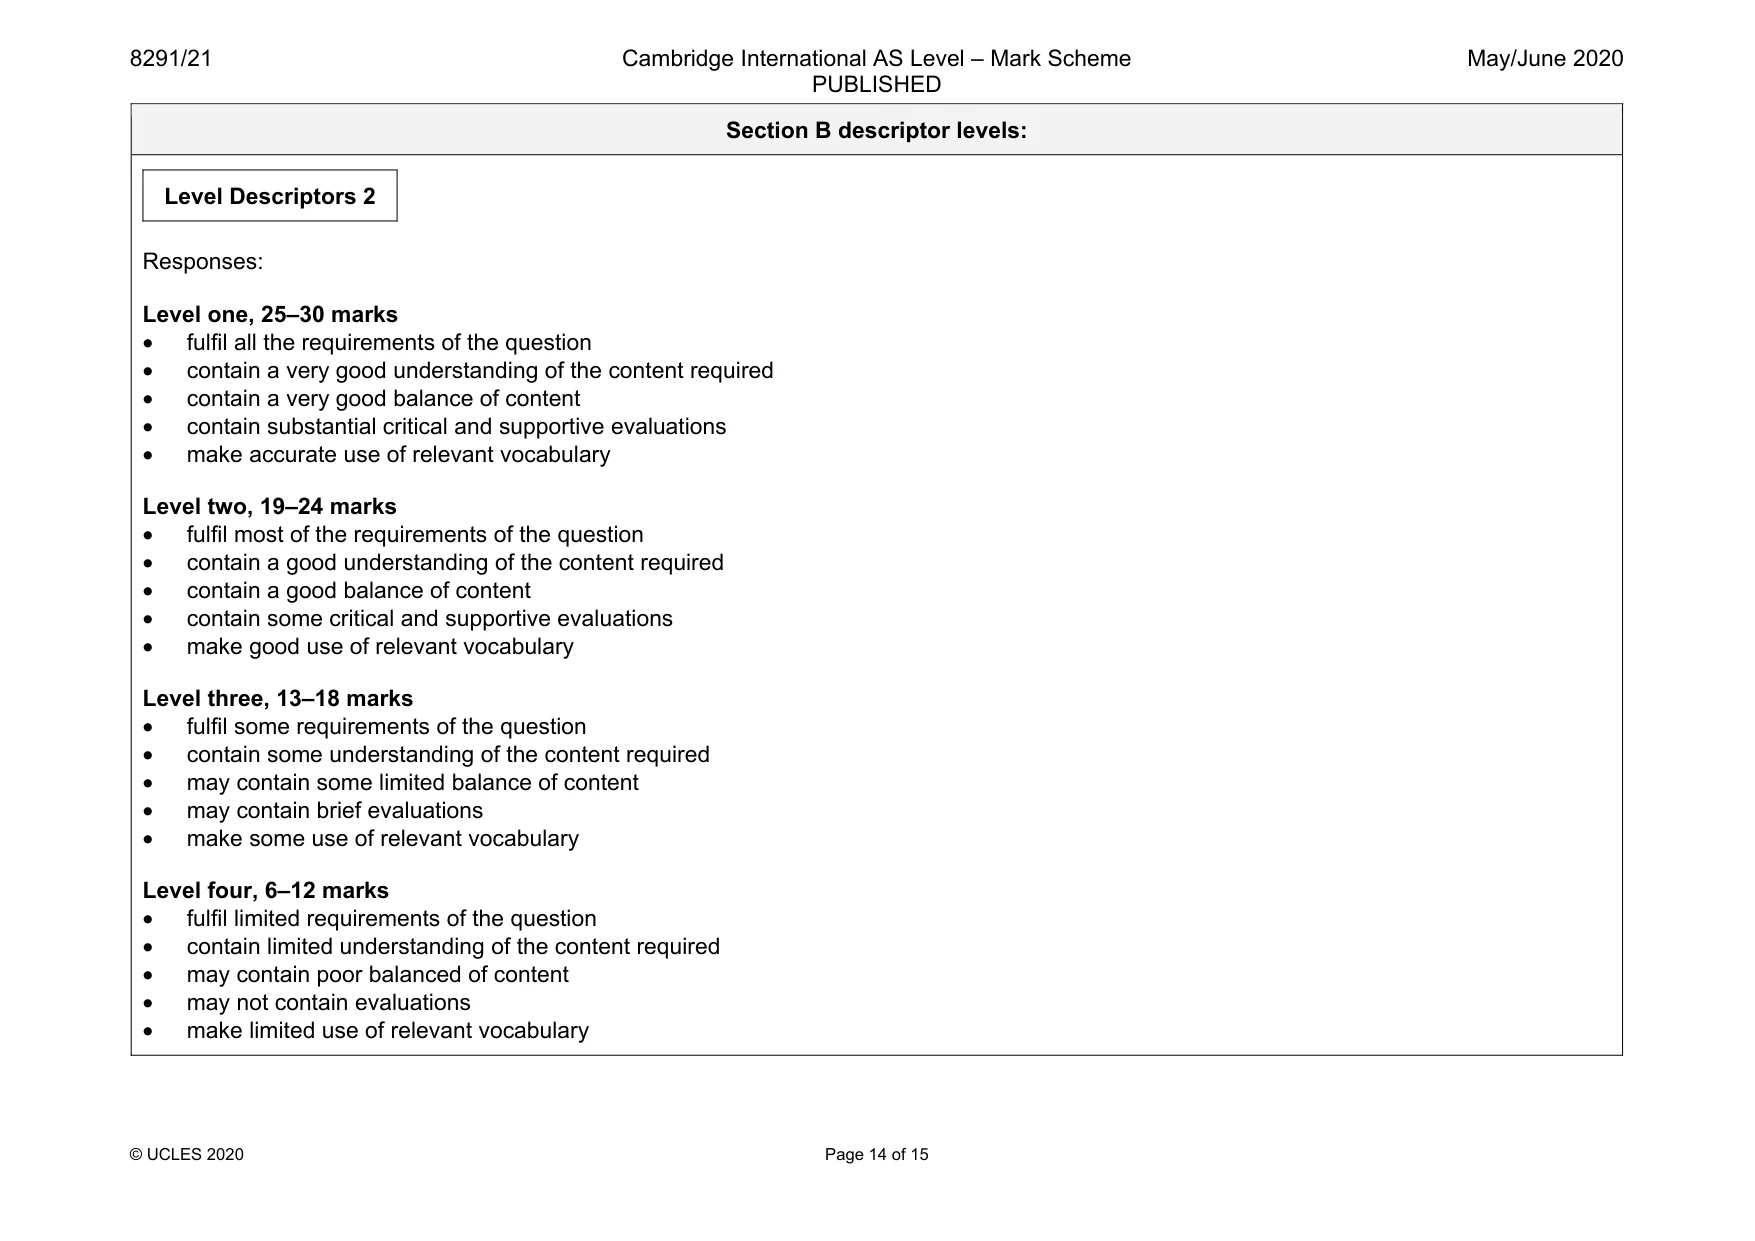
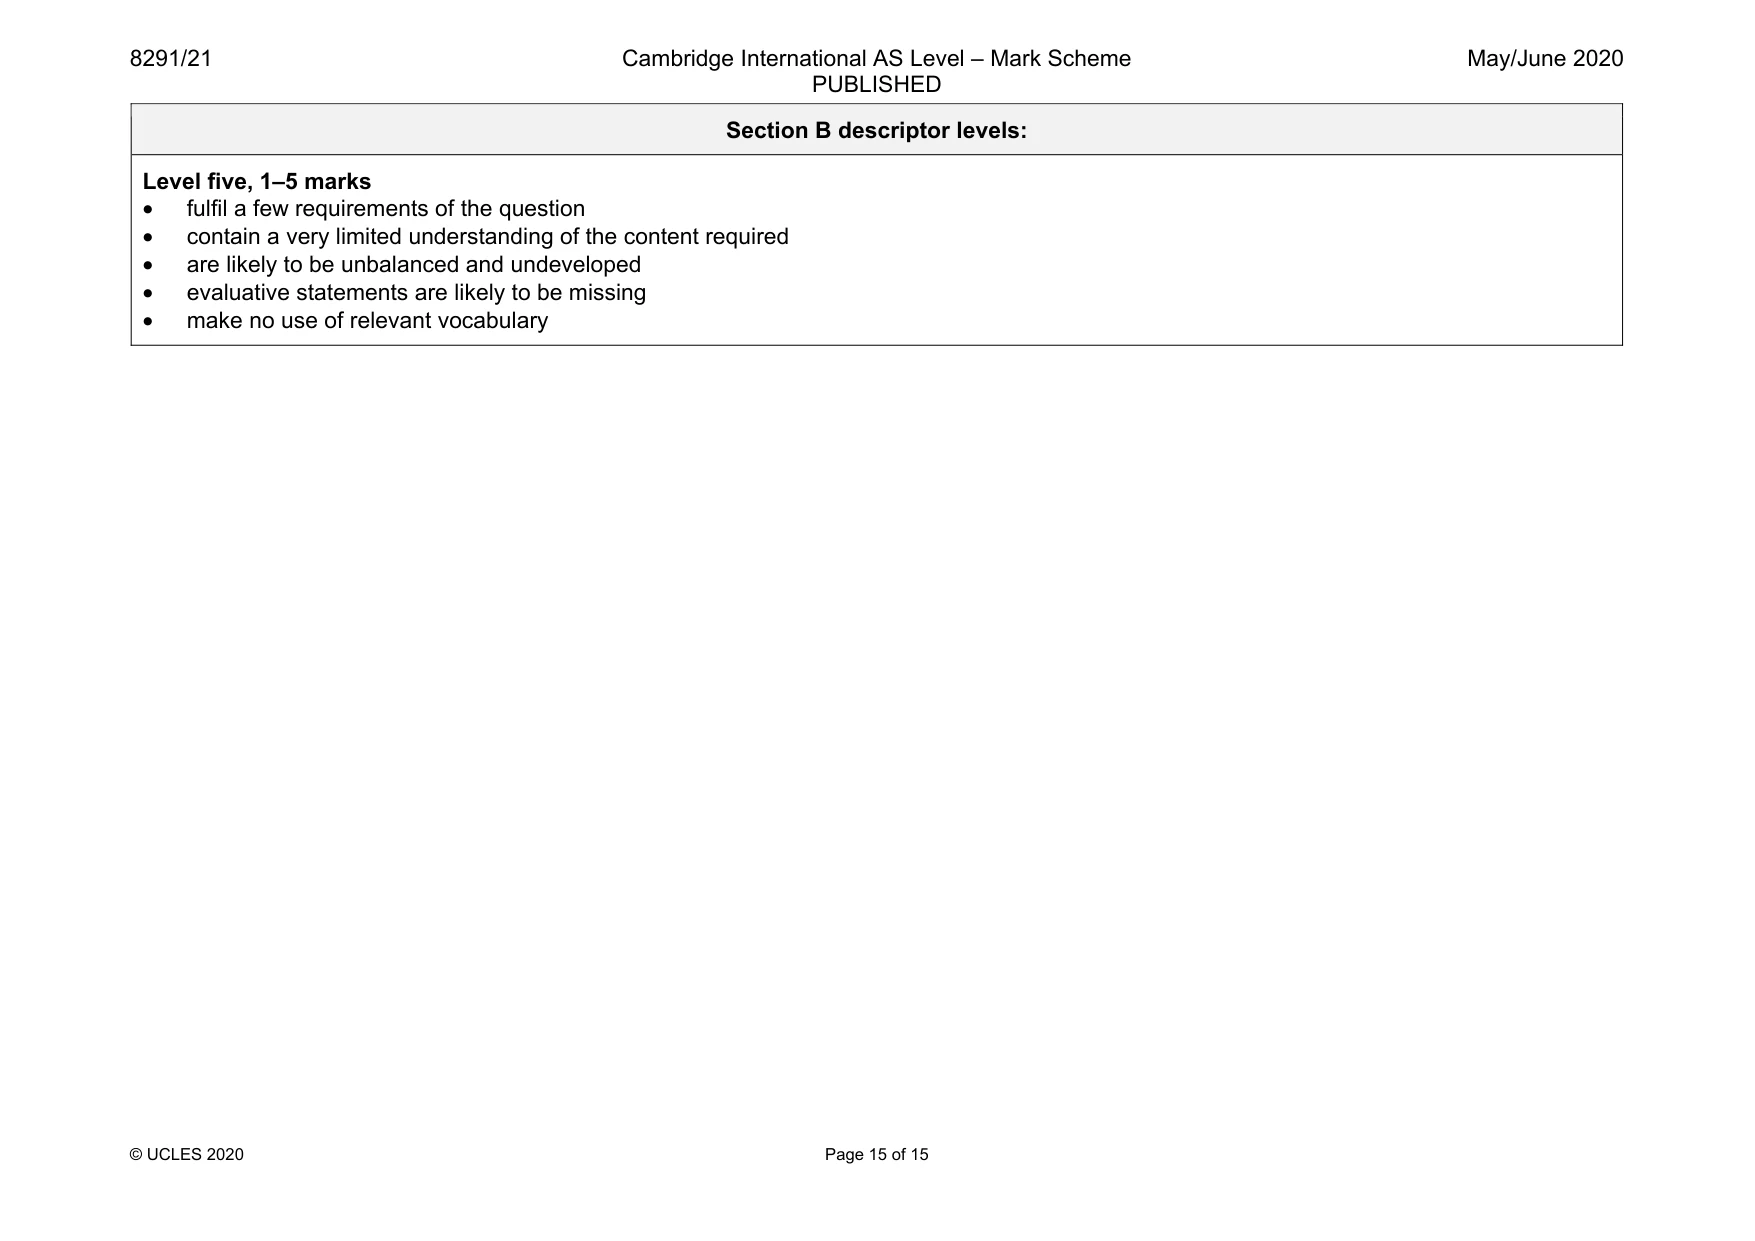
Mark scheme: 5(a) Overgrazing is responsible for most soil degradation except for North and South America. Next most responsible is deforestation particularly significant in Asia, South America and Europe. Differences are due to the nature of the lands available, the increasing aridity of the areas and the growing populations putting particular pressures on the lands in some areas, whether or not legislation and enforcement protects areas from e.g. clearance / burning etc. The difference in pressures from subsistence and mechanised industrial-level farming. 5(b) The question requirements are: • to show understanding of the need to increase agricultural production • to demonstrate how this impacts on soil quality and local habitats • to suggest how this can be managed in countries with differing levels of financial development. Indicative content: Subsistence farming in countries with low economic development leads to loss of habitats. As soil quality falls farmers who can’t afford to use fertilisers clear new land instead (slash and burn) and destroy habitats. Increasing degradation of soil promotes desertification, as soil becomes increasingly arid farming becomes increasingly difficult. Such countries lack the money for infrastructure projects such as irrigation schemes and may come to rely on funding from elsewhere increasing debt. As a consequence, despite legislation the environment is not protected very successfully. Countries with higher levels of income can farm intensively and afford the fertilisers to maintain the soil quality. As a result, they are less likely to destroy local habitats through encroachment and have the luxury of infrastructure and to be able to support environmental protection schemes. 30 Please Use Level Descriptors 2 Please Use Level Descriptors 1 Section B descriptor levels: Descriptor Award Mark Consistently meets the level criteria Mark at top of level Meets the criteria, but with some inconsistency Middle, mark to just below top mark Meets most of level criteria, but not all convincingly Just below middle, mark to just above bottom mark On the borderline of this level and the one below Mark at bottom of level Section B descriptor levels: Level Descriptors 1 Level one, 8–10 marks The response: • contains few errors • shows a very good understanding of the question • shows a good use of data or the information provided, where appropriate • provides a balanced answer Level two, 5–7 marks The response: • may contain some errors • shows an adequate understanding of the question • shows some use of data or the information provided, where appropriate • may lack balance Level three, 1–4 marks The response: • may contain errors • shows limited understanding of the question • shows little or no use of data or the information, where appropriate • lacks balance Section B descriptor levels: Level Descriptors 2 Responses: Level one, 25–30 marks • fulfil all the requirements of the question • contain a very good understanding of the content required • contain a very good balance of content • contain substantial critical and supportive evaluations • make accurate use of relevant vocabulary Level two, 19–24 marks • fulfil most of the requirements of the question • contain a good understanding of the content required • contain a good balance of content • contain some critical and supportive evaluations • make good use of relevant vocabulary Level three, 13–18 marks • fulfil some requirements of the question • contain some understanding of the content required • may contain some limited balance of content • may contain brief evaluations • make some use of relevant vocabulary Level four, 6–12 marks • fulfil limited requirements of the question • contain limited understanding of the content required • may contain poor balanced of content • may not contain evaluations • make limited use of relevant vocabulary Section B descriptor levels: Level five, 1–5 marks • fulfil a few requirements of the question • contain a very limited understanding of the content required • are likely to be unbalanced and undeveloped • evaluative statements are likely to be missing • make no use of relevant vocabulary
What was in this paper
The subtopics covered by these 5 questions, and how many questions each got. Open one in a new tab to see every Cambridge question on it.