Cambridge A Level Environmental Management (AS only) 8291 — 2018 May/June Paper 2 · Variant 2
8291/22/M/J/18 · 5 questions · 80 marks · ≈90 min
The question paper and its mark scheme, free to read here and free to download. This is Cambridge’s own paper, exactly as it was sat.
Question paper16 pages




Mark scheme15 pages
Answers below. Sit the paper first if you are practising.
Questions as text
Q1 · The approximate residence time for some major water stores
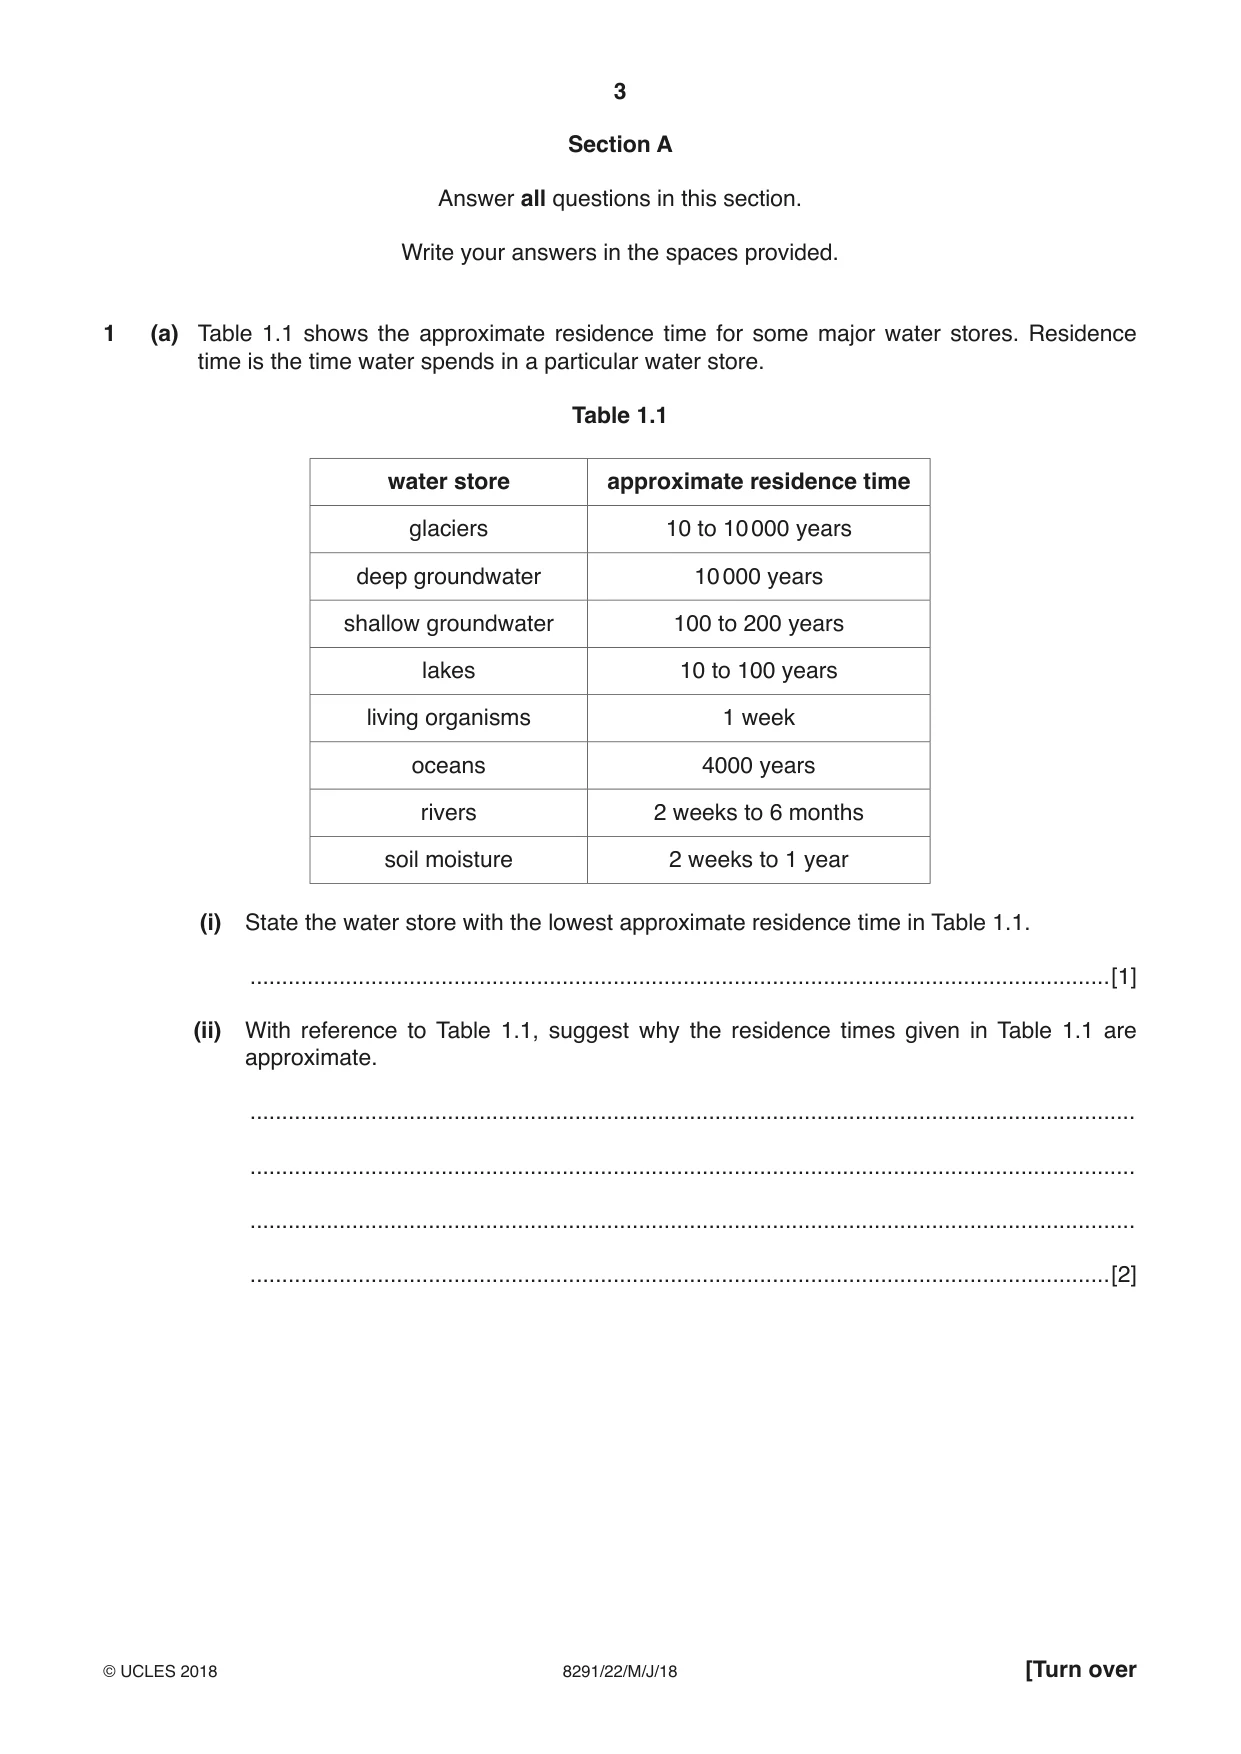
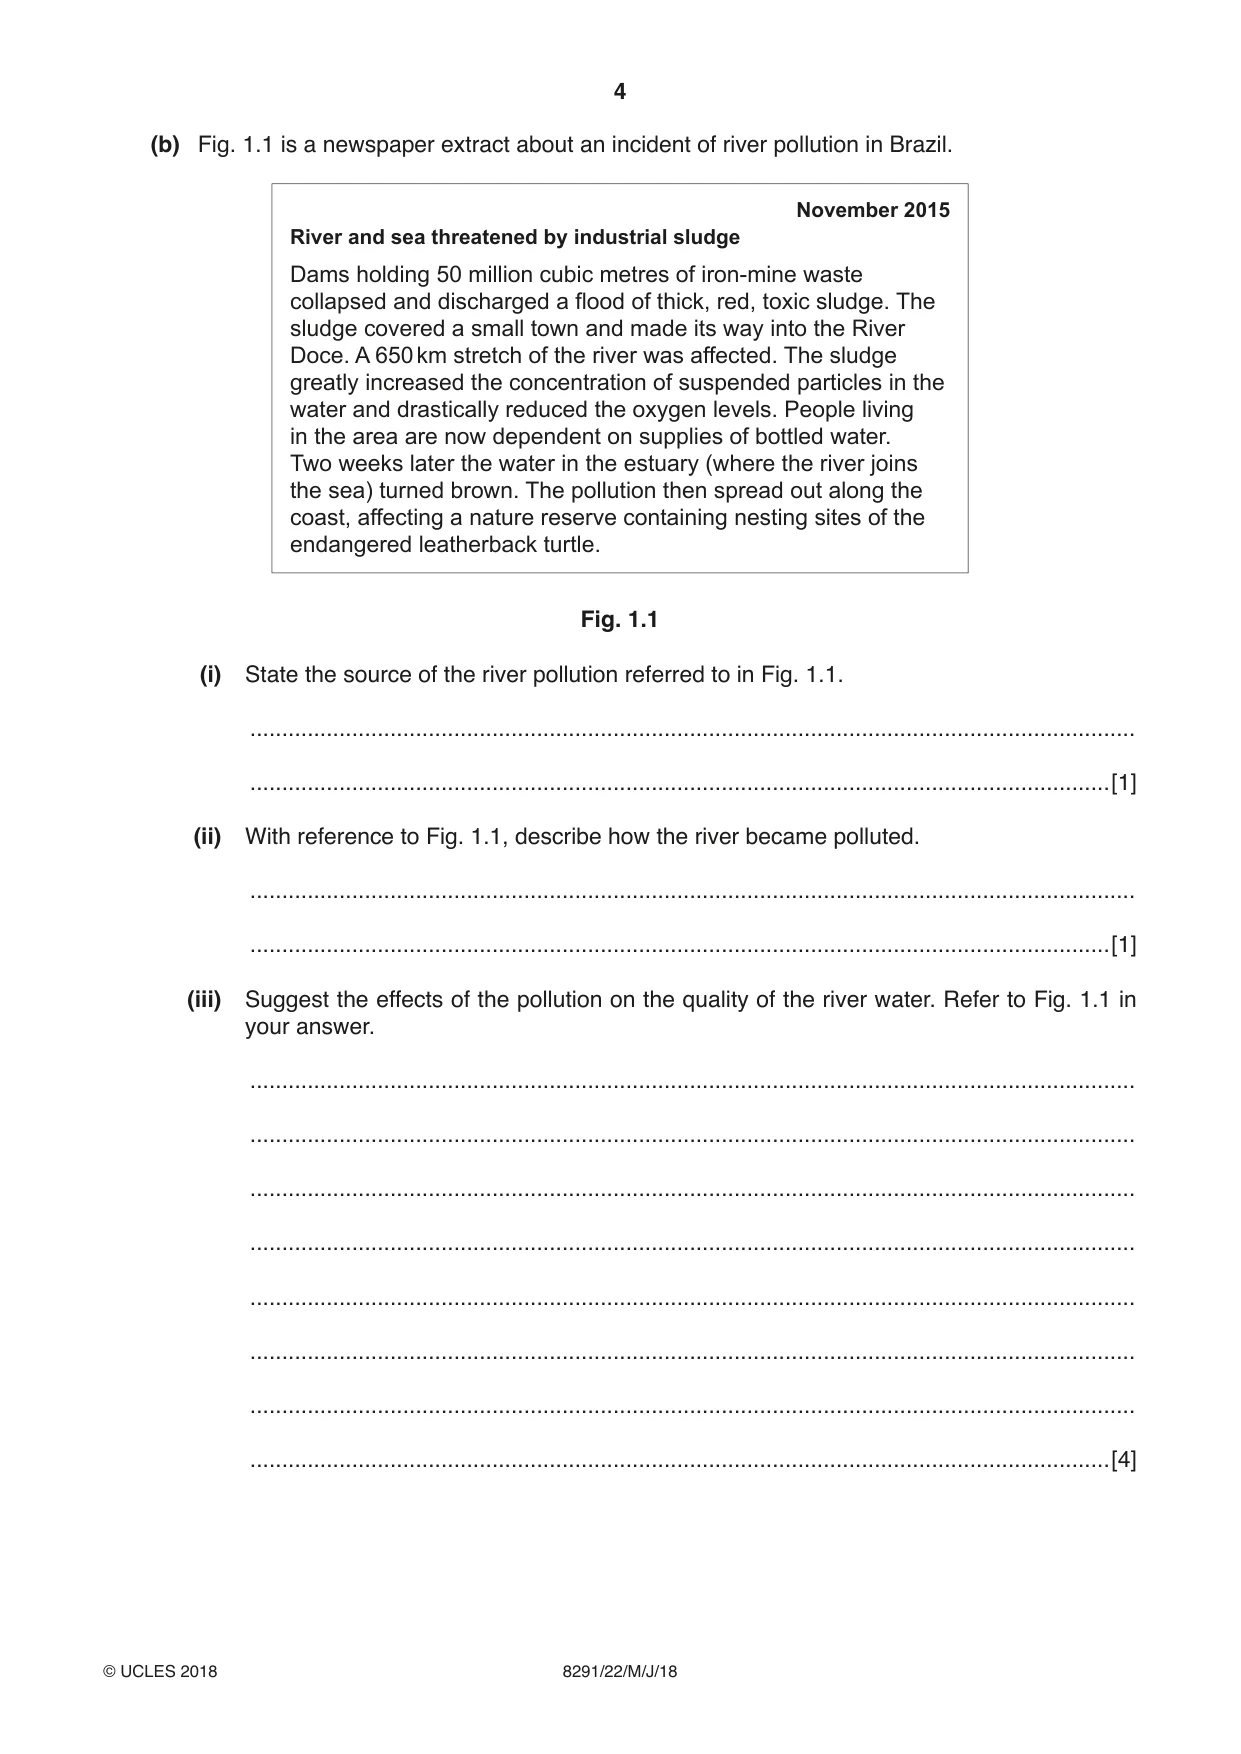
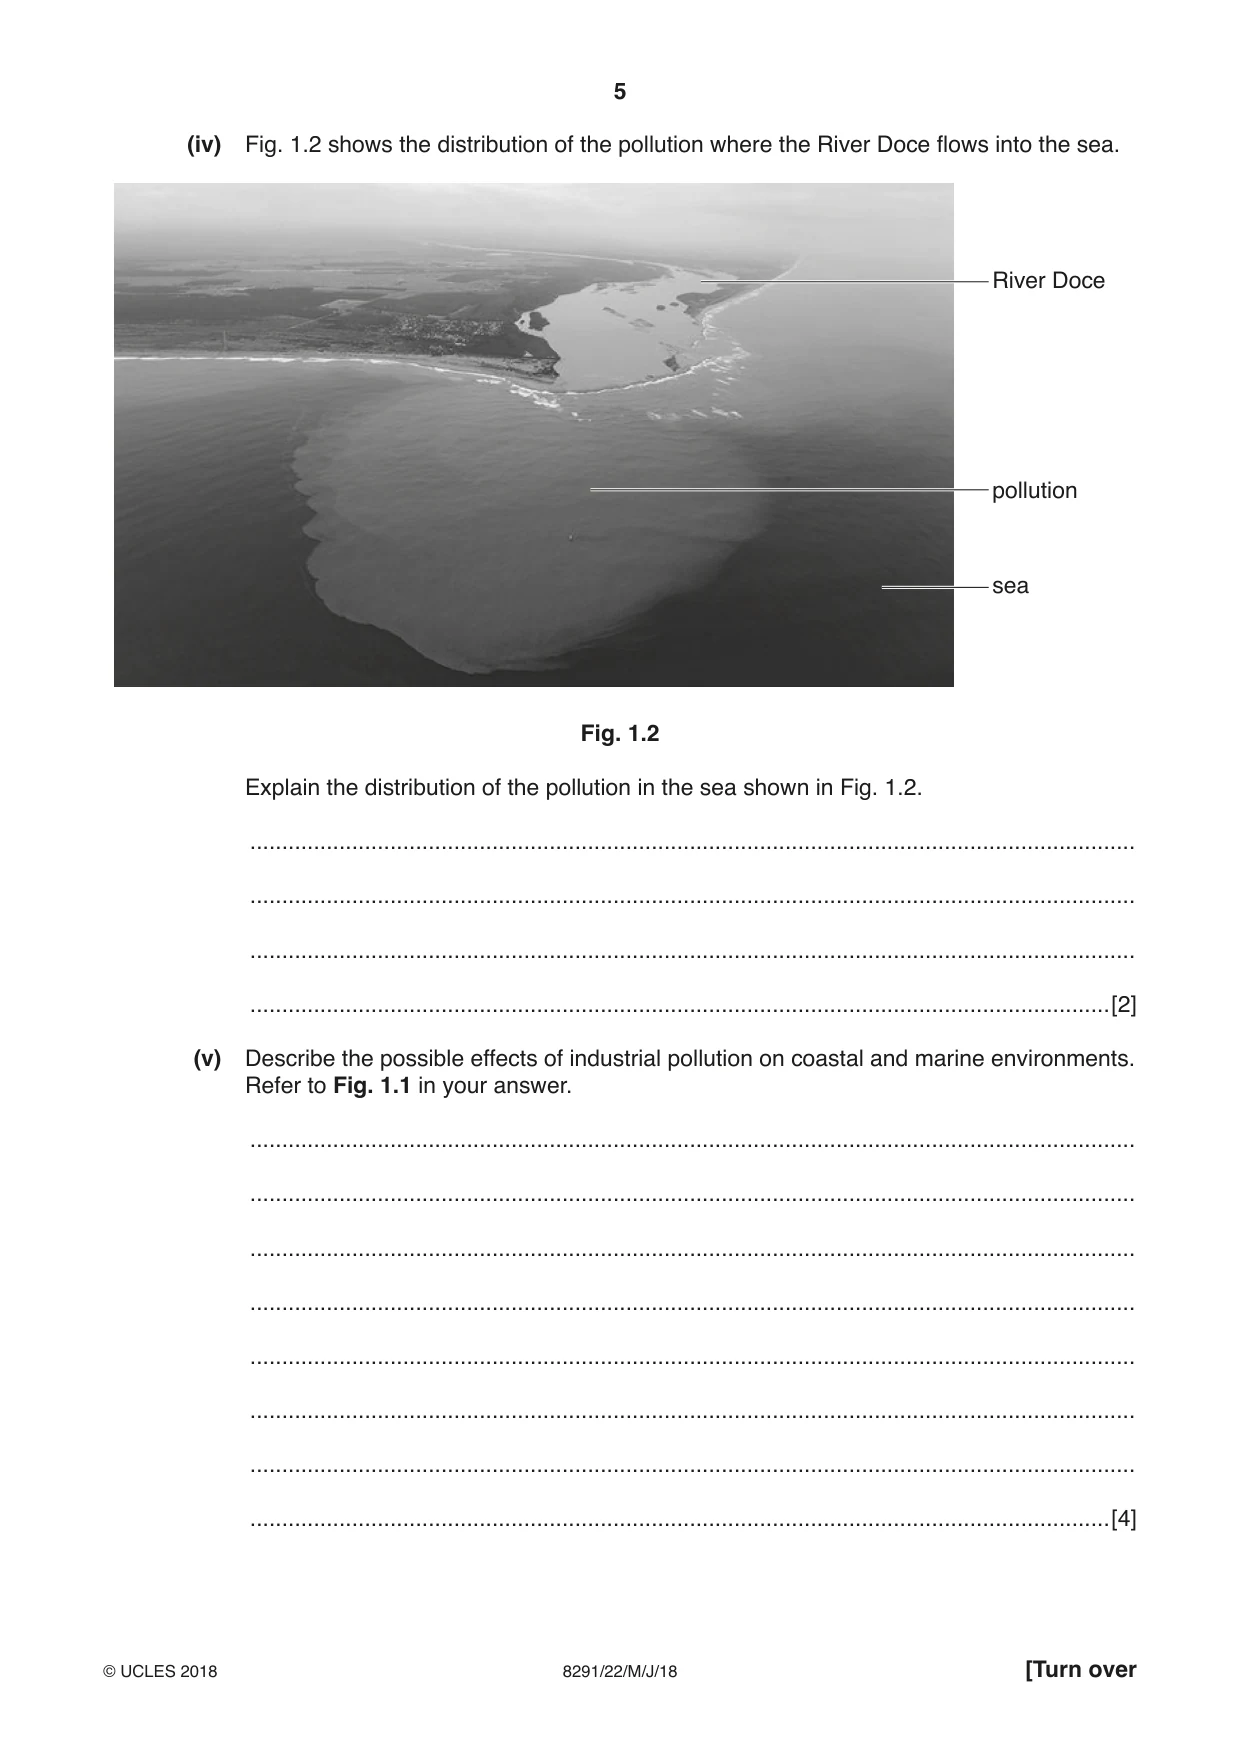
1 (a) Table 1.1 shows the approximate residence time for some major water stores. Residence time is the time water spends in a particular water store. Table 1.1 water store approximate residence time glaciers 10 to 10 000 years deep groundwater 10 000 years shallow groundwater 100 to 200 years lakes 10 to 100 years living organisms 1 week oceans 4000 years rivers 2 weeks to 6 months soil moisture 2 weeks to 1 year (i) State the water store with the lowest approximate residence time in Table 1.1. .......................................................................................................................................[1] (ii) With reference to Table 1.1, suggest why the residence times given in Table 1.1 are approximate. ........................................................................................................................................... ........................................................................................................................................... ........................................................................................................................................... .......................................................................................................................................[2] (b) Fig. 1.1 is a newspaper extract about an incident of river pollution in Brazil. November 2015 River and sea threatened by industrial sludge Dams holding 50 million cubic metres of iron-mine waste collapsed and discharged a flood of thick, red, toxic sludge. The sludge covered a small town and made its way into the River Doce. A 650 km stretch of the river was affected. The sludge greatly increased the concentration of suspended particles in the water and drastically reduced the oxygen levels. People living in the area are now dependent on supplies of bottled water. Two weeks later the water in the estuary (where the river joins the sea) turned brown. The pollution then spread out along the coast, affecting a nature reserve containing nesting sites of the endangered leatherback turtle. Fig. 1.1 (i) State the source of the river pollution referred to in Fig. 1.1. ........................................................................................................................................... .......................................................................................................................................[1] (ii) With reference to Fig. 1.1, describe how the river became polluted. ........................................................................................................................................... .......................................................................................................................................[1] (iii) Suggest the effects of the pollution on the quality of the river water. Refer to Fig. 1.1 in your answer. ........................................................................................................................................... ........................................................................................................................................... ........................................................................................................................................... ........................................................................................................................................... ........................................................................................................................................... ........................................................................................................................................... ........................................................................................................................................... .......................................................................................................................................[4] (iv) Fig. 1.2 shows the distribution of the pollution where the River Doce flows into the sea. River Doce pollution sea Fig. 1.2 Explain the distribution of the pollution in the sea shown in Fig. 1.2. ........................................................................................................................................... ........................................................................................................................................... ........................................................................................................................................... .......................................................................................................................................[2] (v) Describe the possible effects of industrial pollution on coastal and marine environments. Refer to Fig. 1.1 in your answer. ........................................................................................................................................... ........................................................................................................................................... ........................................................................................................................................... ........................................................................................................................................... ........................................................................................................................................... ........................................................................................................................................... ........................................................................................................................................... .......................................................................................................................................[4] (c) Briefly describe strategies that can be used to manage river pollution. ................................................................................................................................................... ................................................................................................................................................... ................................................................................................................................................... ................................................................................................................................................... ................................................................................................................................................... ................................................................................................................................................... ................................................................................................................................................... ................................................................................................................................................... ................................................................................................................................................... ...............................................................................................................................................[5] [Total: 20]
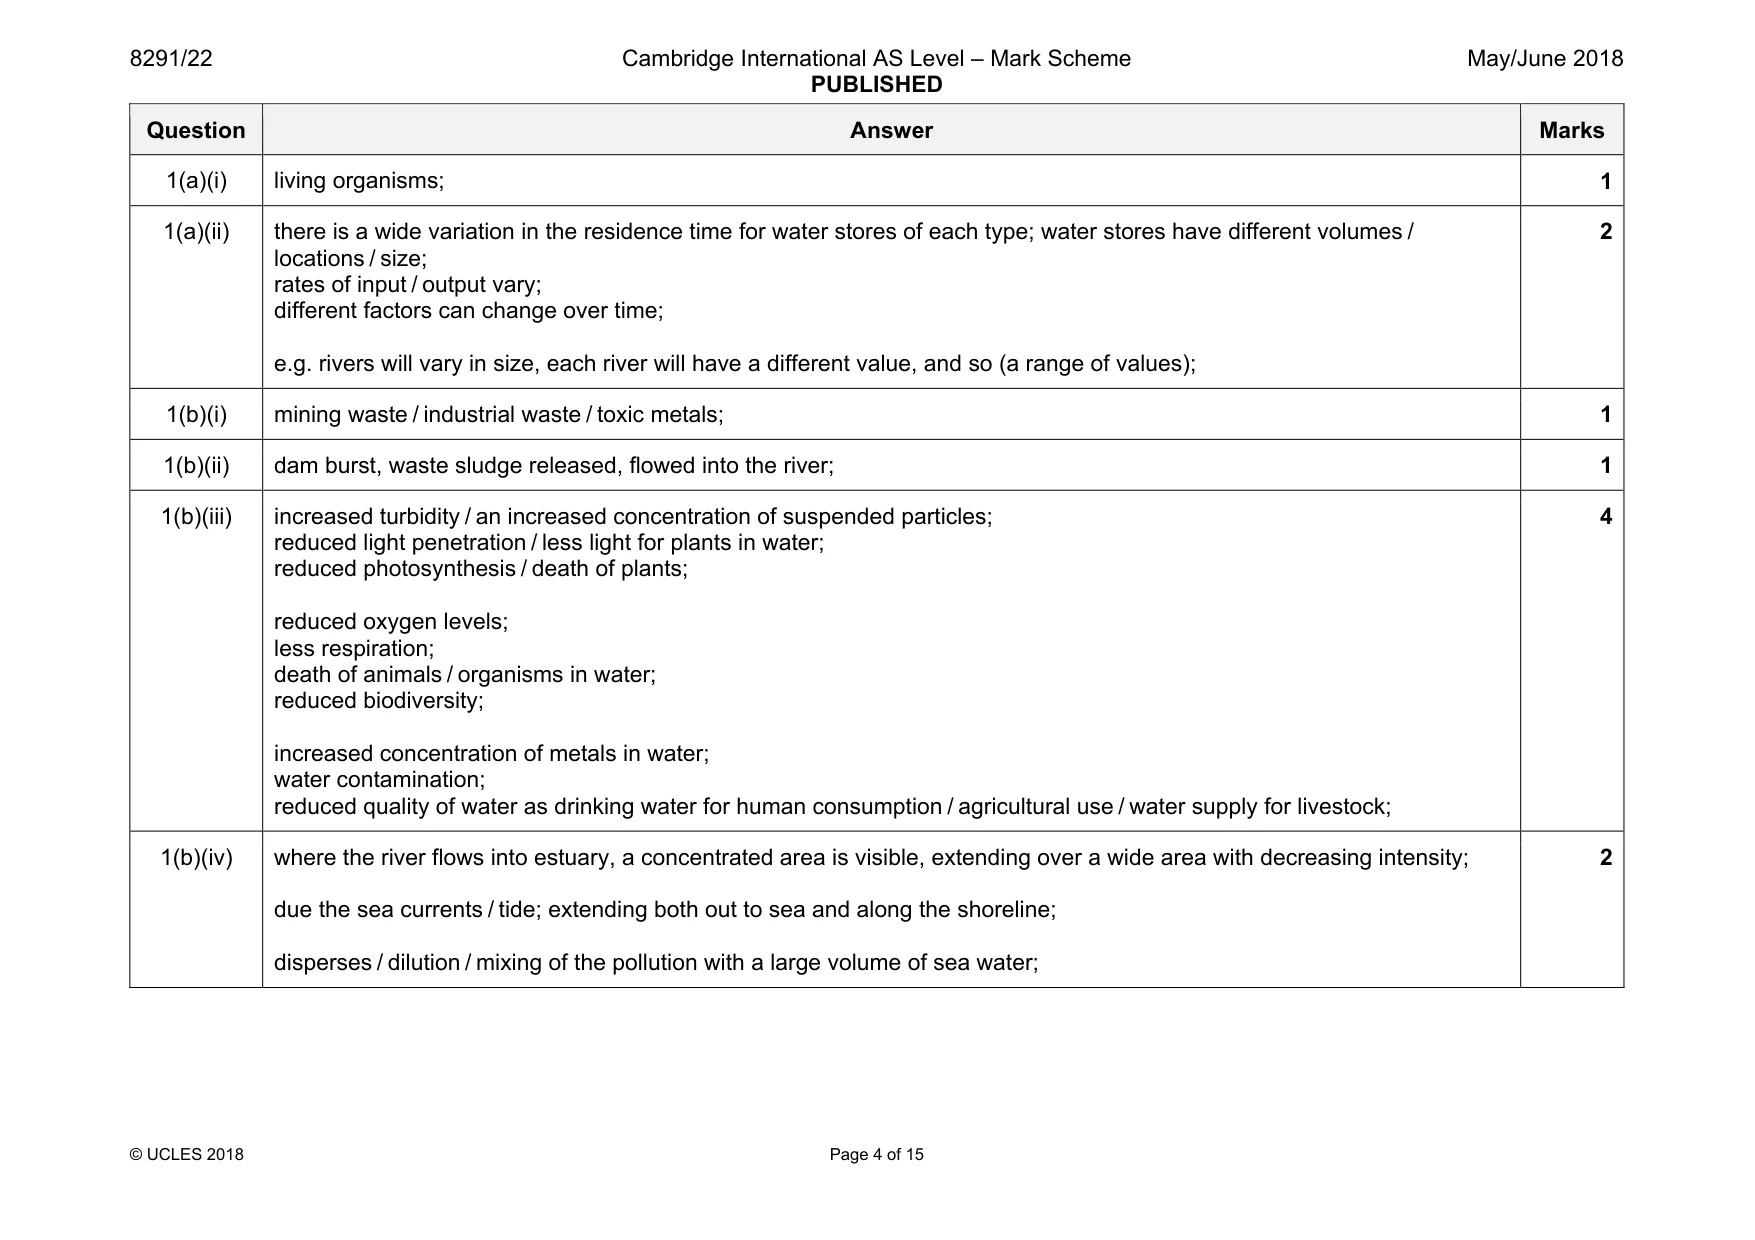
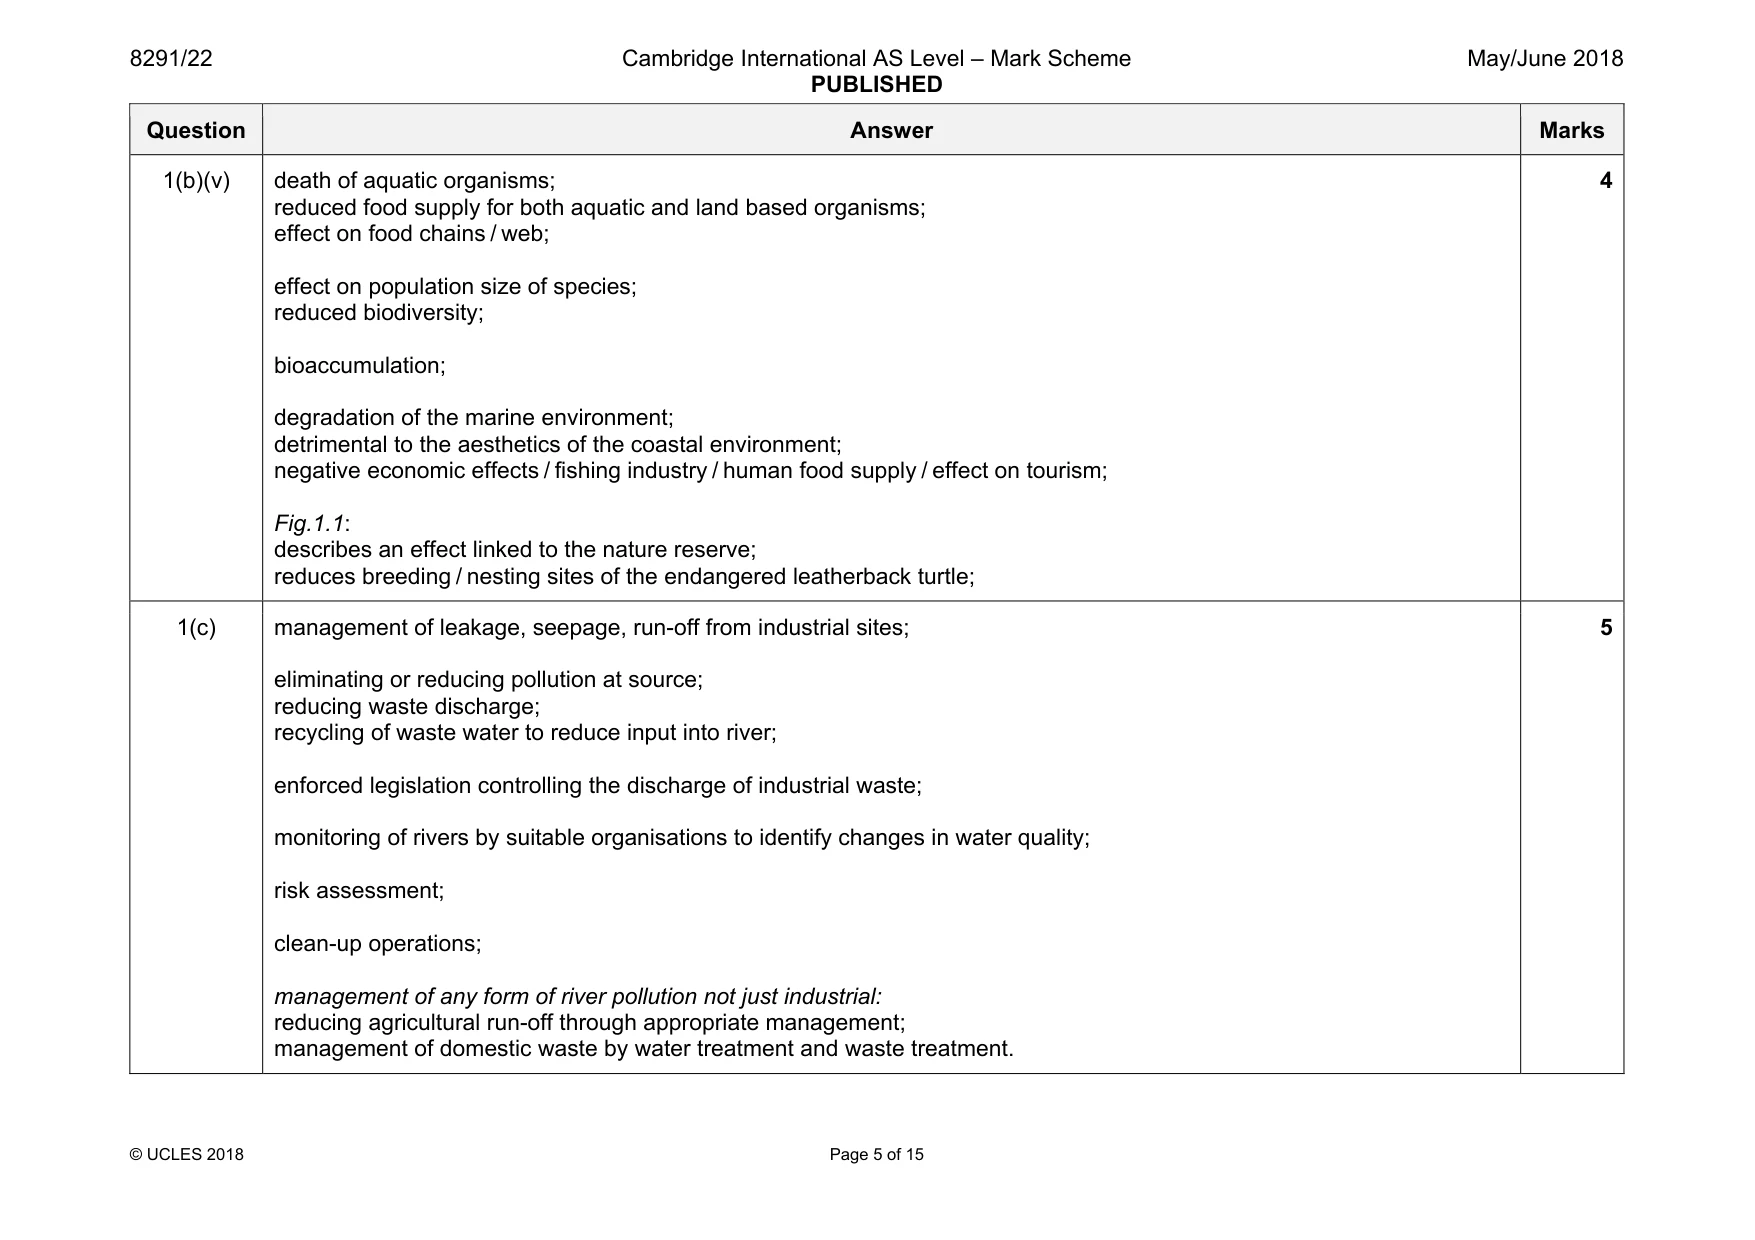
Mark scheme: 1(a)(i) living organisms; 1 1(a)(ii) there is a wide variation in the residence time for water stores of each type; water stores have different volumes / locations / size; rates of input / output vary; different factors can change over time; e.g. rivers will vary in size, each river will have a different value, and so (a range of values); 2 1(b)(i) mining waste / industrial waste / toxic metals; 1 1(b)(ii) dam burst, waste sludge released, flowed into the river; 1 1(b)(iii) increased turbidity / an increased concentration of suspended particles; reduced light penetration / less light for plants in water; reduced photosynthesis / death of plants; reduced oxygen levels; less respiration; death of animals / organisms in water; reduced biodiversity; increased concentration of metals in water; water contamination; reduced quality of water as drinking water for human consumption / agricultural use / water supply for livestock; 4 1(b)(iv) where the river flows into estuary, a concentrated area is visible, extending over a wide area with decreasing intensity; due the sea currents / tide; extending both out to sea and along the shoreline; disperses / dilution / mixing of the pollution with a large volume of sea water; 2 Question Answer Marks 1(b)(v) death of aquatic organisms; reduced food supply for both aquatic and land based organisms; effect on food chains / web; effect on population size of species; reduced biodiversity; bioaccumulation; degradation of the marine environment; detrimental to the aesthetics of the coastal environment; negative economic effects / fishing industry / human food supply / effect on tourism; Fig.1.1: describes an effect linked to the nature reserve; reduces breeding / nesting sites of the endangered leatherback turtle; 4 1(c) management of leakage, seepage, run-off from industrial sites; eliminating or reducing pollution at source; reducing waste discharge; recycling of waste water to reduce input into river; enforced legislation controlling the discharge of industrial waste; monitoring of rivers by suitable organisations to identify changes in water quality; risk assessment; clean-up operations; management of any form of river pollution not just industrial: reducing agricultural run-off through appropriate management; management of domestic waste by water treatment and waste treatment. 5
Q2 · Part of a natural forest ecosystem before deforestation
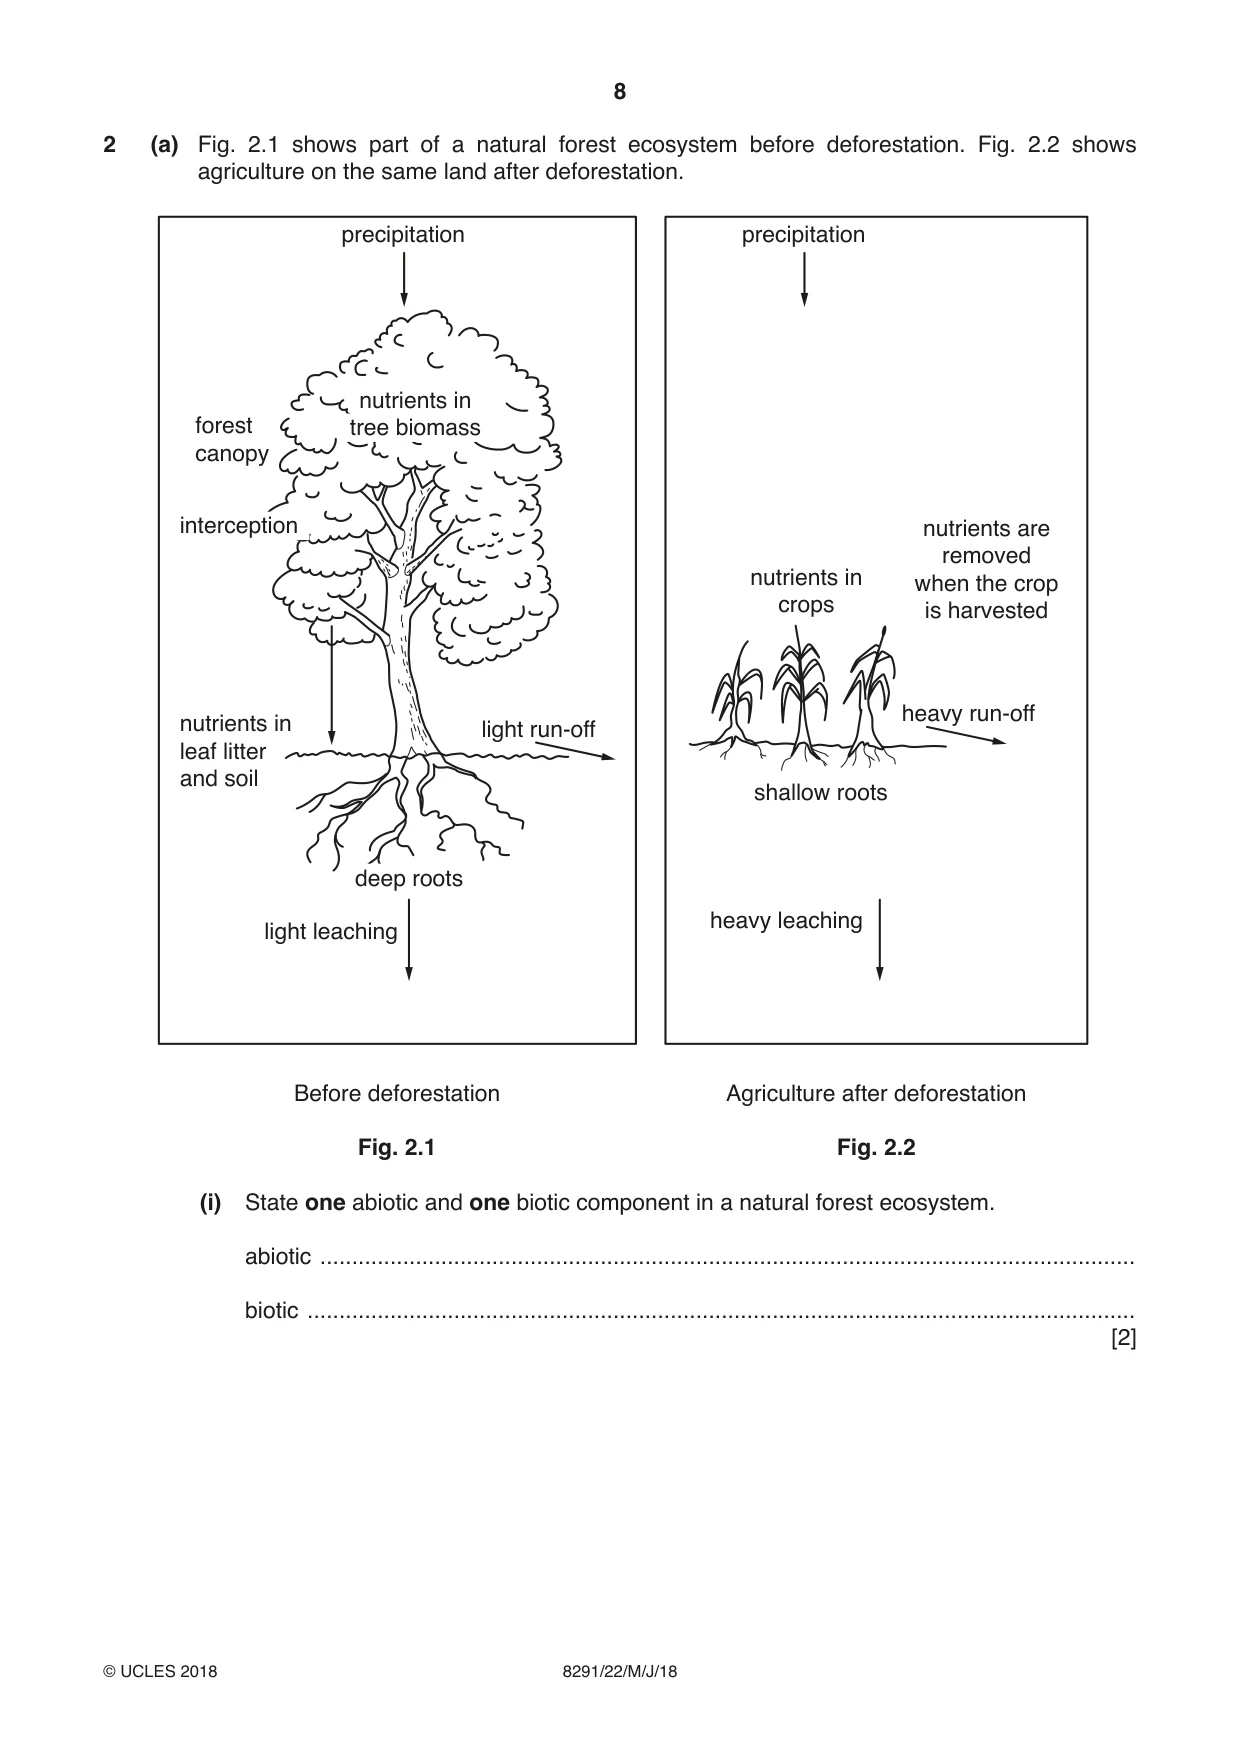
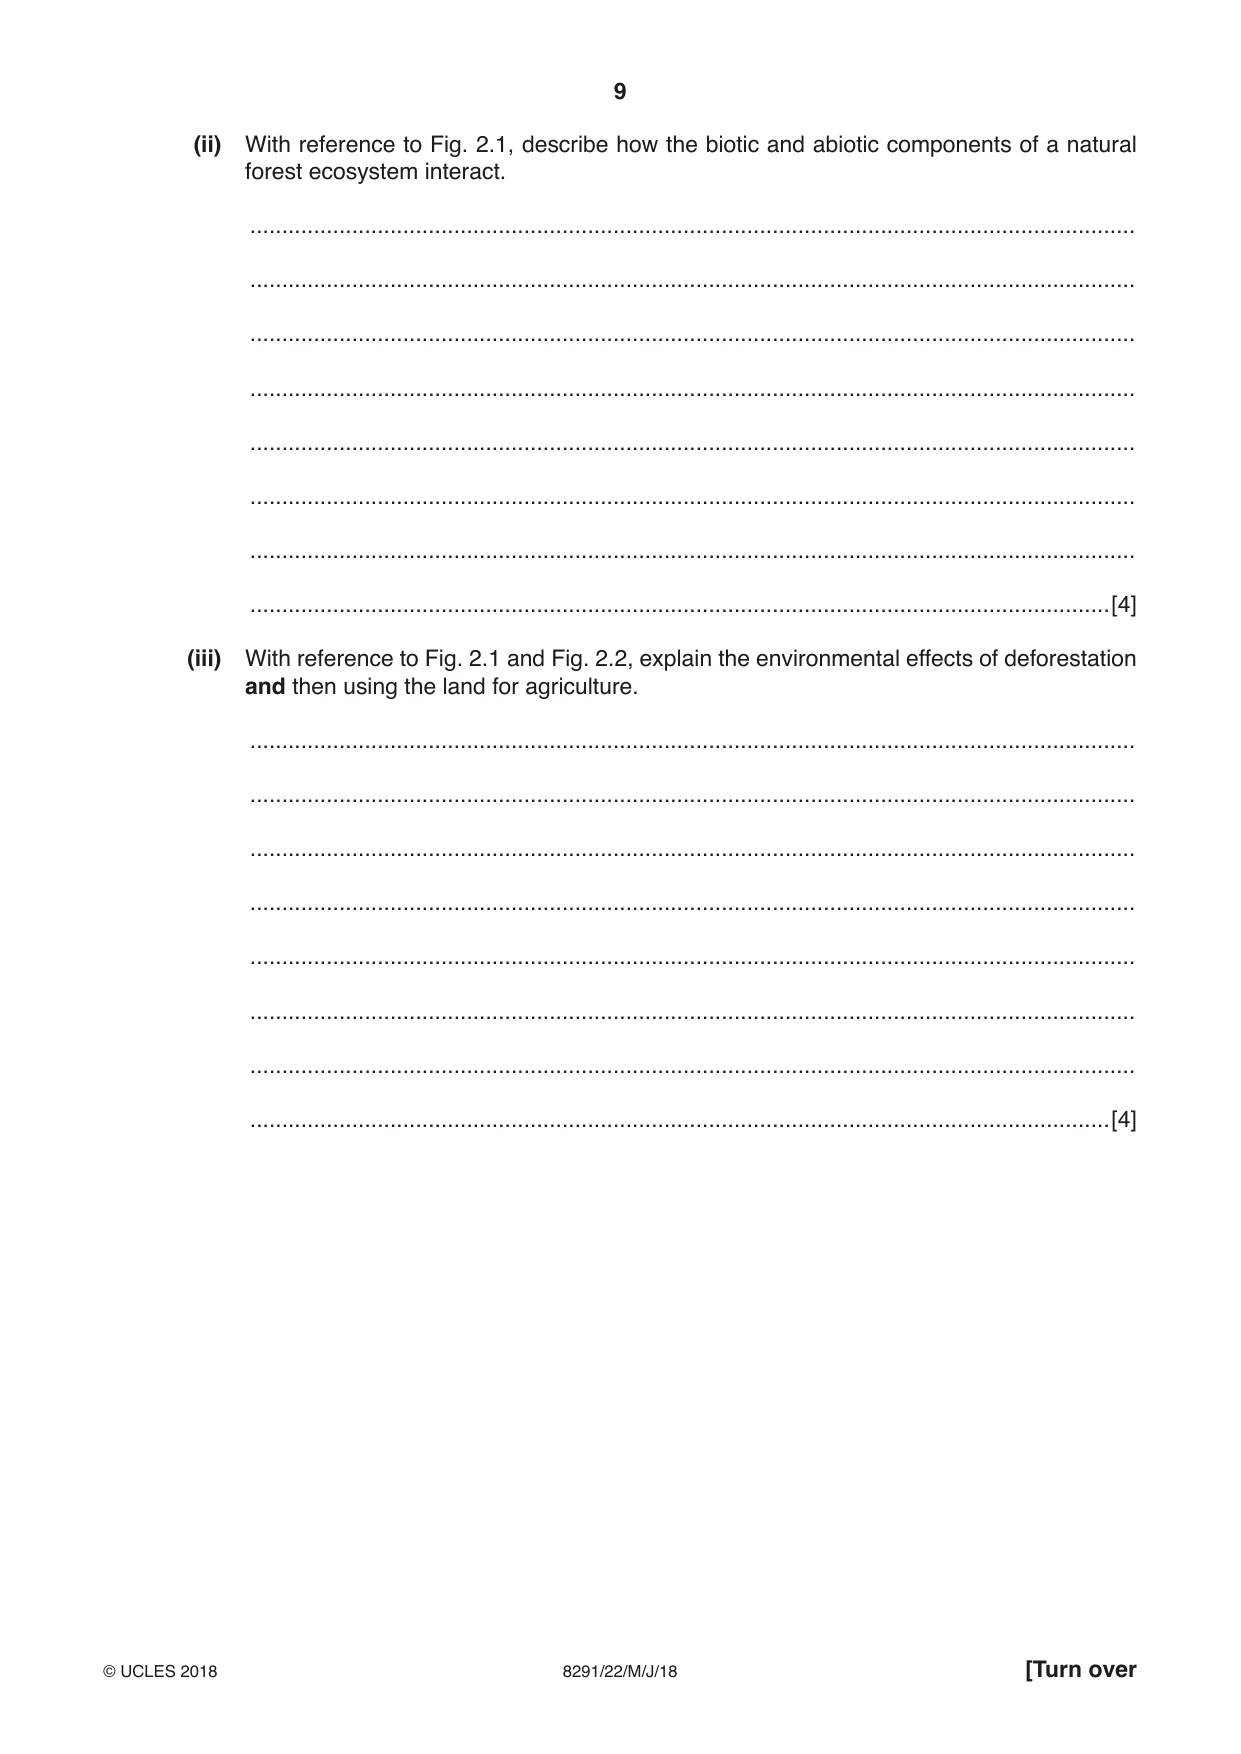
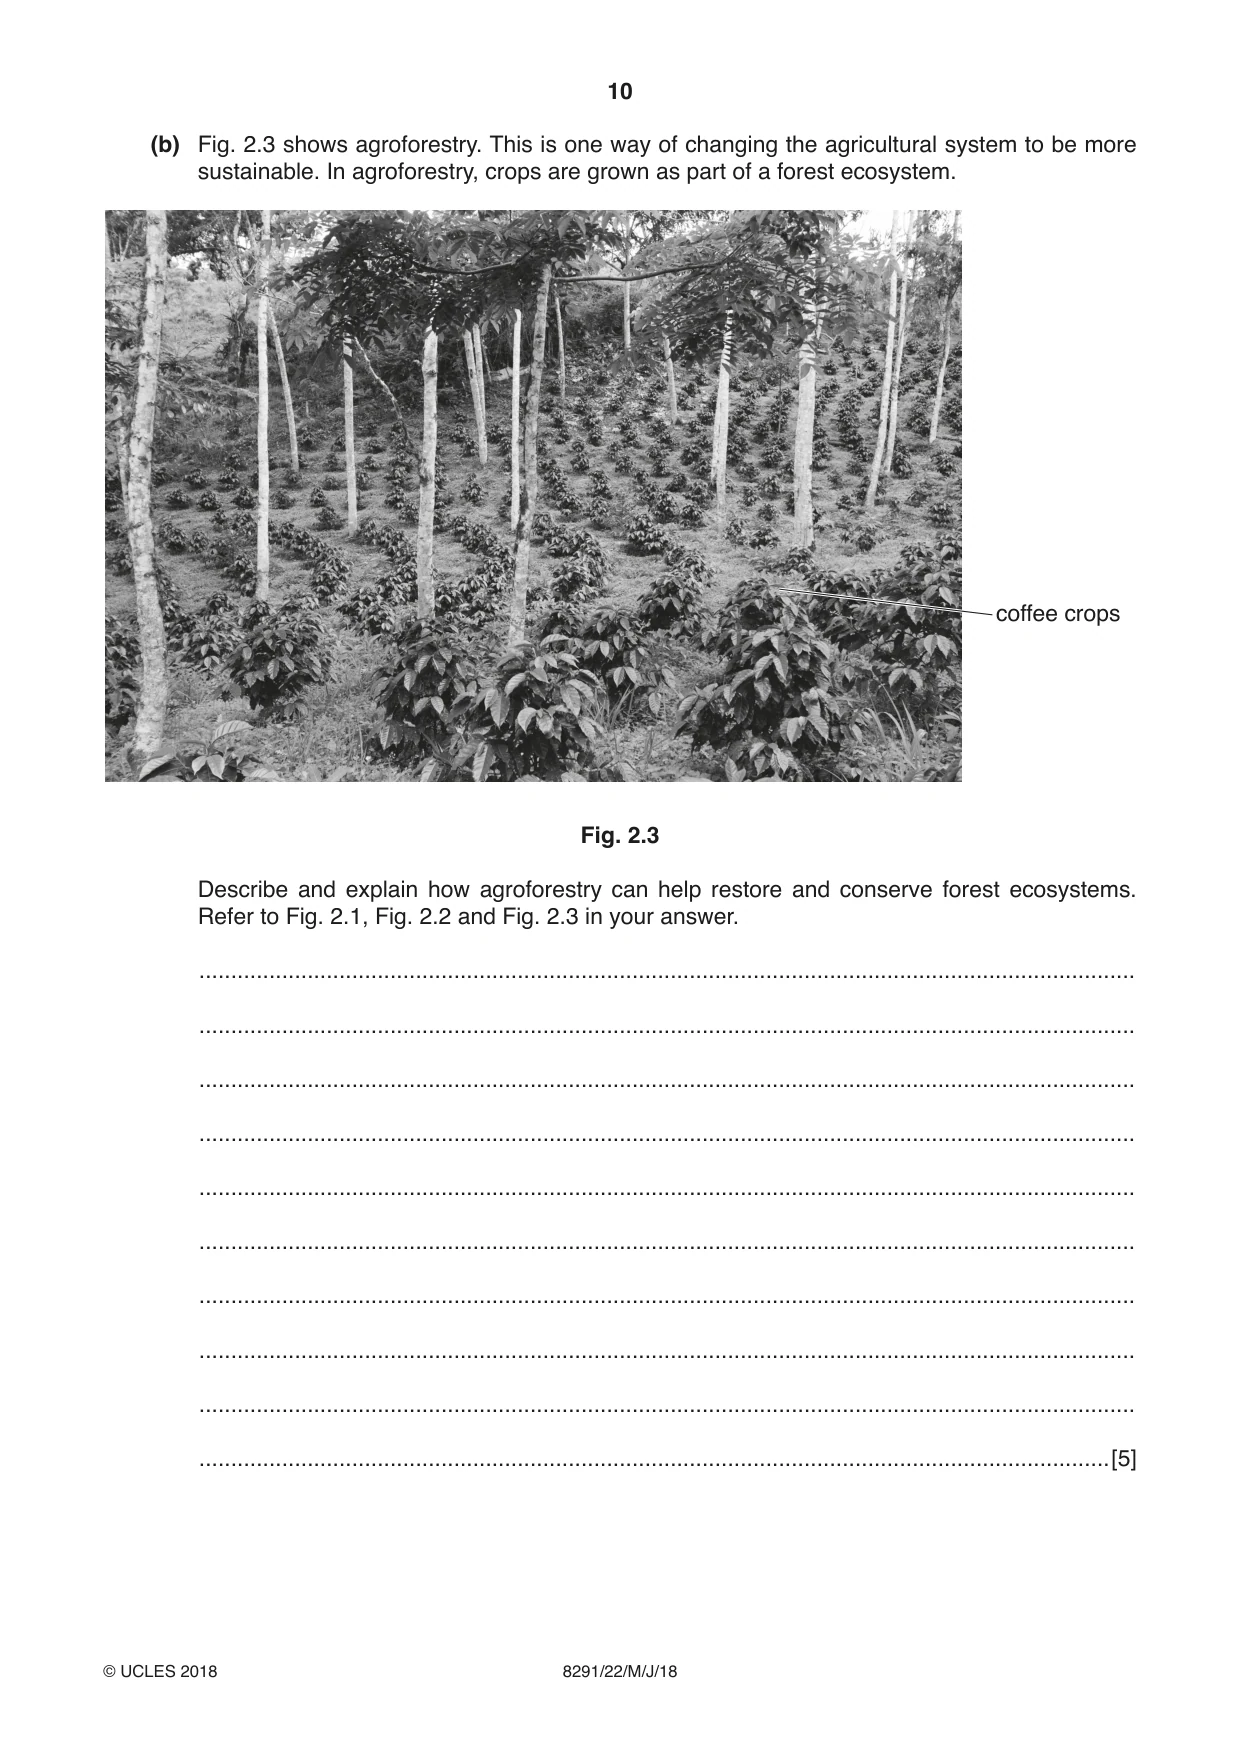
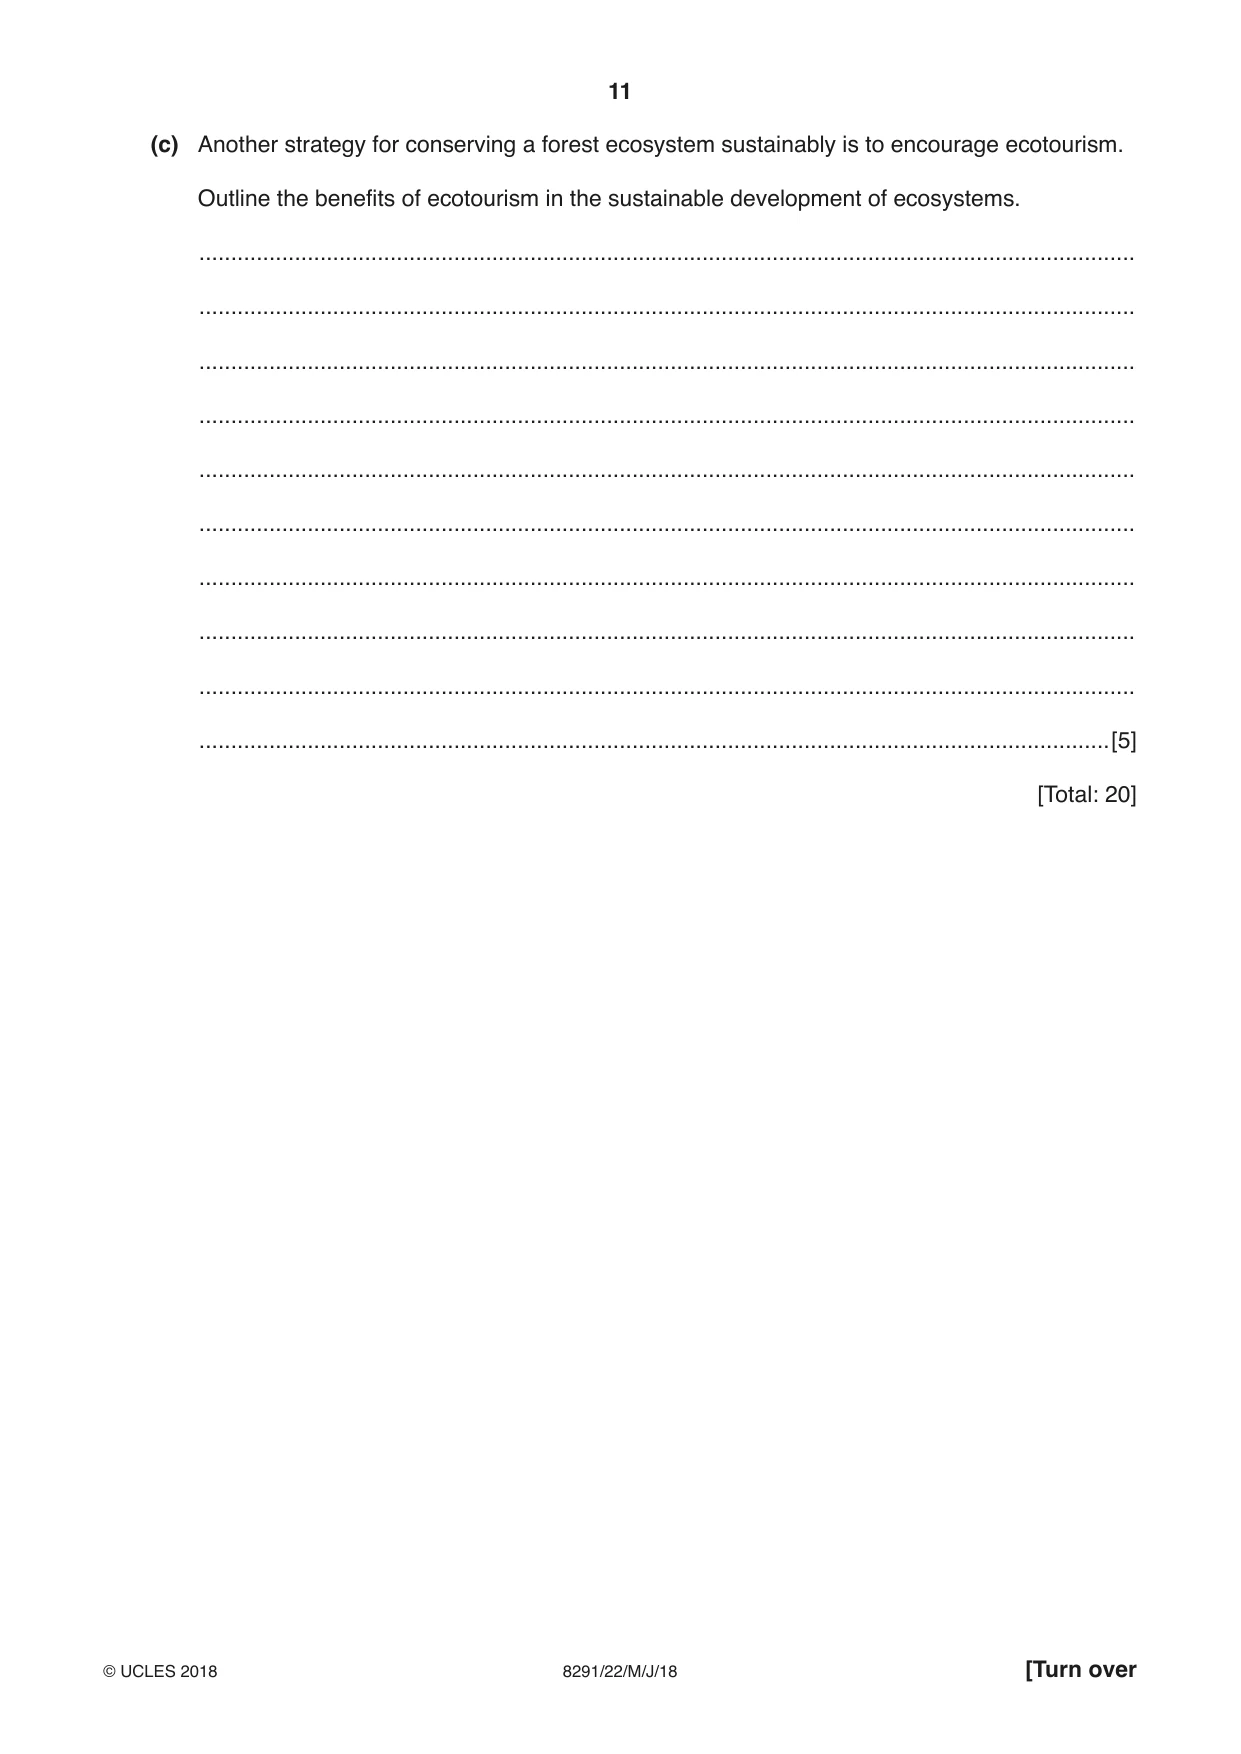
2 (a) Fig. 2.1 shows part of a natural forest ecosystem before deforestation. Fig. 2.2 shows agriculture on the same land after deforestation. precipitation precipitation nutrients in forest tree biomass canopy interception nutrients are removed nutrients in when the crop crops is harvested heavy run-off nutrients in light run-off leaf litter and soil shallow roots deep roots heavy leaching light leaching Before deforestation Agriculture after deforestation Fig. 2.1 Fig. 2.2 (i) State one abiotic and one biotic component in a natural forest ecosystem. abiotic ................................................................................................................................ biotic .................................................................................................................................. [2] (ii) With reference to Fig. 2.1, describe how the biotic and abiotic components of a natural forest ecosystem interact. ........................................................................................................................................... ........................................................................................................................................... ........................................................................................................................................... ........................................................................................................................................... ........................................................................................................................................... ........................................................................................................................................... ........................................................................................................................................... .......................................................................................................................................[4] (iii) With reference to Fig. 2.1 and Fig. 2.2, explain the environmental effects of deforestation and then using the land for agriculture. ........................................................................................................................................... ........................................................................................................................................... ........................................................................................................................................... ........................................................................................................................................... ........................................................................................................................................... ........................................................................................................................................... ........................................................................................................................................... .......................................................................................................................................[4] (b) Fig. 2.3 shows agroforestry. This is one way of changing the agricultural system to be more sustainable. In agroforestry, crops are grown as part of a forest ecosystem. coffee crops Fig. 2.3 Describe and explain how agroforestry can help restore and conserve forest ecosystems. Refer to Fig. 2.1, Fig. 2.2 and Fig. 2.3 in your answer. ................................................................................................................................................... ................................................................................................................................................... ................................................................................................................................................... ................................................................................................................................................... ................................................................................................................................................... ................................................................................................................................................... ................................................................................................................................................... ................................................................................................................................................... ................................................................................................................................................... ...............................................................................................................................................[5] (c) Another strategy for conserving a forest ecosystem sustainably is to encourage ecotourism. Outline the benefits of ecotourism in the sustainable development of ecosystems. ................................................................................................................................................... ................................................................................................................................................... ................................................................................................................................................... ................................................................................................................................................... ................................................................................................................................................... ................................................................................................................................................... ................................................................................................................................................... ................................................................................................................................................... ................................................................................................................................................... ...............................................................................................................................................[5] [Total: 20]
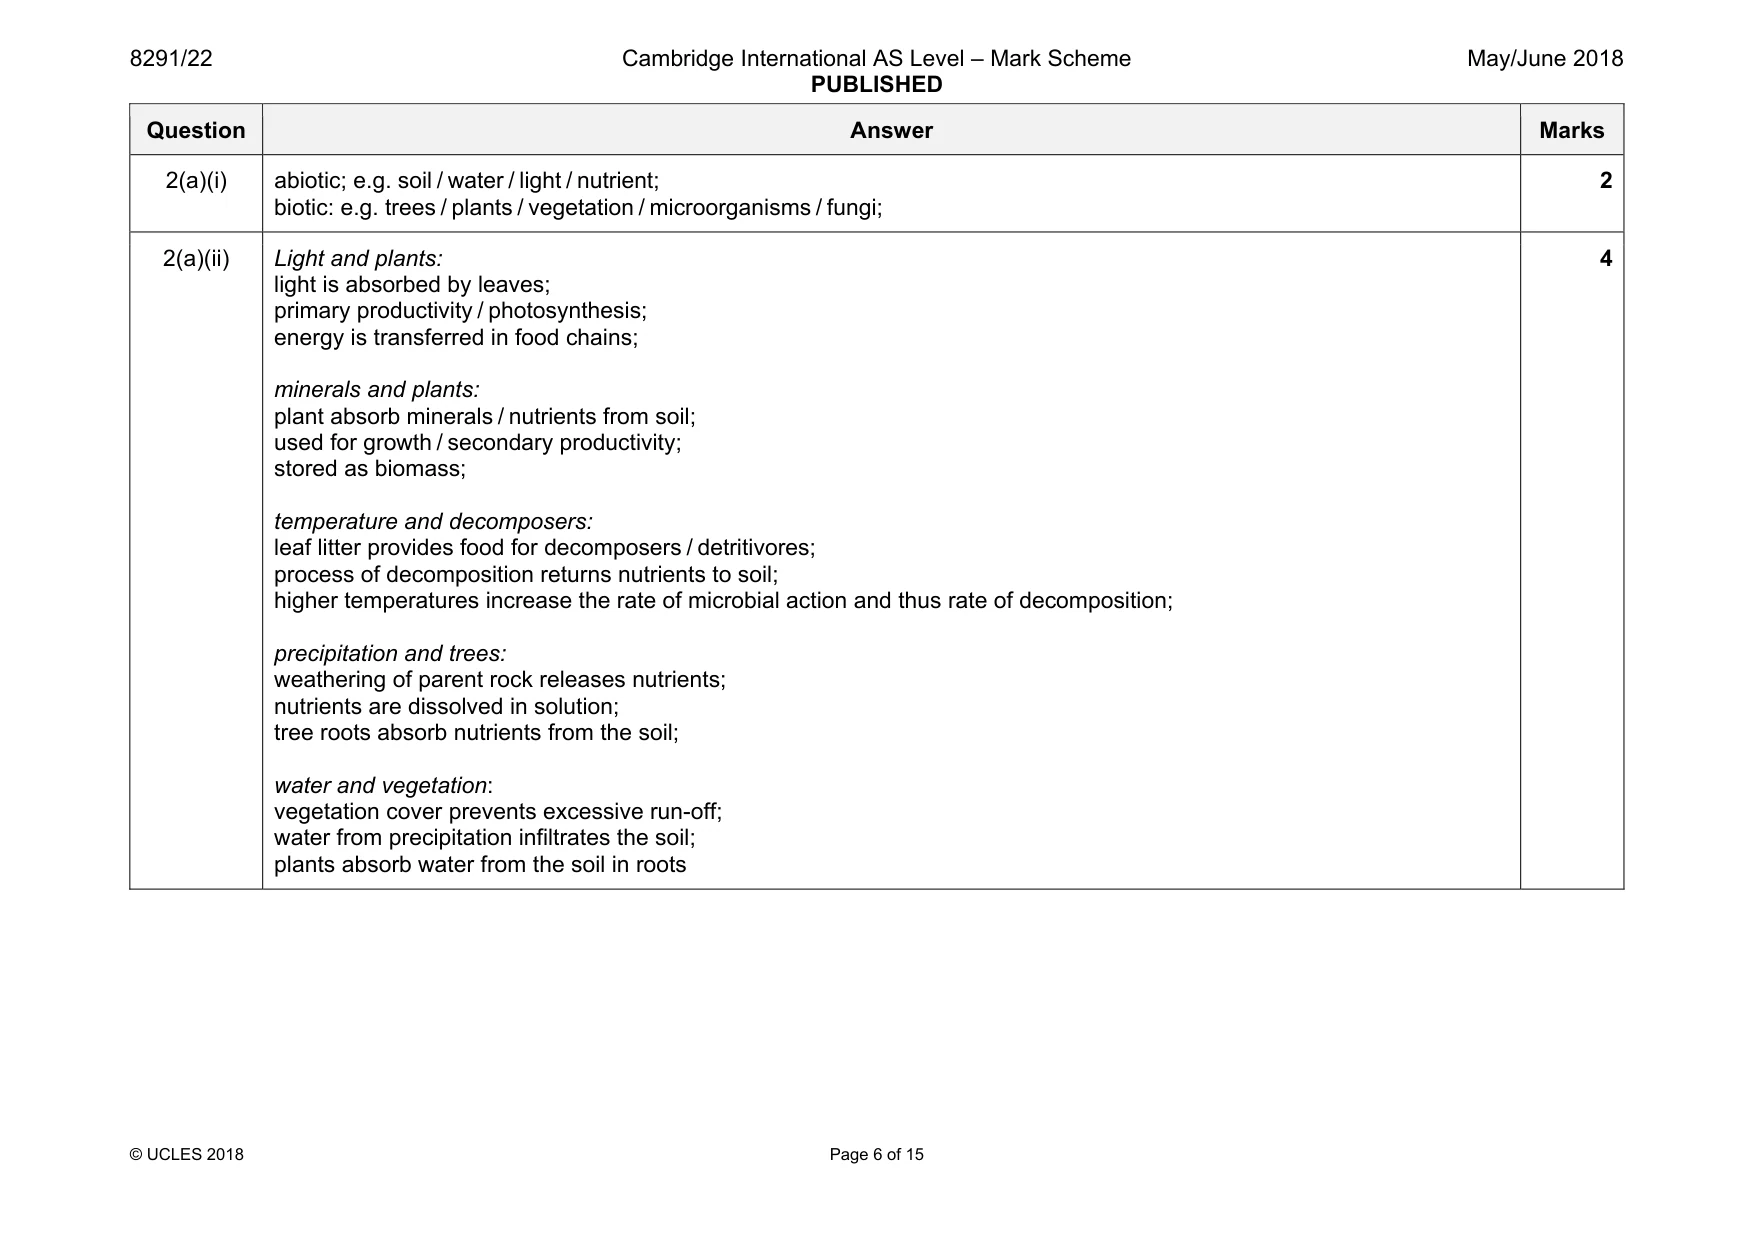
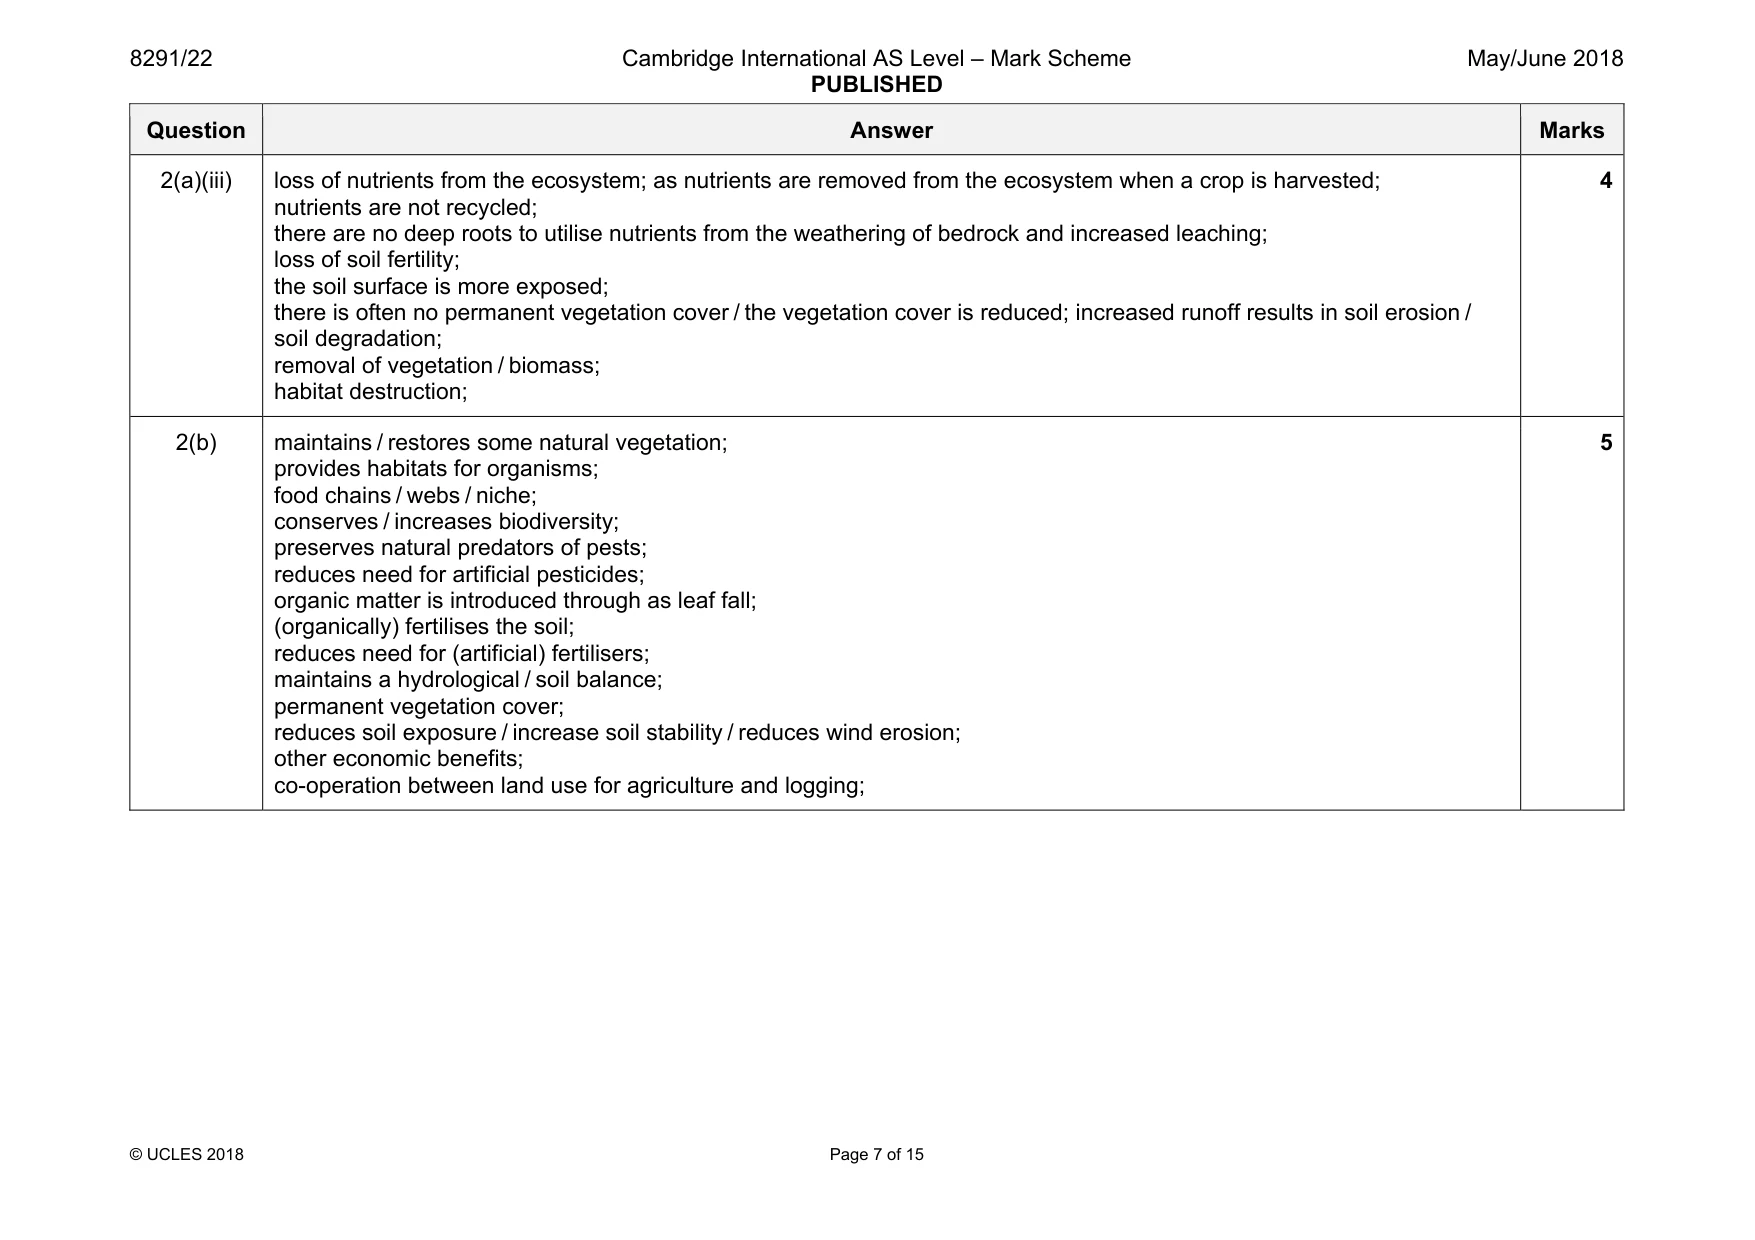
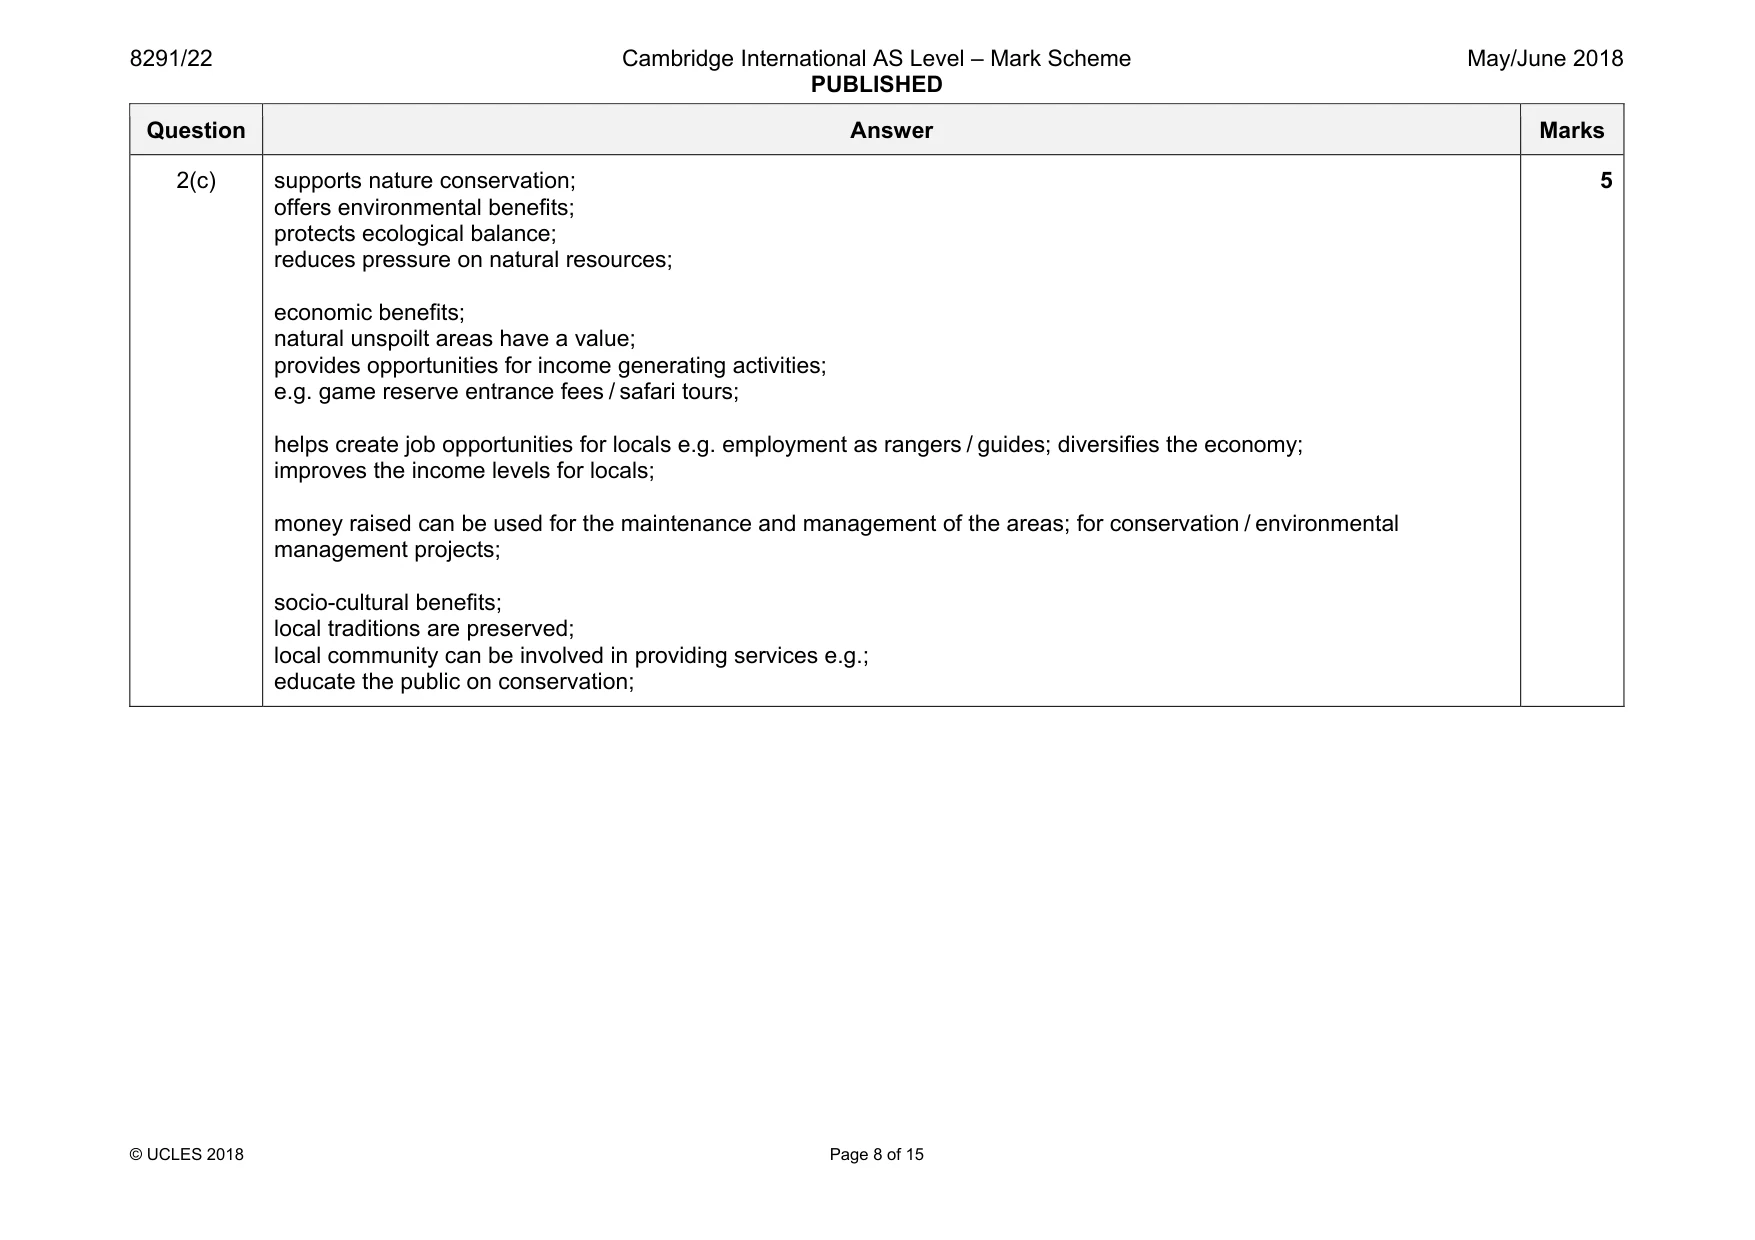
Mark scheme: 2(a)(i) abiotic; e.g. soil / water / light / nutrient; biotic: e.g. trees / plants / vegetation / microorganisms / fungi; 2 2(a)(ii) Light and plants: light is absorbed by leaves; primary productivity / photosynthesis; energy is transferred in food chains; minerals and plants: plant absorb minerals / nutrients from soil; used for growth / secondary productivity; stored as biomass; temperature and decomposers: leaf litter provides food for decomposers / detritivores; process of decomposition returns nutrients to soil; higher temperatures increase the rate of microbial action and thus rate of decomposition; precipitation and trees: weathering of parent rock releases nutrients; nutrients are dissolved in solution; tree roots absorb nutrients from the soil; water and vegetation: vegetation cover prevents excessive run-off; water from precipitation infiltrates the soil; plants absorb water from the soil in roots 4 Question Answer Marks 2(a)(iii) loss of nutrients from the ecosystem; as nutrients are removed from the ecosystem when a crop is harvested; nutrients are not recycled; there are no deep roots to utilise nutrients from the weathering of bedrock and increased leaching; loss of soil fertility; the soil surface is more exposed; there is often no permanent vegetation cover / the vegetation cover is reduced; increased runoff results in soil erosion / soil degradation; removal of vegetation / biomass; habitat destruction; 4 2(b) maintains / restores some natural vegetation; provides habitats for organisms; food chains / webs / niche; conserves / increases biodiversity; preserves natural predators of pests; reduces need for artificial pesticides; organic matter is introduced through as leaf fall; (organically) fertilises the soil; reduces need for (artificial) fertilisers; maintains a hydrological / soil balance; permanent vegetation cover; reduces soil exposure / increase soil stability / reduces wind erosion; other economic benefits; co-operation between land use for agriculture and logging; 5 Question Answer Marks 2(c) supports nature conservation; offers environmental benefits; protects ecological balance; reduces pressure on natural resources; economic benefits; natural unspoilt areas have a value; provides opportunities for income generating activities; e.g. game reserve entrance fees / safari tours; helps create job opportunities for locals e.g. employment as rangers / guides; diversifies the economy; improves the income levels for locals; money raised can be used for the maintenance and management of the areas; for conservation / environmental management projects; socio-cultural benefits; local traditions are preserved; local community can be involved in providing services e.g.; educate the public on conservation; 5
Q3 · The area of agricultural land that was irrigated in 1973 and 2013 and the percentage of…
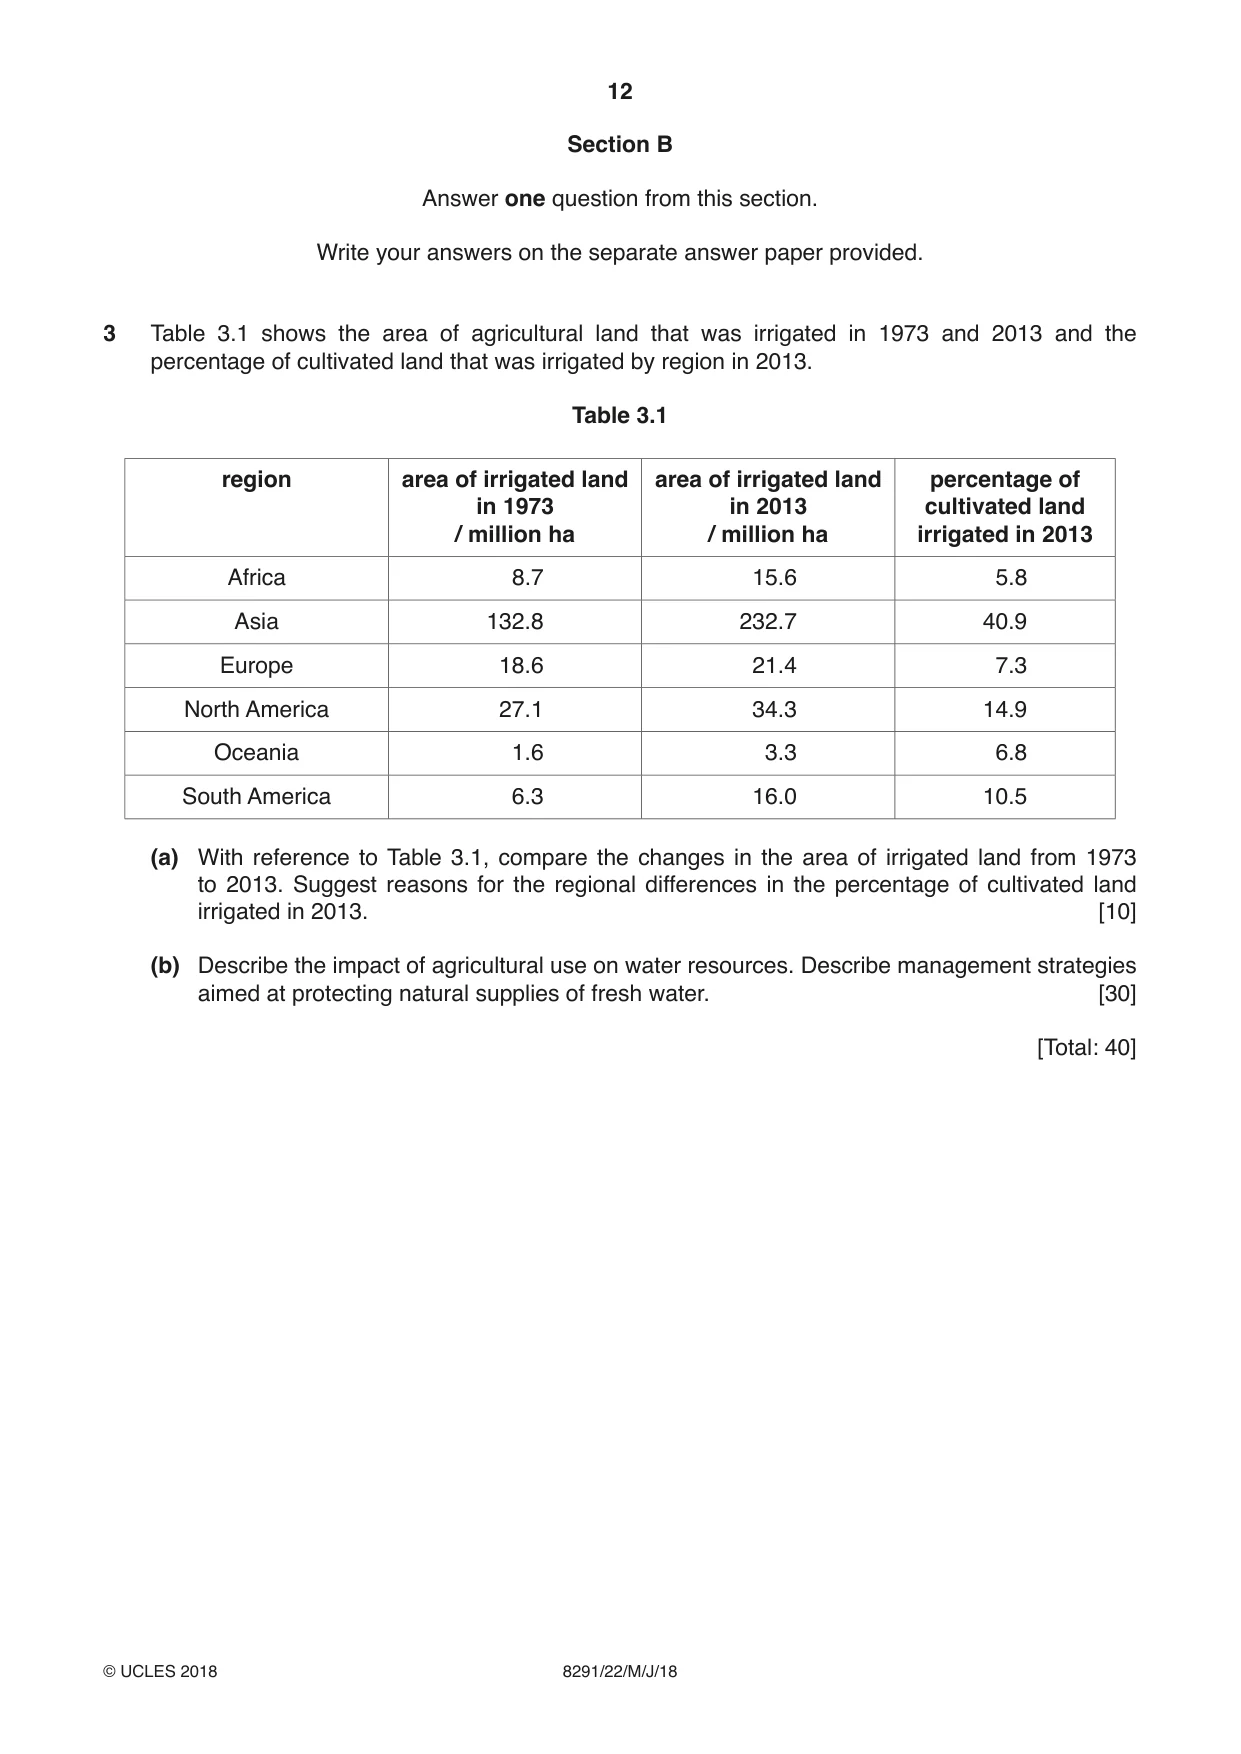
3 Table 3.1 shows the area of agricultural land that was irrigated in 1973 and 2013 and the percentage of cultivated land that was irrigated by region in 2013. Table 3.1 region area of irrigated land area of irrigated land percentage of in 1973 in 2013 cultivated land / million ha / million ha irrigated in 2013 Africa 8.7 15.6 5.8 Asia 132.8 232.7 40.9 Europe 18.6 21.4 7.3 North America 27.1 34.3 14.9 Oceania 1.6 3.3 6.8 South America 6.3 16.0 10.5 (a) With reference to Table 3.1, compare the changes in the area of irrigated land from 1973 to 2013. Suggest reasons for the regional differences in the percentage of cultivated land irrigated in 2013. [10] (b) Describe the impact of agricultural use on water resources. Describe management strategies aimed at protecting natural supplies of fresh water. [30] [Total: 40]
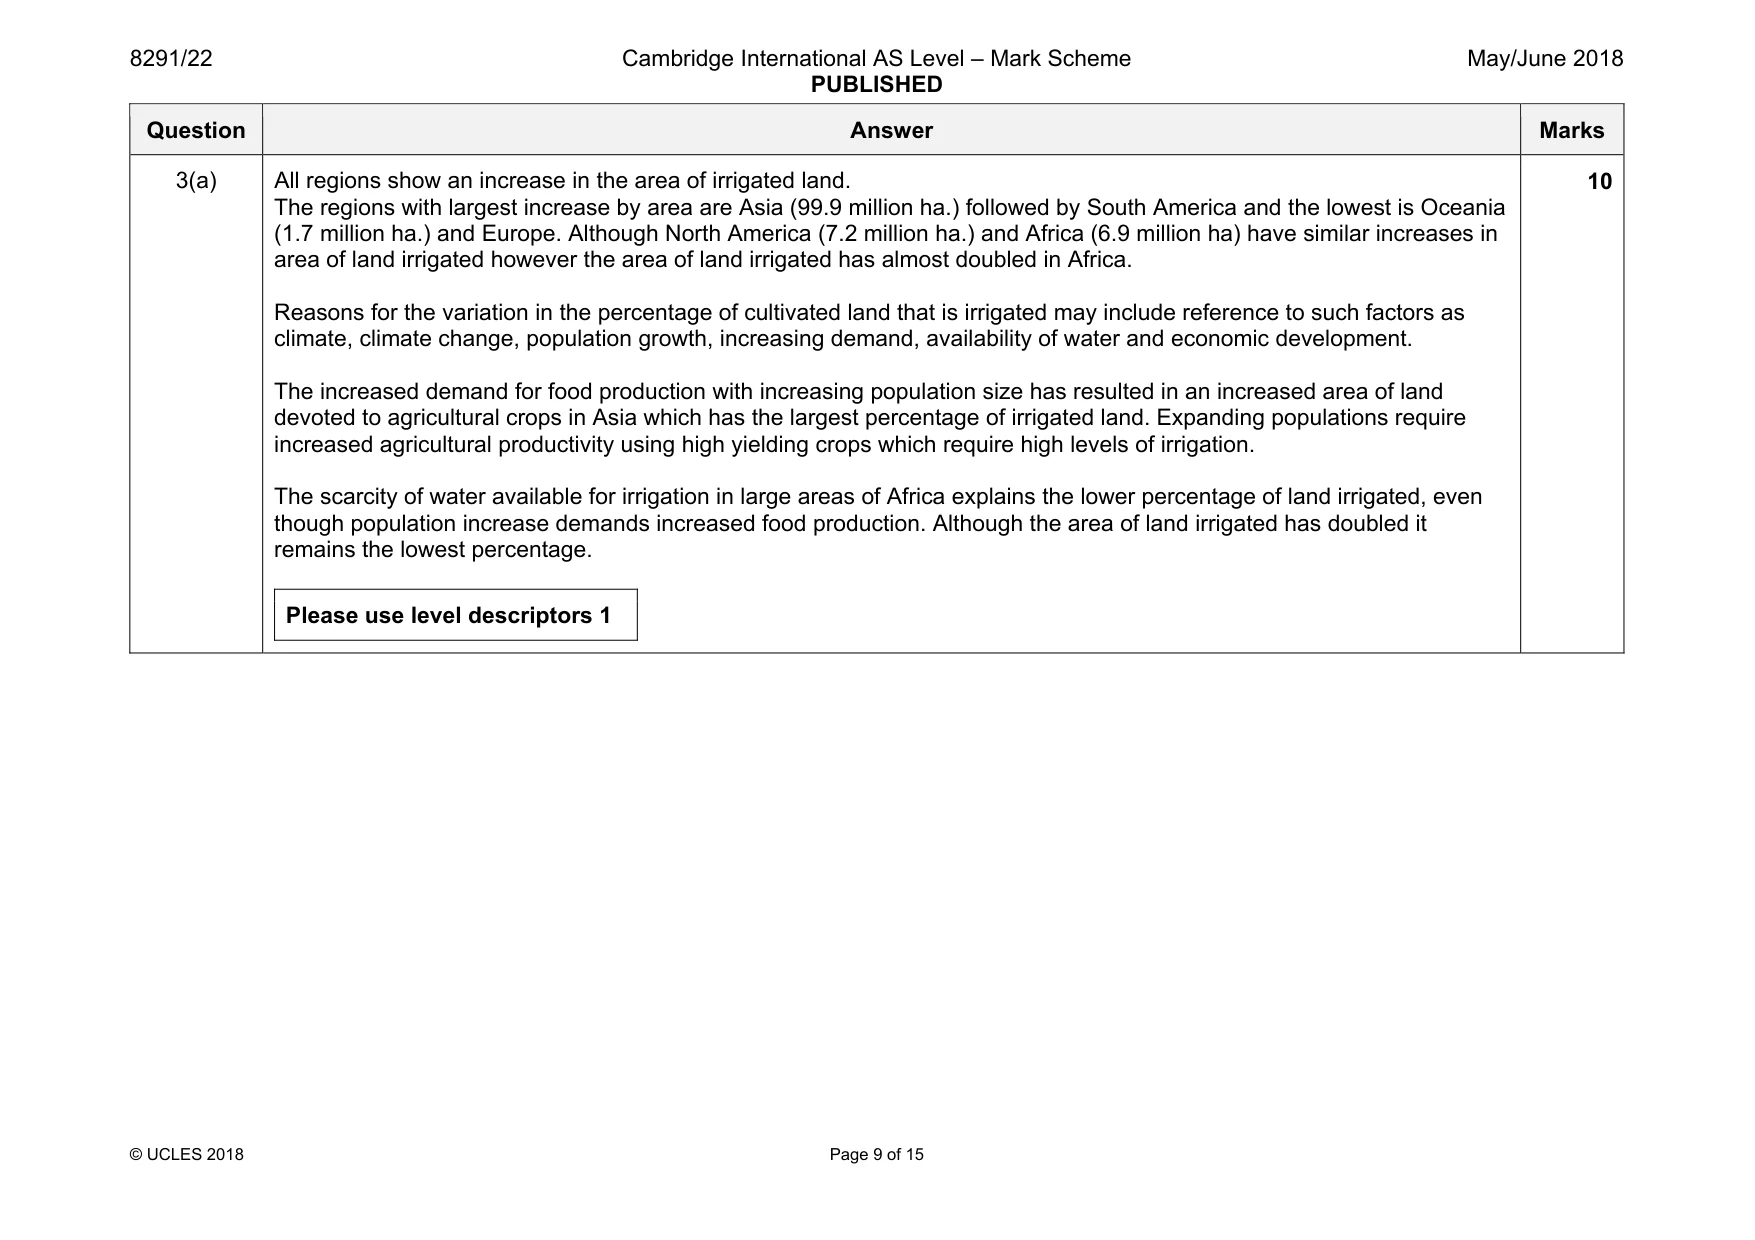
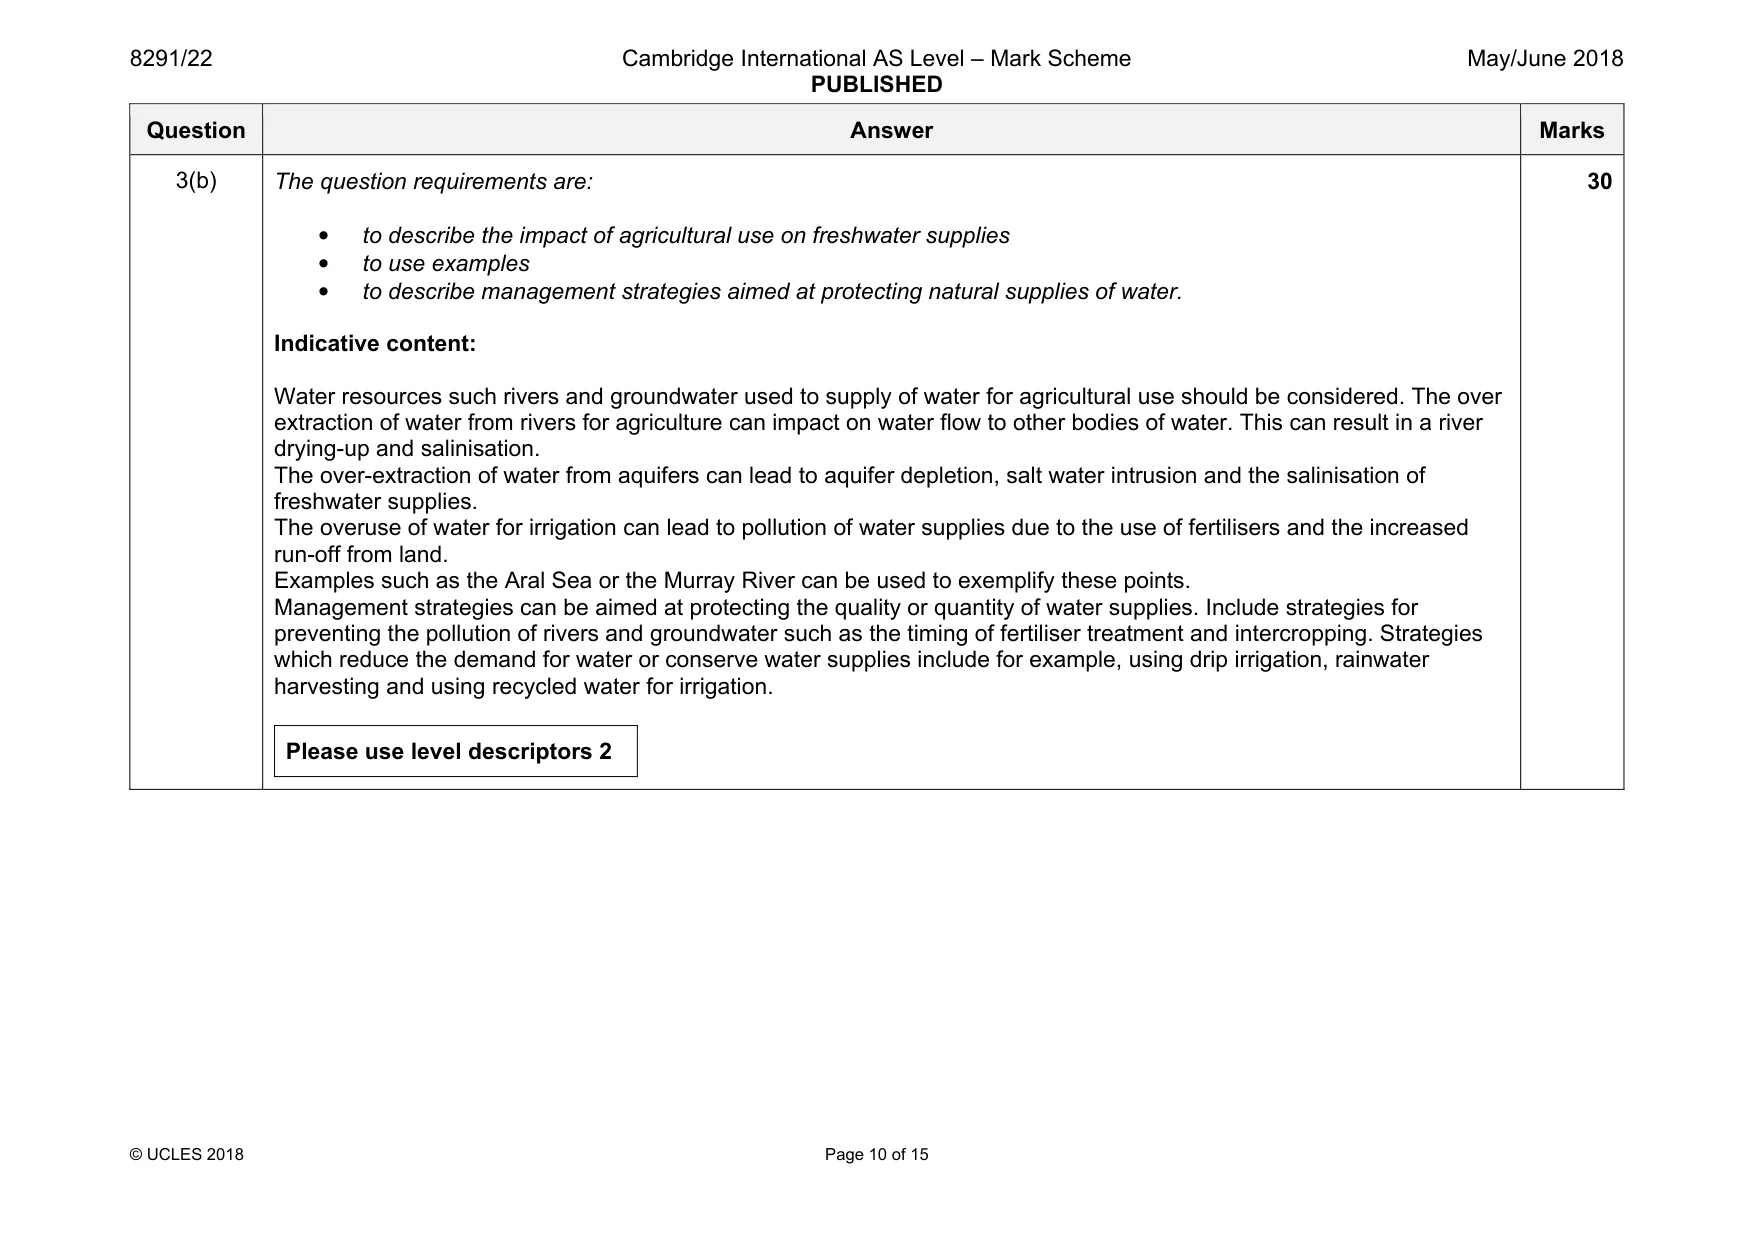
Mark scheme: 3(a) All regions show an increase in the area of irrigated land. The regions with largest increase by area are Asia (99.9 million ha.) followed by South America and the lowest is Oceania (1.7 million ha.) and Europe. Although North America (7.2 million ha.) and Africa (6.9 million ha) have similar increases in area of land irrigated however the area of land irrigated has almost doubled in Africa. Reasons for the variation in the percentage of cultivated land that is irrigated may include reference to such factors as climate, climate change, population growth, increasing demand, availability of water and economic development. The increased demand for food production with increasing population size has resulted in an increased area of land devoted to agricultural crops in Asia which has the largest percentage of irrigated land. Expanding populations require increased agricultural productivity using high yielding crops which require high levels of irrigation. The scarcity of water available for irrigation in large areas of Africa explains the lower percentage of land irrigated, even though population increase demands increased food production. Although the area of land irrigated has doubled it remains the lowest percentage. Please use level descriptors 1 10 Question Answer Marks 3(b) The question requirements are: • to describe the impact of agricultural use on freshwater supplies • to use examples • to describe management strategies aimed at protecting natural supplies of water. Indicative content: Water resources such rivers and groundwater used to supply of water for agricultural use should be considered. The over extraction of water from rivers for agriculture can impact on water flow to other bodies of water. This can result in a river drying-up and salinisation. The over-extraction of water from aquifers can lead to aquifer depletion, salt water intrusion and the salinisation of freshwater supplies. The overuse of water for irrigation can lead to pollution of water supplies due to the use of fertilisers and the increased run-off from land. Examples such as the Aral Sea or the Murray River can be used to exemplify these points. Management strategies can be aimed at protecting the quality or quantity of water supplies. Include strategies for preventing the pollution of rivers and groundwater such as the timing of fertiliser treatment and intercropping. Strategies which reduce the demand for water or conserve water supplies include for example, using drip irrigation, rainwater harvesting and using recycled water for irrigation. Please use level descriptors 2 30
Q4 · The total global population between 1800 and 2015
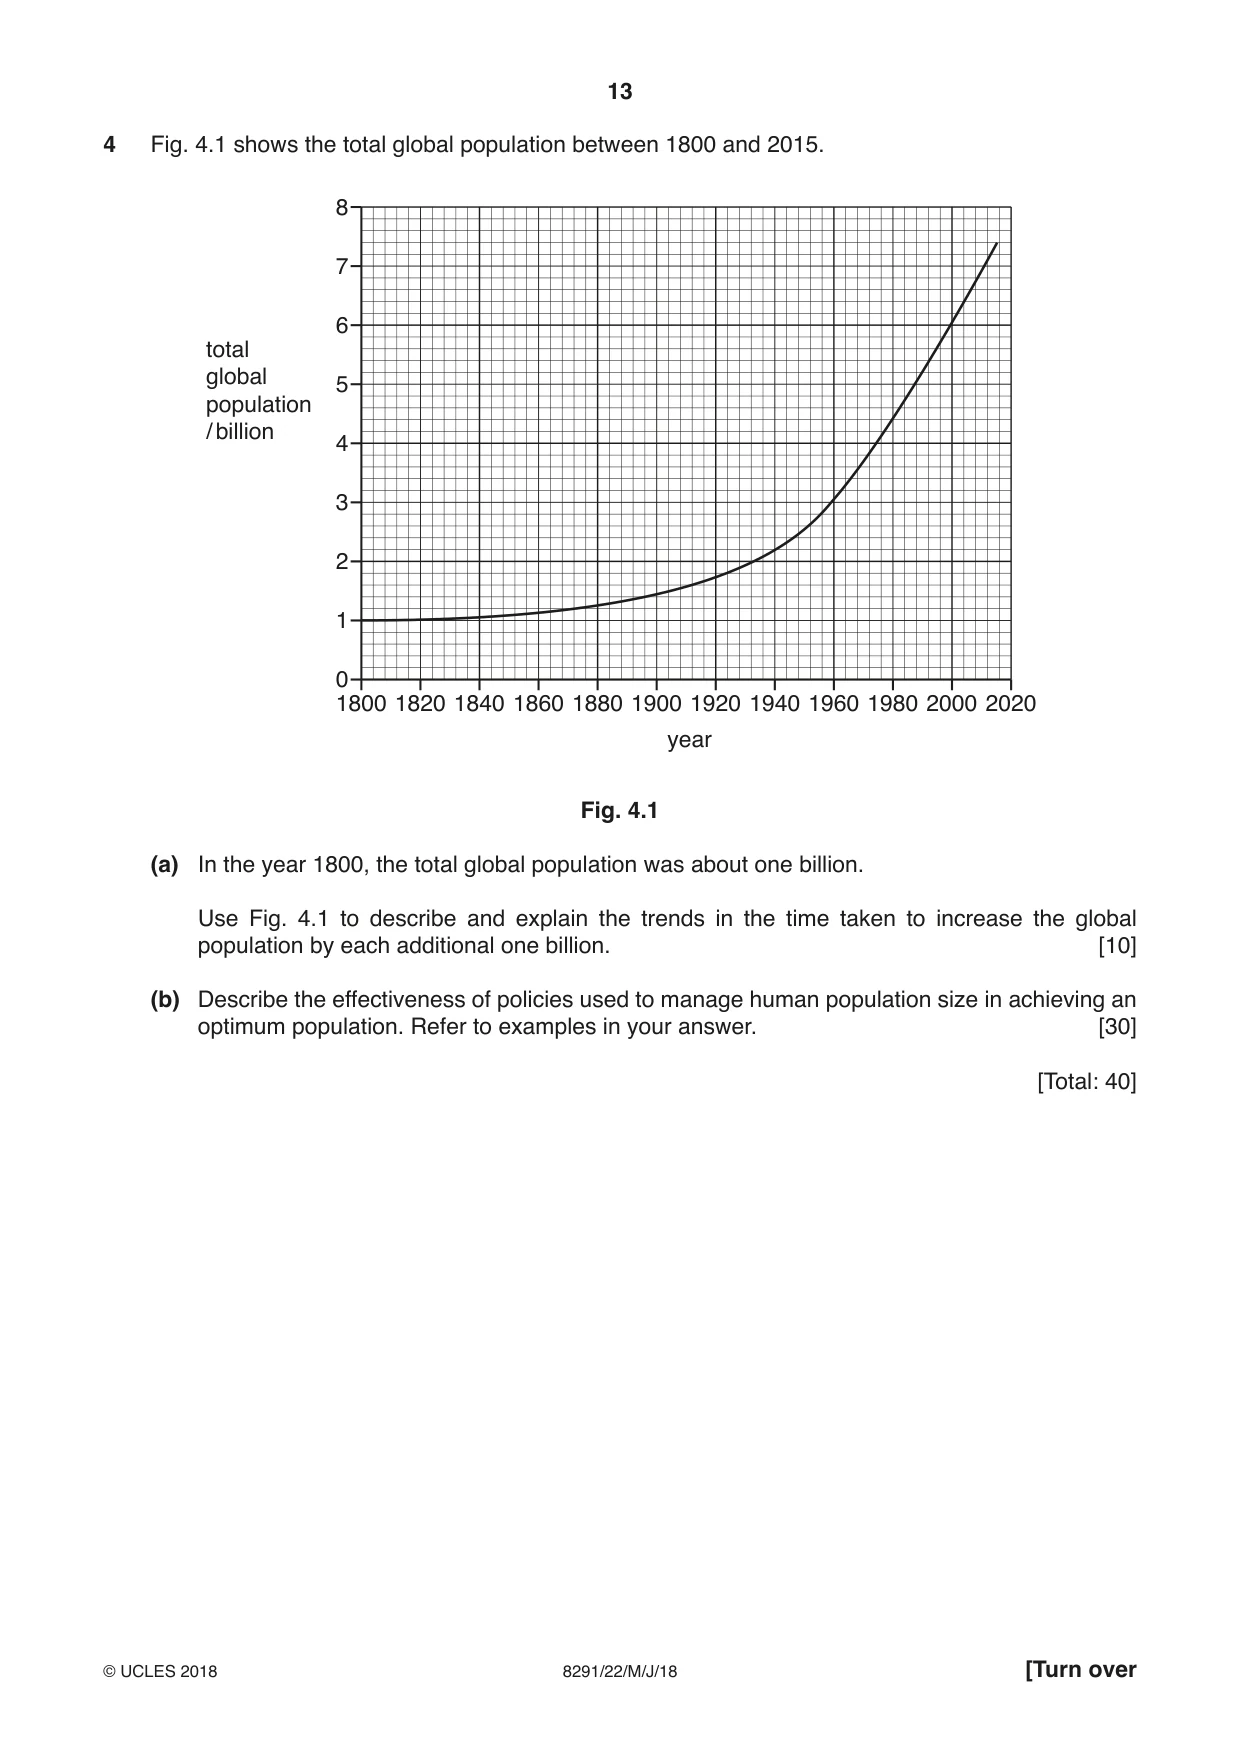
4 Fig. 4.1 shows the total global population between 1800 and 2015. 8 7 6 total global 5 population / billion 4 3 2 1 0 1800 1820 1840 1860 1880 1900 1920 1940 1960 1980 2000 2020 year Fig. 4.1 (a) In the year 1800, the total global population was about one billion. Use Fig. 4.1 to describe and explain the trends in the time taken to increase the global population by each additional one billion. [10] (b) Describe the effectiveness of policies used to manage human population size in achieving an optimum population. Refer to examples in your answer. [30] [Total: 40]
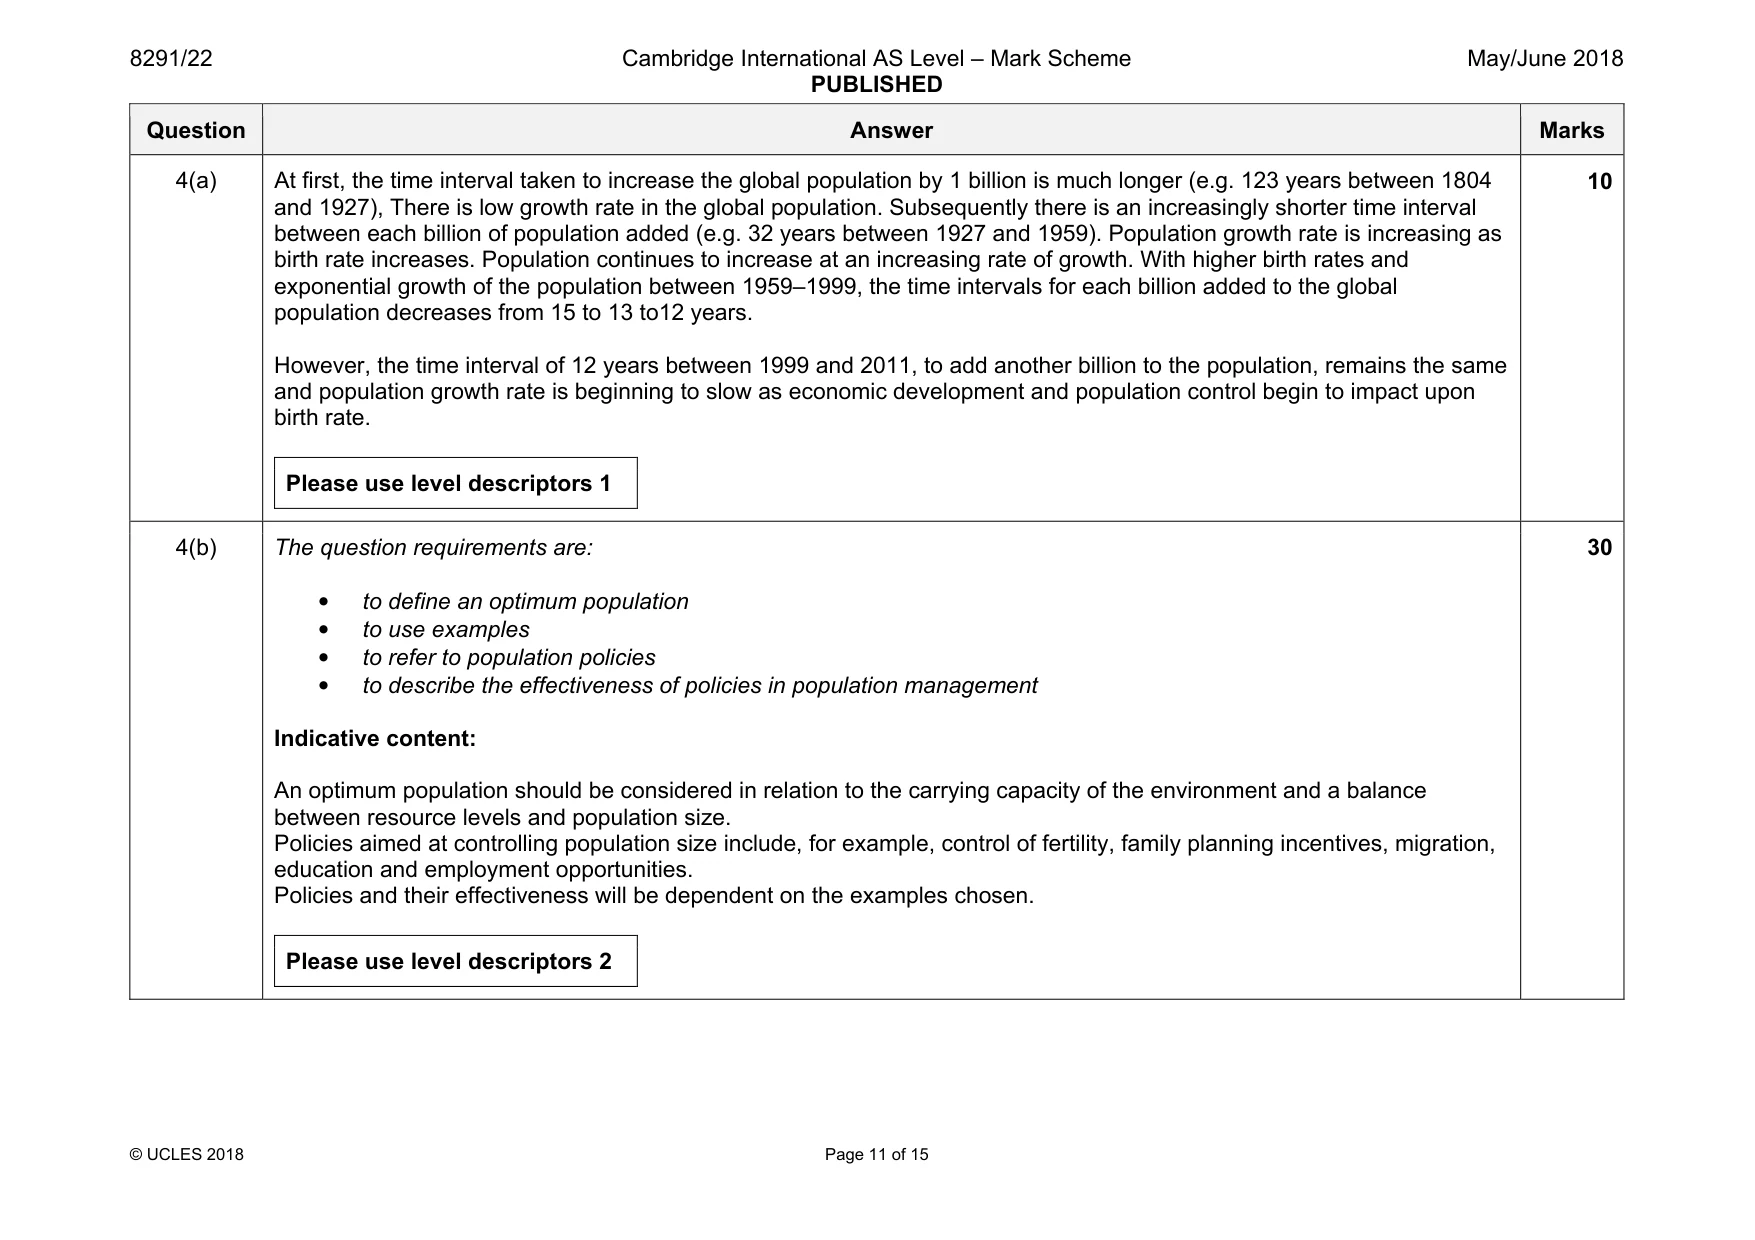
Mark scheme: 4(a) At first, the time interval taken to increase the global population by 1 billion is much longer (e.g. 123 years between 1804 and 1927), There is low growth rate in the global population. Subsequently there is an increasingly shorter time interval between each billion of population added (e.g. 32 years between 1927 and 1959). Population growth rate is increasing as birth rate increases. Population continues to increase at an increasing rate of growth. With higher birth rates and exponential growth of the population between 1959–1999, the time intervals for each billion added to the global population decreases from 15 to 13 to12 years. However, the time interval of 12 years between 1999 and 2011, to add another billion to the population, remains the same and population growth rate is beginning to slow as economic development and population control begin to impact upon birth rate. Please use level descriptors 1 10 4(b) The question requirements are: • to define an optimum population • to use examples • to refer to population policies • to describe the effectiveness of policies in population management Indicative content: An optimum population should be considered in relation to the carrying capacity of the environment and a balance between resource levels and population size. Policies aimed at controlling population size include, for example, control of fertility, family planning incentives, migration, education and employment opportunities. Policies and their effectiveness will be dependent on the examples chosen. Please use level descriptors 2 30
Q5 · A diagram of a cross-section through an island of Tuvalu in the Pacific Ocean
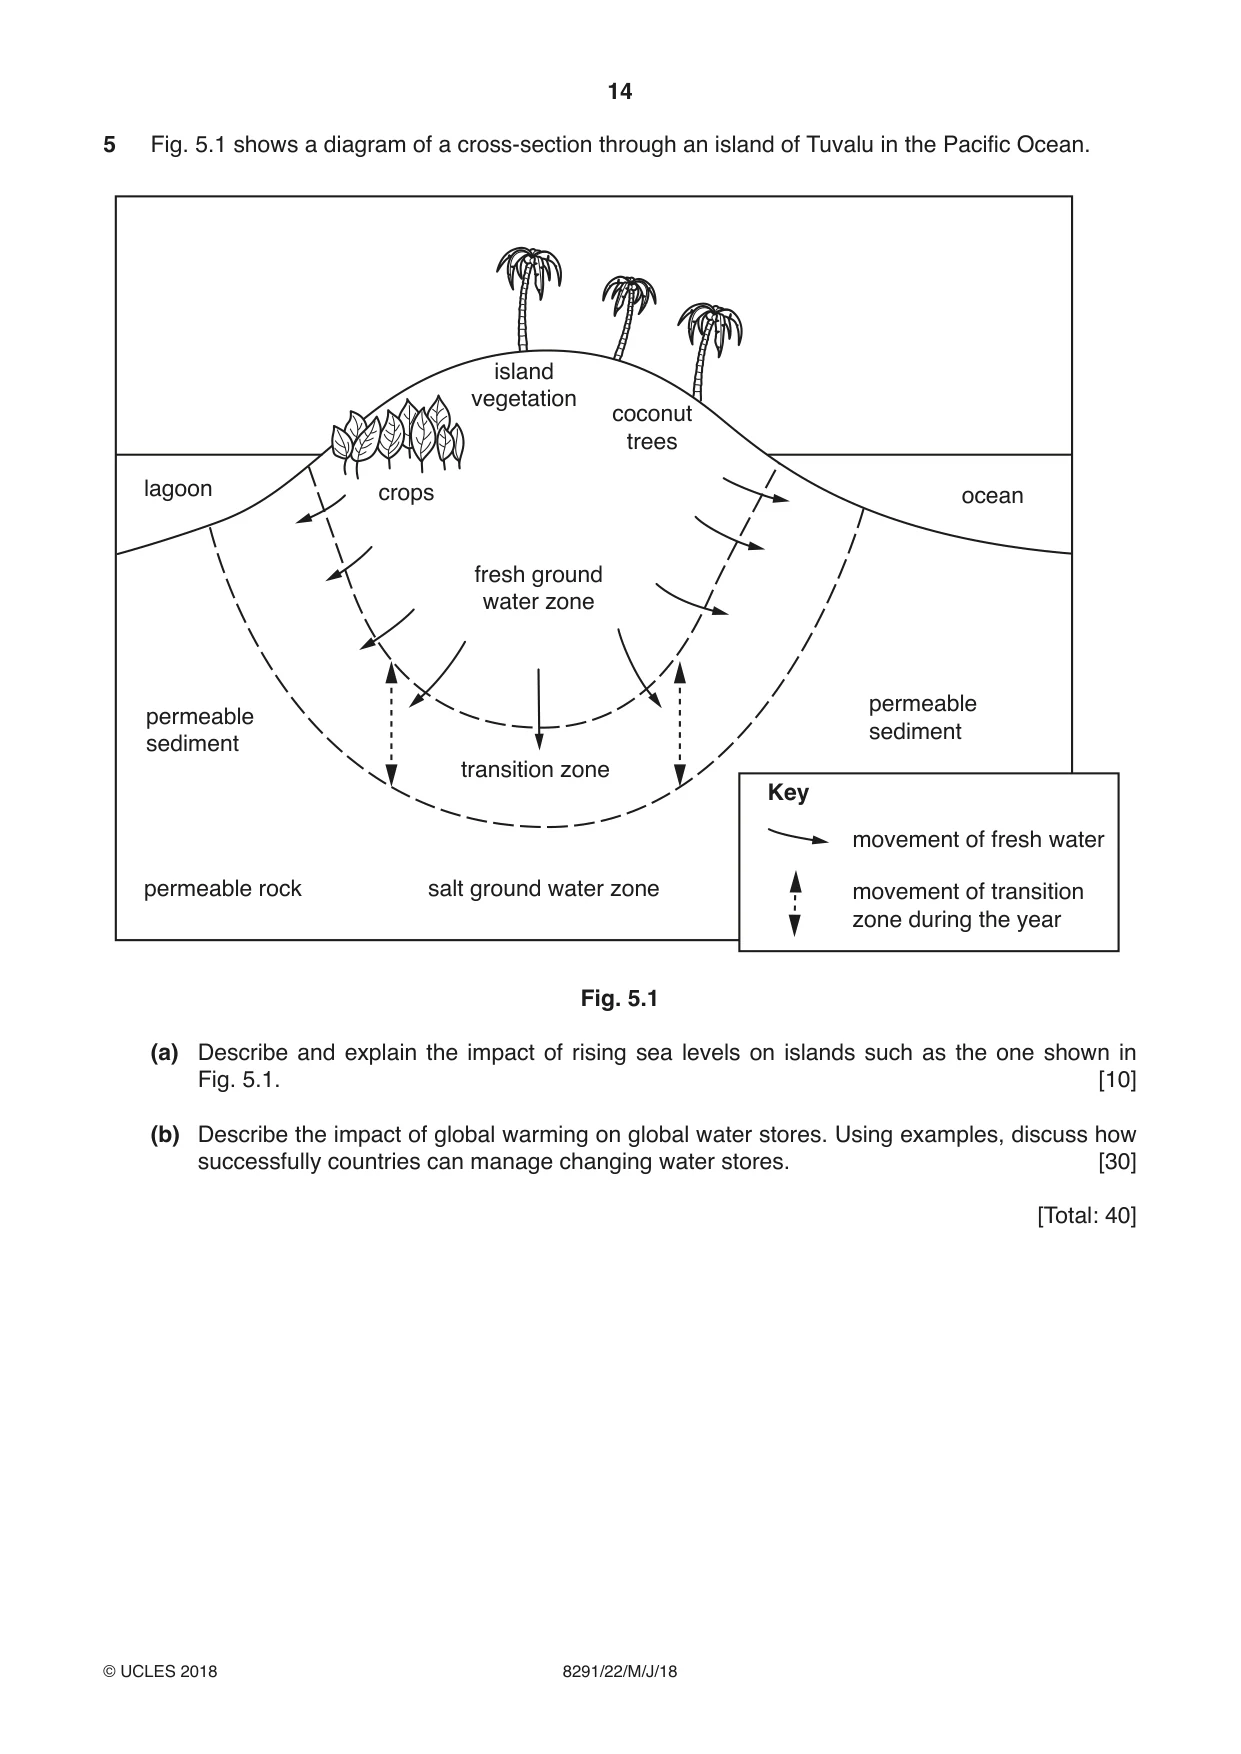
5 Fig. 5.1 shows a diagram of a cross-section through an island of Tuvalu in the Pacific Ocean. island vegetation coconut trees lagoon crops ocean fresh ground water zone permeable permeable sediment sediment transition zone Key movement of fresh water permeable rock salt ground water zone movement of transition zone during the year Fig. 5.1 (a) Describe and explain the impact of rising sea levels on islands such as the one shown in Fig. 5.1. [10] (b) Describe the impact of global warming on global water stores. Using examples, discuss how successfully countries can manage changing water stores. [30] [Total: 40]
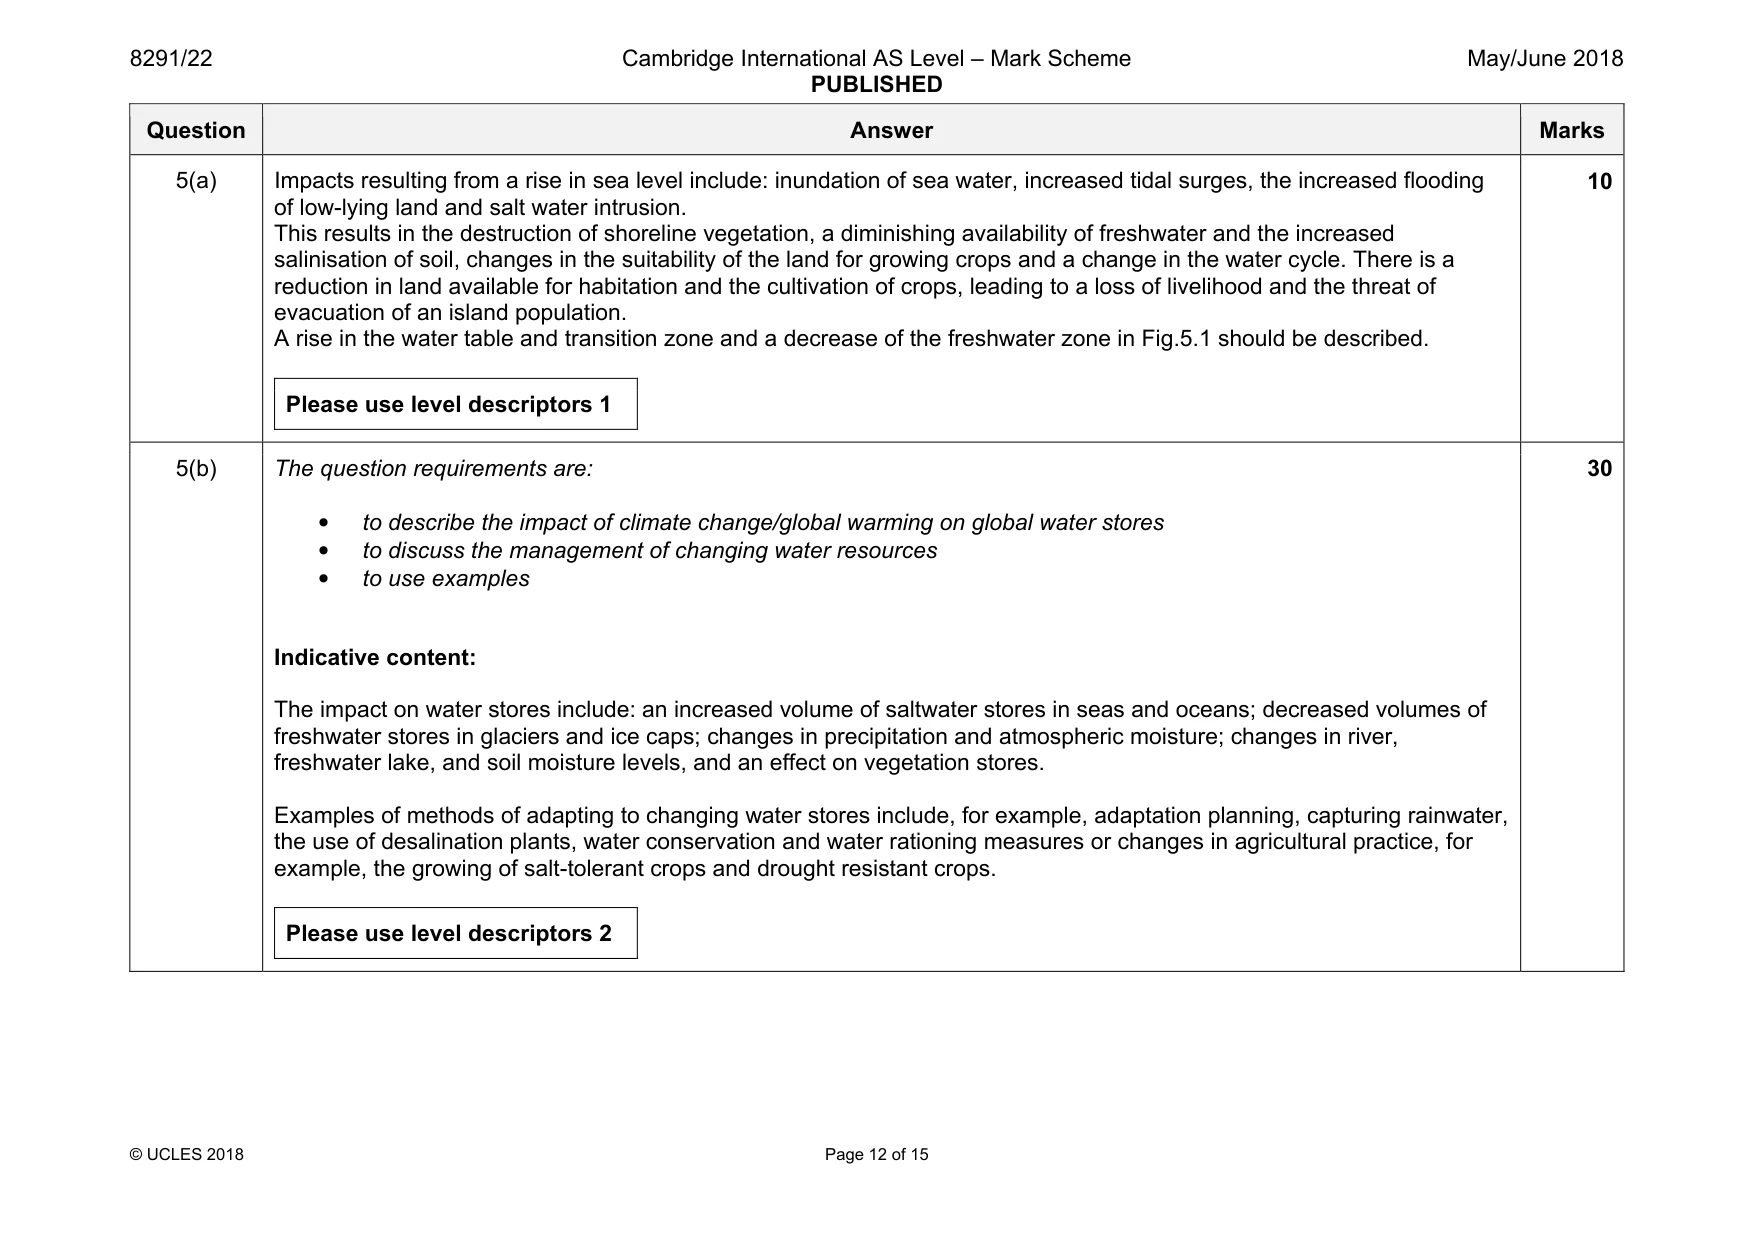
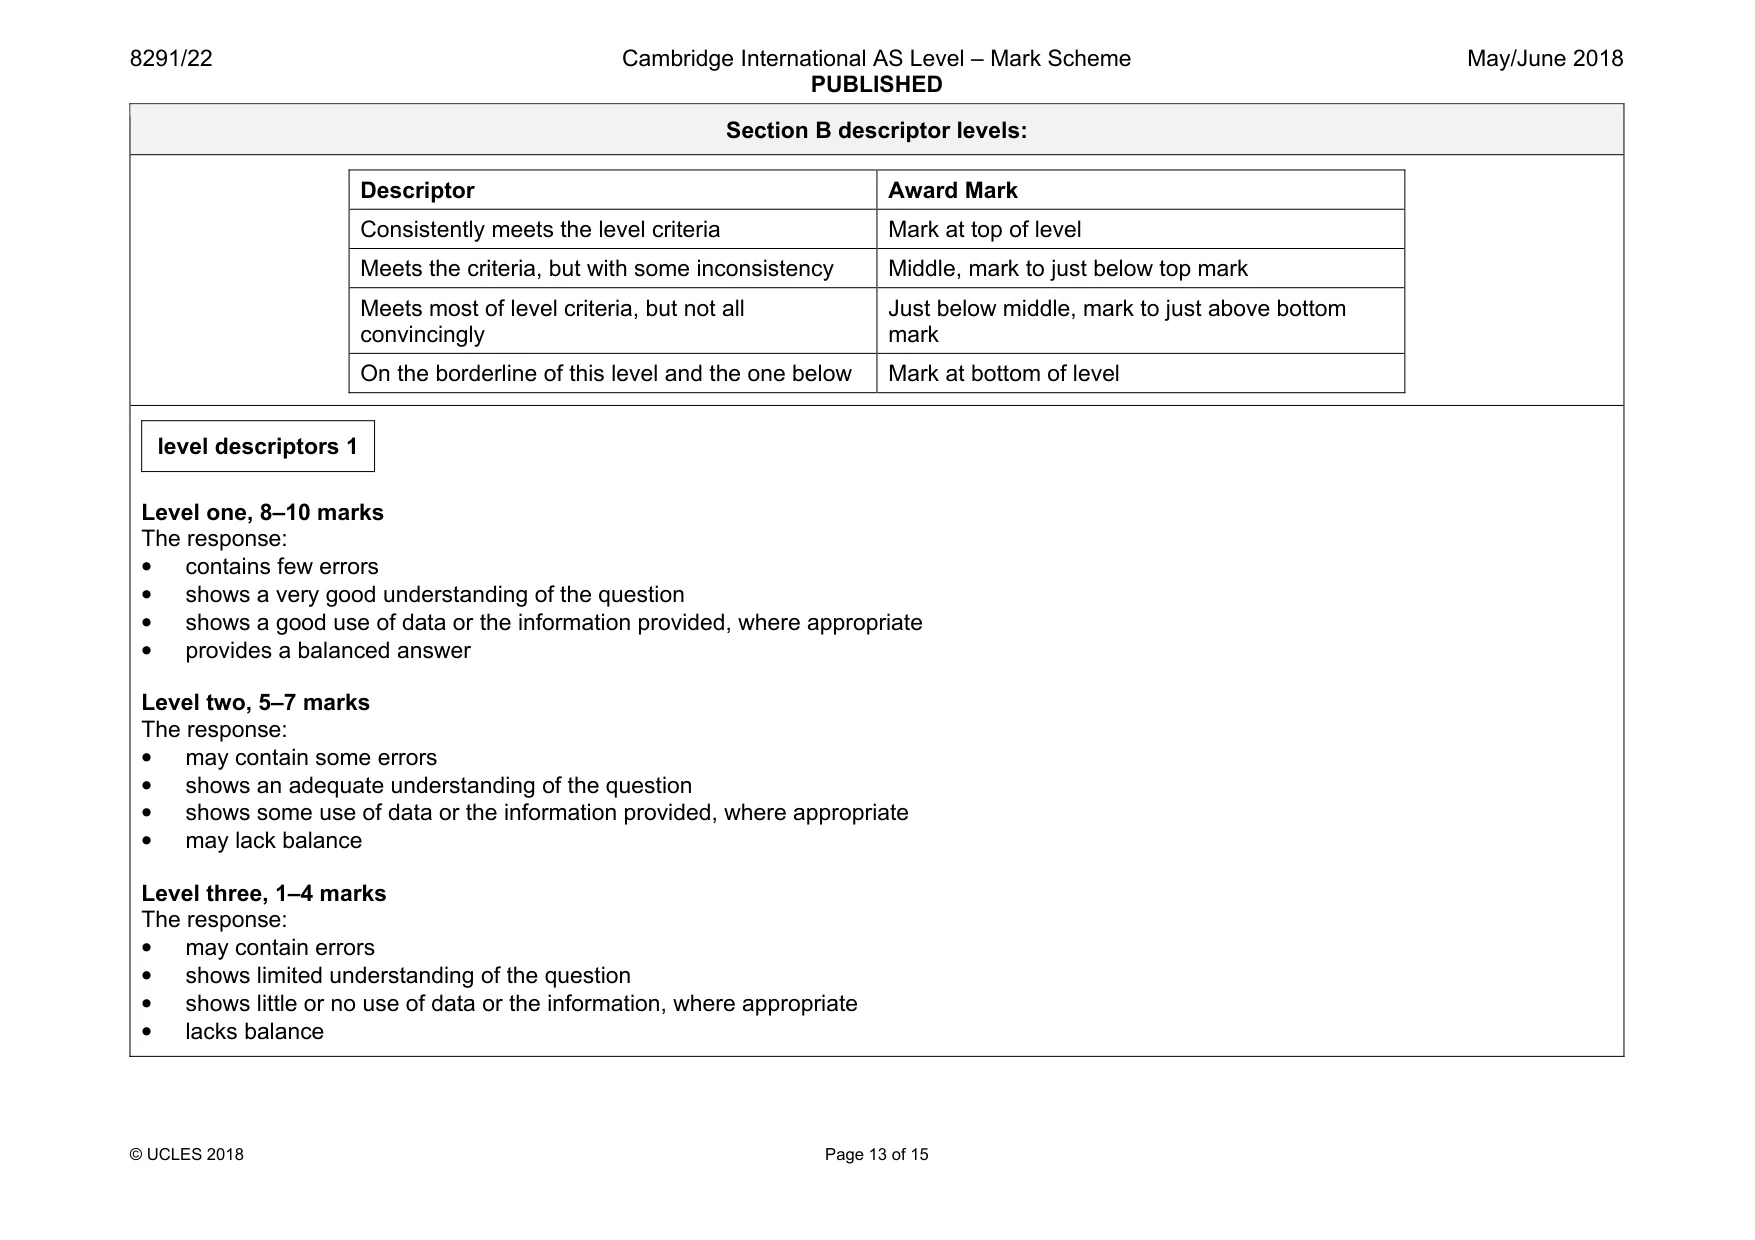
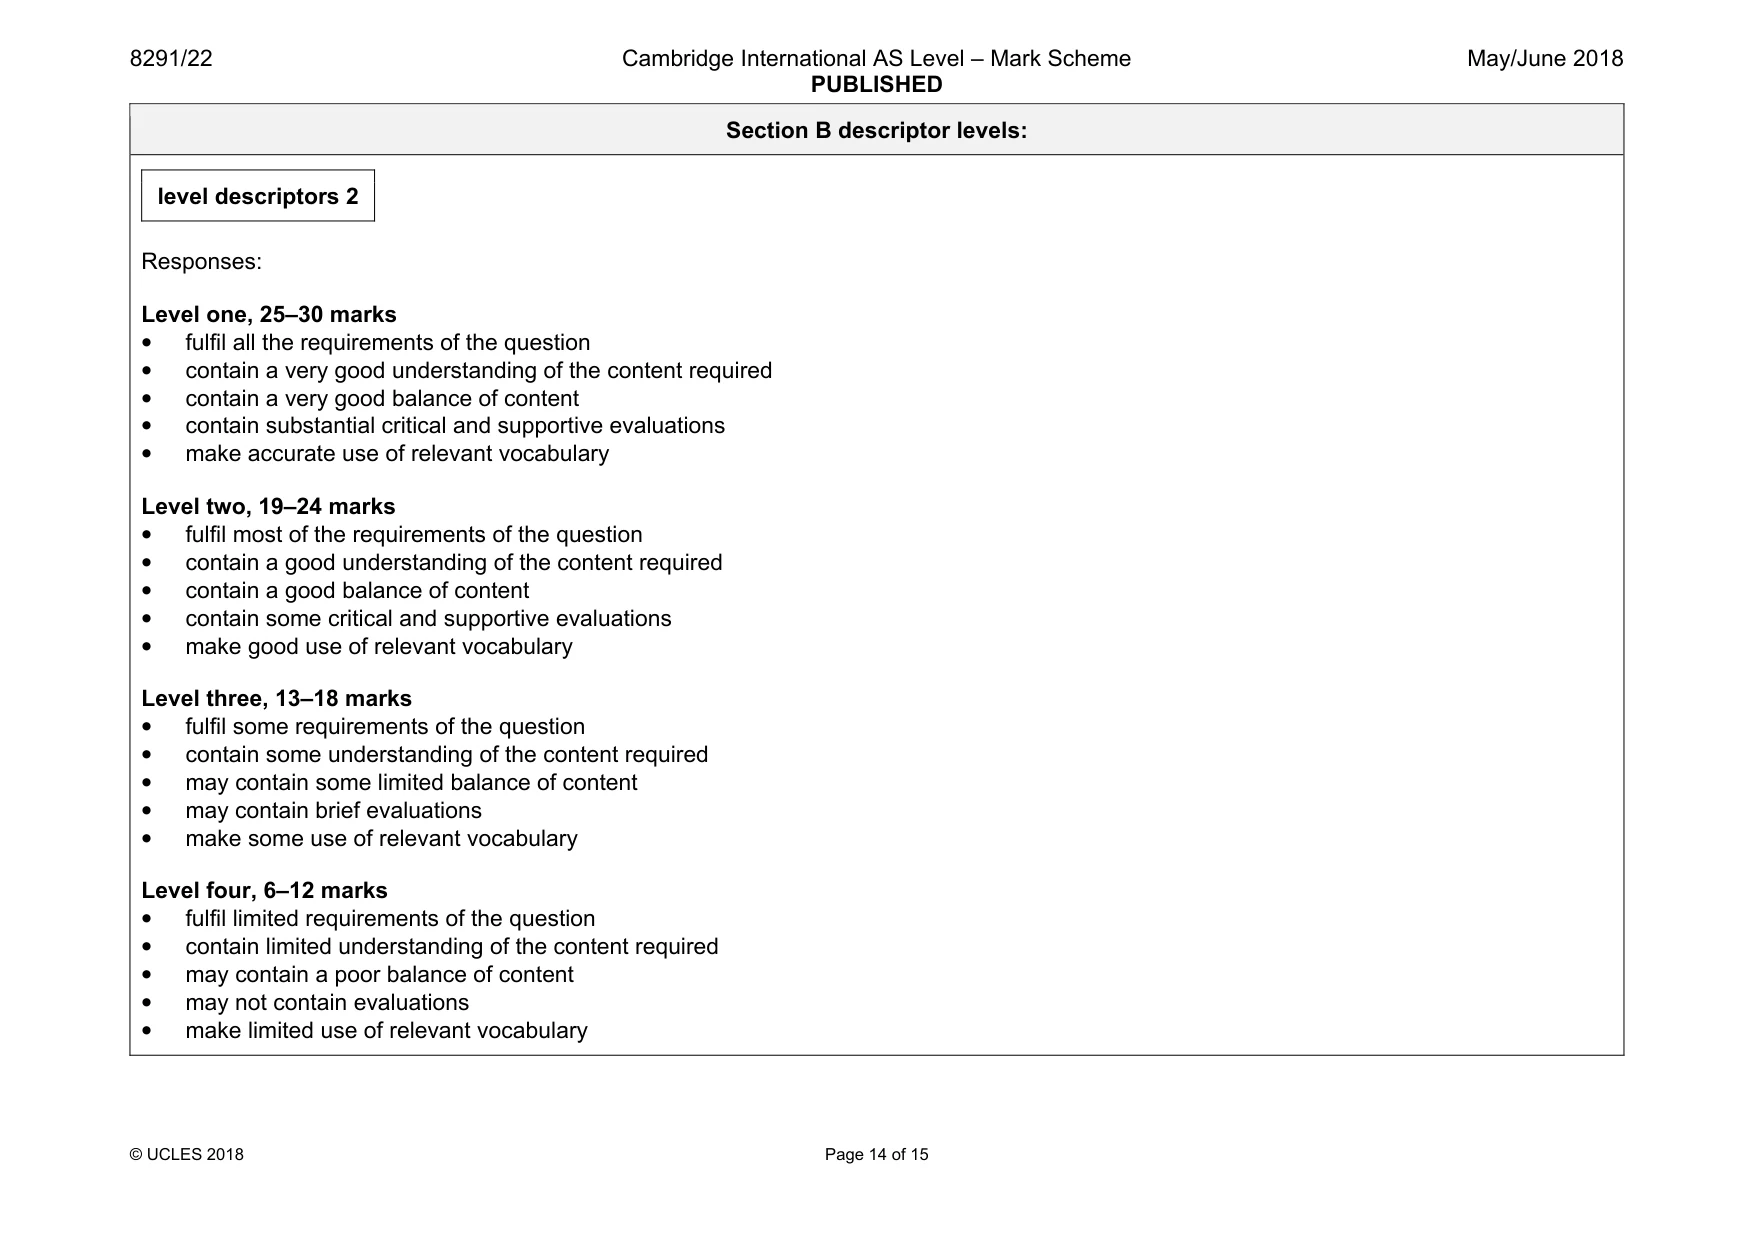
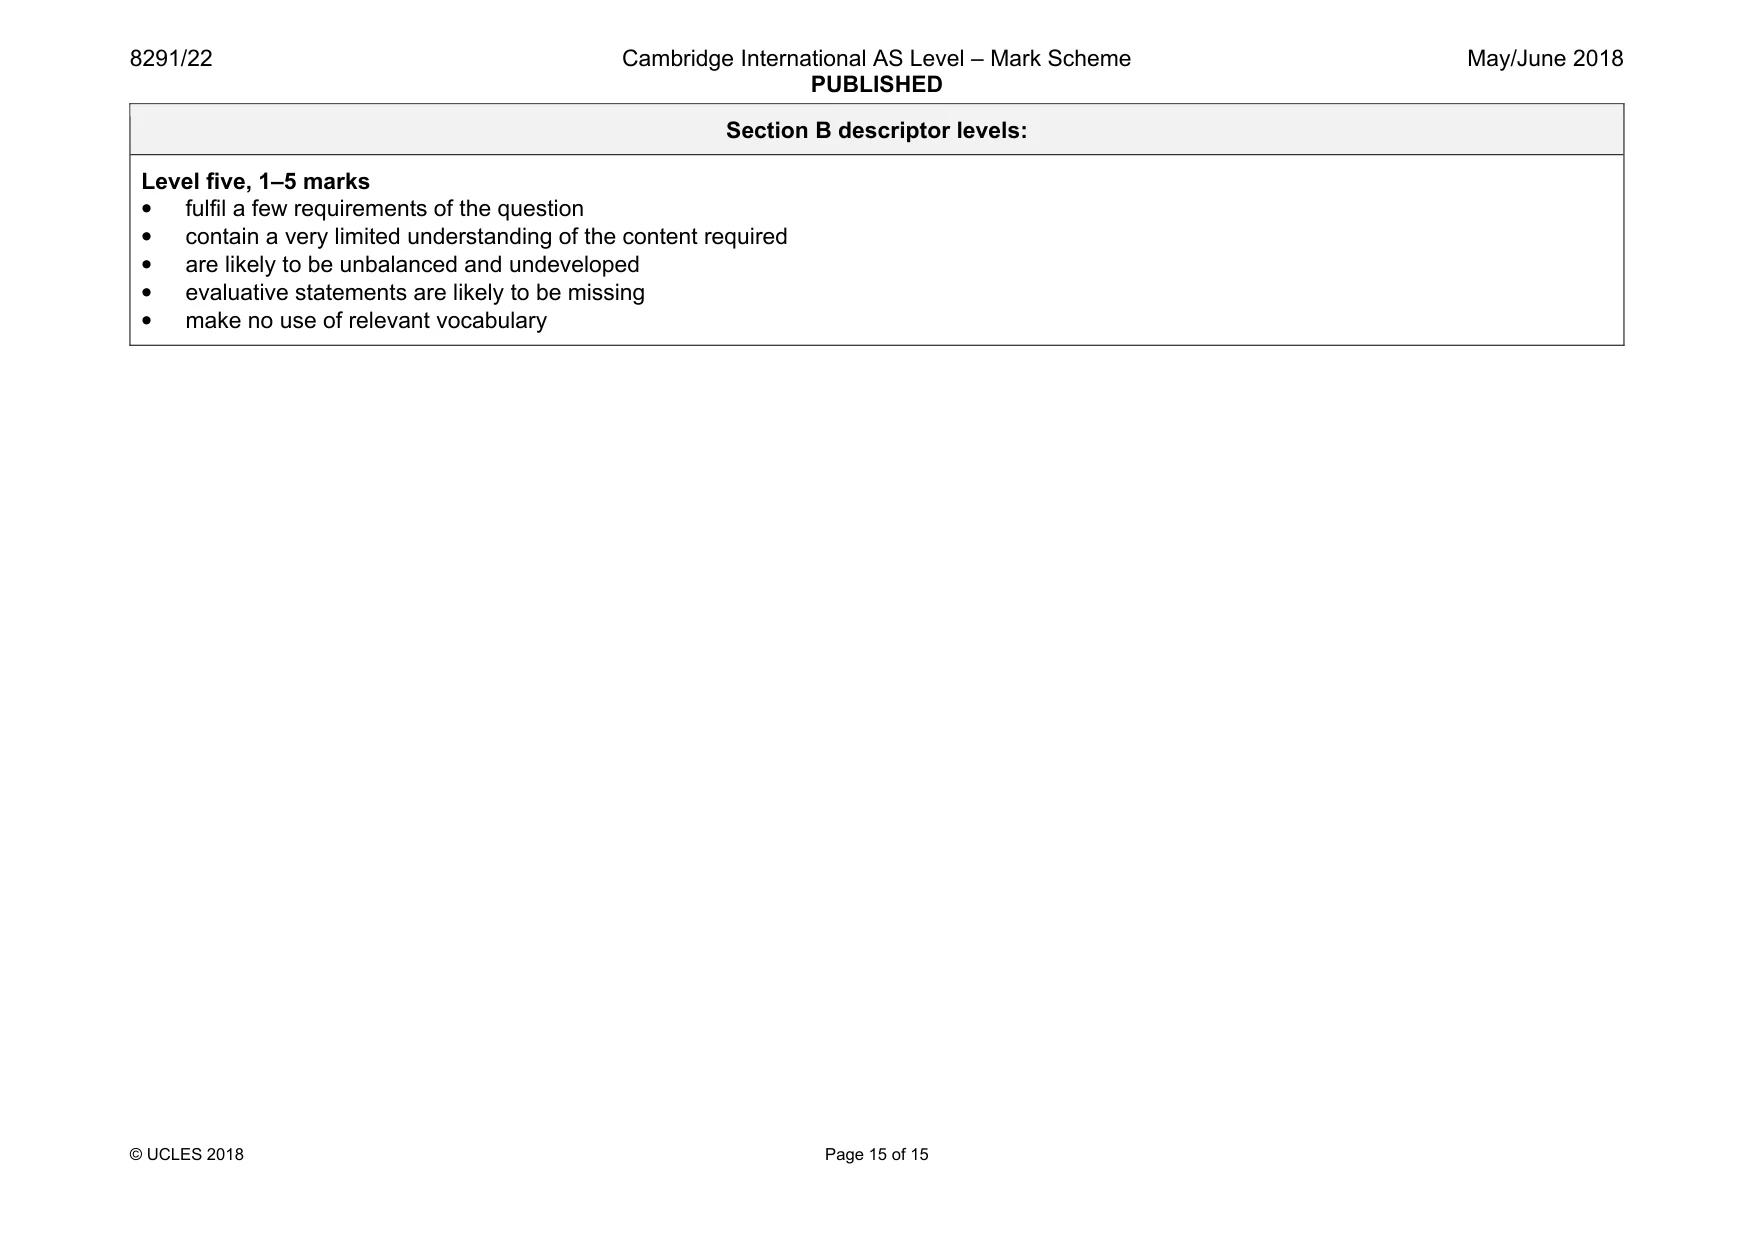
Mark scheme: 5(a) Impacts resulting from a rise in sea level include: inundation of sea water, increased tidal surges, the increased flooding of low-lying land and salt water intrusion. This results in the destruction of shoreline vegetation, a diminishing availability of freshwater and the increased salinisation of soil, changes in the suitability of the land for growing crops and a change in the water cycle. There is a reduction in land available for habitation and the cultivation of crops, leading to a loss of livelihood and the threat of evacuation of an island population. A rise in the water table and transition zone and a decrease of the freshwater zone in Fig.5.1 should be described. Please use level descriptors 1 10 5(b) The question requirements are: • to describe the impact of climate change/global warming on global water stores • to discuss the management of changing water resources • to use examples Indicative content: The impact on water stores include: an increased volume of saltwater stores in seas and oceans; decreased volumes of freshwater stores in glaciers and ice caps; changes in precipitation and atmospheric moisture; changes in river, freshwater lake, and soil moisture levels, and an effect on vegetation stores. Examples of methods of adapting to changing water stores include, for example, adaptation planning, capturing rainwater, the use of desalination plants, water conservation and water rationing measures or changes in agricultural practice, for example, the growing of salt-tolerant crops and drought resistant crops. Please use level descriptors 2 30 Section B descriptor levels: Descriptor Award Mark Consistently meets the level criteria Mark at top of level Meets the criteria, but with some inconsistency Middle, mark to just below top mark Meets most of level criteria, but not all convincingly Just below middle, mark to just above bottom mark On the borderline of this level and the one below Mark at bottom of level level descriptors 1 Level one, 8–10 marks The response: • contains few errors • shows a very good understanding of the question • shows a good use of data or the information provided, where appropriate • provides a balanced answer Level two, 5–7 marks The response: • may contain some errors • shows an adequate understanding of the question • shows some use of data or the information provided, where appropriate • may lack balance Level three, 1–4 marks The response: • may contain errors • shows limited understanding of the question • shows little or no use of data or the information, where appropriate • lacks balance Section B descriptor levels: level descriptors 2 Responses: Level one, 25–30 marks • fulfil all the requirements of the question • contain a very good understanding of the content required • contain a very good balance of content • contain substantial critical and supportive evaluations • make accurate use of relevant vocabulary Level two, 19–24 marks • fulfil most of the requirements of the question • contain a good understanding of the content required • contain a good balance of content • contain some critical and supportive evaluations • make good use of relevant vocabulary Level three, 13–18 marks • fulfil some requirements of the question • contain some understanding of the content required • may contain some limited balance of content • may contain brief evaluations • make some use of relevant vocabulary Level four, 6–12 marks • fulfil limited requirements of the question • contain limited understanding of the content required • may contain a poor balance of content • may not contain evaluations • make limited use of relevant vocabulary Section B descriptor levels: Level five, 1–5 marks • fulfil a few requirements of the question • contain a very limited understanding of the content required • are likely to be unbalanced and undeveloped • evaluative statements are likely to be missing • make no use of relevant vocabulary
What was in this paper
The subtopics covered by these 5 questions, and how many questions each got. Open one in a new tab to see every Cambridge question on it.
What you needed in this session
Cambridge’s own grade thresholds for 2018 May/June, Paper 2 · Variant 2. A higher threshold means an easier paper — the bar moves with how the cohort did.