Cambridge A Level Environmental Management (AS only) 8291 — 2014 May/June Paper 2 · Variant 2
8291/22/M/J/14 · 80 marks · ≈90 min
The question paper and its mark scheme, free to read here and free to download. This is Cambridge’s own paper, exactly as it was sat.
Question paper12 pages
Mark scheme10 pages
Answers below. Sit the paper first if you are practising.
Paper as text
Question paper, page 1
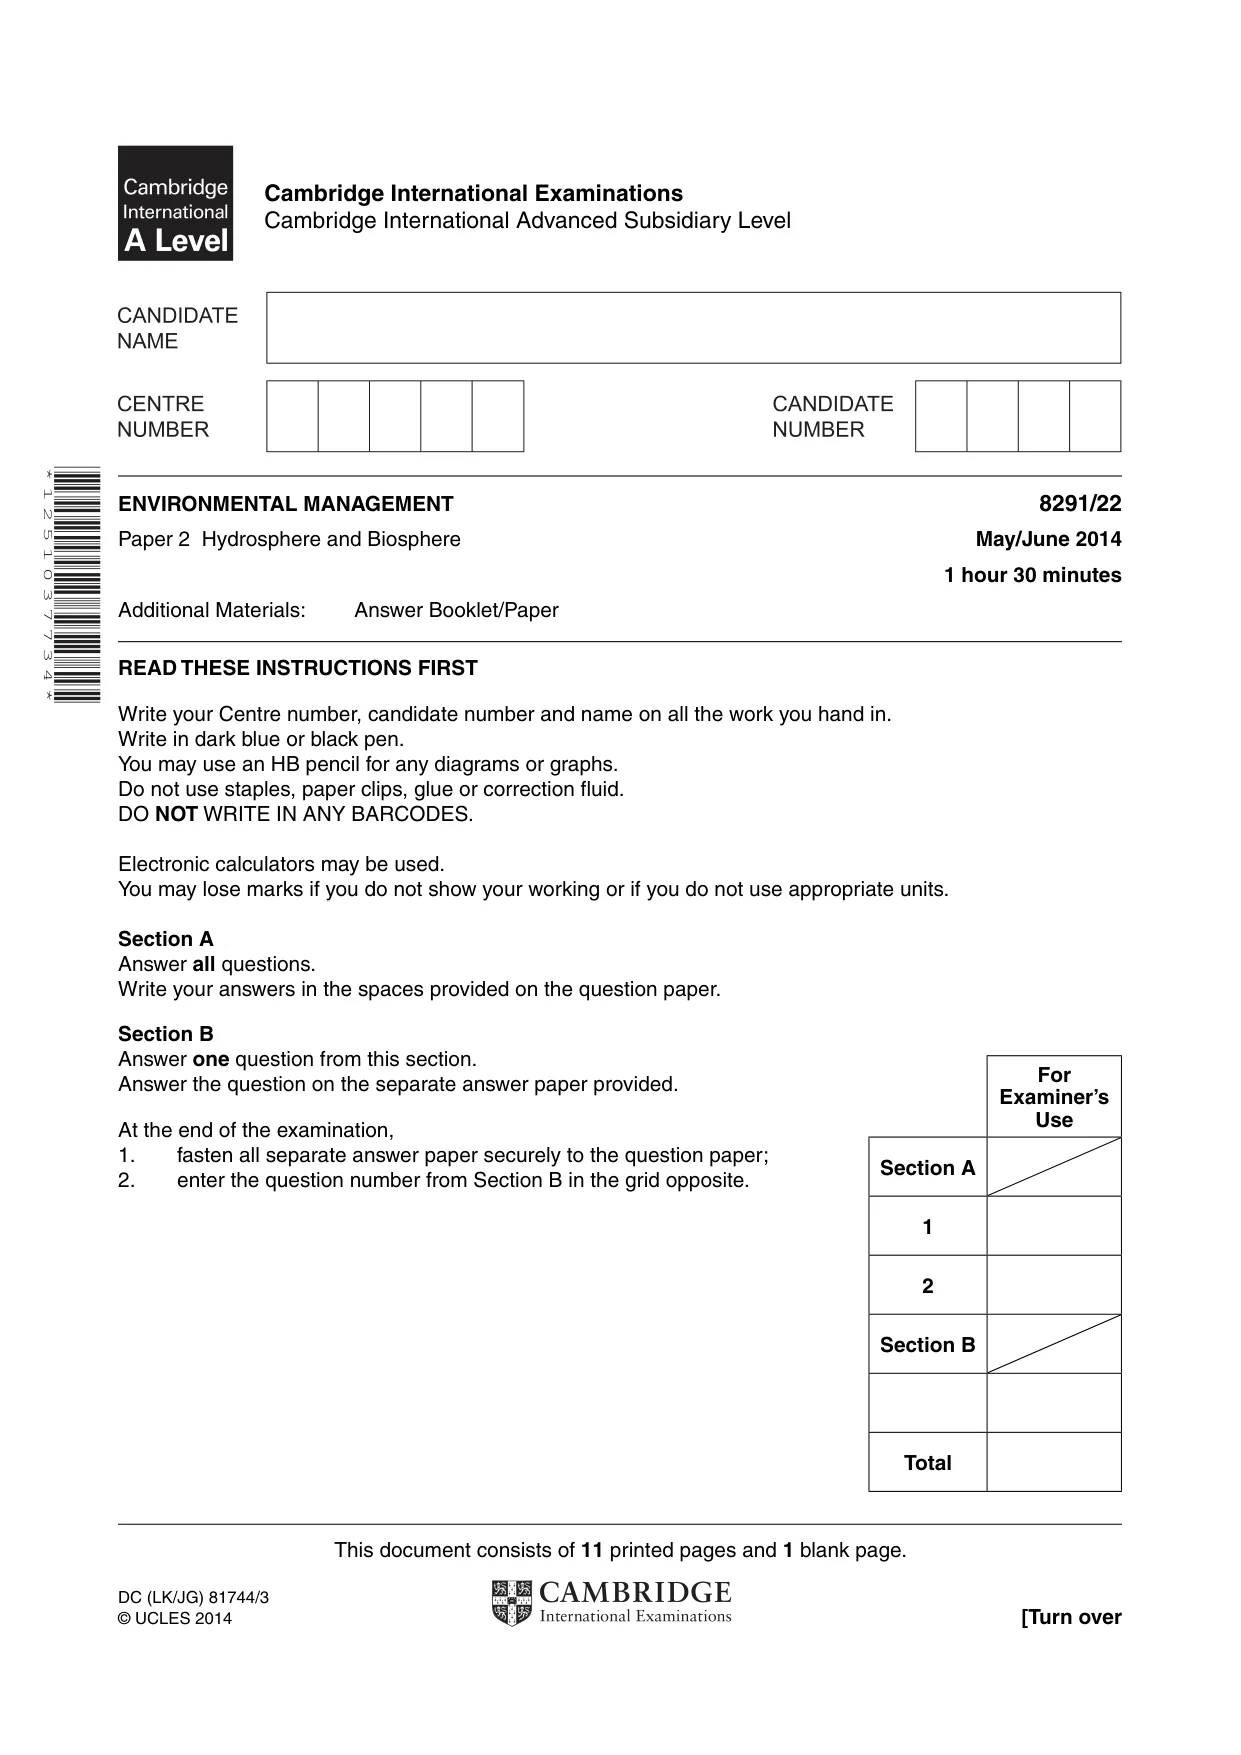
This document consists of 11 printed pages and 1 blank page. DC (LK/JG) 81744/3 © UCLES 2014 [Turn over Cambridge International Examinations Cambridge International Advanced Subsidiary Level * 1 2 5 1 0 3 7 7 3 4 * ENVIRONMENTAL MANAGEMENT 8291/22 Paper 2 Hydrosphere and Biosphere May/June 2014 1 hour 30 minutes Additional Materials: Answer Booklet/Paper READ THESE INSTRUCTIONS FIRST Write your Centre number, candidate number and name on all the work you hand in. Write in dark blue or black pen. You may use an HB pencil for any diagrams or graphs. Do not use staples, paper clips, glue or correction fluid. DO NOT WRITE IN ANY BARCODES. Electronic calculators may be used. You may lose marks if you do not show your working or if you do not use appropriate units. Section A Answer all questions. Write your answers in the spaces provided on the question paper. Section B Answer one question from this section. Answer the question on the separate answer paper provided. At the end of the examination, 1. fasten all separate answer paper securely to the question paper; 2. enter the question number from Section B in the grid opposite. For Examiner’s Use Section A 1 2 Section B Total
Question paper, page 2
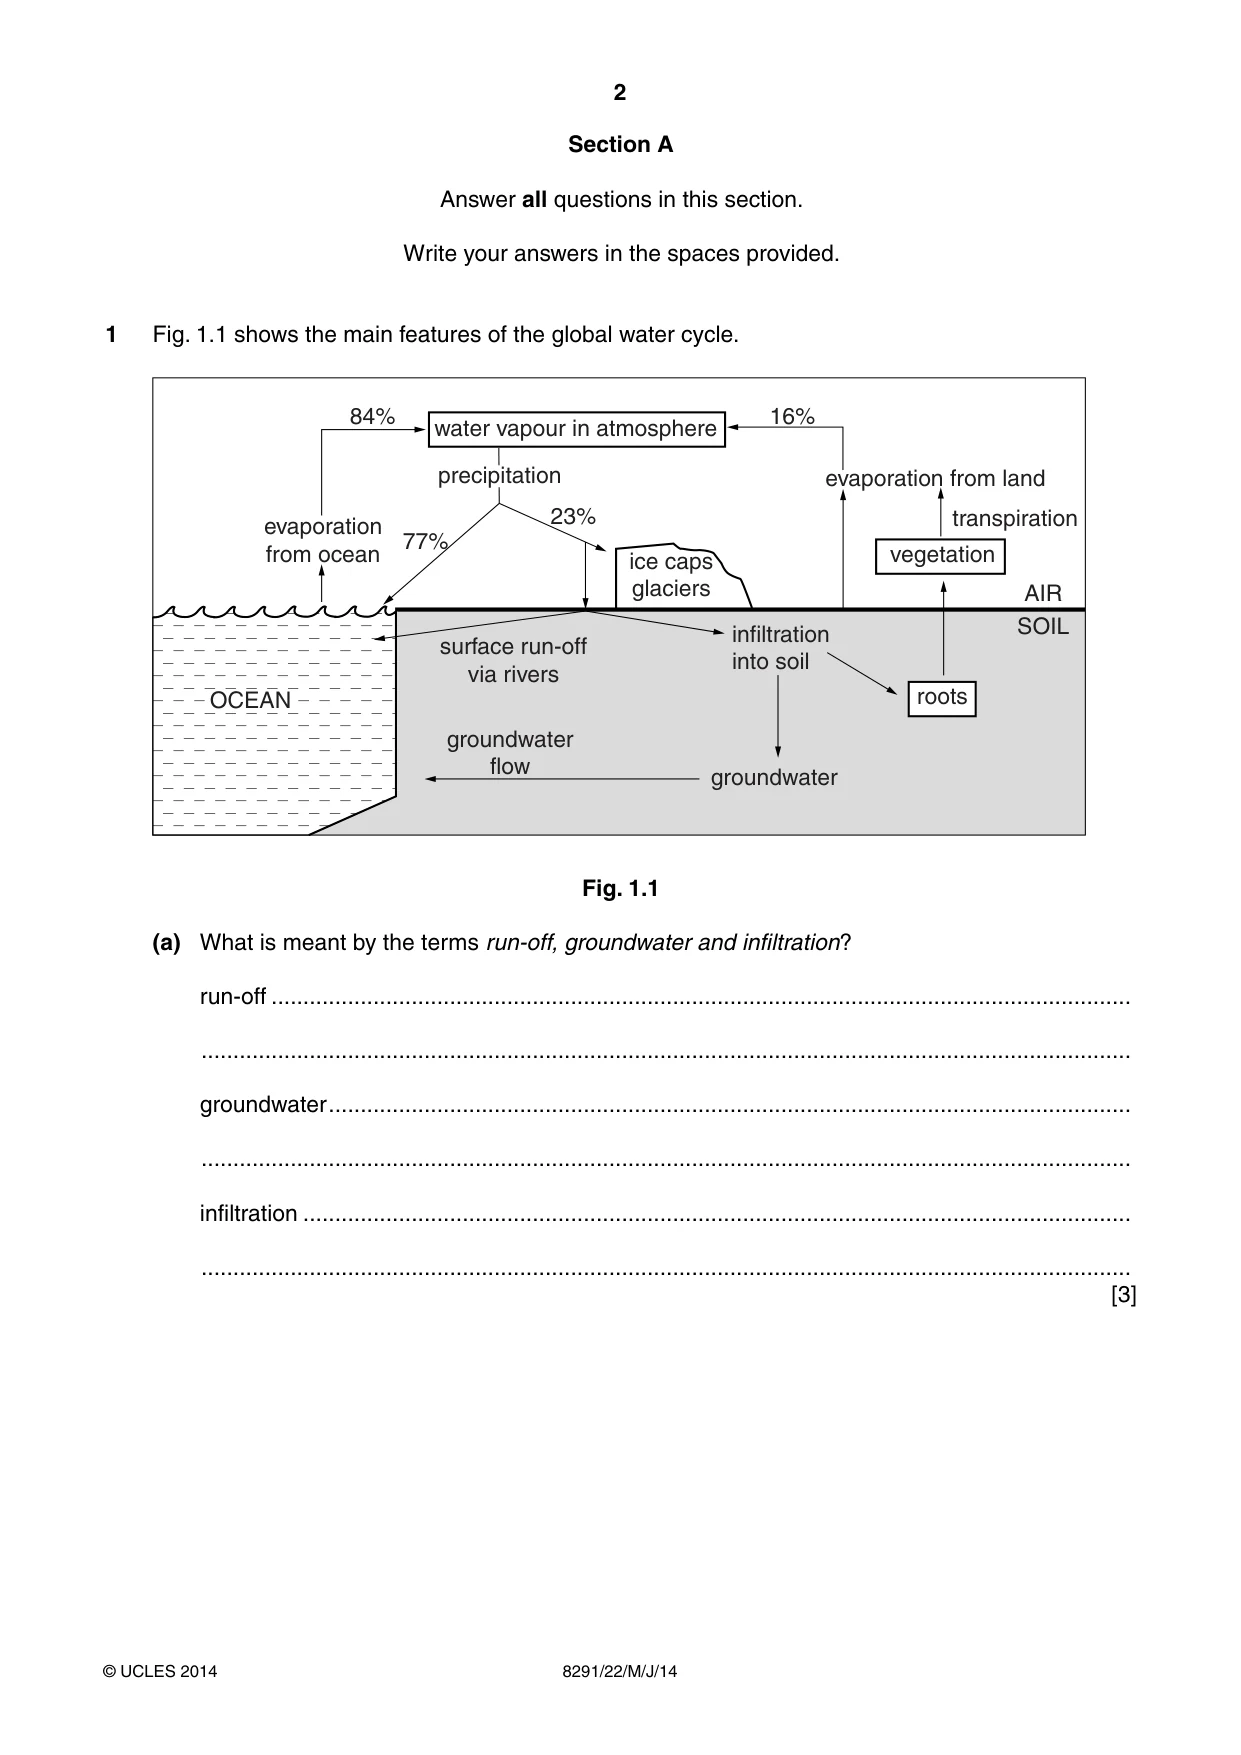
2 8291/22/M/J/14 © UCLES 2014 Section A Answer all questions in this section. Write your answers in the spaces provided. 1 Fig. 1.1 shows the main features of the global water cycle. water vapour in atmosphere infiltration into soil groundwater groundwater flow vegetation transpiration evaporation from land OCEAN surface run-off via rivers ice caps glaciers evaporation from ocean 84% 16% 77% 23% AIR SOIL roots precipitation Fig. 1.1 (a ) What is meant by the terms run-off, groundwater and infiltration? run-off … … groundwater … … infiltration … … [3]
Question paper, page 3
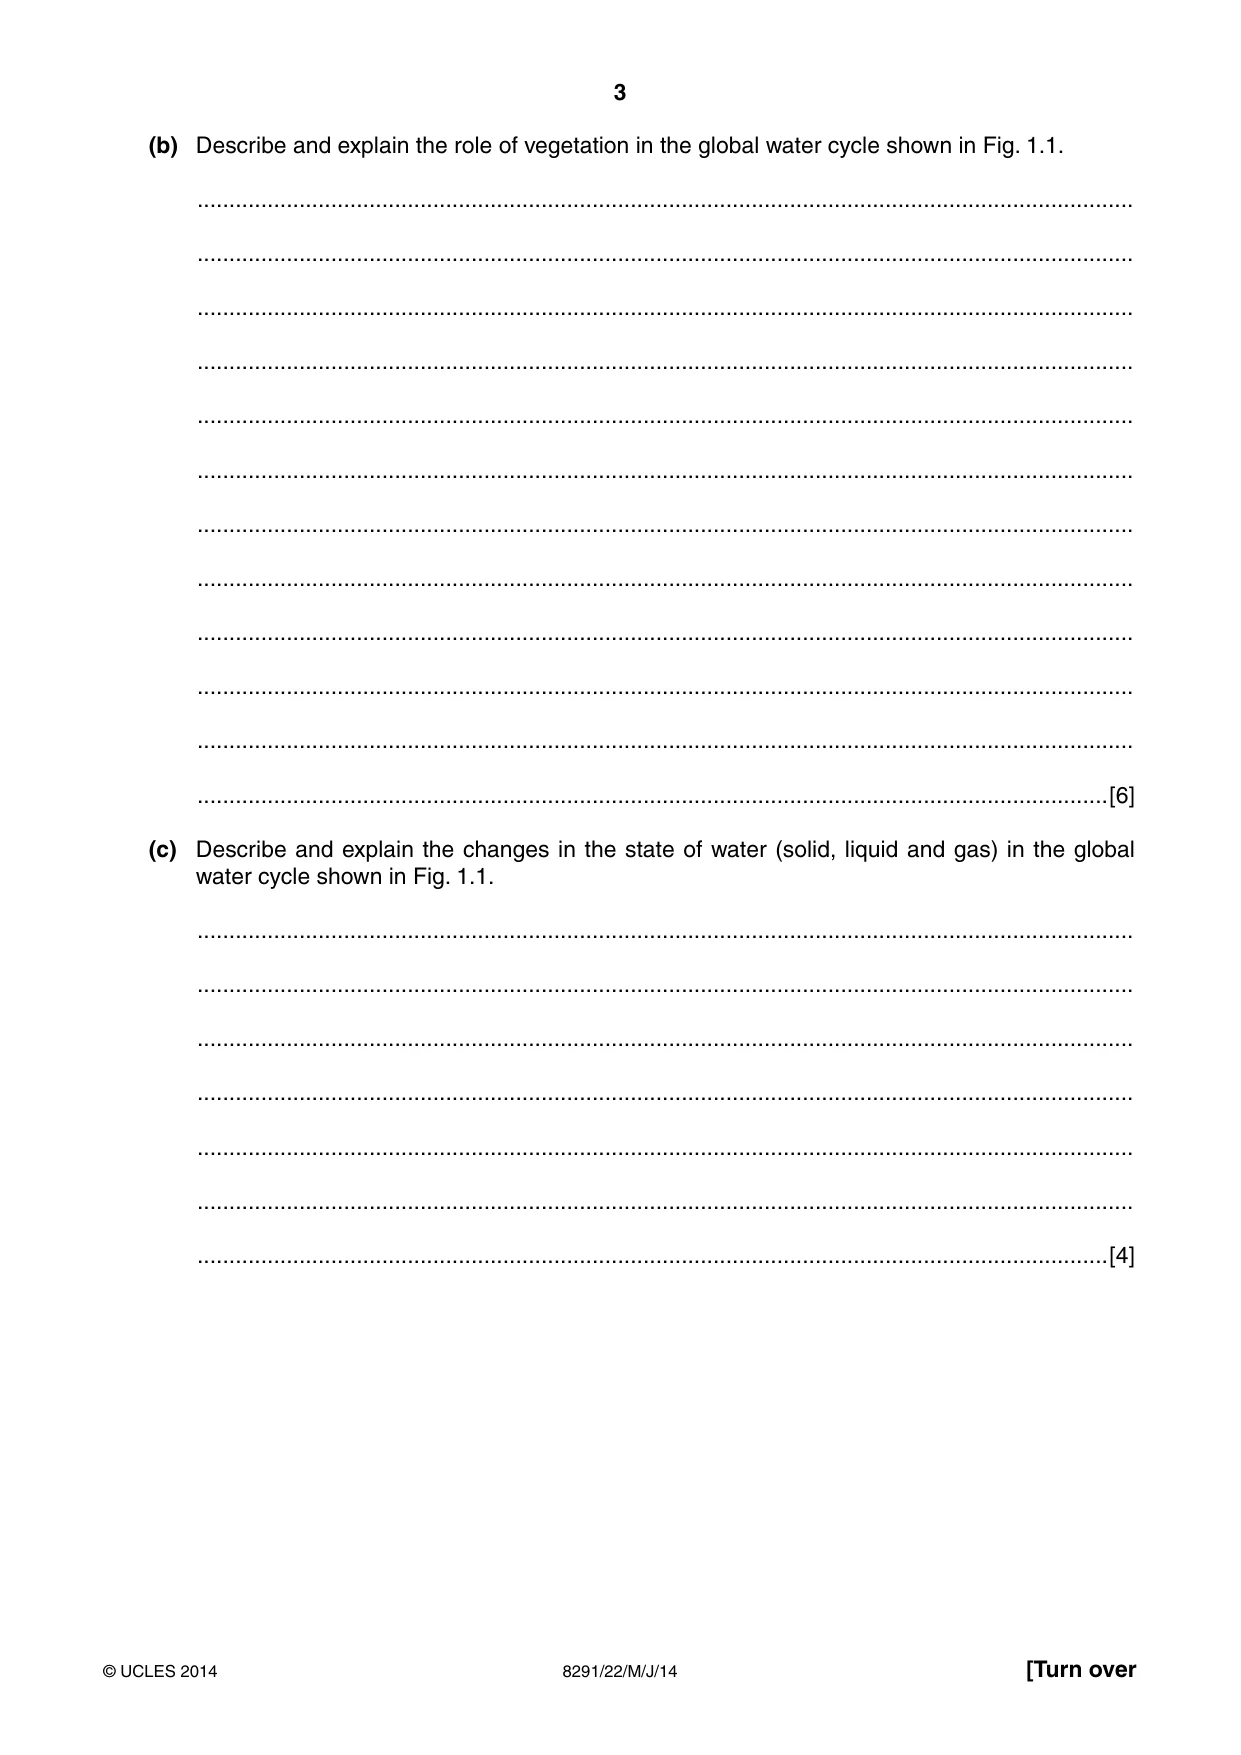
3 8291/22/M/J/14 © UCLES 2014 [Turn over (b) Describe and explain the role of vegetation in the global water cycle shown in Fig. 1.1. … … … … … … … … … … … …[6] (c) Describe and explain the changes in the state of water (solid, liquid and gas) in the global water cycle shown in Fig. 1.1. … … … … … … …[4]
Question paper, page 4
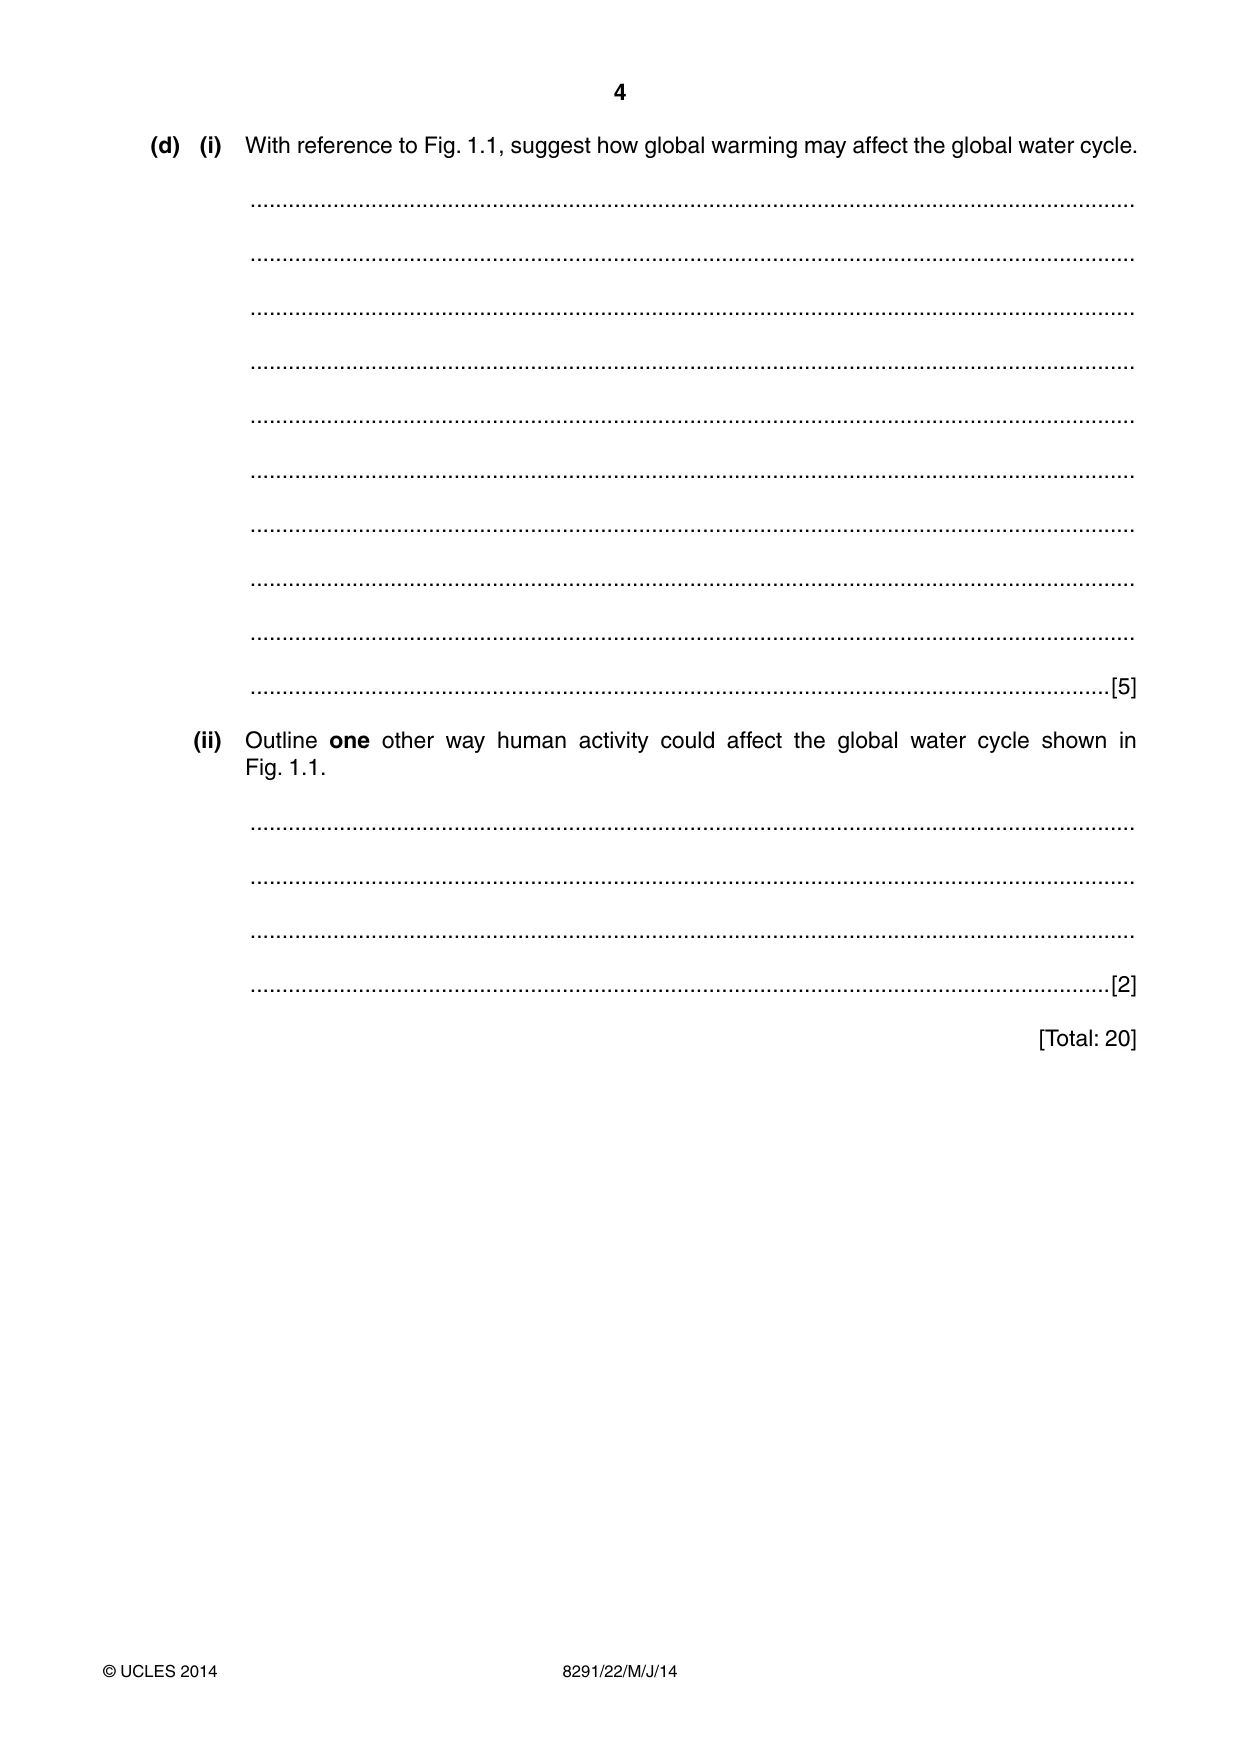
4 8291/22/M/J/14 © UCLES 2014 (d) (i) With reference to Fig. 1.1, suggest how global warming may affect the global water cycle. … … … … … … … … … …[5] (ii) Outline one other way human activity could affect the global water cycle shown in Fig. 1.1. … … … …[2] [Total: 20]
Question paper, page 5
5 8291/22/M/J/14 © UCLES 2014 [Turn over 2 (a) Tropical rainforests are among the most productive ecosystems in the world. They frequently occur on nutrient poor soils. Explain why these ecosystems are so productive, despite rainforest soils being nutrient poor. … … … … … … … … … …[5]
Question paper, page 6
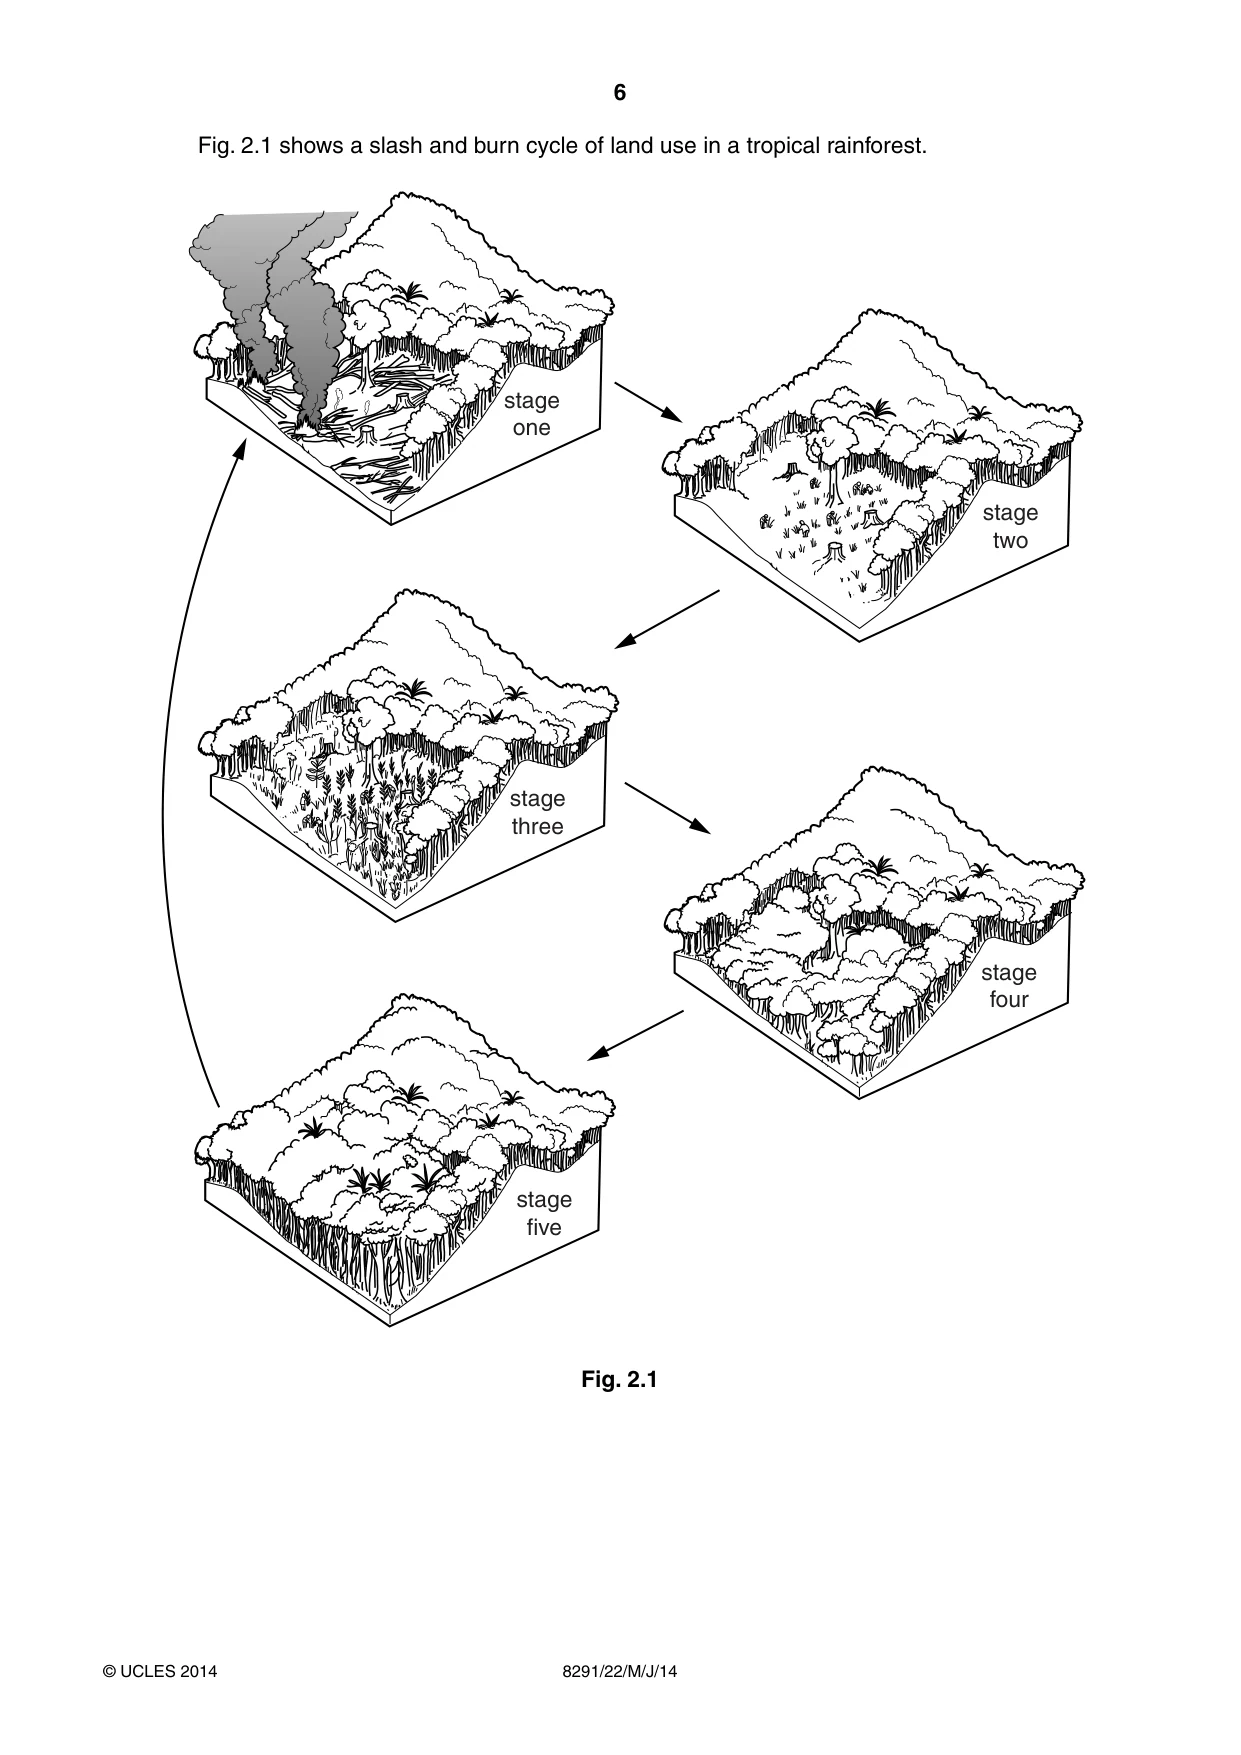
6 8291/22/M/J/14 © UCLES 2014 Fig. 2.1 shows a slash and burn cycle of land use in a tropical rainforest. stage one stage two stage three stage four stage five Fig. 2.1
Question paper, page 7
7 8291/22/M/J/14 © UCLES 2014 [Turn over (b) Briefly describe the slash and burn cycle of land use shown in Fig. 2.1. … … … … … … … … … …[5]
Question paper, page 8
8 8291/22/M/J/14 © UCLES 2014 (c) Explain why this type of land use becomes less sustainable if human population increases in size and density. … … … … … … … … … … … … … … … … … … … …[10] [Total: 20]
Question paper, page 9
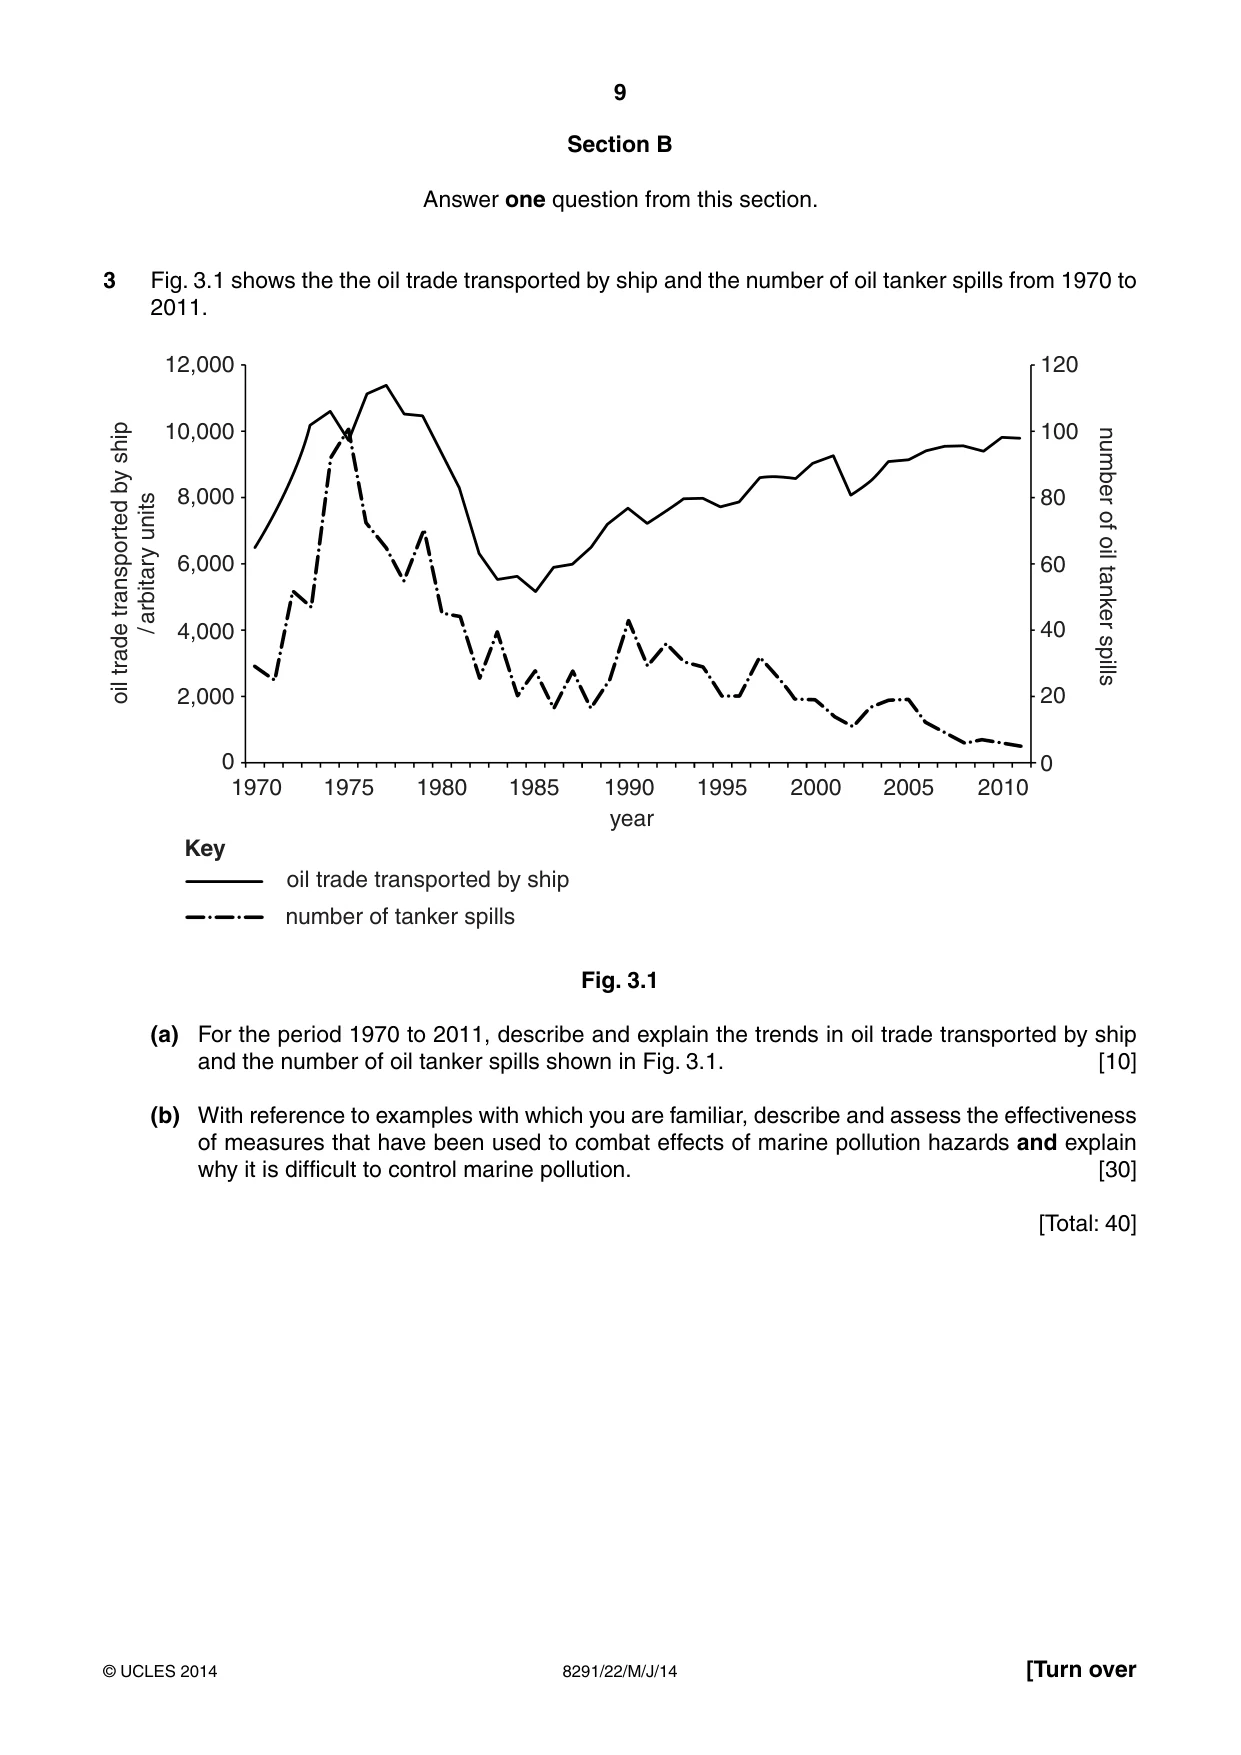
9 8291/22/M/J/14 © UCLES 2014 [Turn over Section B Answer one question from this section. 3 Fig. 3.1 shows the the oil trade transported by ship and the number of oil tanker spills from 1970 to 2011. 1970 1975 1980 1985 1990 1995 2000 2005 2010 120 100 80 60 40 20 0 12,000 10,000 8,000 6,000 4,000 2,000 0 oil trade transported by ship / arbitary units number of oil tanker spills number of tanker spills oil trade transported by ship Key year Fig. 3.1 (a) For the period 1970 to 2011, describe and explain the trends in oil trade transported by ship and the number of oil tanker spills shown in Fig. 3.1. [10] (b) With reference to examples with which you are familiar, describe and assess the effectiveness of measures that have been used to combat effects of marine pollution hazards and explain why it is difficult to control marine pollution. [30] [Total: 40]
Question paper, page 10
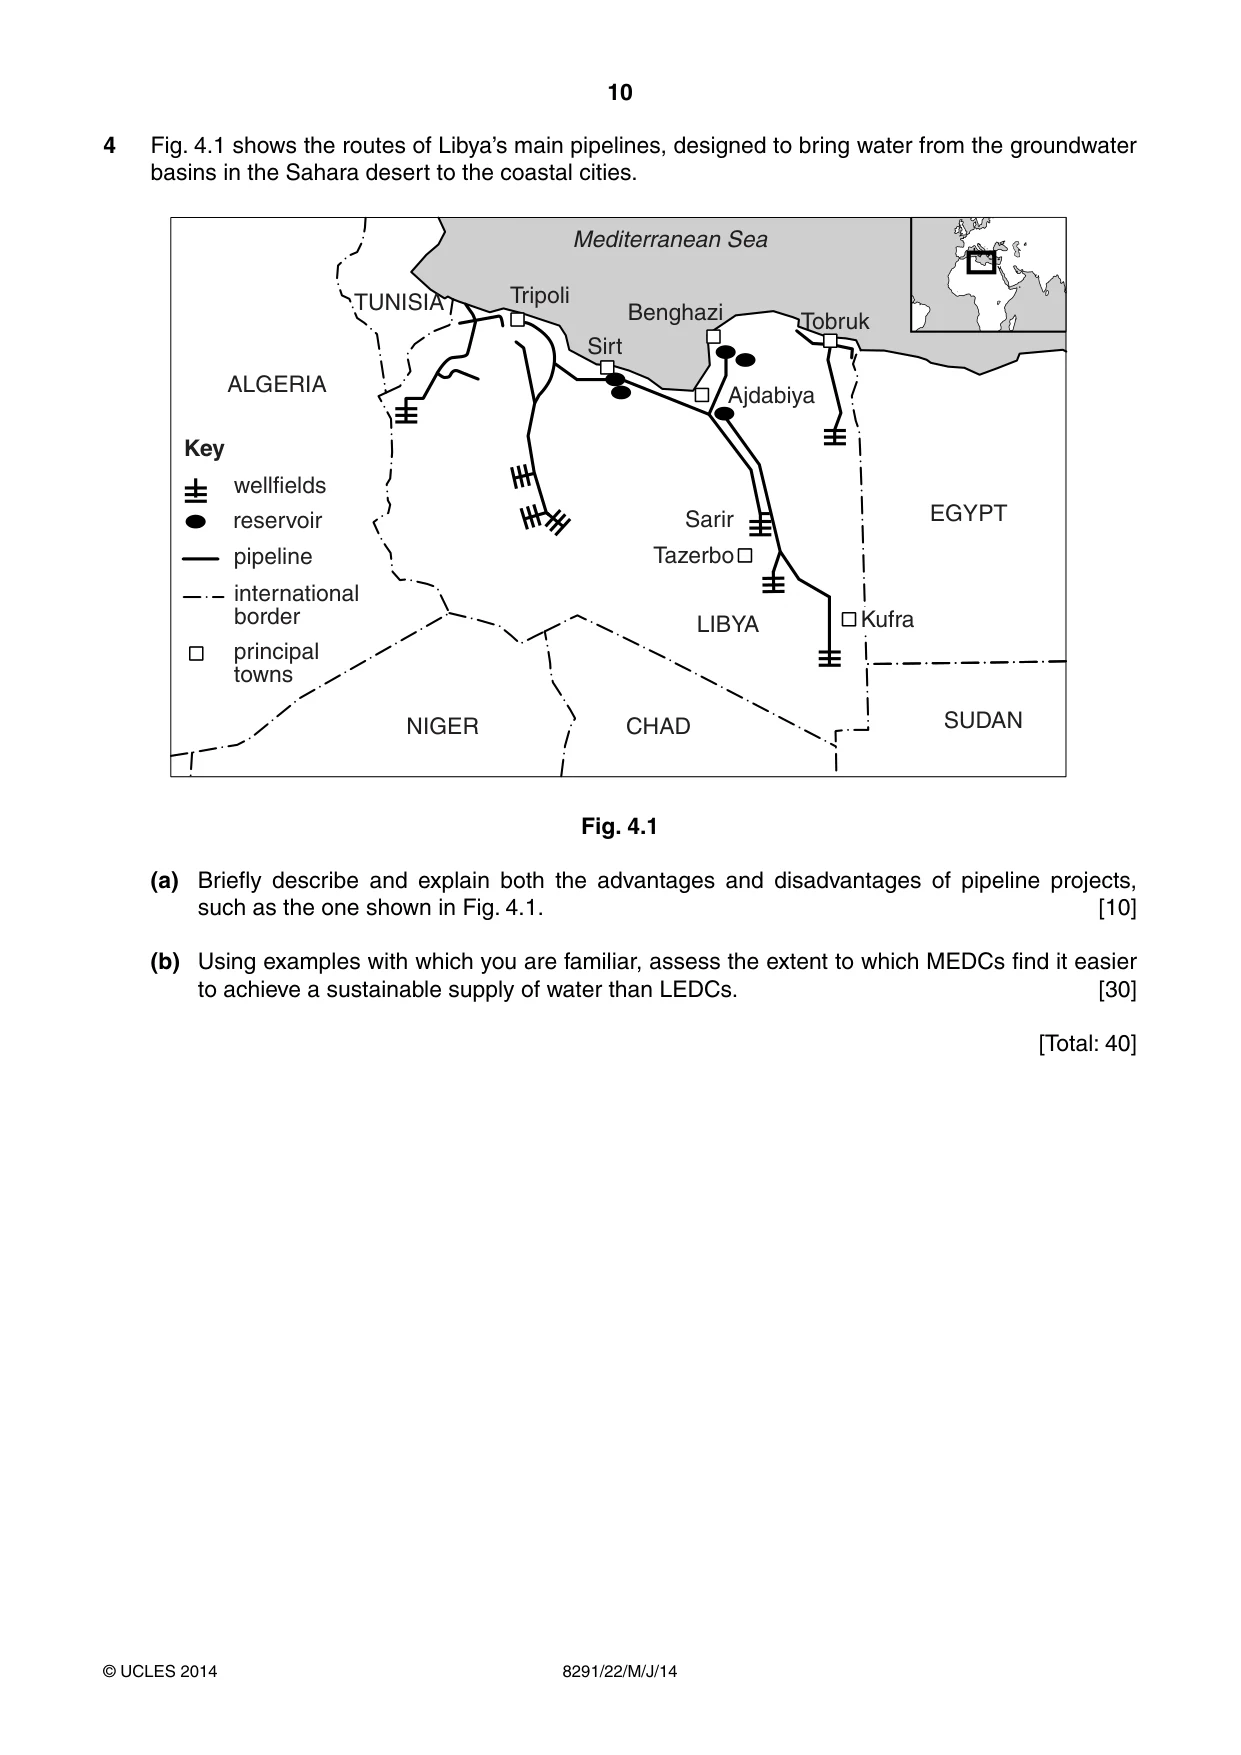
10 8291/22/M/J/14 © UCLES 2014 4 Fig. 4.1 shows the routes of Libya’s main pipelines, designed to bring water from the groundwater basins in the Sahara desert to the coastal cities. NIGER CHAD LIBYA EGYPT SUDAN ALGERIA TUNISIA Tripoli Sirt Benghazi Tobruk Ajdabiya Kufra Tazerbo Sarir wellfields reservoir pipeline international border principal towns Key Mediterranean Sea Fig. 4.1 (a) Briefly describe and explain both the advantages and disadvantages of pipeline projects, such as the one shown in Fig. 4.1. [10] (b) Using examples with which you are familiar, assess the extent to which MEDCs find it easier to achieve a sustainable supply of water than LEDCs. [30] [Total: 40]
Question paper, page 11
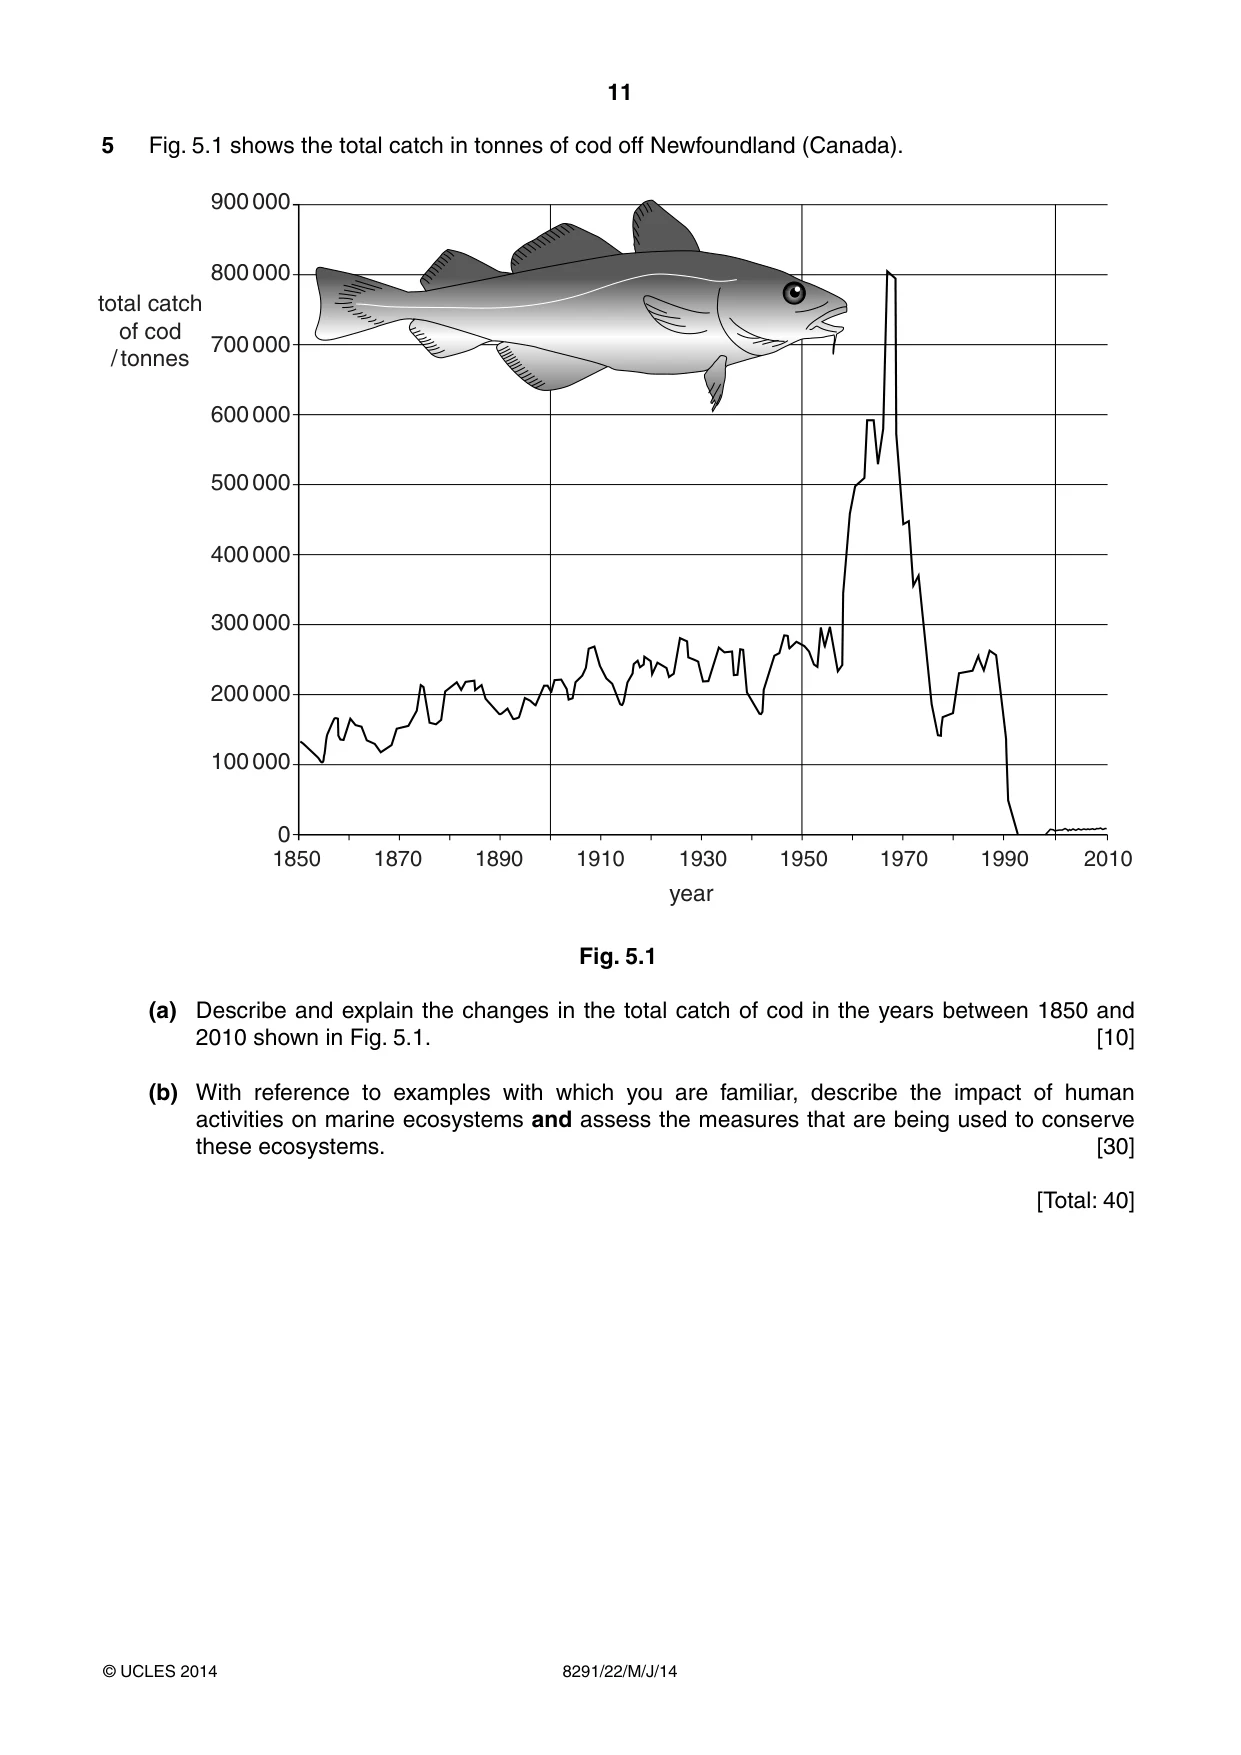
11 8291/22/M/J/14 © UCLES 2014 5 Fig. 5.1 shows the total catch in tonnes of cod off Newfoundland (Canada). 900 000 800 000 700 000 600 000 500 000 400 000 300 000 200 000 100 000 0 1850 1870 1890 1910 1930 1950 1970 1990 2010 total catch of cod / tonnes year Fig. 5.1 (a) Describe and explain the changes in the total catch of cod in the years between 1850 and 2010 shown in Fig. 5.1. [10] (b) With reference to examples with which you are familiar, describe the impact of human activities on marine ecosystems and assess the measures that are being used to conserve these ecosystems. [30] [Total: 40]
Question paper, page 12
12 8291/22/M/J/14 © UCLES 2014 Copyright Acknowledgments: Question 1 Figure 1.1 © Environmental Science; Australian Acadamy of Science; 1994. Question 2 Figure 2.1 © Environmental Science; Australian Acadamy of Science; 1994. Question 3 Figure 3.1 © http://www.itopf.com/news-and-events/documents/STATSPACK2011.pdf. Question 4 Figure 4.1 © http://www.bbc.co.uk; GMR Libya. Question 5 Figure 5.1 © http://commons.wikimedia.org/wiki/File:Surexploitation_morue_surp%C3%AAche.jpg?uselang=en-gb Permission to reproduce items where third-party owned material protected by copyright is included has been sought and cleared where possible. Every reasonable effort has been made by the publisher (UCLES) to trace copyright holders, but if any items requiring clearance have unwittingly been included, the publisher will be pleased to make amends at the earliest possible opportunity. Cambridge International Examinations is part of the Cambridge Assessment Group. Cambridge Assessment is the brand name of University of Cambridge Local Examinations Syndicate (UCLES), which is itself a department of the University of Cambridge. BLANK PAGE
Mark scheme, page 1
CAMBRIDGE INTERNATIONAL EXAMINATIONS GCE Advanced Subsidiary Level MARK SCHEME for the May/June 2014 series 8291 ENVIRONMENTAL MANAGEMENT 8291/22 Paper 2, maximum raw mark 80 This mark scheme is published as an aid to teachers and candidates, to indicate the requirements of the examination. It shows the basis on which Examiners were instructed to award marks. It does not indicate the details of the discussions that took place at an Examiners’ meeting before marking began, which would have considered the acceptability of alternative answers. Mark schemes should be read in conjunction with the question paper and the Principal Examiner Report for Teachers. Cambridge will not enter into discussions about these mark schemes. Cambridge is publishing the mark schemes for the May/June 2014 series for most IGCSE, GCE Advanced Level and Advanced Subsidiary Level components and some Ordinary Level components.
Mark scheme, page 2
Page 2 Mark Scheme Syllabus Paper GCE AS LEVEL – May/June 2014 8291 22 © Cambridge International Examinations 2014 General notes Symbols used in Environmental Management mark schemes. / separates alternatives for a marking point – other valid ways of expressing the same idea are also credited ; separates points for the award of a mark [3] indicates the number of marks available italic indicates that this is information about the marking points and is not required to gain credit italic text is also used for comments about alternatives that should be accepted, ignored or rejected ora or reverse argument – shows that an argument from an alternative viewpoint will be credited AW alternative wording, sometimes called ‘or words to that effect’ – AW is used when there are many different ways of expressing the same idea ( ) the word / phrase in brackets is not required to gain marks but sets the context of the response for credit e.g. (nuclear) waste – nuclear is not needed but if it was described as a domestic waste then no mark is awarded volcanic underlined words – the answer must contain exactly this word ecf error carried forward – if an incorrect answer is given to part of a question, and this answer is subsequently used by a candidate in later parts of the question, this indicates that the candidate’s incorrect answer will be used as a starting point for marking the later parts of the question
Mark scheme, page 3
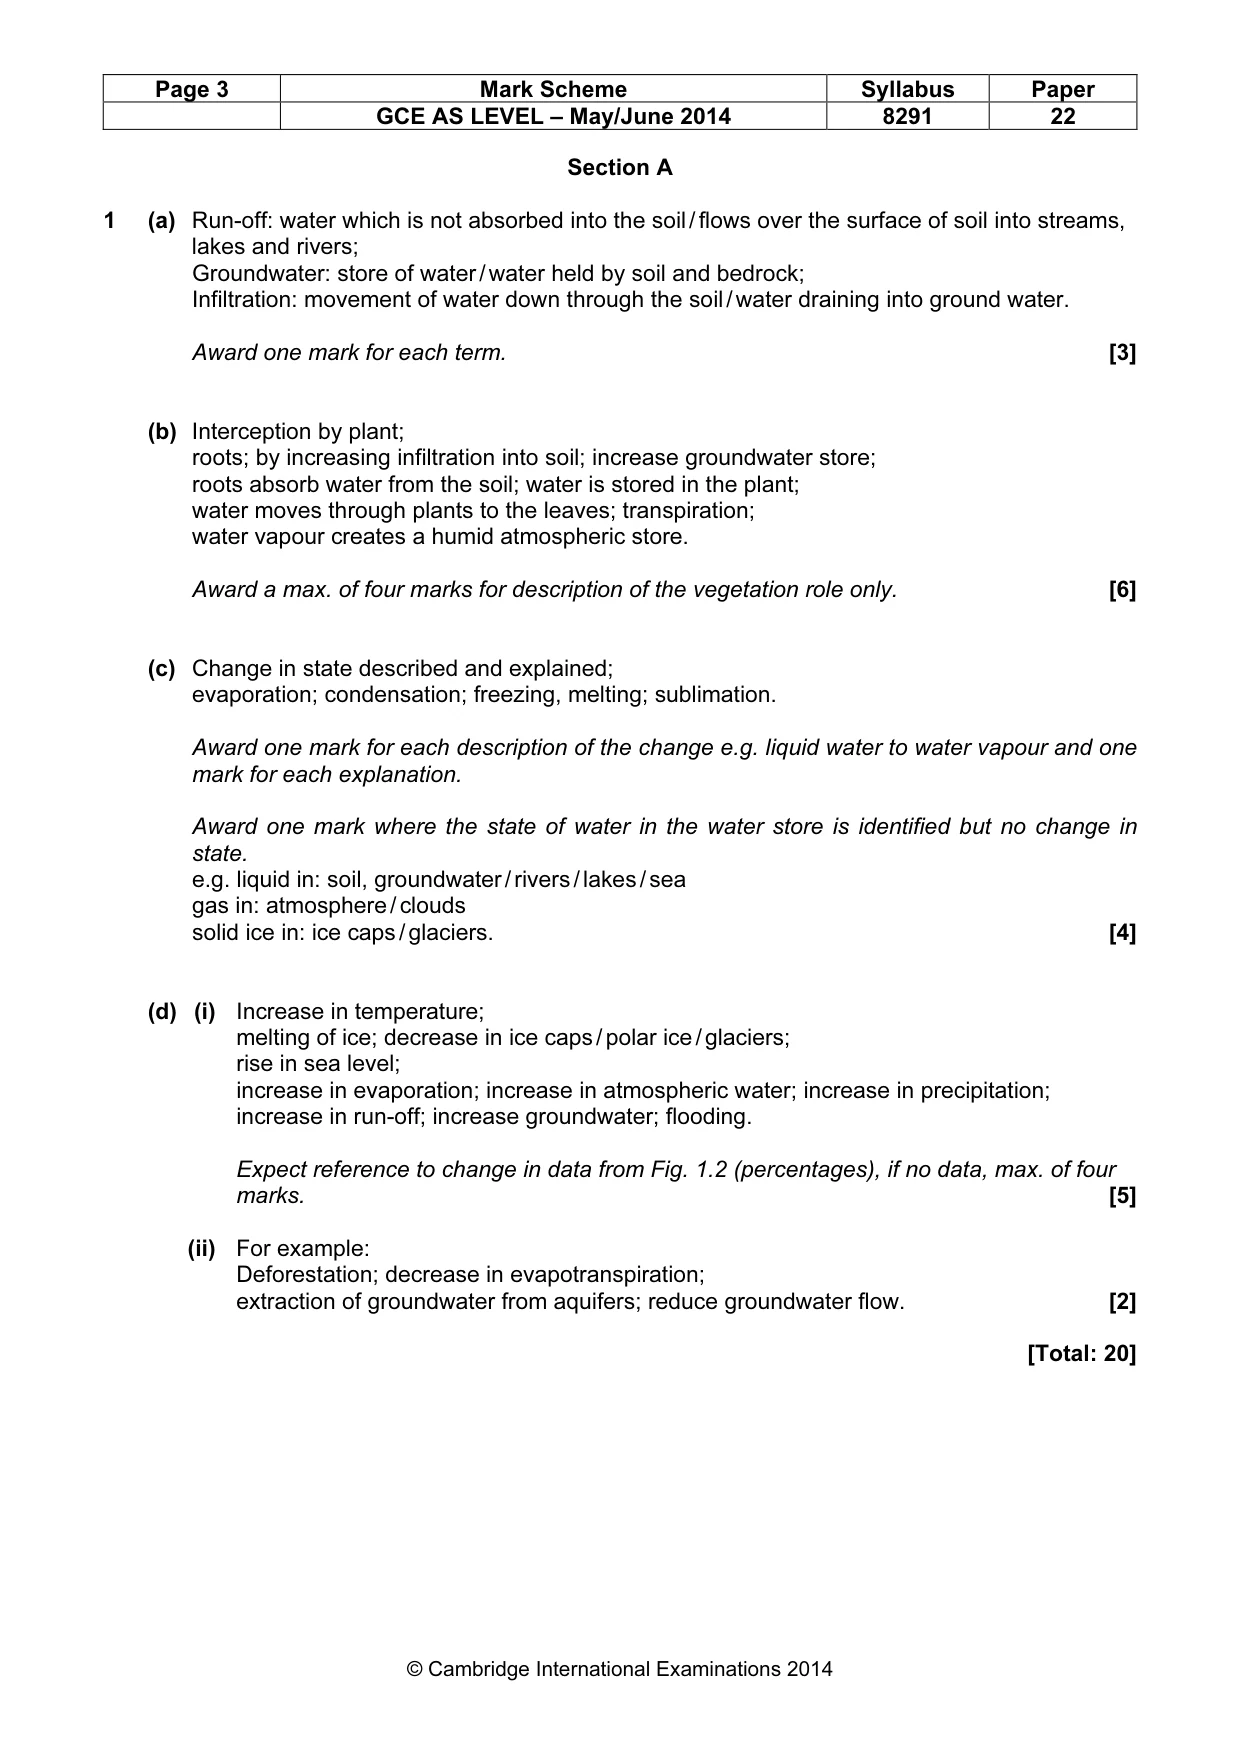
Page 3 Mark Scheme Syllabus Paper GCE AS LEVEL – May/June 2014 8291 22 © Cambridge International Examinations 2014 Section A 1 (a) Run-off: water which is not absorbed into the soil / flows over the surface of soil into streams, lakes and rivers; Groundwater: store of water / water held by soil and bedrock; Infiltration: movement of water down through the soil / water draining into ground water. Award one mark for each term. [3] (b) Interception by plant; roots; by increasing infiltration into soil; increase groundwater store; roots absorb water from the soil; water is stored in the plant; water moves through plants to the leaves; transpiration; water vapour creates a humid atmospheric store. Award a max. of four marks for description of the vegetation role only. [6] (c) Change in state described and explained; evaporation; condensation; freezing, melting; sublimation. Award one mark for each description of the change e.g. liquid water to water vapour and one mark for each explanation. Award one mark where the state of water in the water store is identified but no change in state. e.g. liquid in: soil, groundwater / rivers / lakes / sea gas in: atmosphere / clouds solid ice in: ice caps / glaciers. [4] (d) (i) Increase in temperature; melting of ice; decrease in ice caps / polar ice / glaciers; rise in sea level; increase in evaporation; increase in atmospheric water; increase in precipitation; increase in run-off; increase groundwater; flooding. Expect reference to change in data from Fig. 1.2 (percentages), if no data, max. of four marks. [5] (ii) For example: Deforestation; decrease in evapotranspiration; extraction of groundwater from aquifers; reduce groundwater flow. [2] [Total: 20]
Mark scheme, page 4
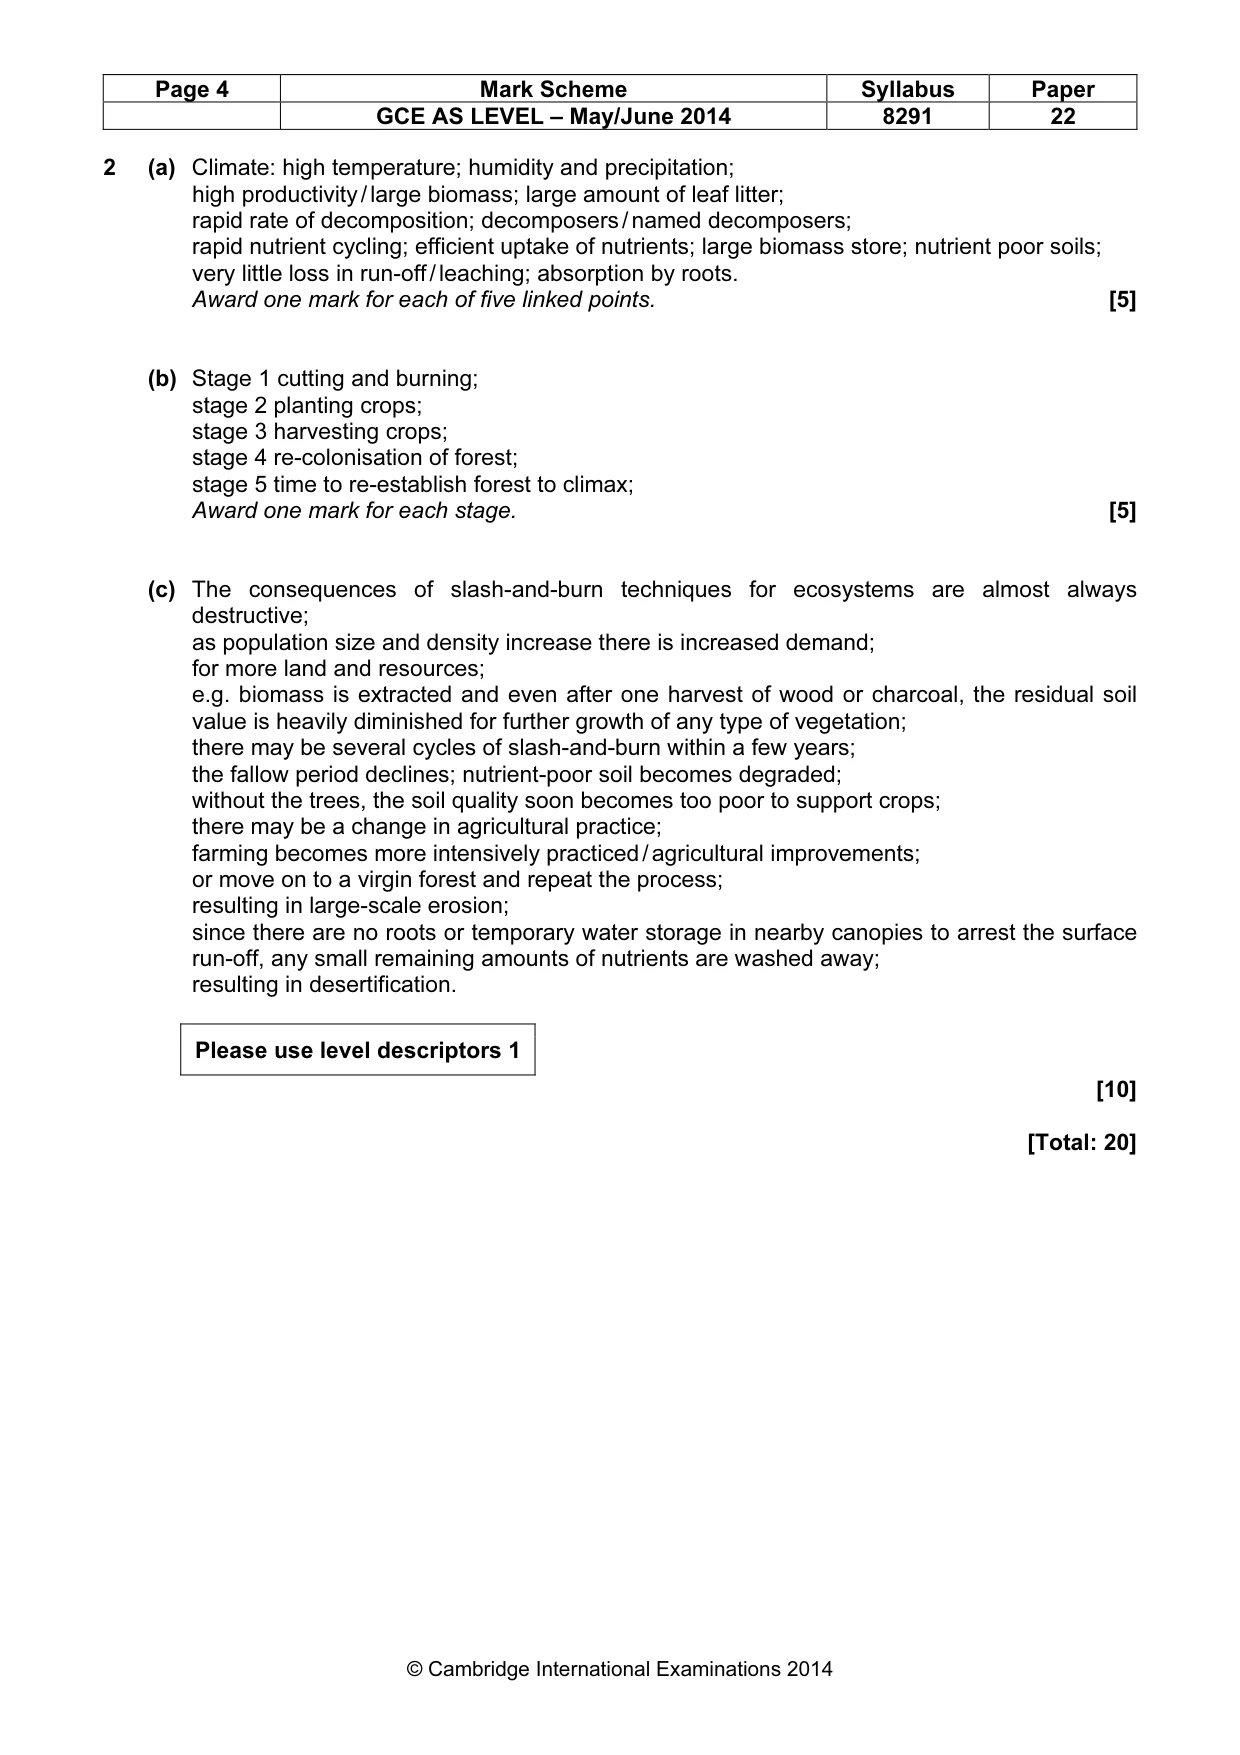
Page 4 Mark Scheme Syllabus Paper GCE AS LEVEL – May/June 2014 8291 22 © Cambridge International Examinations 2014 2 (a) Climate: high temperature; humidity and precipitation; high productivity / large biomass; large amount of leaf litter; rapid rate of decomposition; decomposers / named decomposers; rapid nutrient cycling; efficient uptake of nutrients; large biomass store; nutrient poor soils; very little loss in run-off / leaching; absorption by roots. Award one mark for each of five linked points. [5] (b) Stage 1 cutting and burning; stage 2 planting crops; stage 3 harvesting crops; stage 4 re-colonisation of forest; stage 5 time to re-establish forest to climax; Award one mark for each stage. [5] (c) The consequences of slash-and-burn techniques for ecosystems are almost always destructive; as population size and density increase there is increased demand; for more land and resources; e.g. biomass is extracted and even after one harvest of wood or charcoal, the residual soil value is heavily diminished for further growth of any type of vegetation; there may be several cycles of slash-and-burn within a few years; the fallow period declines; nutrient-poor soil becomes degraded; without the trees, the soil quality soon becomes too poor to support crops; there may be a change in agricultural practice; farming becomes more intensively practiced / agricultural improvements; or move on to a virgin forest and repeat the process; resulting in large-scale erosion; since there are no roots or temporary water storage in nearby canopies to arrest the surface run-off, any small remaining amounts of nutrients are washed away; resulting in desertification. Please use level descriptors 1 [10] [Total: 20]
Mark scheme, page 5
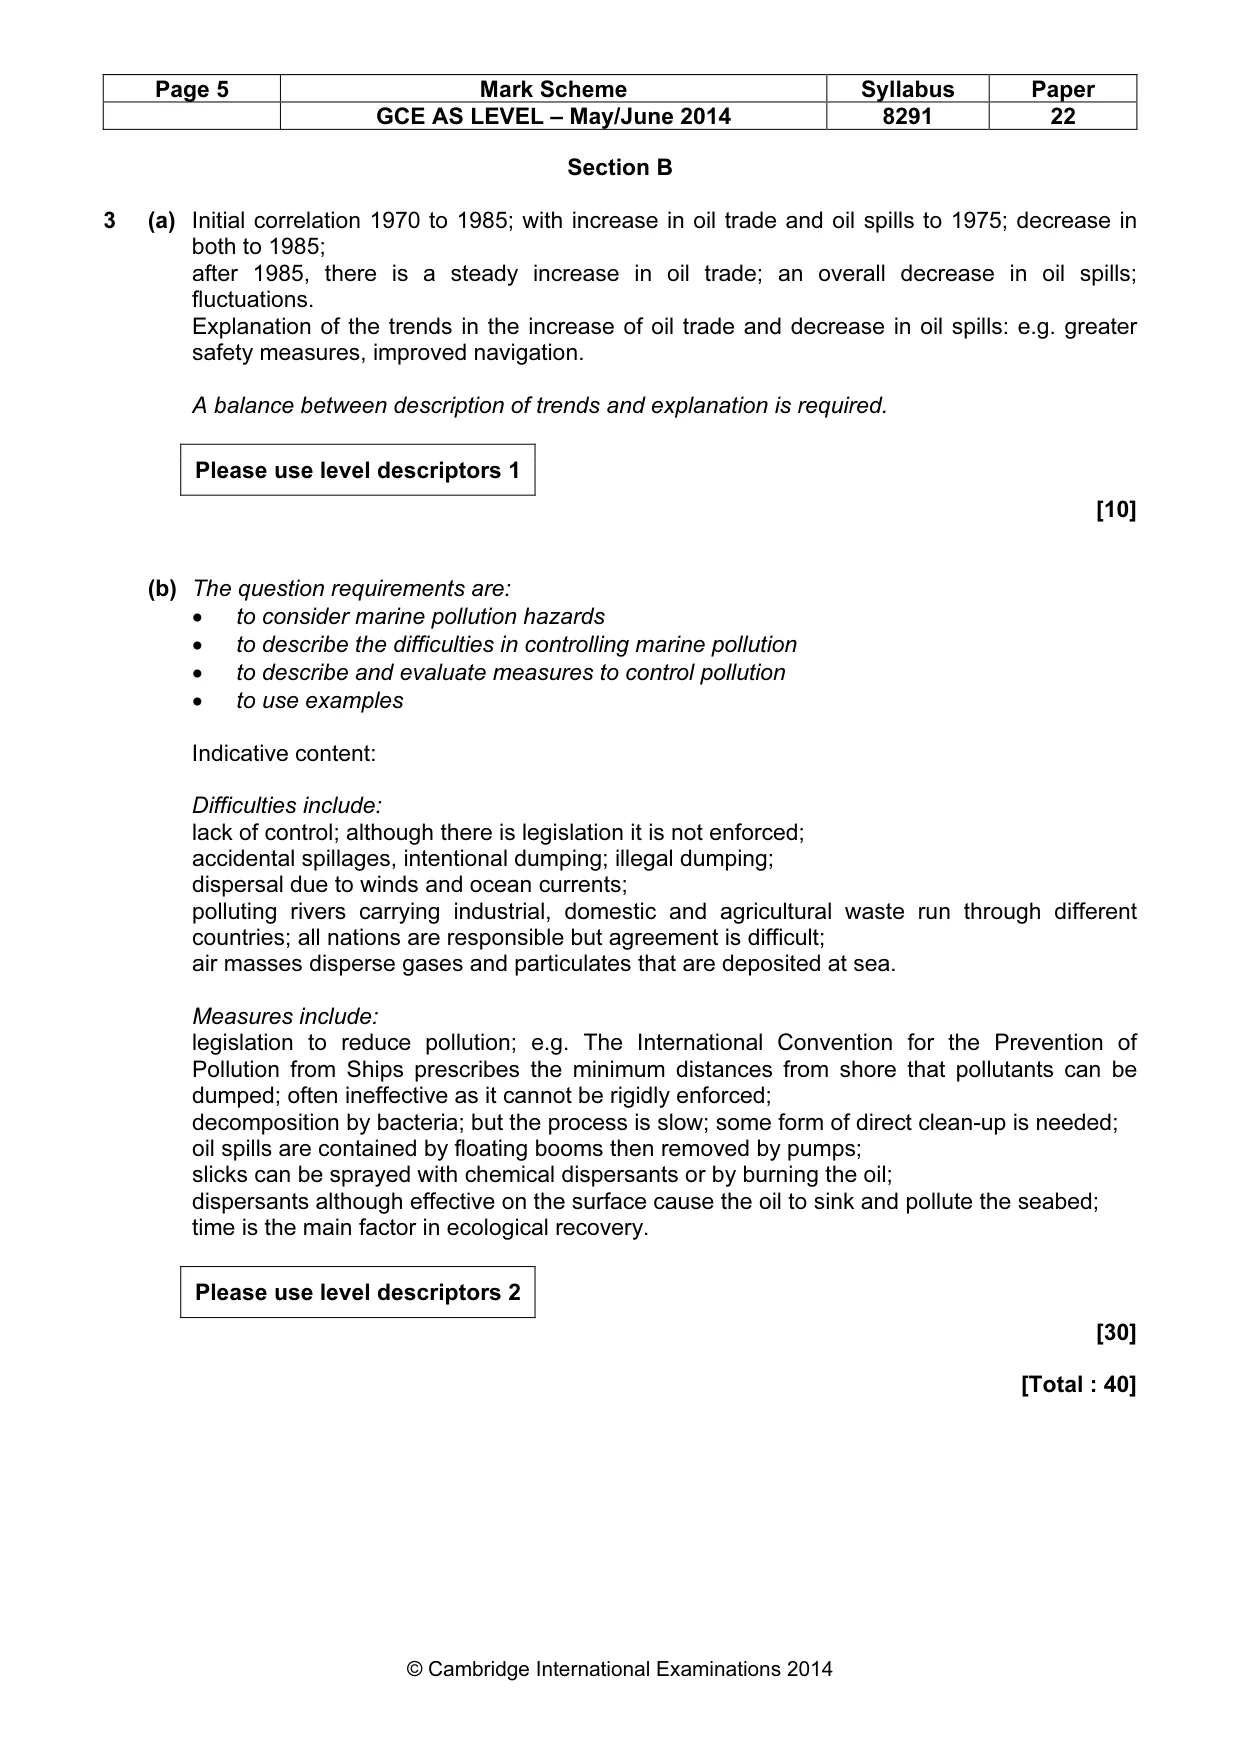
Page 5 Mark Scheme Syllabus Paper GCE AS LEVEL – May/June 2014 8291 22 © Cambridge International Examinations 2014 Section B 3 (a) Initial correlation 1970 to 1985; with increase in oil trade and oil spills to 1975; decrease in both to 1985; after 1985, there is a steady increase in oil trade; an overall decrease in oil spills; fluctuations. Explanation of the trends in the increase of oil trade and decrease in oil spills: e.g. greater safety measures, improved navigation. A balance between description of trends and explanation is required. Please use level descriptors 1 [10] (b) The question requirements are: • to consider marine pollution hazards • to describe the difficulties in controlling marine pollution • to describe and evaluate measures to control pollution • to use examples Indicative content: Difficulties include: lack of control; although there is legislation it is not enforced; accidental spillages, intentional dumping; illegal dumping; dispersal due to winds and ocean currents; polluting rivers carrying industrial, domestic and agricultural waste run through different countries; all nations are responsible but agreement is difficult; air masses disperse gases and particulates that are deposited at sea. Measures include: legislation to reduce pollution; e.g. The International Convention for the Prevention of Pollution from Ships prescribes the minimum distances from shore that pollutants can be dumped; often ineffective as it cannot be rigidly enforced; decomposition by bacteria; but the process is slow; some form of direct clean-up is needed; oil spills are contained by floating booms then removed by pumps; slicks can be sprayed with chemical dispersants or by burning the oil; dispersants although effective on the surface cause the oil to sink and pollute the seabed; time is the main factor in ecological recovery. Please use level descriptors 2 [30] [Total : 40]
Mark scheme, page 6
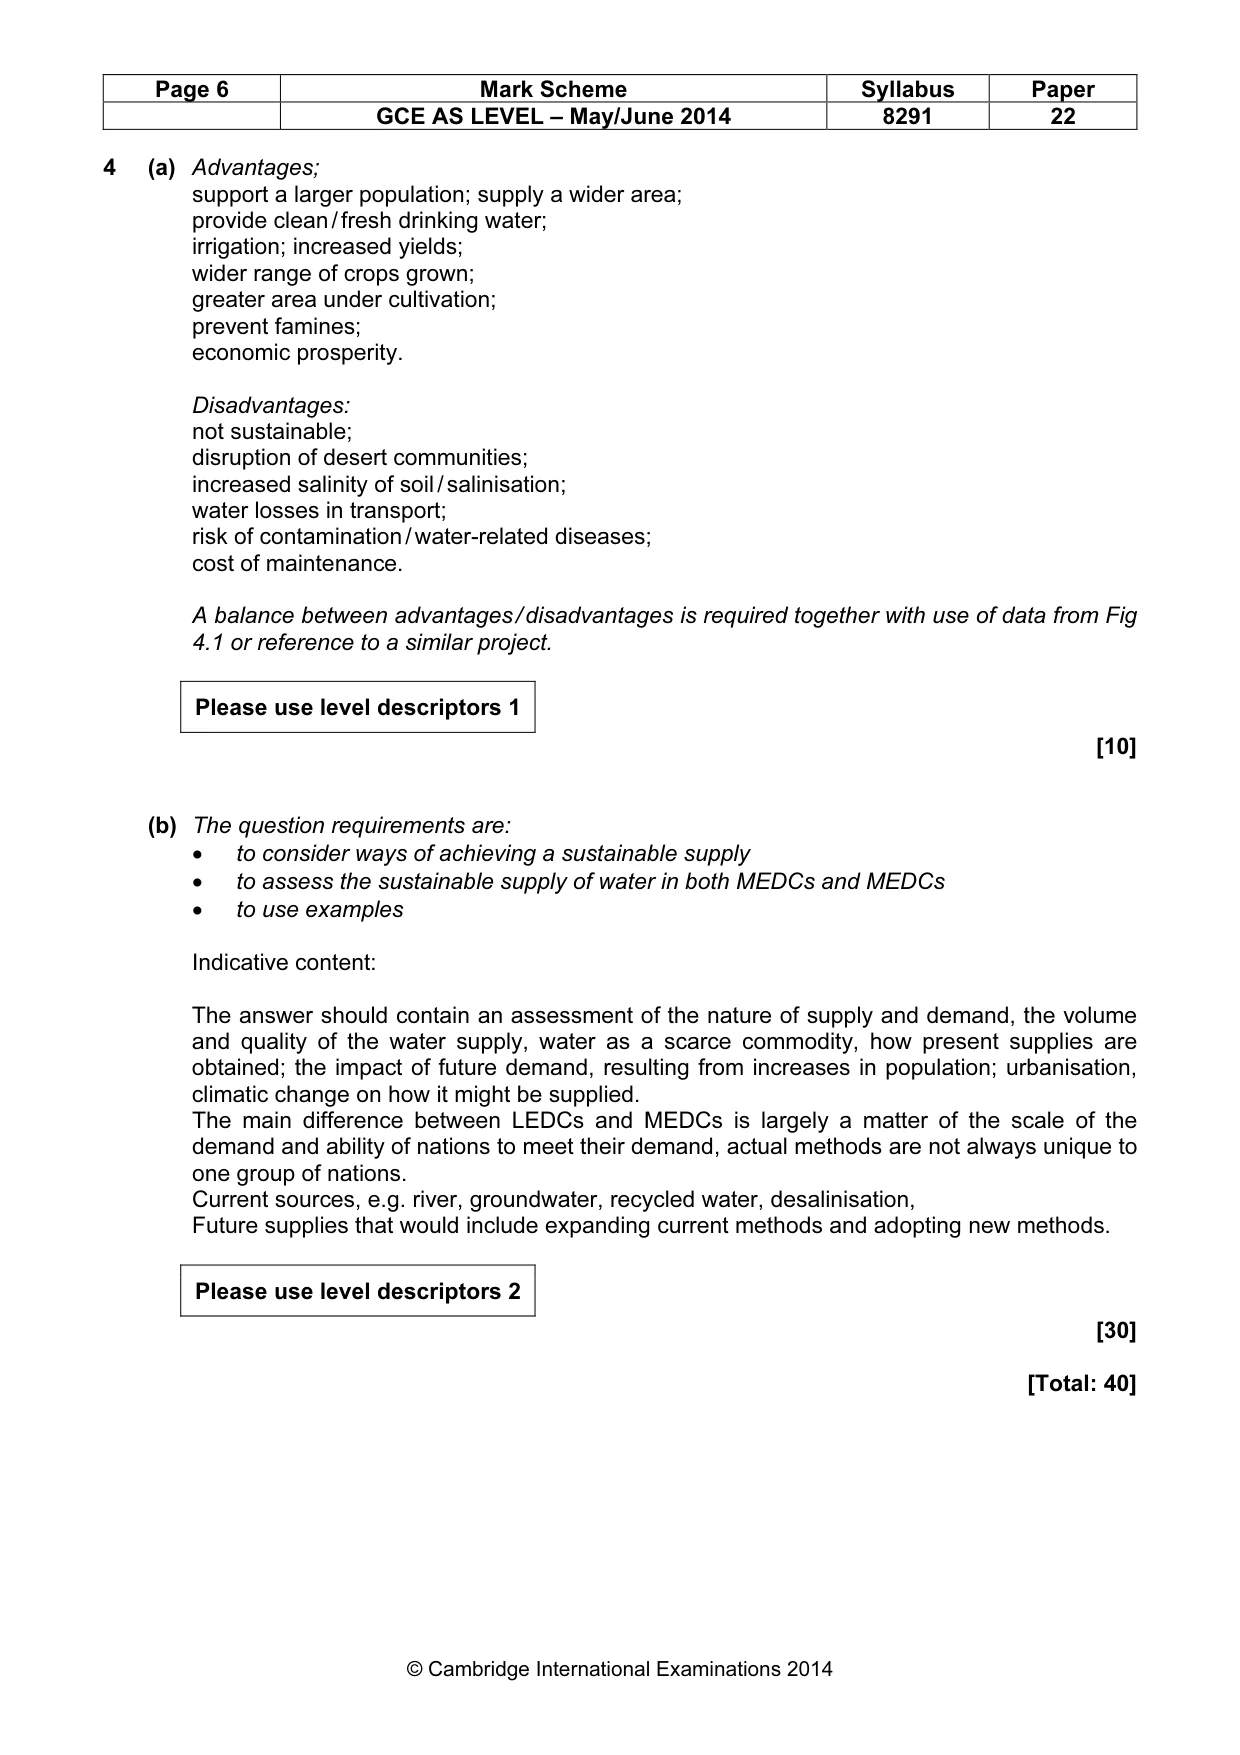
Page 6 Mark Scheme Syllabus Paper GCE AS LEVEL – May/June 2014 8291 22 © Cambridge International Examinations 2014 4 (a) Advantages; support a larger population; supply a wider area; provide clean / fresh drinking water; irrigation; increased yields; wider range of crops grown; greater area under cultivation; prevent famines; economic prosperity. Disadvantages: not sustainable; disruption of desert communities; increased salinity of soil / salinisation; water losses in transport; risk of contamination / water-related diseases; cost of maintenance. A balance between advantages / disadvantages is required together with use of data from Fig 4.1 or reference to a similar project. Please use level descriptors 1 [10] (b) The question requirements are: • to consider ways of achieving a sustainable supply • to assess the sustainable supply of water in both MEDCs and MEDCs • to use examples Indicative content: The answer should contain an assessment of the nature of supply and demand, the volume and quality of the water supply, water as a scarce commodity, how present supplies are obtained; the impact of future demand, resulting from increases in population; urbanisation, climatic change on how it might be supplied. The main difference between LEDCs and MEDCs is largely a matter of the scale of the demand and ability of nations to meet their demand, actual methods are not always unique to one group of nations. Current sources, e.g. river, groundwater, recycled water, desalinisation, Future supplies that would include expanding current methods and adopting new methods. Please use level descriptors 2 [30] [Total: 40]
Mark scheme, page 7
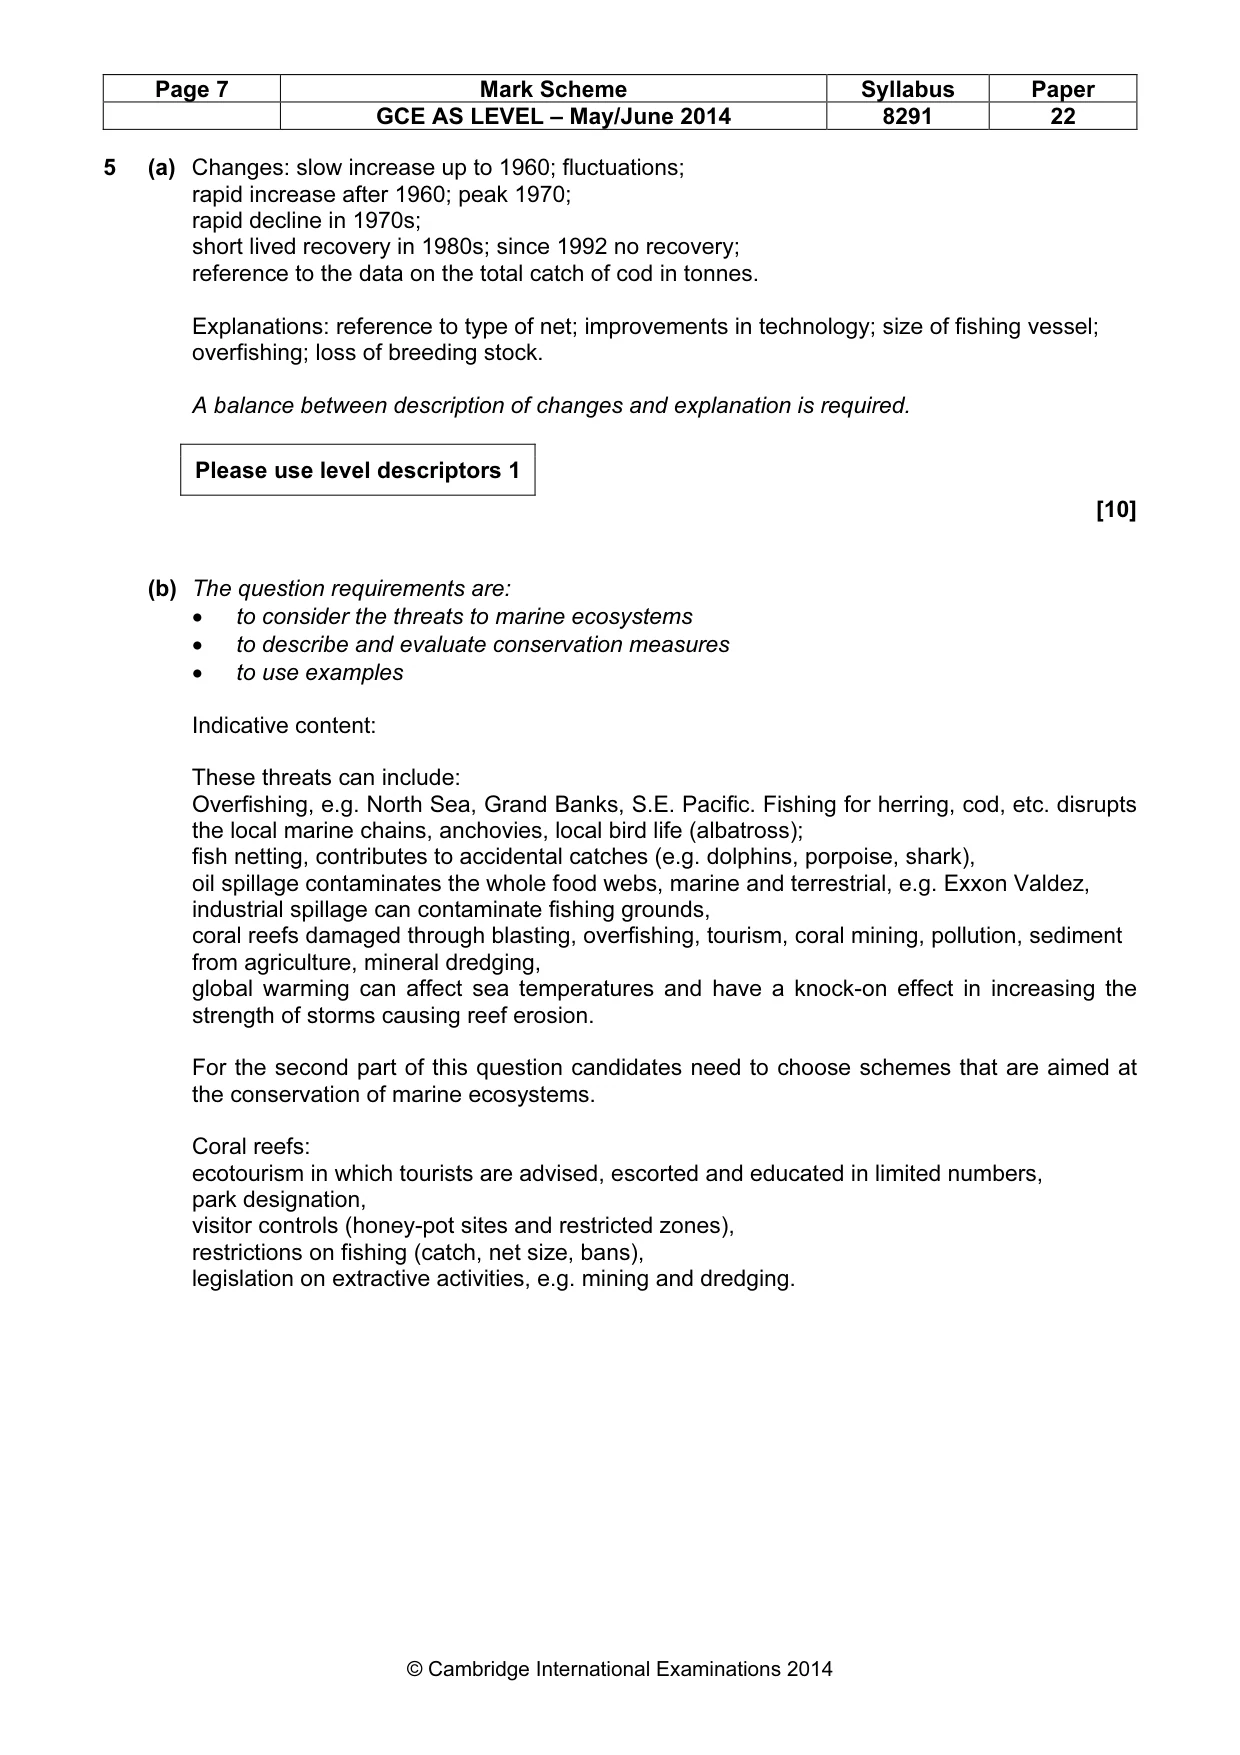
Page 7 Mark Scheme Syllabus Paper GCE AS LEVEL – May/June 2014 8291 22 © Cambridge International Examinations 2014 5 (a) Changes: slow increase up to 1960; fluctuations; rapid increase after 1960; peak 1970; rapid decline in 1970s; short lived recovery in 1980s; since 1992 no recovery; reference to the data on the total catch of cod in tonnes. Explanations: reference to type of net; improvements in technology; size of fishing vessel; overfishing; loss of breeding stock. A balance between description of changes and explanation is required. Please use level descriptors 1 [10] (b) The question requirements are: • to consider the threats to marine ecosystems • to describe and evaluate conservation measures • to use examples Indicative content: These threats can include: Overfishing, e.g. North Sea, Grand Banks, S.E. Pacific. Fishing for herring, cod, etc. disrupts the local marine chains, anchovies, local bird life (albatross); fish netting, contributes to accidental catches (e.g. dolphins, porpoise, shark), oil spillage contaminates the whole food webs, marine and terrestrial, e.g. Exxon Valdez, industrial spillage can contaminate fishing grounds, coral reefs damaged through blasting, overfishing, tourism, coral mining, pollution, sediment from agriculture, mineral dredging, global warming can affect sea temperatures and have a knock-on effect in increasing the strength of storms causing reef erosion. For the second part of this question candidates need to choose schemes that are aimed at the conservation of marine ecosystems. Coral reefs: ecotourism in which tourists are advised, escorted and educated in limited numbers, park designation, visitor controls (honey-pot sites and restricted zones), restrictions on fishing (catch, net size, bans), legislation on extractive activities, e.g. mining and dredging.
Mark scheme, page 8
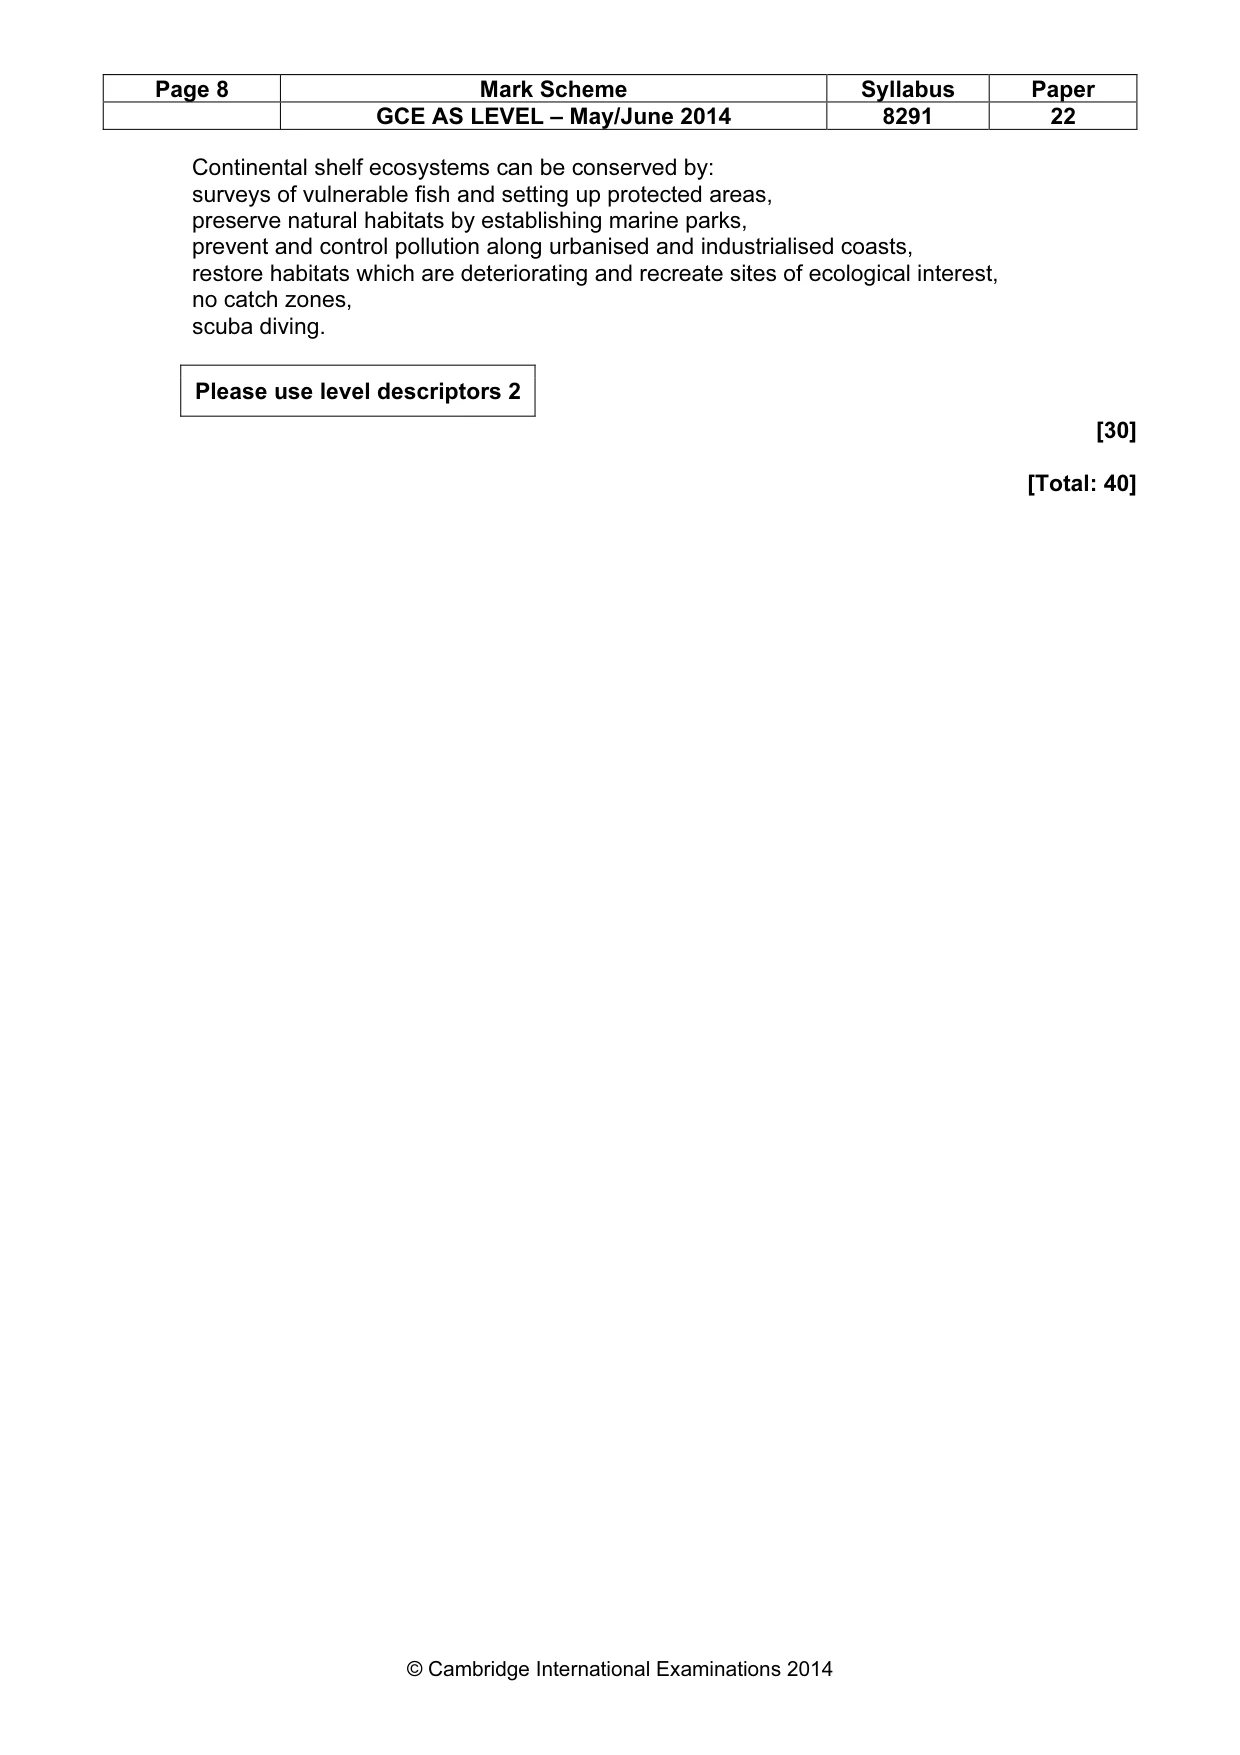
Page 8 Mark Scheme Syllabus Paper GCE AS LEVEL – May/June 2014 8291 22 © Cambridge International Examinations 2014 Continental shelf ecosystems can be conserved by: surveys of vulnerable fish and setting up protected areas, preserve natural habitats by establishing marine parks, prevent and control pollution along urbanised and industrialised coasts, restore habitats which are deteriorating and recreate sites of ecological interest, no catch zones, scuba diving. Please use level descriptors 2 [30] [Total: 40]
Mark scheme, page 9
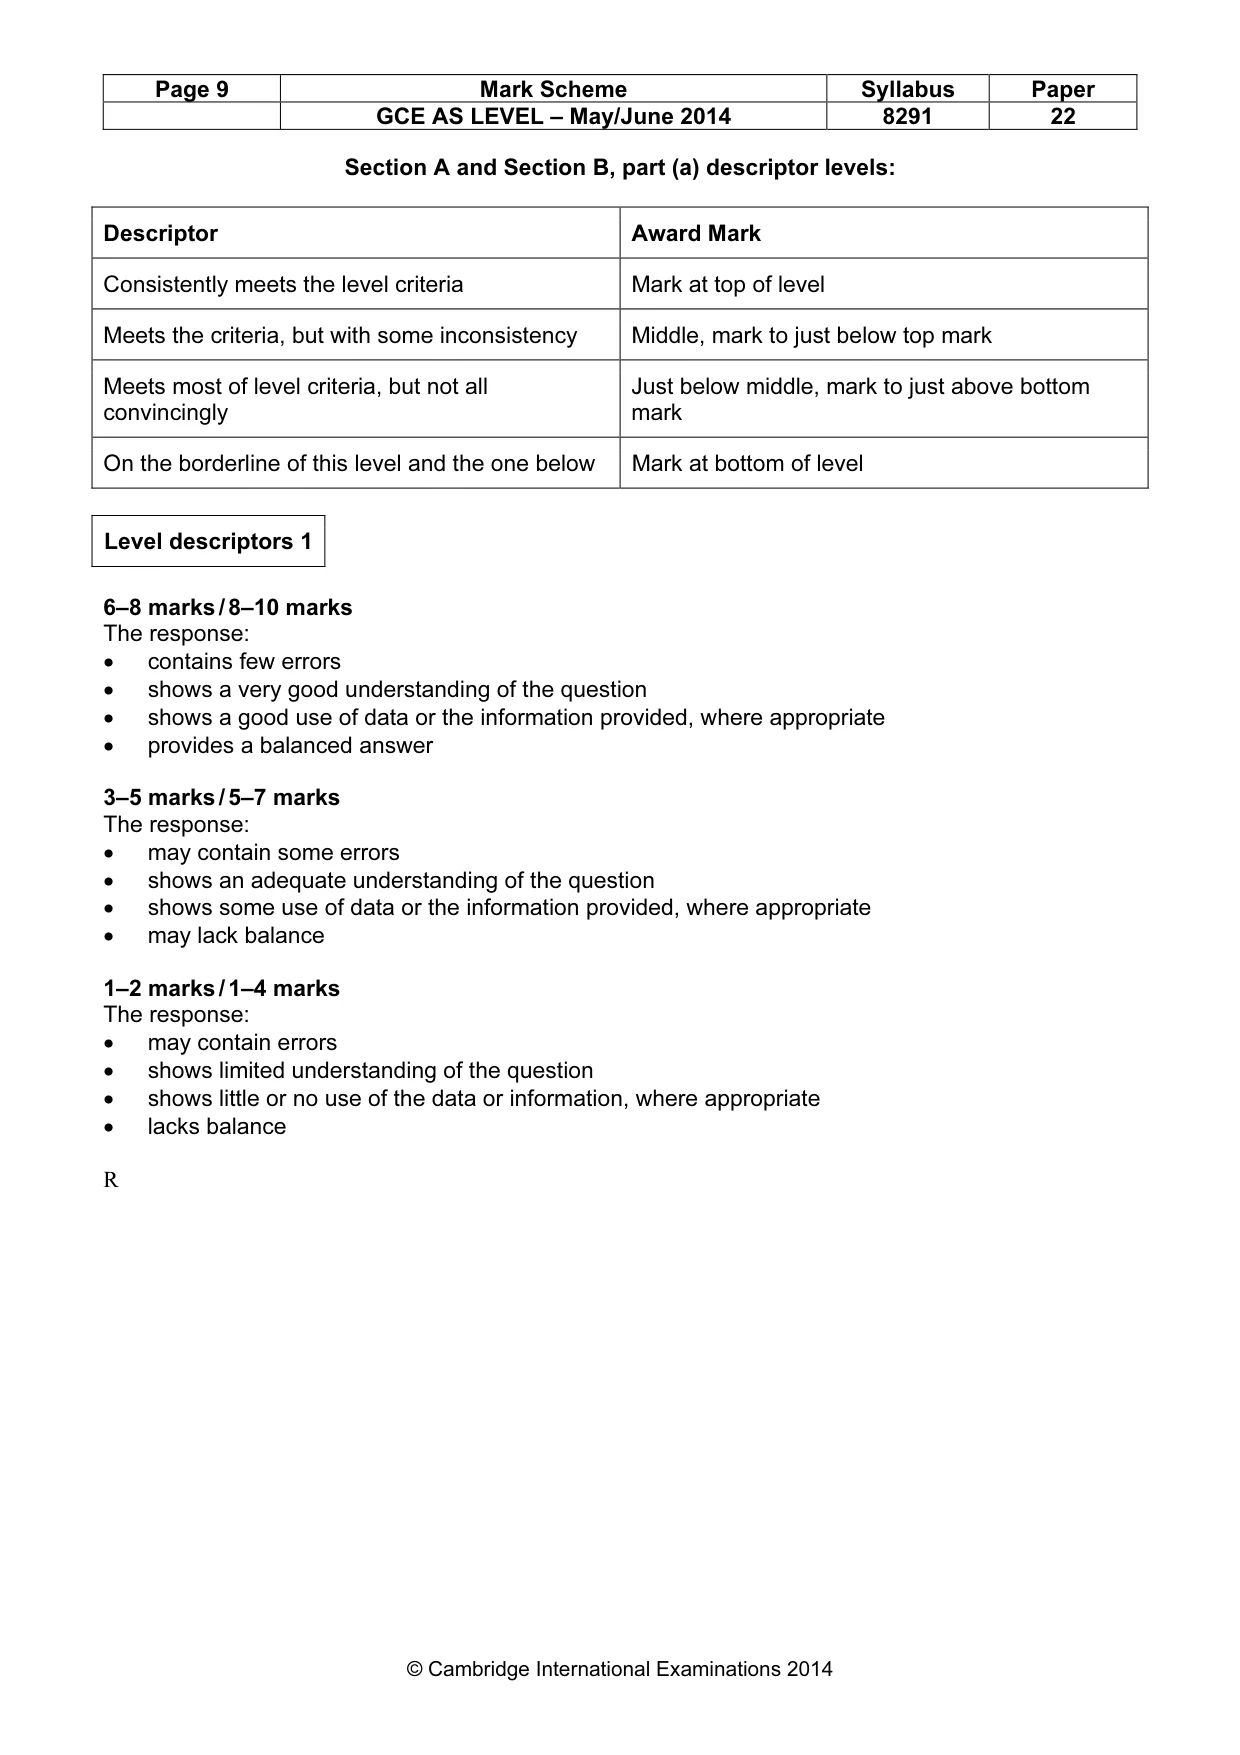
Page 9 Mark Scheme Syllabus Paper GCE AS LEVEL – May/June 2014 8291 22 © Cambridge International Examinations 2014 Section A and Section B, part (a) descriptor levels: Descriptor Award Mark Consistently meets the level criteria Mark at top of level Meets the criteria, but with some inconsistency Middle, mark to just below top mark Meets most of level criteria, but not all convincingly Just below middle, mark to just above bottom mark On the borderline of this level and the one below Mark at bottom of level Level descriptors 1 6–8 marks / 8–10 marks The response: • contains few errors • shows a very good understanding of the question • shows a good use of data or the information provided, where appropriate • provides a balanced answer 3–5 marks / 5–7 marks The response: • may contain some errors • shows an adequate understanding of the question • shows some use of data or the information provided, where appropriate • may lack balance 1–2 marks / 1–4 marks The response: • may contain errors • shows limited understanding of the question • shows little or no use of the data or information, where appropriate • lacks balance R
Mark scheme, page 10
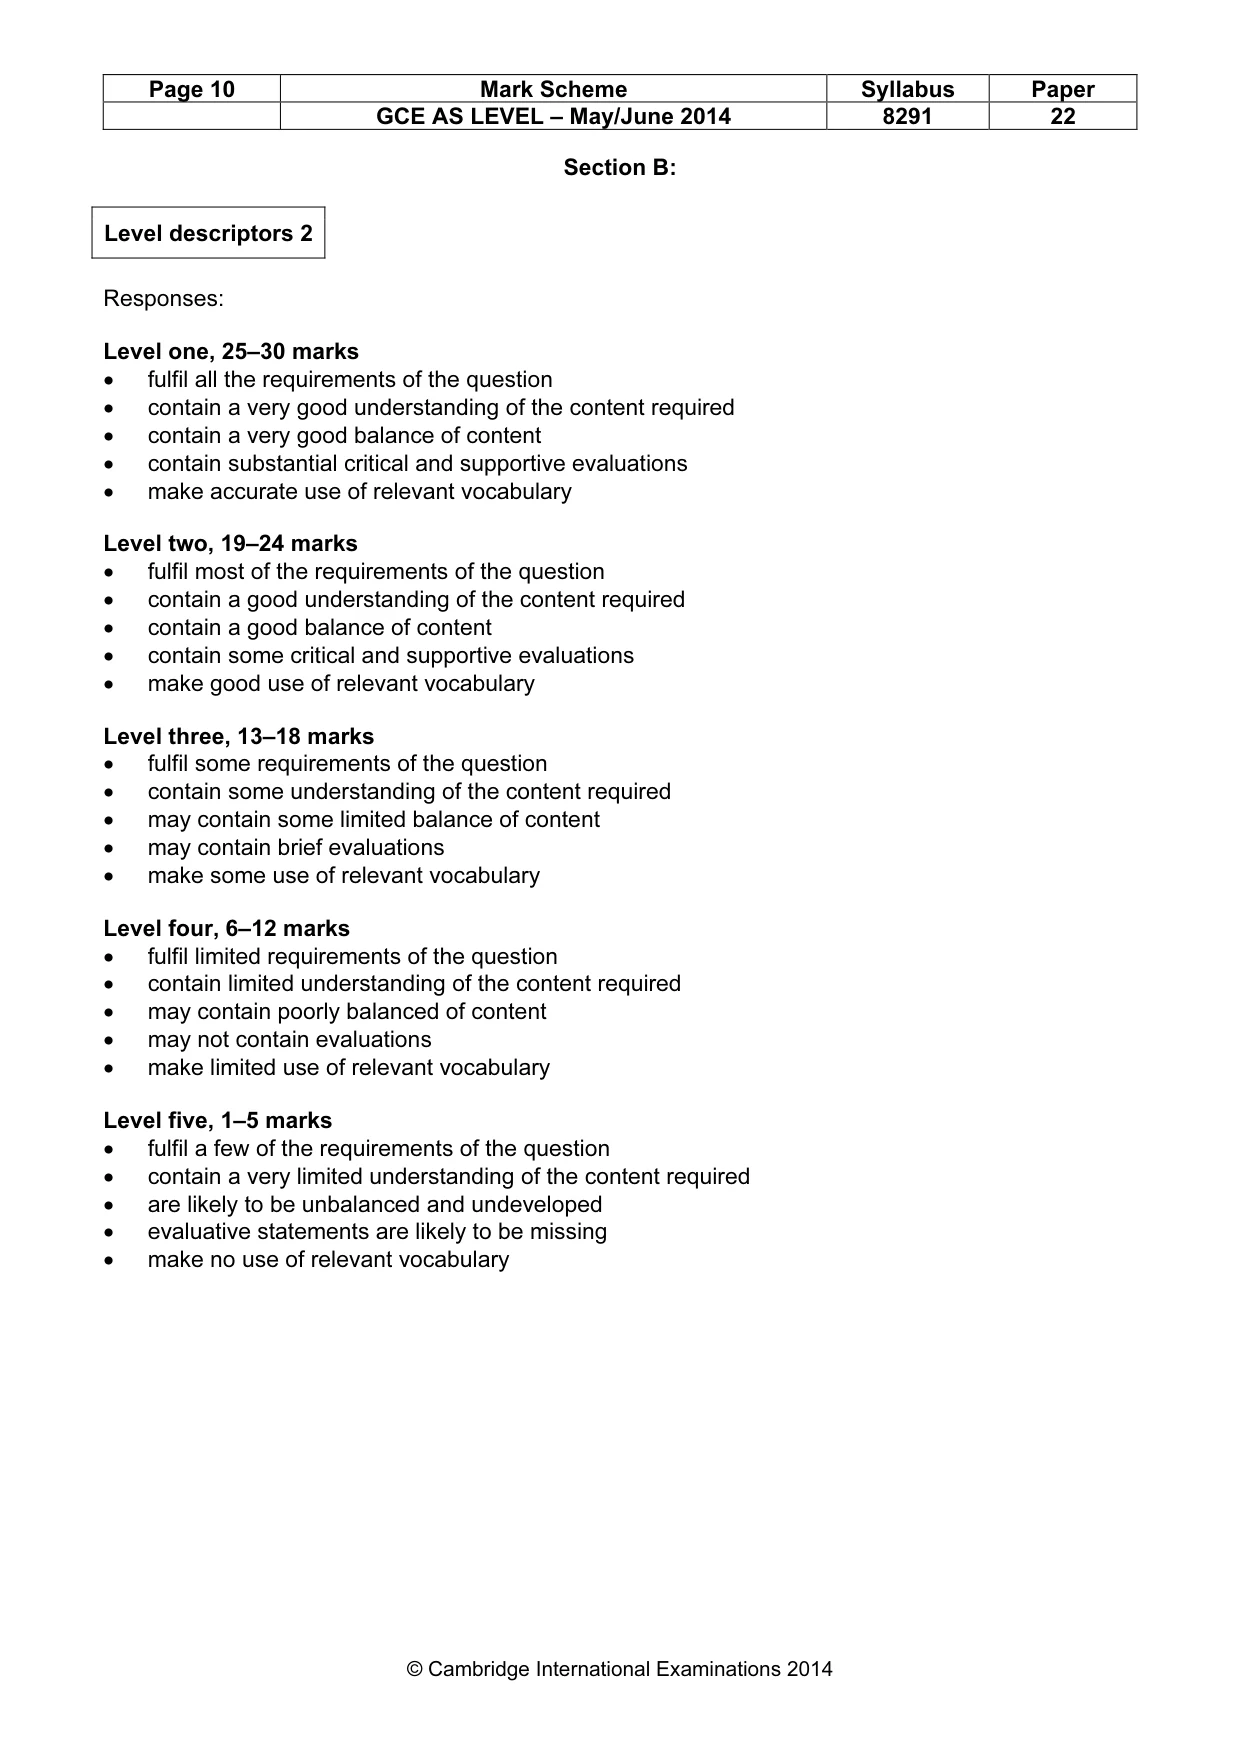
Page 10 Mark Scheme Syllabus Paper GCE AS LEVEL – May/June 2014 8291 22 © Cambridge International Examinations 2014 Section B: Level descriptors 2 Responses: Level one, 25–30 marks • fulfil all the requirements of the question • contain a very good understanding of the content required • contain a very good balance of content • contain substantial critical and supportive evaluations • make accurate use of relevant vocabulary Level two, 19–24 marks • fulfil most of the requirements of the question • contain a good understanding of the content required • contain a good balance of content • contain some critical and supportive evaluations • make good use of relevant vocabulary Level three, 13–18 marks • fulfil some requirements of the question • contain some understanding of the content required • may contain some limited balance of content • may contain brief evaluations • make some use of relevant vocabulary Level four, 6–12 marks • fulfil limited requirements of the question • contain limited understanding of the content required • may contain poorly balanced of content • may not contain evaluations • make limited use of relevant vocabulary Level five, 1–5 marks • fulfil a few of the requirements of the question • contain a very limited understanding of the content required • are likely to be unbalanced and undeveloped • evaluative statements are likely to be missing • make no use of relevant vocabulary
What you needed in this session
Cambridge’s own grade thresholds for 2014 May/June, Paper 2 · Variant 2. A higher threshold means an easier paper — the bar moves with how the cohort did.