Cambridge A Level Environmental Management (AS only) 8291 — 2012 May/June Paper 2 · Variant 2
8291/22/M/J/12 · 80 marks · ≈90 min
The question paper and its mark scheme, free to read here and free to download. This is Cambridge’s own paper, exactly as it was sat.
Question paper12 pages
Mark scheme12 pages
Answers below. Sit the paper first if you are practising.
Paper as text
Question paper, page 1
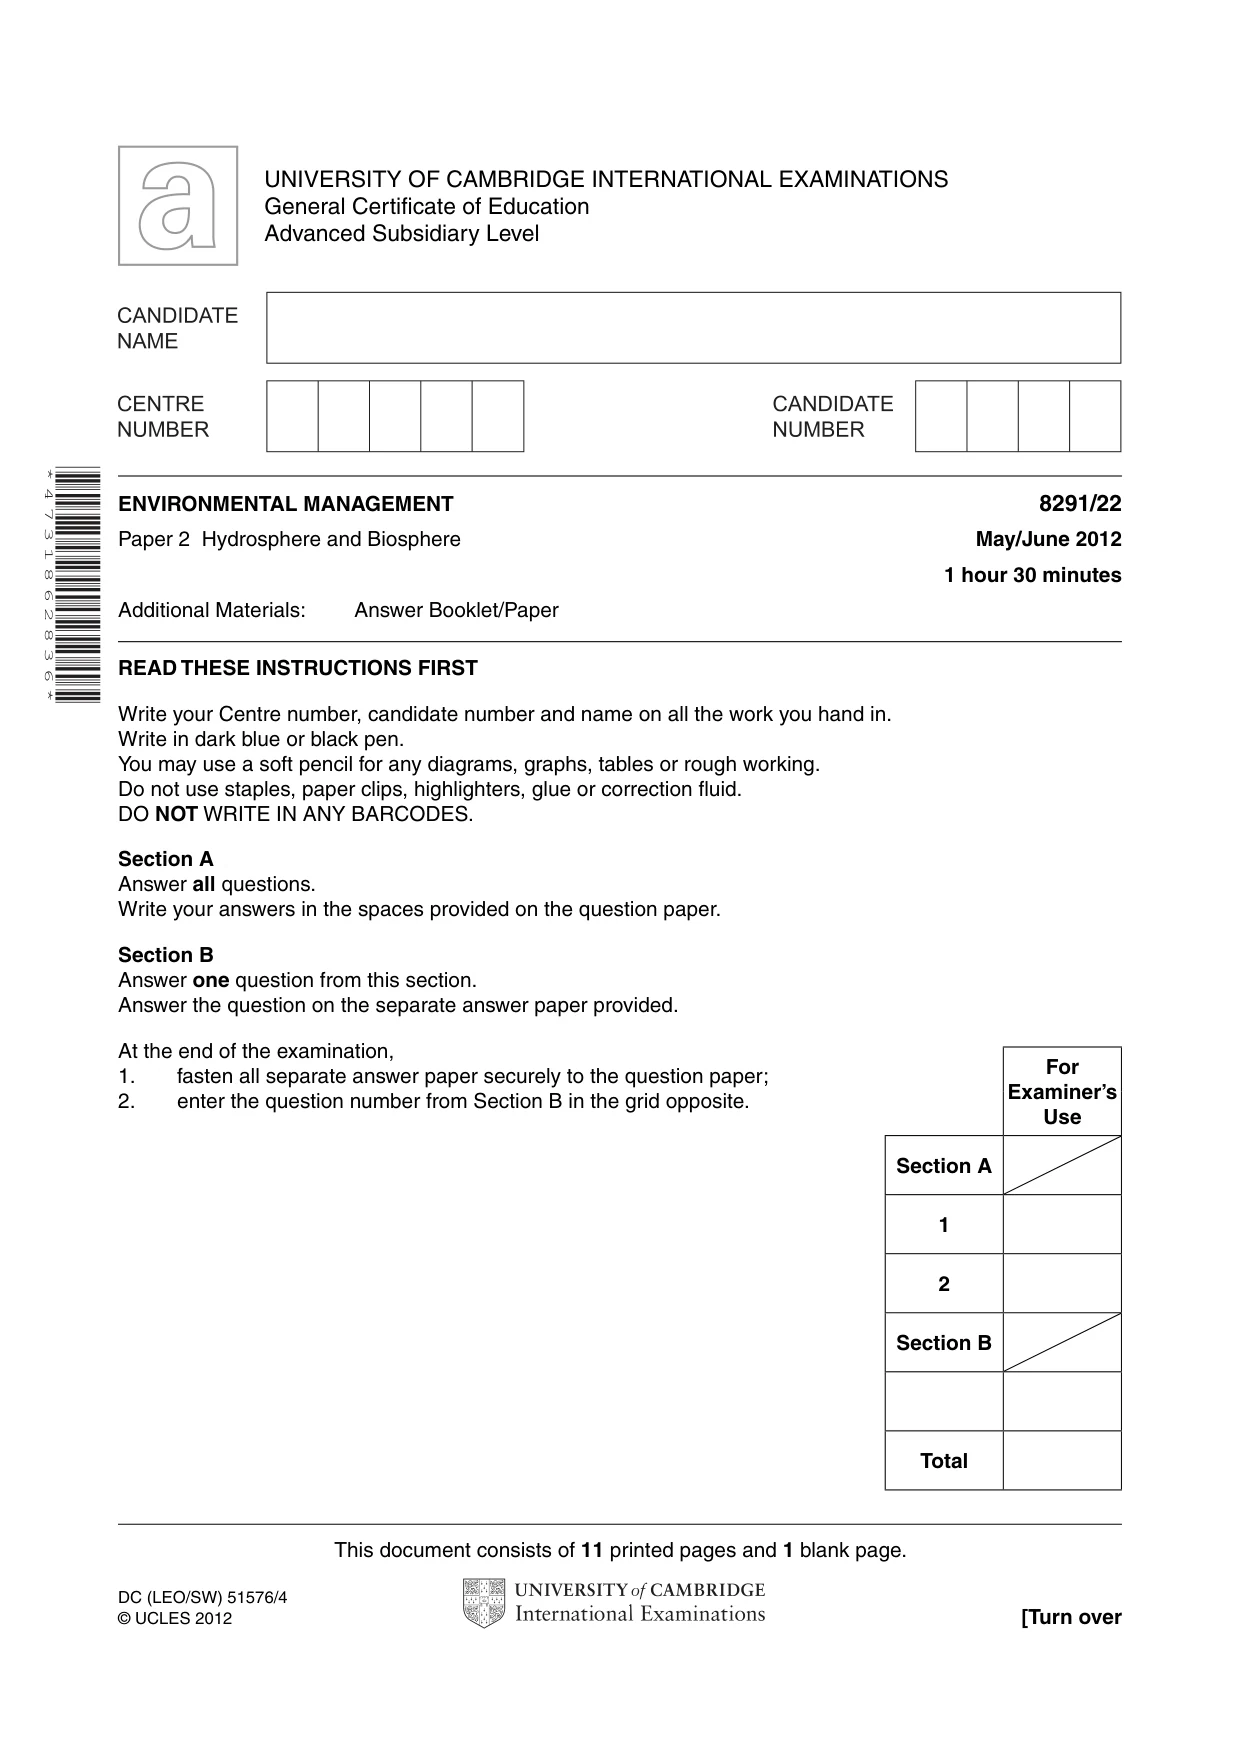
This document consists of 11 printed pages and 1 blank page. DC (LEO/SW) 51576/4 © UCLES 2012 [Turn over UNIVERSITY OF CAMBRIDGE INTERNATIONAL EXAMINATIONS General Certificate of Education Advanced Subsidiary Level * 4 7 3 1 8 6 2 8 3 6 * ENVIRONMENTAL MANAGEMENT 8291/22 Paper 2 Hydrosphere and Biosphere May/June 2012 1 hour 30 minutes Additional Materials: Answer Booklet/Paper READ THESE INSTRUCTIONS FIRST Write your Centre number, candidate number and name on all the work you hand in. Write in dark blue or black pen. You may use a soft pencil for any diagrams, graphs, tables or rough working. Do not use staples, paper clips, highlighters, glue or correction fluid. DO NOT WRITE IN ANY BARCODES. Section A Answer all questions. Write your answers in the spaces provided on the question paper. Section B Answer one question from this section. Answer the question on the separate answer paper provided. At the end of the examination, 1. fasten all separate answer paper securely to the question paper; 2. enter the question number from Section B in the grid opposite. For Examiner’s Use Section A 1 2 Section B Total
Question paper, page 2
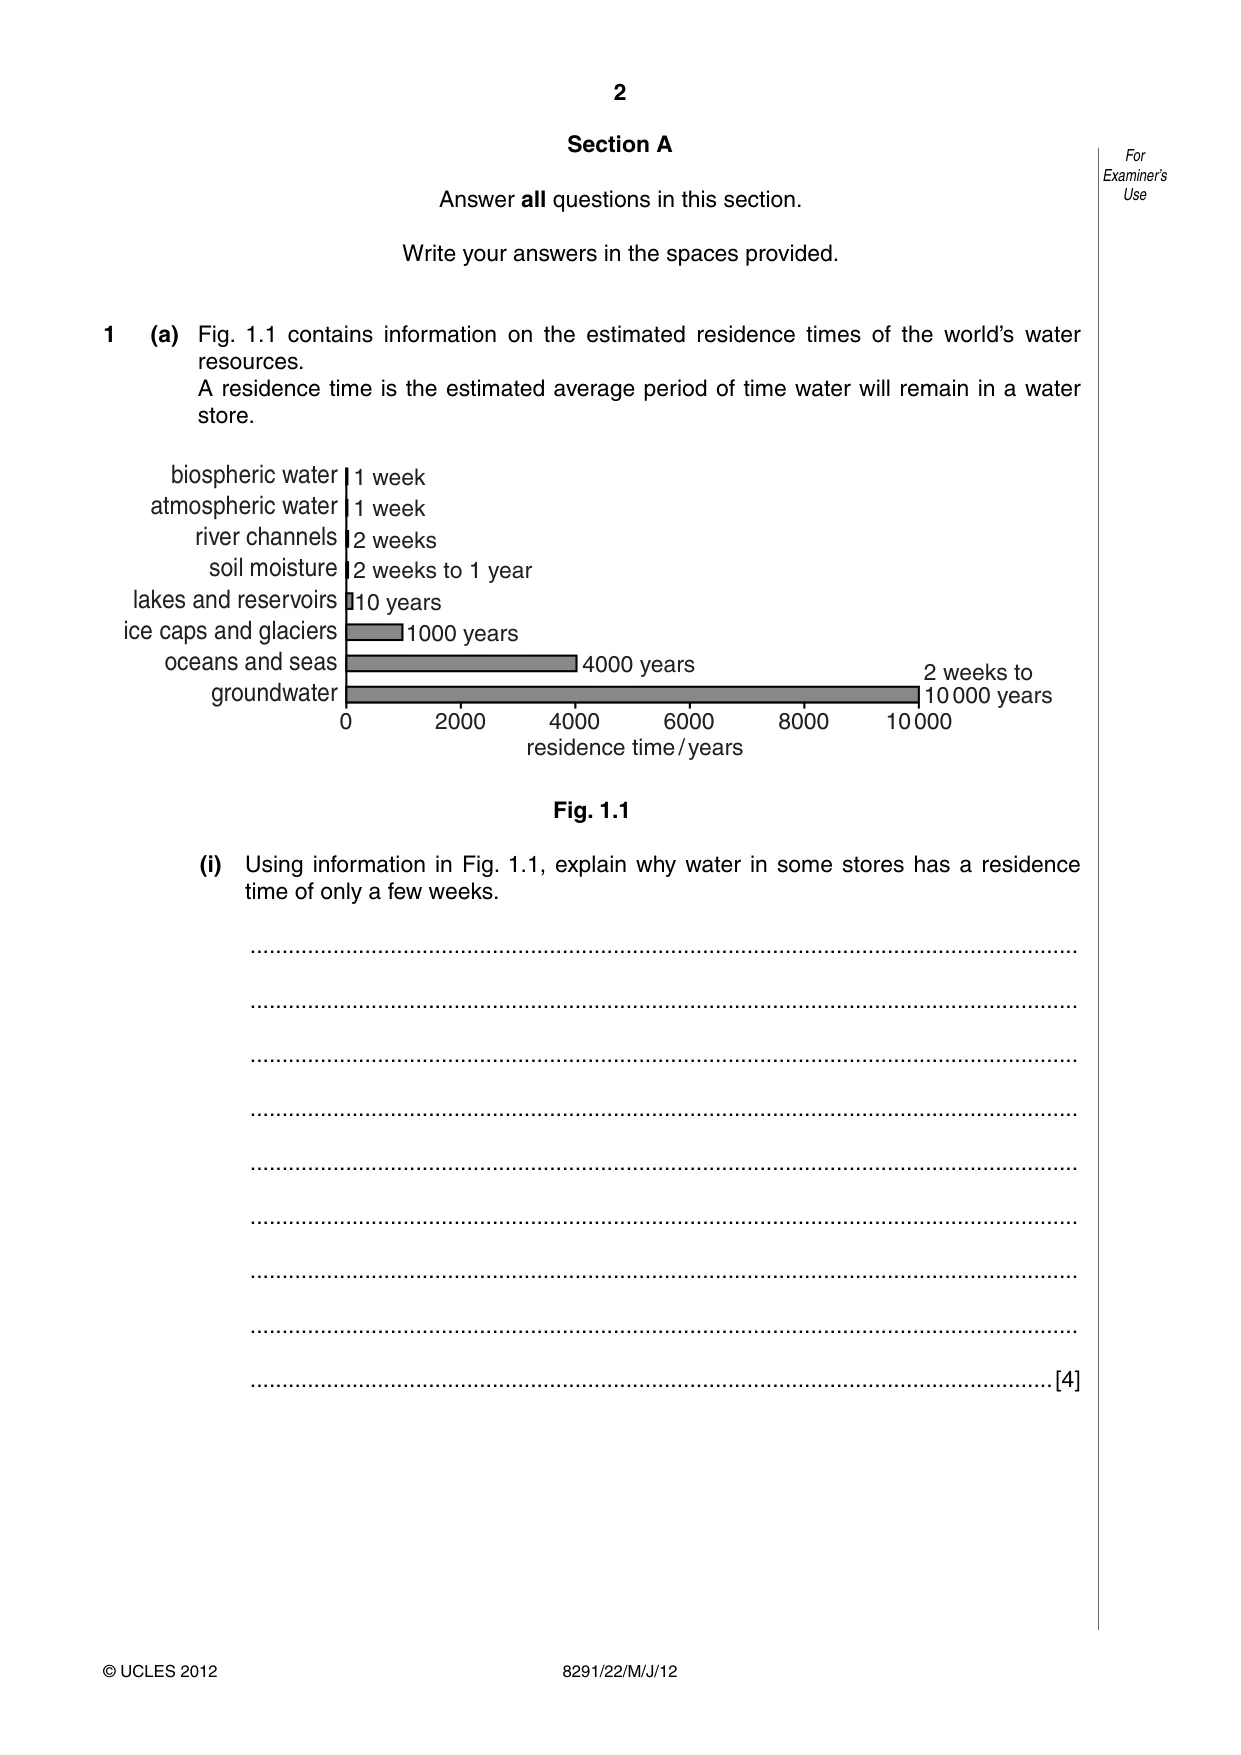
2 8291/22/M/J/12 © UCLES 2012 For Examiner’s Use Section A Answer all questions in this section. Write your answers in the spaces provided. 1 (a) Fig. 1.1 contains information on the estimated residence times of the world’s water resources. A residence time is the estimated average period of time water will remain in a water store. groundwater oceans and seas ice caps and glaciers lakes and reservoirs soil moisture river channels atmospheric water biospheric water 0 2000 4000 4000 years 1000 years 2 weeks to 10 000 years residence time / years 10 years 2 weeks to 1 year 2 weeks 1 week 1 week 6000 8000 10 000 Fig. 1.1 (i) Using information in Fig. 1.1, explain why water in some stores has a residence time of only a few weeks. … … … … … … … … …[4]
Question paper, page 3
3 8291/22/M/J/12 © UCLES 2012 [Turn over For Examiner’s Use (ii) Using information from Fig. 1.1 explain the estimated residence times for those stores of 1000 years or more. … … … … … … … … …[4] (iii) Outline why a recognition of water residence times is important to human activity. … … … …[2]
Question paper, page 4
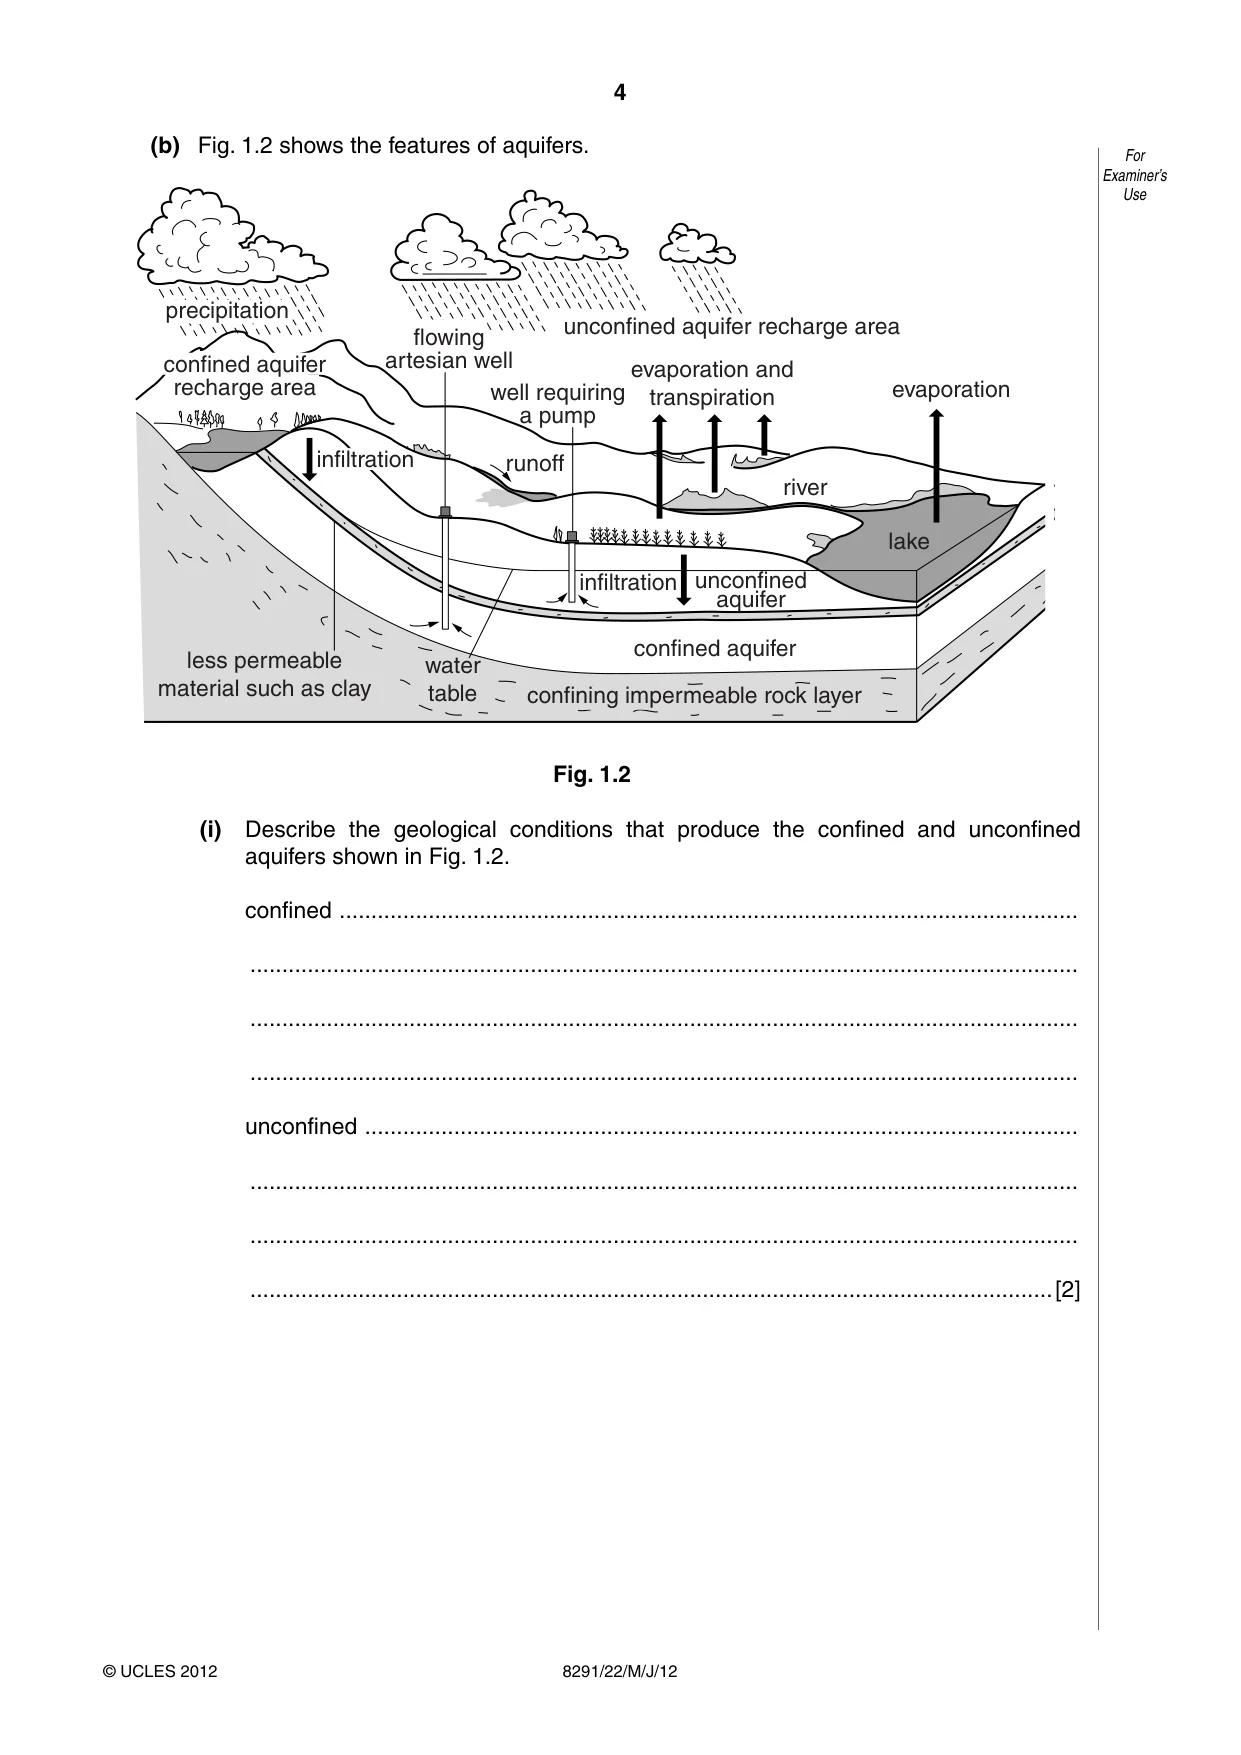
4 8291/22/M/J/12 © UCLES 2012 For Examiner’s Use (b) Fig. 1.2 shows the features of aquifers. flowing artesian well precipitation well requiring a pump unconfined aquifer recharge area evaporation river runoff confined aquifer unconfined aquifer lake water table infiltration confined aquifer recharge area less permeable material such as clay confining impermeable rock layer evaporation and transpiration infiltration Fig. 1.2 (i) Describe the geological conditions that produce the confined and unconfined aquifers shown in Fig. 1.2. confined … … … … unconfined … … … …[2]
Question paper, page 5
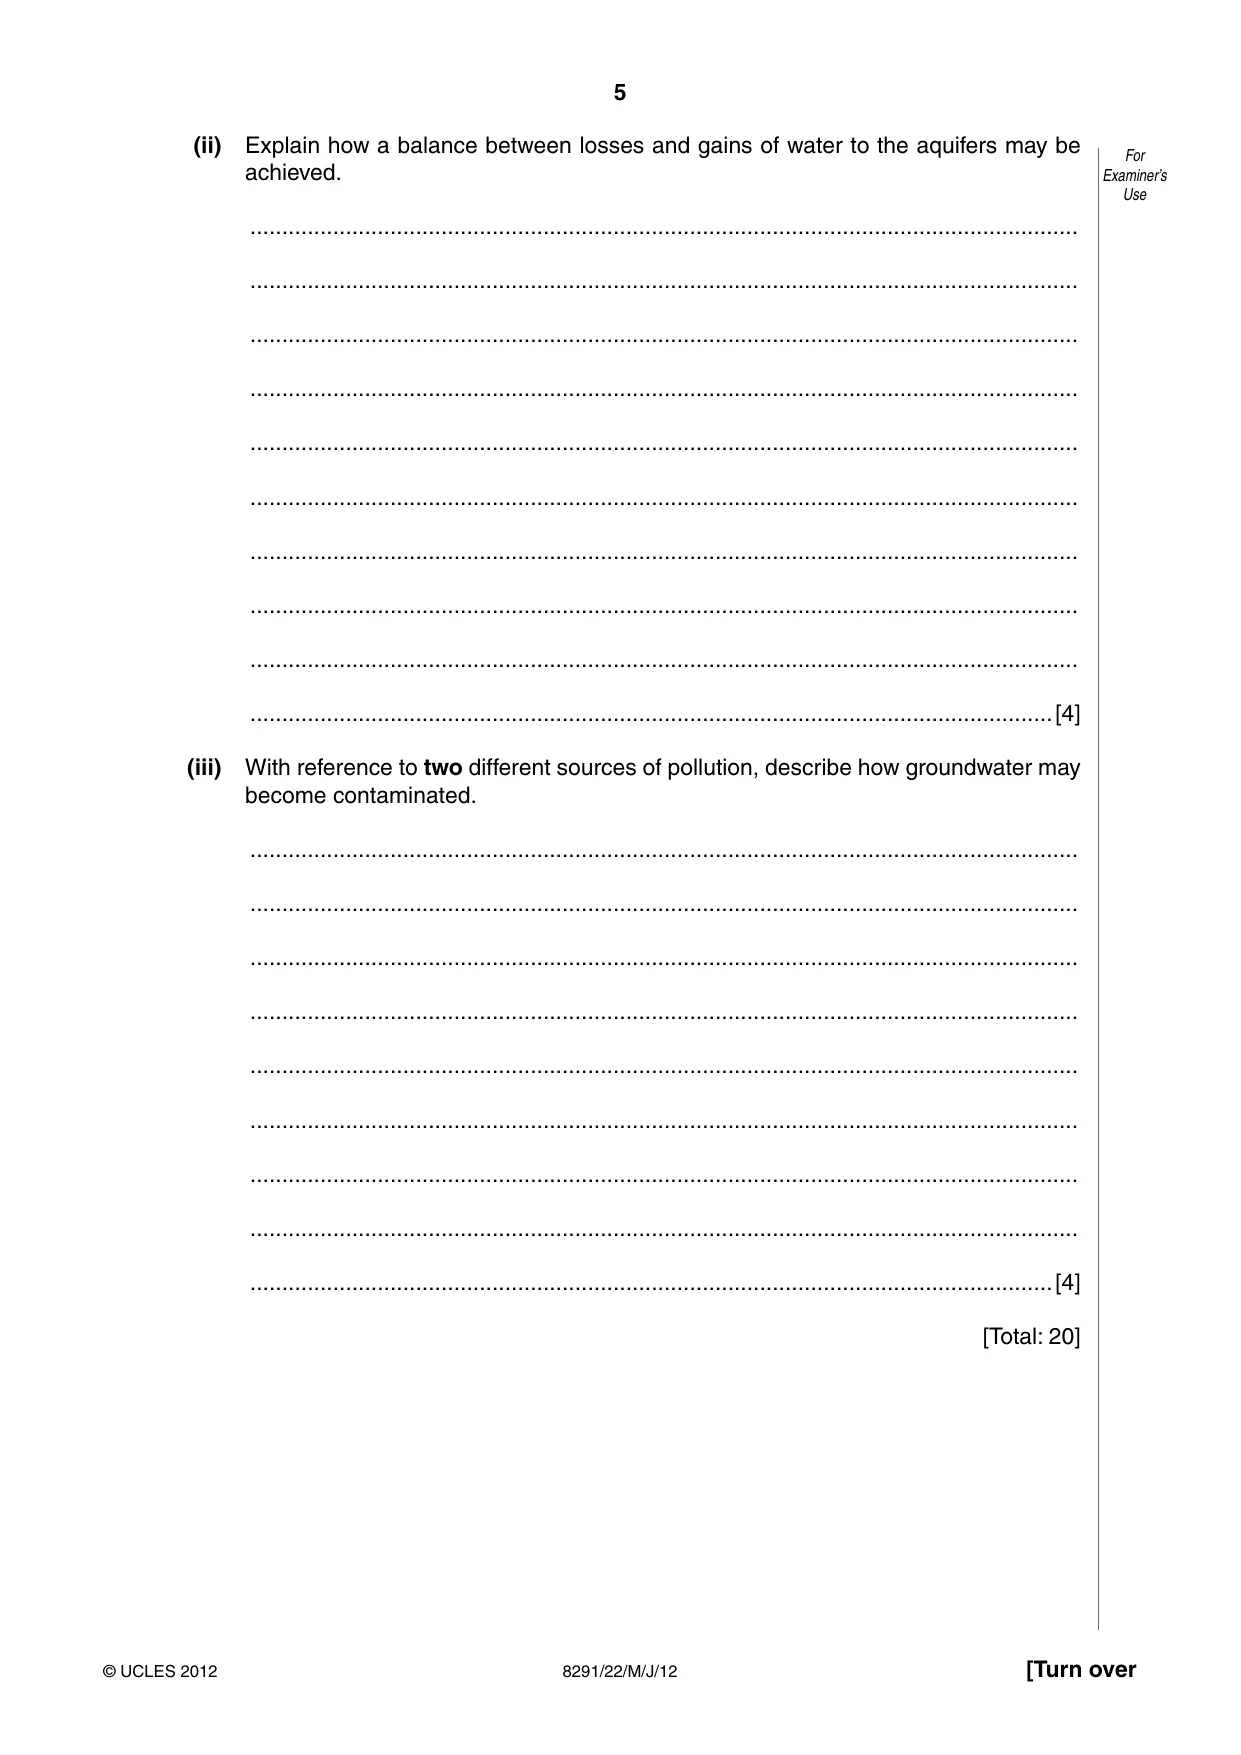
5 8291/22/M/J/12 © UCLES 2012 [Turn over For Examiner’s Use (ii) Explain how a balance between losses and gains of water to the aquifers may be achieved. … … … … … … … … … …[4] (iii) With reference to two different sources of pollution, describe how groundwater may become contaminated. … … … … … … … … …[4] [Total: 20]
Question paper, page 6
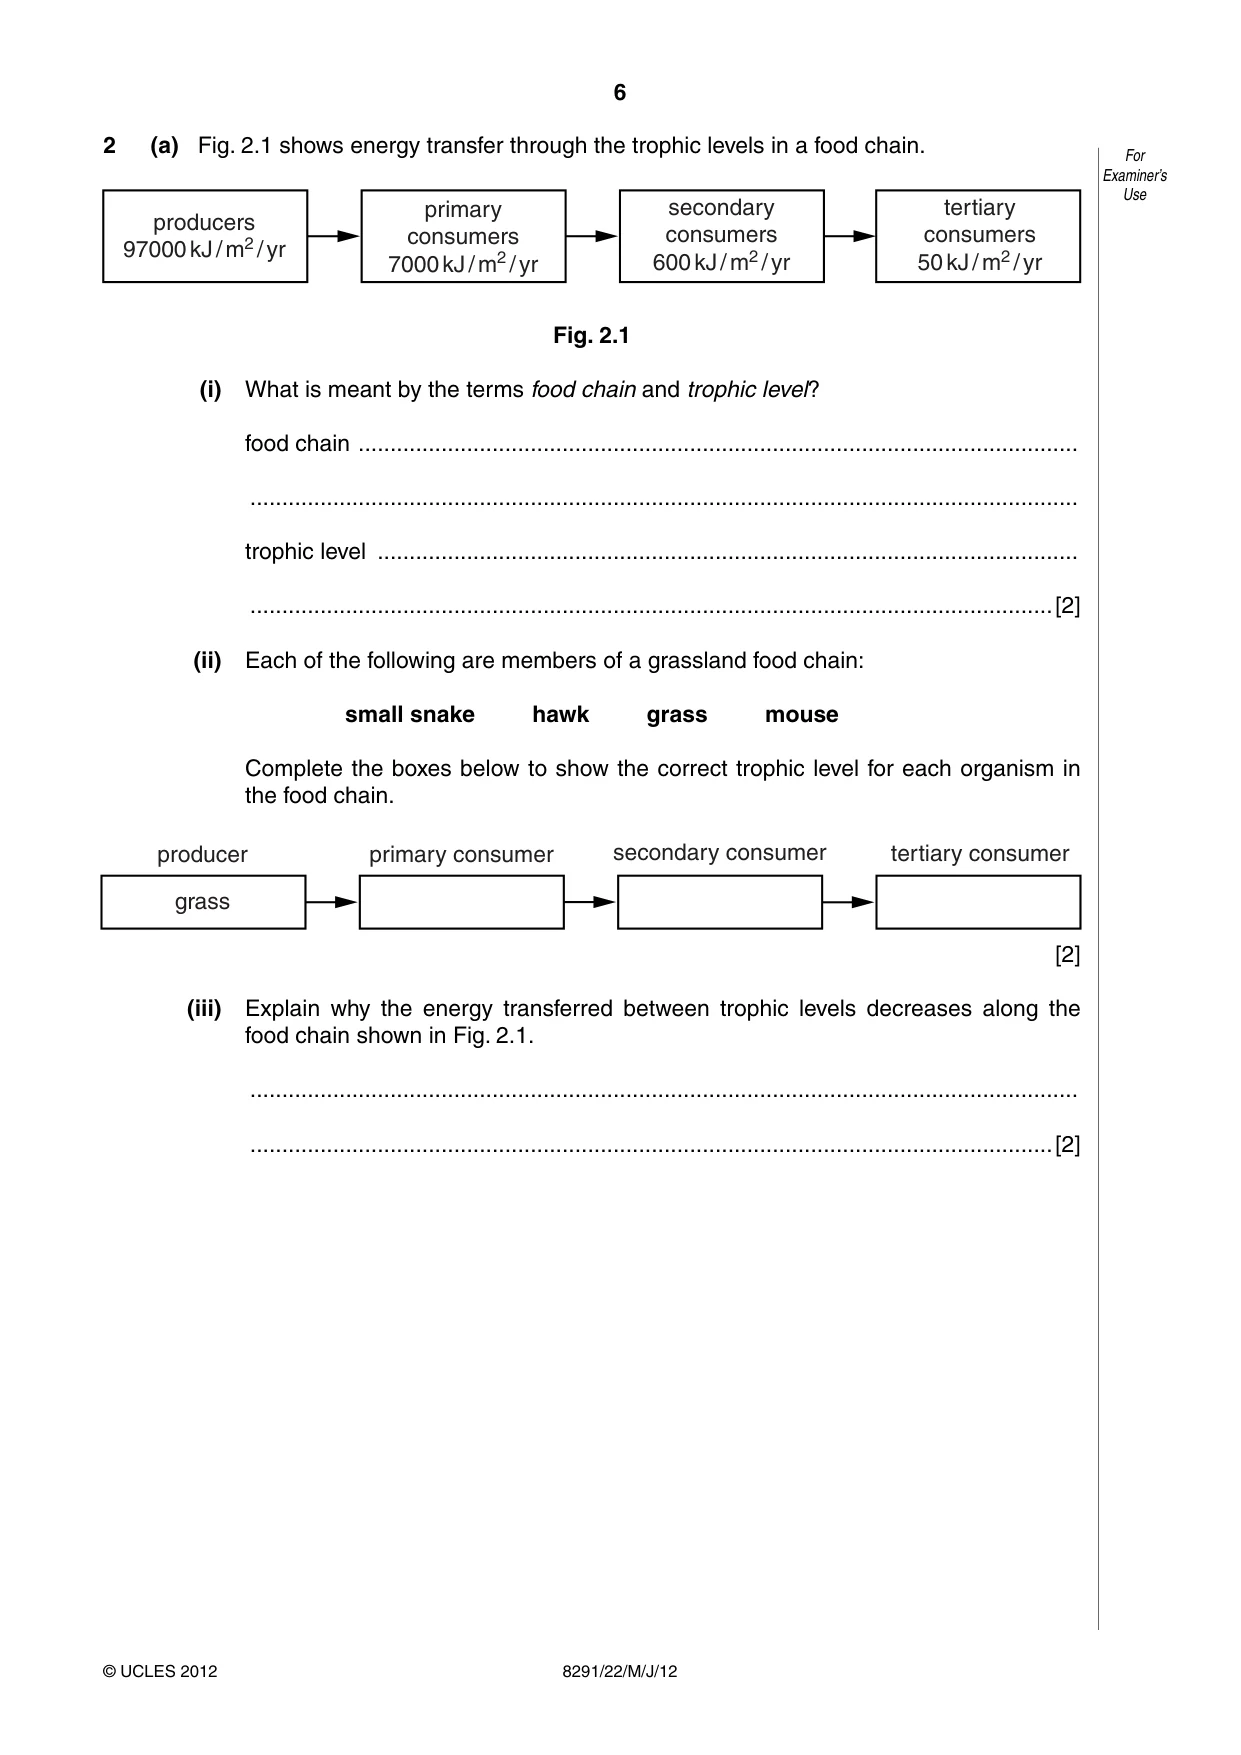
6 8291/22/M/J/12 © UCLES 2012 For Examiner’s Use 2 (a) Fig. 2.1 shows energy transfer through the trophic levels in a food chain. producers 97000 kJ / m2 / yr primary consumers 7000 kJ / m2 / yr secondary consumers 600 kJ / m2 / yr tertiary consumers 50 kJ / m2 / yr Fig. 2.1 (i) What is meant by the terms food chain and trophic level? food chain … … trophic level … …[2] (ii) Each of the following are members of a grassland food chain: small snake hawk grass mouse Complete the boxes below to show the correct trophic level for each organism in the food chain. producer grass primary consumer secondary consumer tertiary consumer [2] (iii) Explain why the energy transferred between trophic levels decreases along the food chain shown in Fig. 2.1. … …[2]
Question paper, page 7
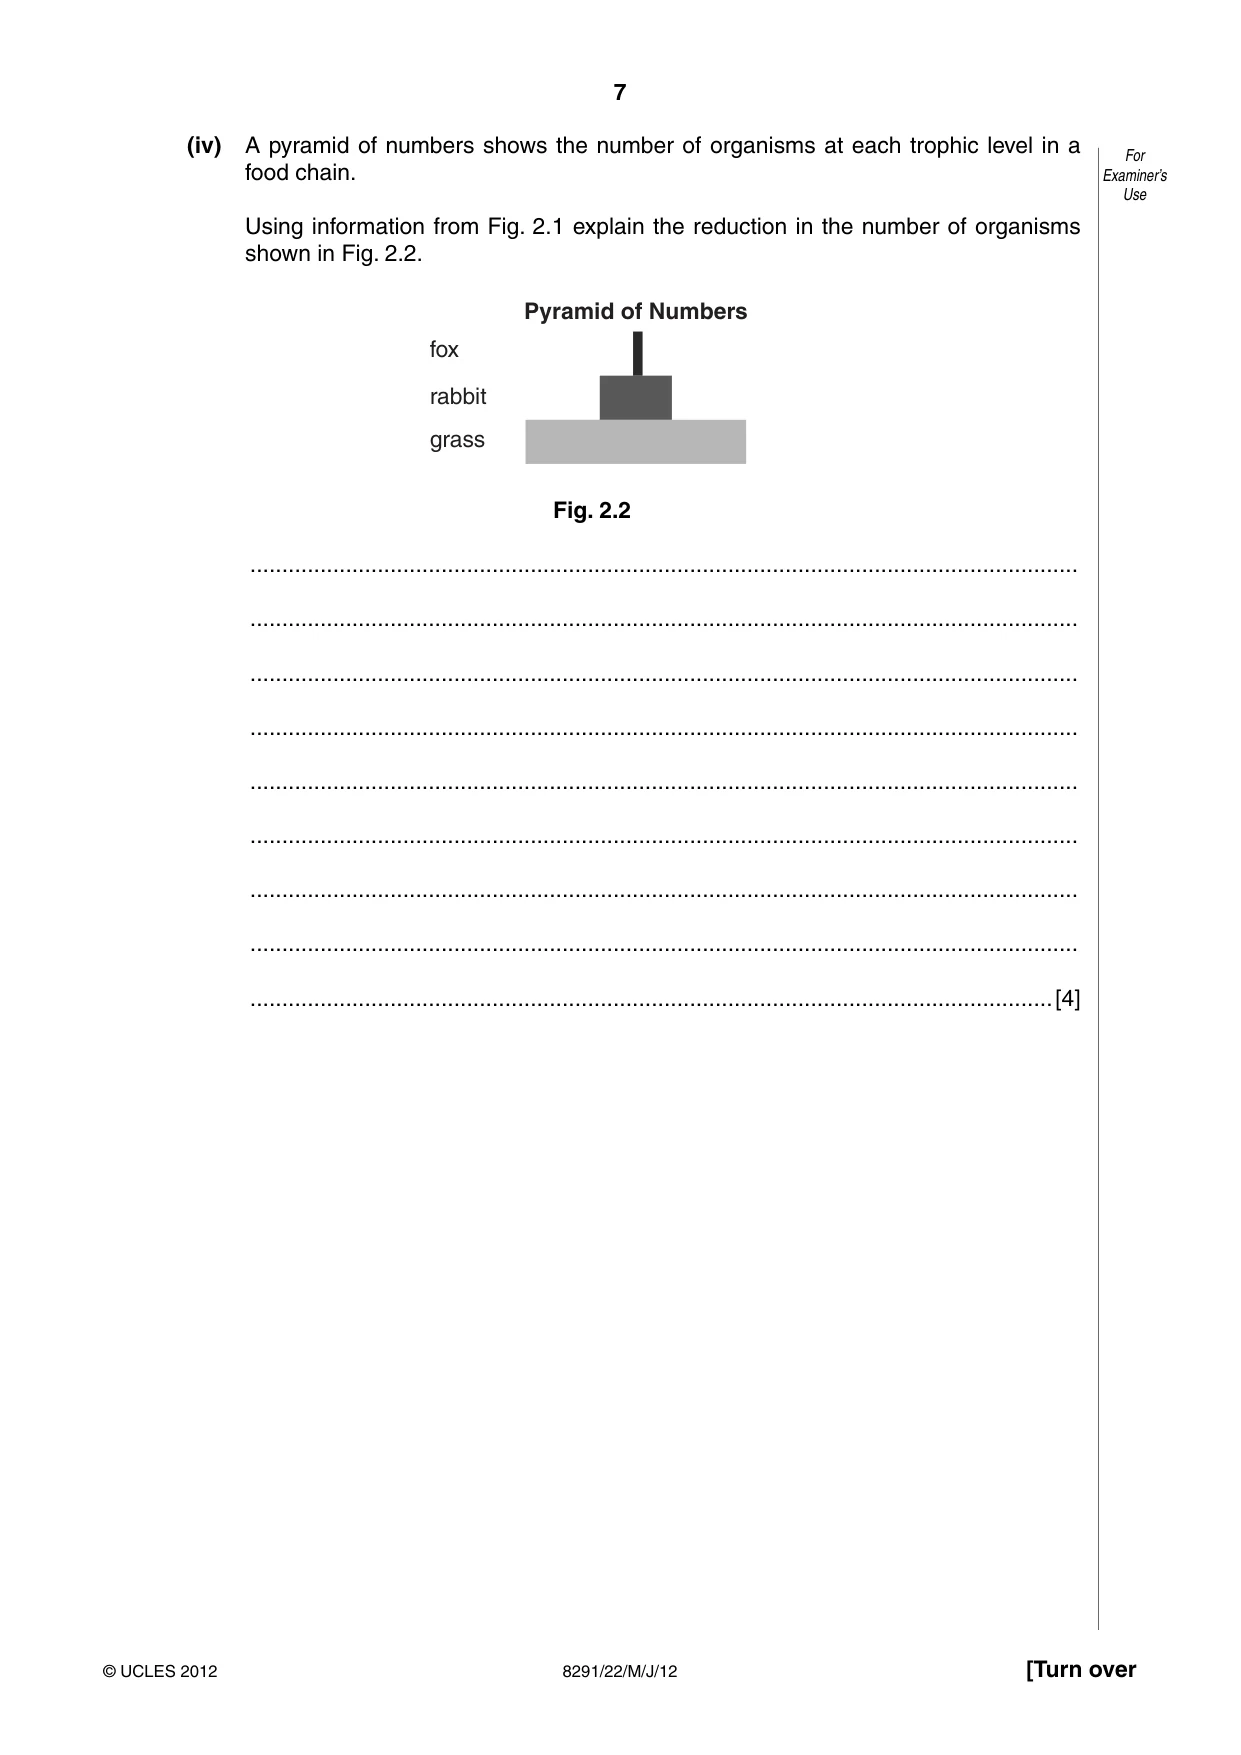
7 8291/22/M/J/12 © UCLES 2012 [Turn over For Examiner’s Use (iv) A pyramid of numbers shows the number of organisms at each trophic level in a food chain. Using information from Fig. 2.1 explain the reduction in the number of organisms shown in Fig. 2.2. fox rabbit grass Pyramid of Numbers Fig. 2.2 … … … … … … … … …[4]
Question paper, page 8
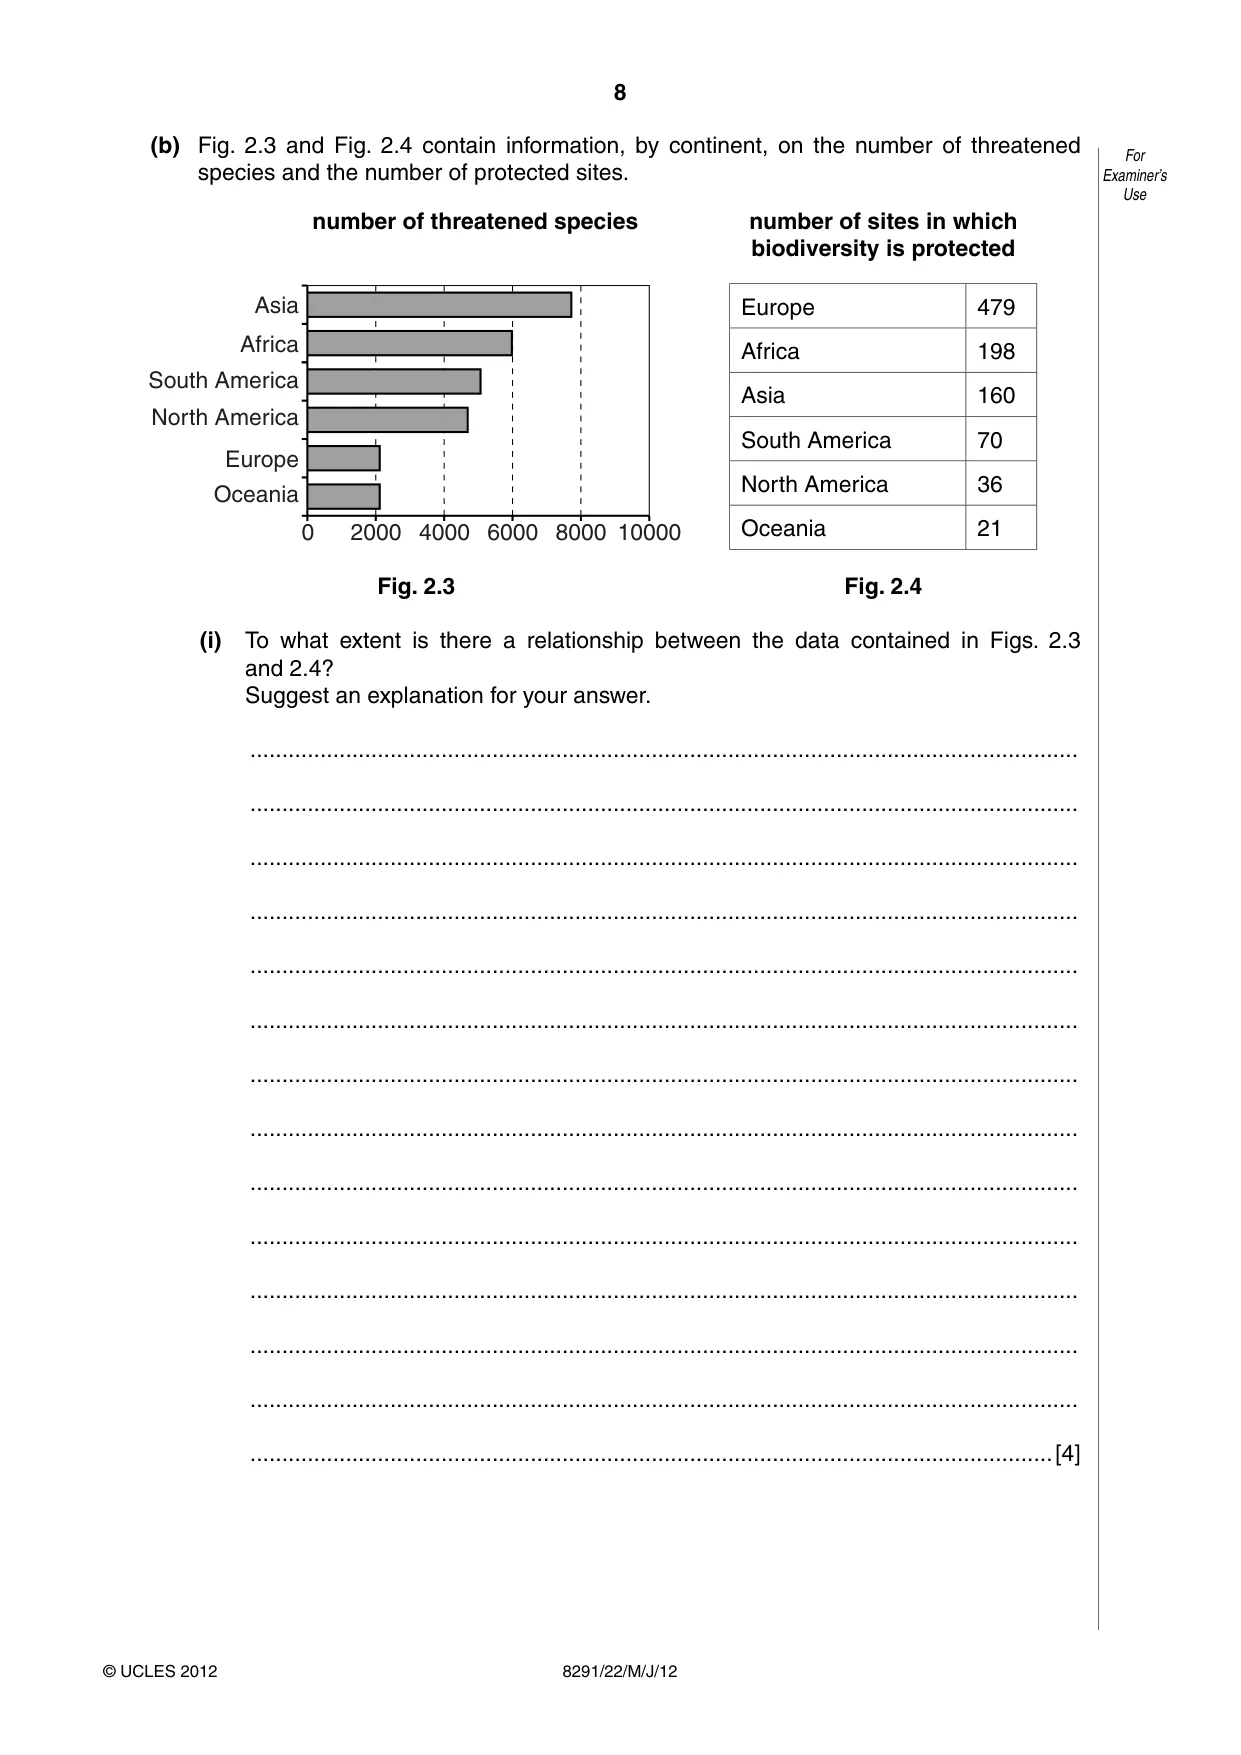
8 8291/22/M/J/12 © UCLES 2012 For Examiner’s Use (b) Fig. 2.3 and Fig. 2.4 contain information, by continent, on the number of threatened species and the number of protected sites. Asia Africa South America North America Europe Oceania 0 2000 4000 6000 8000 10000 number of threatened species Europe 479 Africa 198 Asia 160 South America 70 North America 36 Oceania 21 number of sites in which biodiversity is protected Fig. 2.3 Fig. 2.4 (i) To what extent is there a relationship between the data contained in Figs. 2.3 and 2.4? Suggest an explanation for your answer. … … … … … … … … … … … … … …[4]
Question paper, page 9
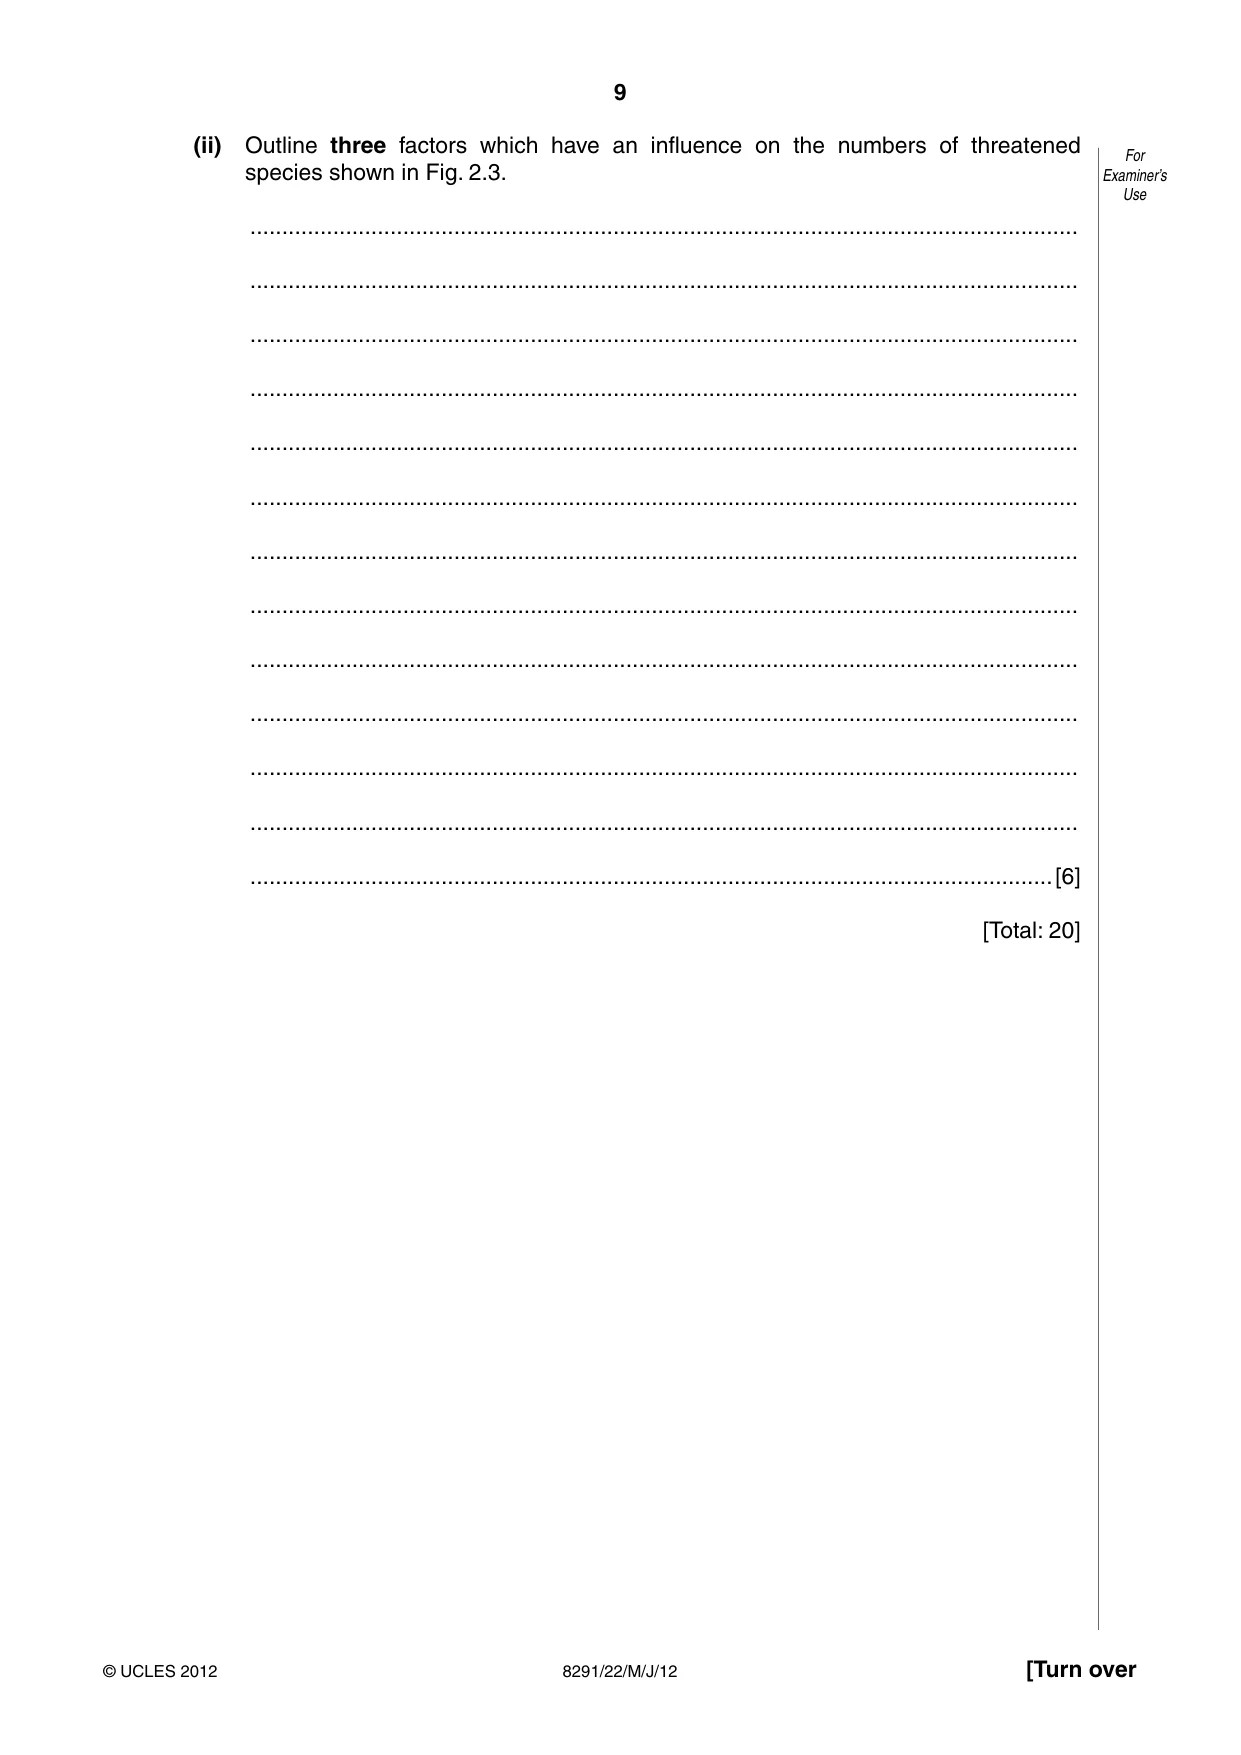
9 8291/22/M/J/12 © UCLES 2012 [Turn over For Examiner’s Use (ii) Outline three factors which have an influence on the numbers of threatened species shown in Fig. 2.3. … … … … … … … … … … … … …[6] [Total: 20]
Question paper, page 10
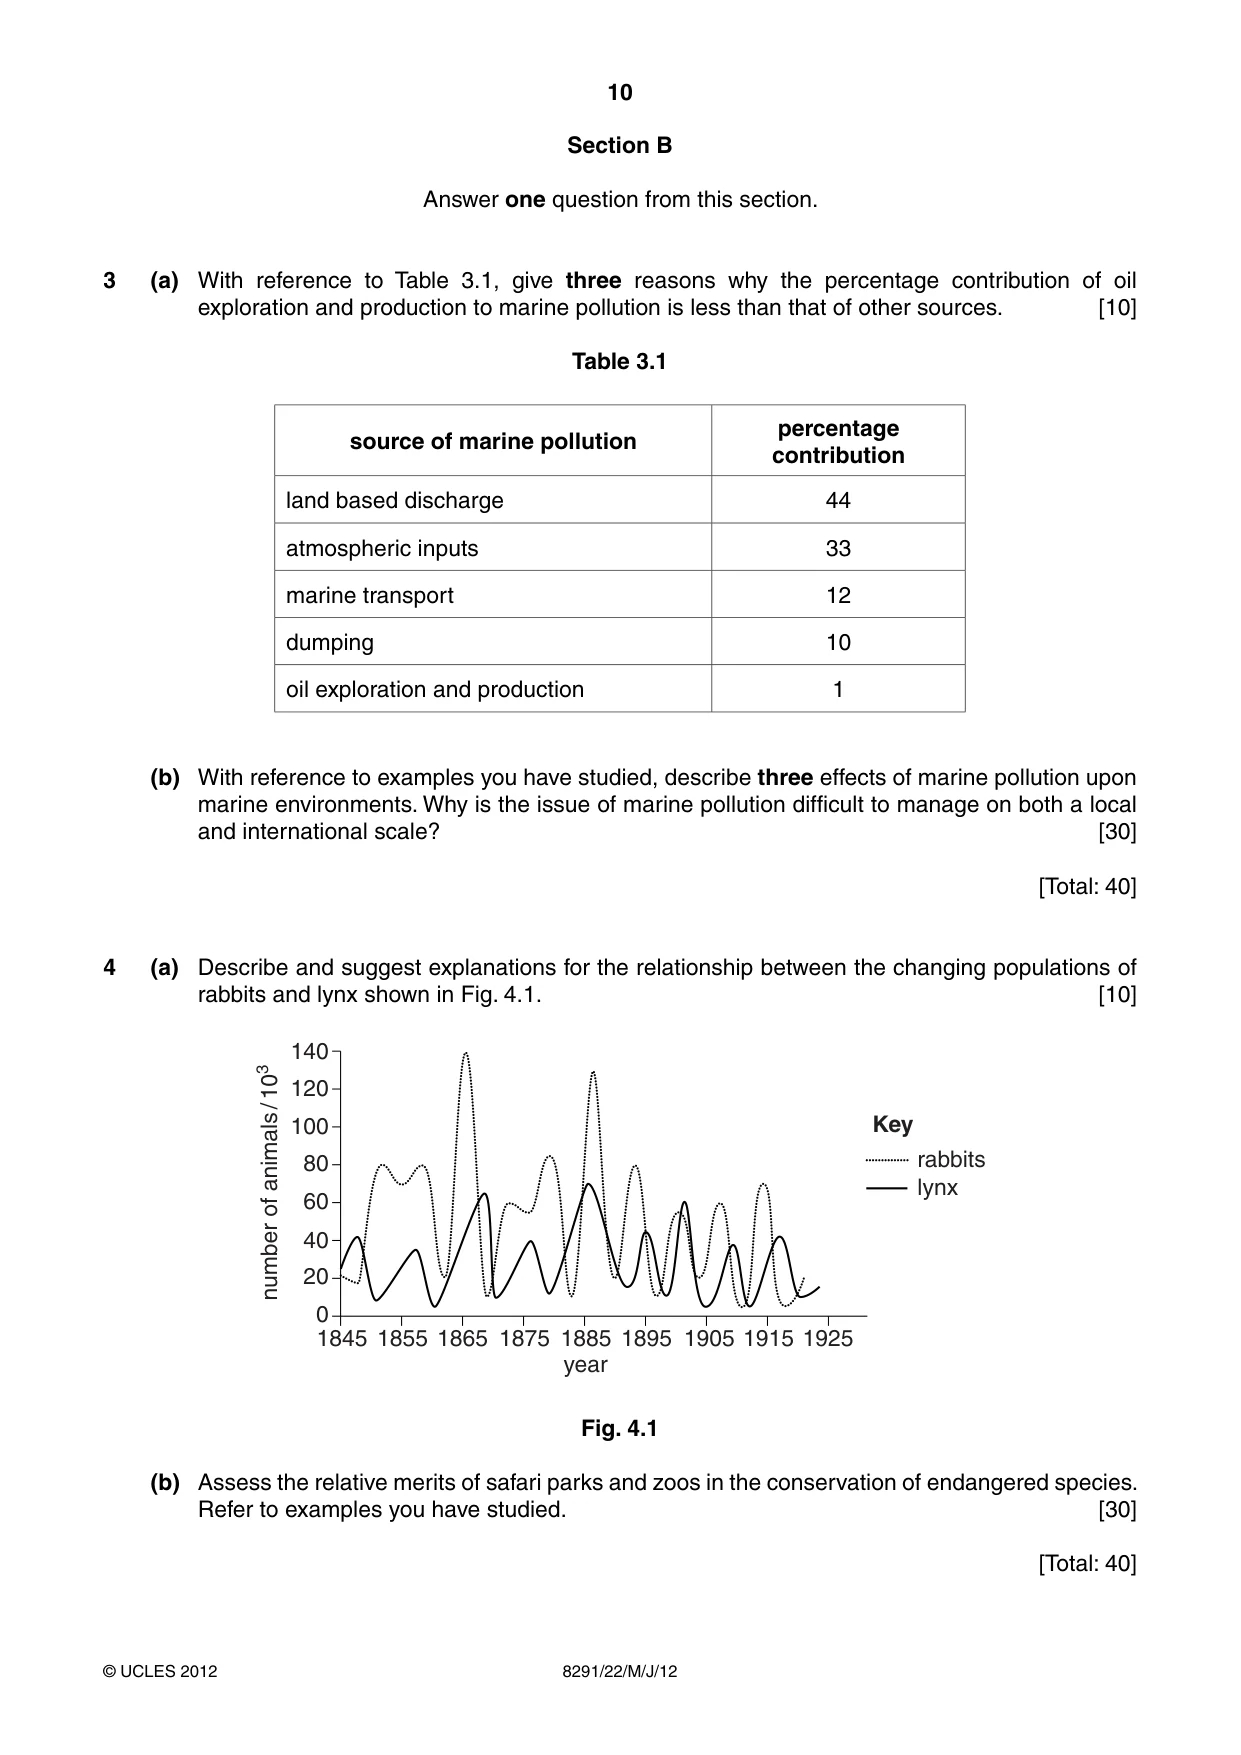
10 8291/22/M/J/12 © UCLES 2012 Section B Answer one question from this section. 3 (a) With reference to Table 3.1, give three reasons why the percentage contribution of oil exploration and production to marine pollution is less than that of other sources. [10] Table 3.1 source of marine pollution percentage contribution land based discharge 44 atmospheric inputs 33 marine transport 12 dumping 10 oil exploration and production 1 (b) With reference to examples you have studied, describe three effects of marine pollution upon marine environments. Why is the issue of marine pollution difficult to manage on both a local and international scale? [30] [Total: 40] 4 (a) Describe and suggest explanations for the relationship between the changing populations of rabbits and lynx shown in Fig. 4.1. [10] 140 120 100 80 60 40 20 0 1845 1855 1865 1875 1895 1885 year number of animals / 103 1905 1915 1925 rabbits lynx Key Fig. 4.1 (b) Assess the relative merits of safari parks and zoos in the conservation of endangered species. Refer to examples you have studied. [30] [Total: 40]
Question paper, page 11
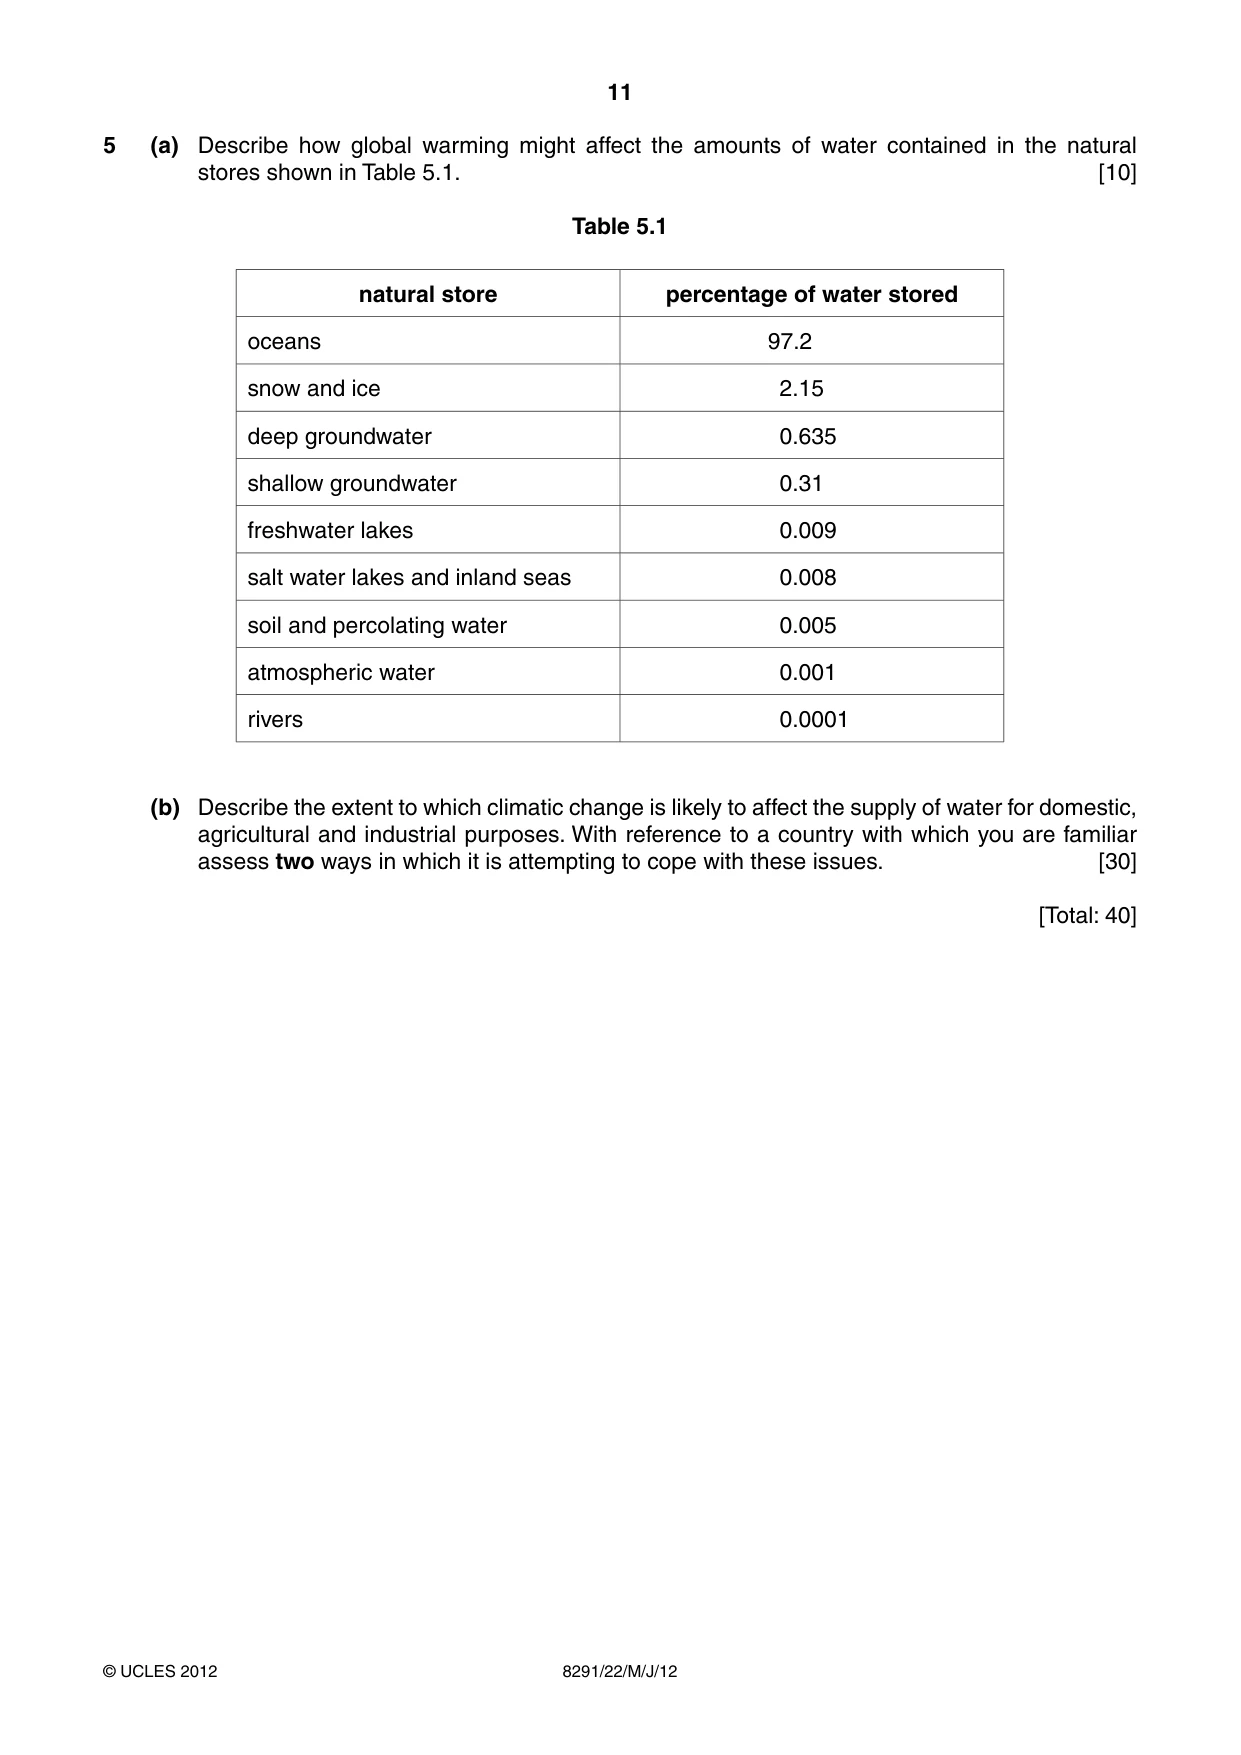
11 8291/22/M/J/12 © UCLES 2012 5 (a) Describe how global warming might affect the amounts of water contained in the natural stores shown in Table 5.1. [10] Table 5.1 natural store percentage of water stored oceans 97.2 snow and ice 2.15 deep groundwater 0.635 shallow groundwater 0.31 freshwater lakes 0.009 salt water lakes and inland seas 0.008 soil and percolating water 0.005 atmospheric water 0.001 rivers 0.0001 (b) Describe the extent to which climatic change is likely to affect the supply of water for domestic, agricultural and industrial purposes. With reference to a country with which you are familiar assess two ways in which it is attempting to cope with these issues. [30] [Total: 40]
Question paper, page 12
12 8291/22/M/J/12 © UCLES 2012 BLANK PAGE Copyright Acknowledgements: Question 1a Figure 1.1 © http://maps.grida.no/go/graphic/world_s_water_cycle_schematic_and_residence_time. Question 1b Figure 1.2 © http://www2.mcdaniel.edu/Biology/EPS04/foodprod/aquifer.gif. Question 4a Figure 4.1 © carrier.pbwalls.com. Permission to reproduce items where third-party owned material protected by copyright is included has been sought and cleared where possible. Every reasonable effort has been made by the publisher (UCLES) to trace copyright holders, but if any items requiring clearance have unwittingly been included, the publisher will be pleased to make amends at the earliest possible opportunity. University of Cambridge International Examinations is part of the Cambridge Assessment Group. Cambridge Assessment is the brand name of University of Cambridge Local Examinations Syndicate (UCLES), which is itself a department of the University of Cambridge.
Mark scheme, page 1
UNIVERSITY OF CAMBRIDGE INTERNATIONAL EXAMINATIONS GCE Advanced Subsidiary Level MARK SCHEME for the May/June 2012 question paper for the guidance of teachers 8291 ENVIRONMENTAL MANAGEMENT 8291/22 Paper 2, maximum raw mark 80 This mark scheme is published as an aid to teachers and candidates, to indicate the requirements of the examination. It shows the basis on which Examiners were instructed to award marks. It does not indicate the details of the discussions that took place at an Examiners’ meeting before marking began, which would have considered the acceptability of alternative answers. Mark schemes must be read in conjunction with the question papers and the report on the examination. • Cambridge will not enter into discussions or correspondence in connection with these mark schemes. Cambridge is publishing the mark schemes for the May/June 2012 question papers for most IGCSE, GCE Advanced Level and Advanced Subsidiary Level syllabuses and some Ordinary Level syllabuses.
Mark scheme, page 2
Page 2 Mark Scheme: Teachers’ version Syllabus Paper GCE AS LEVEL – May/June 2012 8291 22 © University of Cambridge International Examinations 2012 General notes Symbols used in Environmental Management mark schemes. / separates alternatives for a marking point – other valid ways of expressing the same idea are also credited ; separates points for the award of a mark [3] indicates the number of marks available [max 3] the number shows the maximum number of marks available for the question where there are more marking points than total marks available [max 3] when part of the marks of a question must come from part of the mark scheme, this is indicated by non-bold marks showing the internal maxima for different parts of the question these non-bold marks are also used to show marks for bands where banded mark schemes are used italic indicates that this is information about the marking points and is not required to gain credit italic text is also used for comments about alternatives that should be accepted, ignored or rejected ora or reverse argument – shows that an argument from an alternative viewpoint will be credited AW alternative wording, sometimes called ‘or words to that effect’ – AW is used when there are many different ways of expressing the same idea ( ) the word / phrase in brackets is not required to gain marks but sets the context of the response for credit e.g. (nuclear) waste – nuclear is not needed but if it was described as a domestic waste then no mark is awarded volcanic underlined words – the answer must contain exactly this word ecf error carried forward – if an incorrect answer is given to part of a question, and this answer is subsequently used by a candidate in later parts of the question, this indicates that the candidate’s incorrect answer will be used as a starting point for marking the later parts of the question
Mark scheme, page 3
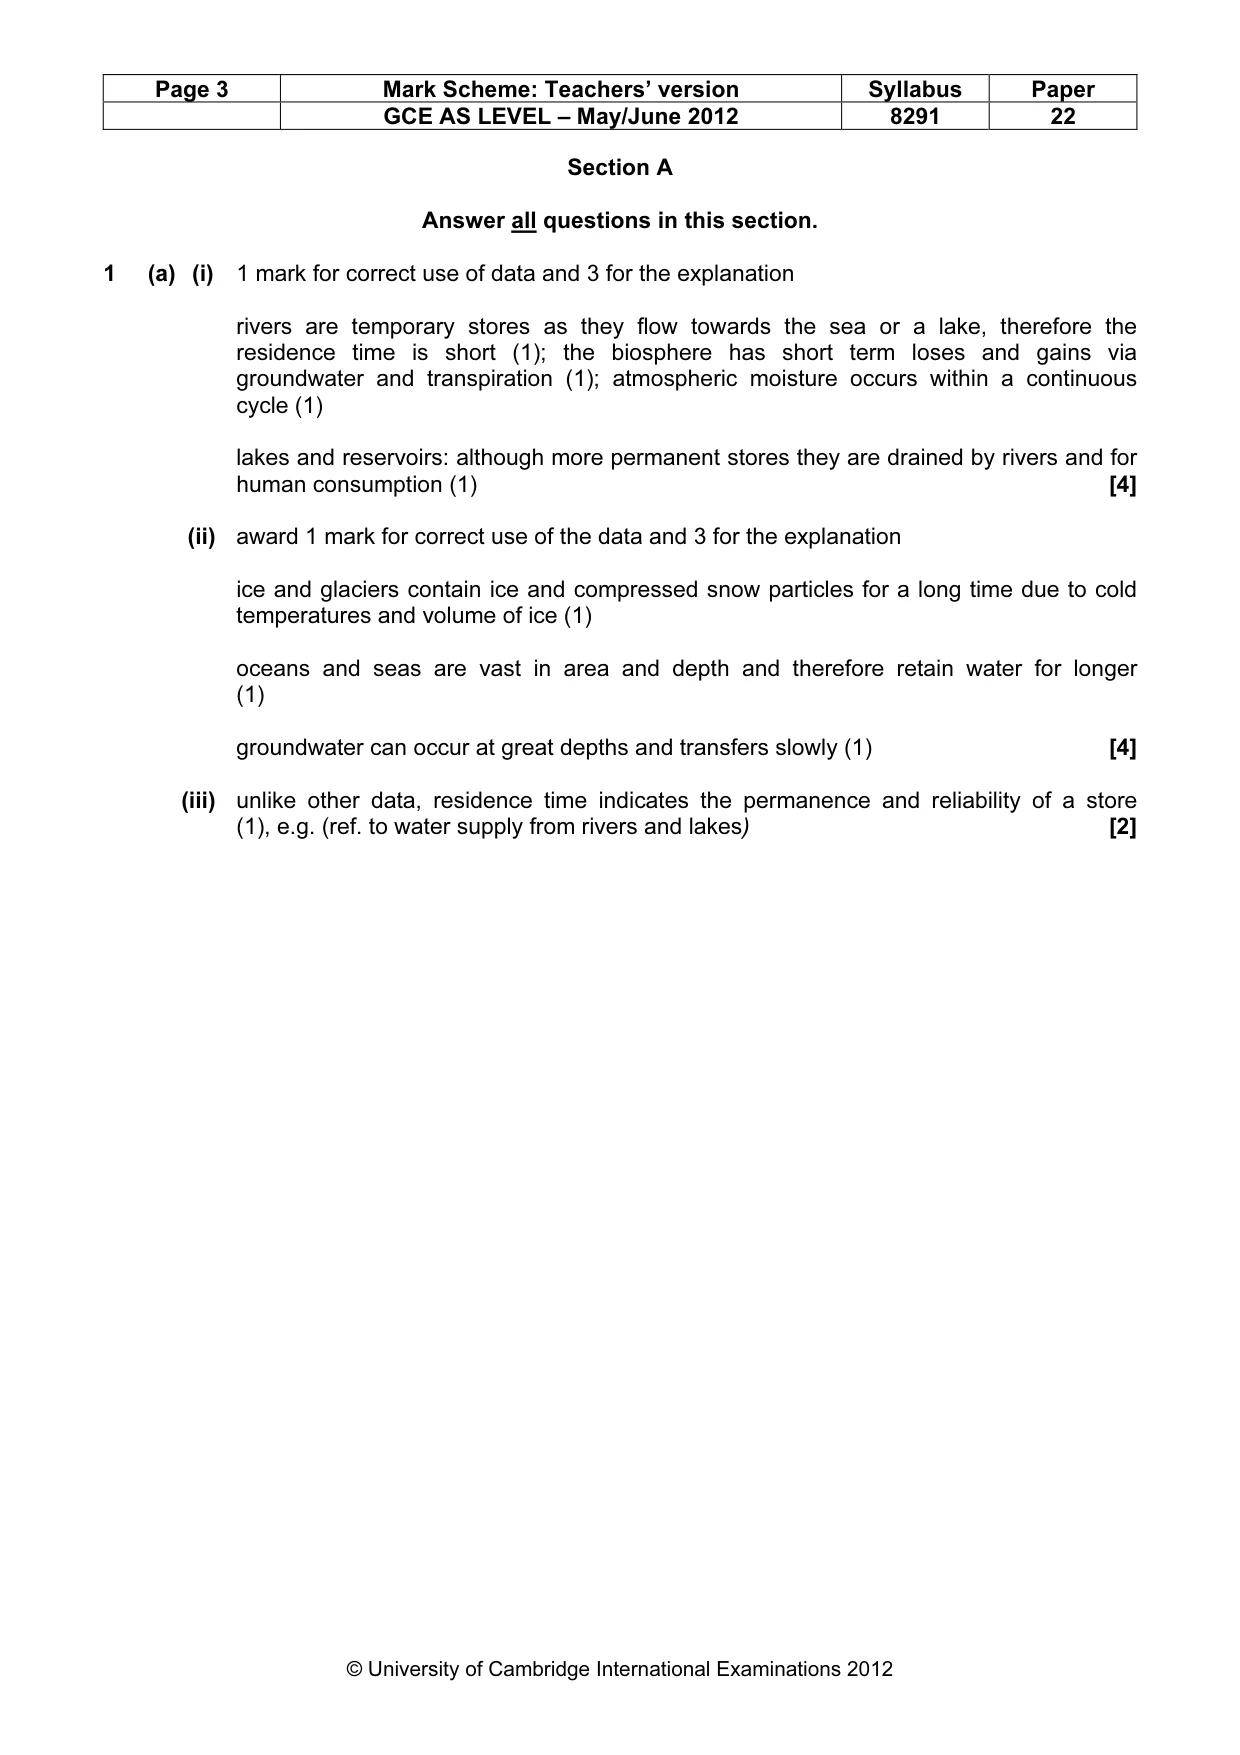
Page 3 Mark Scheme: Teachers’ version Syllabus Paper GCE AS LEVEL – May/June 2012 8291 22 © University of Cambridge International Examinations 2012 Section A Answer all questions in this section. 1 (a) (i) 1 mark for correct use of data and 3 for the explanation rivers are temporary stores as they flow towards the sea or a lake, therefore the residence time is short (1); the biosphere has short term loses and gains via groundwater and transpiration (1); atmospheric moisture occurs within a continuous cycle (1) lakes and reservoirs: although more permanent stores they are drained by rivers and for human consumption (1) [4] (ii) award 1 mark for correct use of the data and 3 for the explanation ice and glaciers contain ice and compressed snow particles for a long time due to cold temperatures and volume of ice (1) oceans and seas are vast in area and depth and therefore retain water for longer (1) groundwater can occur at great depths and transfers slowly (1) [4] (iii) unlike other data, residence time indicates the permanence and reliability of a store (1), e.g. (ref. to water supply from rivers and lakes) [2]
Mark scheme, page 4
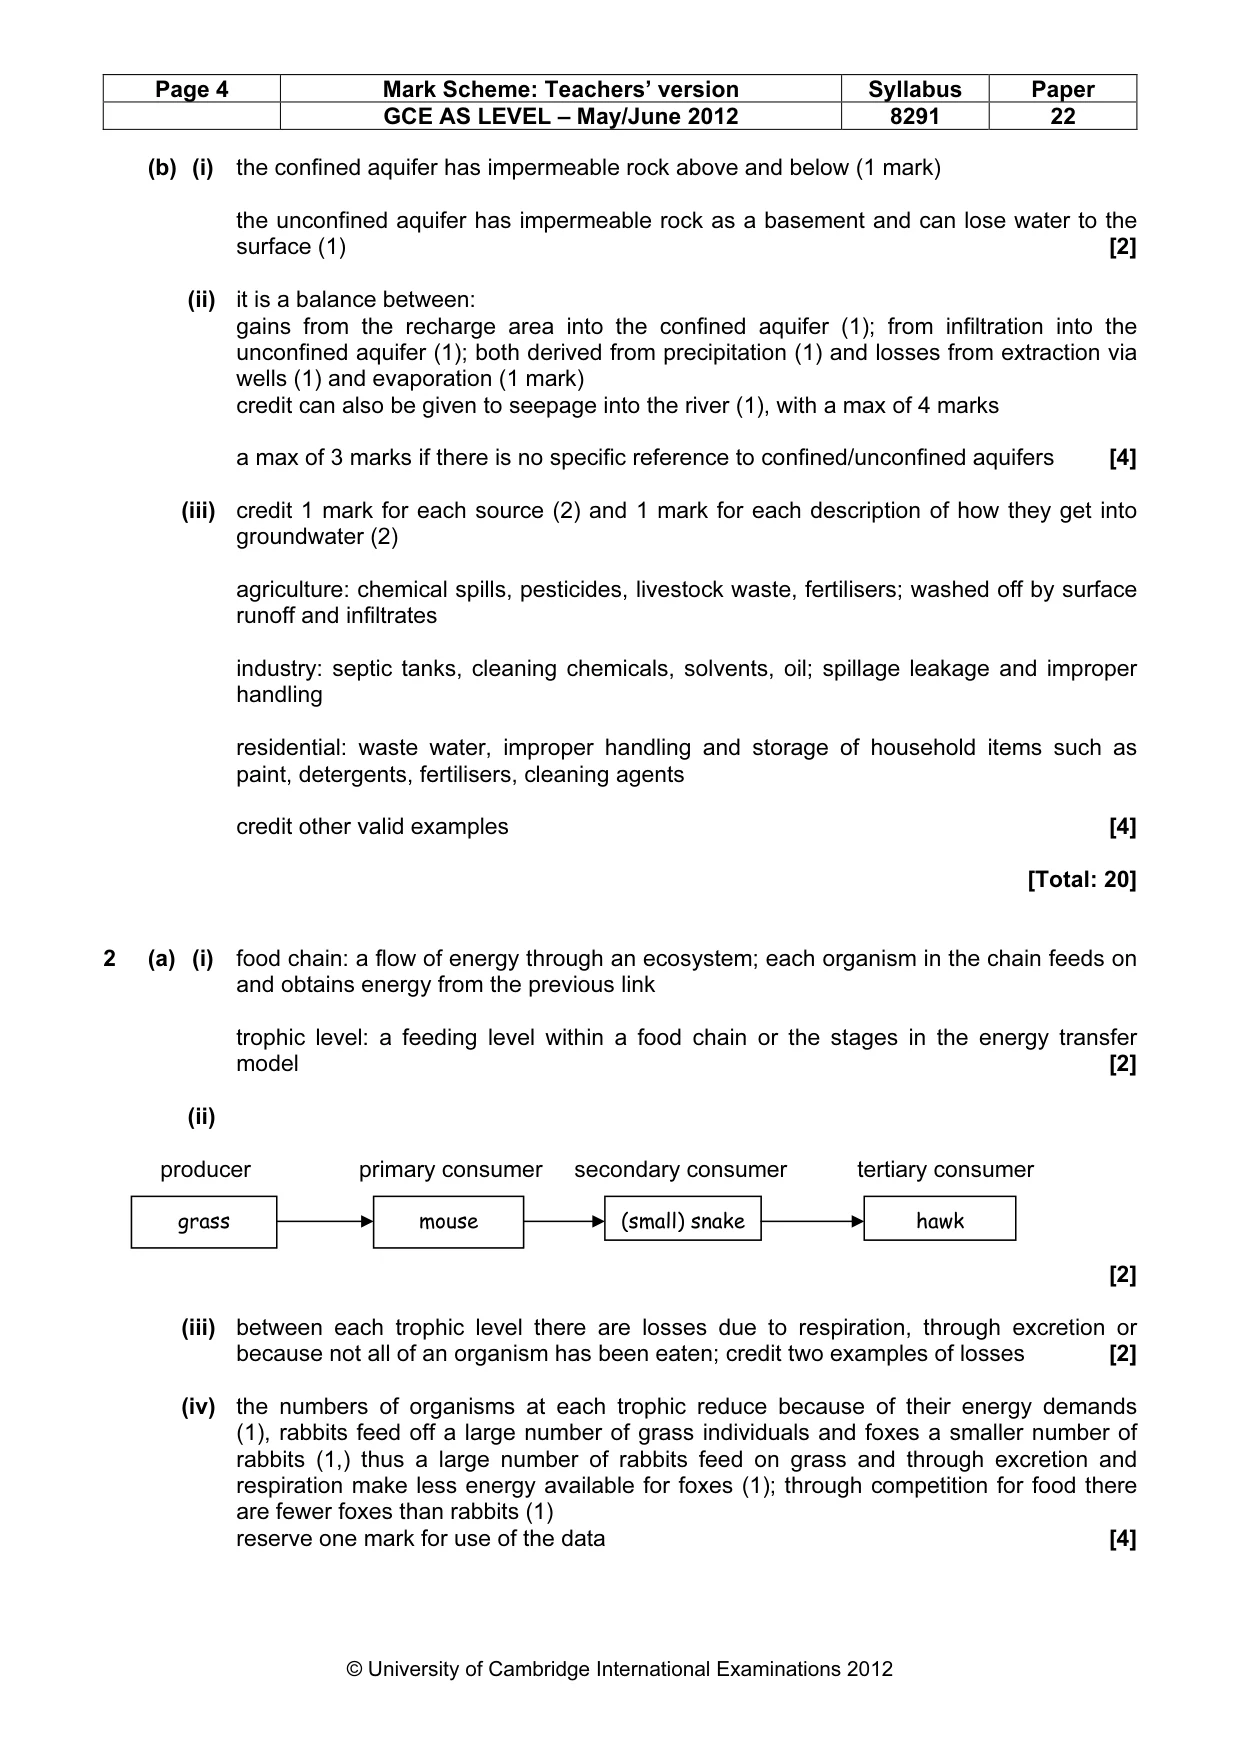
Page 4 Mark Scheme: Teachers’ version Syllabus Paper GCE AS LEVEL – May/June 2012 8291 22 © University of Cambridge International Examinations 2012 (b) (i) the confined aquifer has impermeable rock above and below (1 mark) the unconfined aquifer has impermeable rock as a basement and can lose water to the surface (1) [2] (ii) it is a balance between: gains from the recharge area into the confined aquifer (1); from infiltration into the unconfined aquifer (1); both derived from precipitation (1) and losses from extraction via wells (1) and evaporation (1 mark) credit can also be given to seepage into the river (1), with a max of 4 marks a max of 3 marks if there is no specific reference to confined/unconfined aquifers [4] (iii) credit 1 mark for each source (2) and 1 mark for each description of how they get into groundwater (2) agriculture: chemical spills, pesticides, livestock waste, fertilisers; washed off by surface runoff and infiltrates industry: septic tanks, cleaning chemicals, solvents, oil; spillage leakage and improper handling residential: waste water, improper handling and storage of household items such as paint, detergents, fertilisers, cleaning agents credit other valid examples [4] [Total: 20] 2 (a) (i) food chain: a flow of energy through an ecosystem; each organism in the chain feeds on and obtains energy from the previous link trophic level: a feeding level within a food chain or the stages in the energy transfer model [2] (ii) producer primary consumer secondary consumer tertiary consumer [2] (iii) between each trophic level there are losses due to respiration, through excretion or because not all of an organism has been eaten; credit two examples of losses [2] (iv) the numbers of organisms at each trophic reduce because of their energy demands (1), rabbits feed off a large number of grass individuals and foxes a smaller number of rabbits (1,) thus a large number of rabbits feed on grass and through excretion and respiration make less energy available for foxes (1); through competition for food there are fewer foxes than rabbits (1) reserve one mark for use of the data [4] grass mouse (small) snake hawk
Mark scheme, page 5
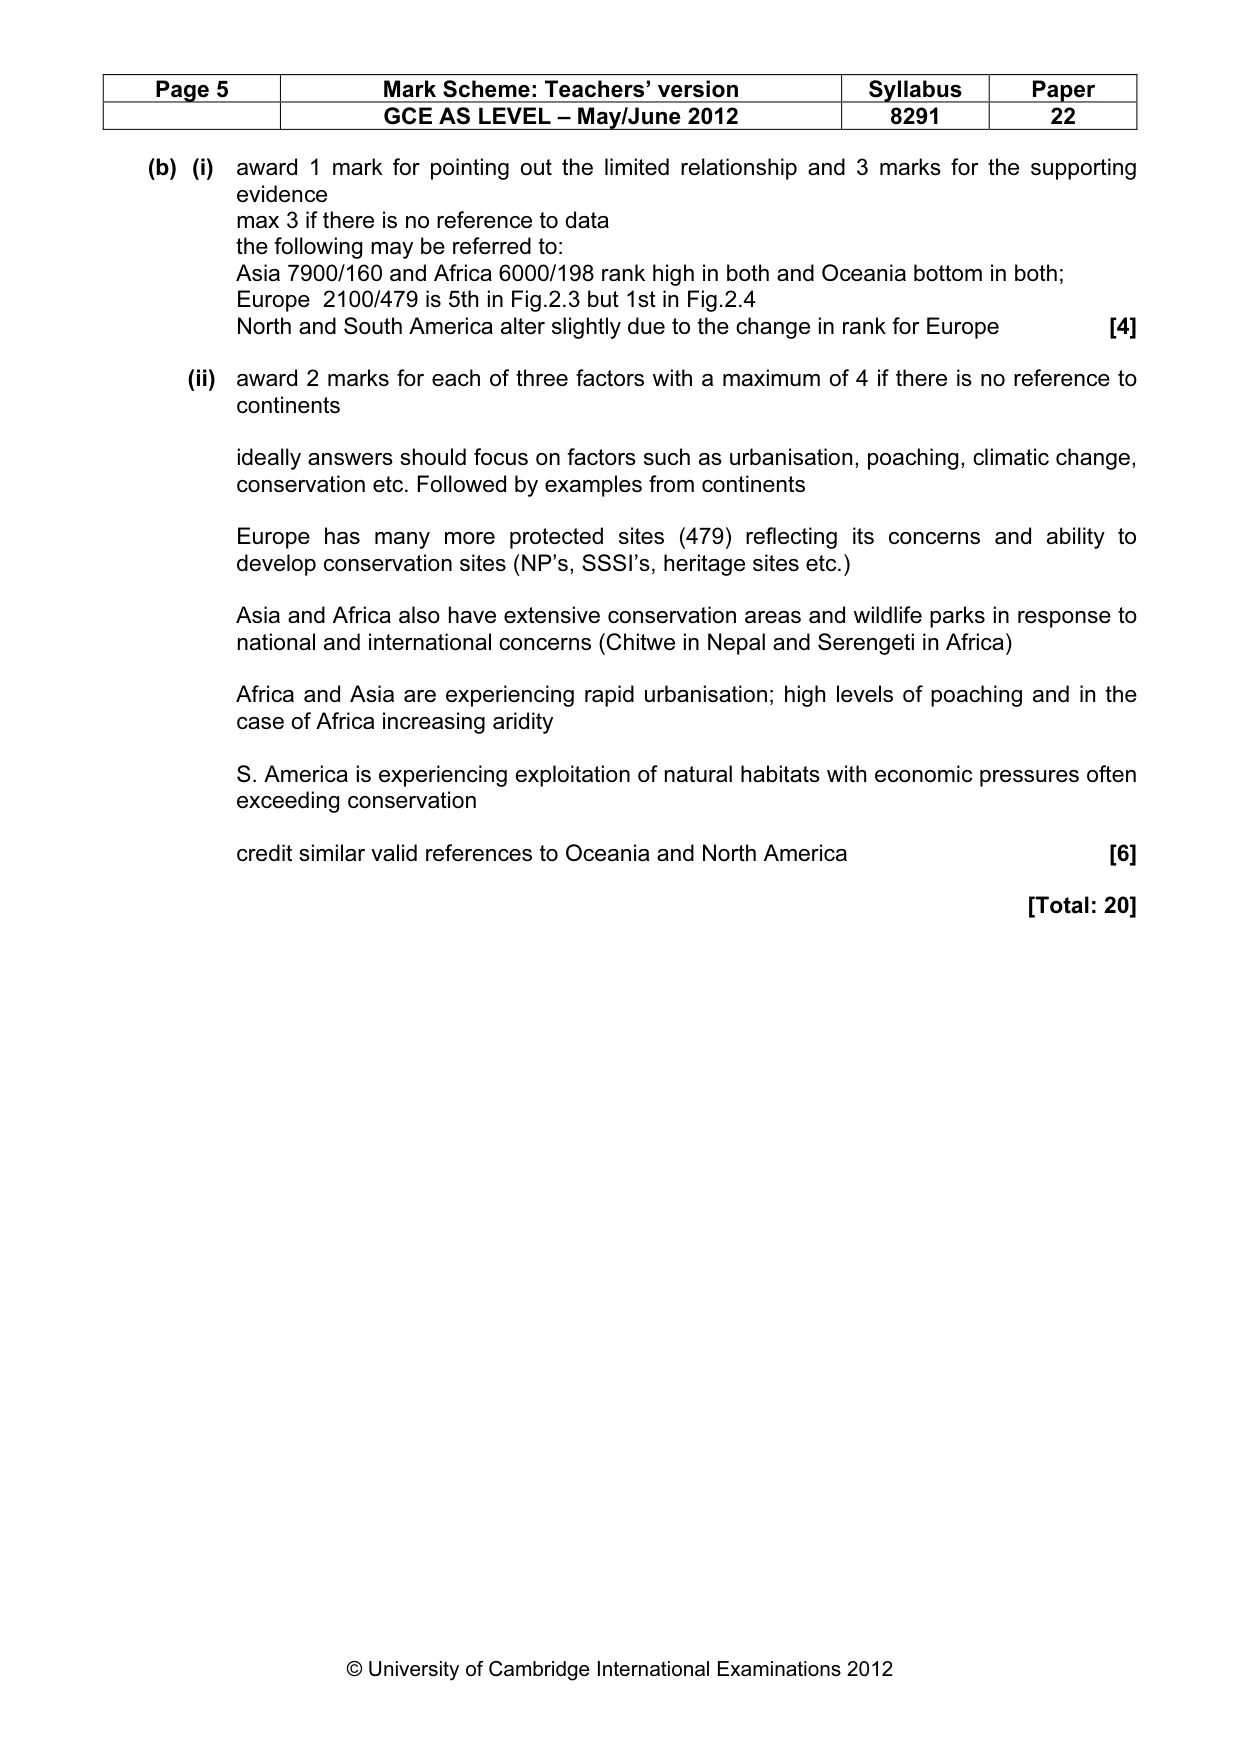
Page 5 Mark Scheme: Teachers’ version Syllabus Paper GCE AS LEVEL – May/June 2012 8291 22 © University of Cambridge International Examinations 2012 (b) (i) award 1 mark for pointing out the limited relationship and 3 marks for the supporting evidence max 3 if there is no reference to data the following may be referred to: Asia 7900/160 and Africa 6000/198 rank high in both and Oceania bottom in both; Europe 2100/479 is 5th in Fig.2.3 but 1st in Fig.2.4 North and South America alter slightly due to the change in rank for Europe [4] (ii) award 2 marks for each of three factors with a maximum of 4 if there is no reference to continents ideally answers should focus on factors such as urbanisation, poaching, climatic change, conservation etc. Followed by examples from continents Europe has many more protected sites (479) reflecting its concerns and ability to develop conservation sites (NP’s, SSSI’s, heritage sites etc.) Asia and Africa also have extensive conservation areas and wildlife parks in response to national and international concerns (Chitwe in Nepal and Serengeti in Africa) Africa and Asia are experiencing rapid urbanisation; high levels of poaching and in the case of Africa increasing aridity S. America is experiencing exploitation of natural habitats with economic pressures often exceeding conservation credit similar valid references to Oceania and North America [6] [Total: 20]
Mark scheme, page 6
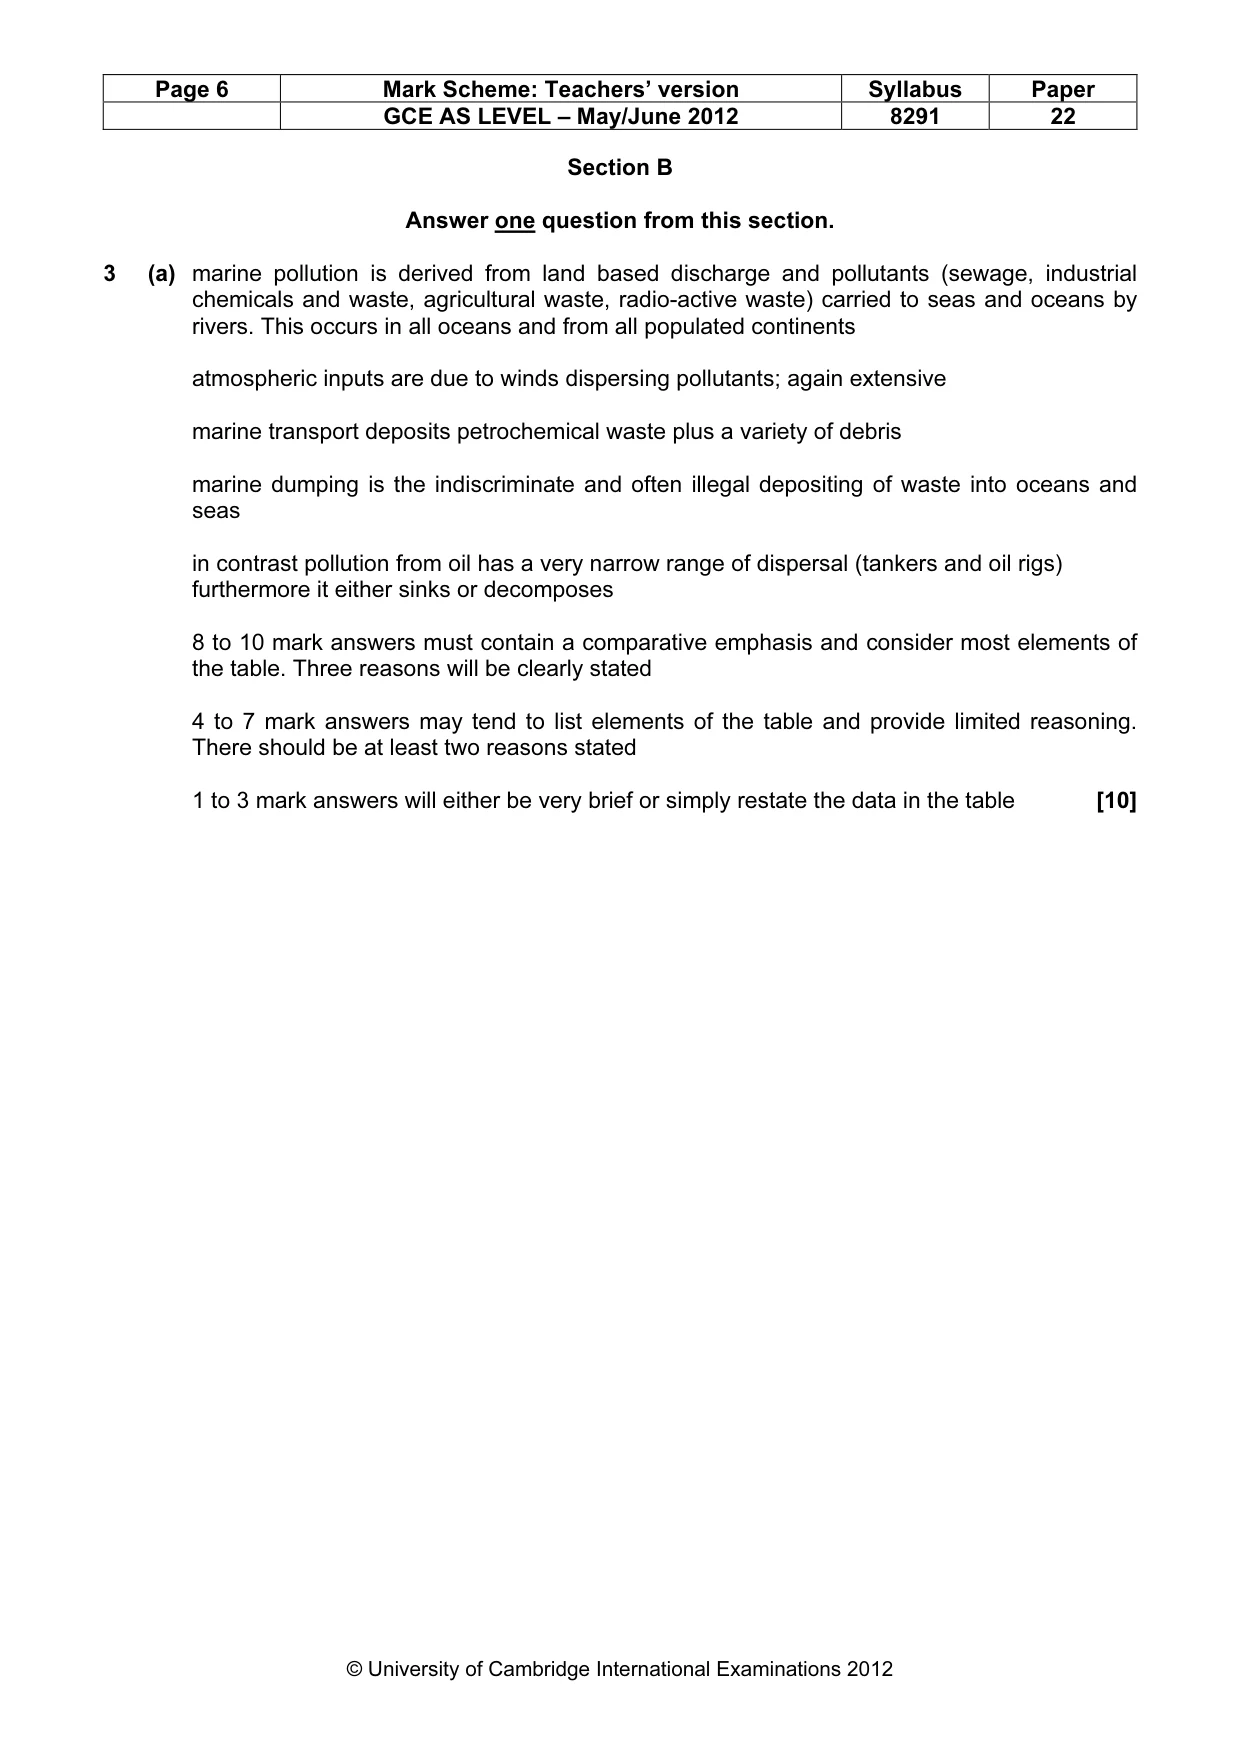
Page 6 Mark Scheme: Teachers’ version Syllabus Paper GCE AS LEVEL – May/June 2012 8291 22 © University of Cambridge International Examinations 2012 Section B Answer one question from this section. 3 (a) marine pollution is derived from land based discharge and pollutants (sewage, industrial chemicals and waste, agricultural waste, radio-active waste) carried to seas and oceans by rivers. This occurs in all oceans and from all populated continents atmospheric inputs are due to winds dispersing pollutants; again extensive marine transport deposits petrochemical waste plus a variety of debris marine dumping is the indiscriminate and often illegal depositing of waste into oceans and seas in contrast pollution from oil has a very narrow range of dispersal (tankers and oil rigs) furthermore it either sinks or decomposes 8 to 10 mark answers must contain a comparative emphasis and consider most elements of the table. Three reasons will be clearly stated 4 to 7 mark answers may tend to list elements of the table and provide limited reasoning. There should be at least two reasons stated 1 to 3 mark answers will either be very brief or simply restate the data in the table [10]
Mark scheme, page 7
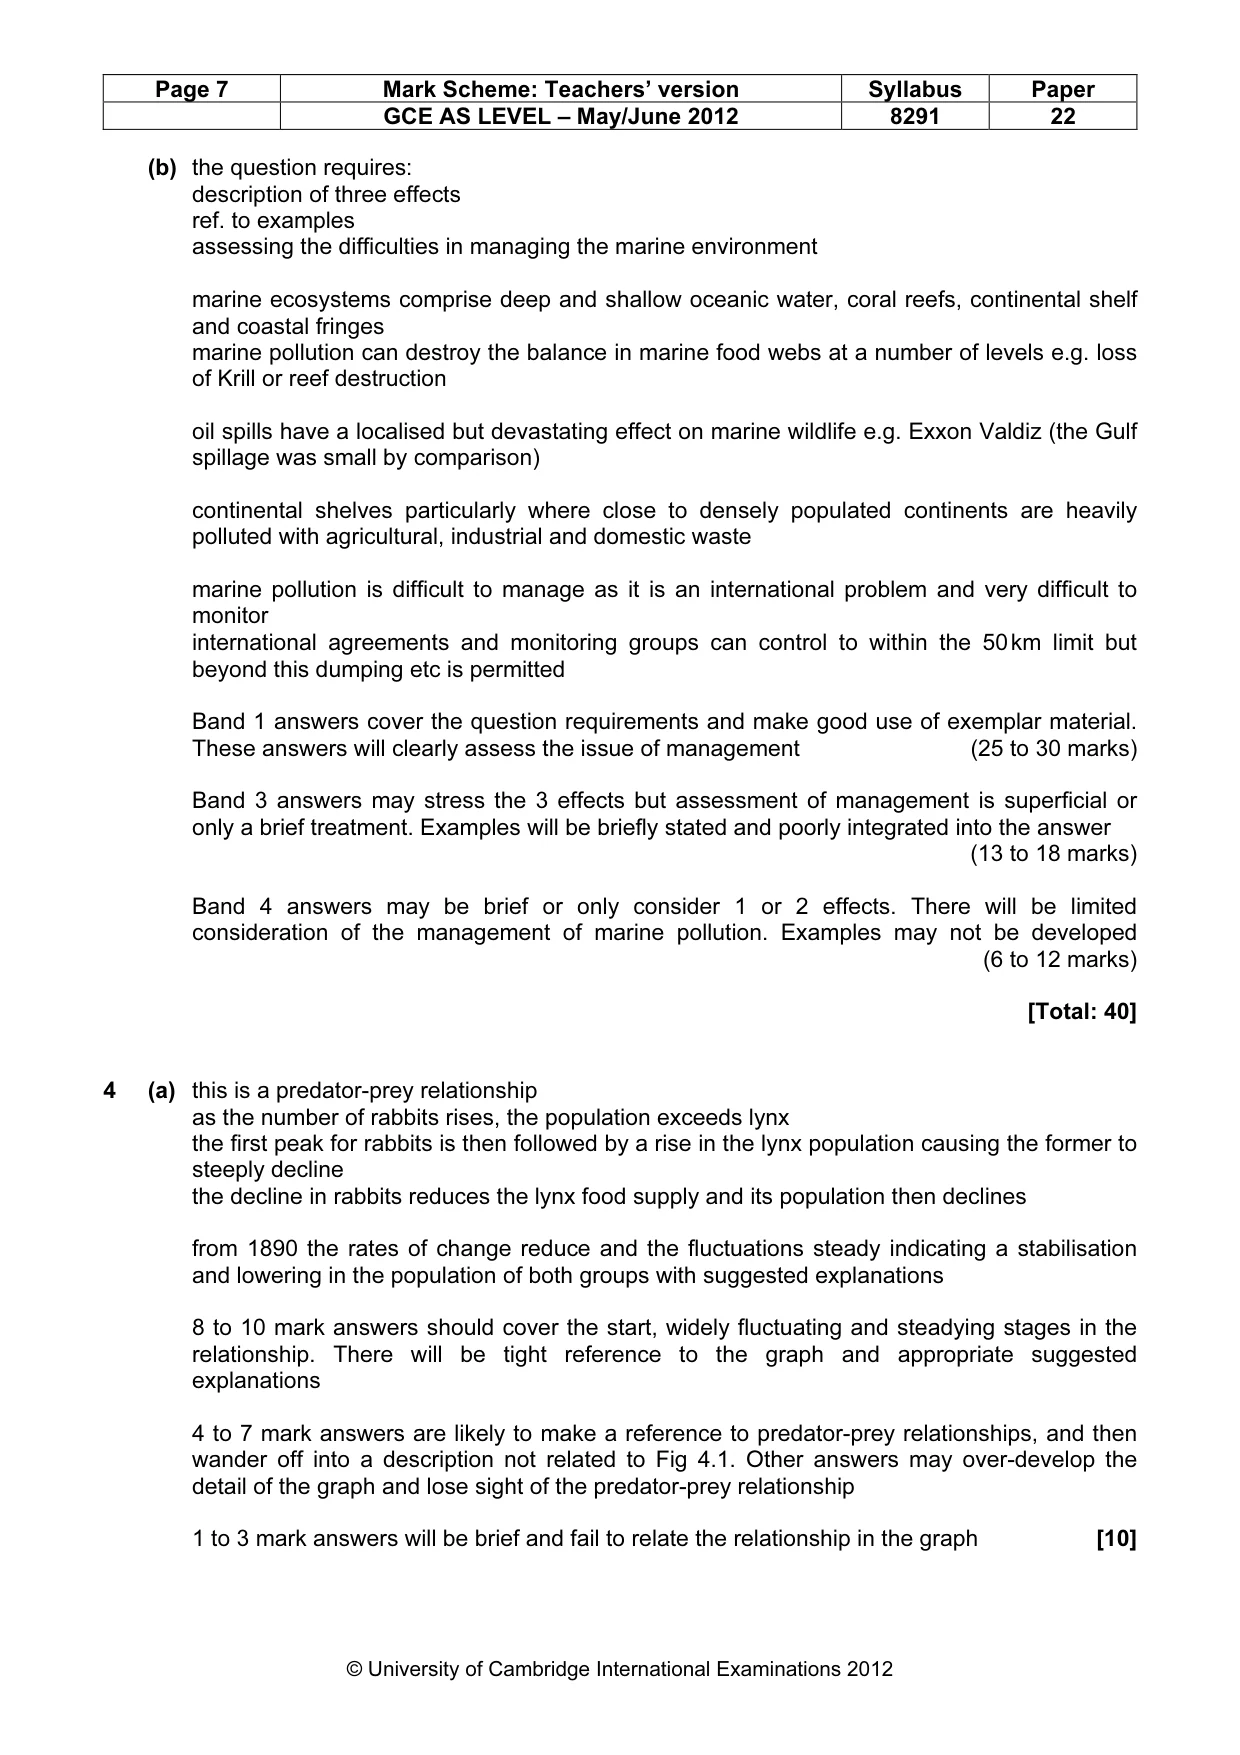
Page 7 Mark Scheme: Teachers’ version Syllabus Paper GCE AS LEVEL – May/June 2012 8291 22 © University of Cambridge International Examinations 2012 (b) the question requires: description of three effects ref. to examples assessing the difficulties in managing the marine environment marine ecosystems comprise deep and shallow oceanic water, coral reefs, continental shelf and coastal fringes marine pollution can destroy the balance in marine food webs at a number of levels e.g. loss of Krill or reef destruction oil spills have a localised but devastating effect on marine wildlife e.g. Exxon Valdiz (the Gulf spillage was small by comparison) continental shelves particularly where close to densely populated continents are heavily polluted with agricultural, industrial and domestic waste marine pollution is difficult to manage as it is an international problem and very difficult to monitor international agreements and monitoring groups can control to within the 50 km limit but beyond this dumping etc is permitted Band 1 answers cover the question requirements and make good use of exemplar material. These answers will clearly assess the issue of management (25 to 30 marks) Band 3 answers may stress the 3 effects but assessment of management is superficial or only a brief treatment. Examples will be briefly stated and poorly integrated into the answer (13 to 18 marks) Band 4 answers may be brief or only consider 1 or 2 effects. There will be limited consideration of the management of marine pollution. Examples may not be developed (6 to 12 marks) [Total: 40] 4 (a) this is a predator-prey relationship as the number of rabbits rises, the population exceeds lynx the first peak for rabbits is then followed by a rise in the lynx population causing the former to steeply decline the decline in rabbits reduces the lynx food supply and its population then declines from 1890 the rates of change reduce and the fluctuations steady indicating a stabilisation and lowering in the population of both groups with suggested explanations 8 to 10 mark answers should cover the start, widely fluctuating and steadying stages in the relationship. There will be tight reference to the graph and appropriate suggested explanations 4 to 7 mark answers are likely to make a reference to predator-prey relationships, and then wander off into a description not related to Fig 4.1. Other answers may over-develop the detail of the graph and lose sight of the predator-prey relationship 1 to 3 mark answers will be brief and fail to relate the relationship in the graph [10]
Mark scheme, page 8
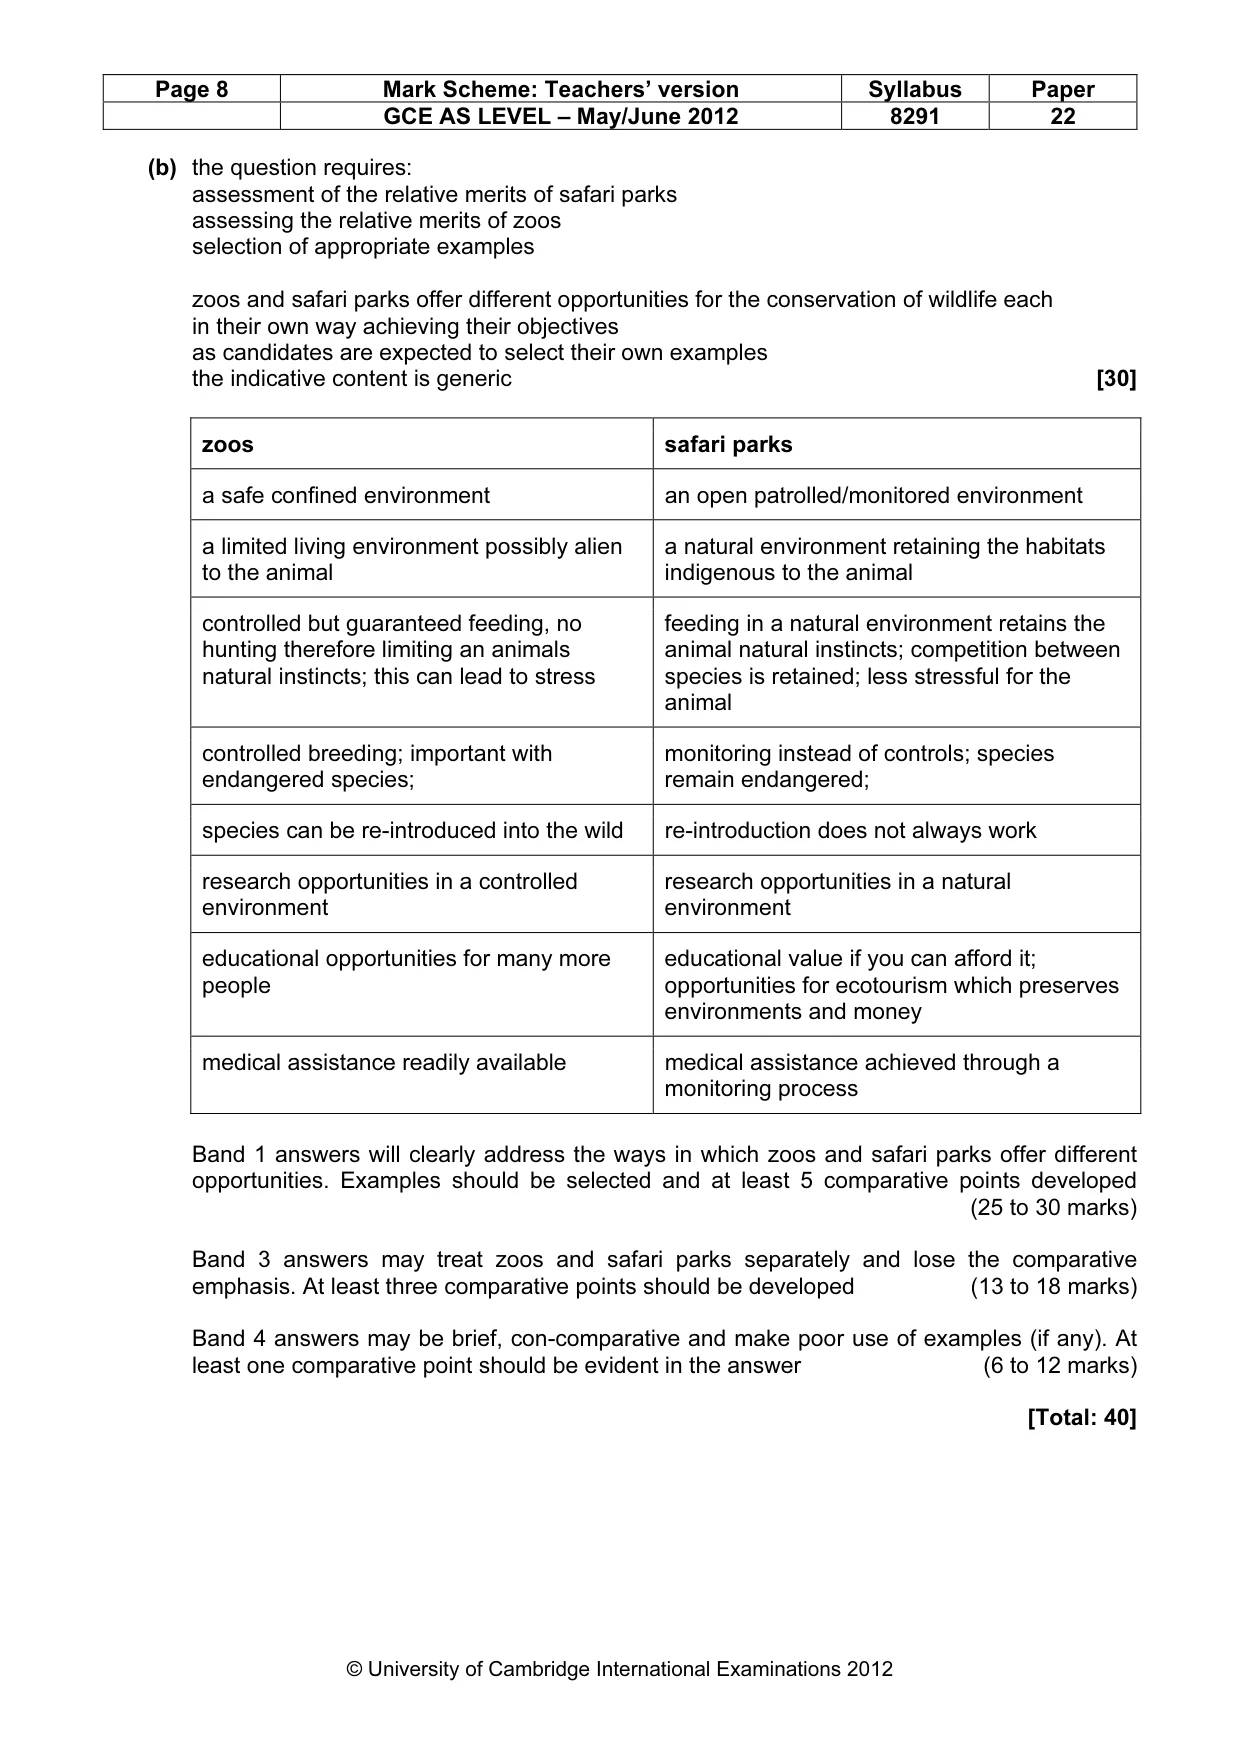
Page 8 Mark Scheme: Teachers’ version Syllabus Paper GCE AS LEVEL – May/June 2012 8291 22 © University of Cambridge International Examinations 2012 (b) the question requires: assessment of the relative merits of safari parks assessing the relative merits of zoos selection of appropriate examples zoos and safari parks offer different opportunities for the conservation of wildlife each in their own way achieving their objectives as candidates are expected to select their own examples the indicative content is generic [30] zoos safari parks a safe confined environment an open patrolled/monitored environment a limited living environment possibly alien to the animal a natural environment retaining the habitats indigenous to the animal controlled but guaranteed feeding, no hunting therefore limiting an animals natural instincts; this can lead to stress feeding in a natural environment retains the animal natural instincts; competition between species is retained; less stressful for the animal controlled breeding; important with endangered species; monitoring instead of controls; species remain endangered; species can be re-introduced into the wild re-introduction does not always work research opportunities in a controlled environment research opportunities in a natural environment educational opportunities for many more people educational value if you can afford it; opportunities for ecotourism which preserves environments and money medical assistance readily available medical assistance achieved through a monitoring process Band 1 answers will clearly address the ways in which zoos and safari parks offer different opportunities. Examples should be selected and at least 5 comparative points developed (25 to 30 marks) Band 3 answers may treat zoos and safari parks separately and lose the comparative emphasis. At least three comparative points should be developed (13 to 18 marks) Band 4 answers may be brief, con-comparative and make poor use of examples (if any). At least one comparative point should be evident in the answer (6 to 12 marks) [Total: 40]
Mark scheme, page 9
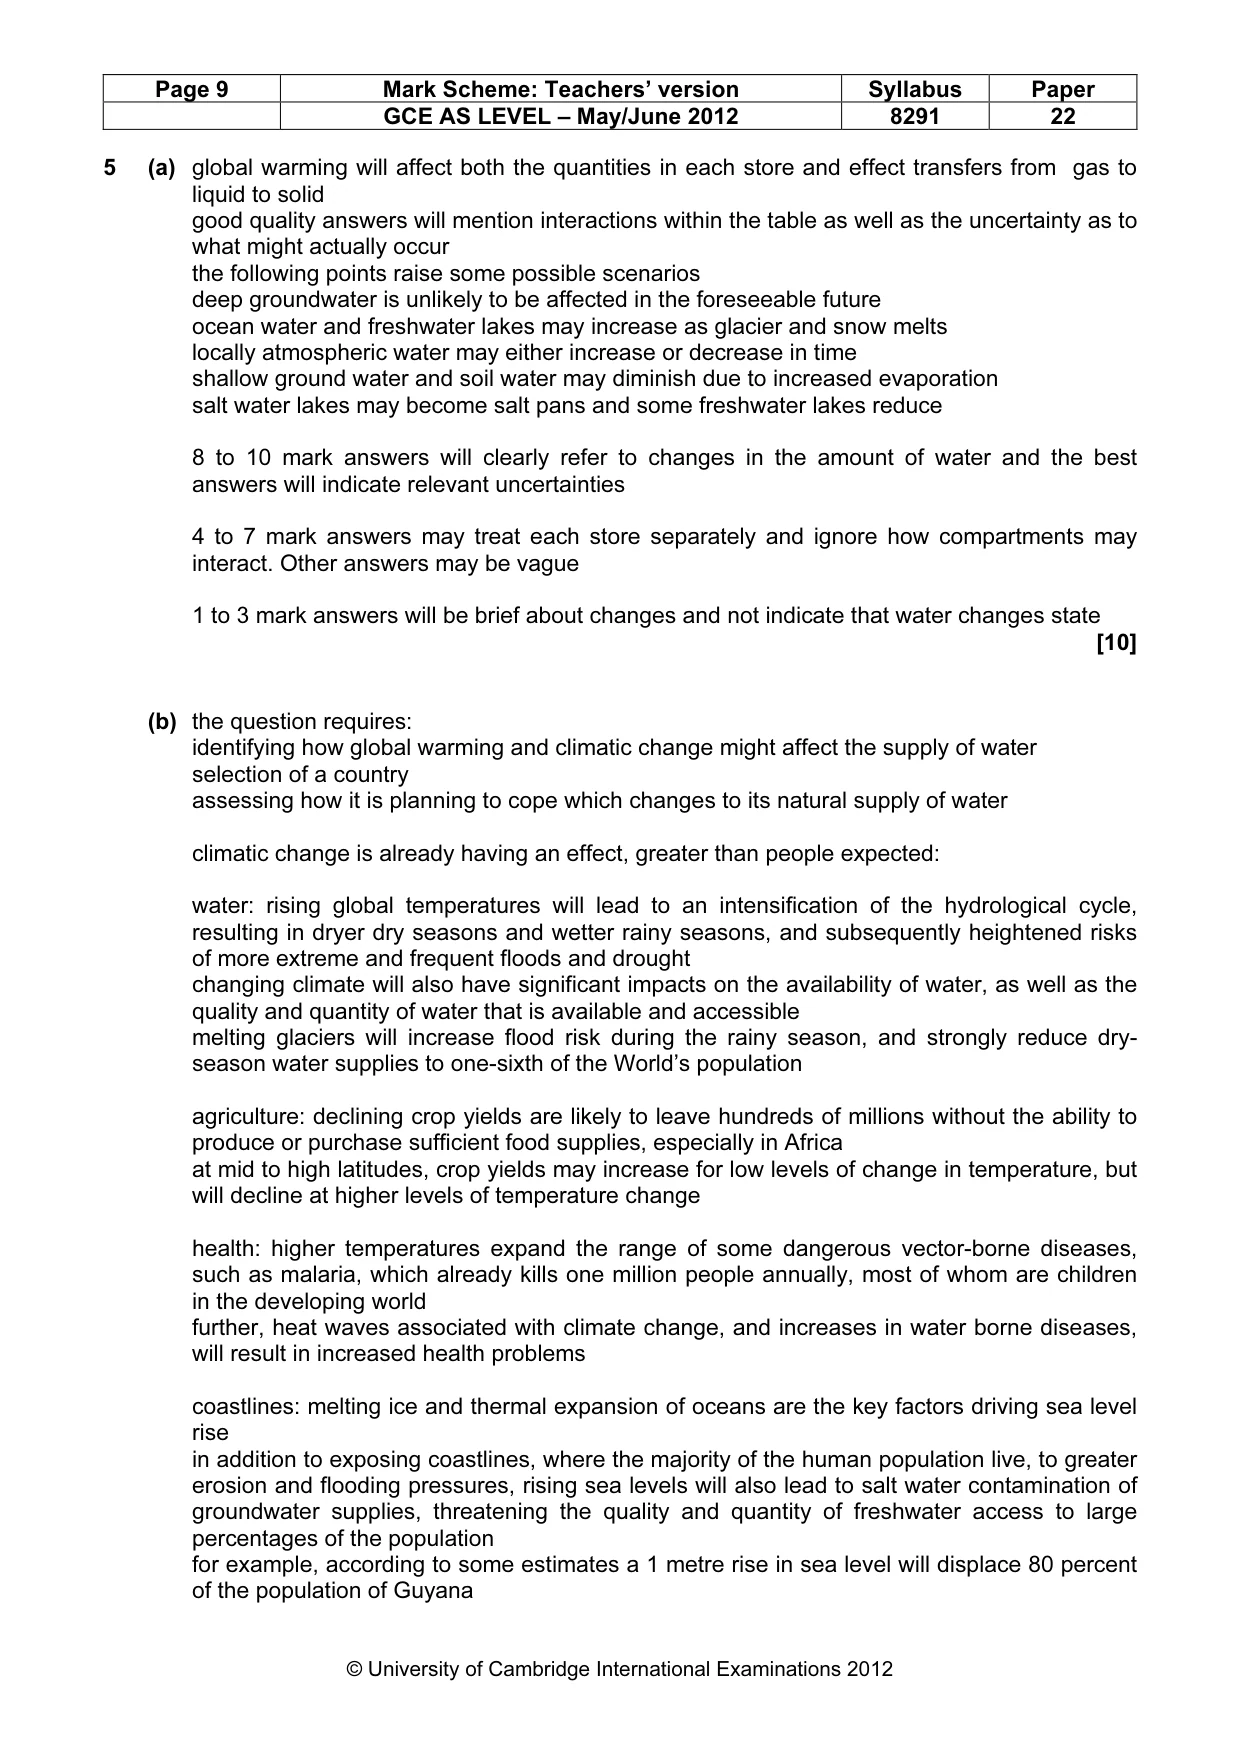
Page 9 Mark Scheme: Teachers’ version Syllabus Paper GCE AS LEVEL – May/June 2012 8291 22 © University of Cambridge International Examinations 2012 5 (a) global warming will affect both the quantities in each store and effect transfers from gas to liquid to solid good quality answers will mention interactions within the table as well as the uncertainty as to what might actually occur the following points raise some possible scenarios deep groundwater is unlikely to be affected in the foreseeable future ocean water and freshwater lakes may increase as glacier and snow melts locally atmospheric water may either increase or decrease in time shallow ground water and soil water may diminish due to increased evaporation salt water lakes may become salt pans and some freshwater lakes reduce 8 to 10 mark answers will clearly refer to changes in the amount of water and the best answers will indicate relevant uncertainties 4 to 7 mark answers may treat each store separately and ignore how compartments may interact. Other answers may be vague 1 to 3 mark answers will be brief about changes and not indicate that water changes state [10] (b) the question requires: identifying how global warming and climatic change might affect the supply of water selection of a country assessing how it is planning to cope which changes to its natural supply of water climatic change is already having an effect, greater than people expected: water: rising global temperatures will lead to an intensification of the hydrological cycle, resulting in dryer dry seasons and wetter rainy seasons, and subsequently heightened risks of more extreme and frequent floods and drought changing climate will also have significant impacts on the availability of water, as well as the quality and quantity of water that is available and accessible melting glaciers will increase flood risk during the rainy season, and strongly reduce dry- season water supplies to one-sixth of the World’s population agriculture: declining crop yields are likely to leave hundreds of millions without the ability to produce or purchase sufficient food supplies, especially in Africa at mid to high latitudes, crop yields may increase for low levels of change in temperature, but will decline at higher levels of temperature change health: higher temperatures expand the range of some dangerous vector-borne diseases, such as malaria, which already kills one million people annually, most of whom are children in the developing world further, heat waves associated with climate change, and increases in water borne diseases, will result in increased health problems coastlines: melting ice and thermal expansion of oceans are the key factors driving sea level rise in addition to exposing coastlines, where the majority of the human population live, to greater erosion and flooding pressures, rising sea levels will also lead to salt water contamination of groundwater supplies, threatening the quality and quantity of freshwater access to large percentages of the population for example, according to some estimates a 1 metre rise in sea level will displace 80 percent of the population of Guyana
Mark scheme, page 10
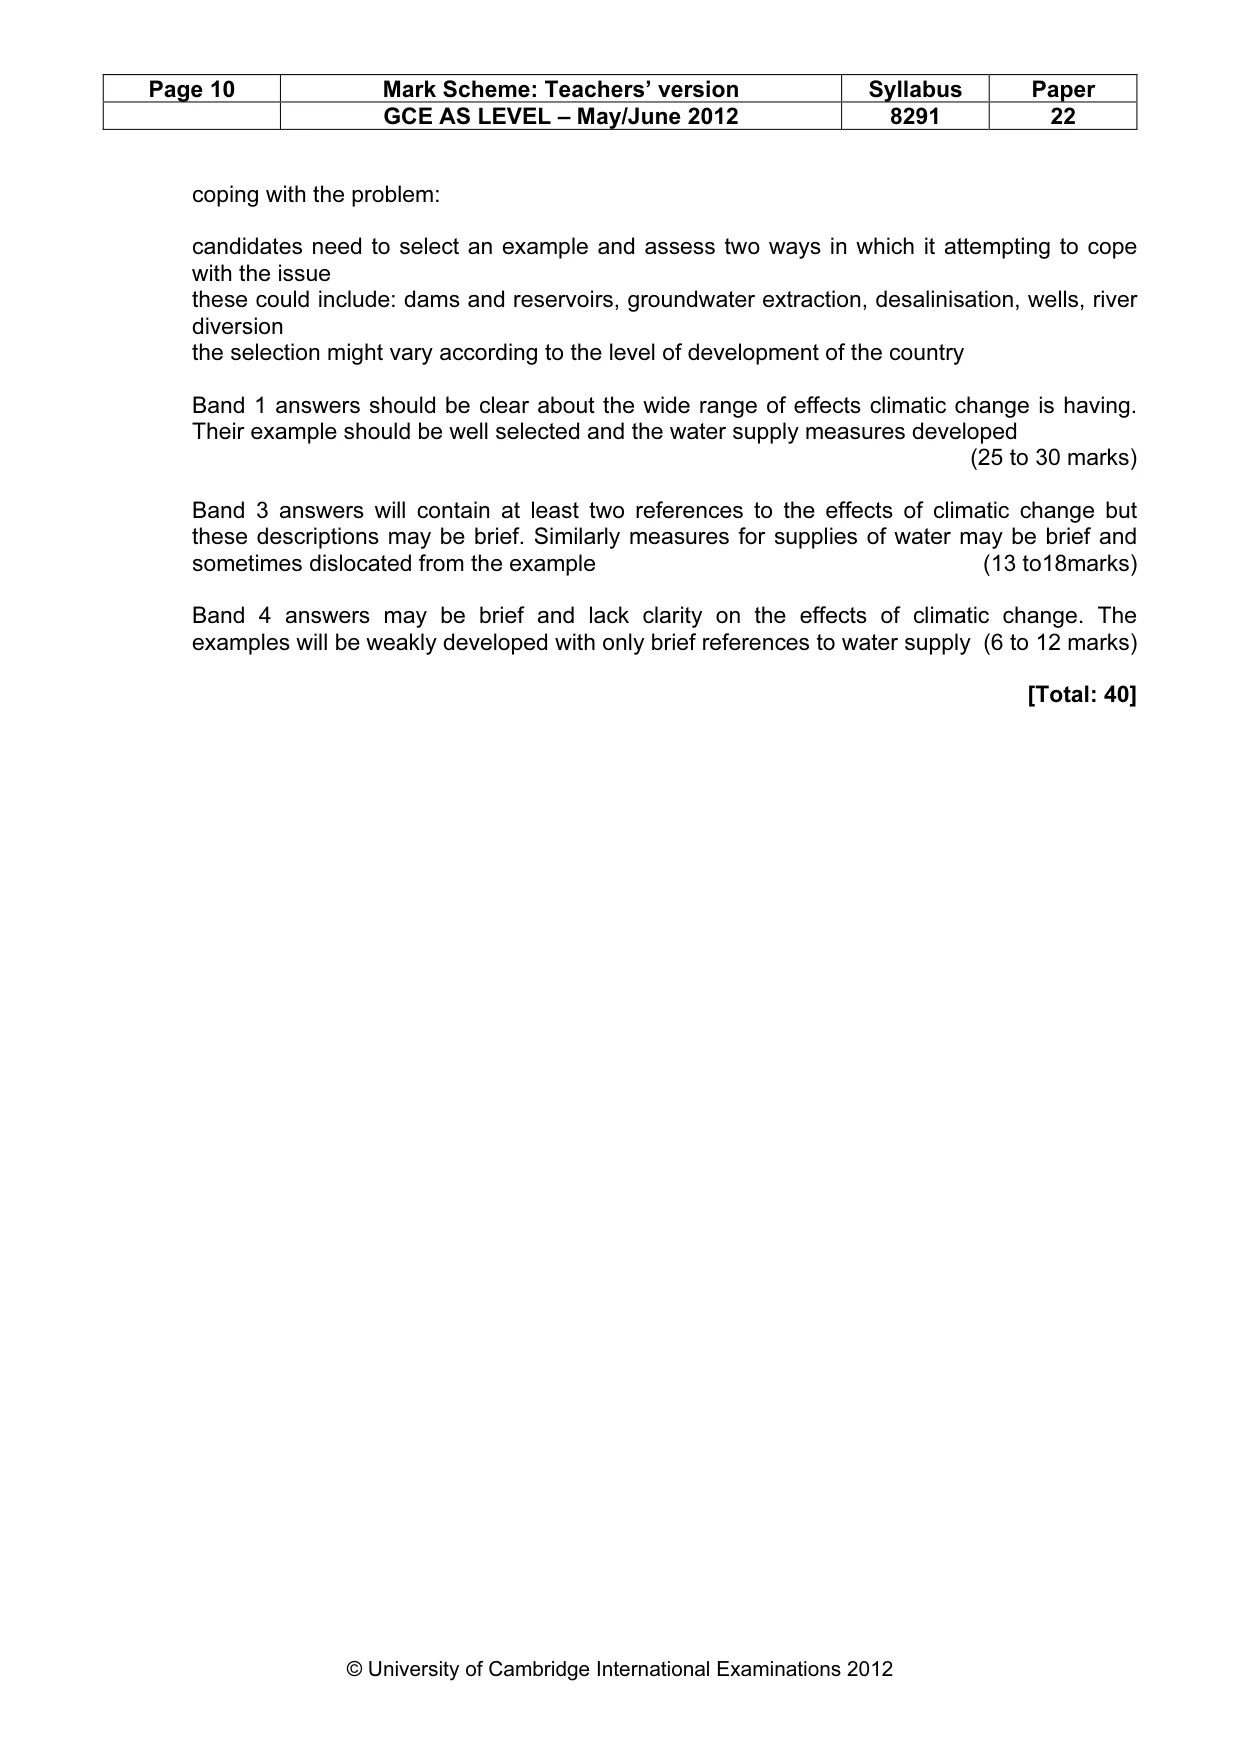
Page 10 Mark Scheme: Teachers’ version Syllabus Paper GCE AS LEVEL – May/June 2012 8291 22 © University of Cambridge International Examinations 2012 coping with the problem: candidates need to select an example and assess two ways in which it attempting to cope with the issue these could include: dams and reservoirs, groundwater extraction, desalinisation, wells, river diversion the selection might vary according to the level of development of the country Band 1 answers should be clear about the wide range of effects climatic change is having. Their example should be well selected and the water supply measures developed (25 to 30 marks) Band 3 answers will contain at least two references to the effects of climatic change but these descriptions may be brief. Similarly measures for supplies of water may be brief and sometimes dislocated from the example (13 to18marks) Band 4 answers may be brief and lack clarity on the effects of climatic change. The examples will be weakly developed with only brief references to water supply (6 to 12 marks) [Total: 40]
Mark scheme, page 11
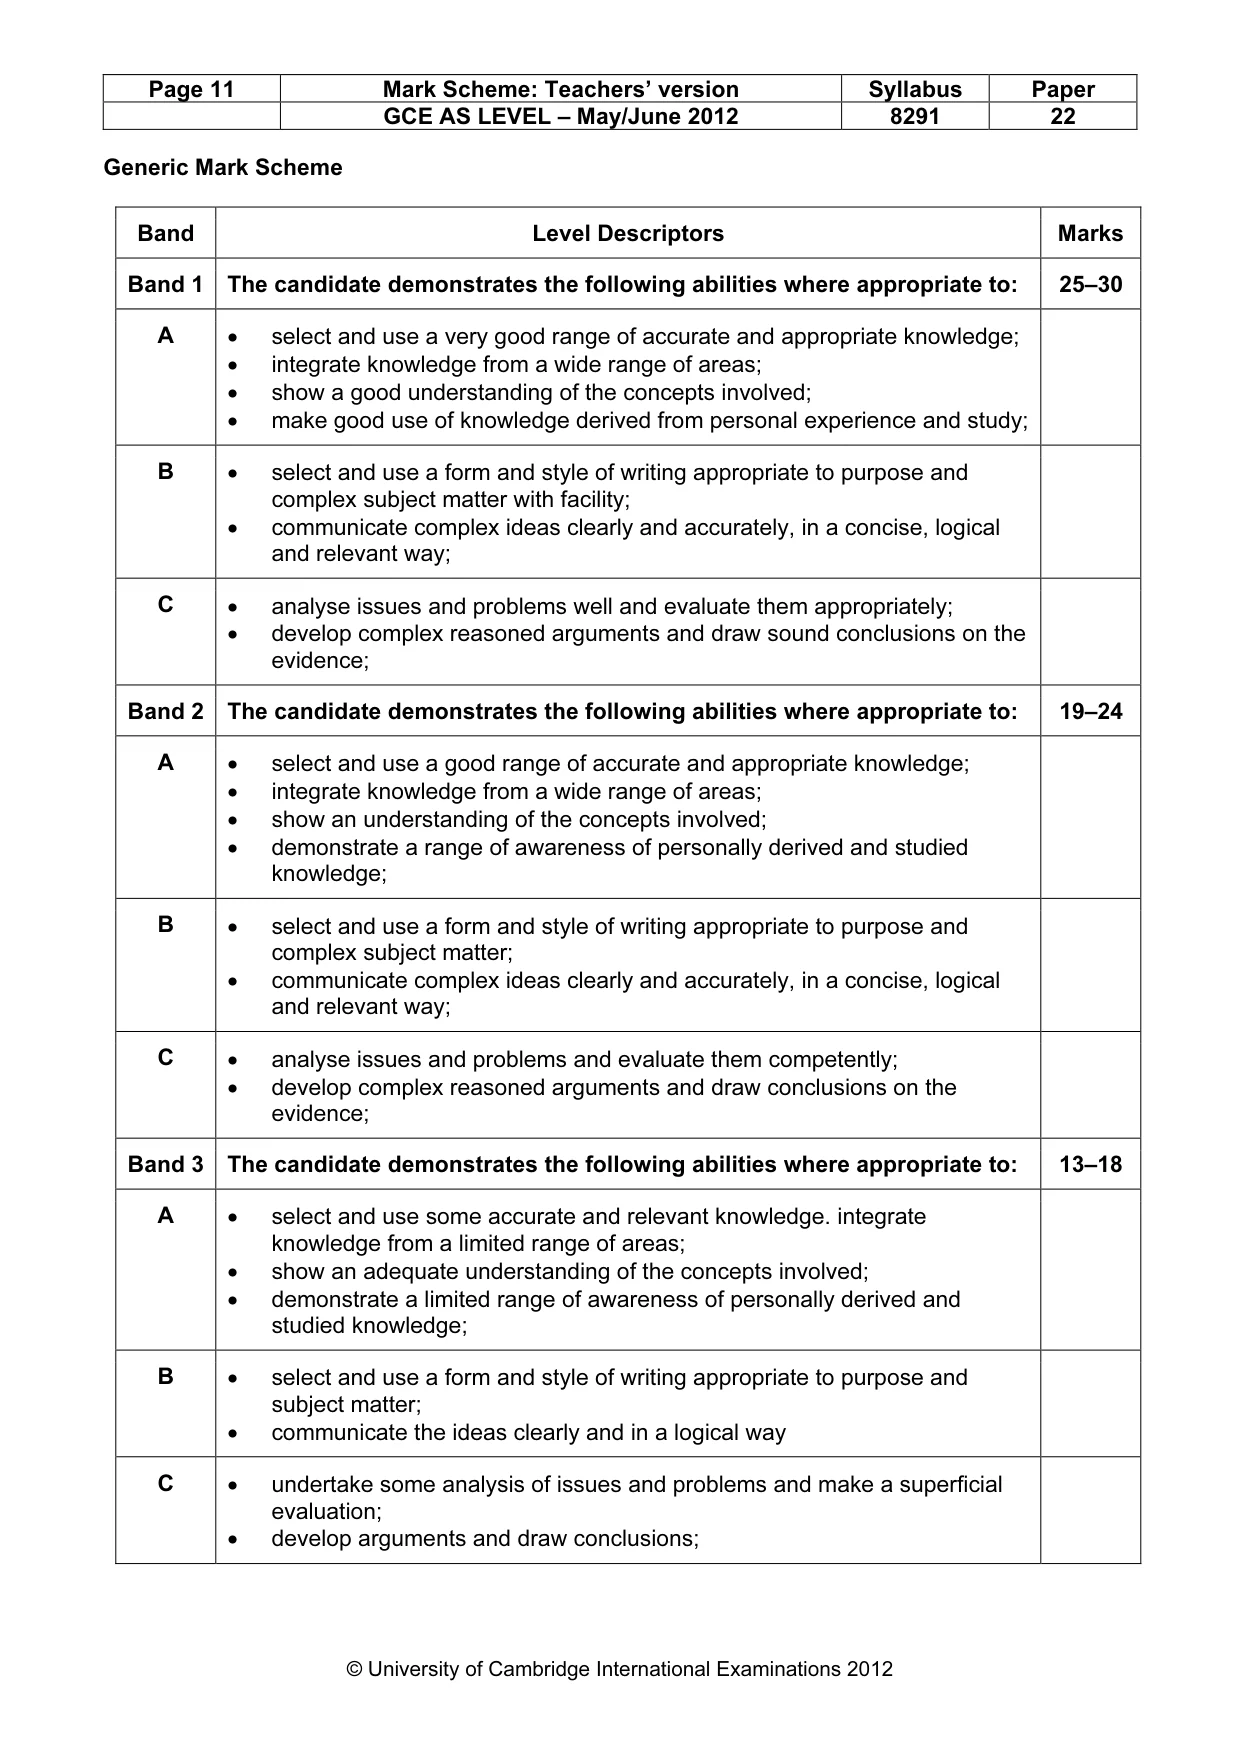
Page 11 Mark Scheme: Teachers’ version Syllabus Paper GCE AS LEVEL – May/June 2012 8291 22 © University of Cambridge International Examinations 2012 Generic Mark Scheme Band Level Descriptors Marks Band 1 The candidate demonstrates the following abilities where appropriate to: 25–30 A • select and use a very good range of accurate and appropriate knowledge; • integrate knowledge from a wide range of areas; • show a good understanding of the concepts involved; • make good use of knowledge derived from personal experience and study; B • select and use a form and style of writing appropriate to purpose and complex subject matter with facility; • communicate complex ideas clearly and accurately, in a concise, logical and relevant way; C • analyse issues and problems well and evaluate them appropriately; • develop complex reasoned arguments and draw sound conclusions on the evidence; Band 2 The candidate demonstrates the following abilities where appropriate to: 19–24 A • select and use a good range of accurate and appropriate knowledge; • integrate knowledge from a wide range of areas; • show an understanding of the concepts involved; • demonstrate a range of awareness of personally derived and studied knowledge; B • select and use a form and style of writing appropriate to purpose and complex subject matter; • communicate complex ideas clearly and accurately, in a concise, logical and relevant way; C • analyse issues and problems and evaluate them competently; • develop complex reasoned arguments and draw conclusions on the evidence; Band 3 The candidate demonstrates the following abilities where appropriate to: 13–18 A • select and use some accurate and relevant knowledge. integrate knowledge from a limited range of areas; • show an adequate understanding of the concepts involved; • demonstrate a limited range of awareness of personally derived and studied knowledge; B • select and use a form and style of writing appropriate to purpose and subject matter; • communicate the ideas clearly and in a logical way C • undertake some analysis of issues and problems and make a superficial evaluation; • develop arguments and draw conclusions;
Mark scheme, page 12
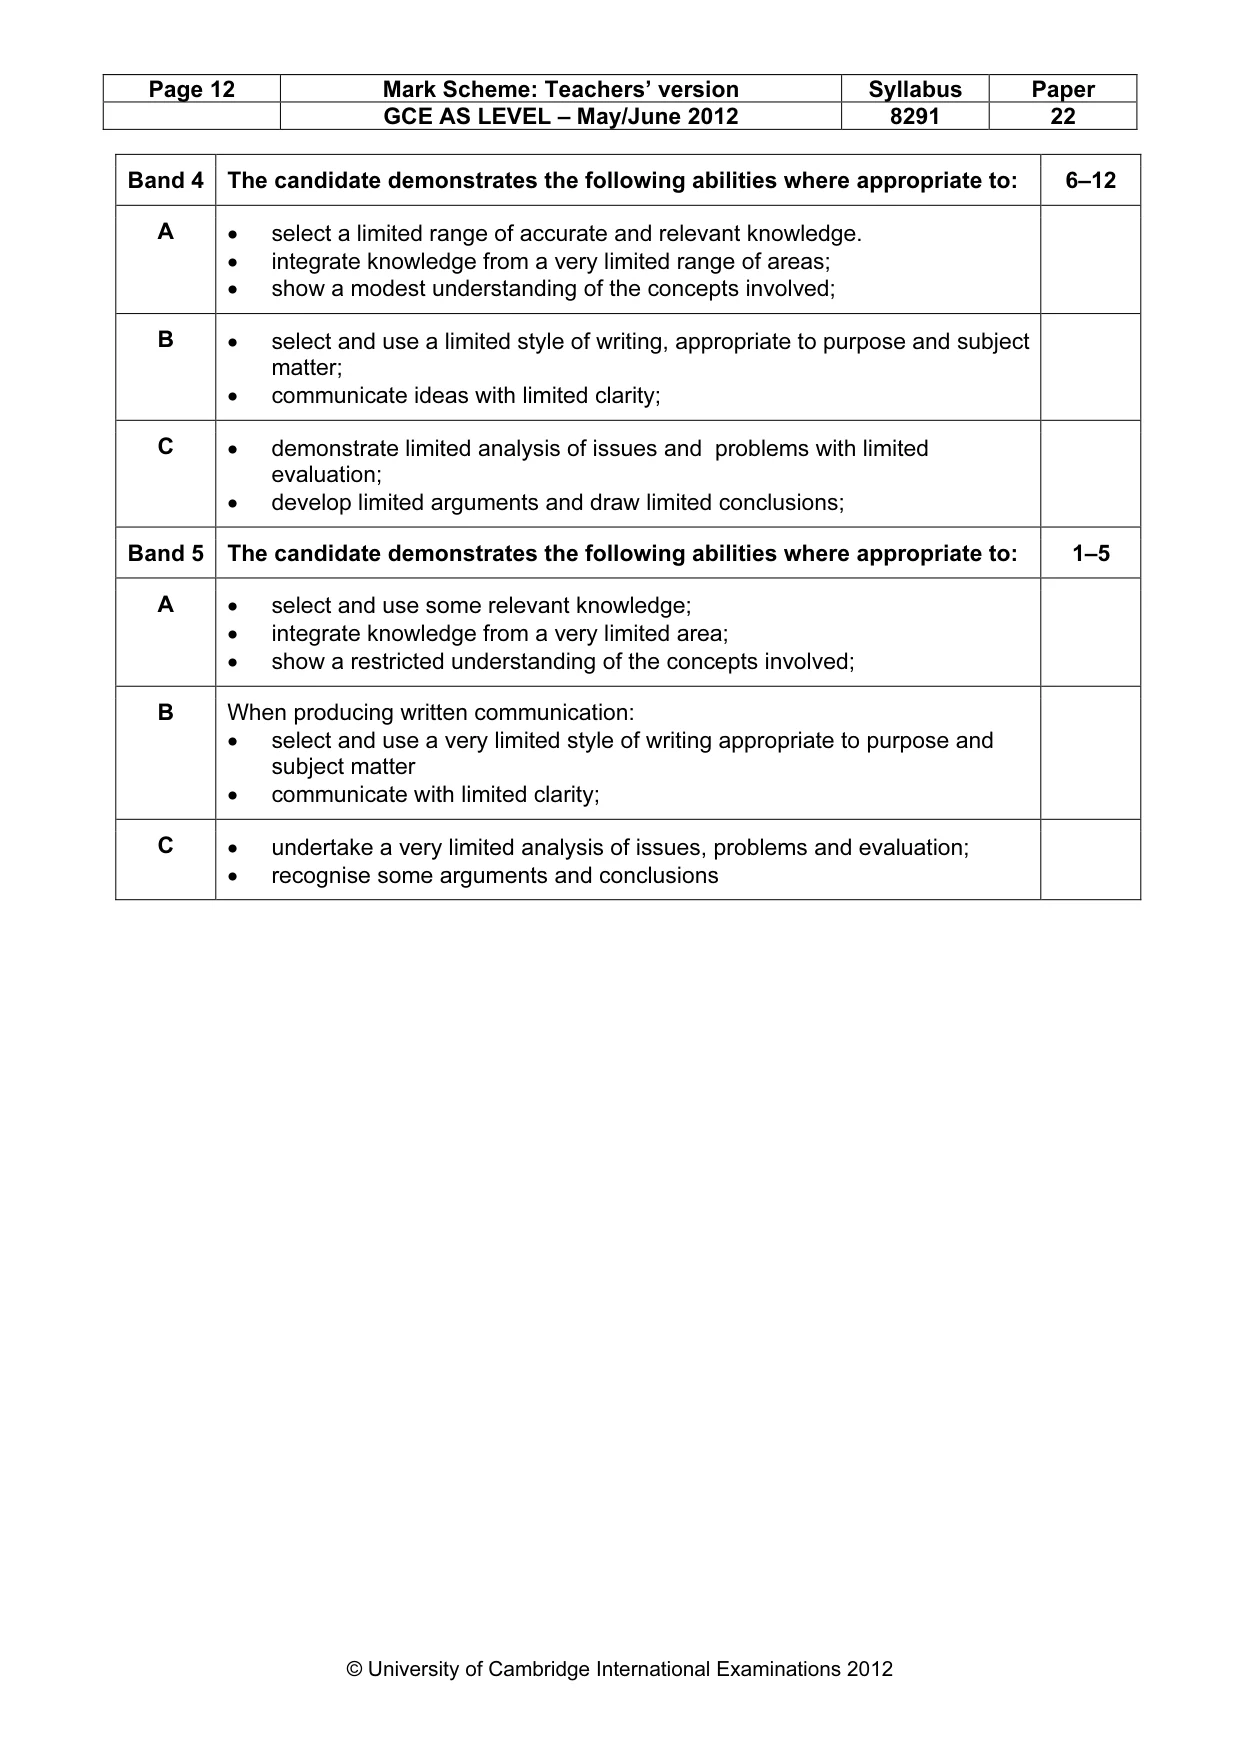
Page 12 Mark Scheme: Teachers’ version Syllabus Paper GCE AS LEVEL – May/June 2012 8291 22 © University of Cambridge International Examinations 2012 Band 4 The candidate demonstrates the following abilities where appropriate to: 6–12 A • select a limited range of accurate and relevant knowledge. • integrate knowledge from a very limited range of areas; • show a modest understanding of the concepts involved; B • select and use a limited style of writing, appropriate to purpose and subject matter; • communicate ideas with limited clarity; C • demonstrate limited analysis of issues and problems with limited evaluation; • develop limited arguments and draw limited conclusions; Band 5 The candidate demonstrates the following abilities where appropriate to: 1–5 A • select and use some relevant knowledge; • integrate knowledge from a very limited area; • show a restricted understanding of the concepts involved; B When producing written communication: • select and use a very limited style of writing appropriate to purpose and subject matter • communicate with limited clarity; C • undertake a very limited analysis of issues, problems and evaluation; • recognise some arguments and conclusions
What you needed in this session
Cambridge’s own grade thresholds for 2012 May/June, Paper 2 · Variant 2. A higher threshold means an easier paper — the bar moves with how the cohort did.