Questions as text
Q1 · In the diagram, the curve X1 shows an economy’s initial trade-off between inflation and… 9708/31 Oct/Nov 2009
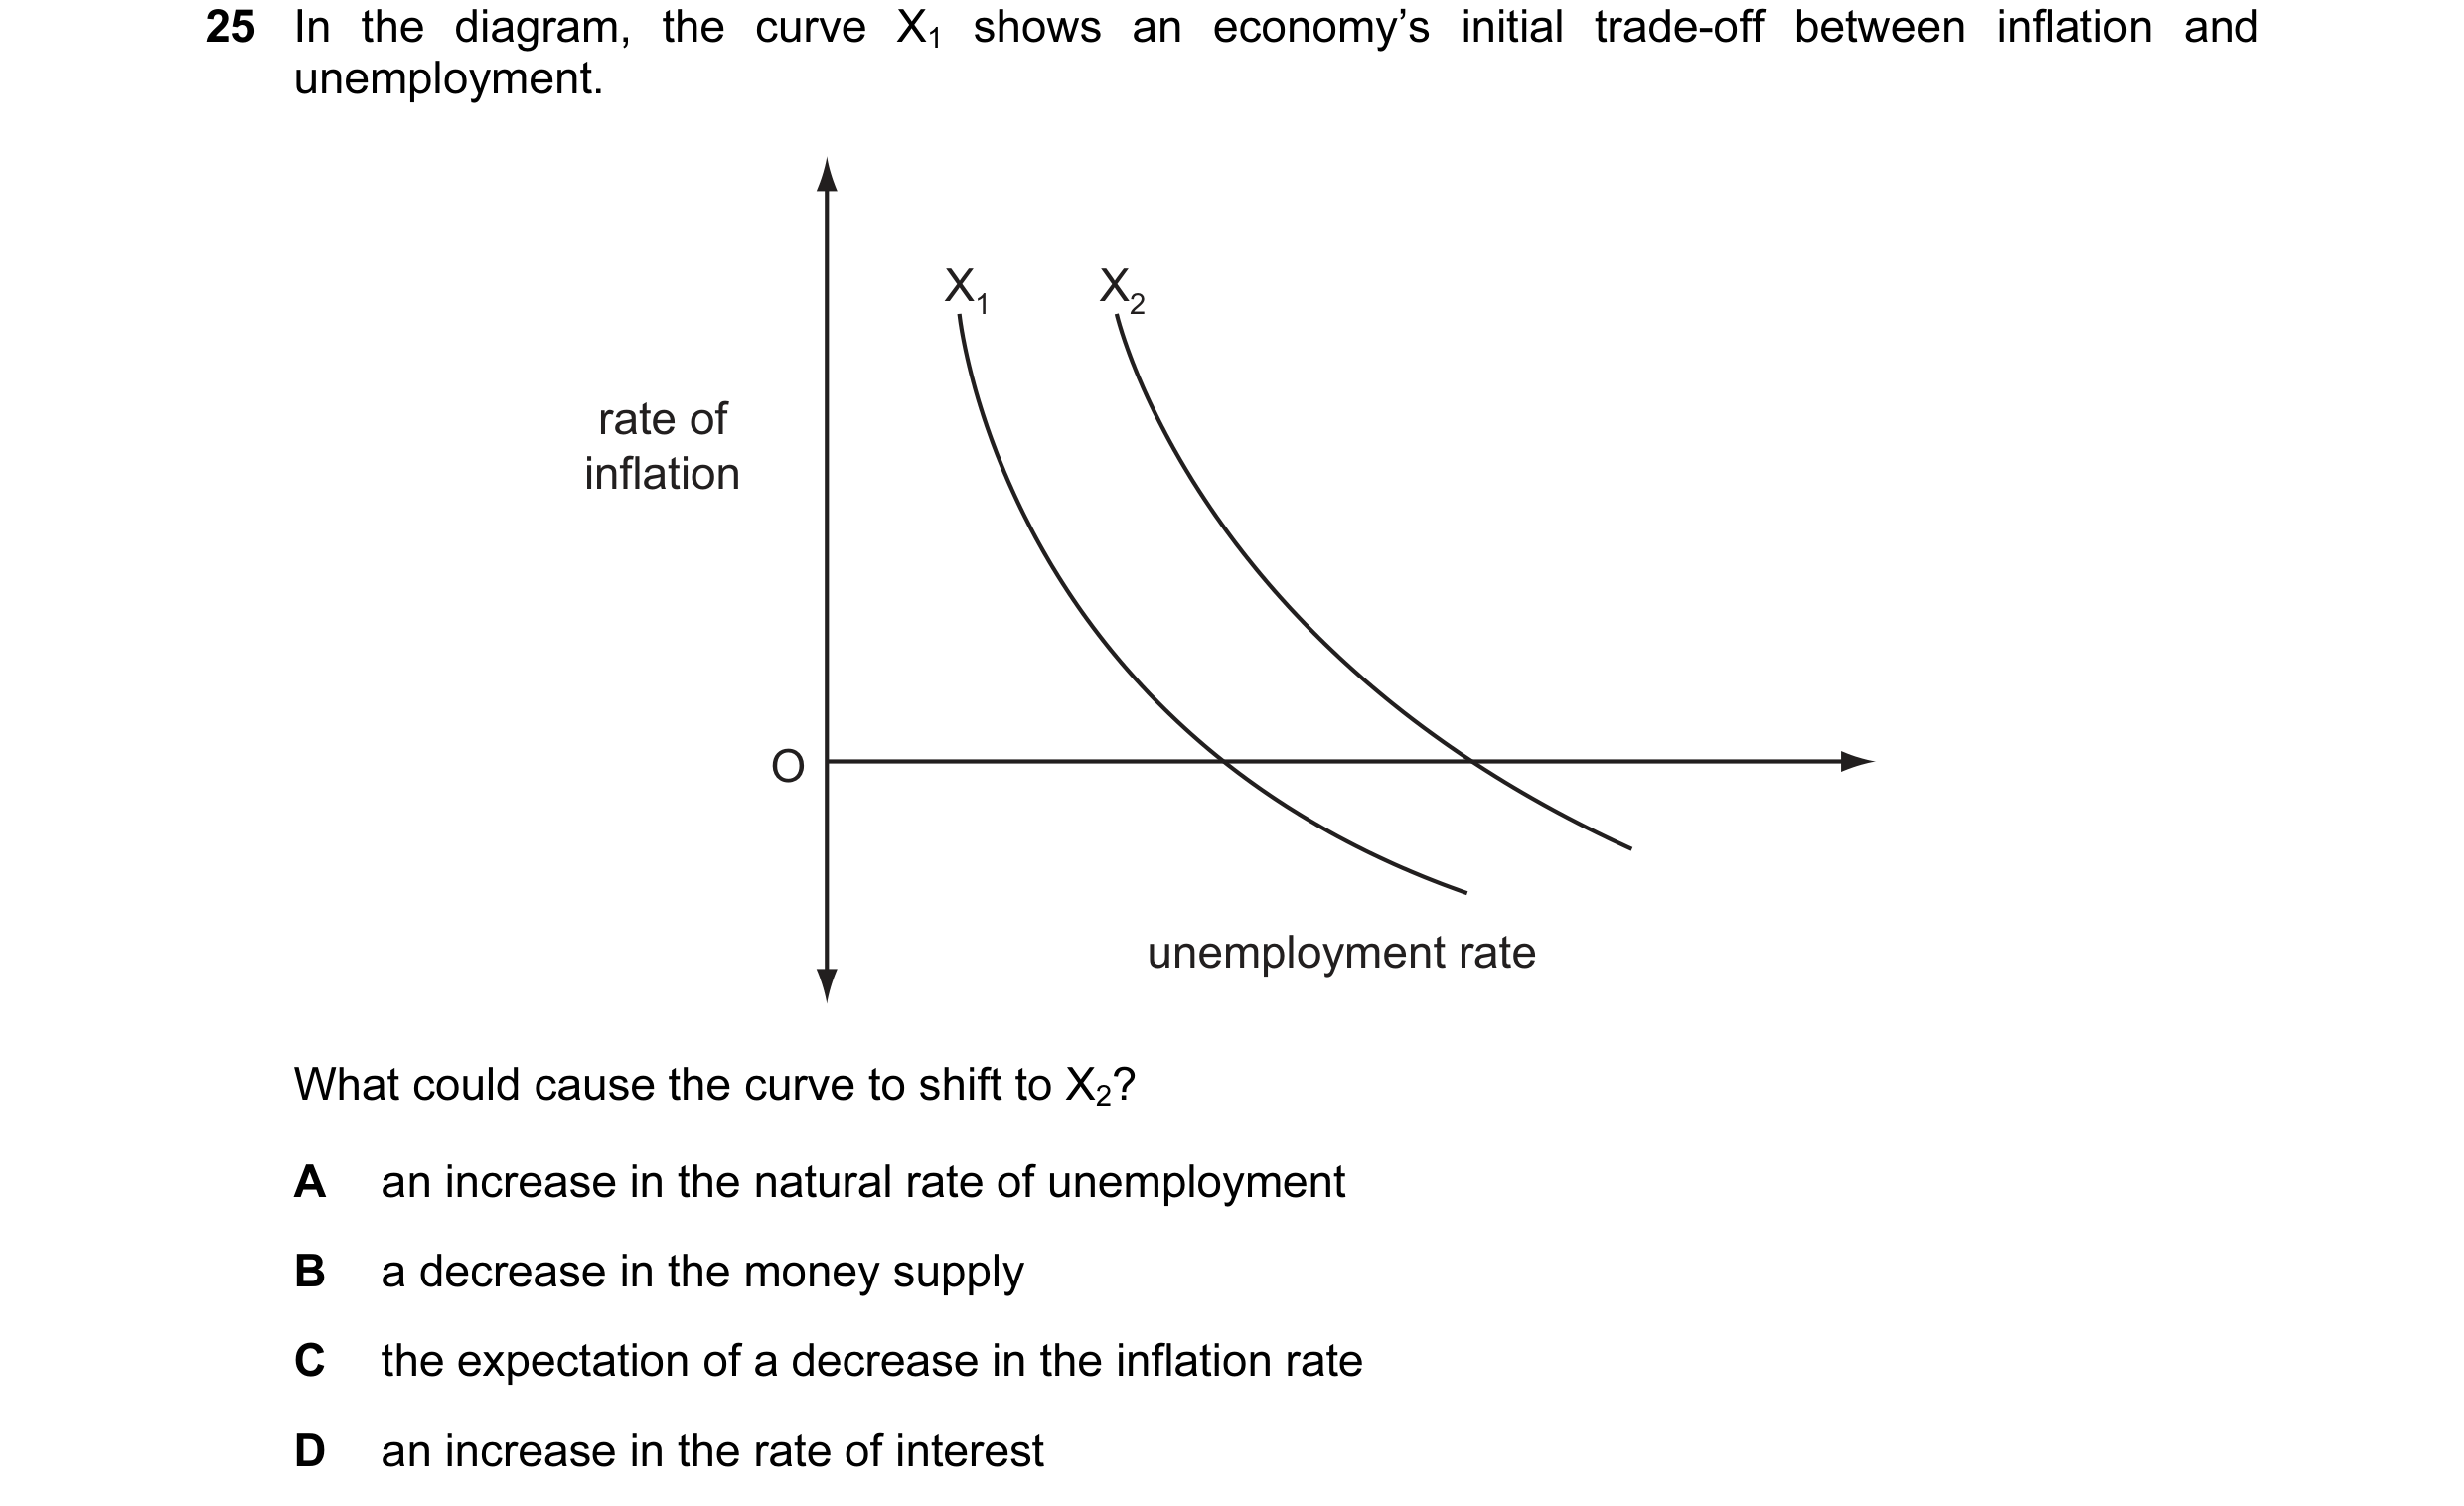
25 In the diagram, the curve X1 shows an economy’s initial trade-off between inflation and unemployment. X1 X2 rate of inflation O unemployment rate What could cause the curve to shift to X2? A an increase in the natural rate of unemployment B a decrease in the money supply C the expectation of a decrease in the inflation rate D an increase in the rate of interest
1 marks
Answer: A
This question in 9708/31 Oct/Nov 2009
Q2 · The diagram shows the relationship between the rate of increase in wages and the rate of… 9708/31 May/June 2010
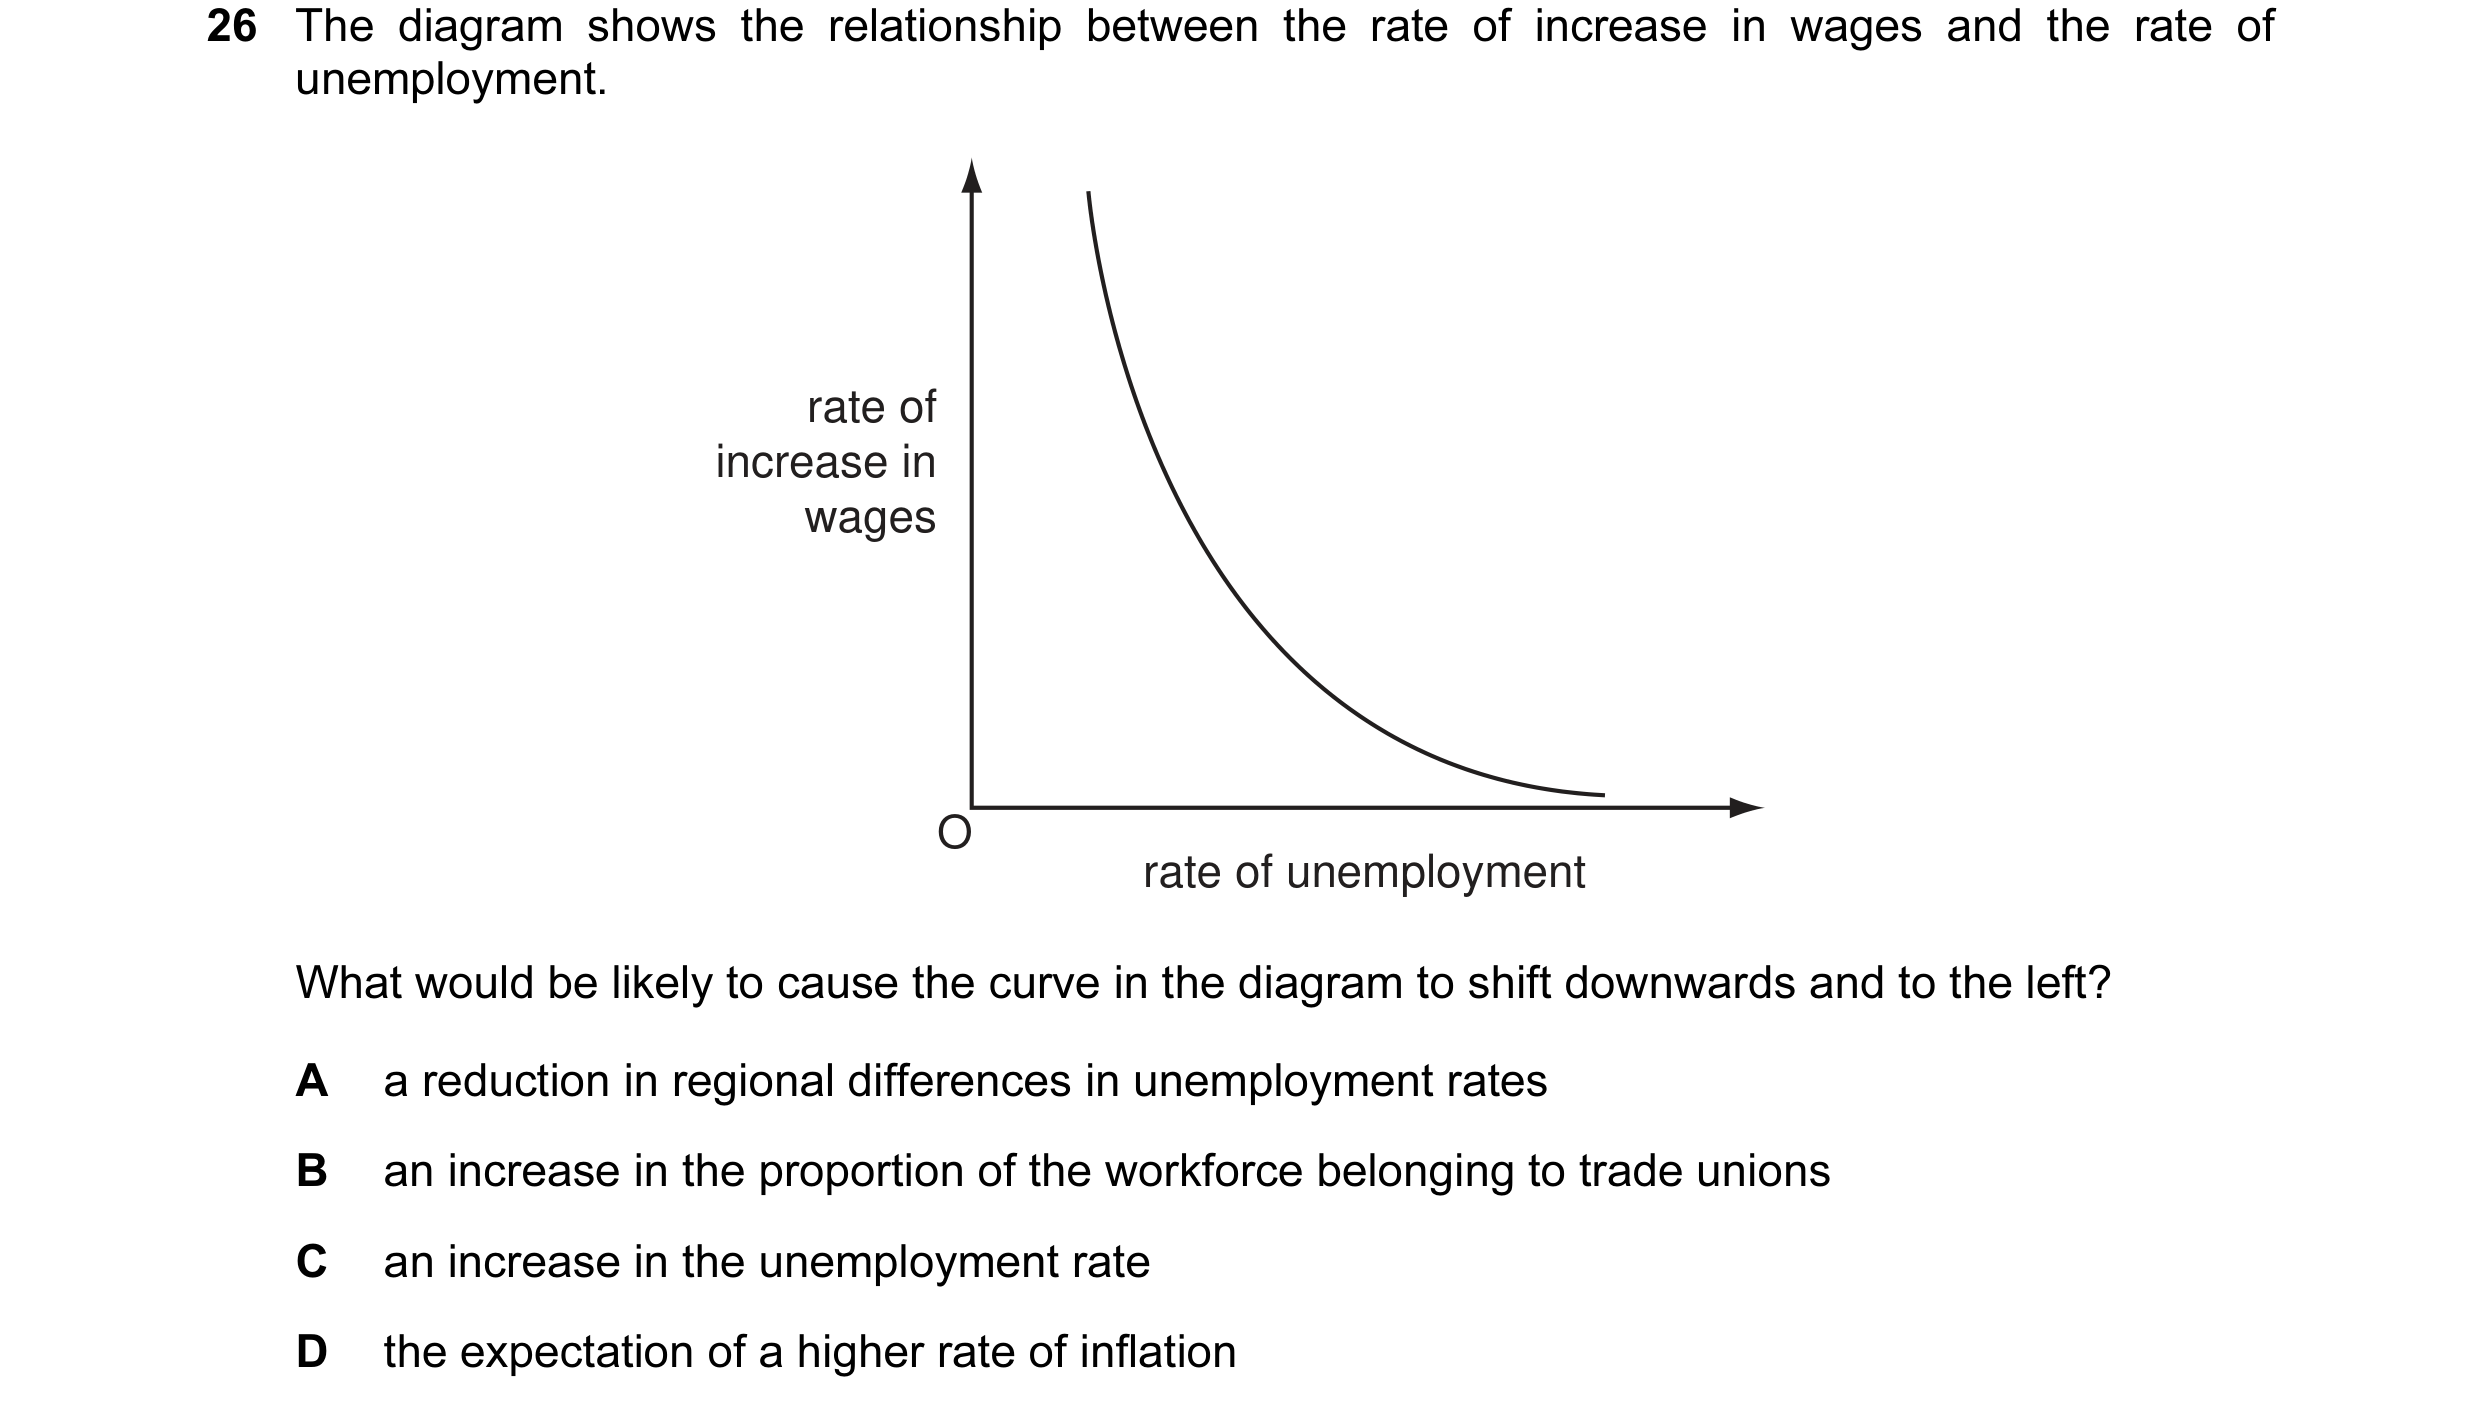
26 The diagram shows the relationship between the rate of increase in wages and the rate of unemployment. rate of increase in wages O rate of unemployment What would be likely to cause the curve in the diagram to shift downwards and to the left? A a reduction in regional differences in unemployment rates B an increase in the proportion of the workforce belonging to trade unions C an increase in the unemployment rate D the expectation of a higher rate of inflation
1 marks
Answer: A
This question in 9708/31 May/June 2010
Q3 · The diagram shows the relationship between the rate of increase in wages and the rate of… 9708/32 May/June 2010
25 The diagram shows the relationship between the rate of increase in wages and the rate of unemployment. rate of increase in wages O rate of unemployment What would be likely to cause the curve in the diagram to shift downwards and to the left? A a reduction in regional differences in unemployment rates B an increase in the proportion of the workforce belonging to trade unions C an increase in the unemployment rate D the expectation of a higher rate of inflation
1 marks
Answer: A
This question in 9708/32 May/June 2010
Q4 · The diagram shows the relationship between the rate of increase in wages and the rate of… 9708/33 May/June 2010
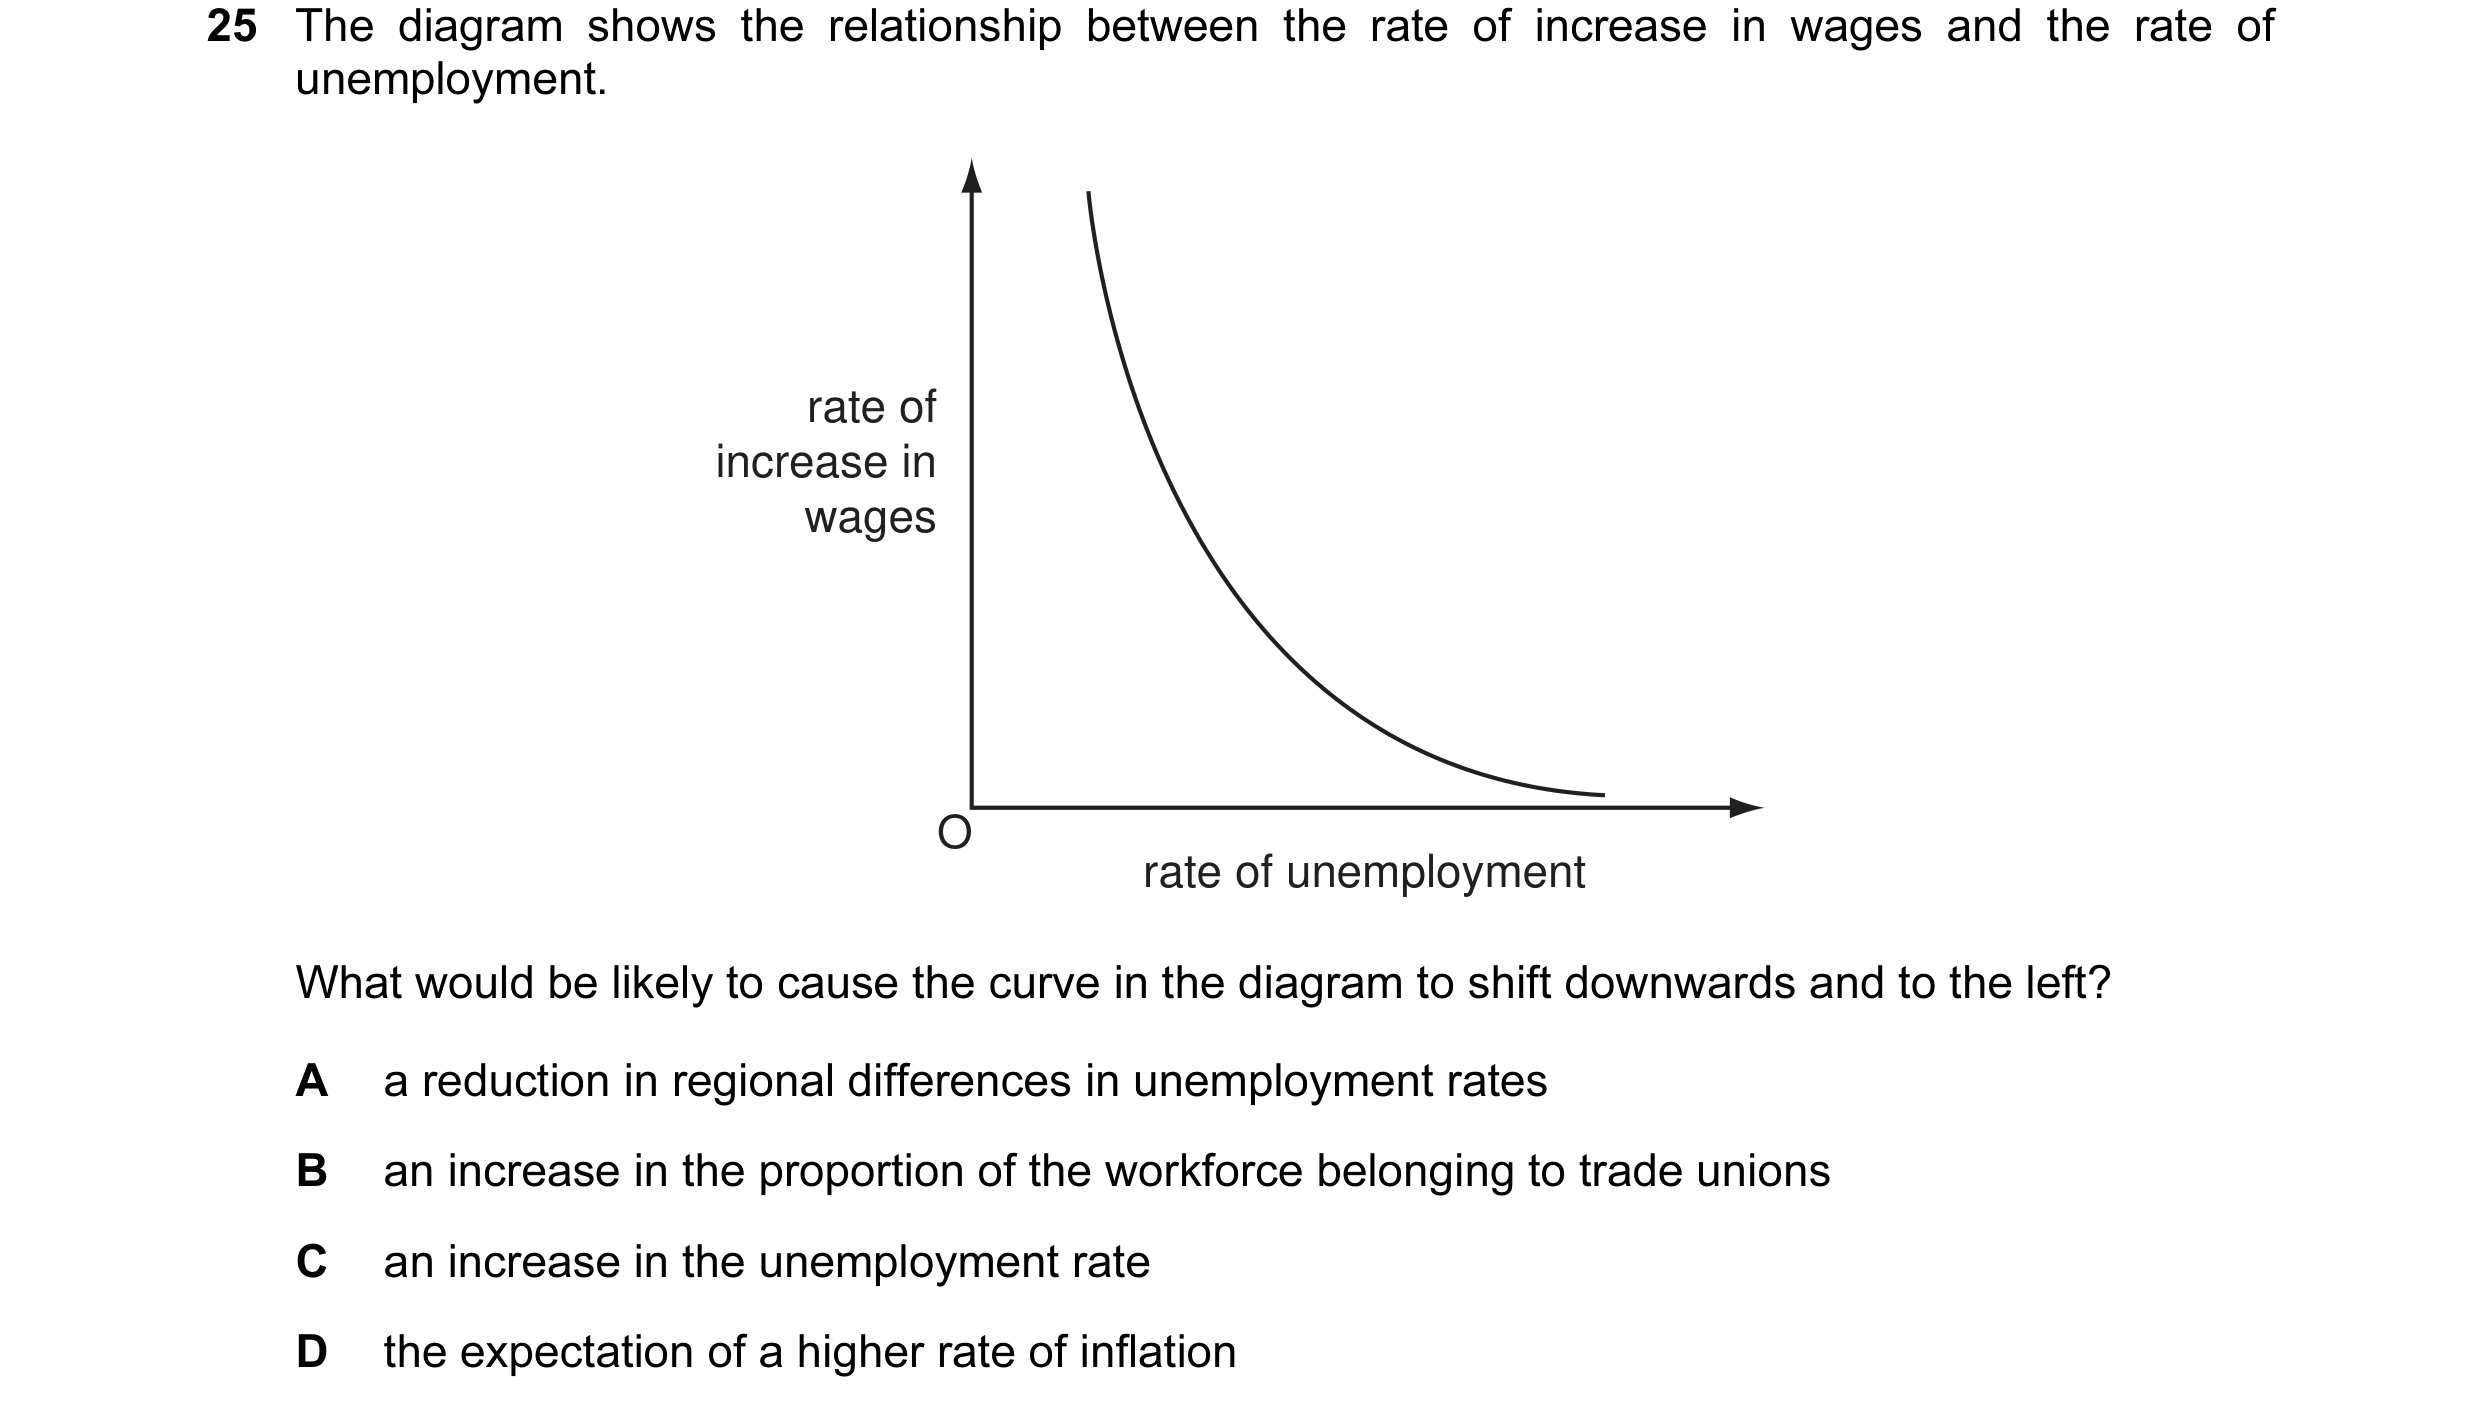
25 The diagram shows the relationship between the rate of increase in wages and the rate of unemployment. rate of increase in wages O rate of unemployment What would be likely to cause the curve in the diagram to shift downwards and to the left? A a reduction in regional differences in unemployment rates B an increase in the proportion of the workforce belonging to trade unions C an increase in the unemployment rate D the expectation of a higher rate of inflation
1 marks
Answer: A
This question in 9708/33 May/June 2010
Q5 · What is likely to be the effect of a fall in oil prices on the global economy? 9708/33 Oct/Nov 2010
24 What is likely to be the effect of a fall in oil prices on the global economy? A a decrease in the rate of economic growth B a decrease in unemployment C a strengthening of cost-push inflation D a weakening of demand-pull inflation
1 marks
Answer: B
This question in 9708/33 Oct/Nov 2010
Q6 · The table shows some indicators of macro-economic performance in the US economy for five… 9708/31 May/June 2011
23 The table shows some indicators of macro-economic performance in the US economy for five decades. economic target 1950s 1960s 1970s 1980s 1990s real GDP growth (average %) 4.18 4.43 3.28 3.02 3.03 inflation (average %) 2.07 2.33 7.09 5.66 3.00 unemployment (average %) 4.51 4.78 6.22 7.27 5.76 Between which decades did the US government achieve an overall improvement in its performance with no trade-off between individual policy goals? A 1950s to 1960s B 1960s to 1970s C 1970s to 1980s D 1980s to 1990s
1 marks
Answer: D
This question in 9708/31 May/June 2011
Q7 · The table shows some indicators of macro-economic performance in the US economy for five… 9708/32 May/June 2011
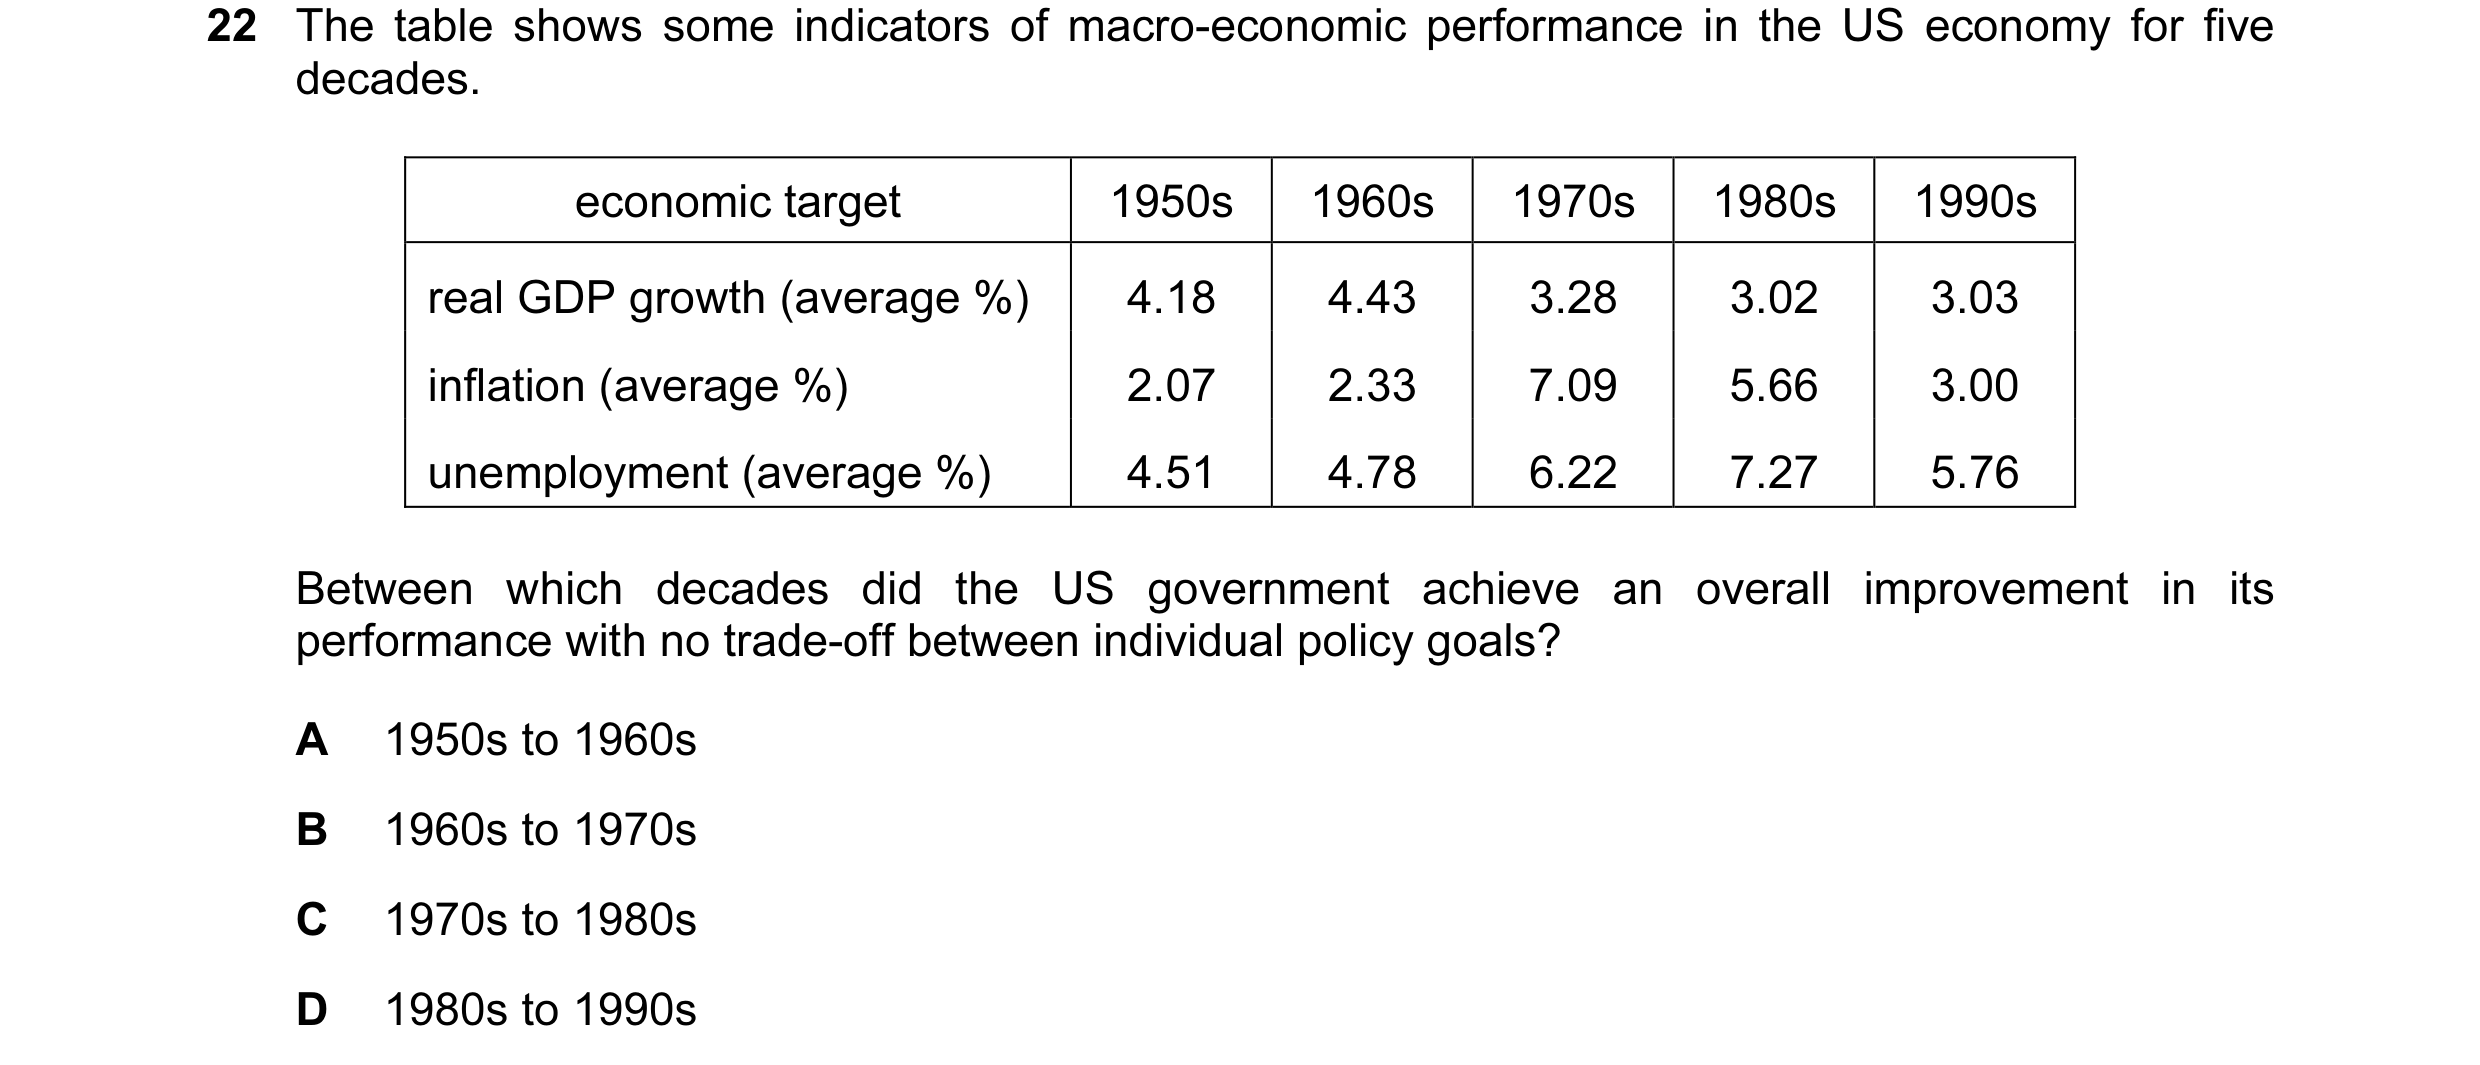
22 The table shows some indicators of macro-economic performance in the US economy for five decades. economic target 1950s 1960s 1970s 1980s 1990s real GDP growth (average %) 4.18 4.43 3.28 3.02 3.03 inflation (average %) 2.07 2.33 7.09 5.66 3.00 unemployment (average %) 4.51 4.78 6.22 7.27 5.76 Between which decades did the US government achieve an overall improvement in its performance with no trade-off between individual policy goals? A 1950s to 1960s B 1960s to 1970s C 1970s to 1980s D 1980s to 1990s
1 marks
Answer: D
This question in 9708/32 May/June 2011
Q8 · The diagram shows the relationship between the rate of inflation and the rate of… 9708/32 May/June 2011
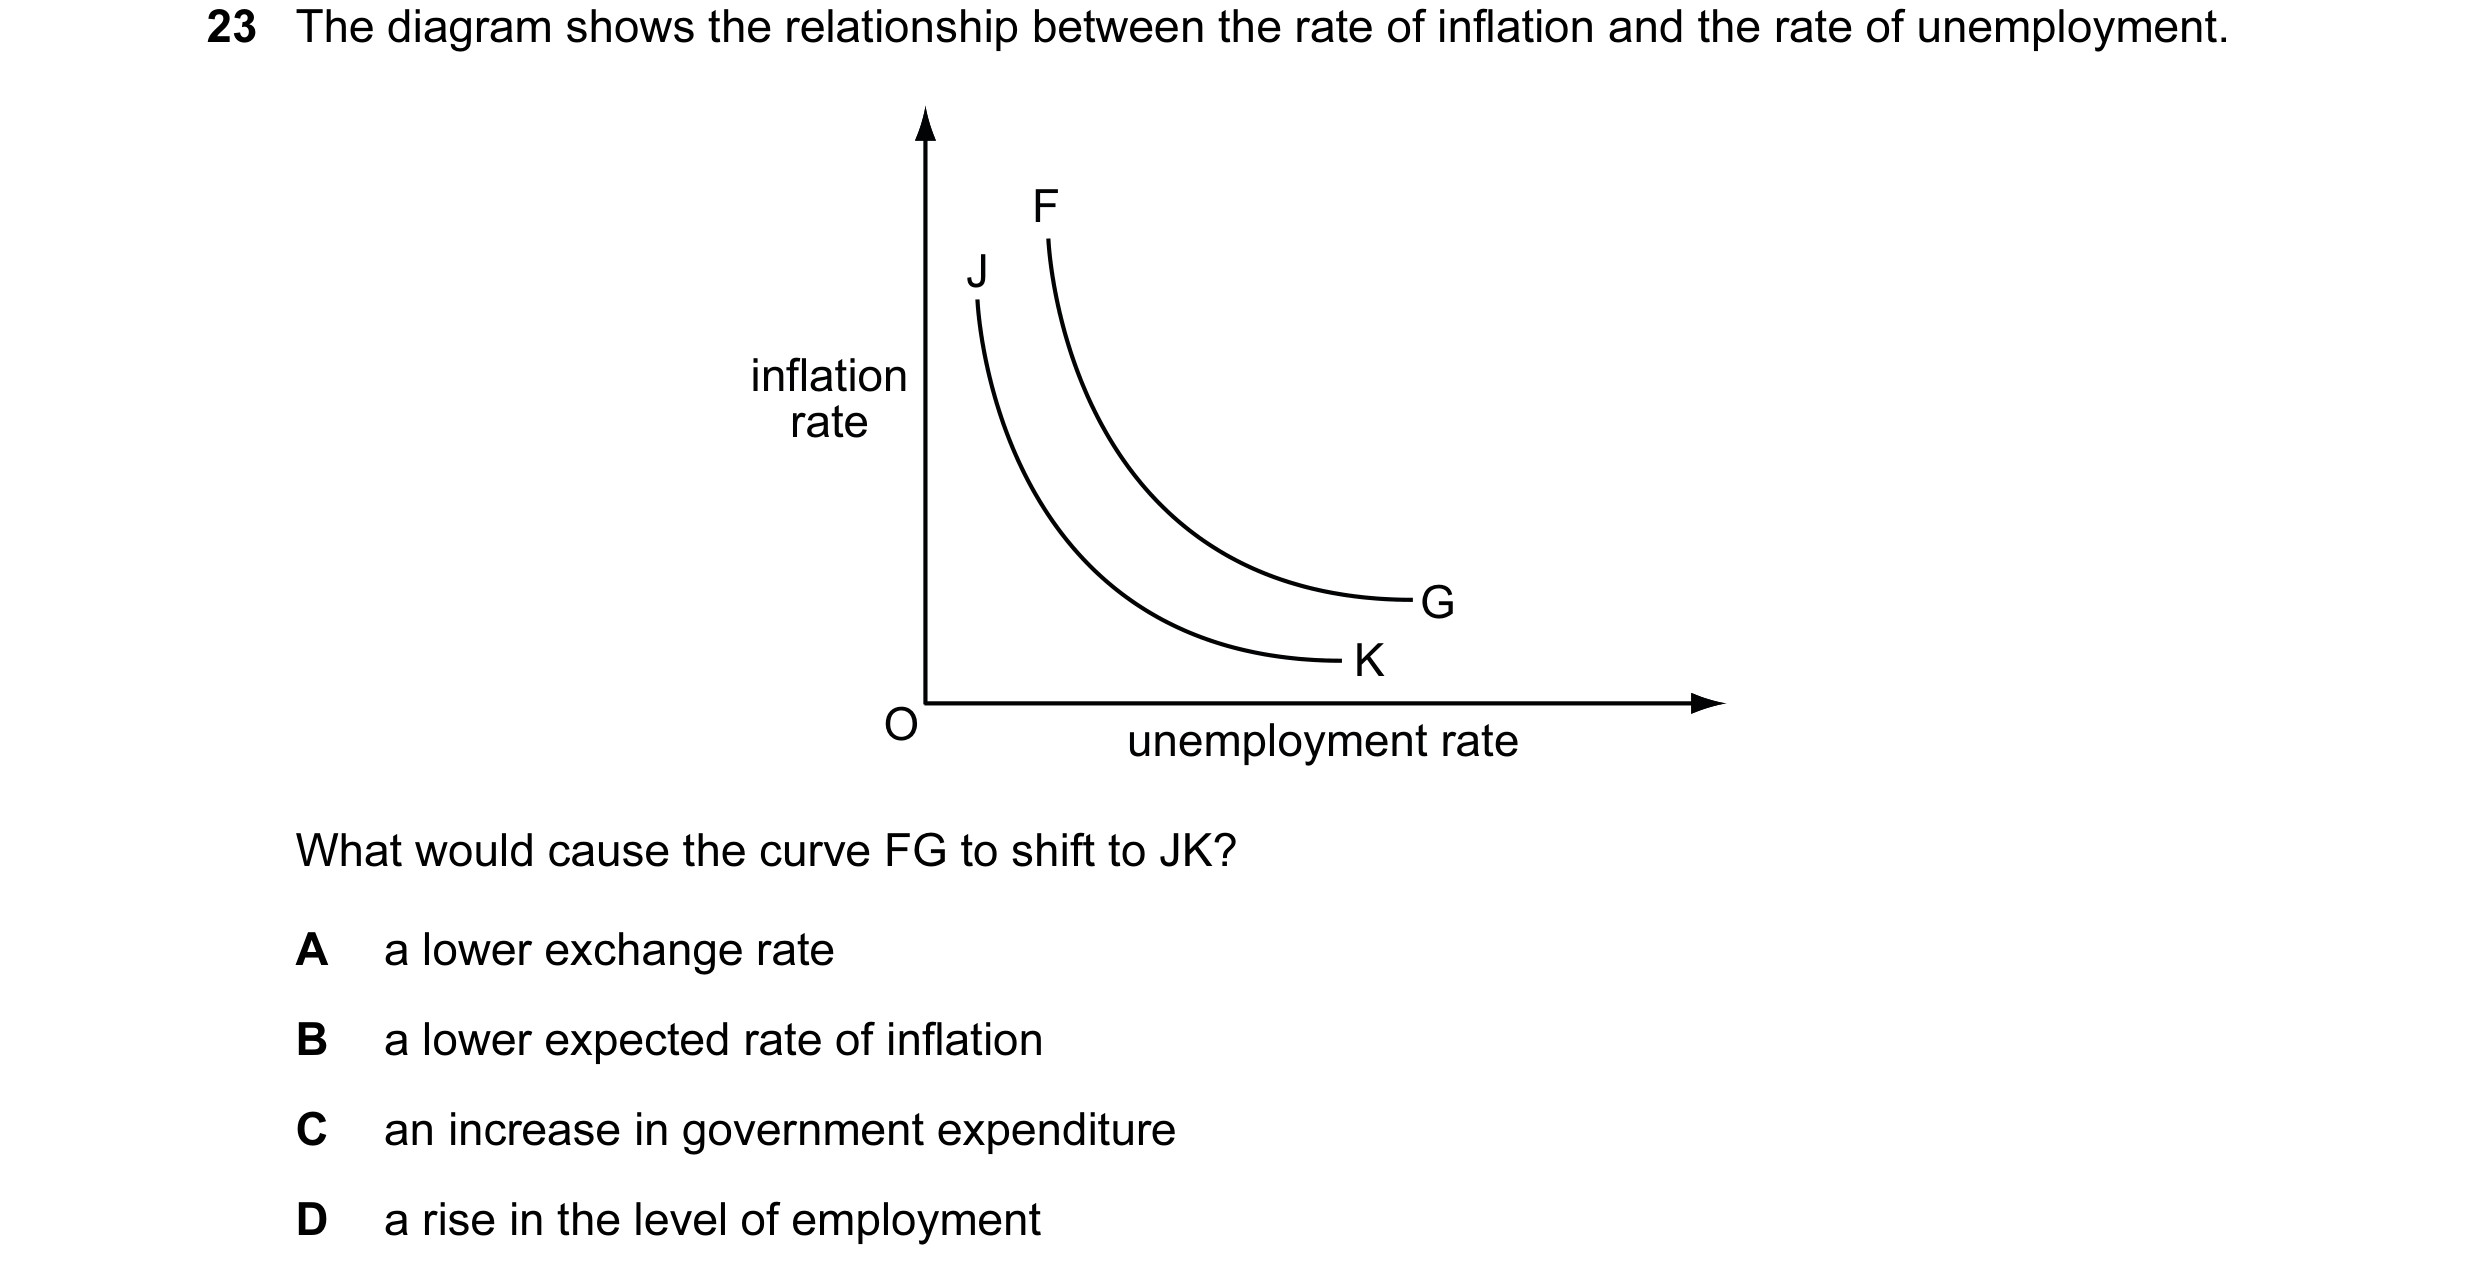
23 The diagram shows the relationship between the rate of inflation and the rate of unemployment. F J inflation rate G K O unemployment rate What would cause the curve FG to shift to JK? A a lower exchange rate B a lower expected rate of inflation C an increase in government expenditure D a rise in the level of employment
1 marks
Answer: B
This question in 9708/32 May/June 2011
Q9 · The table shows some indicators of macro-economic performance in the US economy for five… 9708/33 May/June 2011
22 The table shows some indicators of macro-economic performance in the US economy for five decades. economic target 1950s 1960s 1970s 1980s 1990s real GDP growth (average %) 4.18 4.43 3.28 3.02 3.03 inflation (average %) 2.07 2.33 7.09 5.66 3.00 unemployment (average %) 4.51 4.78 6.22 7.27 5.76 Between which decades did the US government achieve an overall improvement in its performance with no trade-off between individual policy goals? A 1950s to 1960s B 1960s to 1970s C 1970s to 1980s D 1980s to 1990s
1 marks
Answer: D
This question in 9708/33 May/June 2011
Q10 · What is a likely consequence of an increase in cyclical unemployment? 9708/33 Oct/Nov 2011
21 What is a likely consequence of an increase in cyclical unemployment? A a deficit on the current account of the balance of payments B a deterioration in the fiscal balance of the government C an increased rate of inflation D an increase in immigration
1 marks
Answer: B
This question in 9708/33 Oct/Nov 2011
Q11 · According to monetarist theory, which policy objectives are in conflict in the short run… 9708/33 Oct/Nov 2012
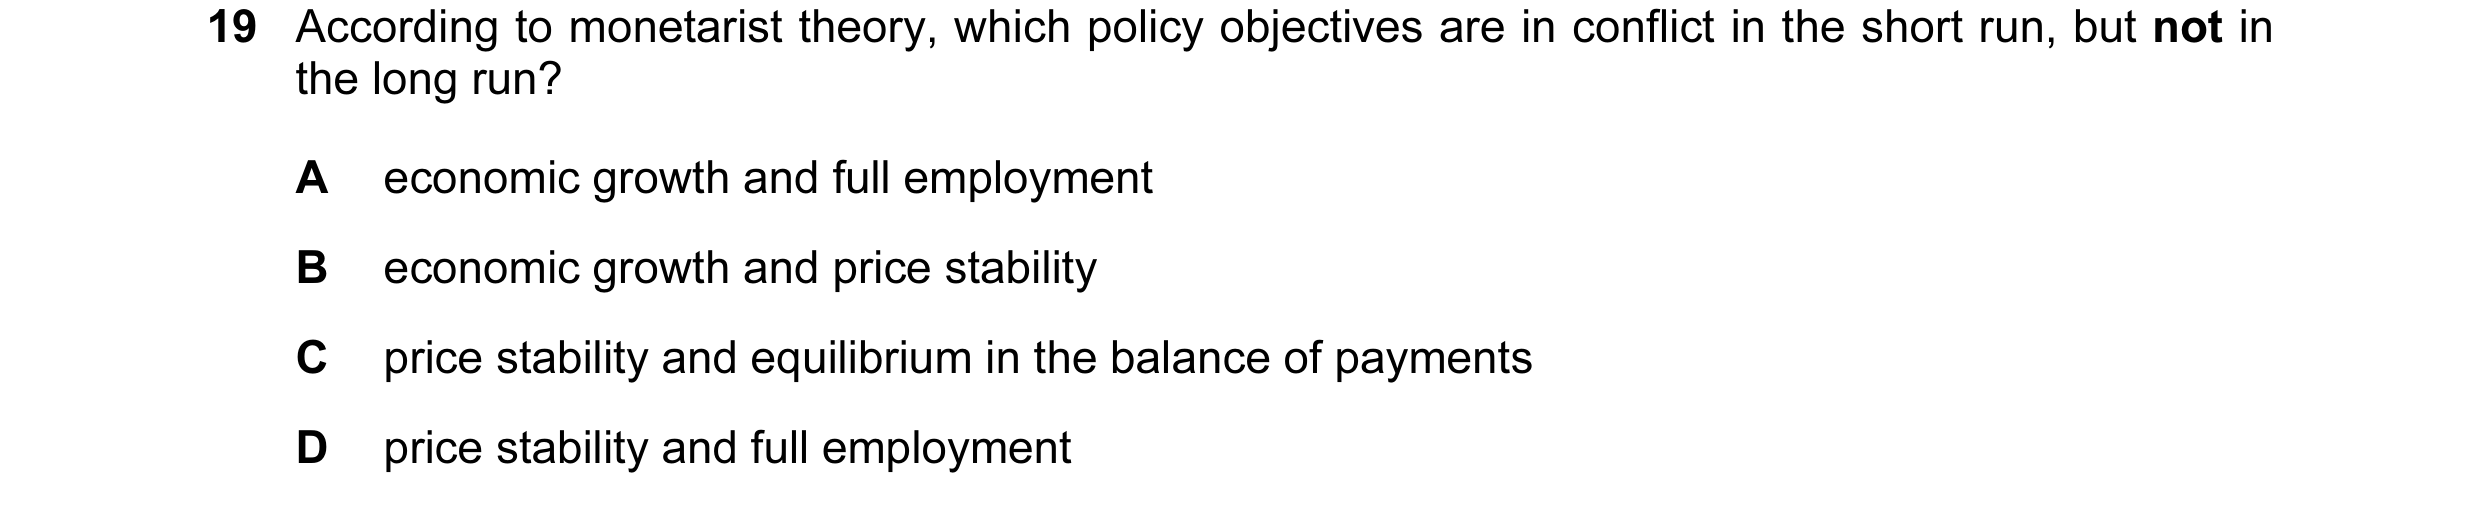
19 According to monetarist theory, which policy objectives are in conflict in the short run, but not in the long run? A economic growth and full employment B economic growth and price stability C price stability and equilibrium in the balance of payments D price stability and full employment
1 marks
This question in 9708/33 Oct/Nov 2012
Q12 · The diagram shows the short-run trade-off between a country’s inflation rate and its… 9708/31 May/June 2013
25 The diagram shows the short-run trade-off between a country’s inflation rate and its national output level. + rate of inflation O national output – What could cause the curve to shift to the left? A an increase in the money supply B an increase in labour productivity C an increase in the expected future rate of inflation D an increase in the budget deficit
1 marks
Answer: C
This question in 9708/31 May/June 2013
Q13 · The diagram shows the short-run trade-off between a country’s inflation rate and its… 9708/33 May/June 2013
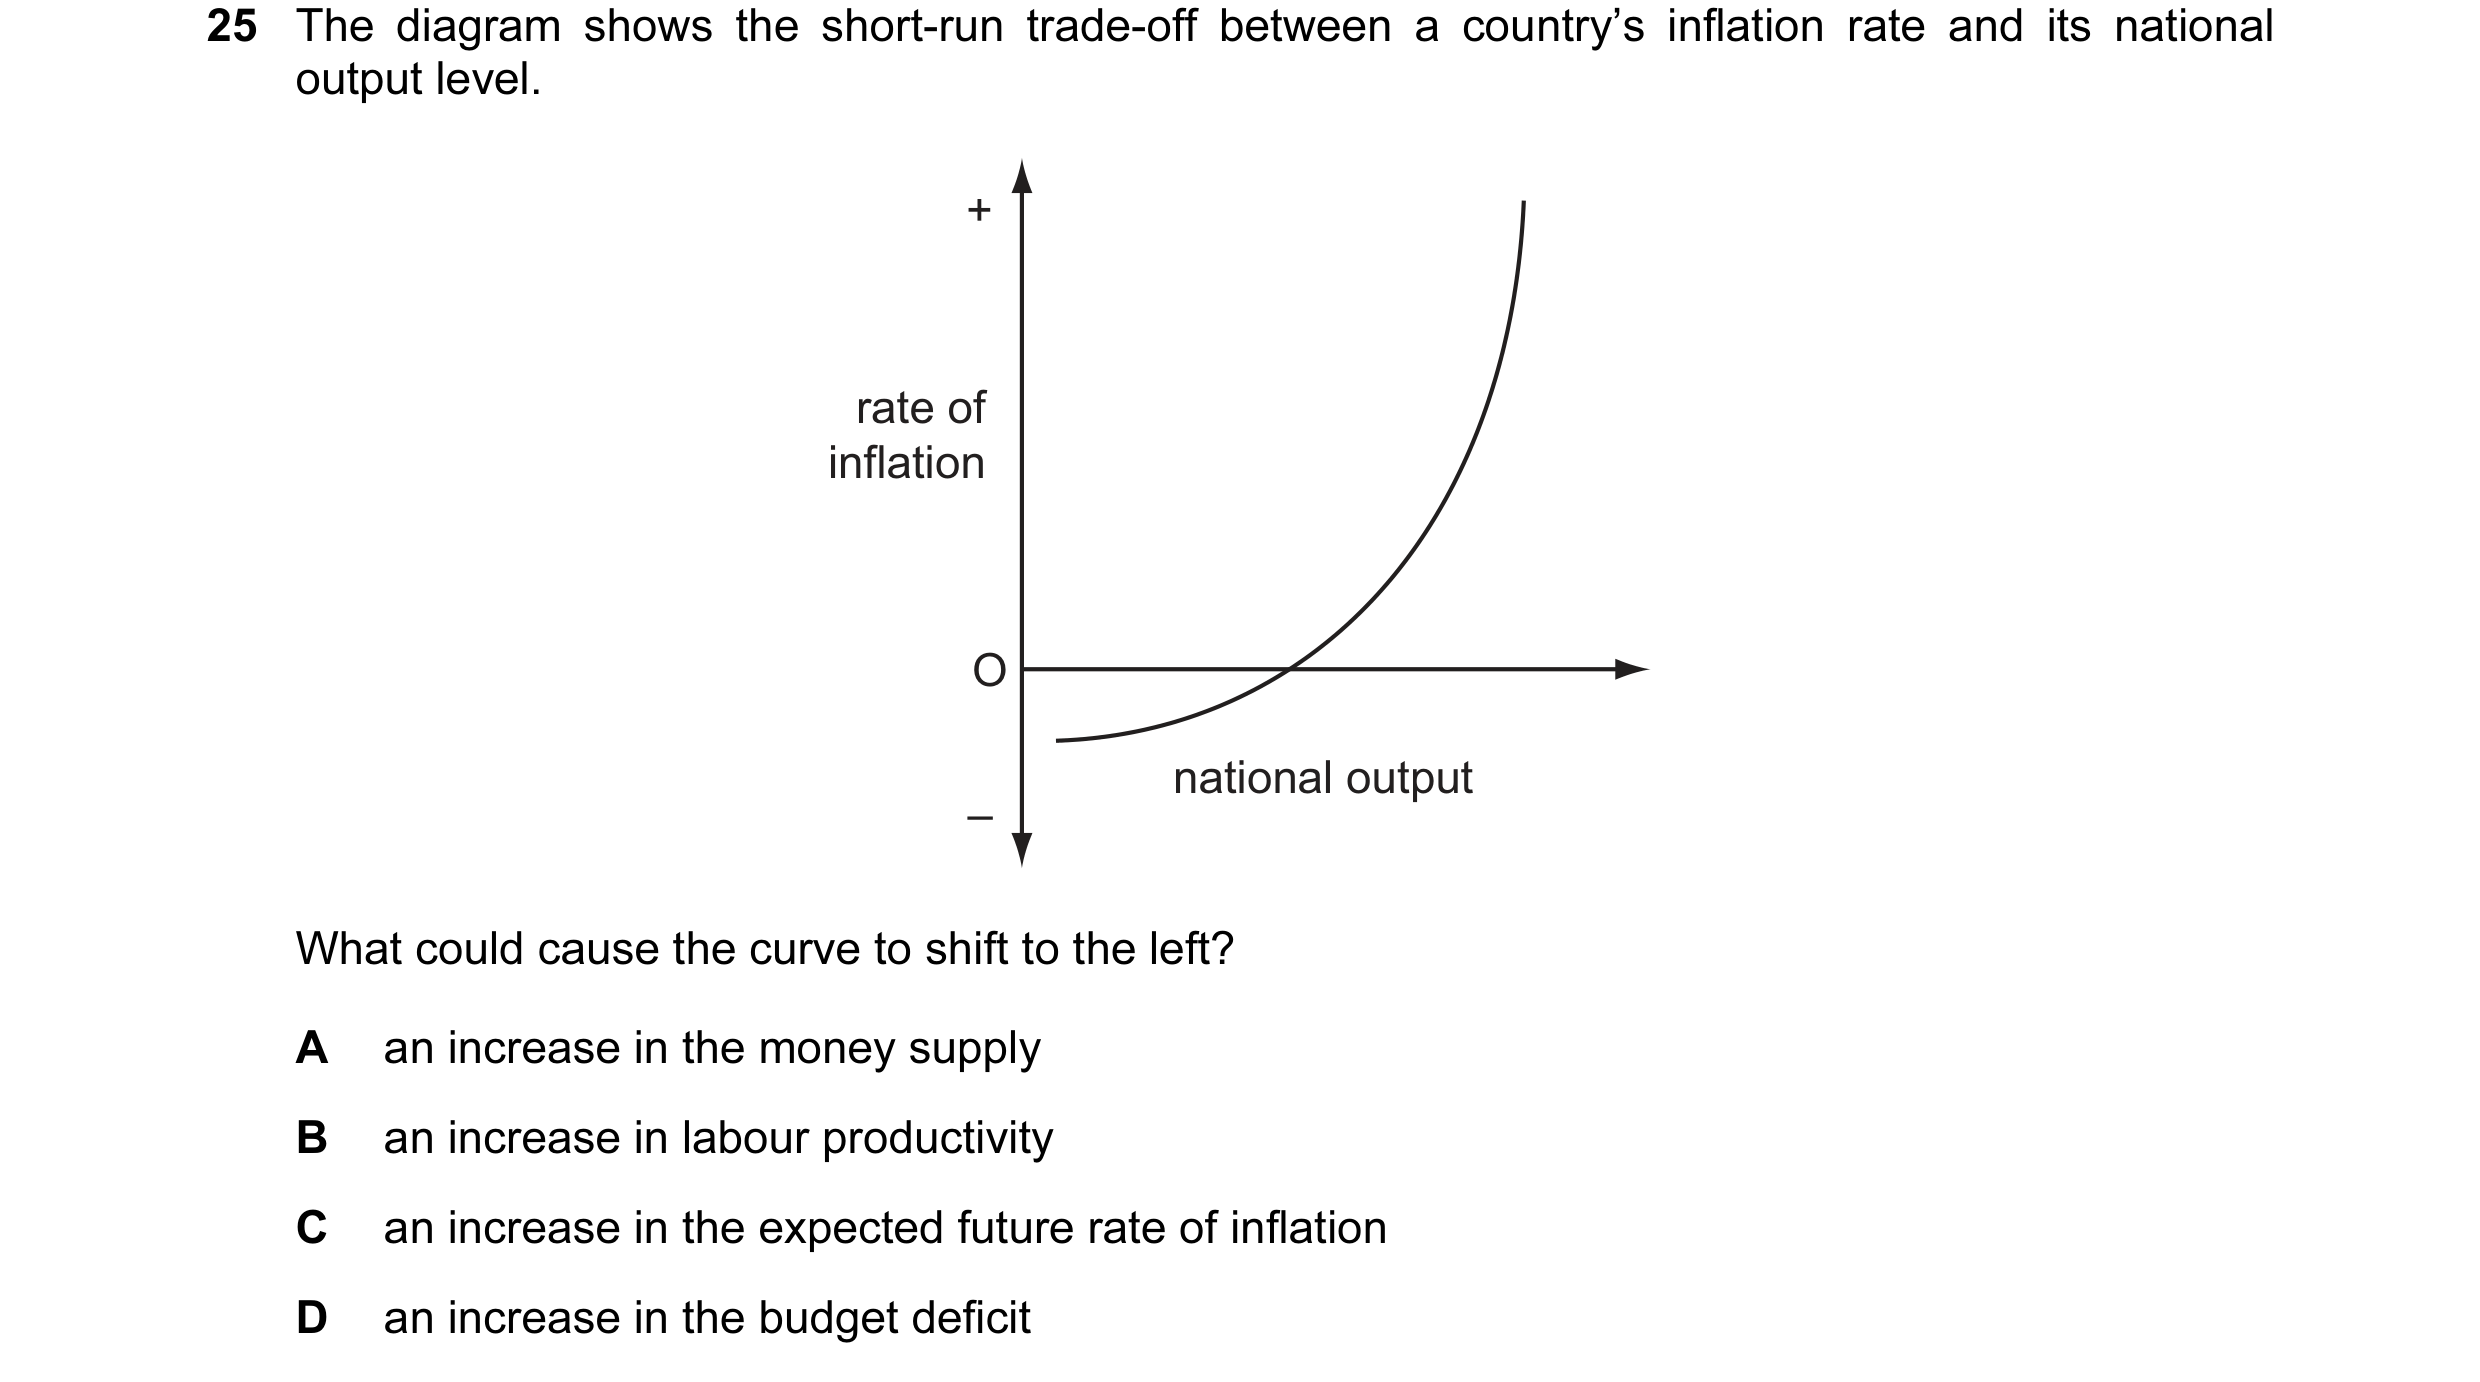
25 The diagram shows the short-run trade-off between a country’s inflation rate and its national output level. + rate of inflation O national output – What could cause the curve to shift to the left? A an increase in the money supply B an increase in labour productivity C an increase in the expected future rate of inflation D an increase in the budget deficit
1 marks
Answer: C
This question in 9708/33 May/June 2013
Q14 · The diagram shows the relationship between the rate of increase in wages and the rate of… 9708/31 Oct/Nov 2013
25 The diagram shows the relationship between the rate of increase in wages and the rate of unemployment. rate of increase in wages O rate of unemployment What would be likely to cause the curve in the diagram to shift downwards and to the left? A an increase in regional differences in unemployment rates B an increase in the proportion of the workforce belonging to trade unions C an increase in the unemployment rate D the expectation of a lower rate of inflation
1 marks
Answer: D
This question in 9708/31 Oct/Nov 2013
Q15 · A country experiences cyclical unemployment due to a decrease in domestic spending 9708/32 Oct/Nov 2013
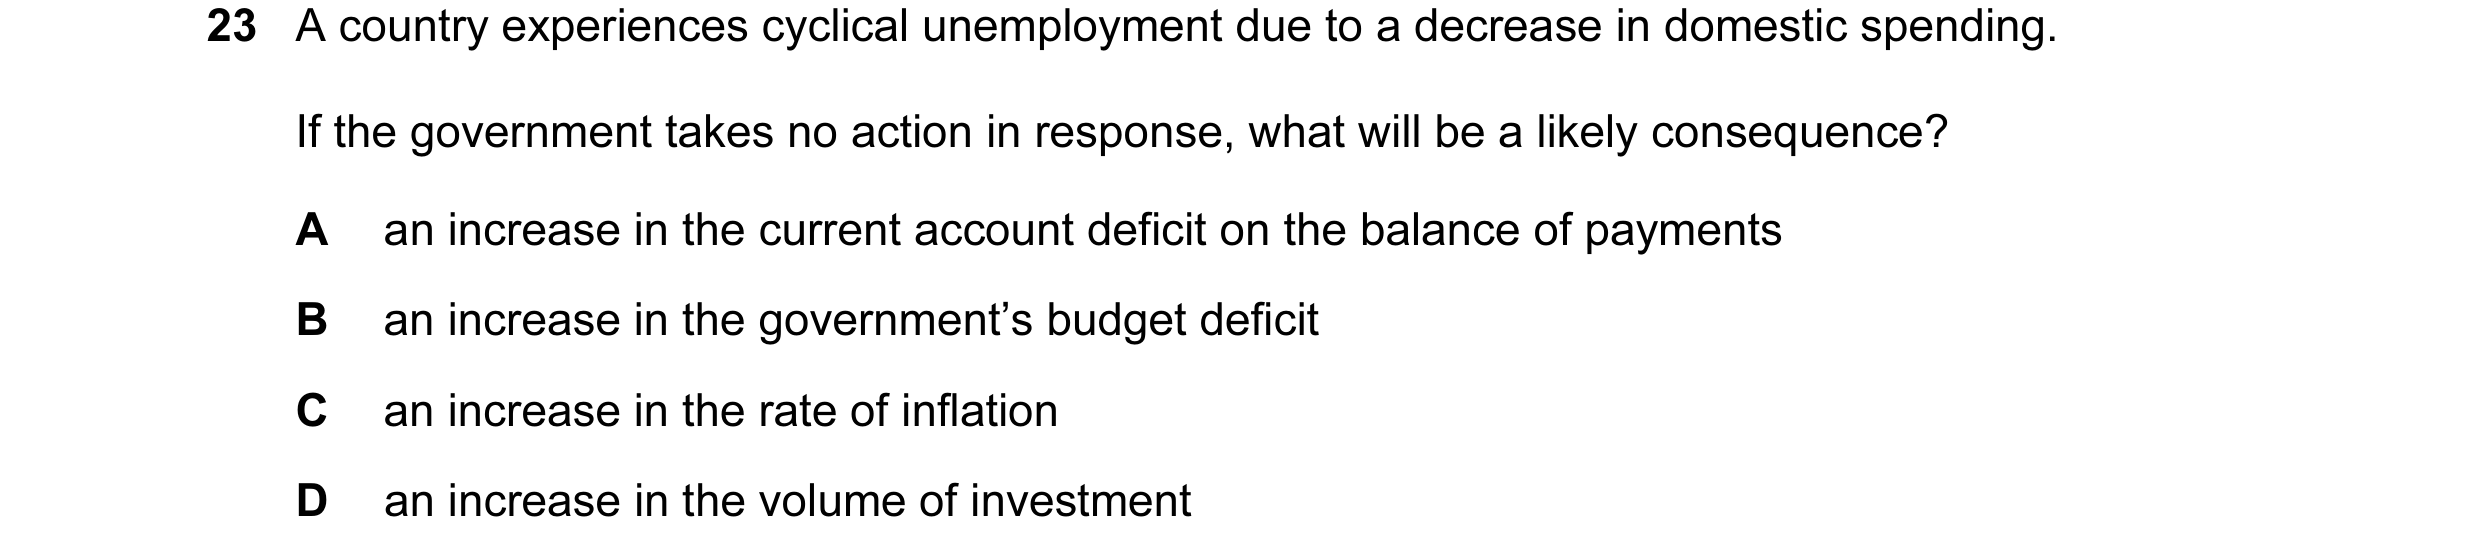
23 A country experiences cyclical unemployment due to a decrease in domestic spending. If the government takes no action in response, what will be a likely consequence? A an increase in the current account deficit on the balance of payments B an increase in the government’s budget deficit C an increase in the rate of inflation D an increase in the volume of investment
1 marks
Answer: B
This question in 9708/32 Oct/Nov 2013
Q16 · What will result from rising unemployment in an economy? 9708/33 Oct/Nov 2013
25 What will result from rising unemployment in an economy? A a reduction in the government’s budget deficit B inflationary pressure will be reduced C potential output will fall D the economy’s production possibility curve will move inwards
1 marks
Answer: B
This question in 9708/33 Oct/Nov 2013
Q17 · Why is a high ratio of government debt to GDP likely to cause a decline in a country’s… 9708/33 Oct/Nov 2013
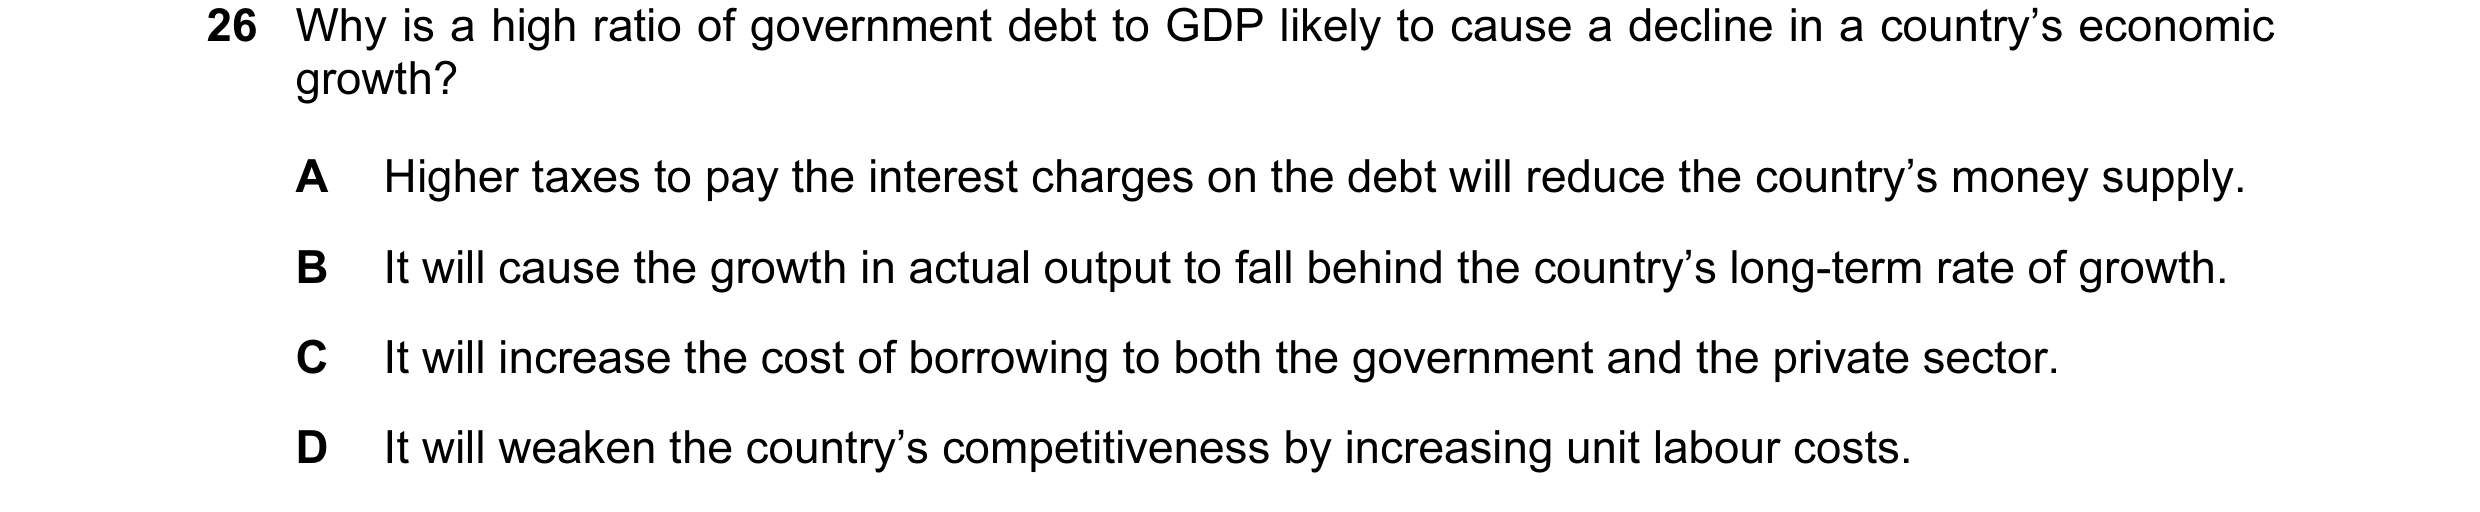
26 Why is a high ratio of government debt to GDP likely to cause a decline in a country’s economic growth? A Higher taxes to pay the interest charges on the debt will reduce the country’s money supply. B It will cause the growth in actual output to fall behind the country’s long-term rate of growth. C It will increase the cost of borrowing to both the government and the private sector. D It will weaken the country’s competitiveness by increasing unit labour costs.
1 marks
Answer: C
This question in 9708/33 Oct/Nov 2013
Q18 · In the diagram, the curve X1 shows an economy’s initial trade-off between inflation and… 9708/33 Oct/Nov 2013
29 In the diagram, the curve X1 shows an economy’s initial trade-off between inflation and unemployment. X2 X1 rate of inflation O unemployment rate What could cause the curve to shift to X2? A a decrease in the money supply B a decrease in the natural rate of unemployment C an increase in the rate of interest D the expectation of an increase in the inflation rate
1 marks
Answer: B
This question in 9708/33 Oct/Nov 2013
Q19 · In which set of circumstances is an economy likely to experience both falling inflation… 9708/31 Oct/Nov 2014
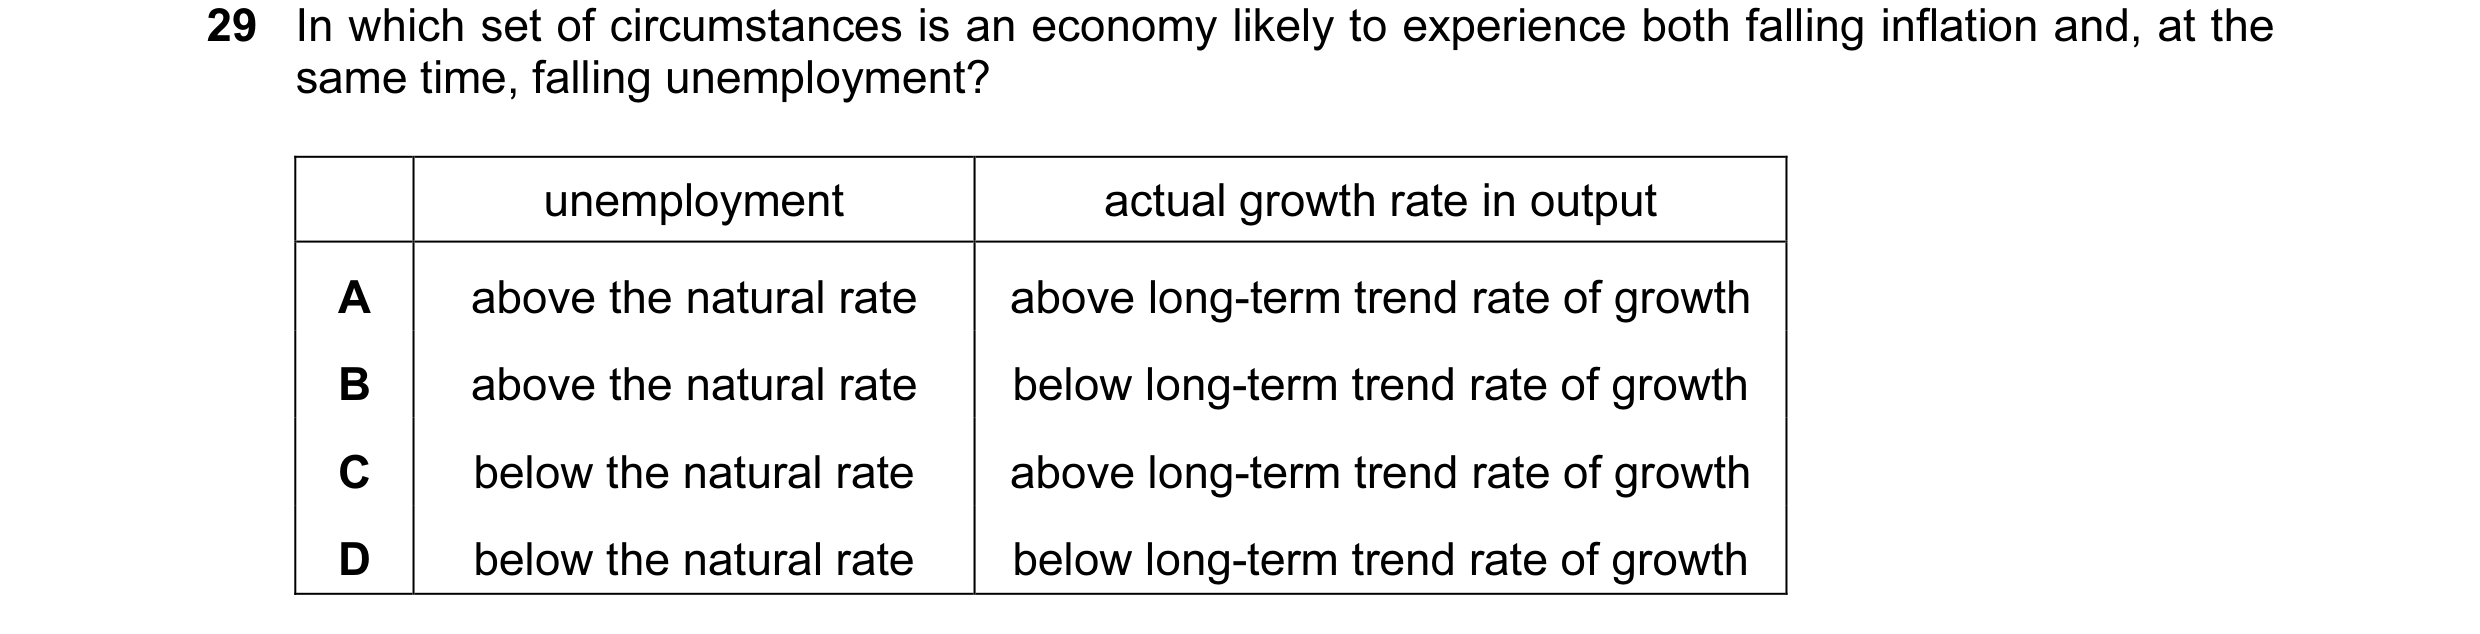
29 In which set of circumstances is an economy likely to experience both falling inflation and, at the same time, falling unemployment? unemployment actual growth rate in output A above the natural rate above long-term trend rate of growth B above the natural rate below long-term trend rate of growth C below the natural rate above long-term trend rate of growth D below the natural rate below long-term trend rate of growth
1 marks
Answer: A
This question in 9708/31 Oct/Nov 2014
Q20 · The diagram shows the relationship between the rate of inflation and the rate of… 9708/31 May/June 2015
24 The diagram shows the relationship between the rate of inflation and the rate of unemployment. F J inflation rate G K O unemployment rate What would cause the curve FG to shift to JK? A a lower exchange rate B a lower expected rate of inflation C an increase in government expenditure D a rise in the level of employment
1 marks
Answer: B
This question in 9708/31 May/June 2015
Q21 · An economy is experiencing economic growth 9708/32 May/June 2015
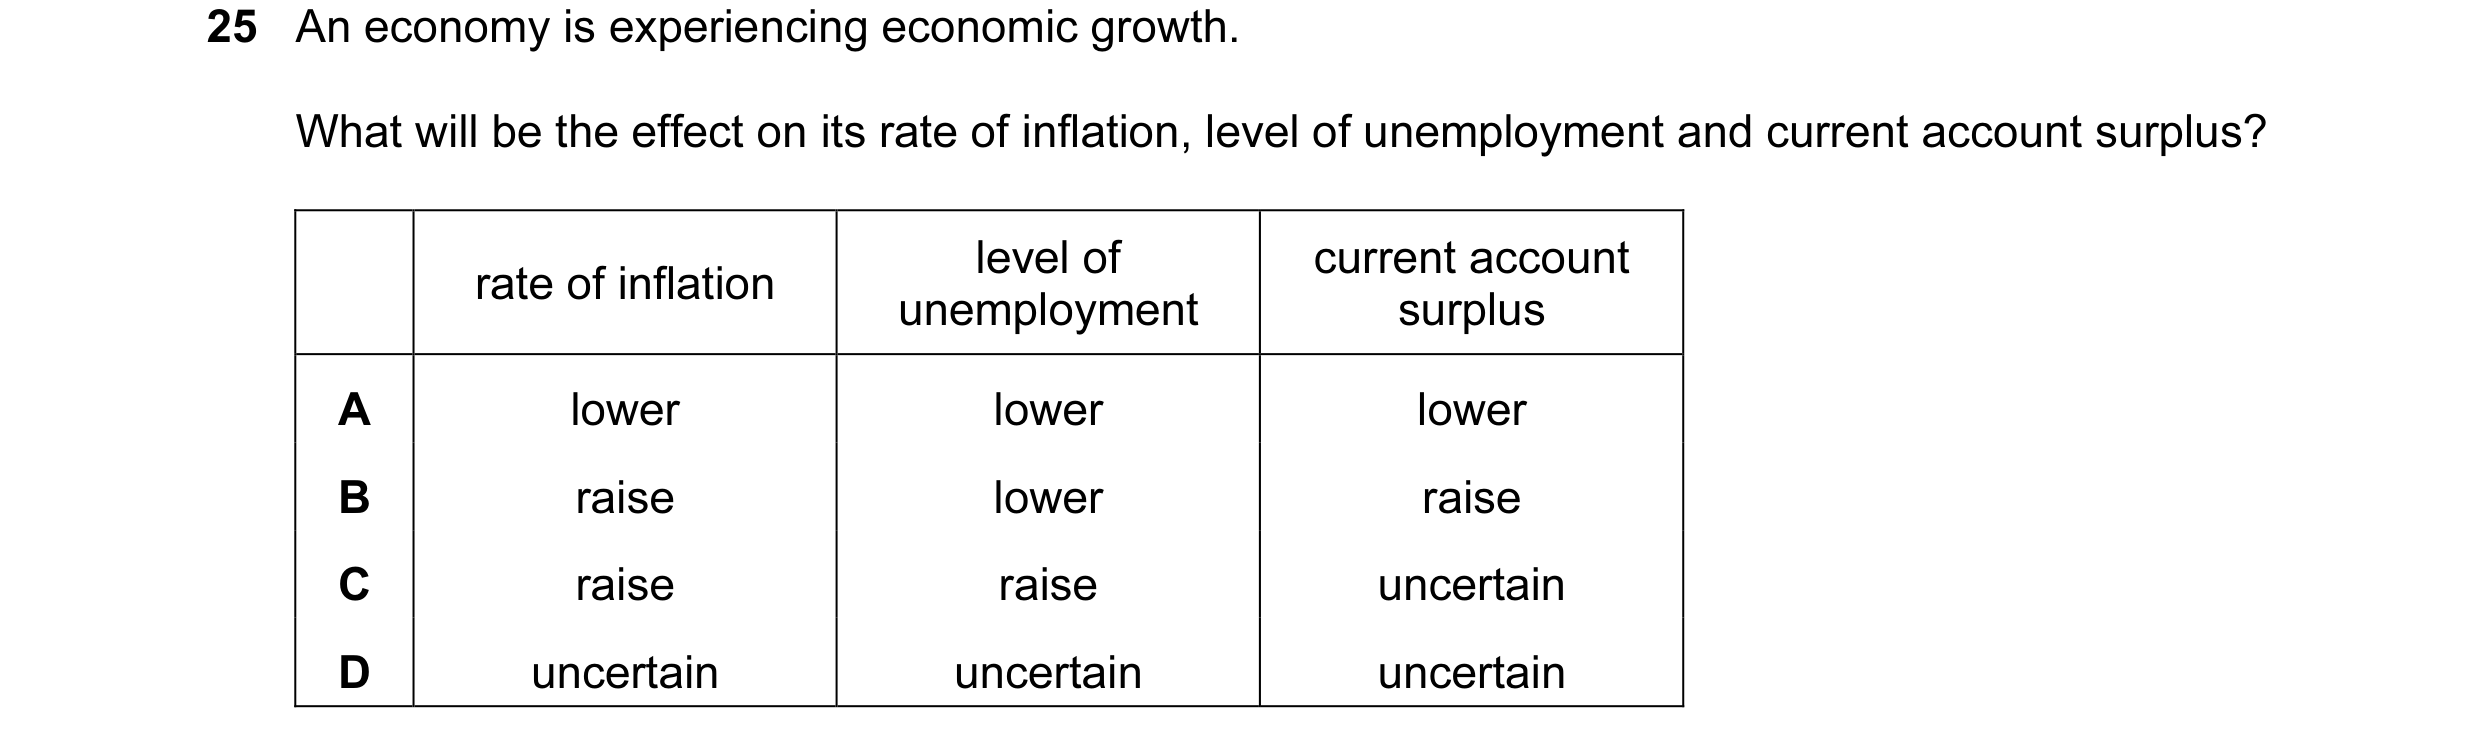
25 An economy is experiencing economic growth. What will be the effect on its rate of inflation, level of unemployment and current account surplus? level of current account rate of inflation unemployment surplus A lower lower lower B raise lower raise C raise raise uncertain D uncertain uncertain uncertain
1 marks
Answer: D
This question in 9708/32 May/June 2015
Q22 · In the diagram, the curve X1 shows an economy’s initial trade-off between inflation and… 9708/33 Oct/Nov 2015
26 In the diagram, the curve X1 shows an economy’s initial trade-off between inflation and unemployment. X1 X2 rate of inflation O unemployment rate What could cause the curve to shift to X2? A an increase in the natural rate of unemployment B a decrease in the money supply C the expectation of a decrease in the inflation rate D an increase in the rate of interest
1 marks
Answer: A
This question in 9708/33 Oct/Nov 2015
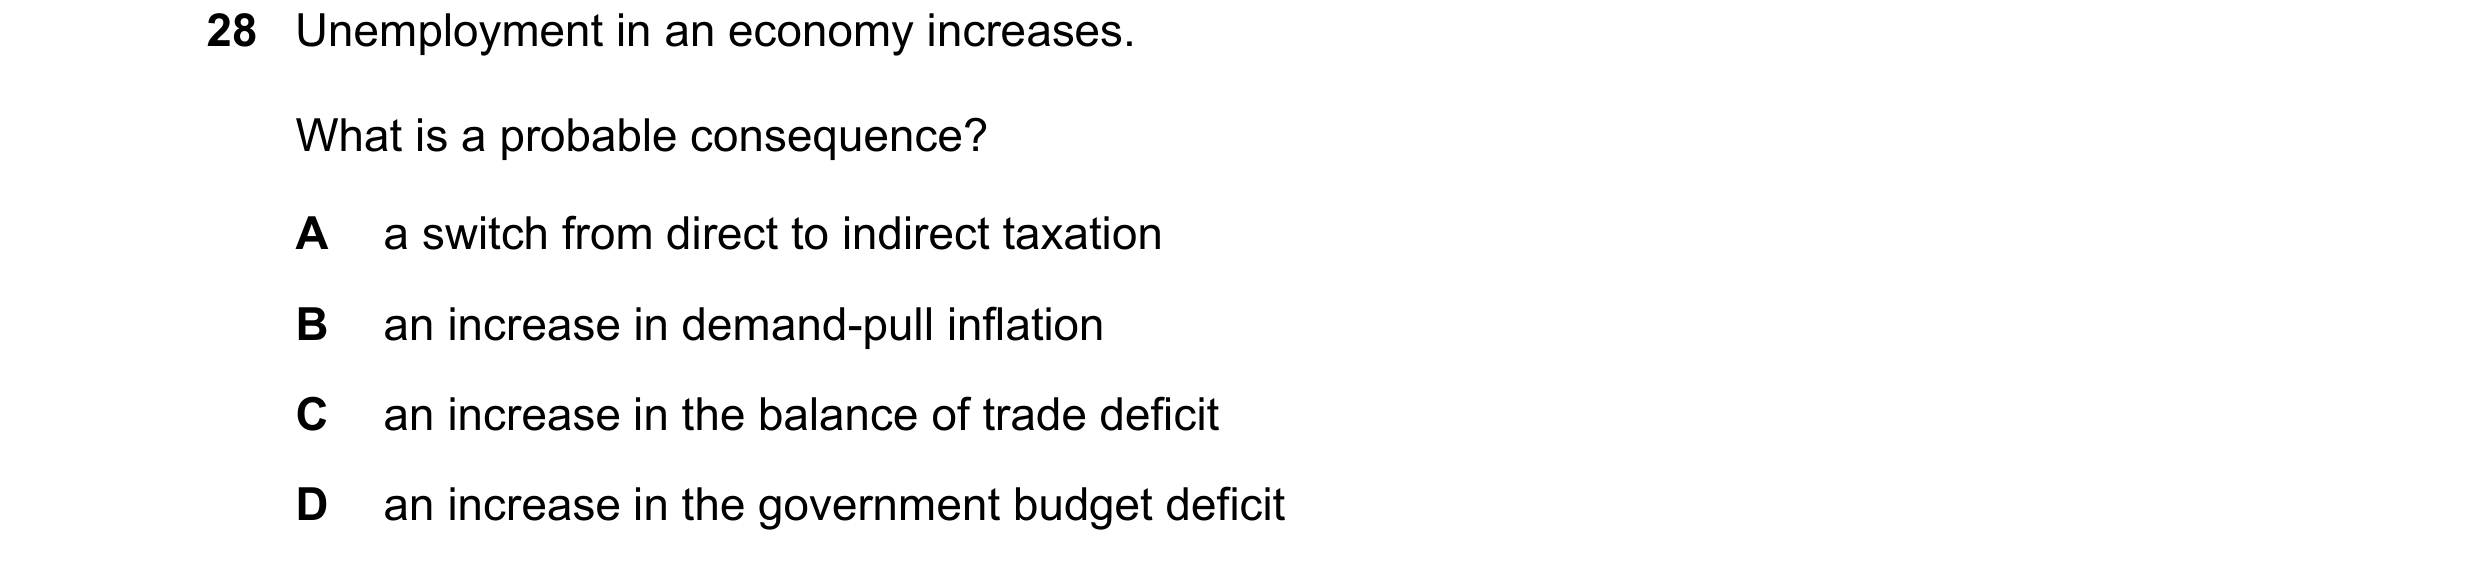
Q23 · Unemployment in an economy increases 9708/33 Oct/Nov 2016
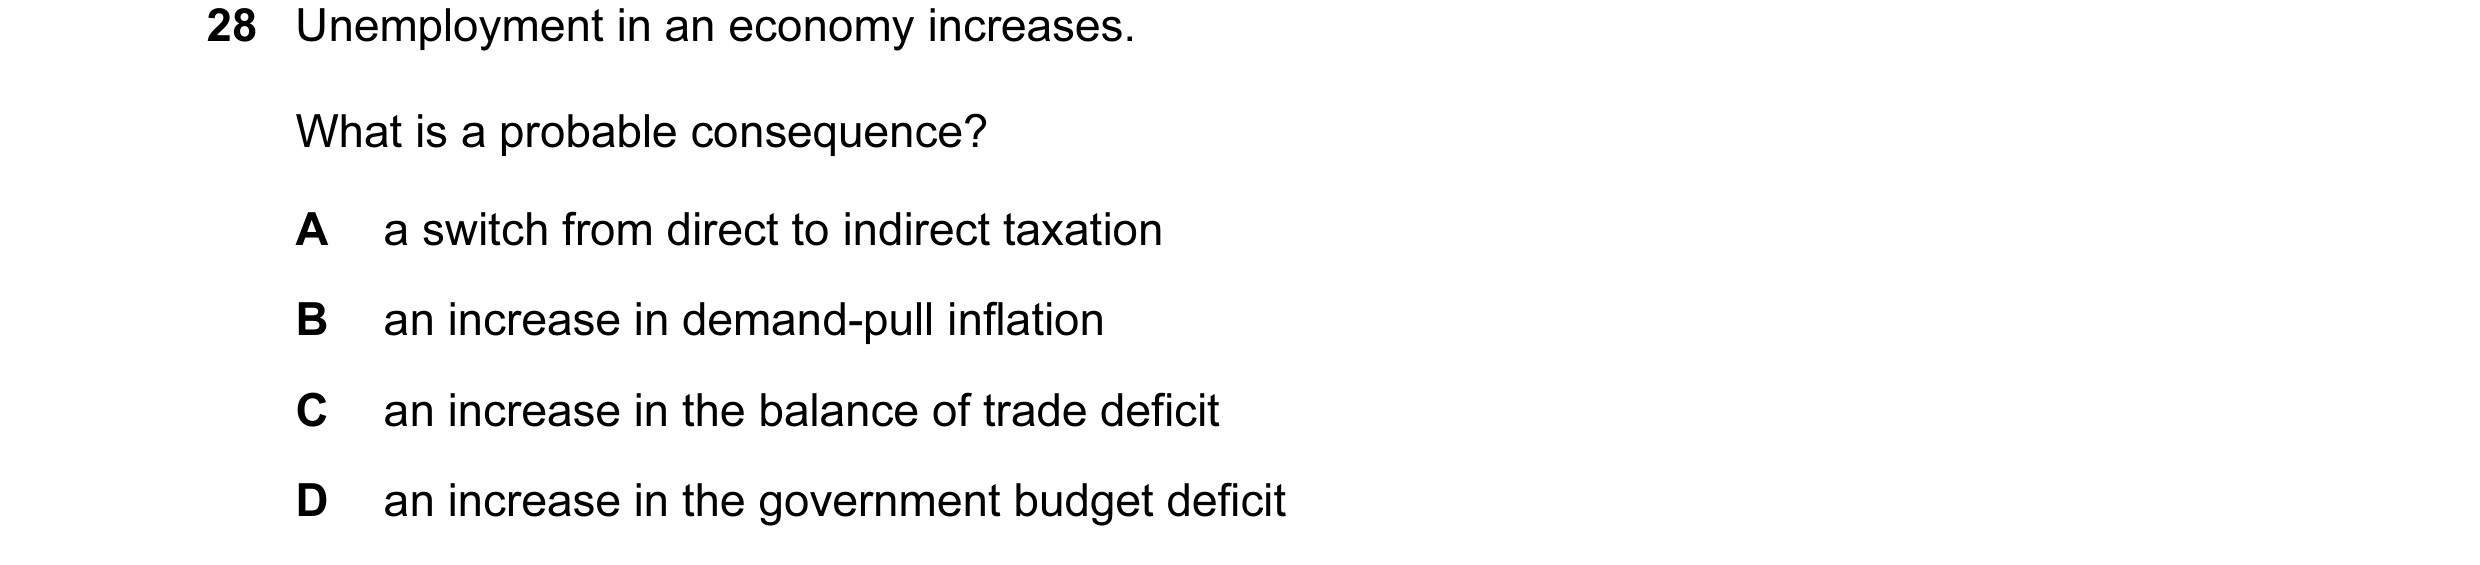
28 Unemployment in an economy increases. What is a probable consequence? A a switch from direct to indirect taxation B an increase in demand-pull inflation C an increase in the balance of trade deficit D an increase in the government budget deficit
1 marks
Answer: D
This question in 9708/33 Oct/Nov 2016
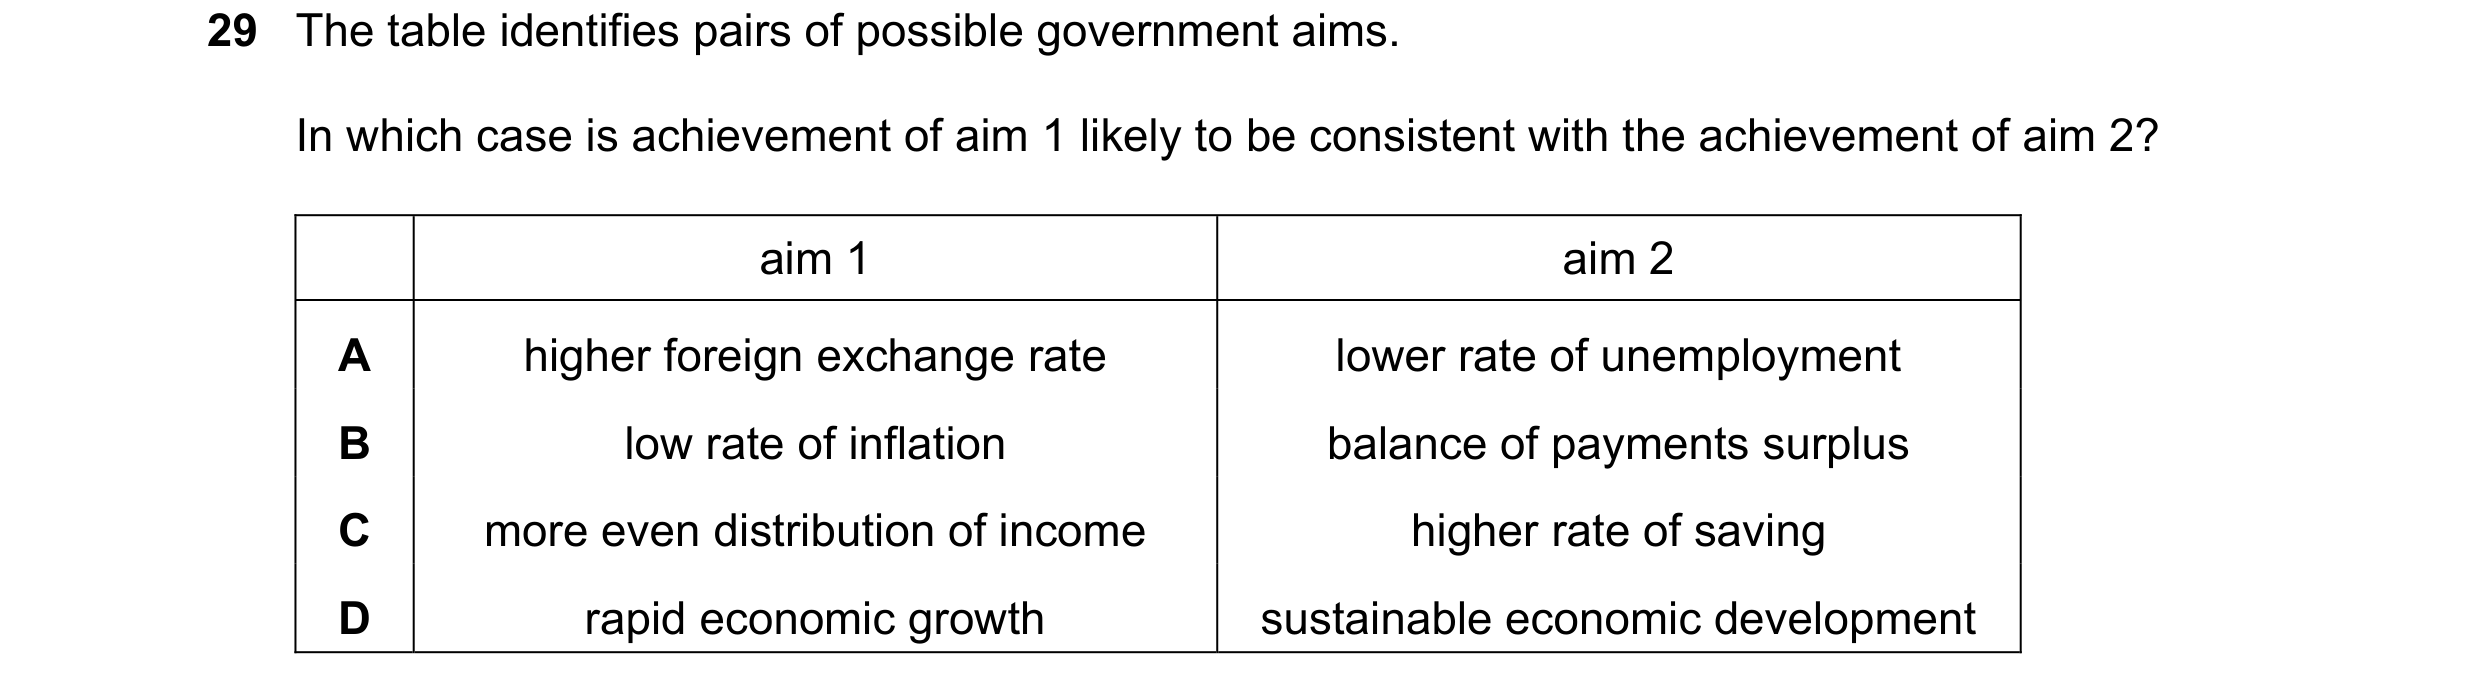
Q24 · The table identifies pairs of possible government aims 9708/32 Oct/Nov 2018
29 The table identifies pairs of possible government aims. In which case is achievement of aim 1 likely to be consistent with the achievement of aim 2? aim 1 aim 2 A higher foreign exchange rate lower rate of unemployment B low rate of inflation balance of payments surplus C more even distribution of income higher rate of saving D rapid economic growth sustainable economic development
1 marks
Answer: B
This question in 9708/32 Oct/Nov 2018
Q25 · What is measured on the vertical axis of the Phillips curve? 9708/32 Oct/Nov 2019
29 What is measured on the vertical axis of the Phillips curve? A the rate of change of real wages B the rate of change of take-home pay C the rate of inflation D the rate of interest
1 marks
Answer: C
This question in 9708/32 Oct/Nov 2019
Q26 · A government sets a target for the annual rate of inflation to be no more than 3% 9708/31 Oct/Nov 2020
30 A government sets a target for the annual rate of inflation to be no more than 3%. Which circumstances would make it difficult to achieve the target? A if devaluation of the currency leads to a trade surplus B if interest rates are increased to control effective demand C if the government increases its budget surplus D if wage increases are kept in line with productivity
1 marks
Answer: A
This question in 9708/31 Oct/Nov 2020
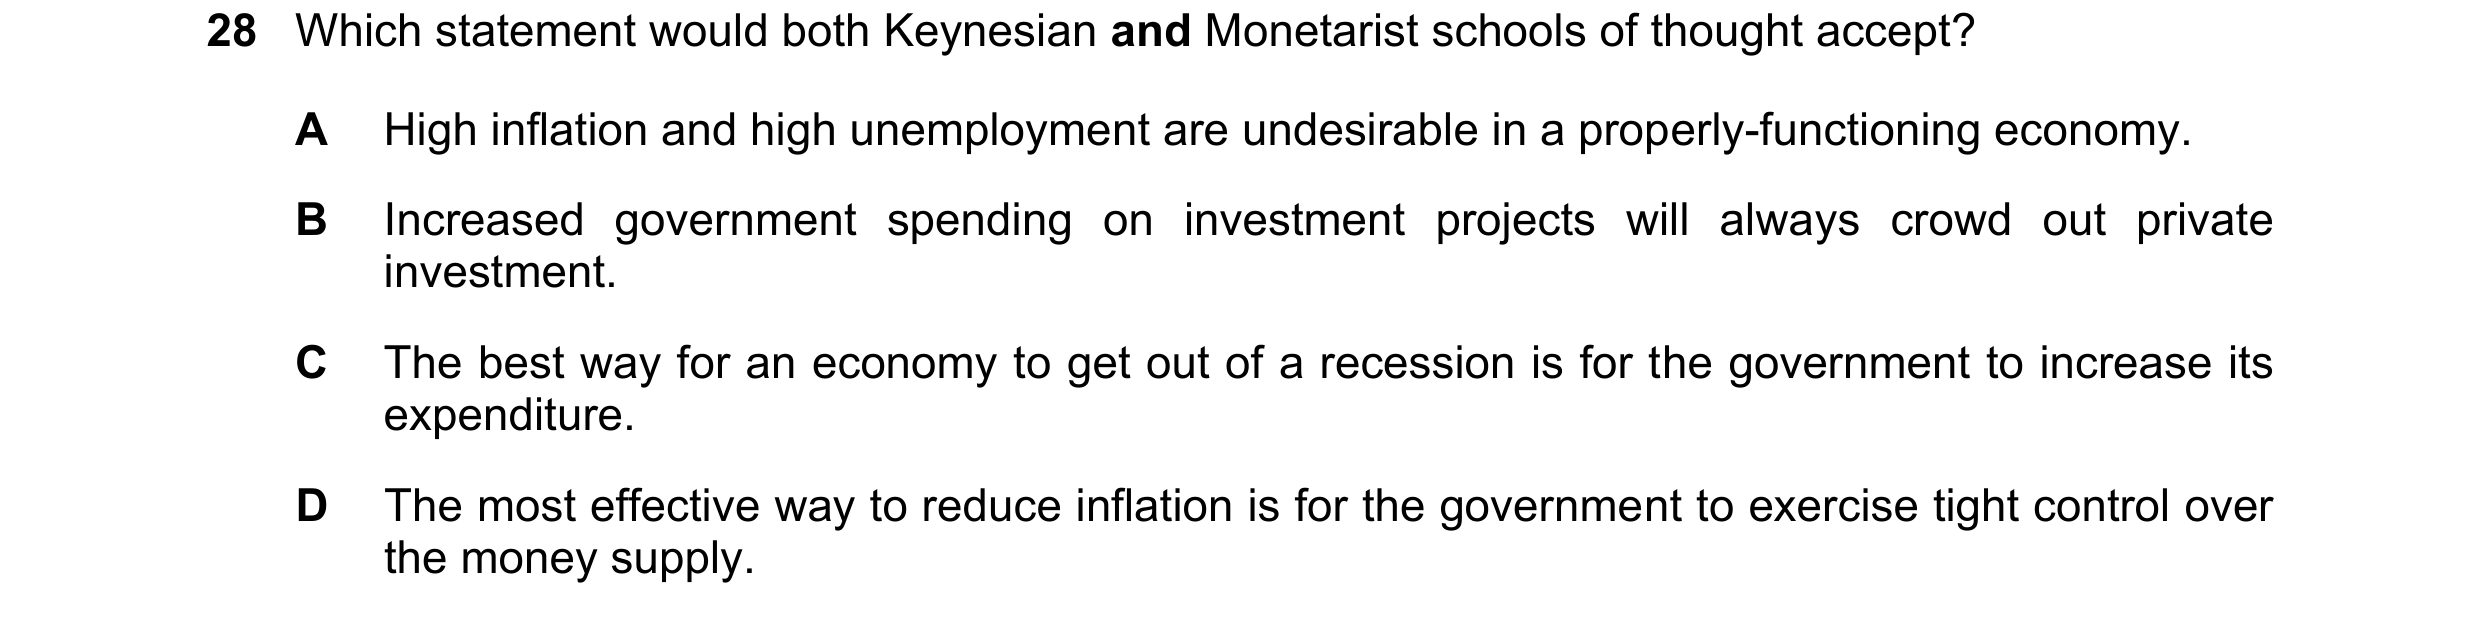
Q27 · Which statement would both Keynesian and Monetarist schools of thought accept? 9708/31 May/June 2021
28 Which statement would both Keynesian and Monetarist schools of thought accept? A High inflation and high unemployment are undesirable in a properly-functioning economy. B Increased government spending on investment projects will always crowd out private investment. C The best way for an economy to get out of a recession is for the government to increase its expenditure. D The most effective way to reduce inflation is for the government to exercise tight control over the money supply.
1 marks
Answer: A
This question in 9708/31 May/June 2021
Q28 · Unemployment in an economy increases 9708/32 May/June 2021
28 Unemployment in an economy increases. What is a probable consequence? A a switch from direct to indirect taxation B an increase in demand-pull inflation C an increase in the balance of trade deficit D an increase in the government budget deficit
1 marks
Answer: D
This question in 9708/32 May/June 2021
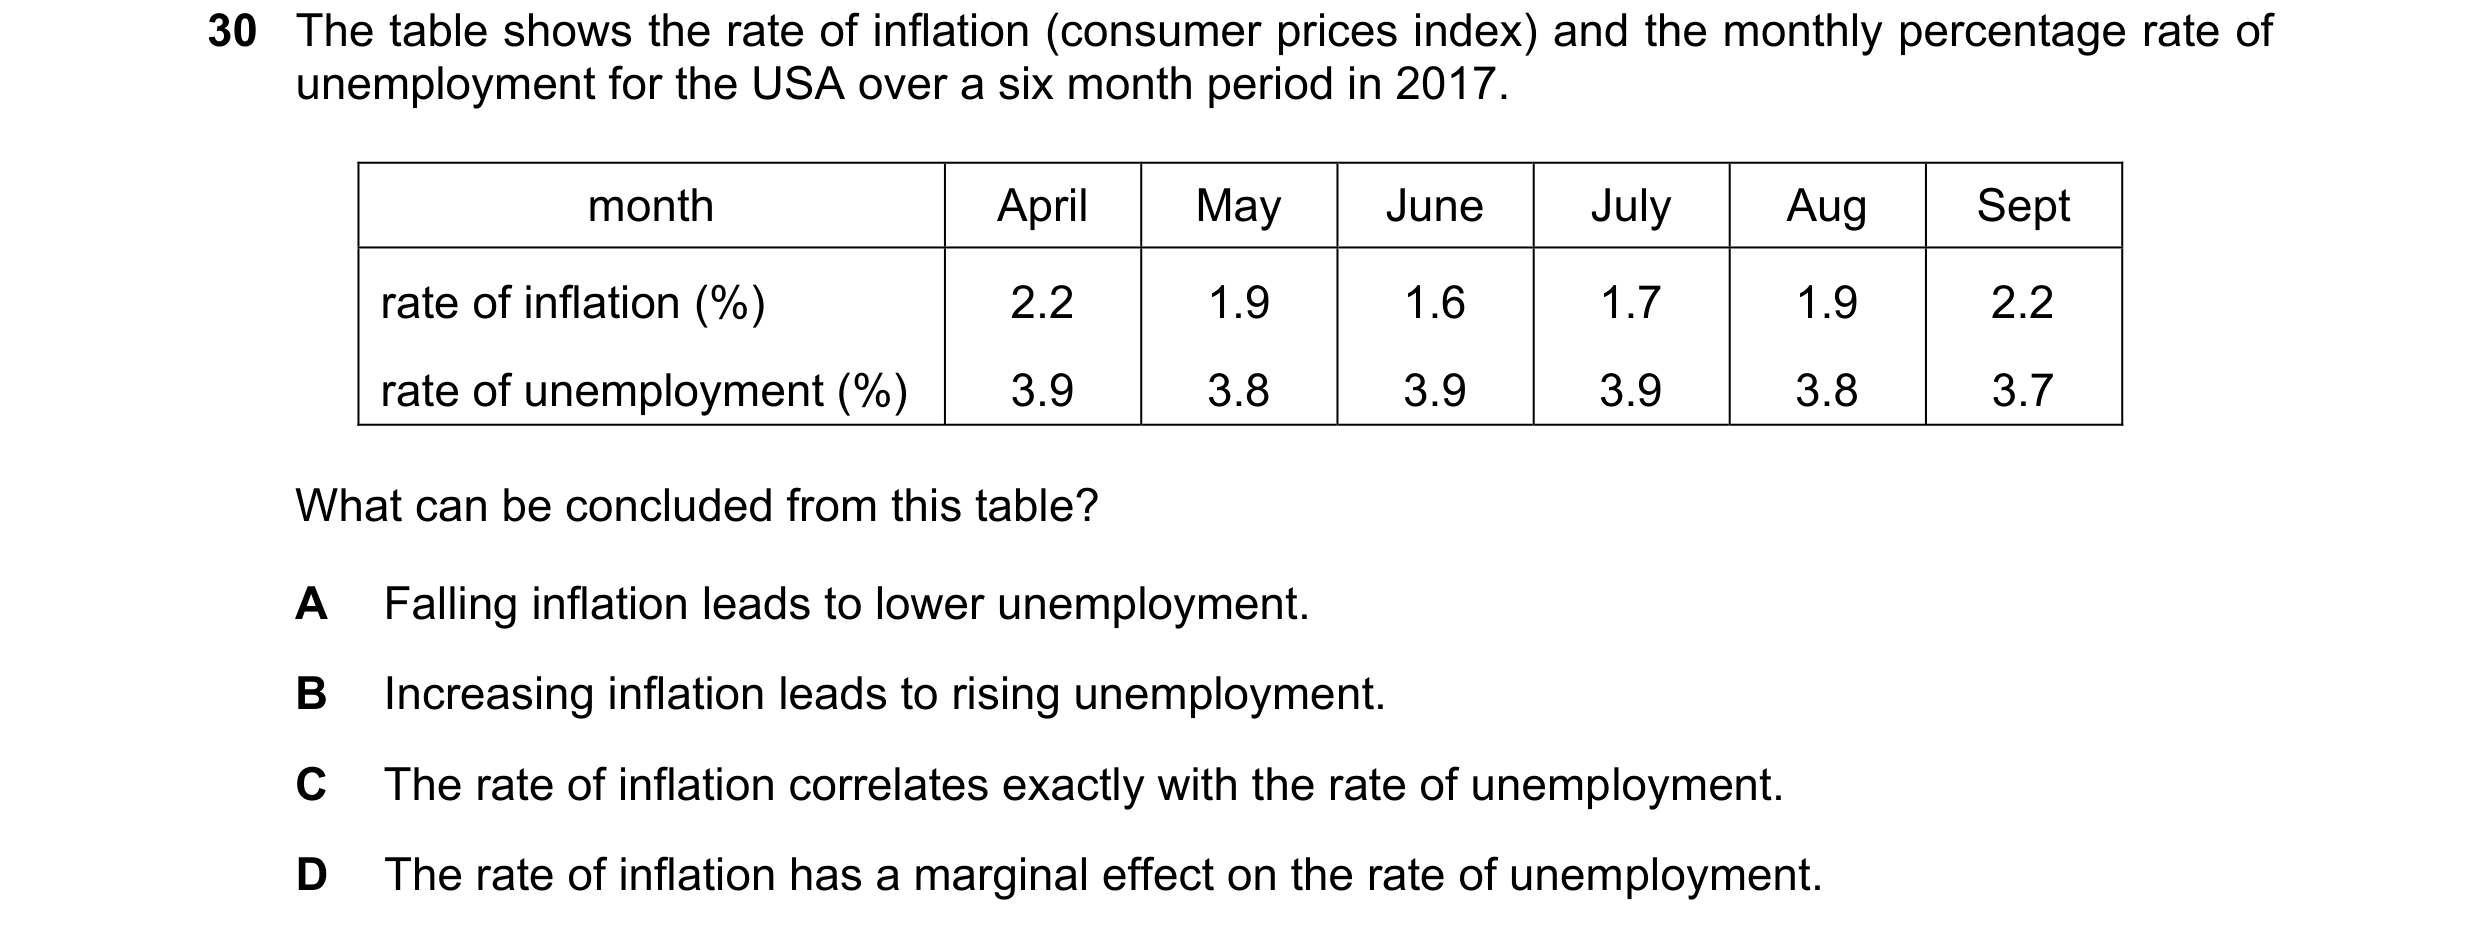
Q29 · The table shows the rate of inflation (consumer prices index) and the monthly percentage… 9708/31 May/June 2022
30 The table shows the rate of inflation (consumer prices index) and the monthly percentage rate of unemployment for the USA over a six month period in 2017. month April May June July Aug Sept rate of inflation (%) 2.2 1.9 1.6 1.7 1.9 2.2 rate of unemployment (%) 3.9 3.8 3.9 3.9 3.8 3.7 What can be concluded from this table? A Falling inflation leads to lower unemployment. B Increasing inflation leads to rising unemployment. C The rate of inflation correlates exactly with the rate of unemployment. D The rate of inflation has a marginal effect on the rate of unemployment.
1 marks
Answer: D
This question in 9708/31 May/June 2022
Q30 · The table shows the rate of inflation (consumer prices index) and the monthly percentage… 9708/33 May/June 2022
30 The table shows the rate of inflation (consumer prices index) and the monthly percentage rate of unemployment for the USA over a six month period in 2017. month April May June July Aug Sept rate of inflation (%) 2.2 1.9 1.6 1.7 1.9 2.2 rate of unemployment (%) 3.9 3.8 3.9 3.9 3.8 3.7 What can be concluded from this table? A Falling inflation leads to lower unemployment. B Increasing inflation leads to rising unemployment. C The rate of inflation correlates exactly with the rate of unemployment. D The rate of inflation has a marginal effect on the rate of unemployment.
1 marks
Answer: D
This question in 9708/33 May/June 2022
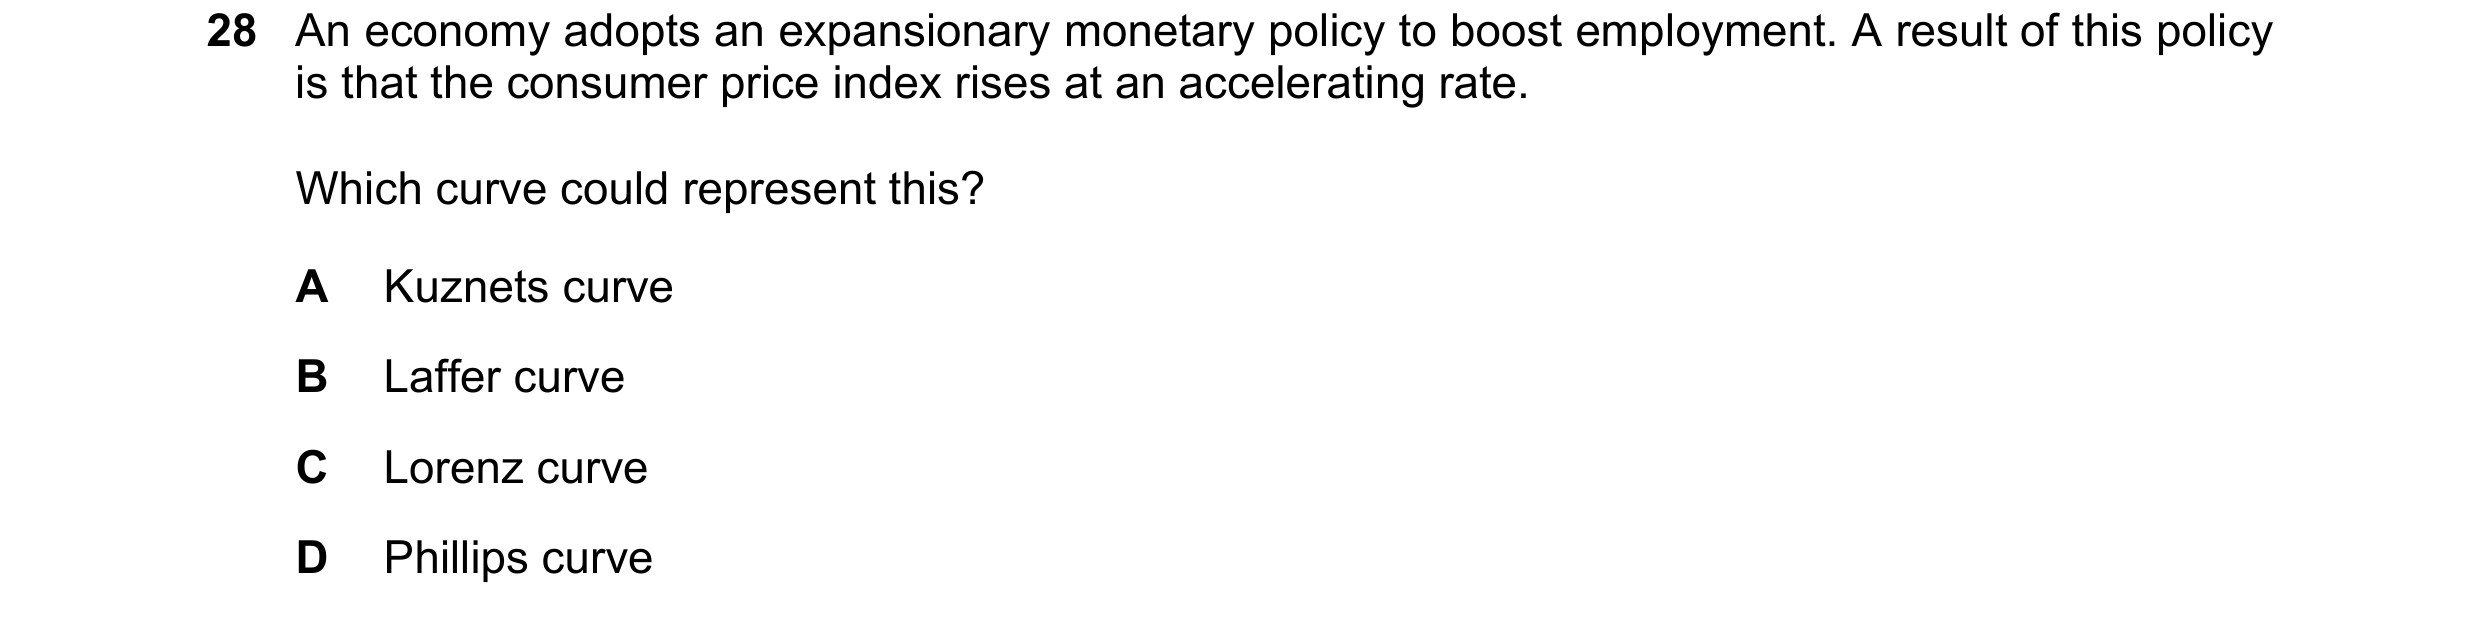
Q31 · An economy adopts an expansionary monetary policy to boost employment 9708/31 Oct/Nov 2022
28 An economy adopts an expansionary monetary policy to boost employment. A result of this policy is that the consumer price index rises at an accelerating rate. Which curve could represent this? A Kuznets curve B Laffer curve C Lorenz curve D Phillips curve
1 marks
Answer: D
This question in 9708/31 Oct/Nov 2022
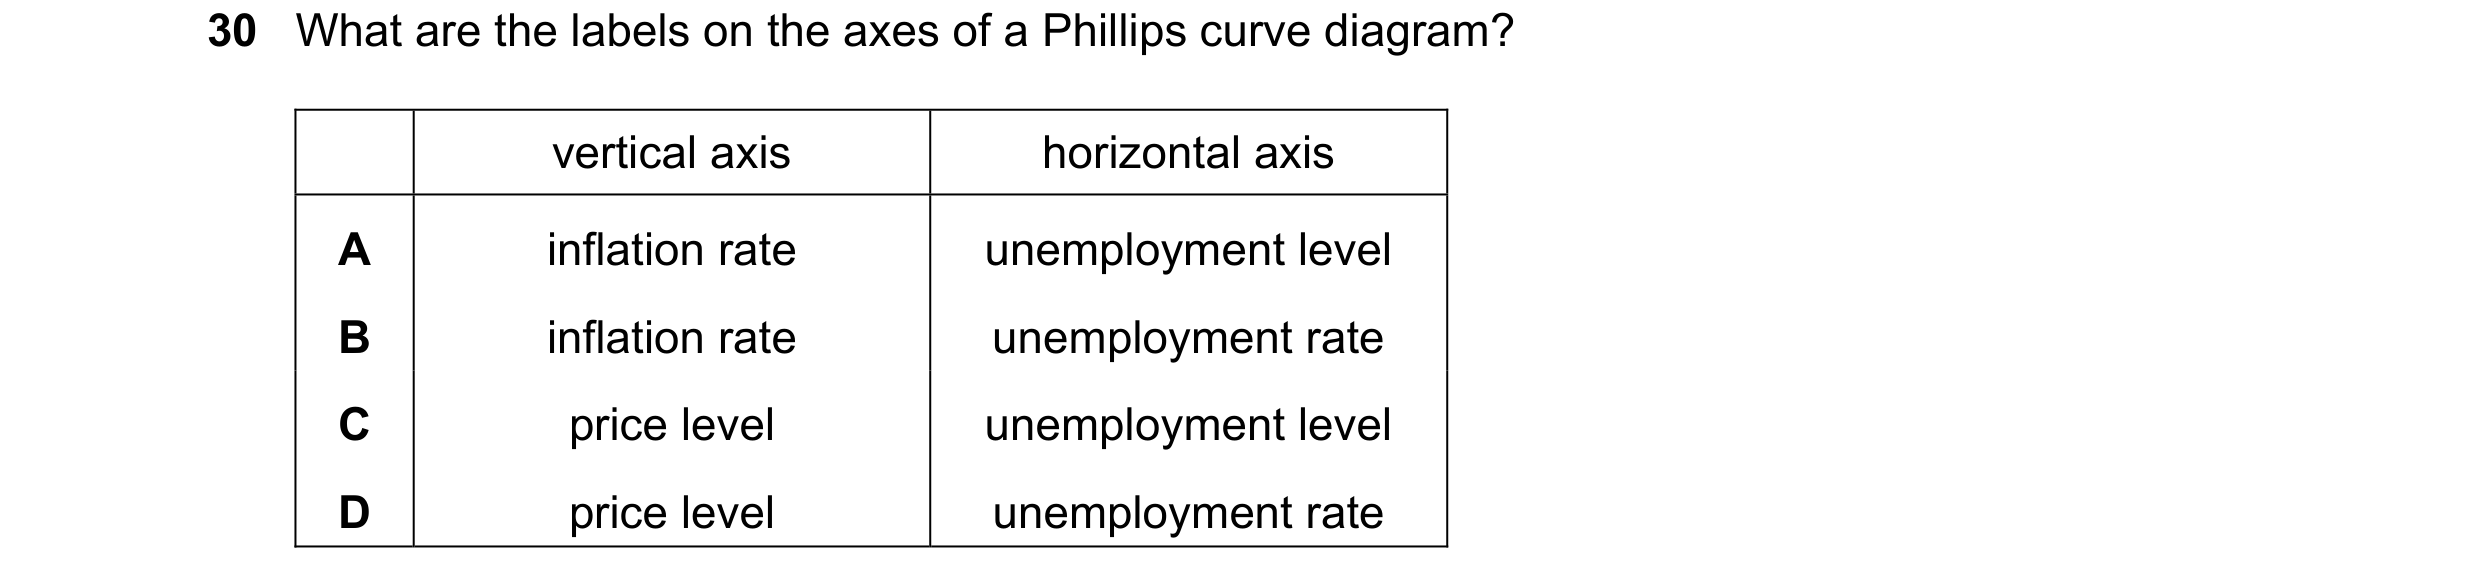
Q32 · What are the labels on the axes of a Phillips curve diagram? 9708/32 Oct/Nov 2022
30 What are the labels on the axes of a Phillips curve diagram? vertical axis horizontal axis A inflation rate unemployment level B inflation rate unemployment rate C price level unemployment level D price level unemployment rate
1 marks
Answer: B
This question in 9708/32 Oct/Nov 2022
Q33 · The table shows real GDP and unemployment for an economy 9708/33 Oct/Nov 2022
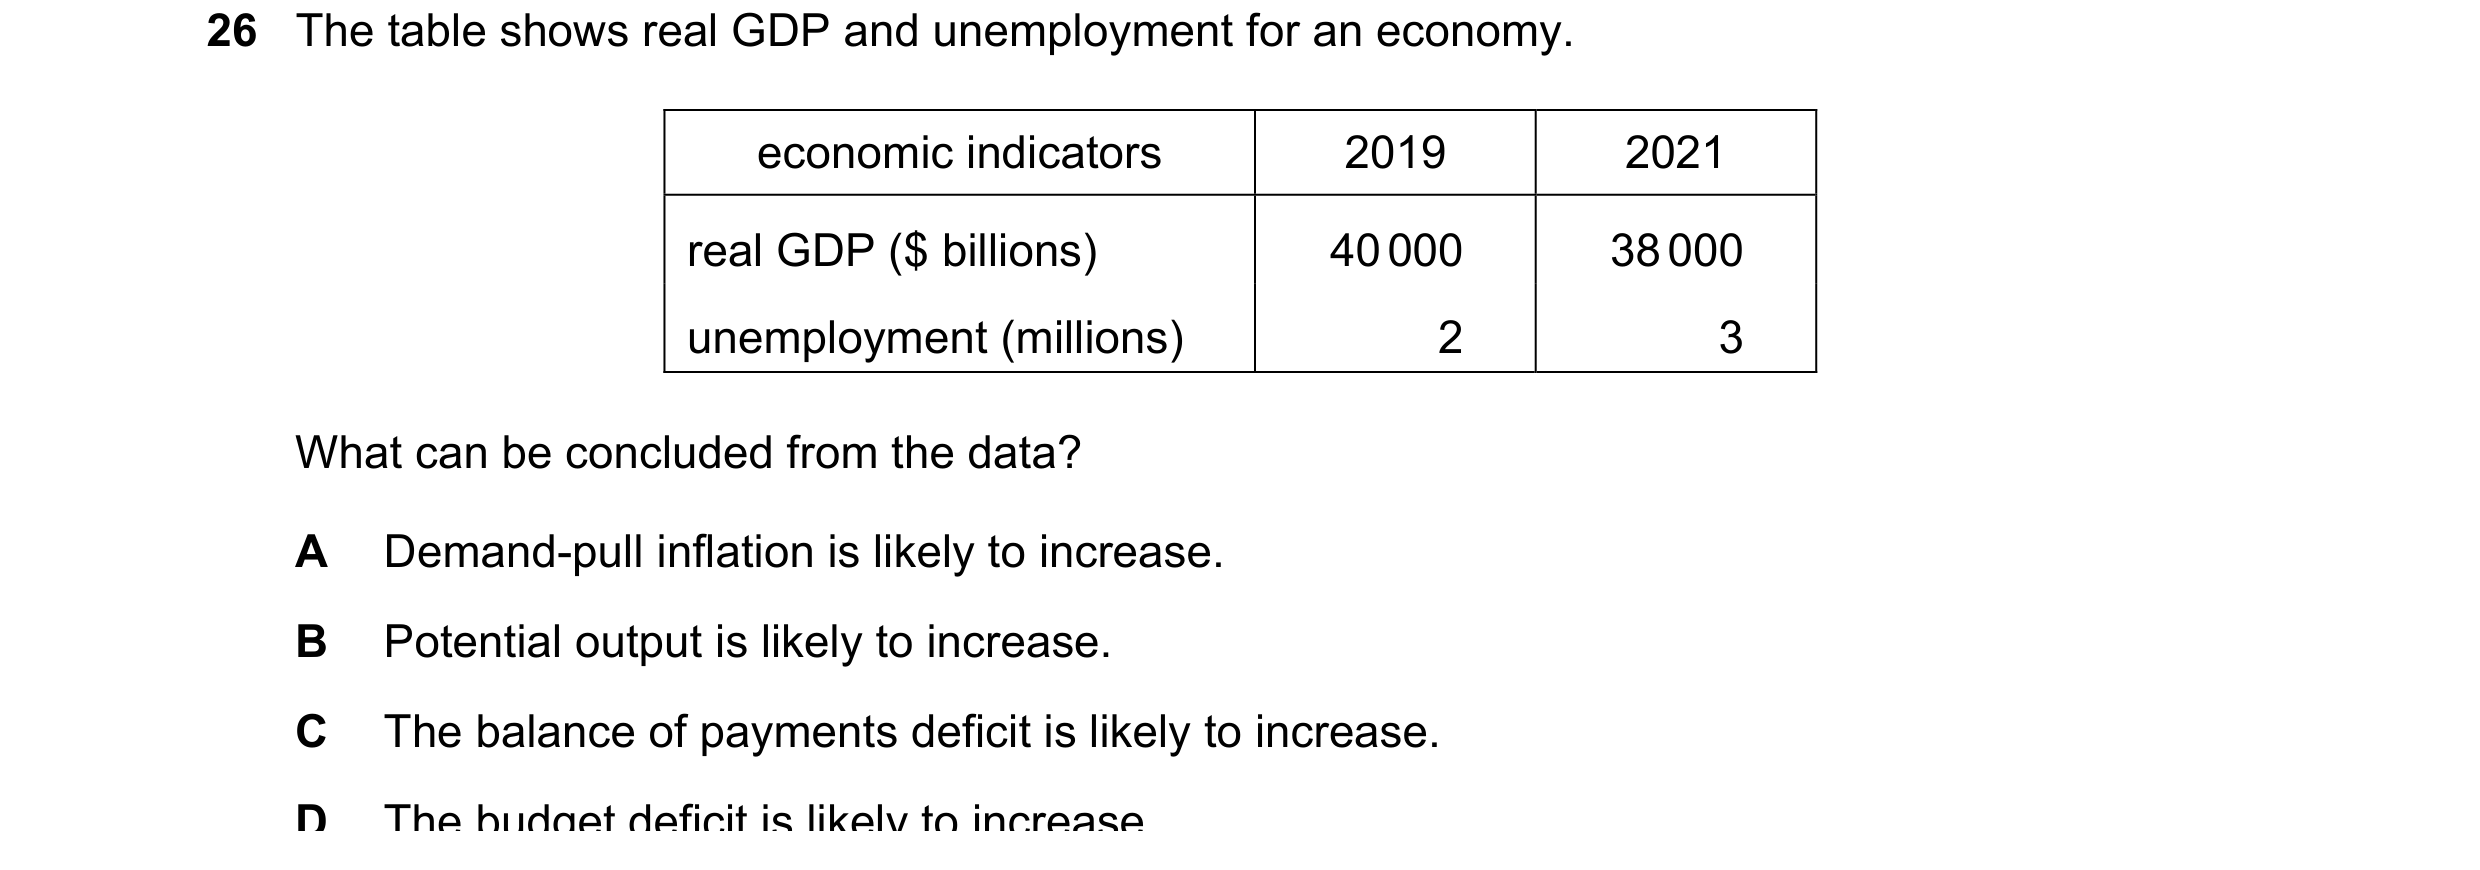
26 The table shows real GDP and unemployment for an economy. economic indicators 2019 2021 real GDP ($ billions) 40 000 38 000 unemployment (millions) 2 3 What can be concluded from the data? A Demand-pull inflation is likely to increase. B Potential output is likely to increase. C The balance of payments deficit is likely to increase. D The budget deficit is likely to increase.
1 marks
Answer: D
This question in 9708/33 Oct/Nov 2022
Q34 · A government adopts an expansionary fiscal policy to increase the economic growth rate 9708/32 Feb/March 2023
23 A government adopts an expansionary fiscal policy to increase the economic growth rate.
Which other main macroeconomic aims is this policy most likely to help?
full stable current account
employment price level surplus
0 OD >
\ -« x
«x KM
«x \OK
1 marks
Answer: D
This question in 9708/32 Feb/March 2023
Q35 · A country is a net importer of oil 9708/31 May/June 2023
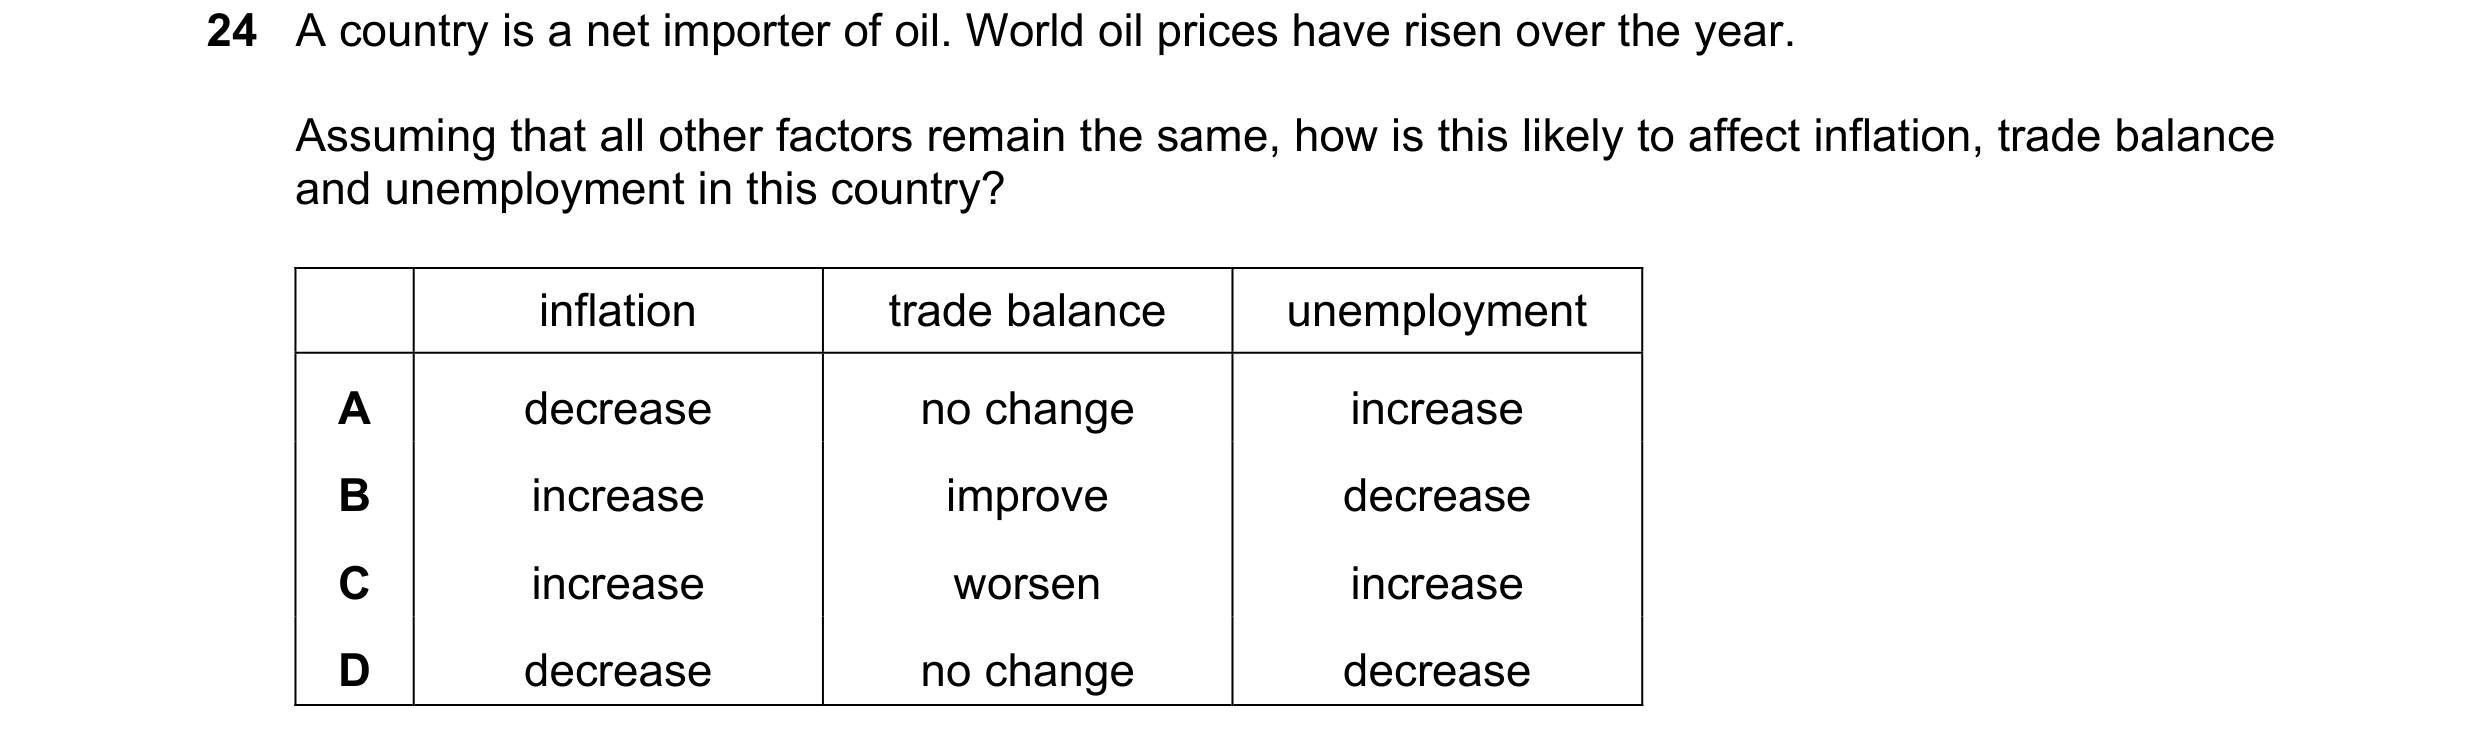
24 A country is a net importer of oil. World oil prices have risen over the year. Assuming that all other factors remain the same, how is this likely to affect inflation, trade balance and unemployment in this country? inflation trade balance unemployment A decrease no change increase B increase improve decrease C increase worsen increase D decrease no change decrease
1 marks
Answer: C
This question in 9708/31 May/June 2023
Q36 · Increased borrowing by the government results in higher interest charges and this leads… 9708/32 May/June 2023
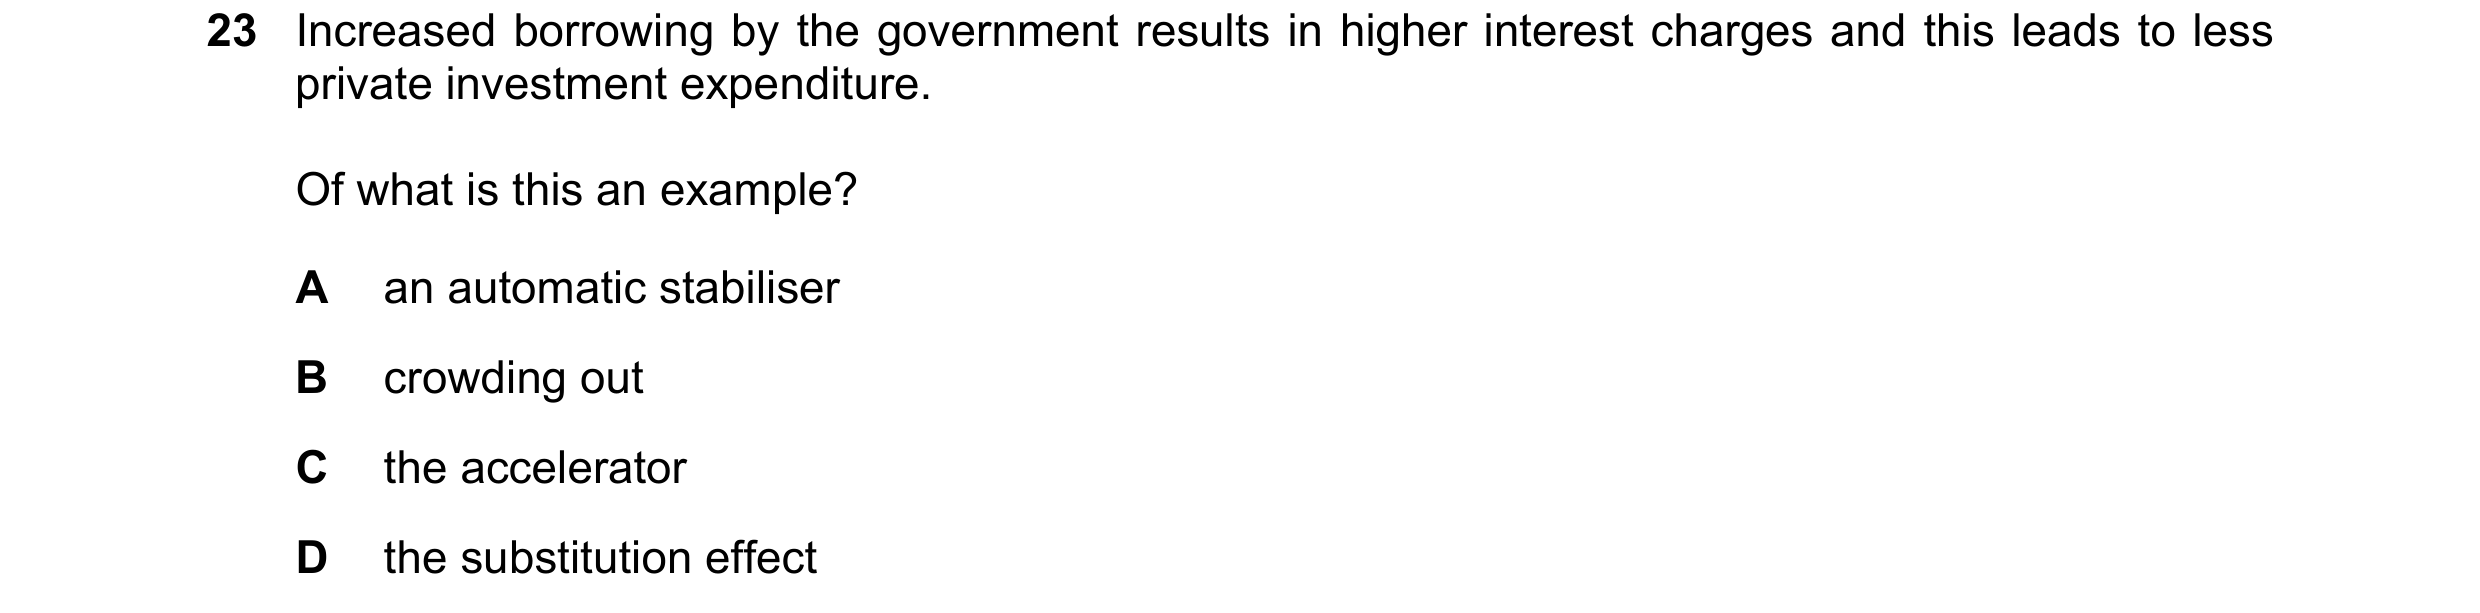
23 Increased borrowing by the government results in higher interest charges and this leads to less private investment expenditure. Of what is this an example? A an automatic stabiliser B crowding out C the accelerator D the substitution effect
1 marks
Answer: B
This question in 9708/32 May/June 2023
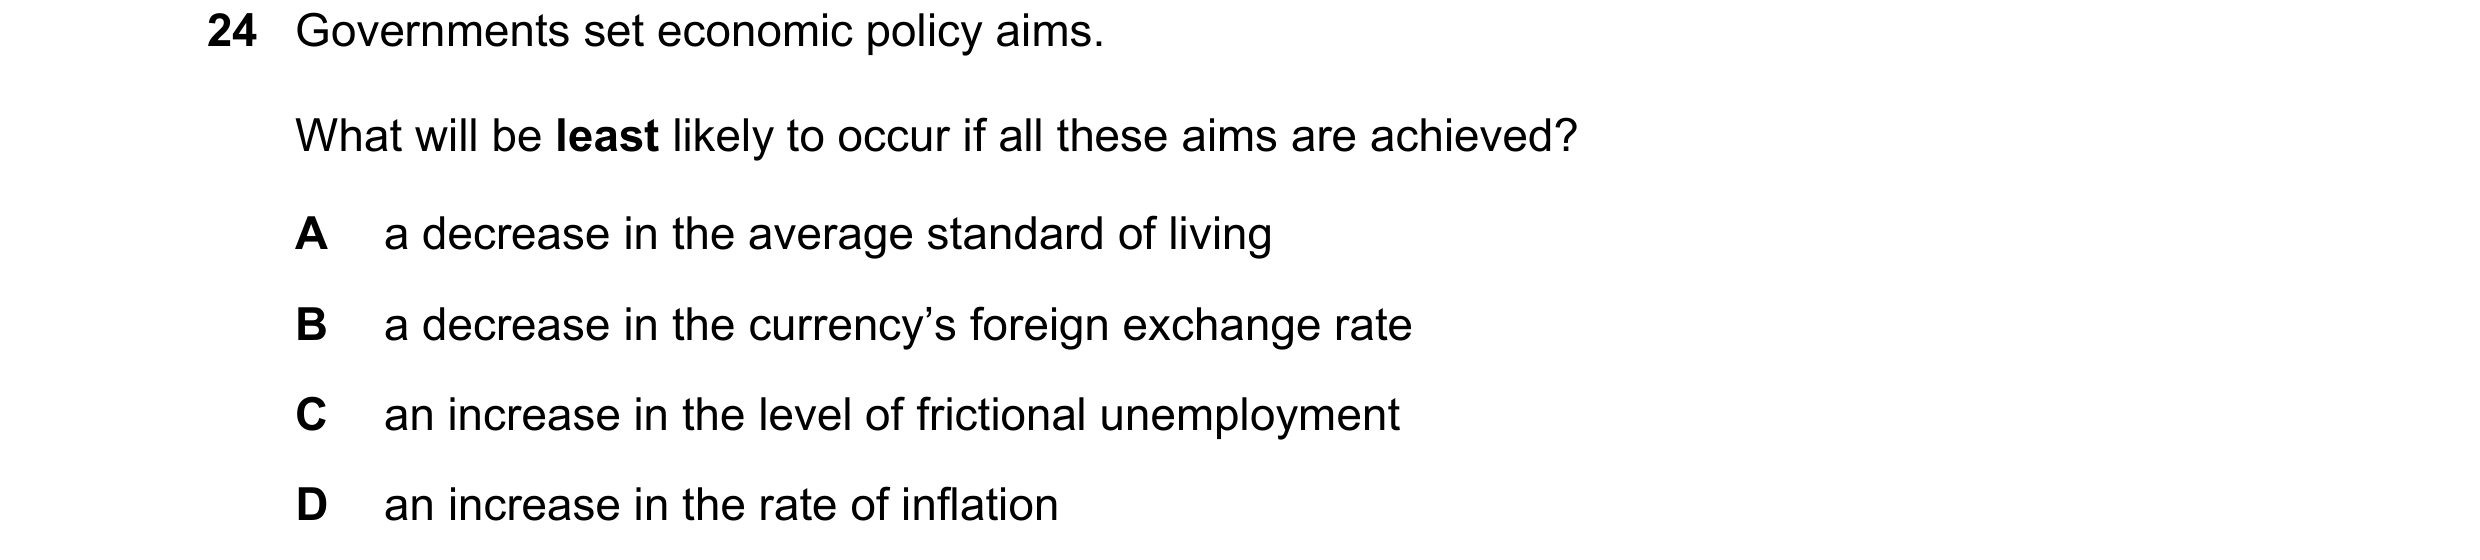
Q37 · Governments set economic policy aims 9708/32 May/June 2023
24 Governments set economic policy aims. What will be least likely to occur if all these aims are achieved? A a decrease in the average standard of living B a decrease in the currency’s foreign exchange rate C an increase in the level of frictional unemployment D an increase in the rate of inflation
1 marks
Answer: A
This question in 9708/32 May/June 2023
Q38 · A country is a net importer of oil 9708/33 May/June 2023
24 A country is a net importer of oil. World oil prices have risen over the year. Assuming that all other factors remain the same, how is this likely to affect inflation, trade balance and unemployment in this country? inflation trade balance unemployment A decrease no change increase B increase improve decrease C increase worsen increase D decrease no change decrease
1 marks
Answer: C
This question in 9708/33 May/June 2023
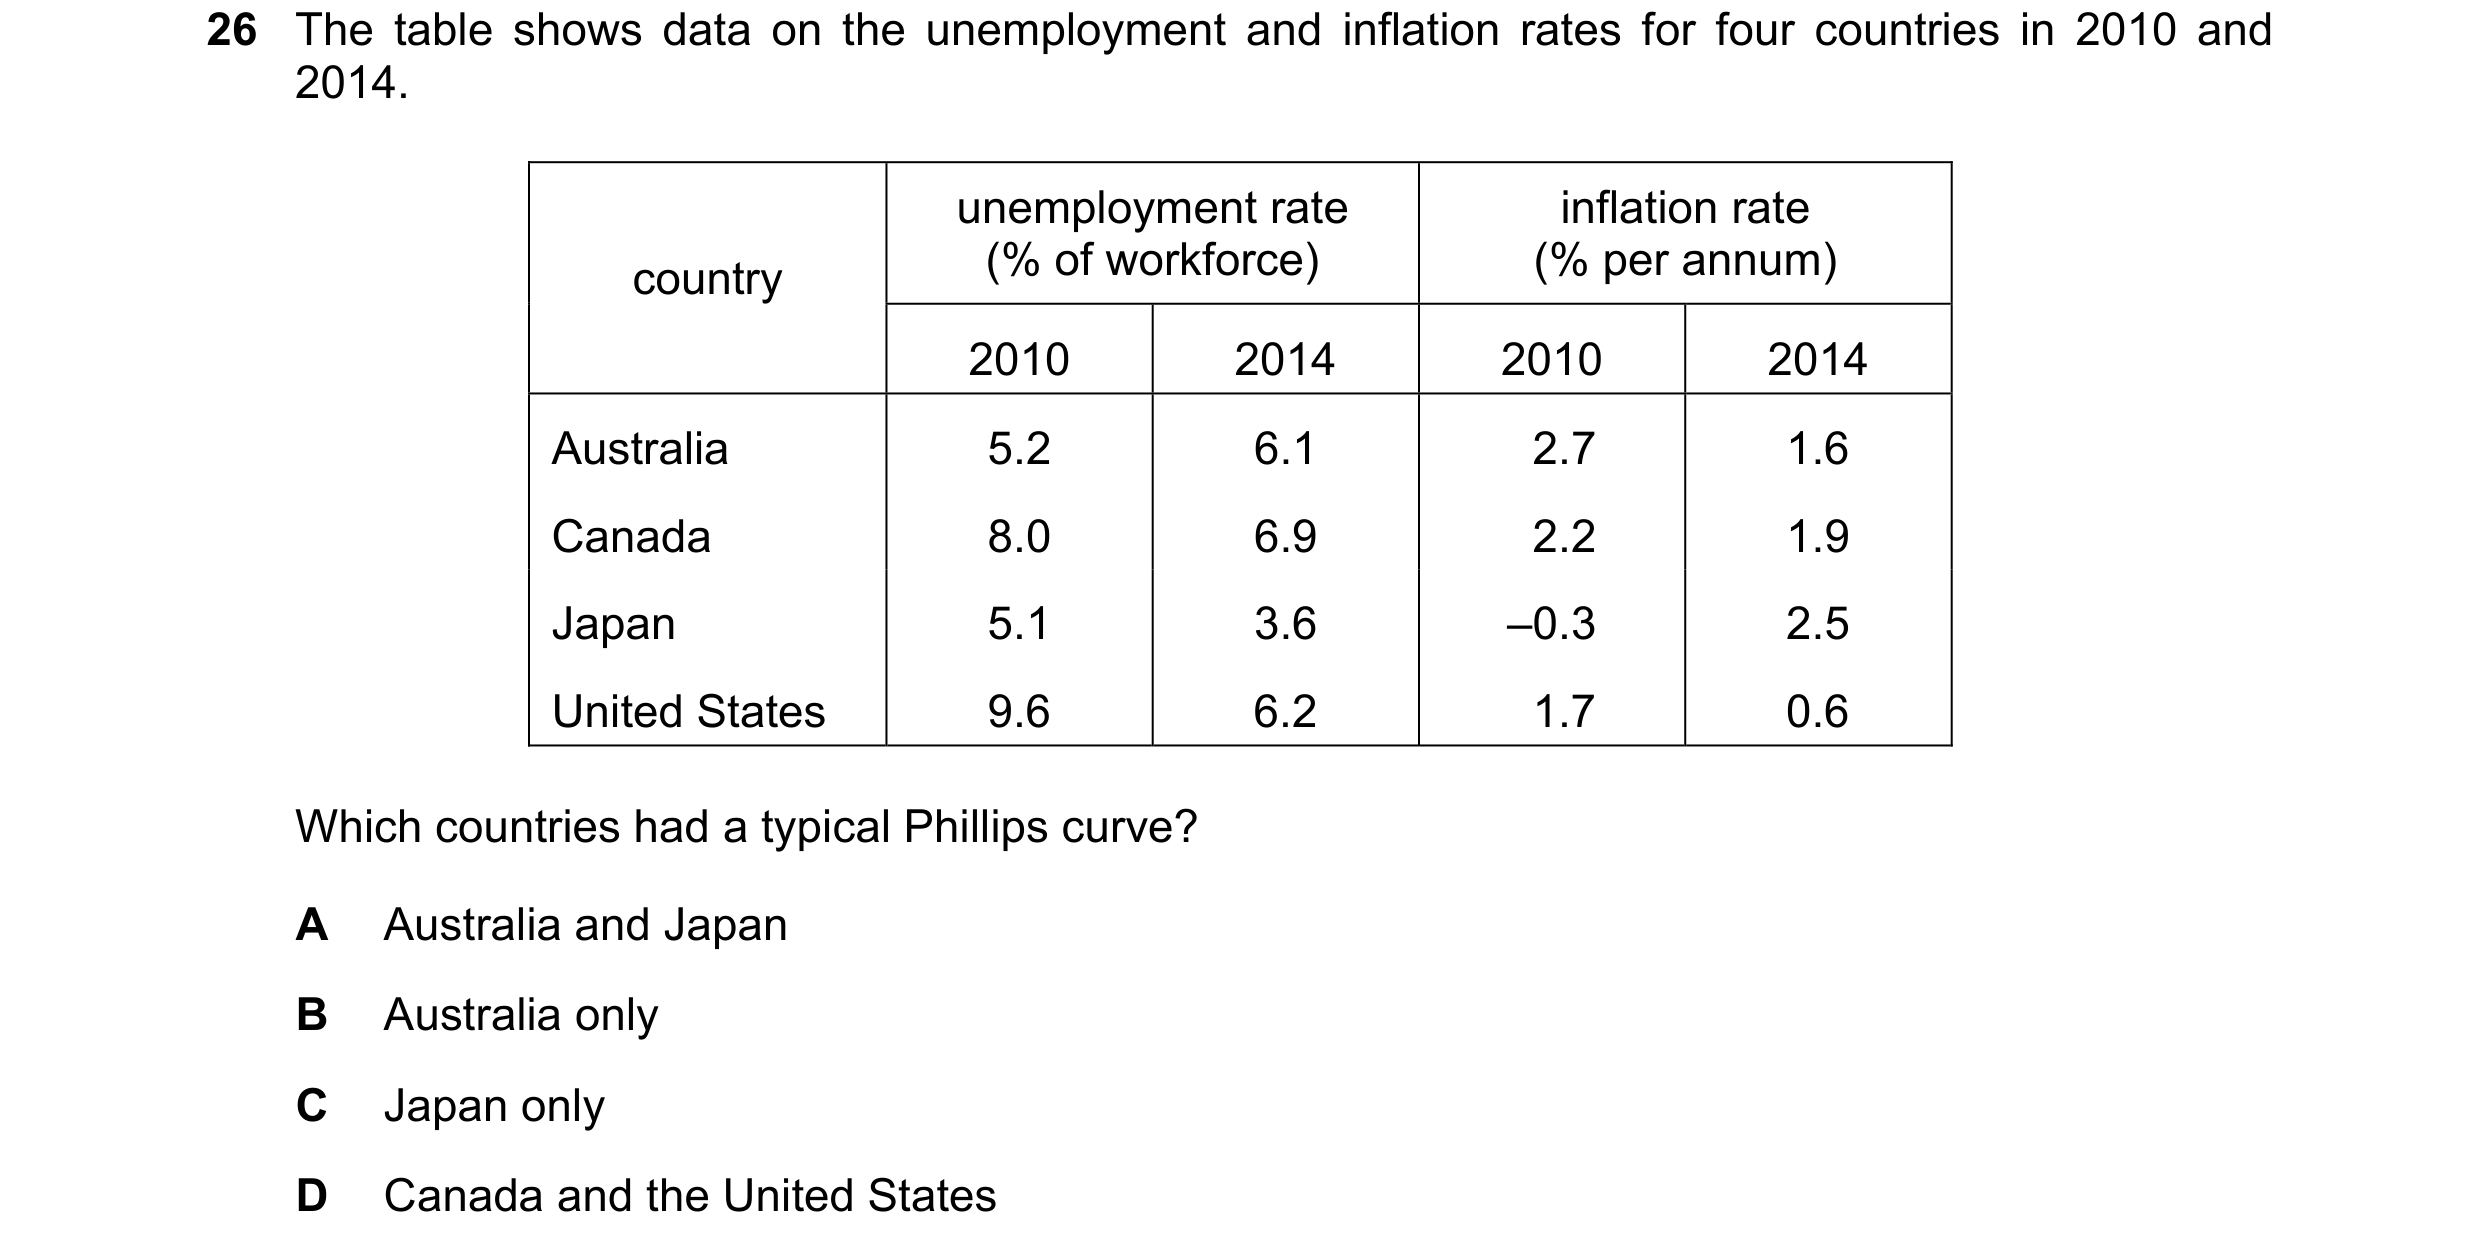
Q39 · The table shows data on the unemployment and inflation rates for four countries in 2010… 9708/31 Oct/Nov 2023
26 The table shows data on the unemployment and inflation rates for four countries in 2010 and 2014. unemployment rate inflation rate country (% of workforce) (% per annum) 2010 2014 2010 2014 Australia 5.2 6.1 2.7 1.6 Canada 8.0 6.9 2.2 1.9 Japan 5.1 3.6 –0.3 2.5 United States 9.6 6.2 1.7 0.6 Which countries had a typical Phillips curve? A Australia and Japan B Australia only C Japan only D Canada and the United States
1 marks
Answer: A
This question in 9708/31 Oct/Nov 2023
Q40 · What is measured on the vertical axis of the Phillips curve? 9708/33 Oct/Nov 2023
22 What is measured on the vertical axis of the Phillips curve? A the rate of change of real wages B the rate of change of take-home pay C the rate of inflation D the rate of interest
1 marks
Answer: C
This question in 9708/33 Oct/Nov 2023
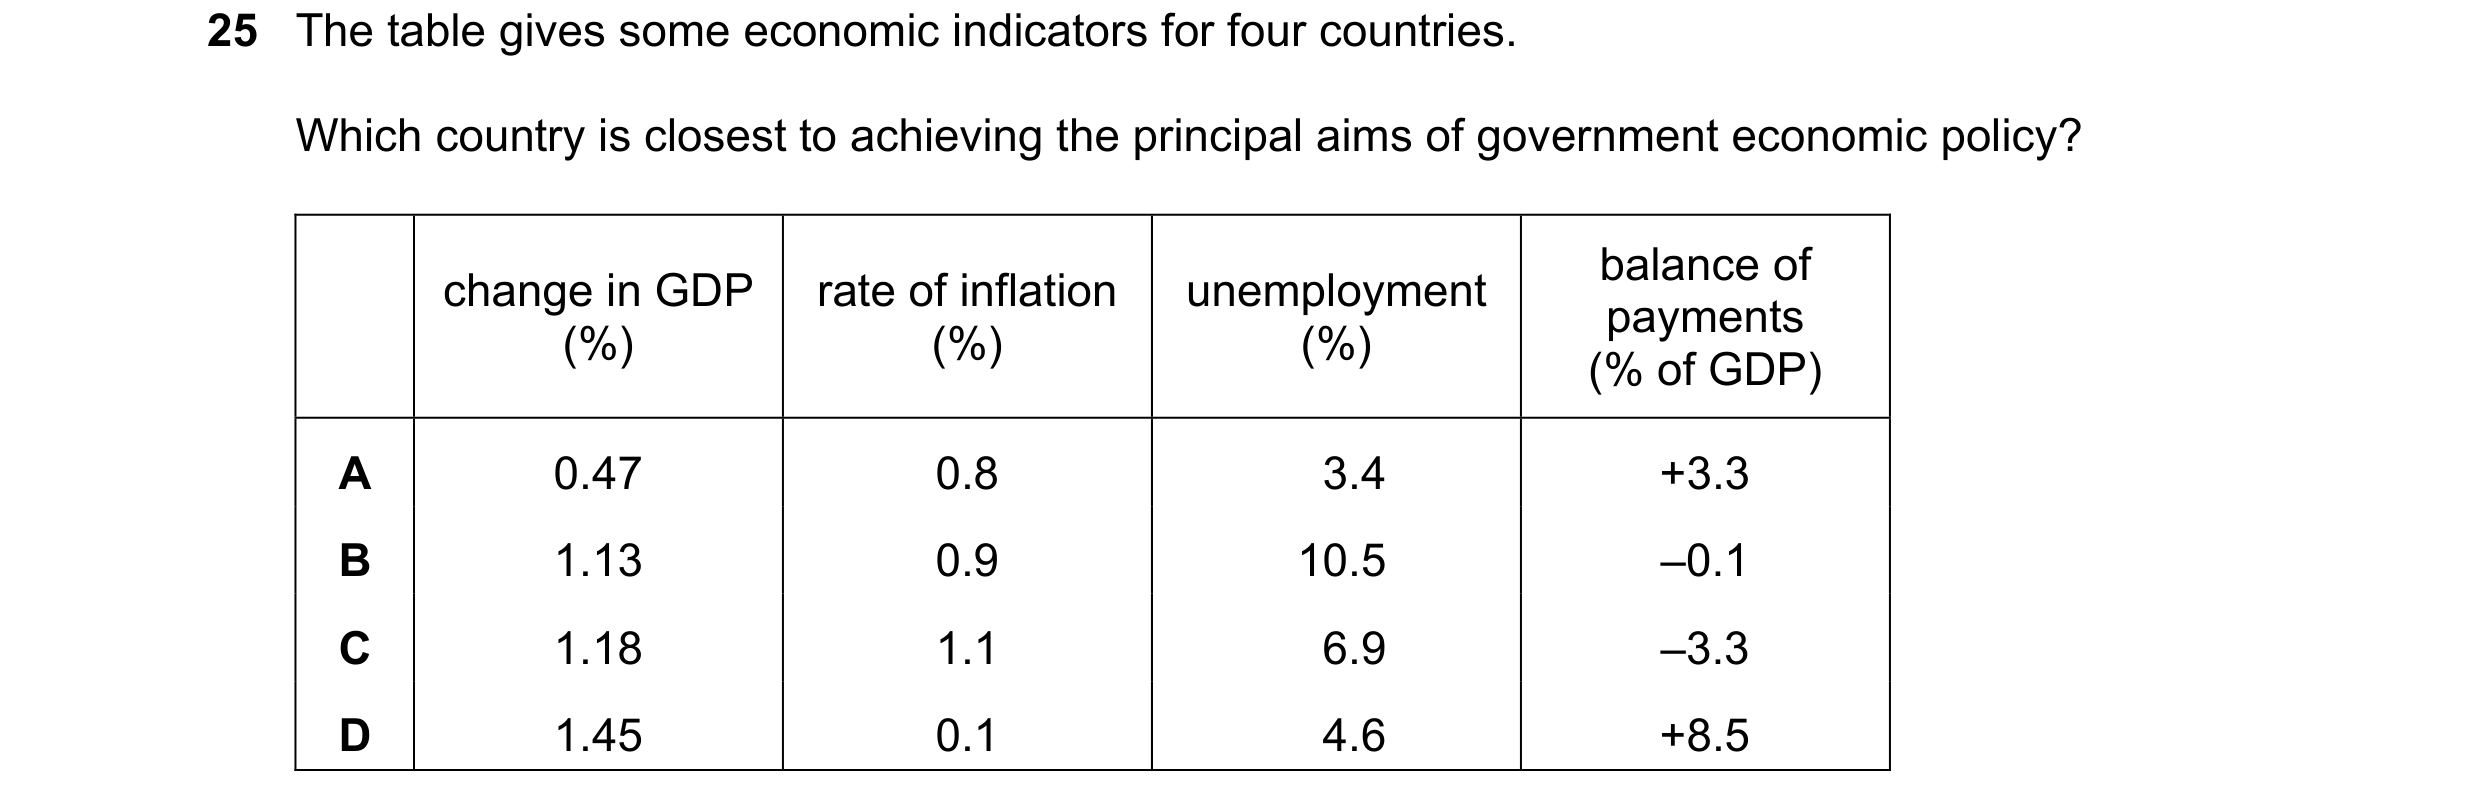
Q41 · The table gives some economic indicators for four countries 9708/33 Oct/Nov 2023
25 The table gives some economic indicators for four countries. Which country is closest to achieving the principal aims of government economic policy? balance of change in GDP rate of inflation unemployment payments (%) (%) (%) (% of GDP) A 0.47 0.8 3.4 +3.3 B 1.13 0.9 10.5 –0.1 C 1.18 1.1 6.9 –3.3 D 1.45 0.1 4.6 +8.5
1 marks
Answer: D
This question in 9708/33 Oct/Nov 2023
Q42 · The table shows the relationship between inflation and unemployment in Germany from 2019… 9708/31 May/June 2024
20 The table shows the relationship between inflation and unemployment in Germany from 2019 to 2022. 2019 2020 2021 2022 inflation: annual –1.9 –1.6 2.7 2.6 variation (%) unemployment 6.4 6.1 5.7 5.2 rate (%) Some theories argue that inflation rates are at their lowest when the rate of unemployment is low. Which year contradicts this expectation to the greatest extent? A 2019 B 2020 C 2021 D 2022
1 marks
Answer: A
This question in 9708/31 May/June 2024
Q43 · The table shows the relationship between inflation and unemployment in Germany from 2019… 9708/33 May/June 2024
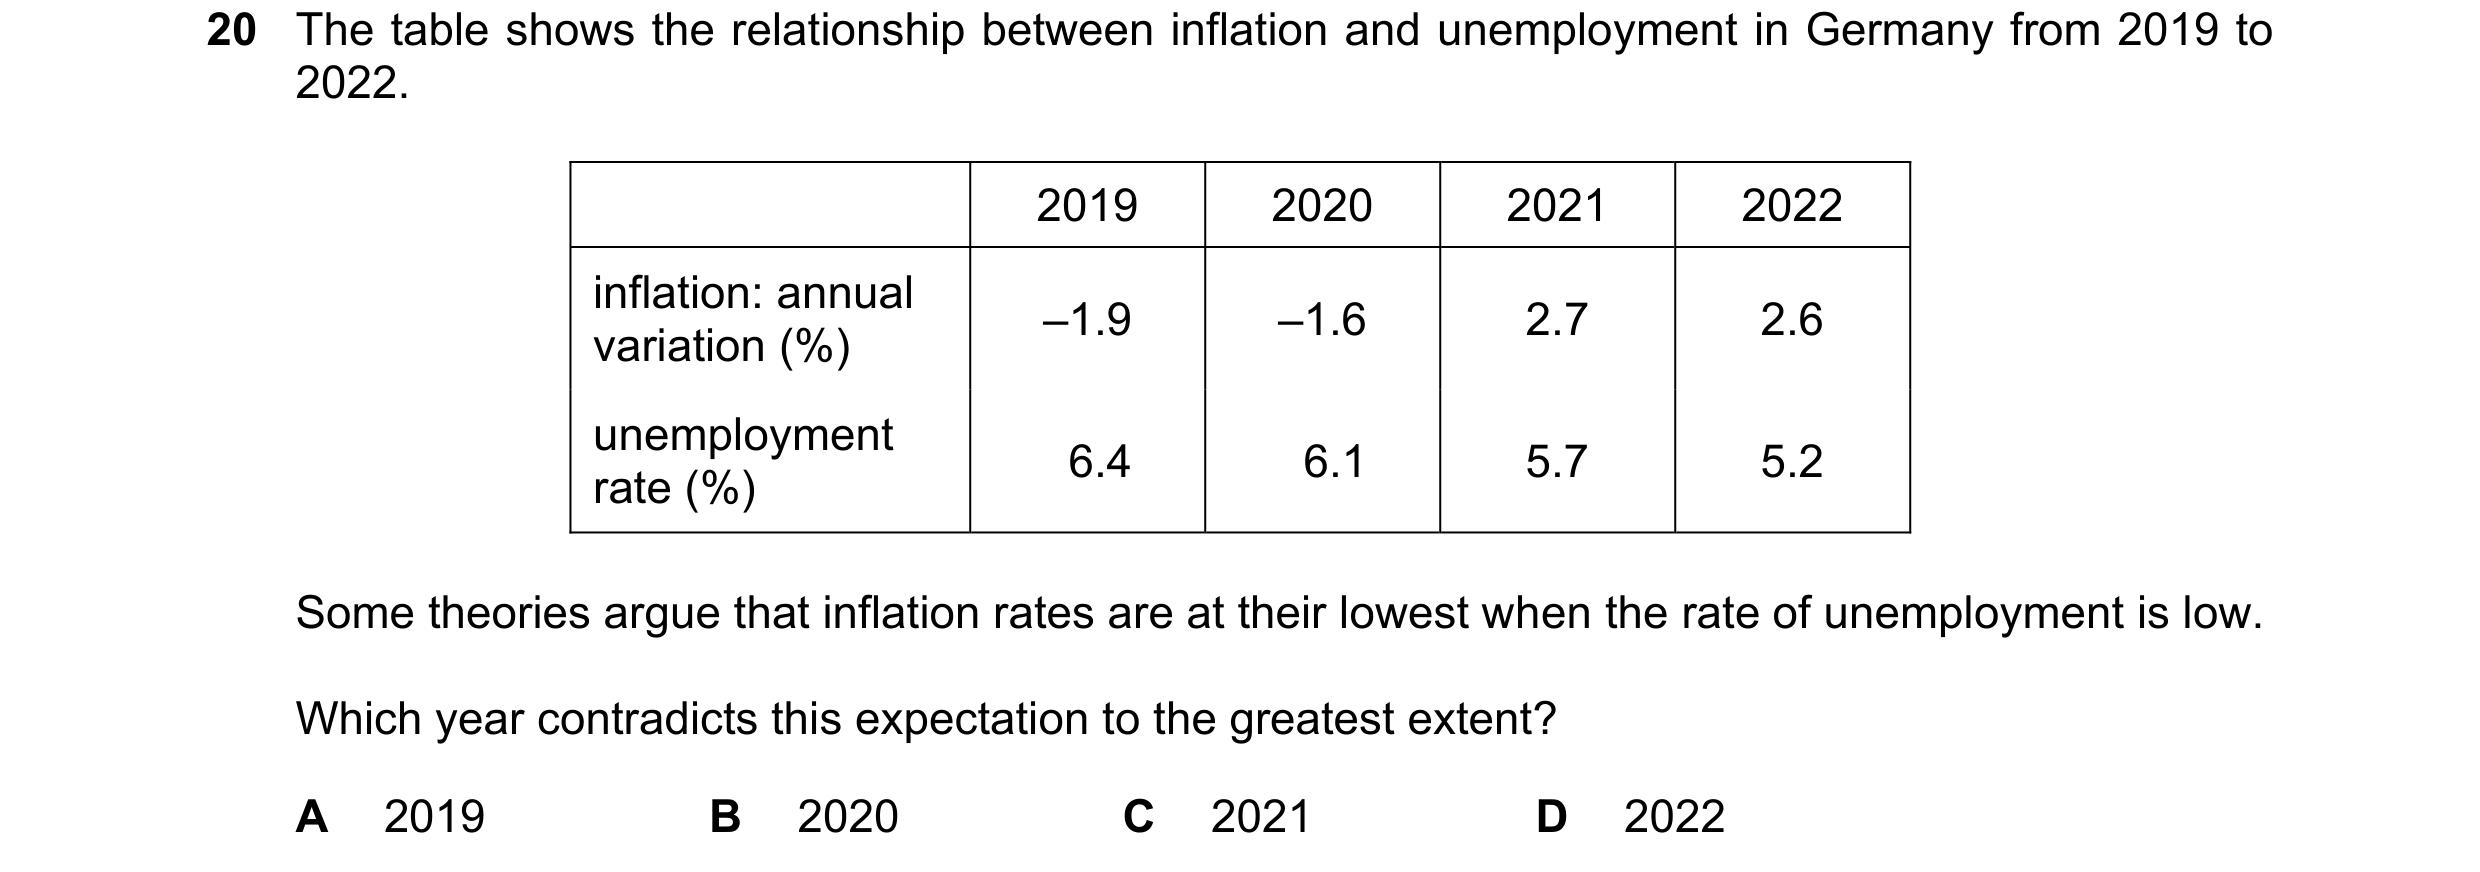
20 The table shows the relationship between inflation and unemployment in Germany from 2019 to 2022. 2019 2020 2021 2022 inflation: annual –1.9 –1.6 2.7 2.6 variation (%) unemployment 6.4 6.1 5.7 5.2 rate (%) Some theories argue that inflation rates are at their lowest when the rate of unemployment is low. Which year contradicts this expectation to the greatest extent? A 2019 B 2020 C 2021 D 2022
1 marks
Answer: A
This question in 9708/33 May/June 2024
 1 / 14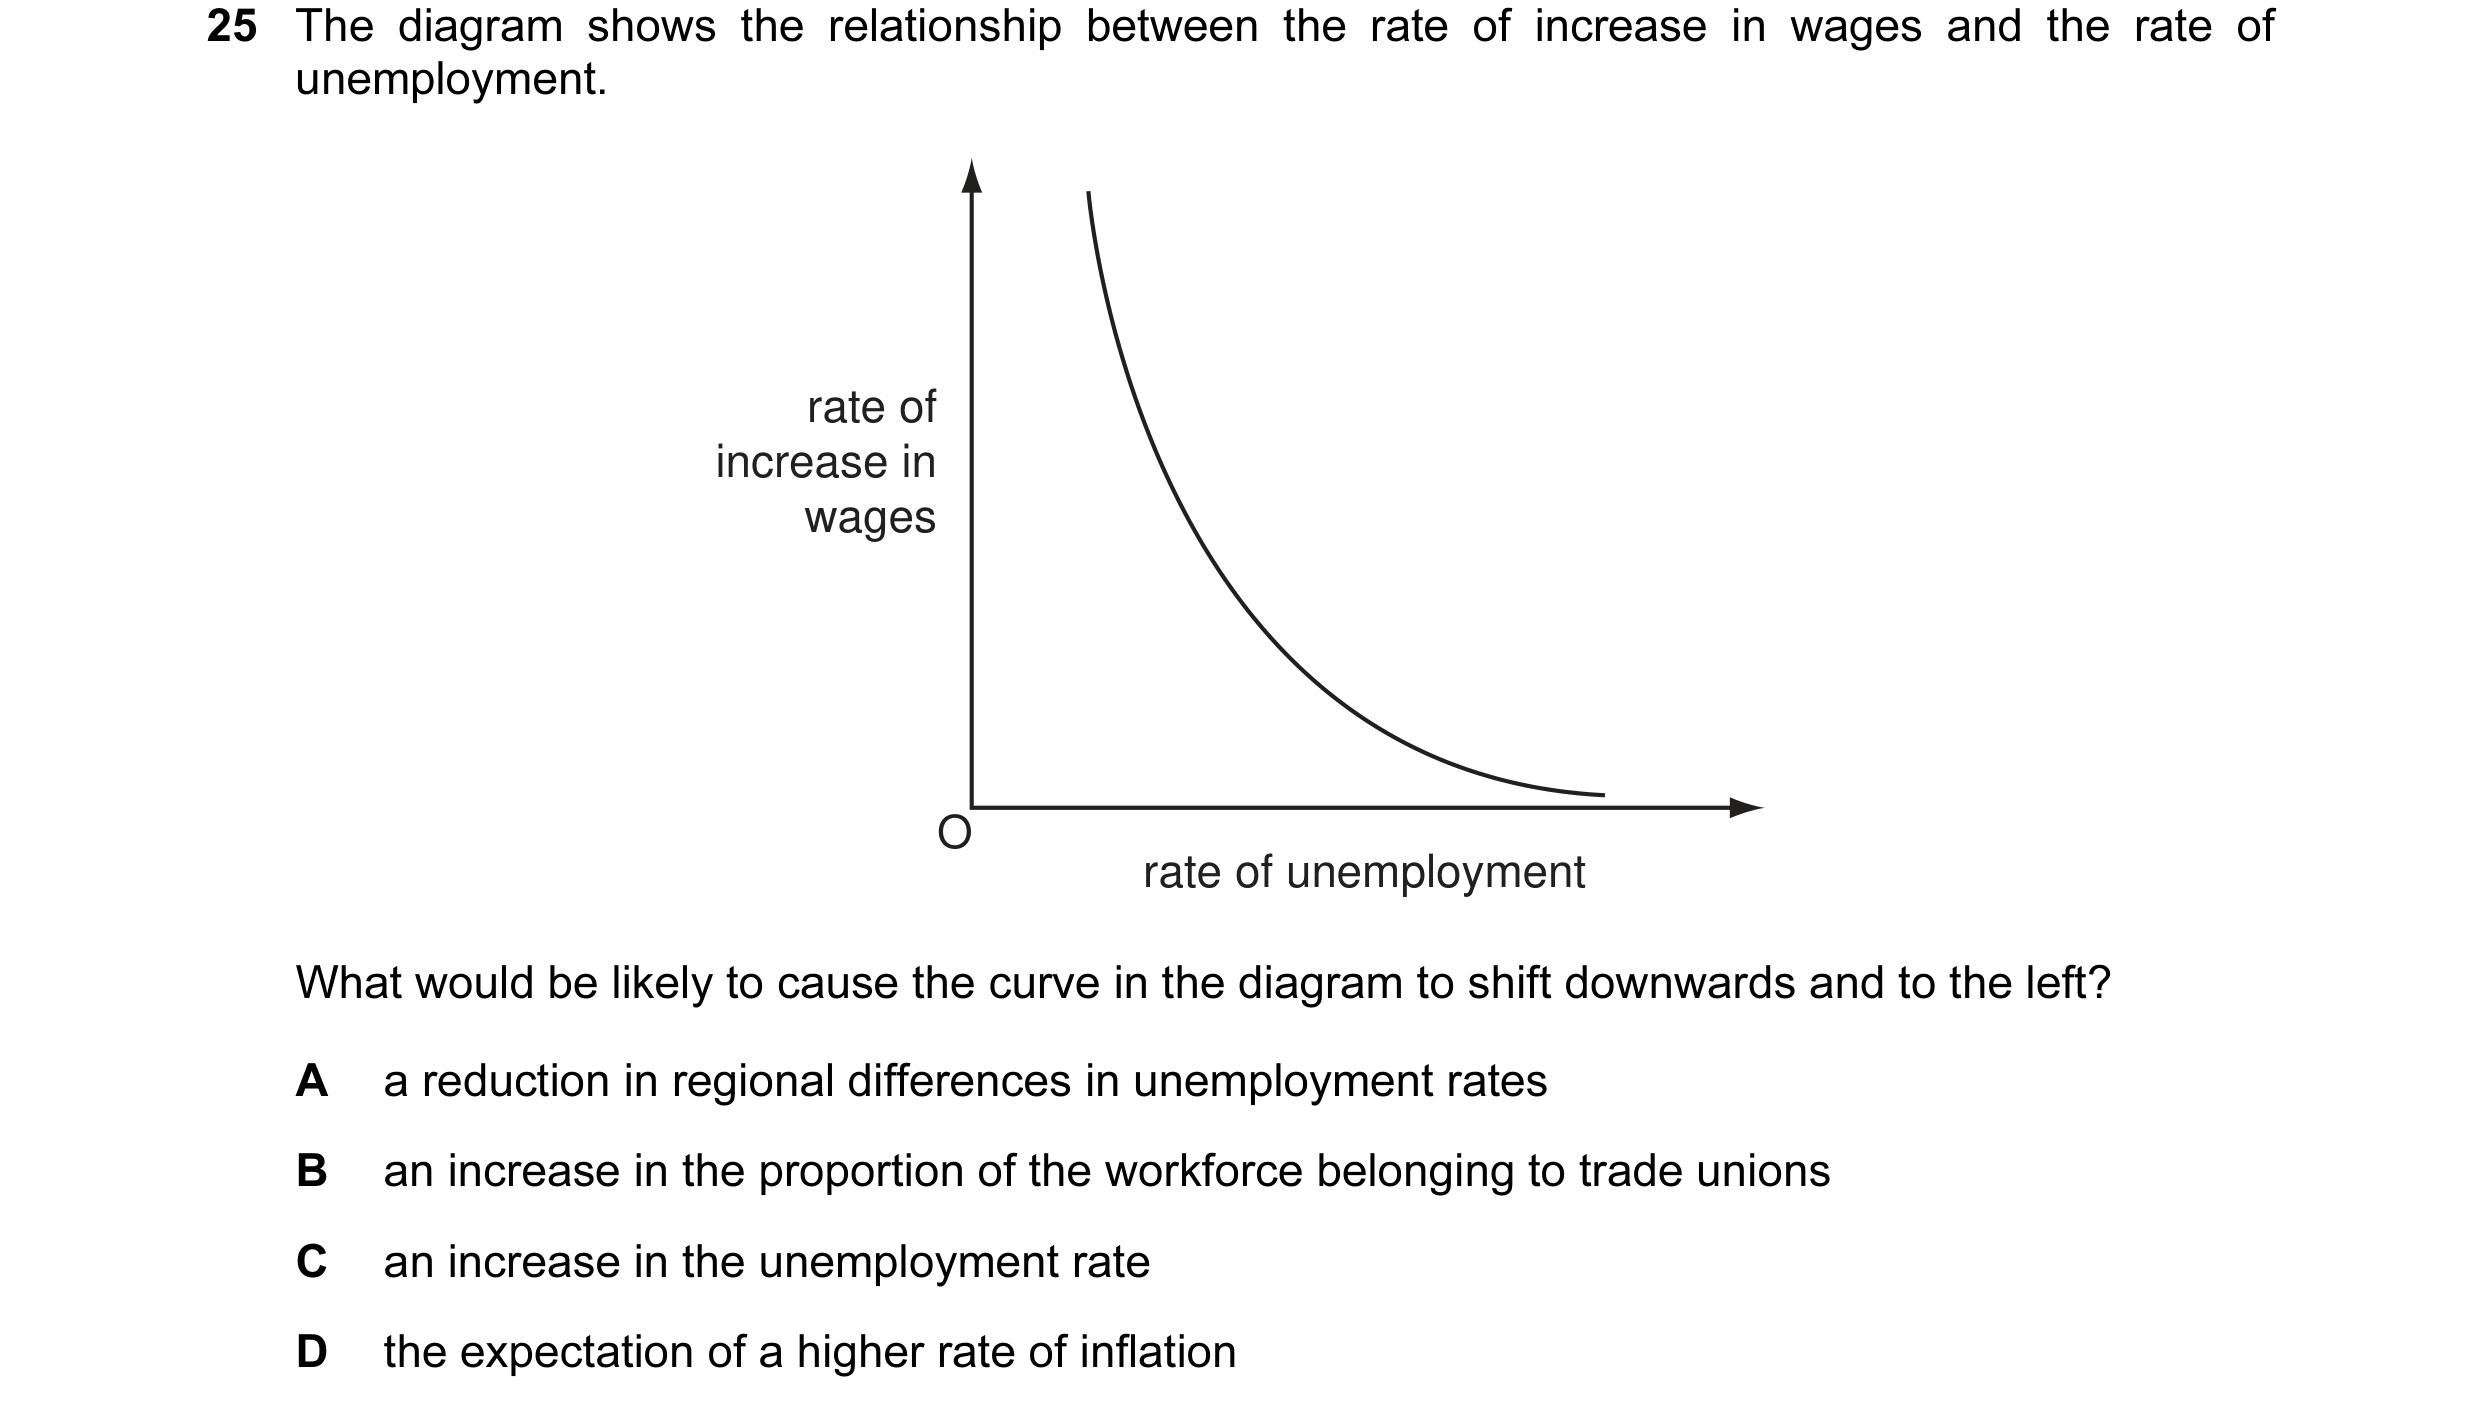
 2 / 14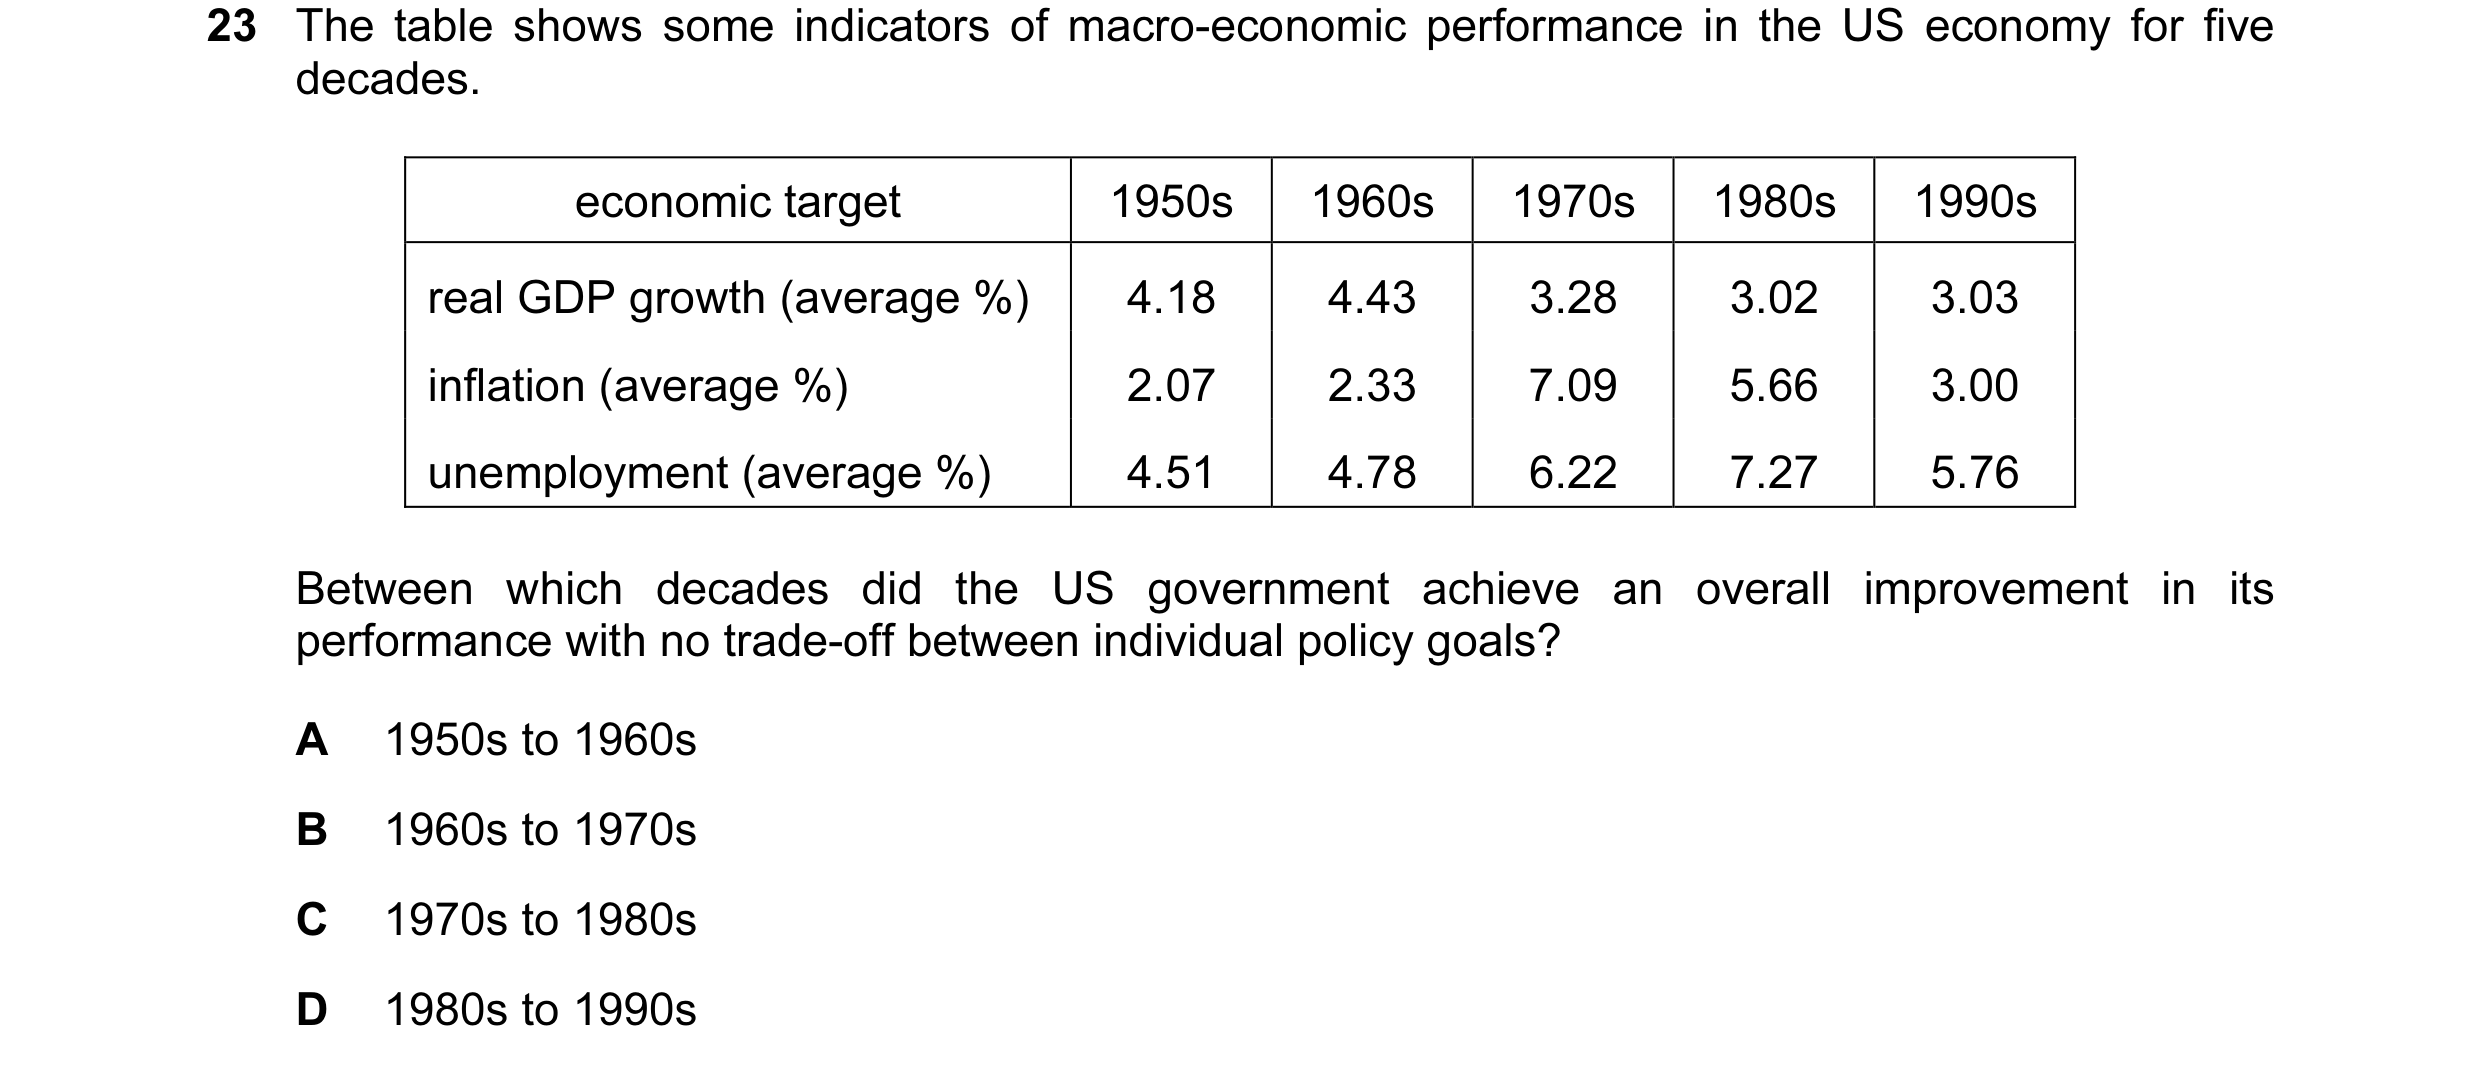
 3 / 14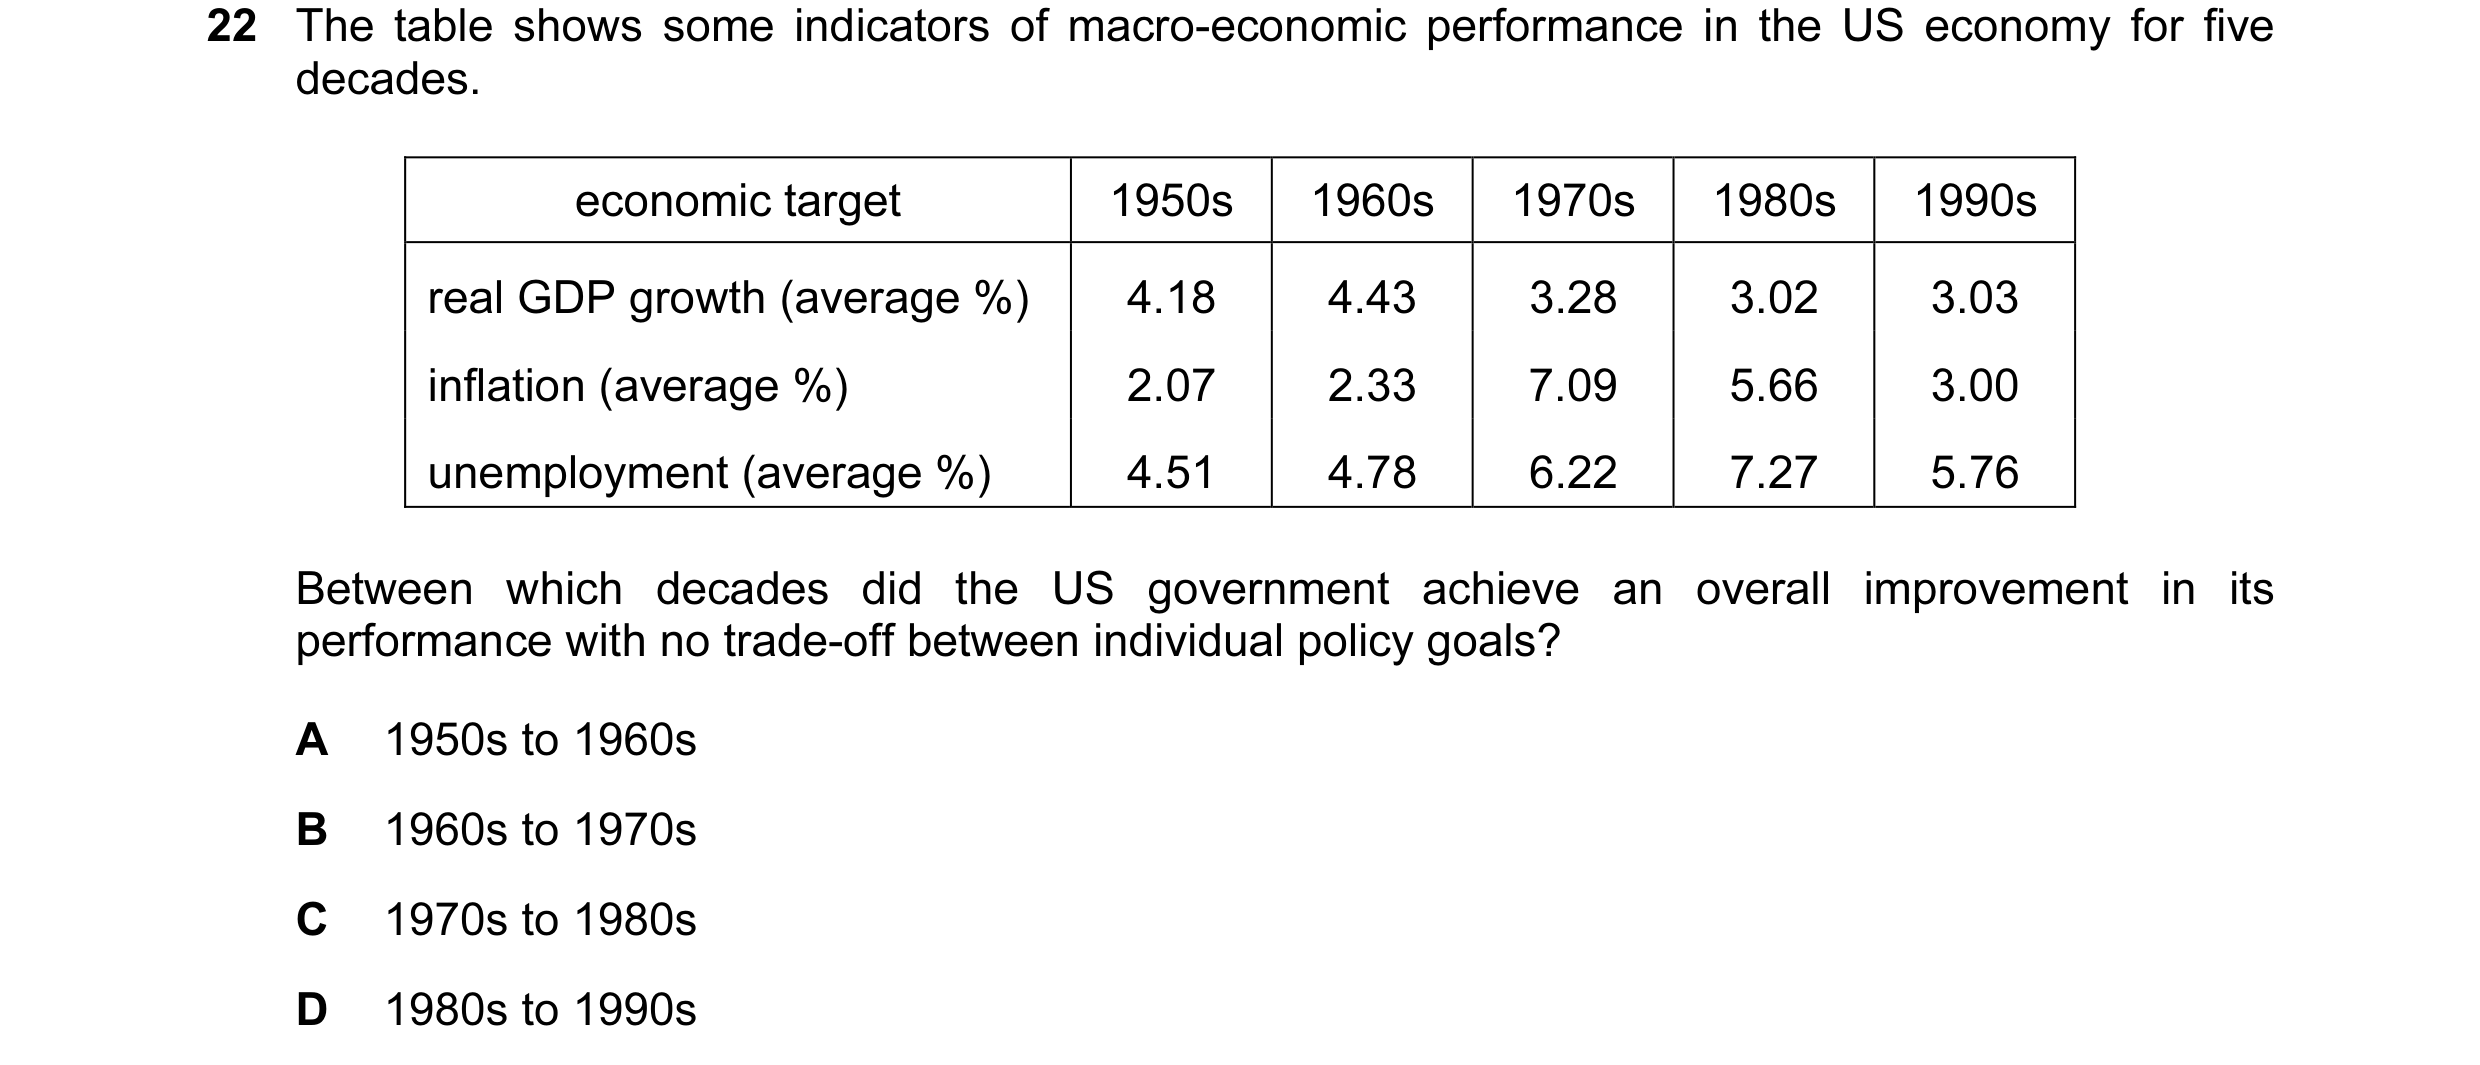

 4 / 14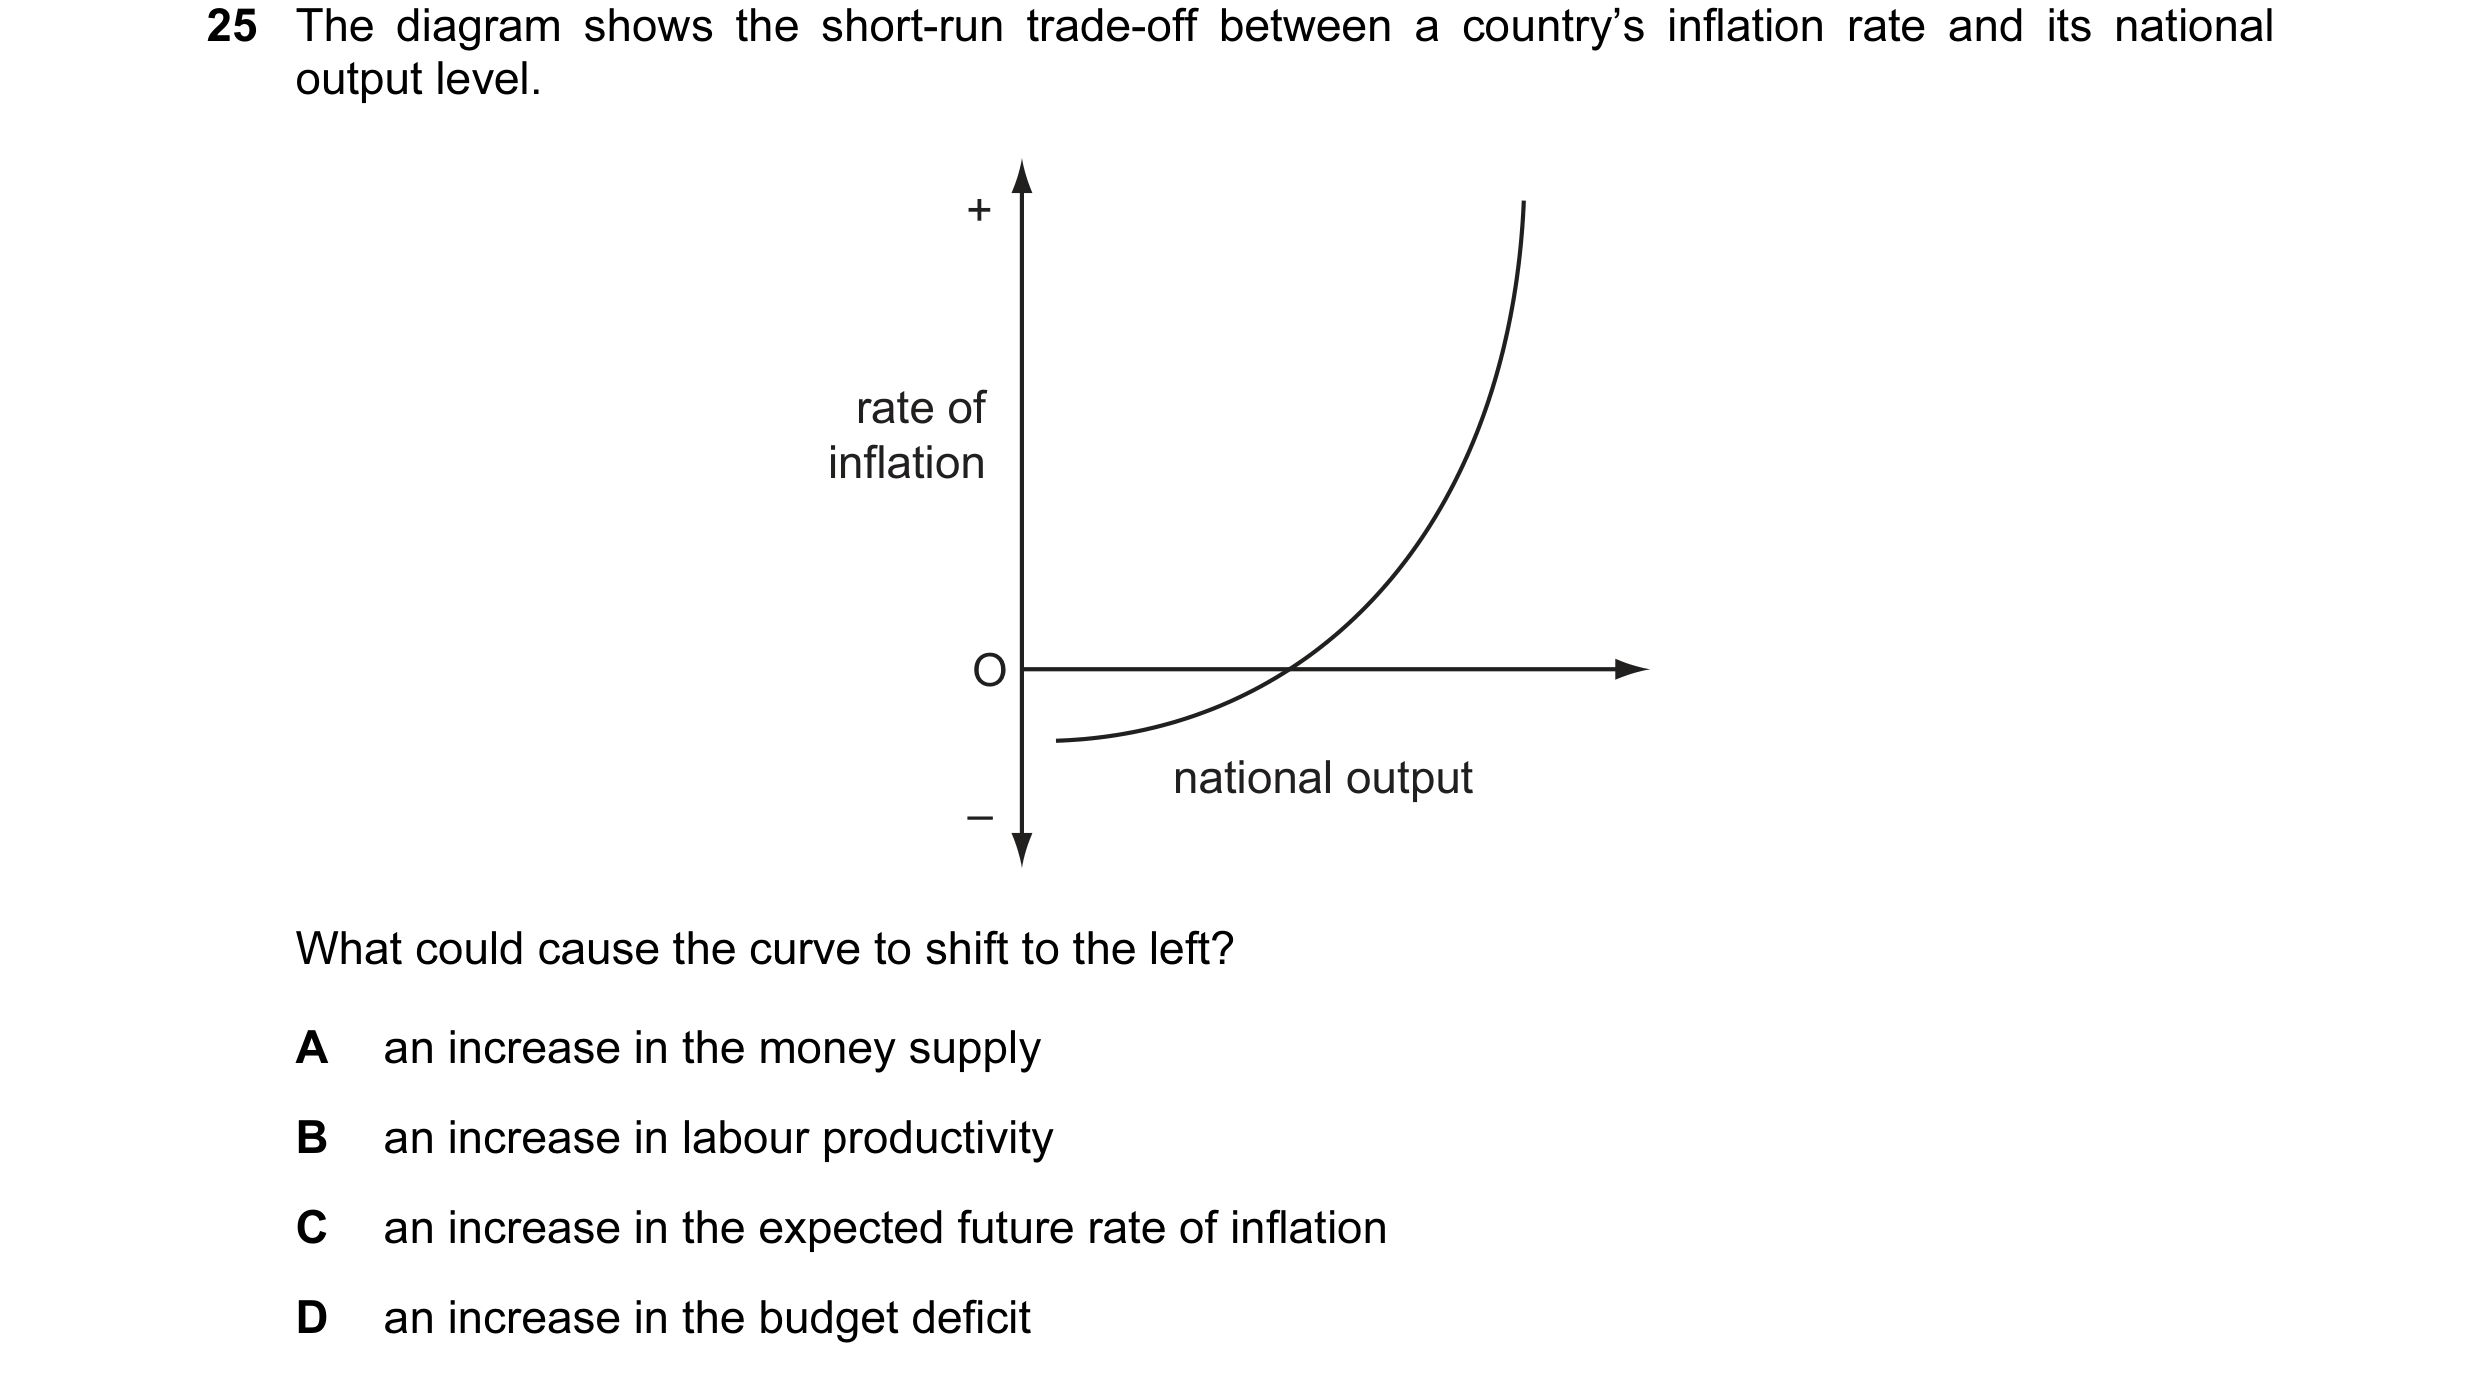
 5 / 14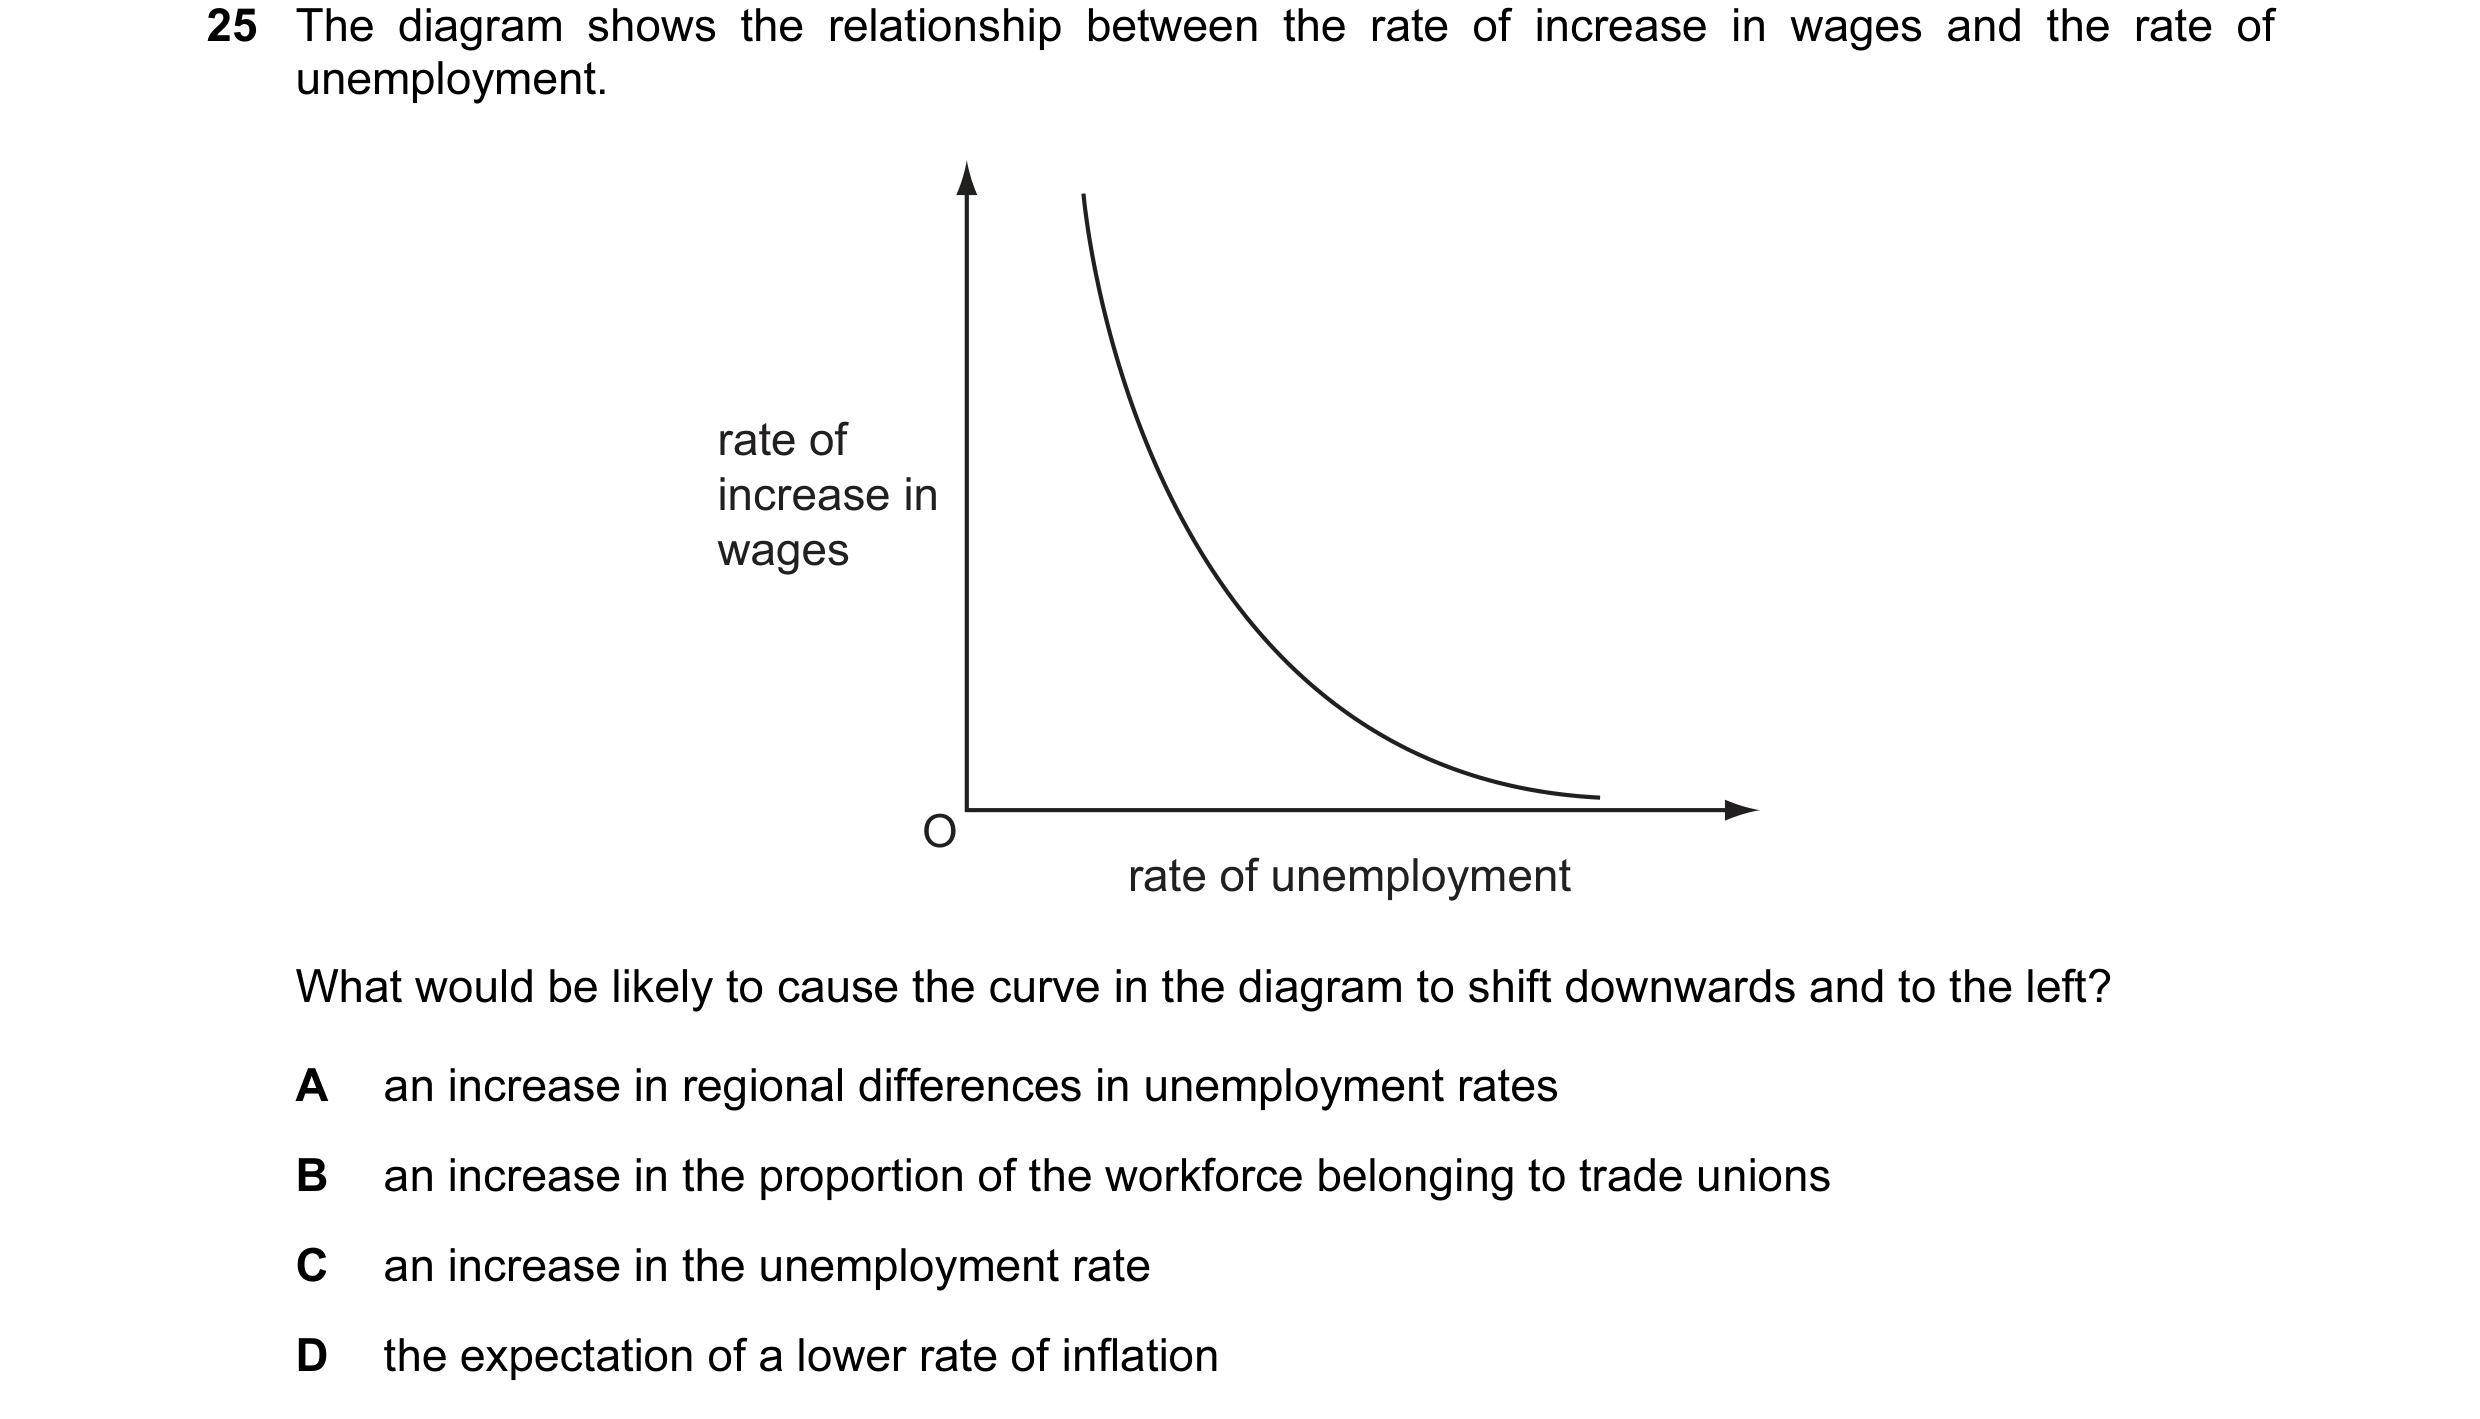

 6 / 14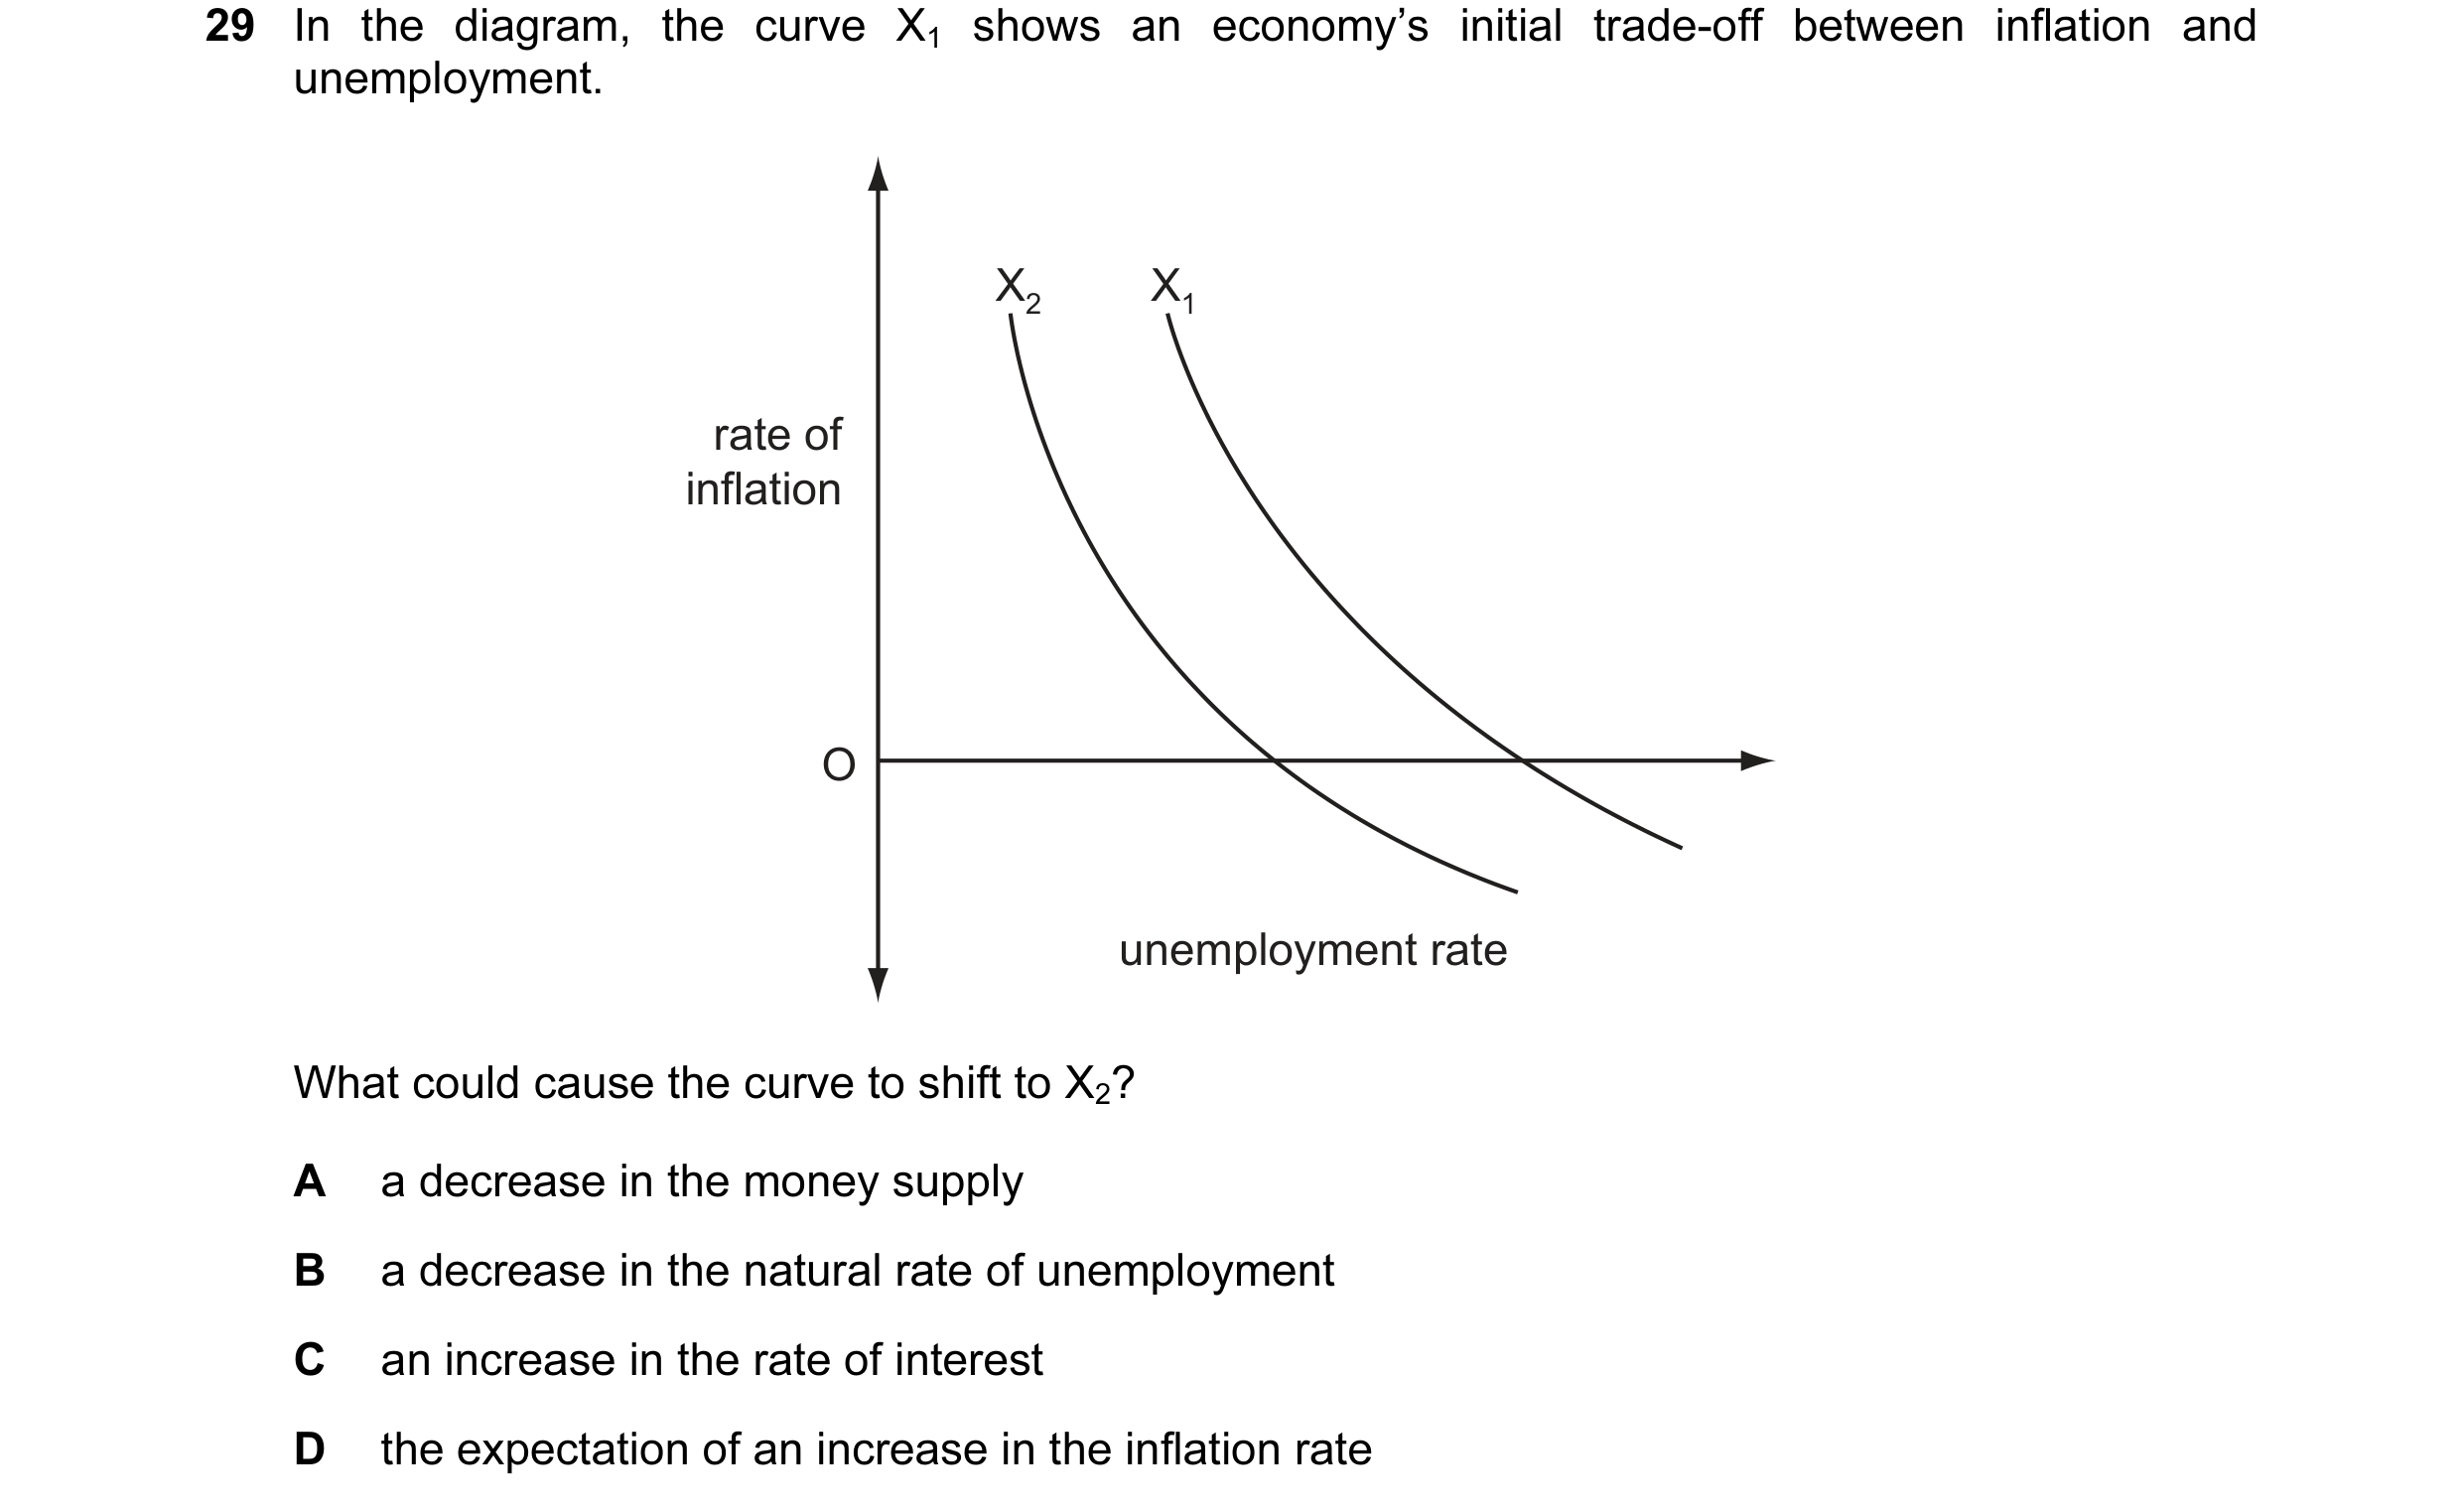
 7 / 14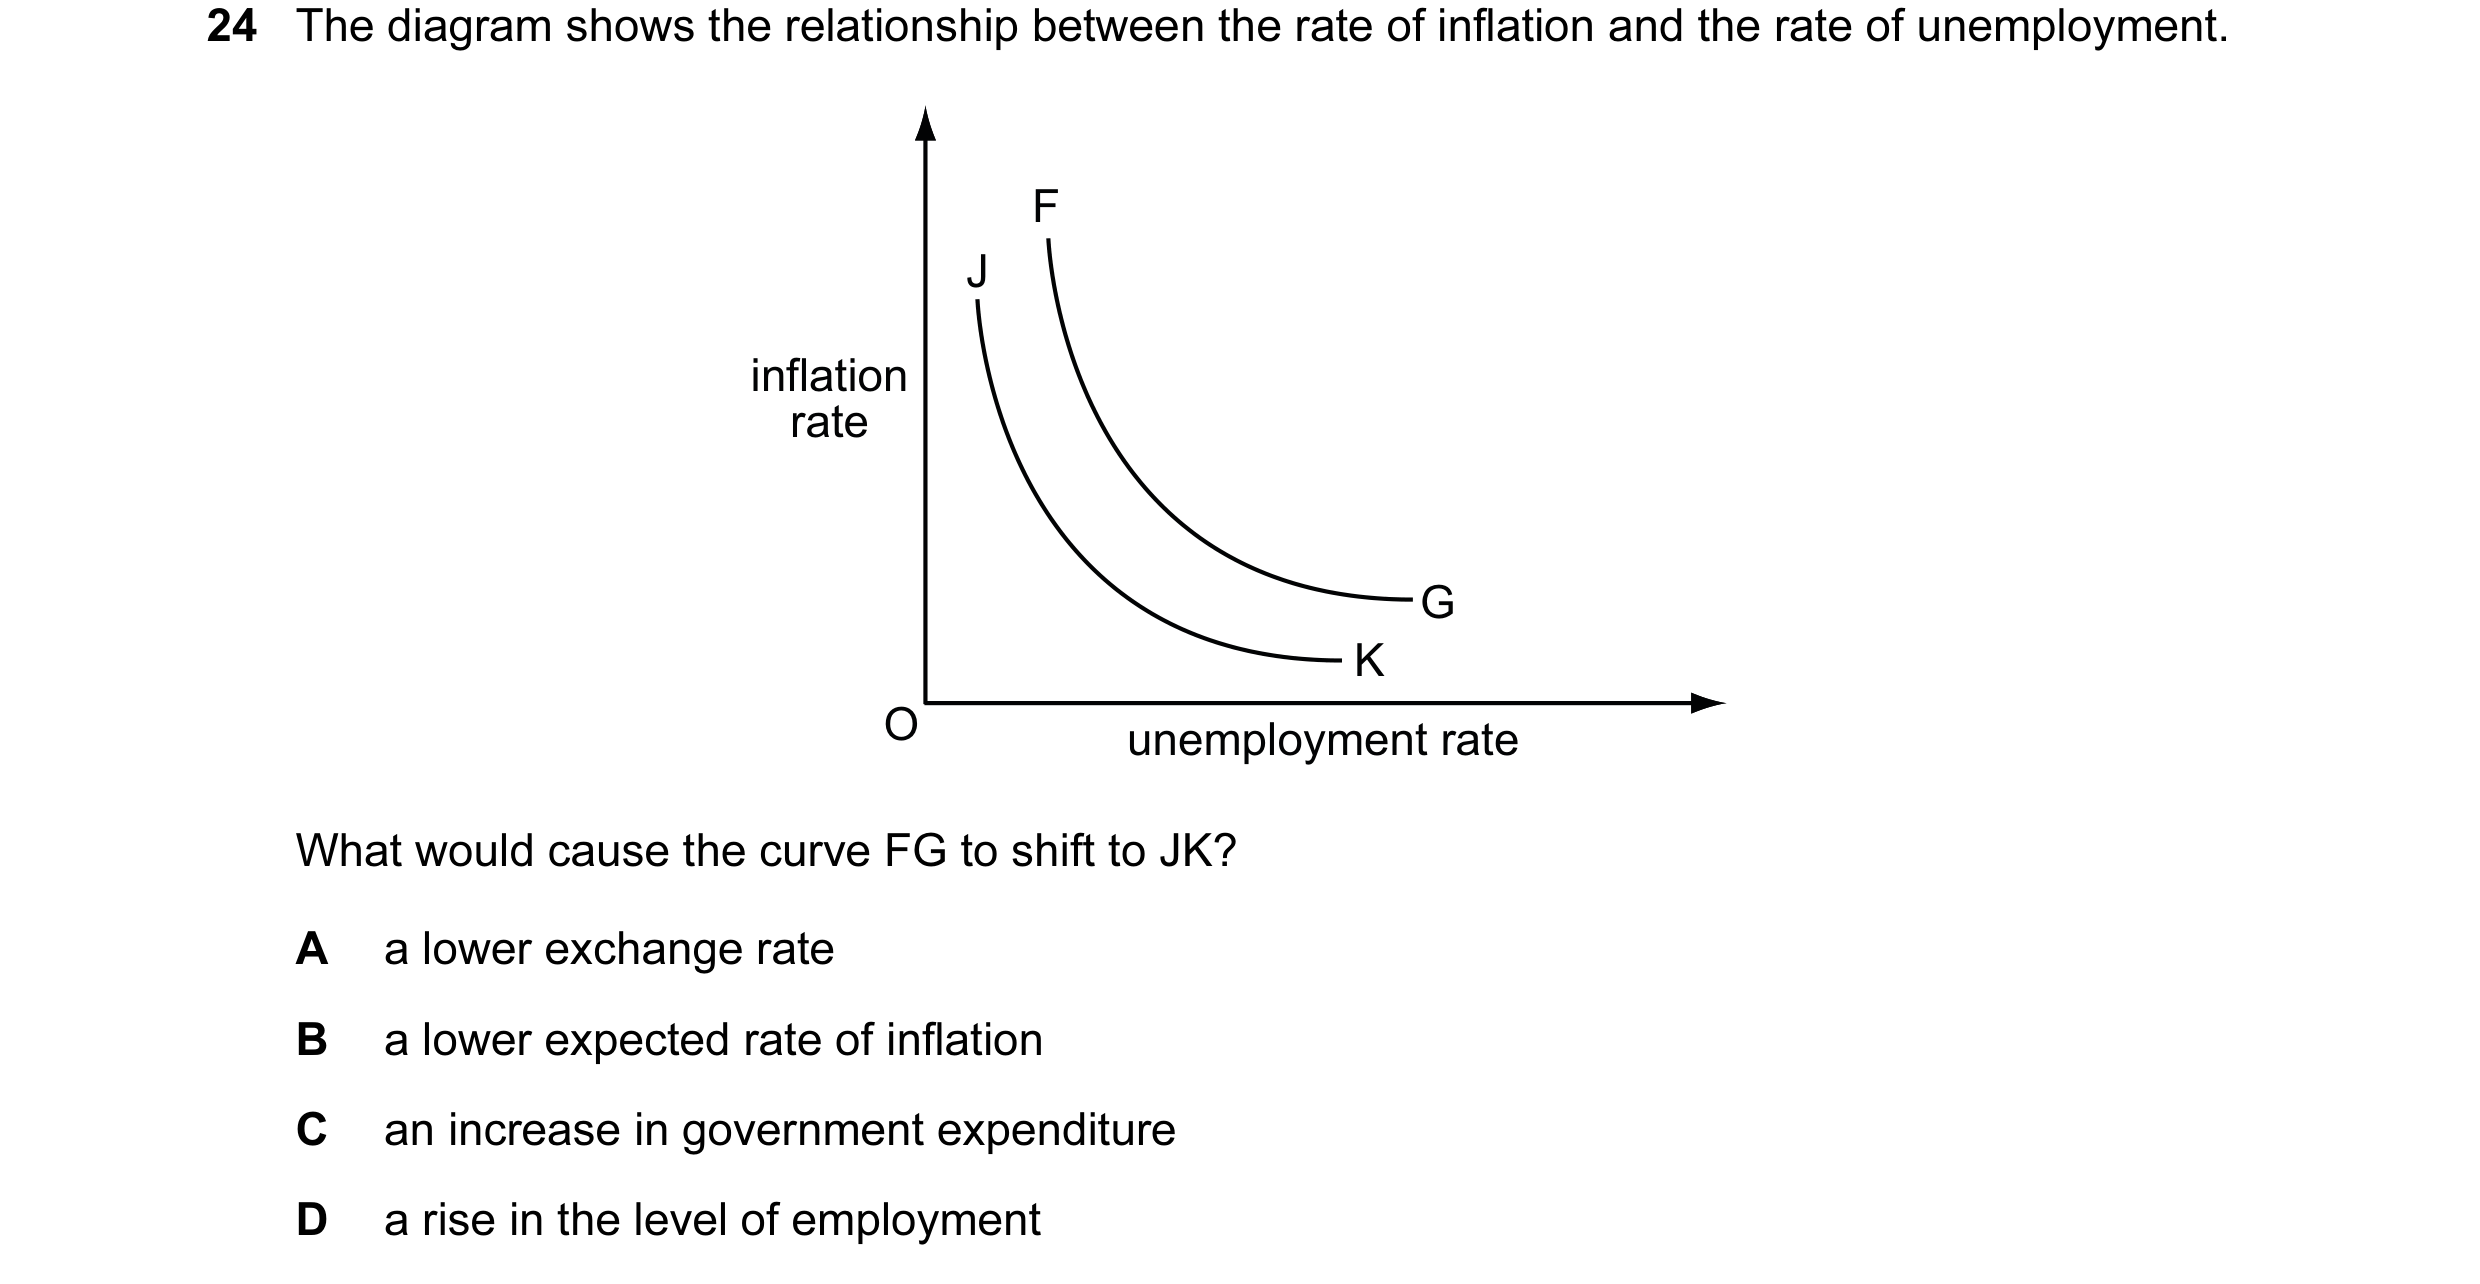
 8 / 14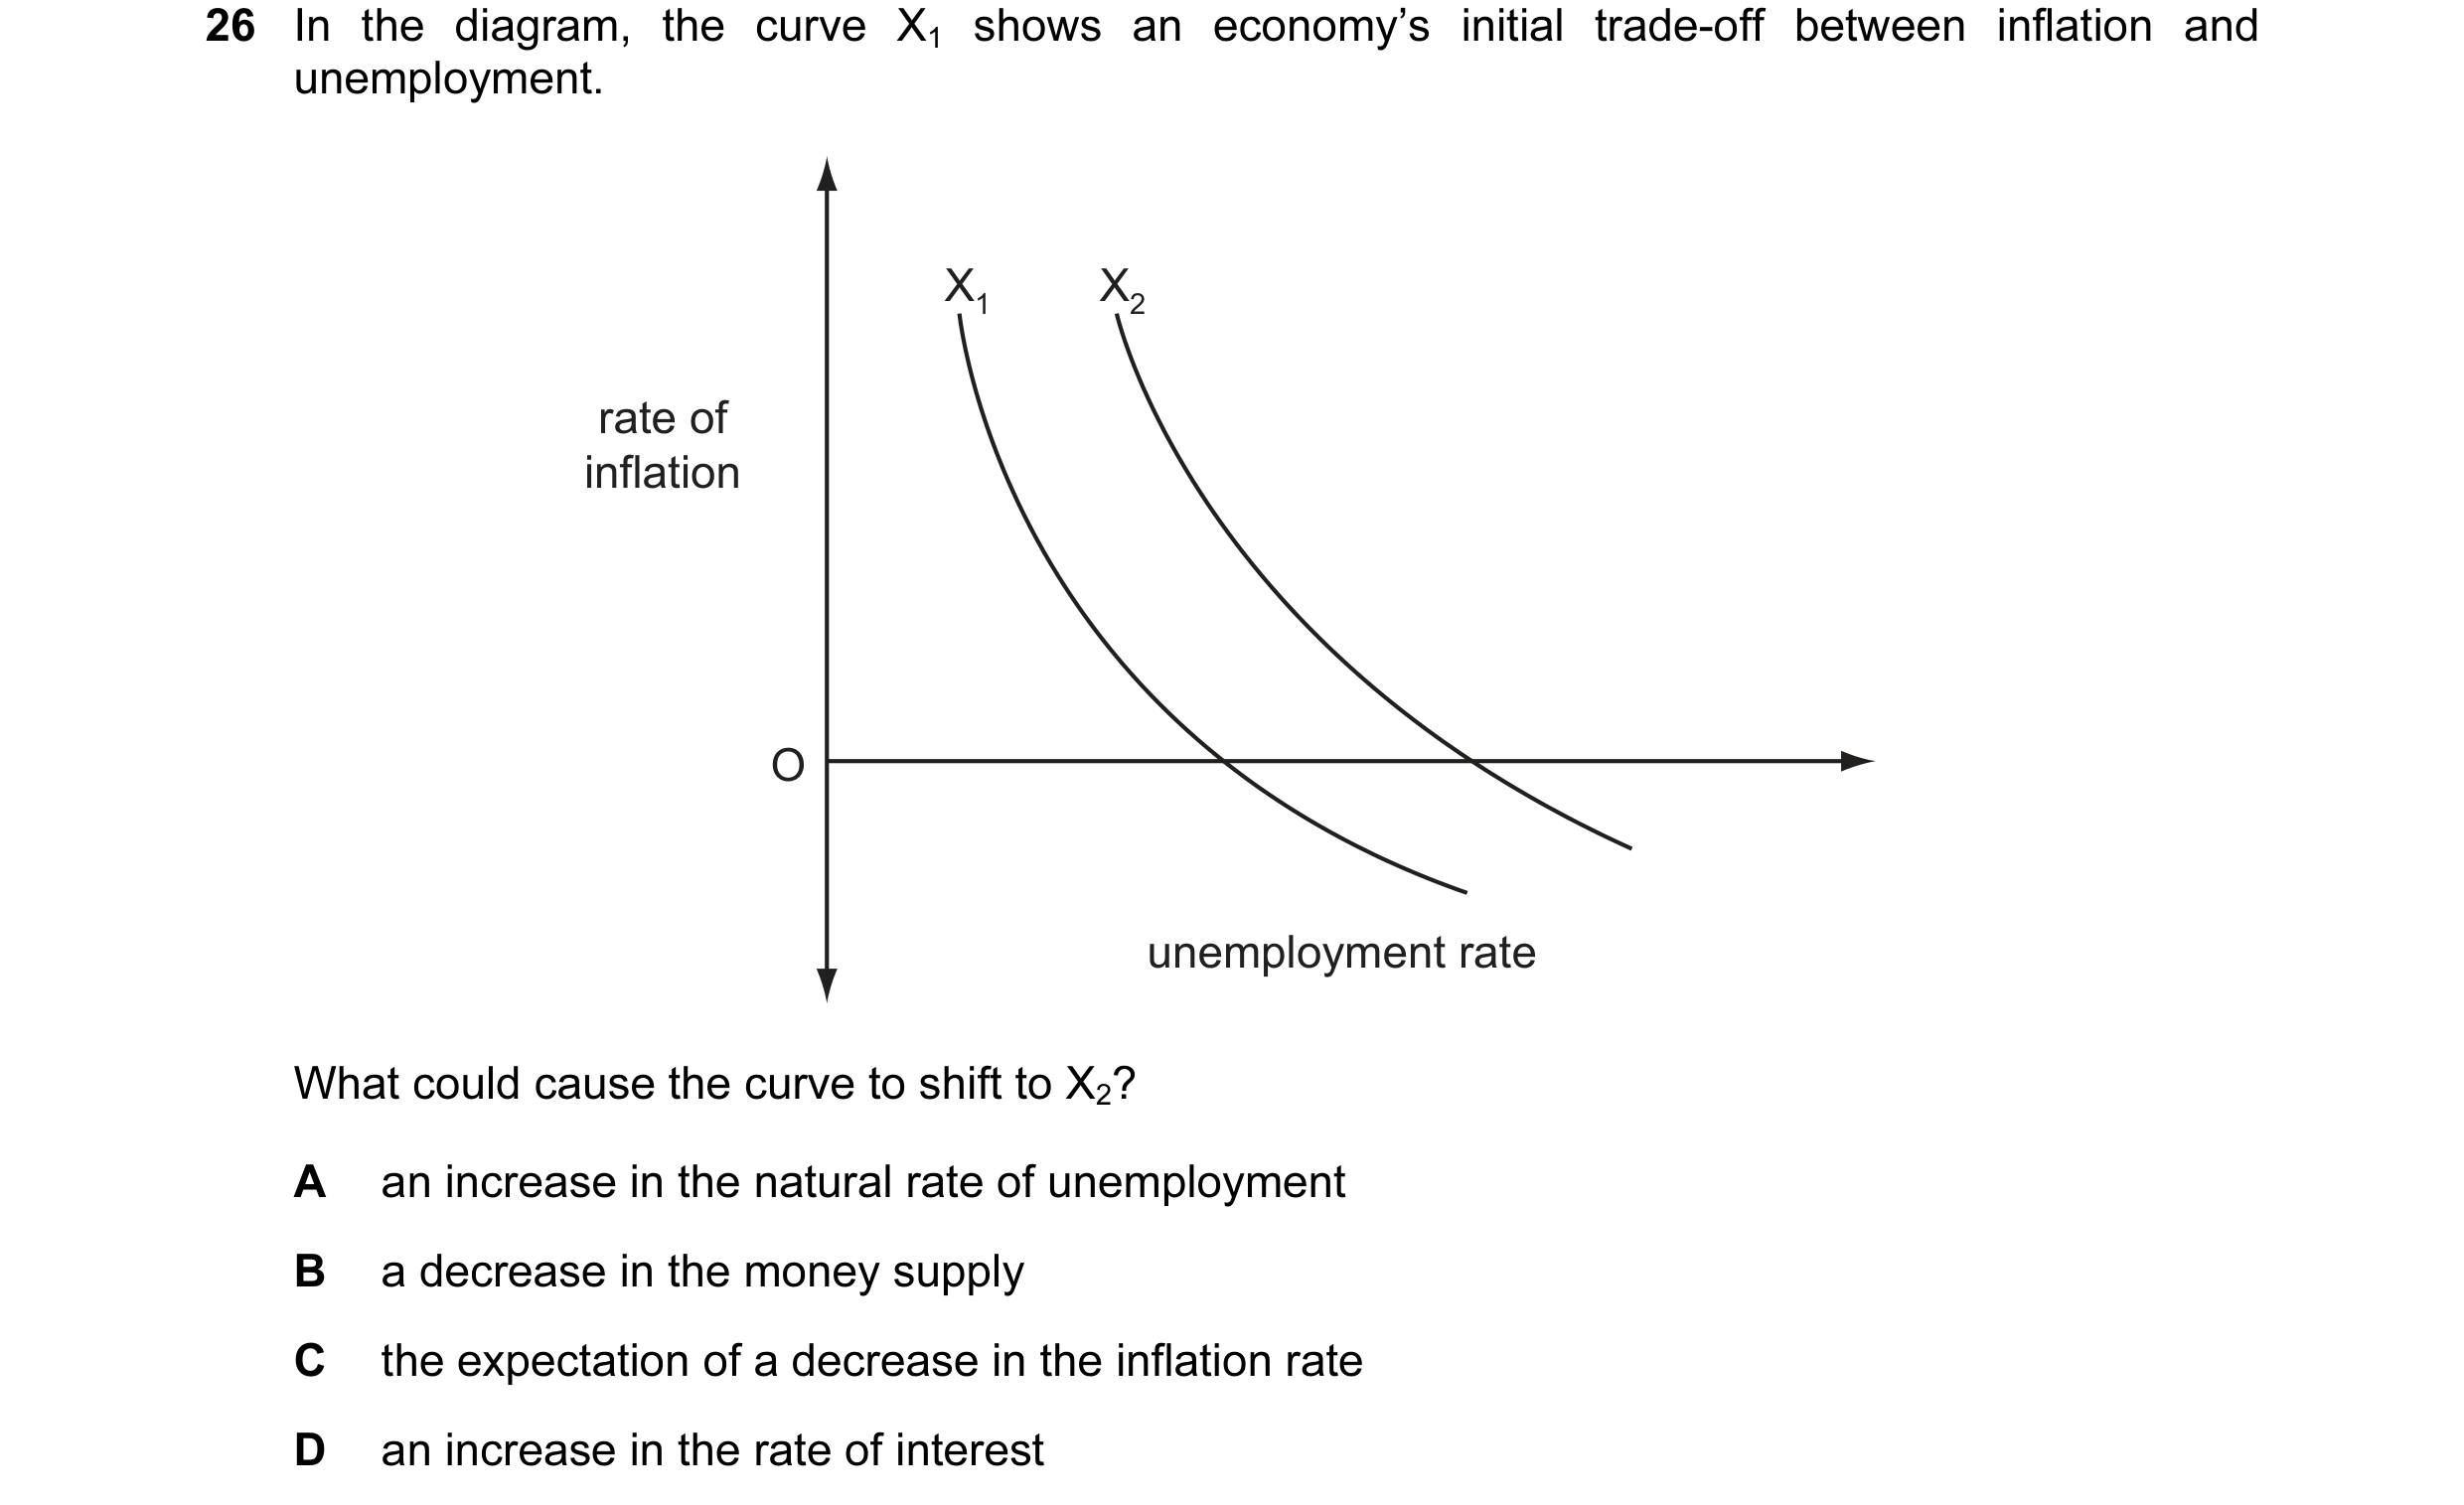
 9 / 14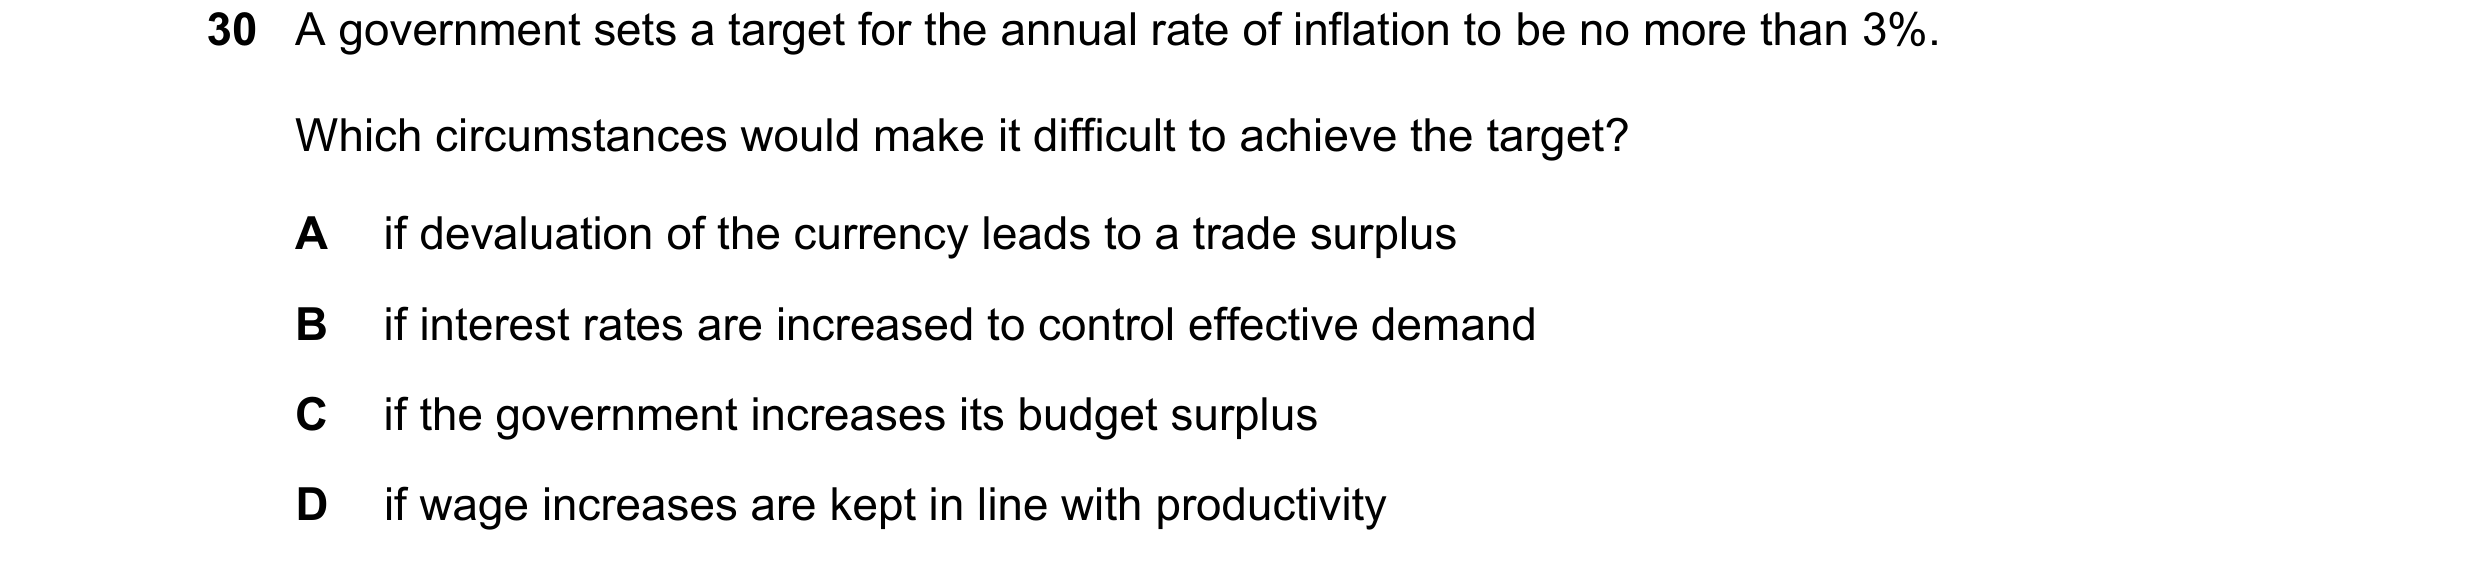
 10 / 14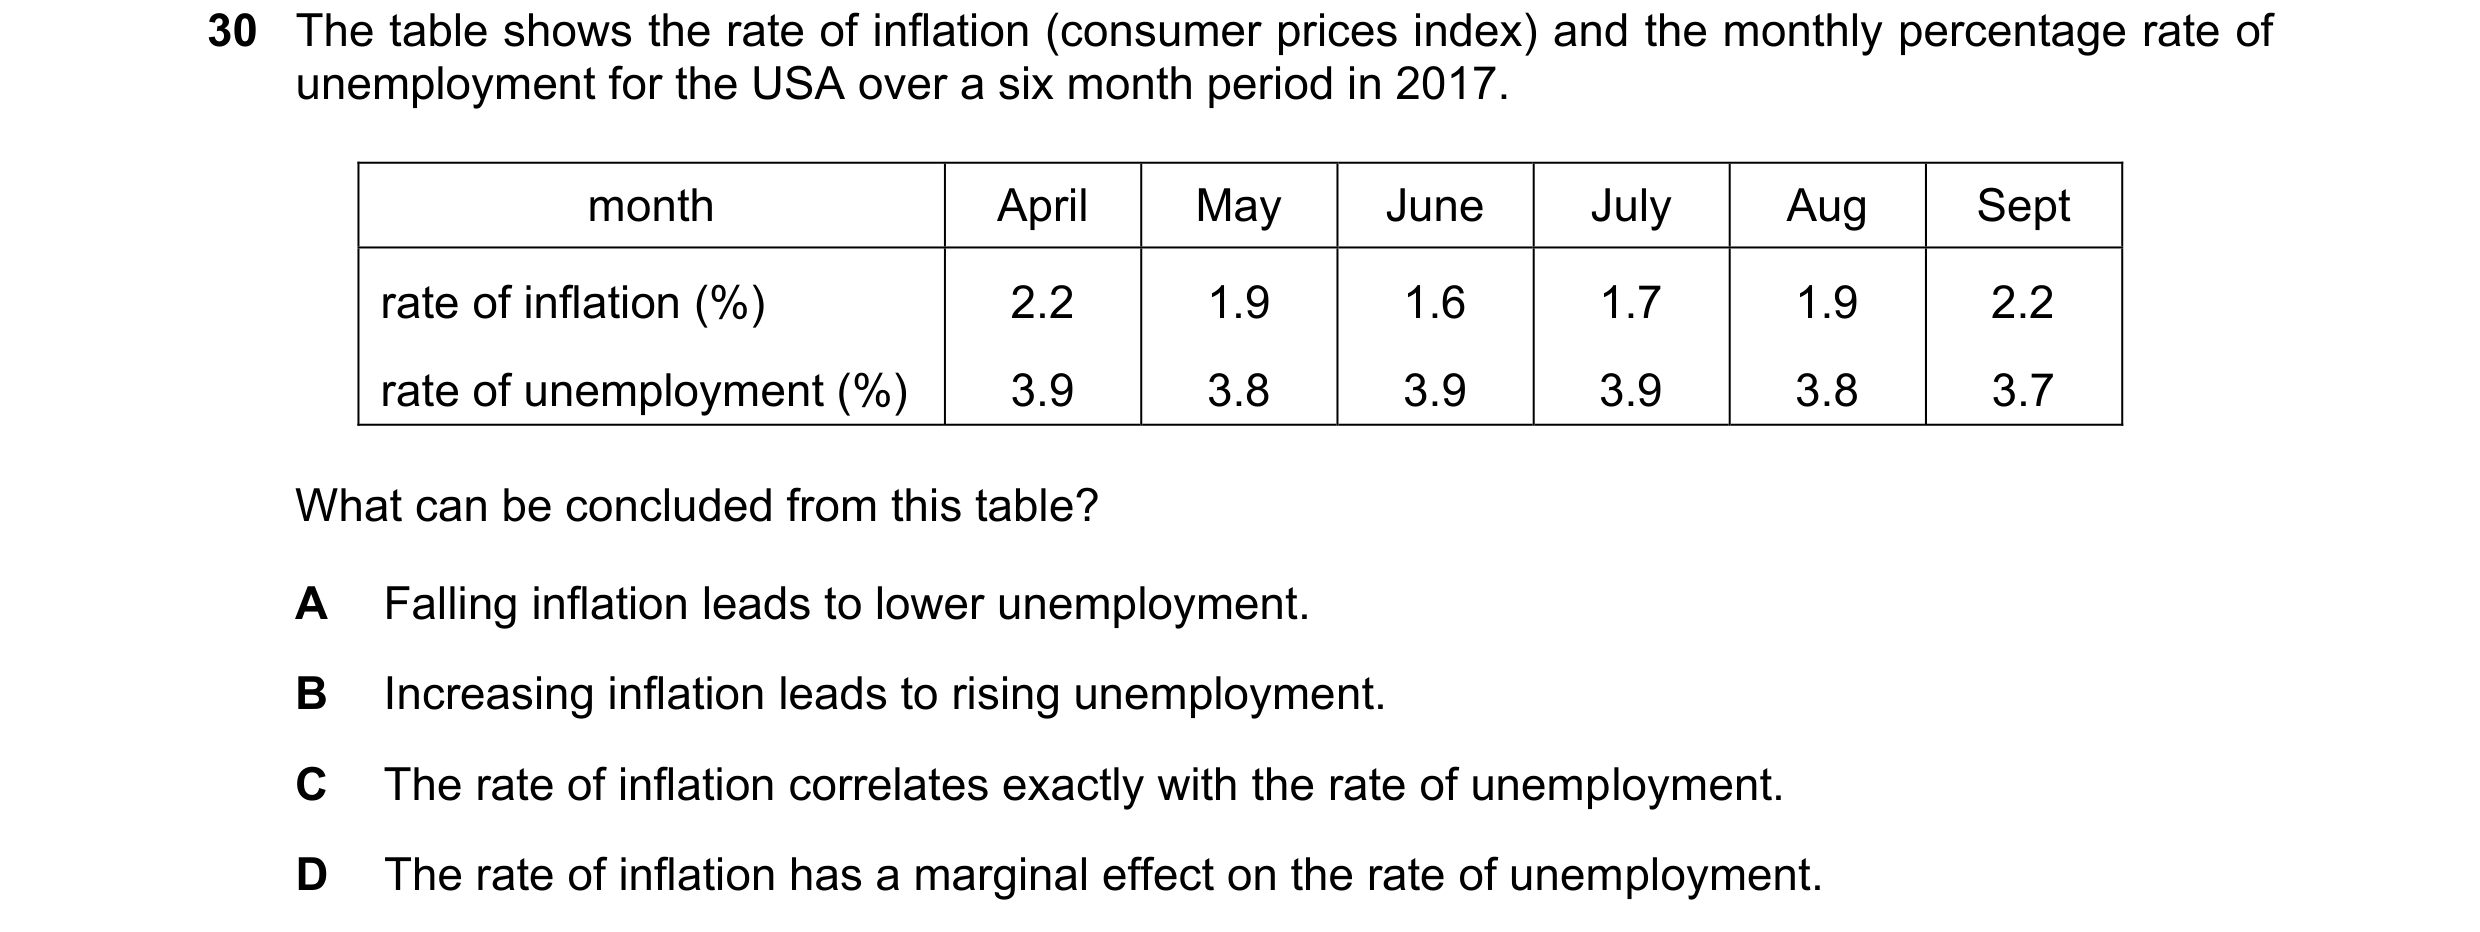
 11 / 14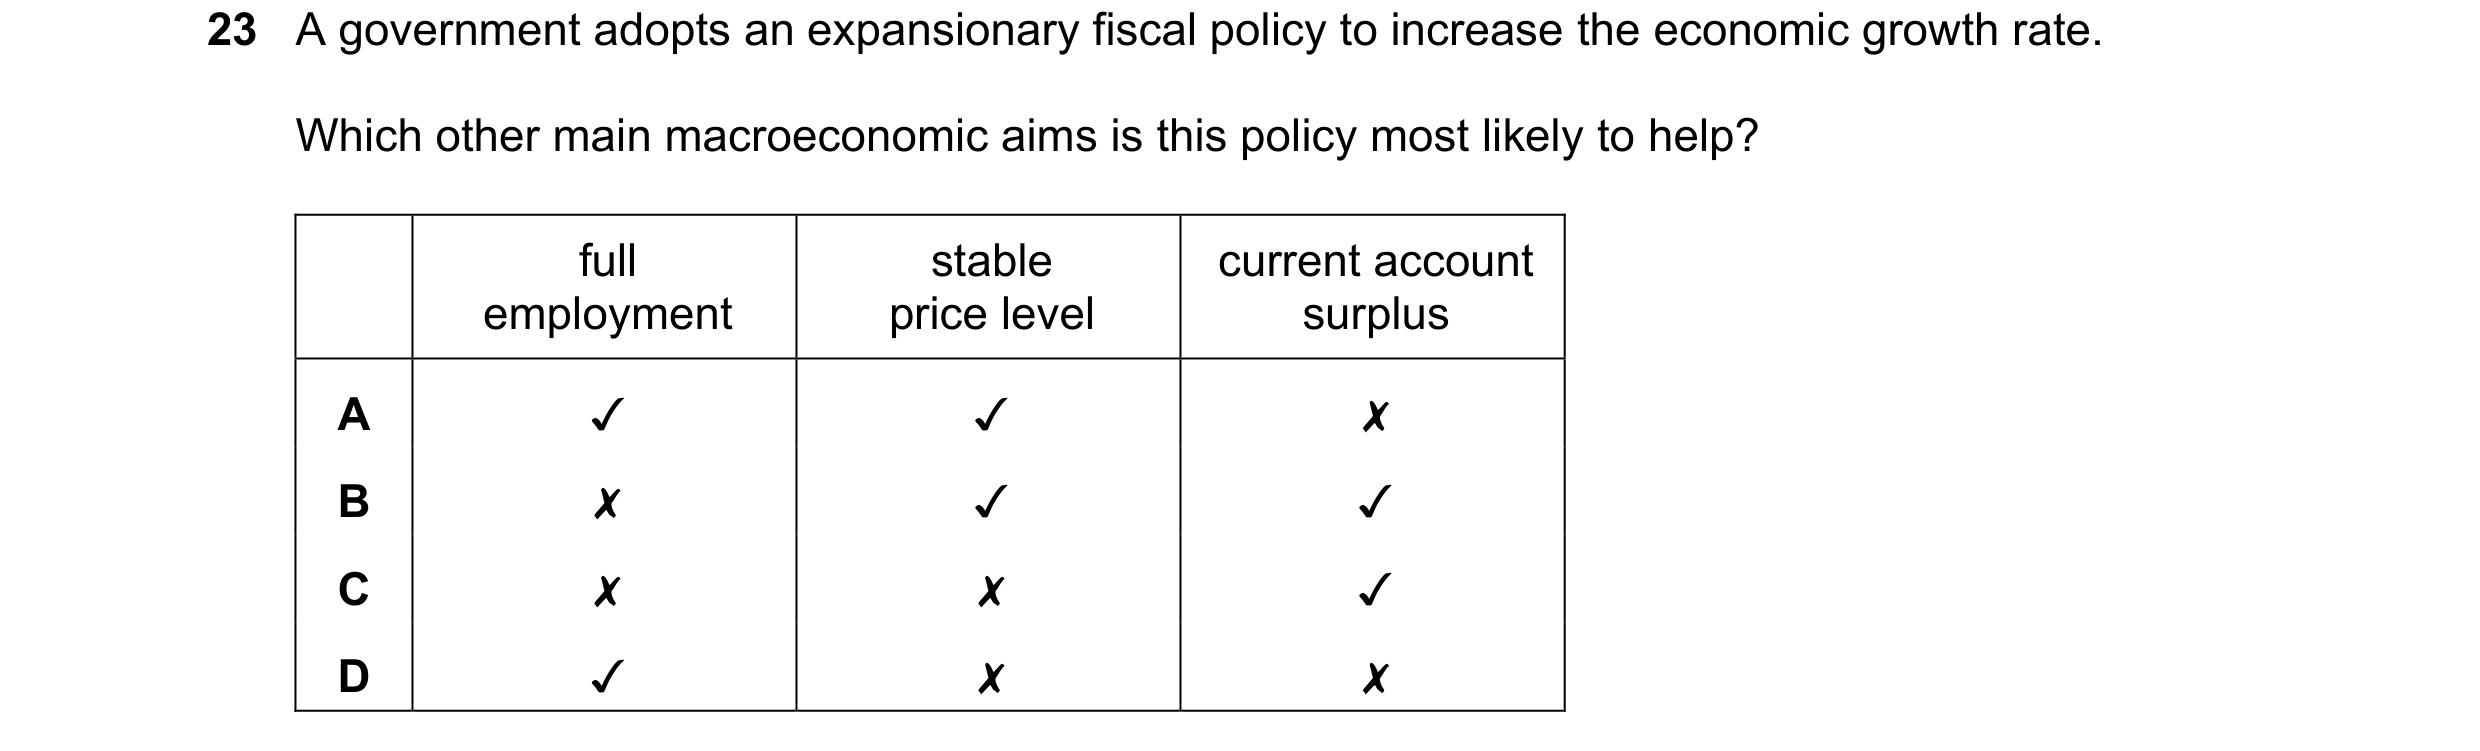
 12 / 14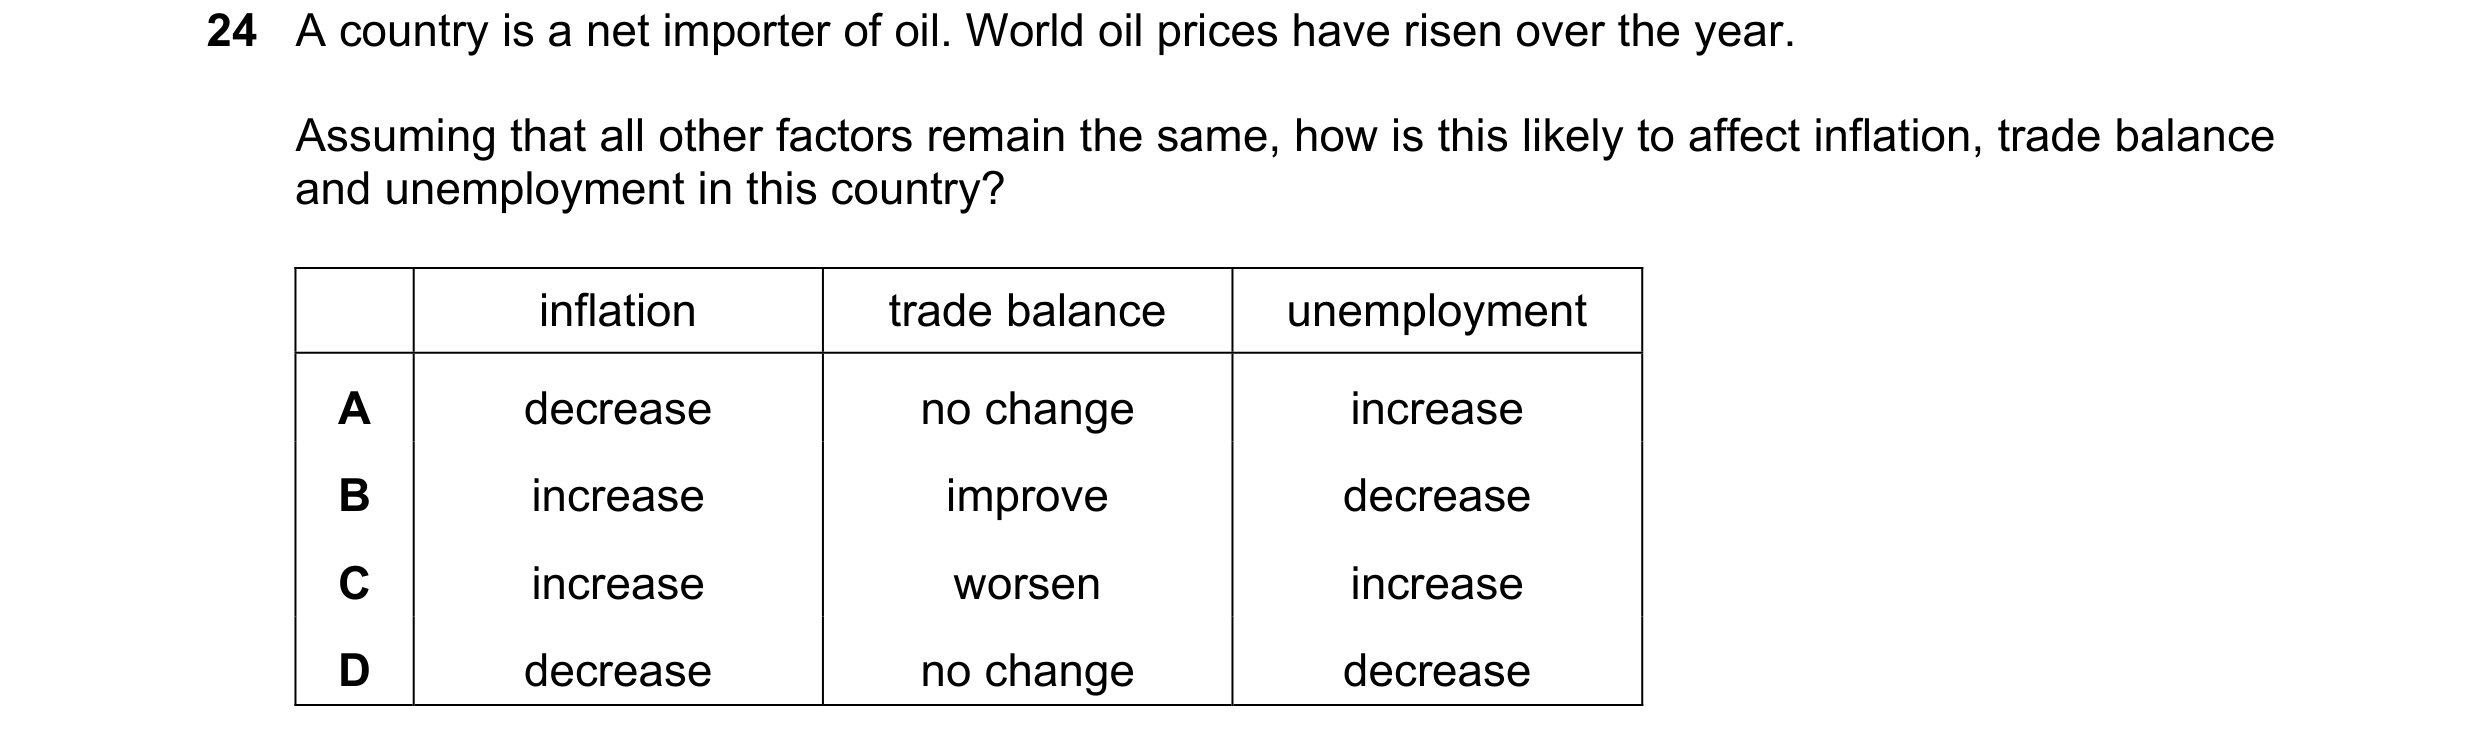

 13 / 14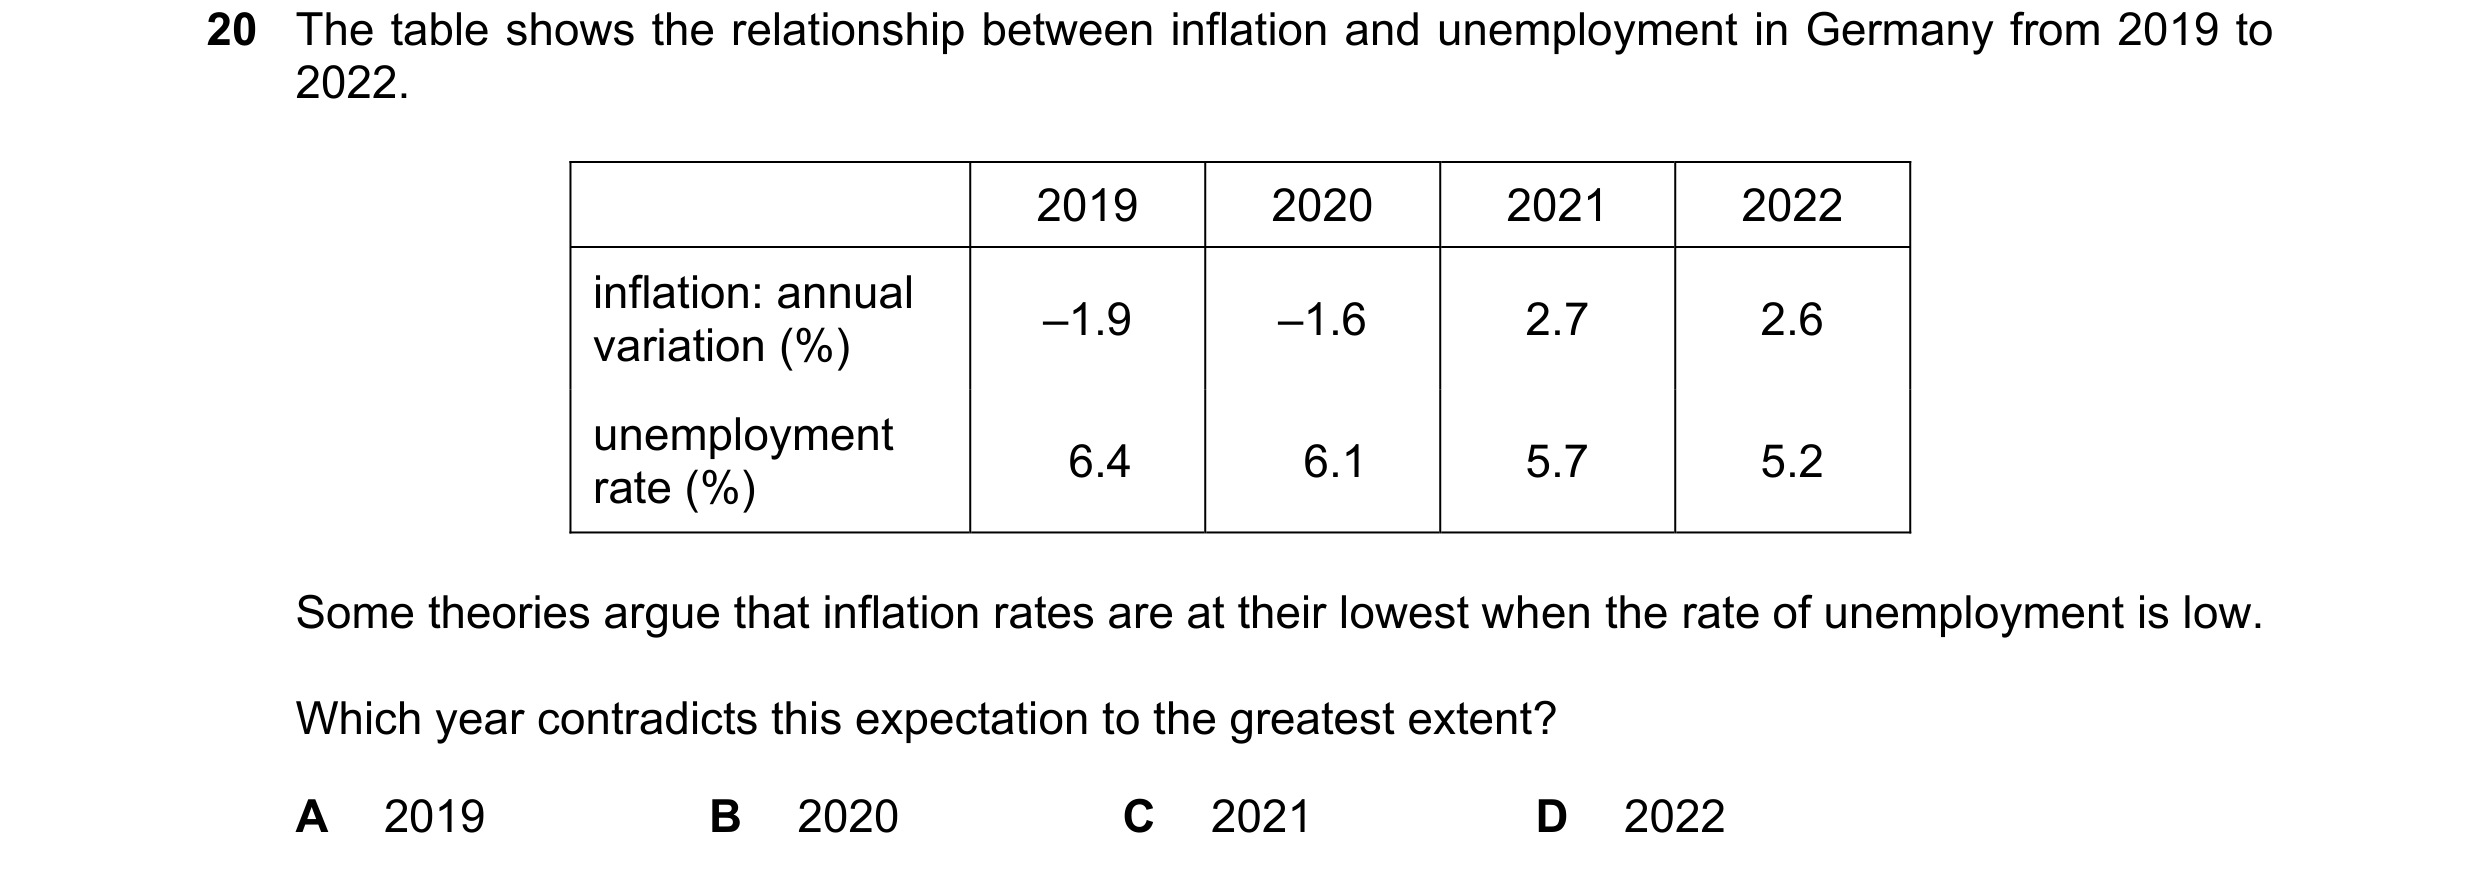
 14 / 14