Cambridge A Level Biology 9700 — 2022 Feb/March Paper 5 · Variant 2
9700/52/F/M/22 · 4 questions · 30 marks · ≈34 min
The question paper and its mark scheme, free to read here and free to download. This is Cambridge’s own paper, exactly as it was sat.
Question paper16 pages




Mark scheme9 pages
Answers below. Sit the paper first if you are practising.
Questions as text
Q1 · Some students wanted to investigate the effect of light intensity on the rate of…
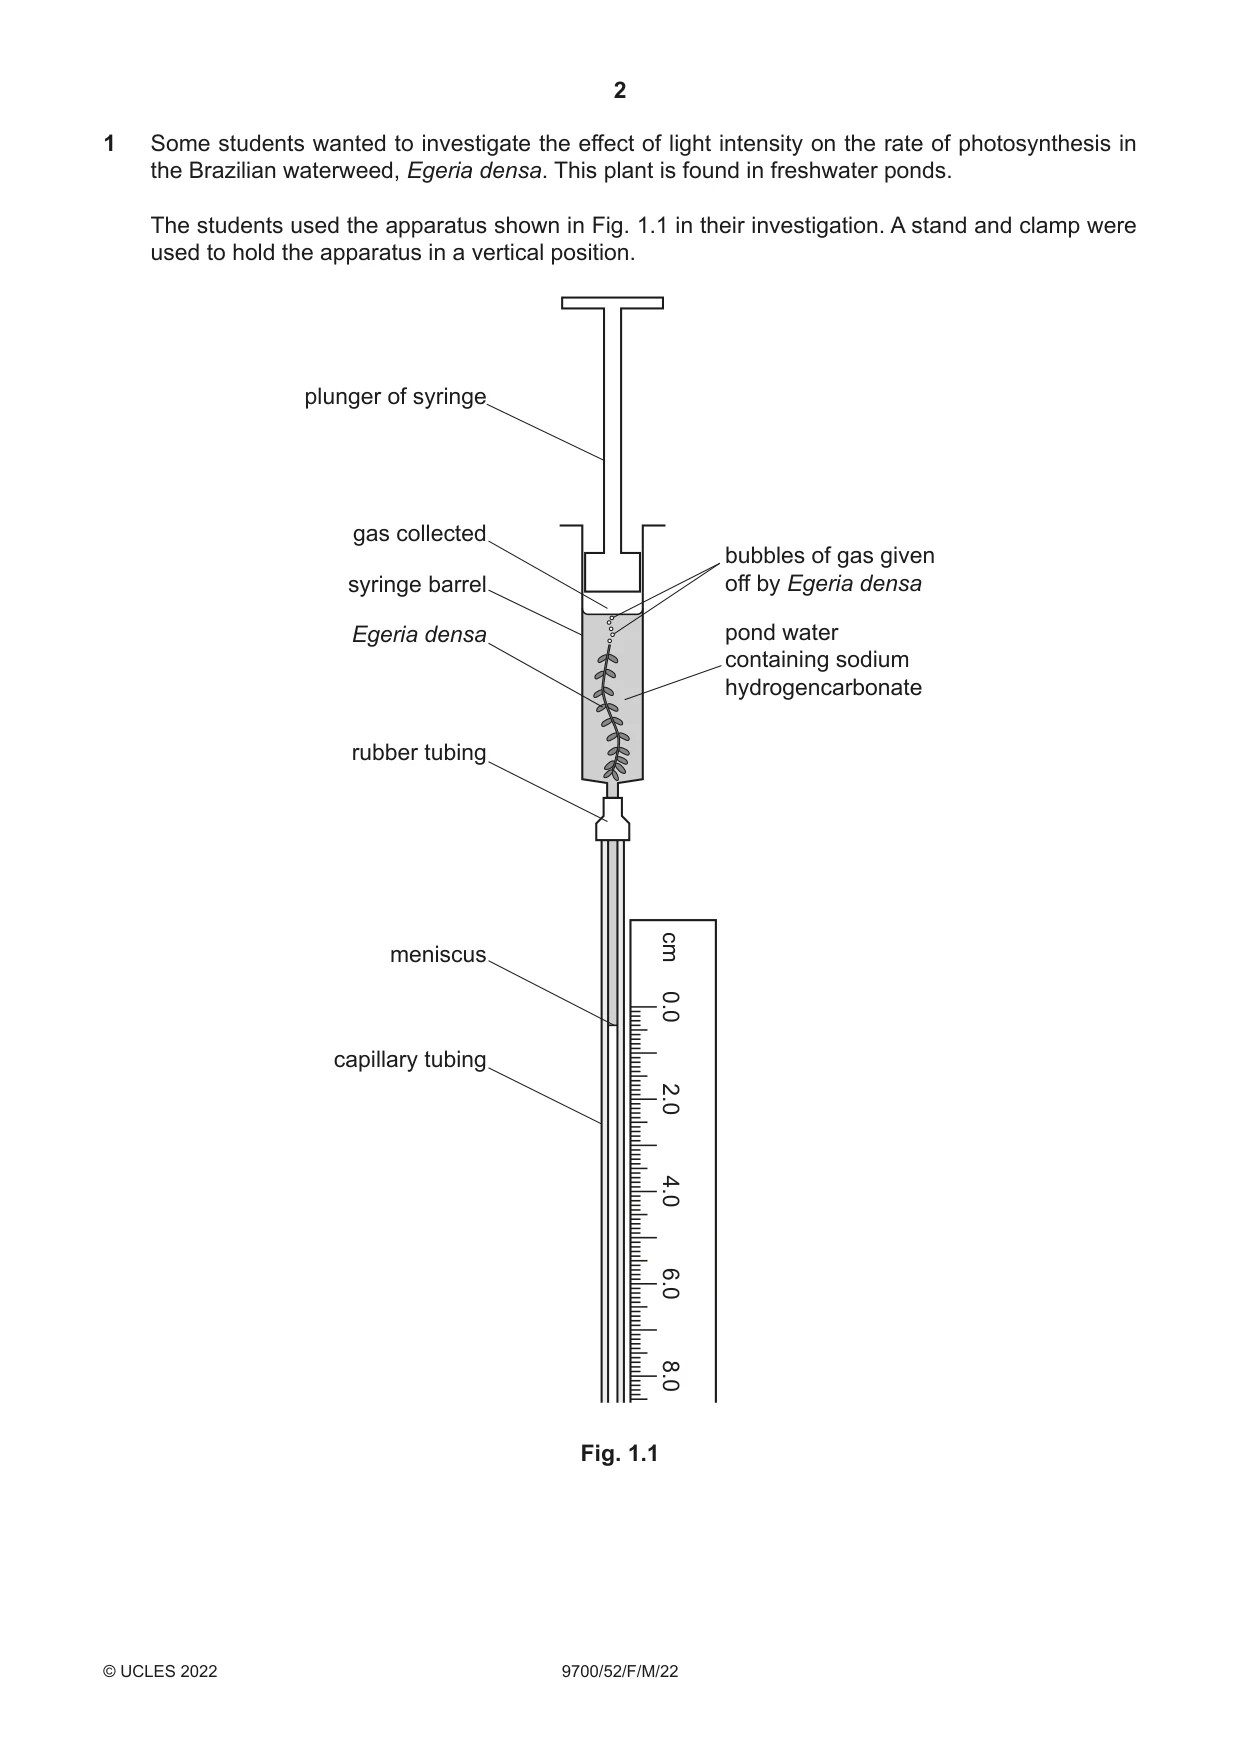
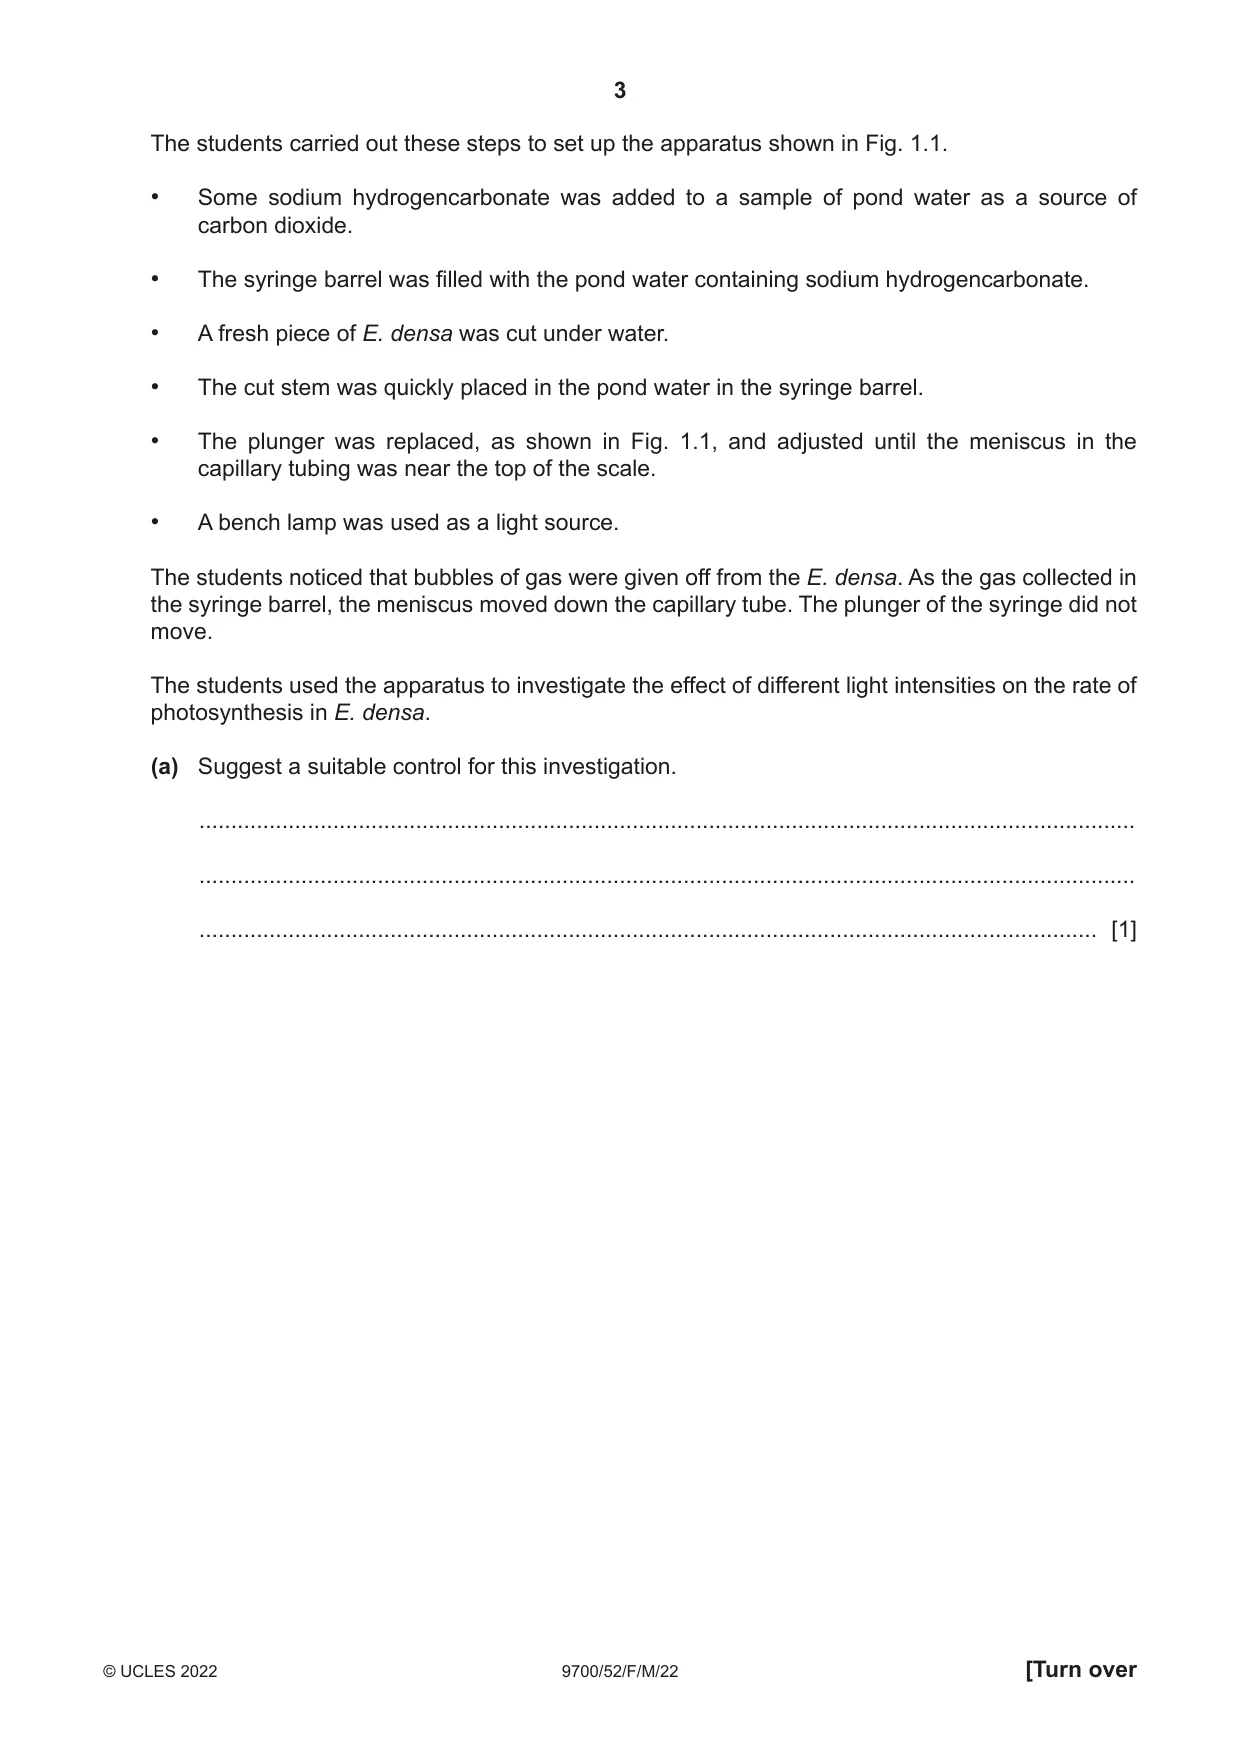
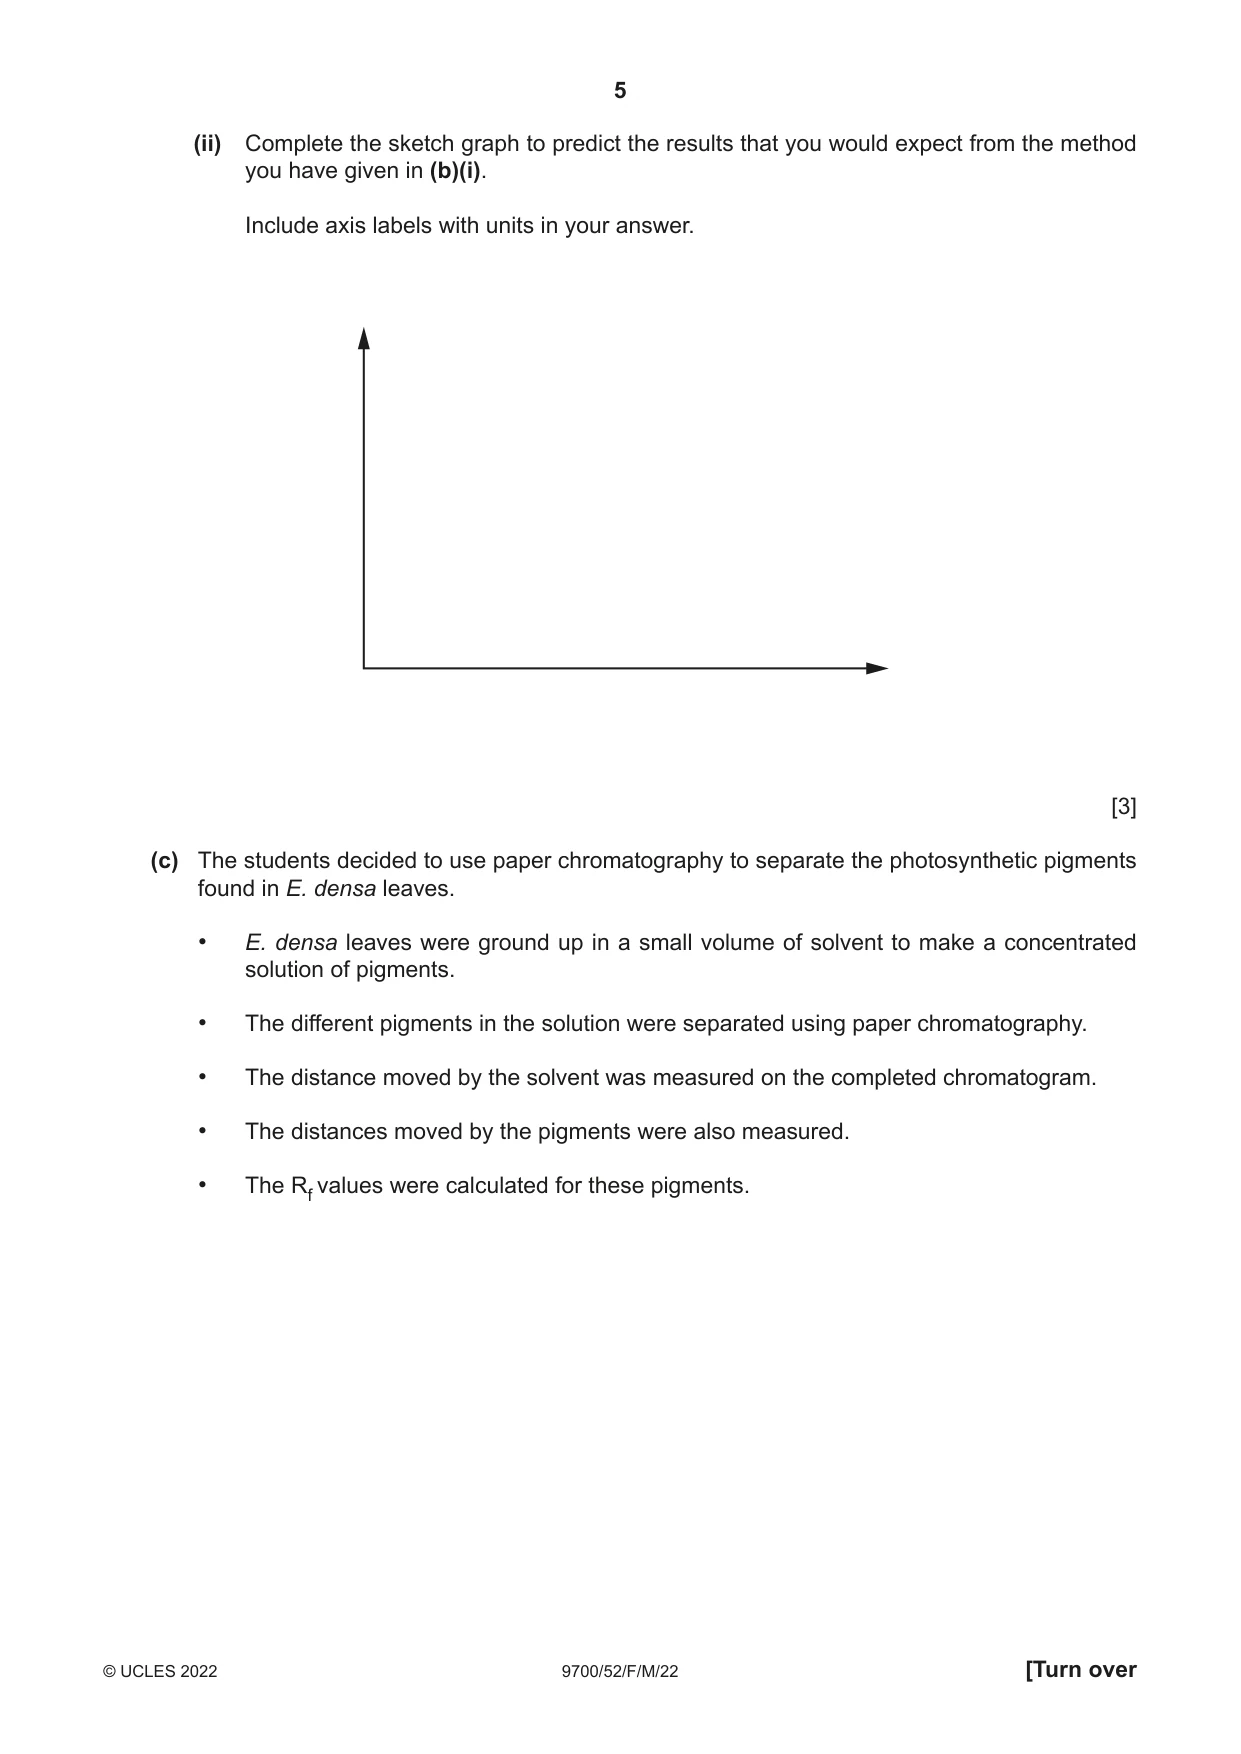
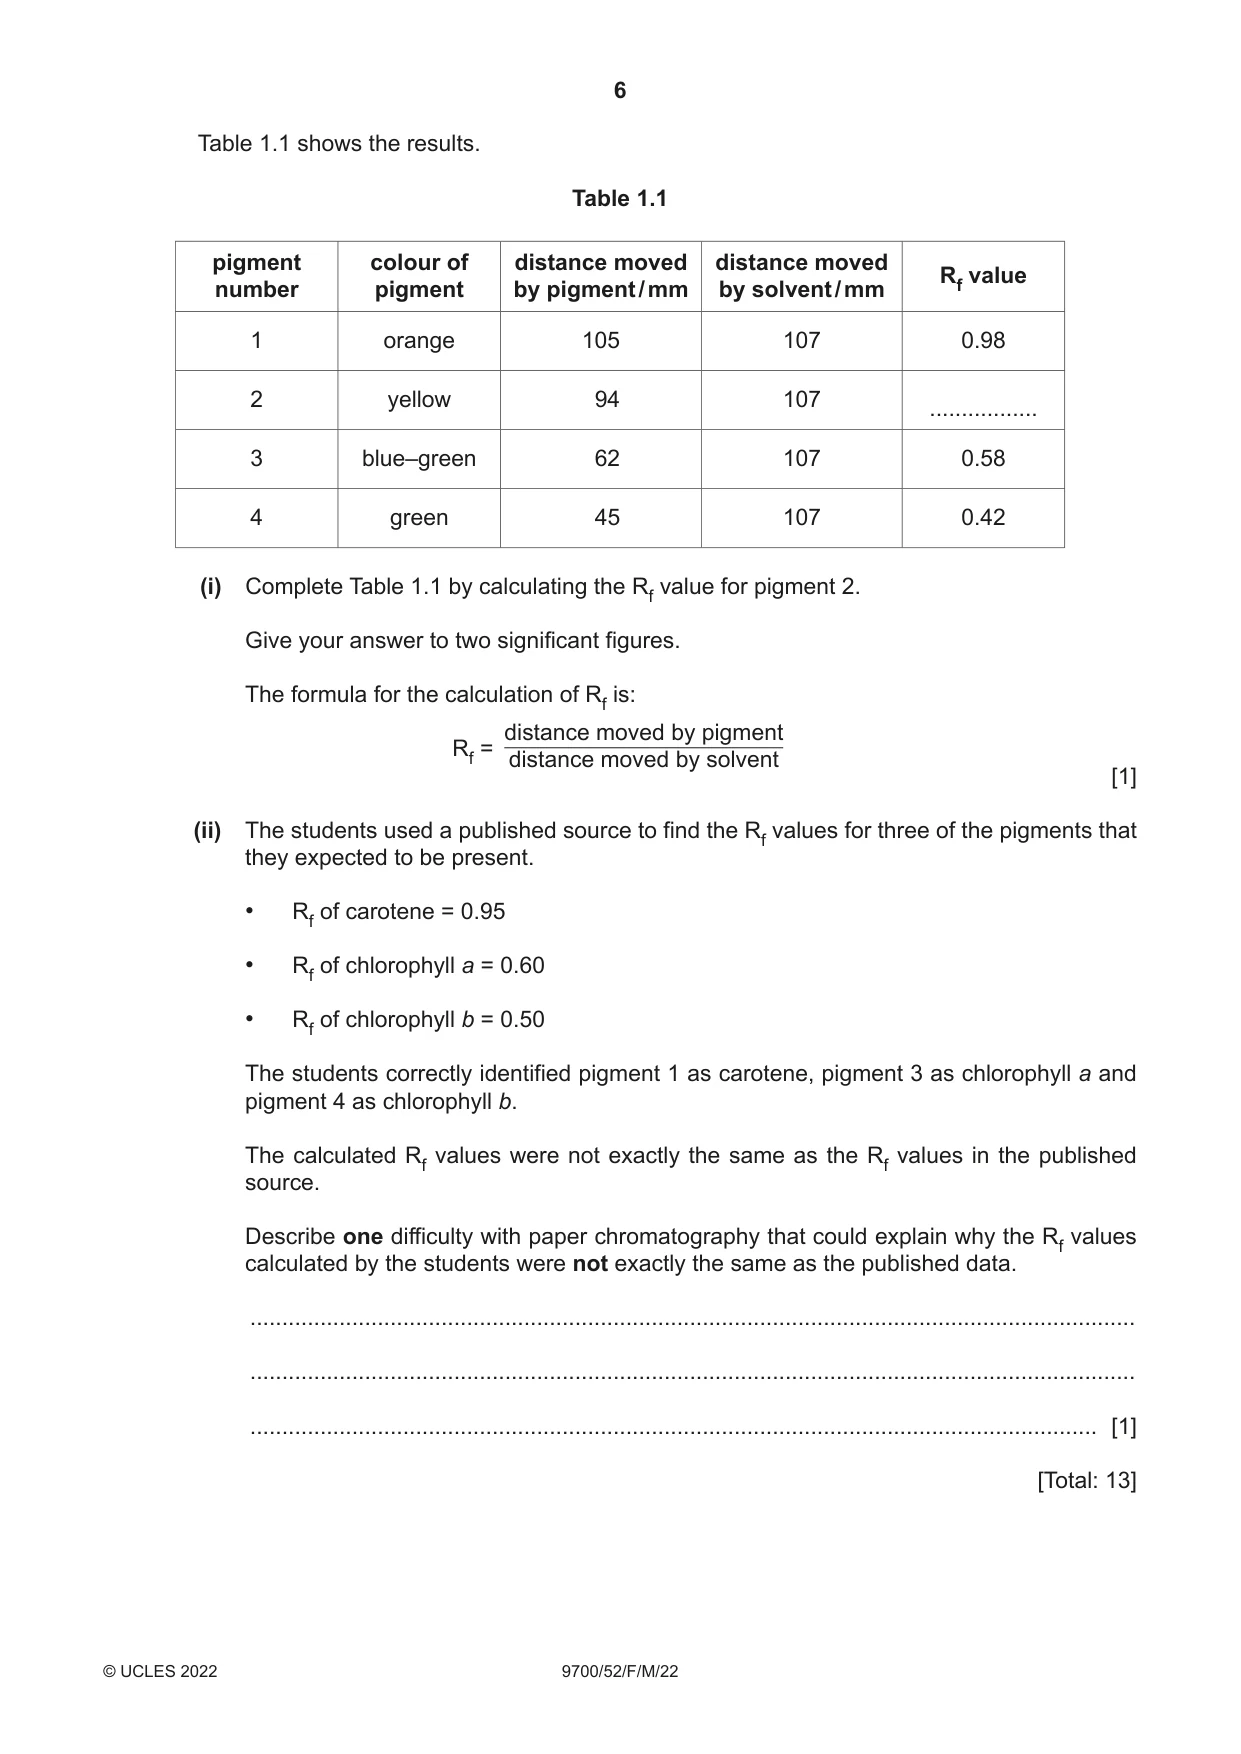
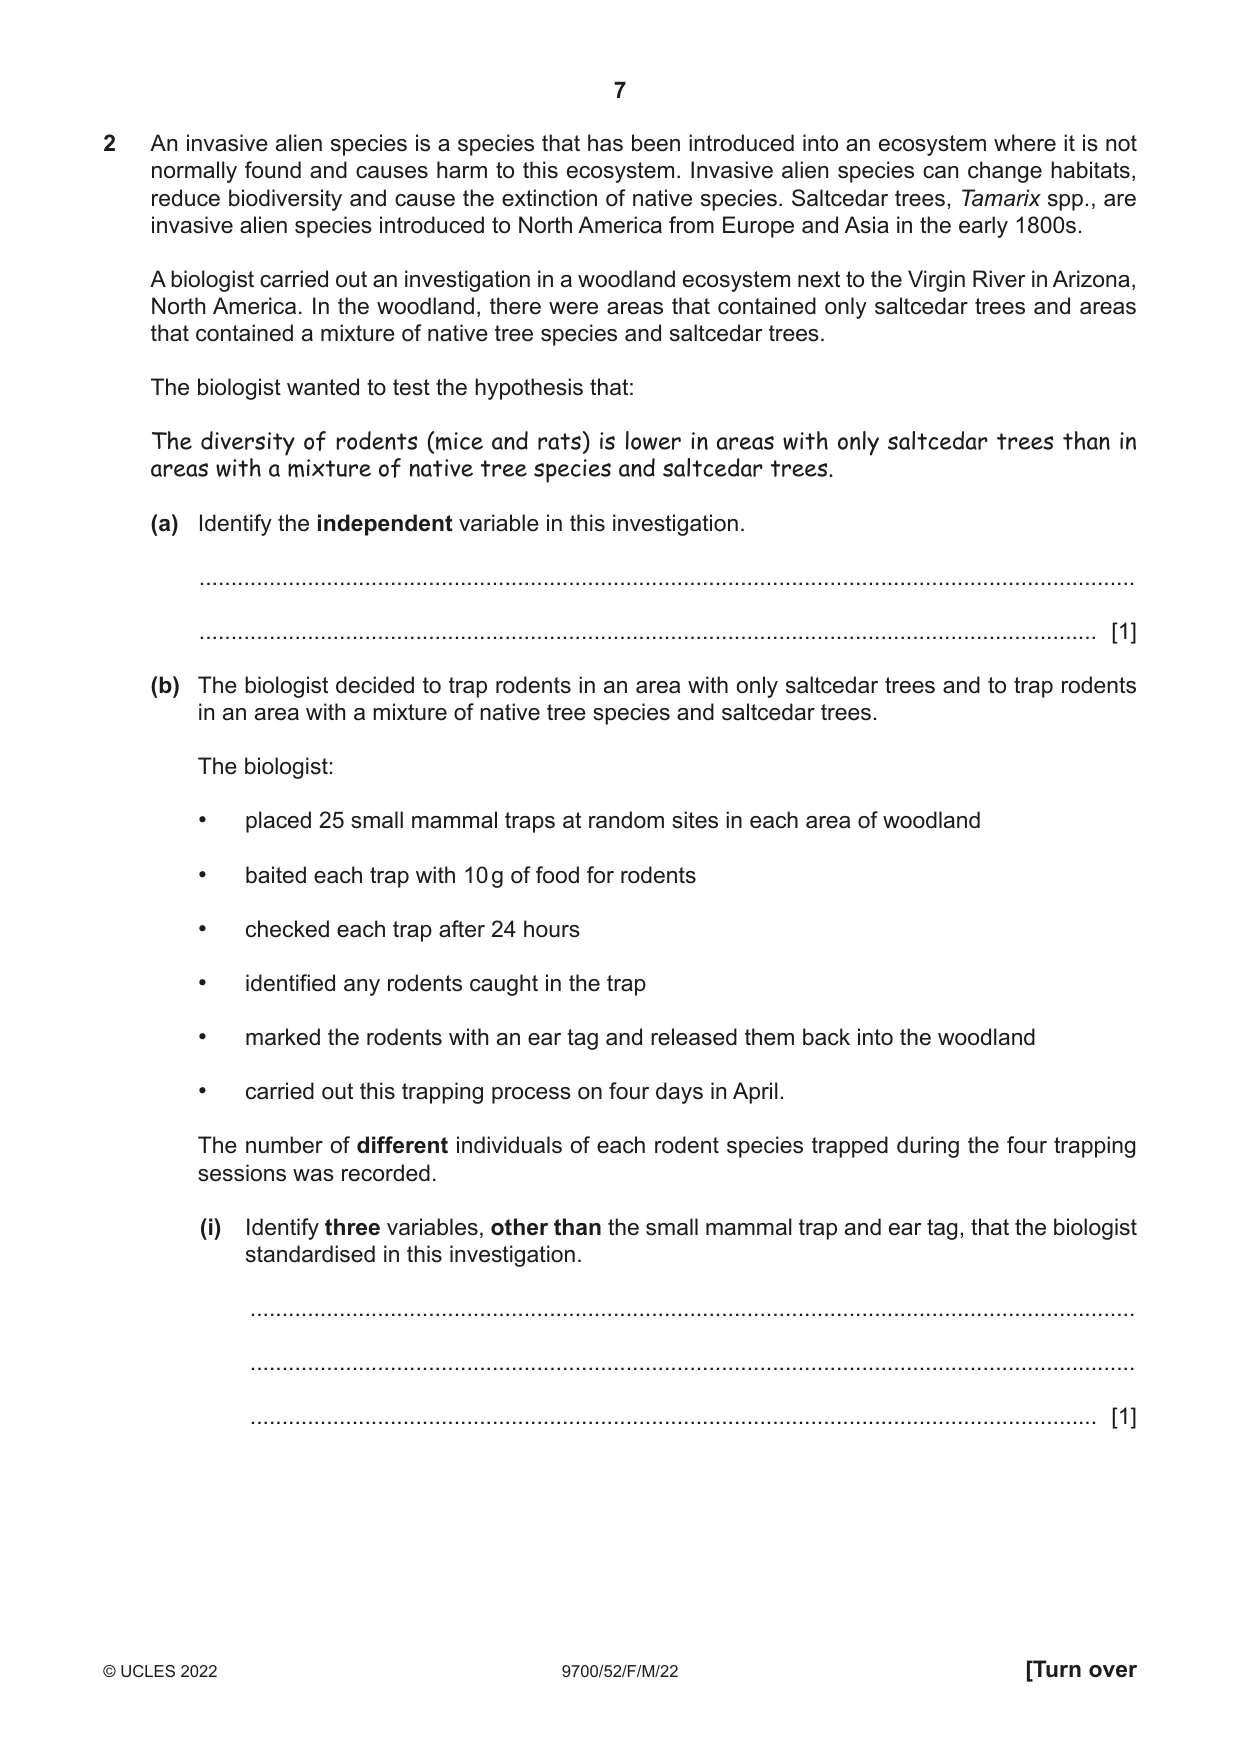
1 Some students wanted to investigate the effect of light intensity on the rate of photosynthesis in the Brazilian waterweed, Egeria densa. This plant is found in freshwater ponds. The students used the apparatus shown in Fig. 1.1 in their investigation. A stand and clamp were used to hold the apparatus in a vertical position. plunger of syringe gas collected bubbles of gas given syringe barrel off by Egeria densa Egeria densa pond water containing sodium hydrogencarbonate rubber tubing cm meniscus 0.0 capillary tubing 2.0 4.0 6.0 8.0 Fig. 1.1 The students carried out these steps to set up the apparatus shown in Fig. 1.1. • Some sodium hydrogencarbonate was added to a sample of pond water as a source of carbon dioxide. • The syringe barrel was filled with the pond water containing sodium hydrogencarbonate. • A fresh piece of E. densa was cut under water. • The cut stem was quickly placed in the pond water in the syringe barrel. • The plunger was replaced, as shown in Fig. 1.1, and adjusted until the meniscus in the capillary tubing was near the top of the scale. • A bench lamp was used as a light source. The students noticed that bubbles of gas were given off from the E. densa. As the gas collected in the syringe barrel, the meniscus moved down the capillary tube. The plunger of the syringe did not move. The students used the apparatus to investigate the effect of different light intensities on the rate of photosynthesis in E. densa. (a) Suggest a suitable control for this investigation. ................................................................................................................................................... ................................................................................................................................................... ............................................................................................................................................. [1] (b) (i) Describe a method, using the apparatus shown in Fig. 1.1, that the students could use to investigate the effect of light intensity on the rate of photosynthesis of E. densa. Your method should be set out in a logical order and be detailed enough to allow another person to follow it. The steps carried out to set up the apparatus shown in Fig. 1.1 should not be included. ........................................................................................................................................... ........................................................................................................................................... ........................................................................................................................................... ........................................................................................................................................... ........................................................................................................................................... ........................................................................................................................................... ........................................................................................................................................... ........................................................................................................................................... ........................................................................................................................................... ........................................................................................................................................... ........................................................................................................................................... ........................................................................................................................................... ........................................................................................................................................... ........................................................................................................................................... ........................................................................................................................................... ........................................................................................................................................... ........................................................................................................................................... ........................................................................................................................................... ........................................................................................................................................... ........................................................................................................................................... ........................................................................................................................................... ........................................................................................................................................... ........................................................................................................................................... ..................................................................................................................................... [7] (ii) Complete the sketch graph to predict the results that you would expect from the method you have given in (b)(i). Include axis labels with units in your answer. [3] (c) The students decided to use paper chromatography to separate the photosynthetic pigments found in E. densa leaves. • E. densa leaves were ground up in a small volume of solvent to make a concentrated solution of pigments. • The different pigments in the solution were separated using paper chromatography. • The distance moved by the solvent was measured on the completed chromatogram. • The distances moved by the pigments were also measured. • The Rf values were calculated for these pigments. Table 1.1 shows the results. Table 1.1 pigment colour of distance moved distance moved Rf value number pigment by pigment / mm by solvent / mm 1 orange 105 107 0.98 2 yellow 94 107 ................. 3 blue–green 62 107 0.58 4 green 45 107 0.42 (i) Complete Table 1.1 by calculating the Rf value for pigment 2. Give your answer to two significant figures. The formula for the calculation of Rf is: distance moved by pigment Rf = distance moved by solvent [1] (ii) The students used a published source to find the Rf values for three of the pigments that they expected to be present. • Rf of carotene = 0.95 • Rf of chlorophyll a = 0.60 • Rf of chlorophyll b = 0.50 The students correctly identified pigment 1 as carotene, pigment 3 as chlorophyll a and pigment 4 as chlorophyll b. The calculated Rf values were not exactly the same as the Rf values in the published source. Describe one difficulty with paper chromatography that could explain why the Rf values calculated by the students were not exactly the same as the published data. ........................................................................................................................................... ........................................................................................................................................... ..................................................................................................................................... [1] [Total: 13]
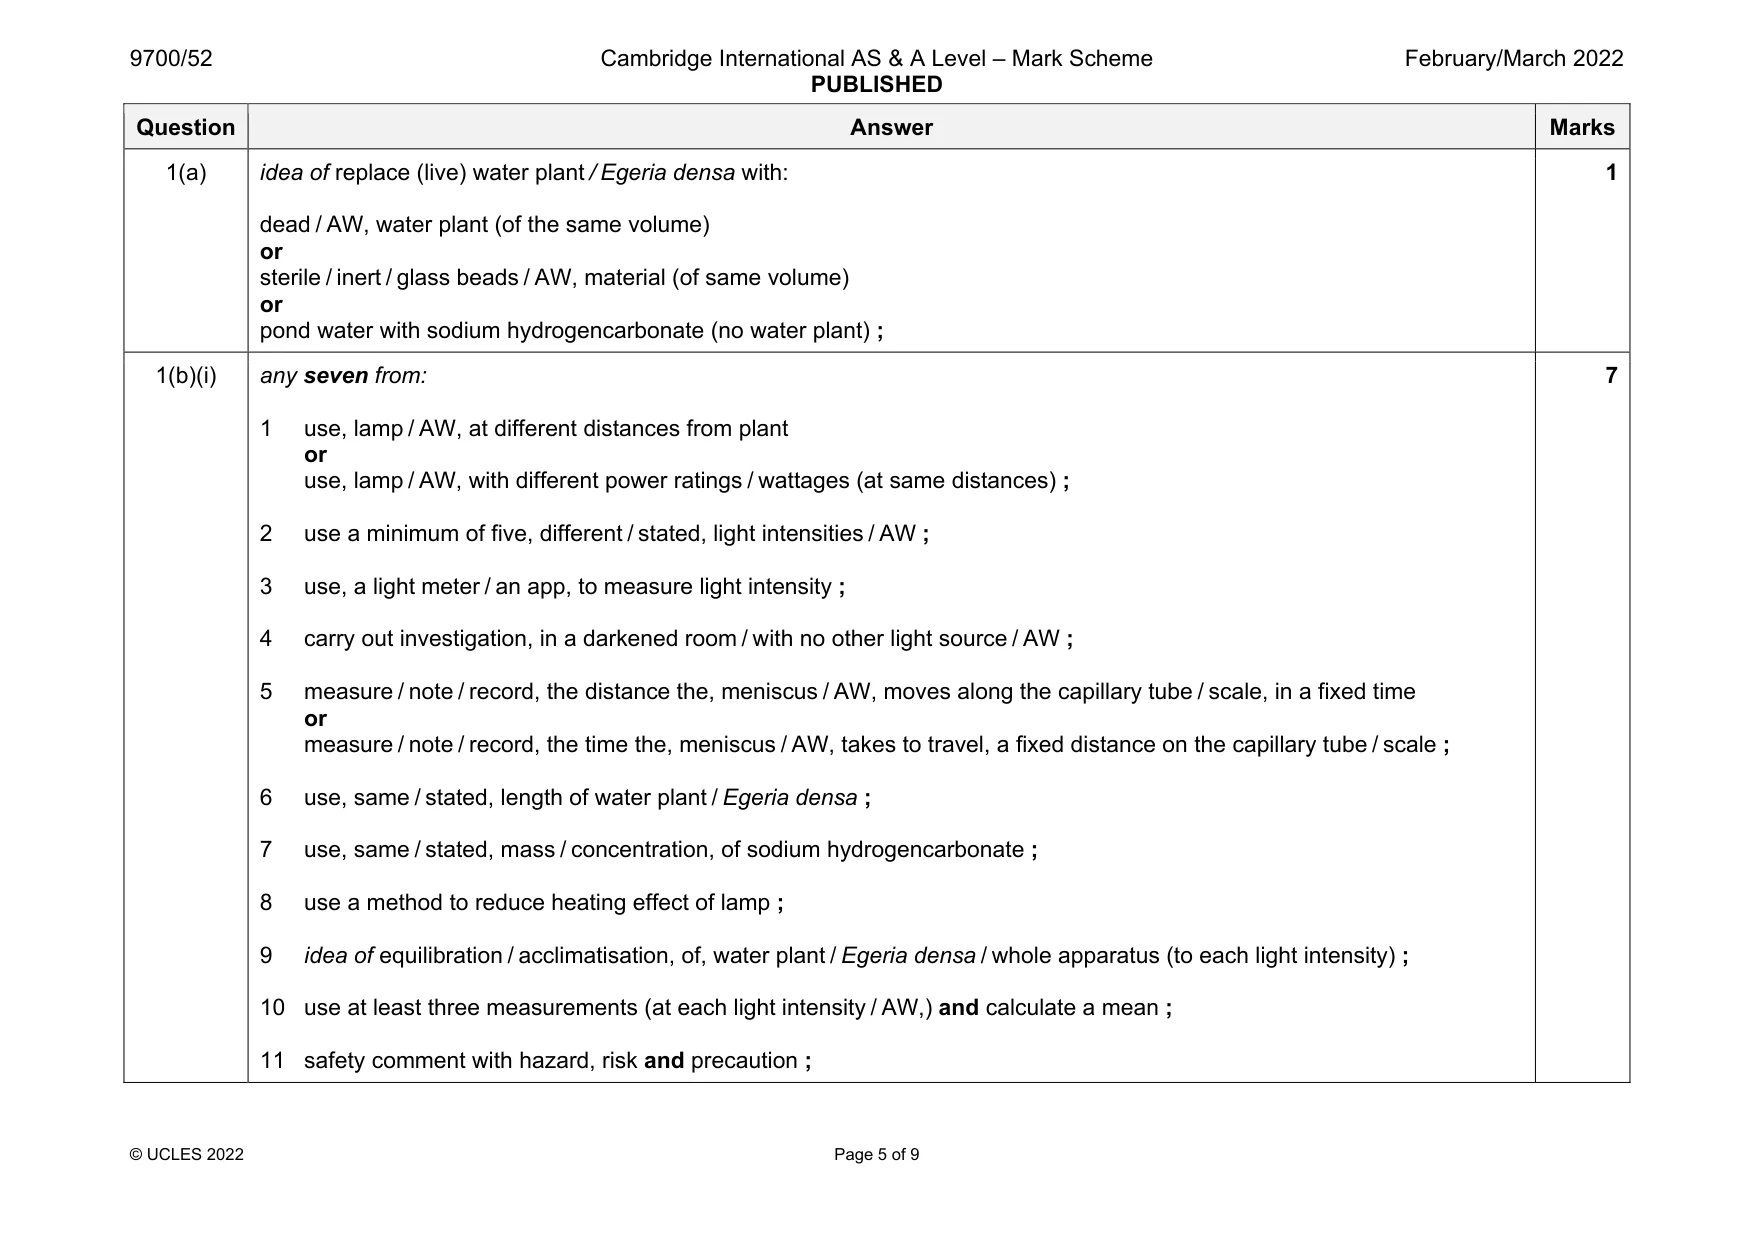
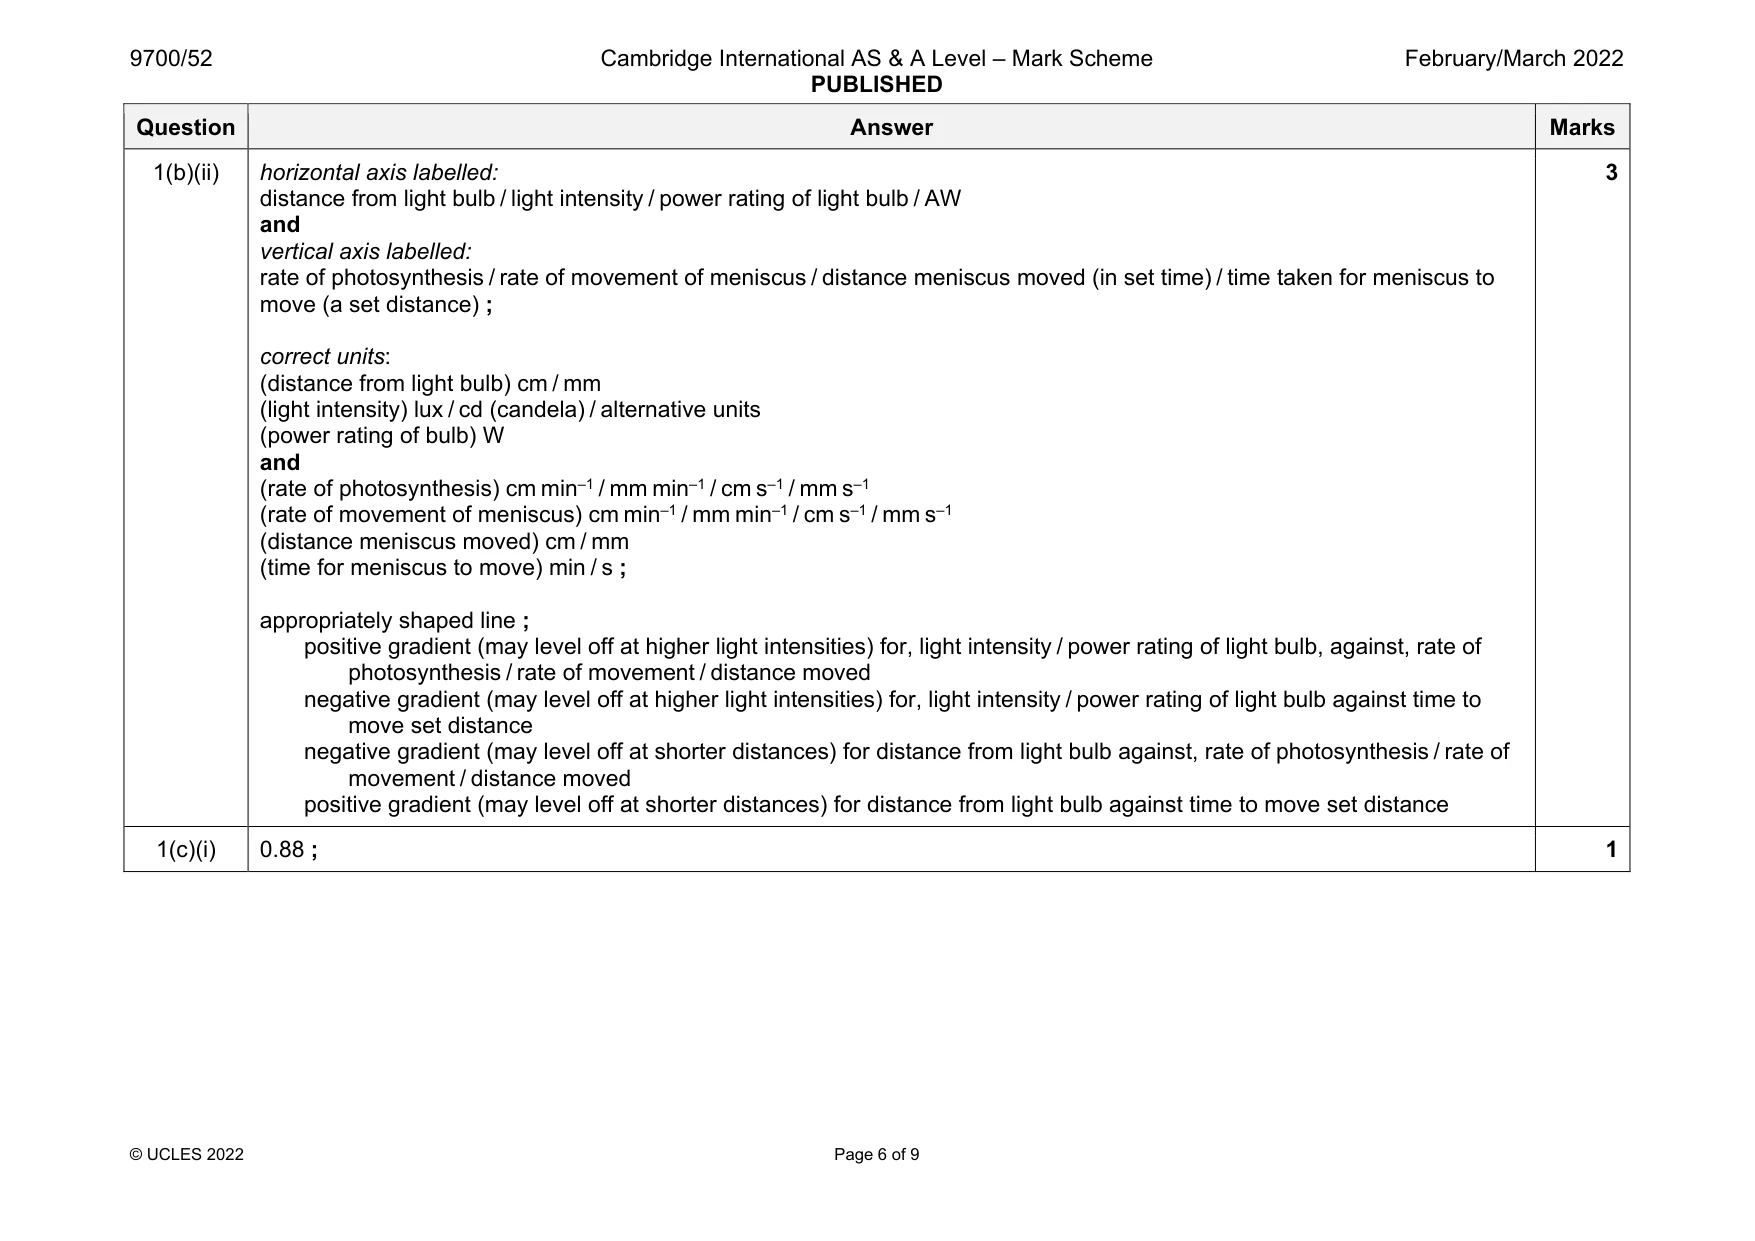
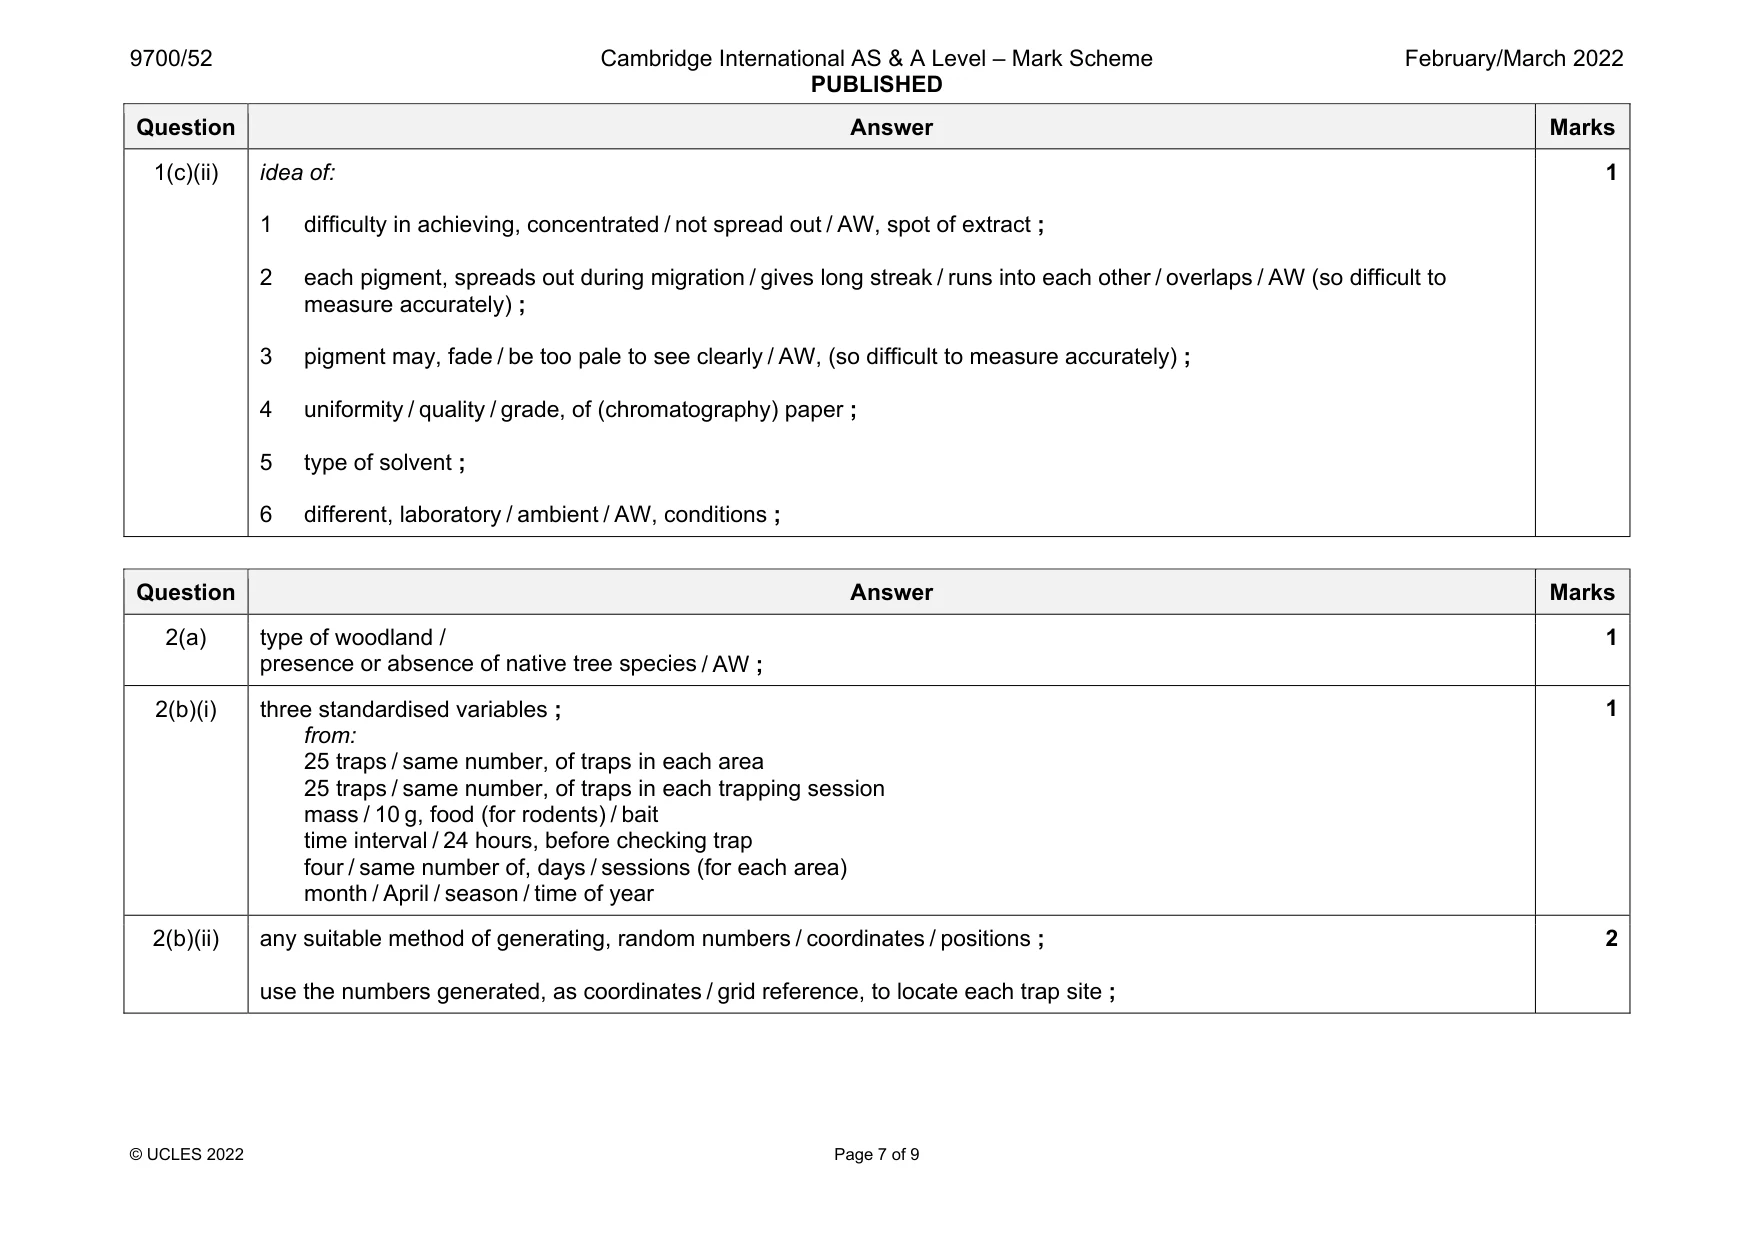
Mark scheme: 1(a) idea of replace (live) water plant / Egeria densa with: dead / AW, water plant (of the same volume) or sterile / inert / glass beads / AW, material (of same volume) or pond water with sodium hydrogencarbonate (no water plant) ; 1(b)(i) any seven from: 1 use, lamp / AW, at different distances from plant or use, lamp / AW, with different power ratings / wattages (at same distances) ; 2 use a minimum of five, different / stated, light intensities / AW ; 3 use, a light meter / an app, to measure light intensity ; 4 carry out investigation, in a darkened room / with no other light source / AW ; 5 measure / note / record, the distance the, meniscus / AW, moves along the capillary tube / scale, in a fixed time or measure / note / record, the time the, meniscus / AW, takes to travel, a fixed distance on the capillary tube / scale ; 6 use, same / stated, length of water plant / Egeria densa ; 7 use, same / stated, mass / concentration, of sodium hydrogencarbonate ; 8 use a method to reduce heating effect of lamp ; 9 idea of equilibration / acclimatisation, of, water plant / Egeria densa / whole apparatus (to each light intensity) ; 10 use at least three measurements (at each light intensity / AW,) and calculate a mean ; 11 safety comment with hazard, risk and precaution ; 7 Question Answer Marks 1(b)(ii) horizontal axis labelled: distance from light bulb / light intensity / power rating of light bulb / AW and vertical axis labelled: rate of photosynthesis / rate of movement of meniscus / distance meniscus moved (in set time) / time taken for meniscus to move (a set distance) ; correct units: (distance from light bulb) cm / mm (light intensity) lux / cd (candela) / alternative units (power rating of bulb) W and (rate of photosynthesis) cm min–1 / mm min–1 / cm s–1 / mm s–1 (rate of movement of meniscus) cm min–1 / mm min–1 / cm s–1 / mm s–1 (distance meniscus moved) cm / mm (time for meniscus to move) min / s ; appropriately shaped line ; positive gradient (may level off at higher light intensities) for, light intensity / power rating of light bulb, against, rate of photosynthesis / rate of movement / distance moved negative gradient (may level off at higher light intensities) for, light intensity / power rating of light bulb against time to move set distance negative gradient (may level off at shorter distances) for distance from light bulb against, rate of photosynthesis / rate of movement / distance moved positive gradient (may level off at shorter distances) for distance from light bulb against time to move set distance 3 1(c)(i) 0.88 ; 1 Question Answer Marks 1(c)(ii) idea of: 1 difficulty in achieving, concentrated / not spread out / AW, spot of extract ; 2 each pigment, spreads out during migration / gives long streak / runs into each other / overlaps / AW (so difficult to measure accurately) ; 3 pigment may, fade / be too pale to see clearly / AW, (so difficult to measure accurately) ; 4 uniformity / quality / grade, of (chromatography) paper ; 5 type of solvent ; 6 different, laboratory / ambient / AW, conditions ; 1
Q2 · An invasive alien species is a species that has been introduced into an ecosystem where…
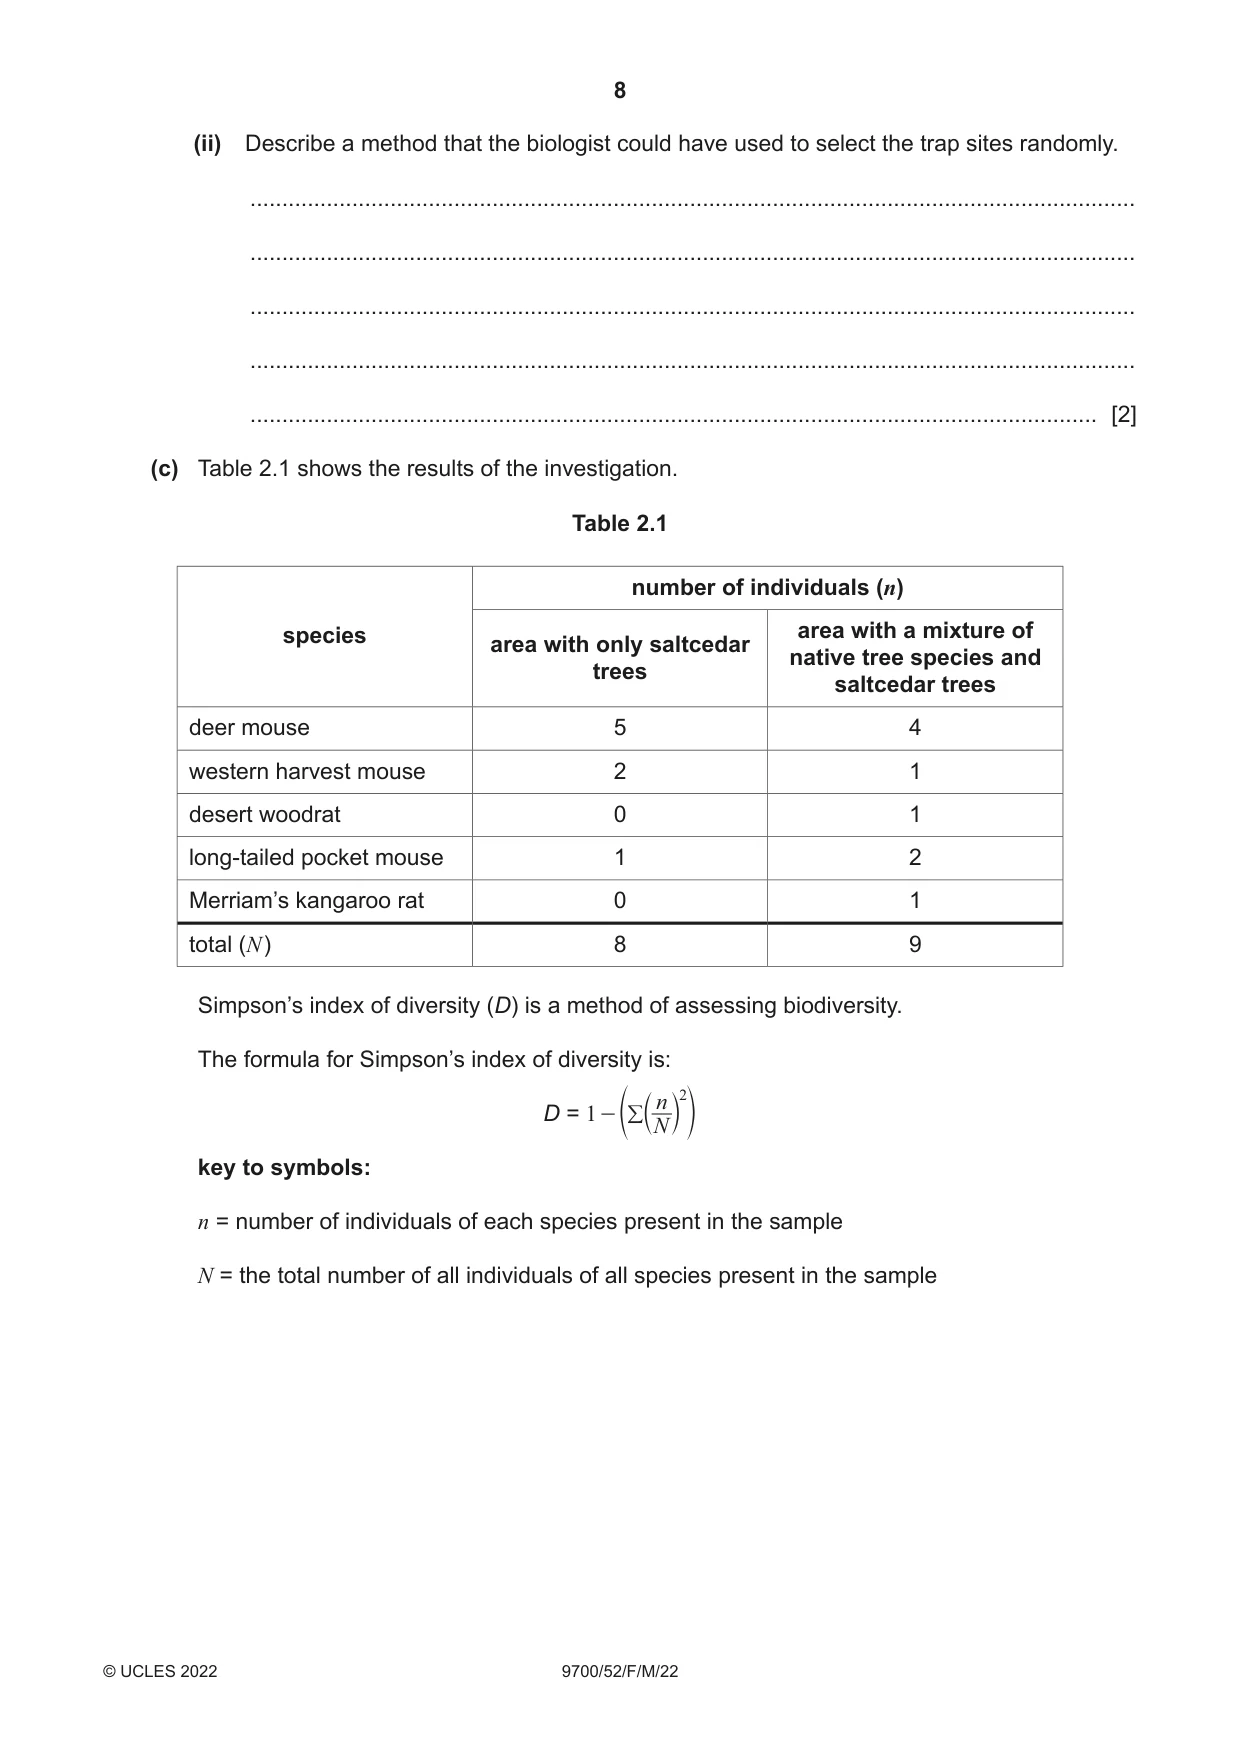
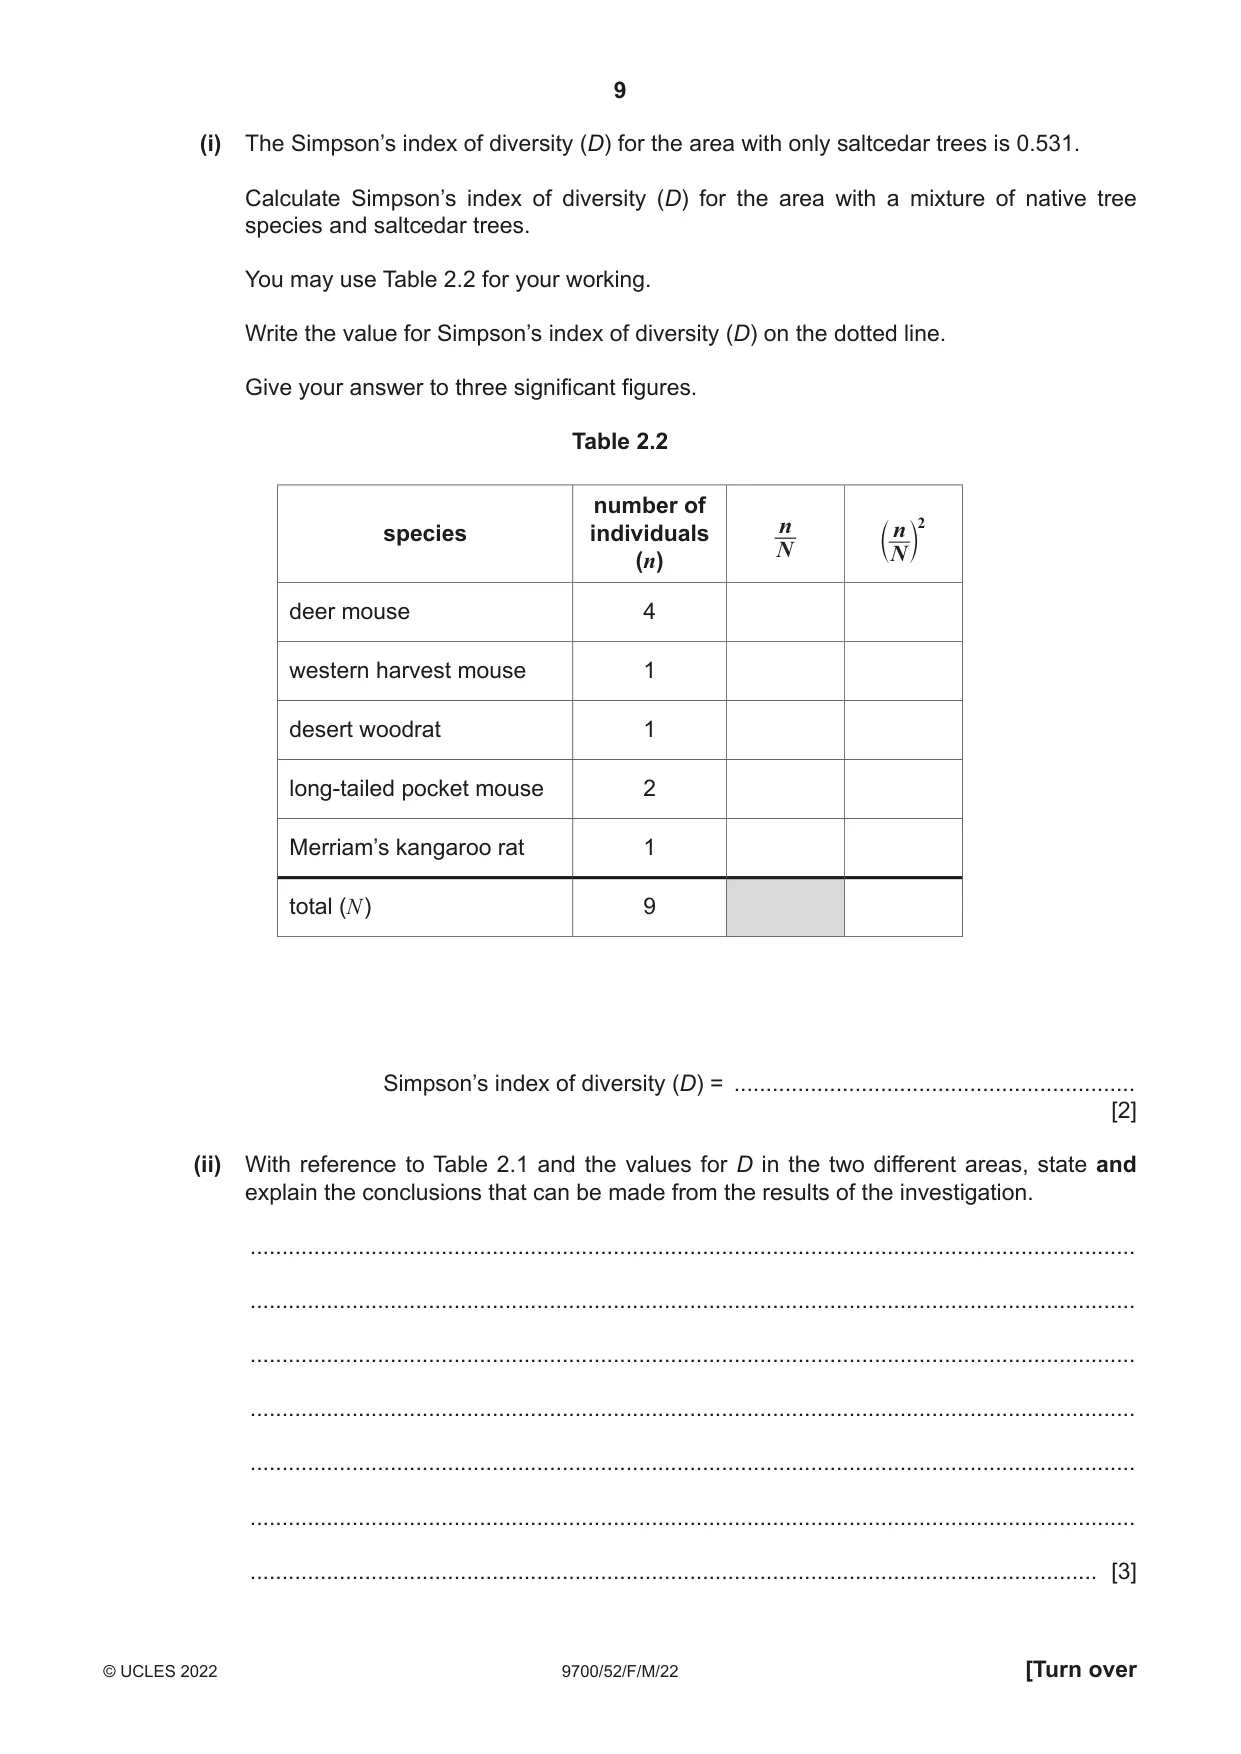
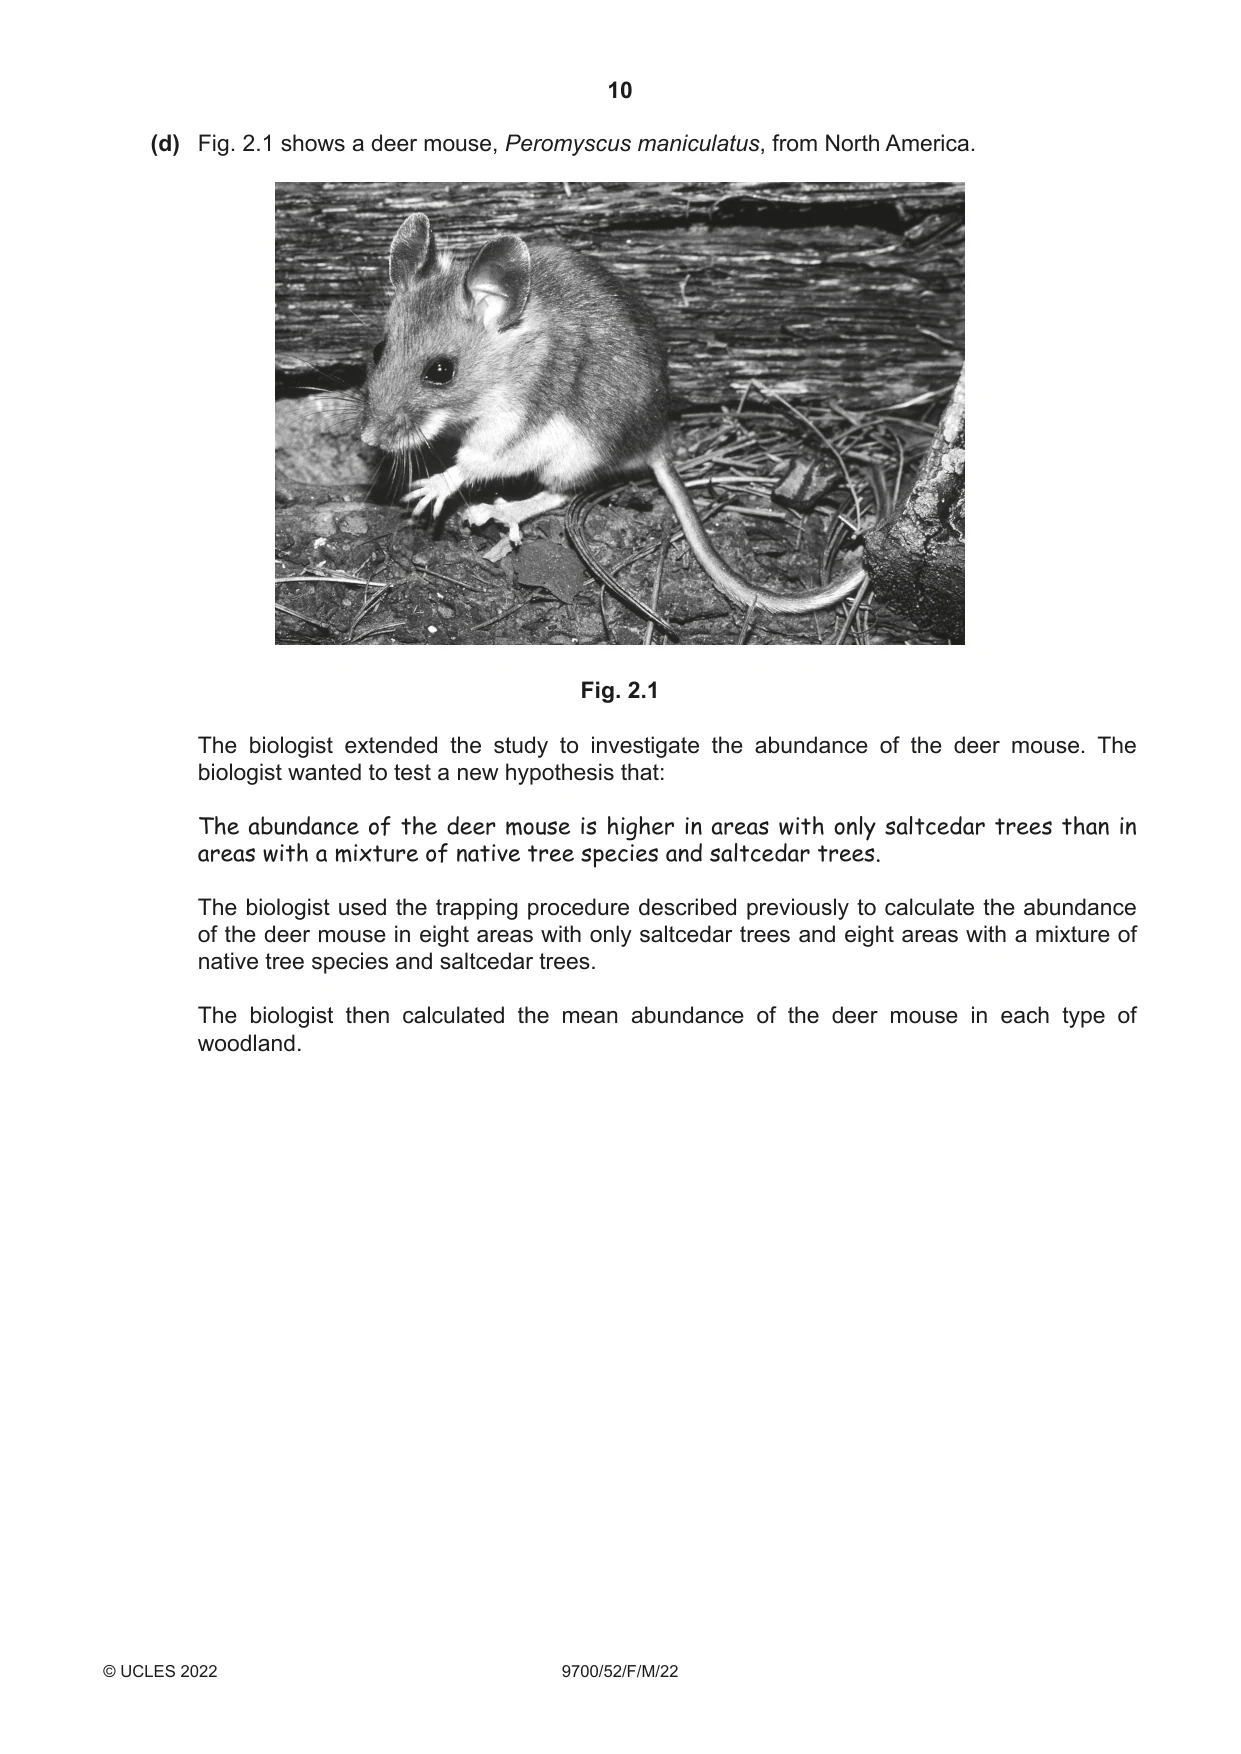
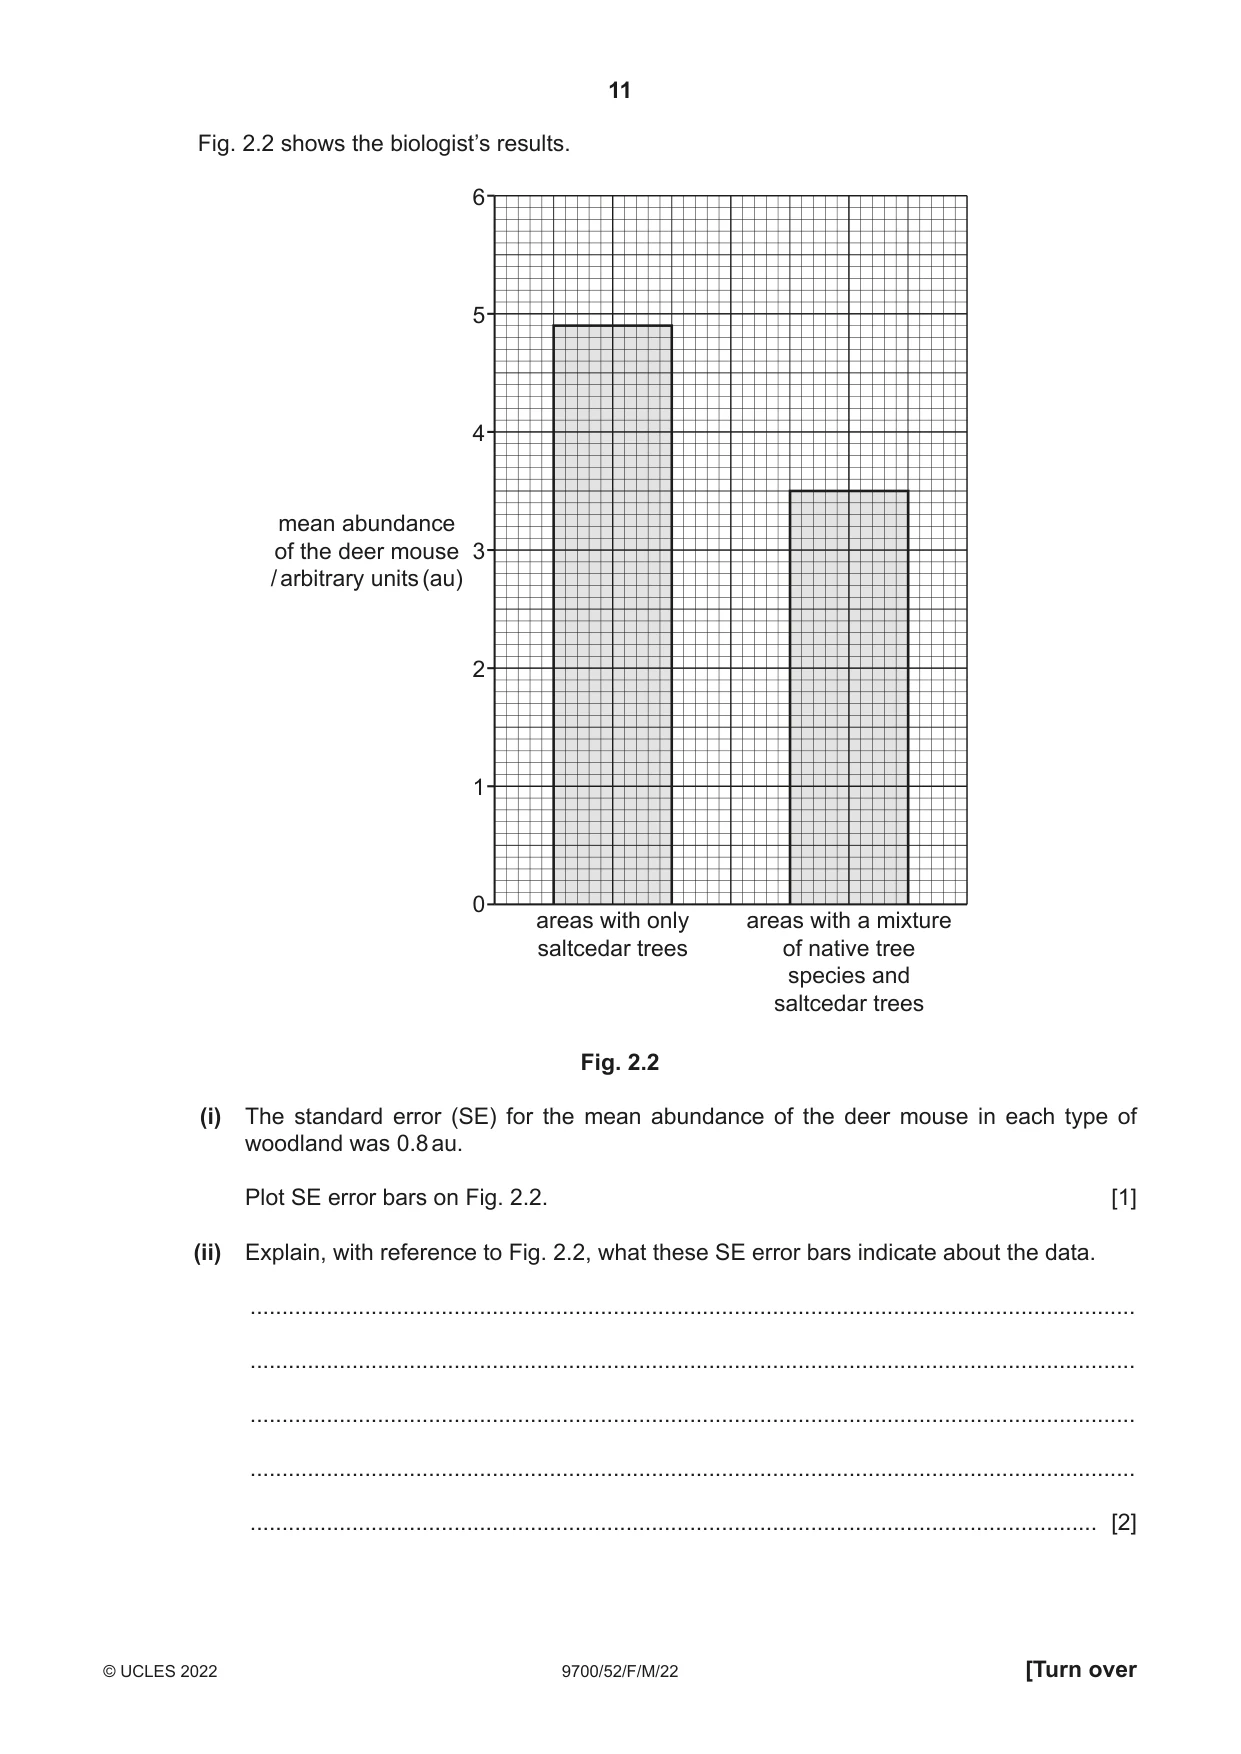
2 An invasive alien species is a species that has been introduced into an ecosystem where it is not normally found and causes harm to this ecosystem. Invasive alien species can change habitats, reduce biodiversity and cause the extinction of native species. Saltcedar trees, Tamarix spp., are invasive alien species introduced to North America from Europe and Asia in the early 1800s. A biologist carried out an investigation in a woodland ecosystem next to the Virgin River in Arizona, North America. In the woodland, there were areas that contained only saltcedar trees and areas that contained a mixture of native tree species and saltcedar trees. The biologist wanted to test the hypothesis that: The diversity of rodents (mice and rats) is lower in areas with only saltcedar trees than in areas with a mixture of native tree species and saltcedar trees. (a) Identify the independent variable in this investigation. ................................................................................................................................................... ............................................................................................................................................. [1] (b) The biologist decided to trap rodents in an area with only saltcedar trees and to trap rodents in an area with a mixture of native tree species and saltcedar trees. The biologist: • placed 25 small mammal traps at random sites in each area of woodland • baited each trap with 10 g of food for rodents • checked each trap after 24 hours • identified any rodents caught in the trap • marked the rodents with an ear tag and released them back into the woodland • carried out this trapping process on four days in April. The number of different individuals of each rodent species trapped during the four trapping sessions was recorded. (i) Identify three variables, other than the small mammal trap and ear tag, that the biologist standardised in this investigation. ........................................................................................................................................... ........................................................................................................................................... ..................................................................................................................................... [1] (ii) Describe a method that the biologist could have used to select the trap sites randomly. ........................................................................................................................................... ........................................................................................................................................... ........................................................................................................................................... ........................................................................................................................................... ..................................................................................................................................... [2] (c) Table 2.1 shows the results of the investigation. Table 2.1 number of individuals (n) species area with a mixture of area with only saltcedar native tree species and trees saltcedar trees deer mouse 5 4 western harvest mouse 2 1 desert woodrat 0 1 long-tailed pocket mouse 1 2 Merriam’s kangaroo rat 0 1 total (N ) 8 9 Simpson’s index of diversity (D) is a method of assessing biodiversity. The formula for Simpson’s index of diversity is: n 2 D = 1 / -e b N l o key to symbols: n = number of individuals of each species present in the sample N = the total number of all individuals of all species present in the sample (i) The Simpson’s index of diversity (D) for the area with only saltcedar trees is 0.531. Calculate Simpson’s index of diversity (D) for the area with a mixture of native tree species and saltcedar trees. You may use Table 2.2 for your working. Write the value for Simpson’s index of diversity (D) on the dotted line. Give your answer to three significant figures. Table 2.2 number of n n 2 species individuals N b N l (n) deer mouse 4 western harvest mouse 1 desert woodrat 1 long-tailed pocket mouse 2 Merriam’s kangaroo rat 1 total (N ) 9 Simpson’s index of diversity (D) = ............................................................... [2] (ii) With reference to Table 2.1 and the values for D in the two different areas, state and explain the conclusions that can be made from the results of the investigation. ........................................................................................................................................... ........................................................................................................................................... ........................................................................................................................................... ........................................................................................................................................... ........................................................................................................................................... ........................................................................................................................................... ..................................................................................................................................... [3] (d) Fig. 2.1 shows a deer mouse, Peromyscus maniculatus, from North America. Fig. 2.1 The biologist extended the study to investigate the abundance of the deer mouse. The biologist wanted to test a new hypothesis that: The abundance of the deer mouse is higher in areas with only saltcedar trees than in areas with a mixture of native tree species and saltcedar trees. The biologist used the trapping procedure described previously to calculate the abundance of the deer mouse in eight areas with only saltcedar trees and eight areas with a mixture of native tree species and saltcedar trees. The biologist then calculated the mean abundance of the deer mouse in each type of woodland. Fig. 2.2 shows the biologist’s results. 6 5 4 mean abundance of the deer mouse 3 / arbitrary units (au) 2 1 0 areas with only areas with a mixture saltcedar trees of native tree species and saltcedar trees Fig. 2.2 (i) The standard error (SE) for the mean abundance of the deer mouse in each type of woodland was 0.8 au. Plot SE error bars on Fig. 2.2. [1] (ii) Explain, with reference to Fig. 2.2, what these SE error bars indicate about the data. ........................................................................................................................................... ........................................................................................................................................... ........................................................................................................................................... ........................................................................................................................................... ..................................................................................................................................... [2] (iii) The biologist then analysed these data using a t-test to compare the abundance of the deer mouse in the two types of woodland. State a null hypothesis for the t-test. ........................................................................................................................................... ........................................................................................................................................... ..................................................................................................................................... [1] [Total: 13]
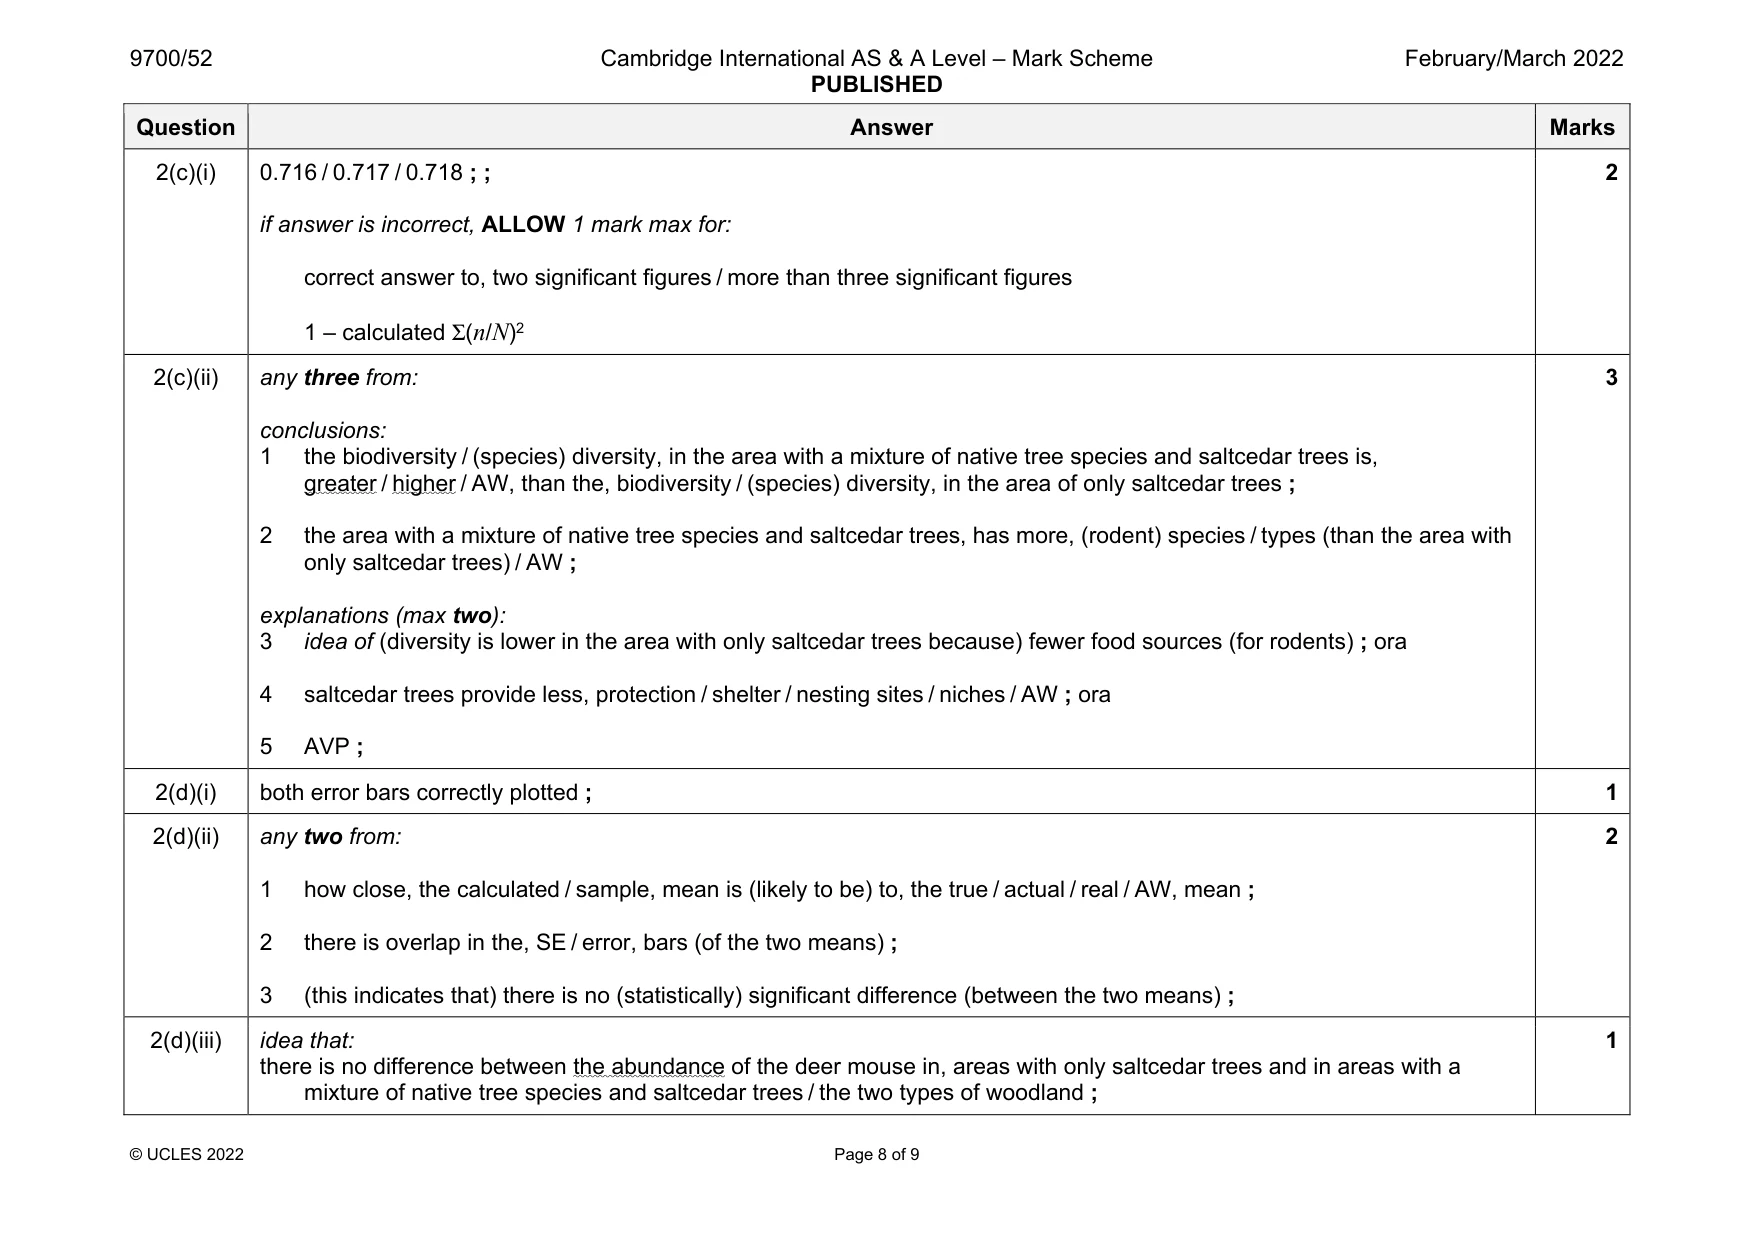
Mark scheme: 2(a) type of woodland / presence or absence of native tree species / AW ; 1 2(b)(i) three standardised variables ; from: 25 traps / same number, of traps in each area 25 traps / same number, of traps in each trapping session mass / 10 g, food (for rodents) / bait time interval / 24 hours, before checking trap four / same number of, days / sessions (for each area) month / April / season / time of year 1 2(b)(ii) any suitable method of generating, random numbers / coordinates / positions ; use the numbers generated, as coordinates / grid reference, to locate each trap site ; 2 Question Answer Marks 2(c)(i) 0.716 / 0.717 / 0.718 ; ; if answer is incorrect, ALLOW 1 mark max for: correct answer to, two significant figures / more than three significant figures 1 – calculated Σ(n/N)2 2 2(c)(ii) any three from: conclusions: 1 the biodiversity / (species) diversity, in the area with a mixture of native tree species and saltcedar trees is, greater / higher / AW, than the, biodiversity / (species) diversity, in the area of only saltcedar trees ; 2 the area with a mixture of native tree species and saltcedar trees, has more, (rodent) species / types (than the area with only saltcedar trees) / AW ; explanations (max two): 3 idea of (diversity is lower in the area with only saltcedar trees because) fewer food sources (for rodents) ; ora 4 saltcedar trees provide less, protection / shelter / nesting sites / niches / AW ; ora 5 AVP ; 3 2(d)(i) both error bars correctly plotted ; 1 2(d)(ii) any two from: 1 how close, the calculated / sample, mean is (likely to be) to, the true / actual / real / AW, mean ; 2 there is overlap in the, SE / error, bars (of the two means) ; 3 (this indicates that) there is no (statistically) significant difference (between the two means) ; 2 2(d)(iii) idea that: there is no difference between the abundance of the deer mouse in, areas with only saltcedar trees and in areas with a mixture of native tree species and saltcedar trees / the two types of woodland ; 1
Q3 · Mussels, Mytilus edulis, are molluscs that live in sea water on the shorelines of coastal…
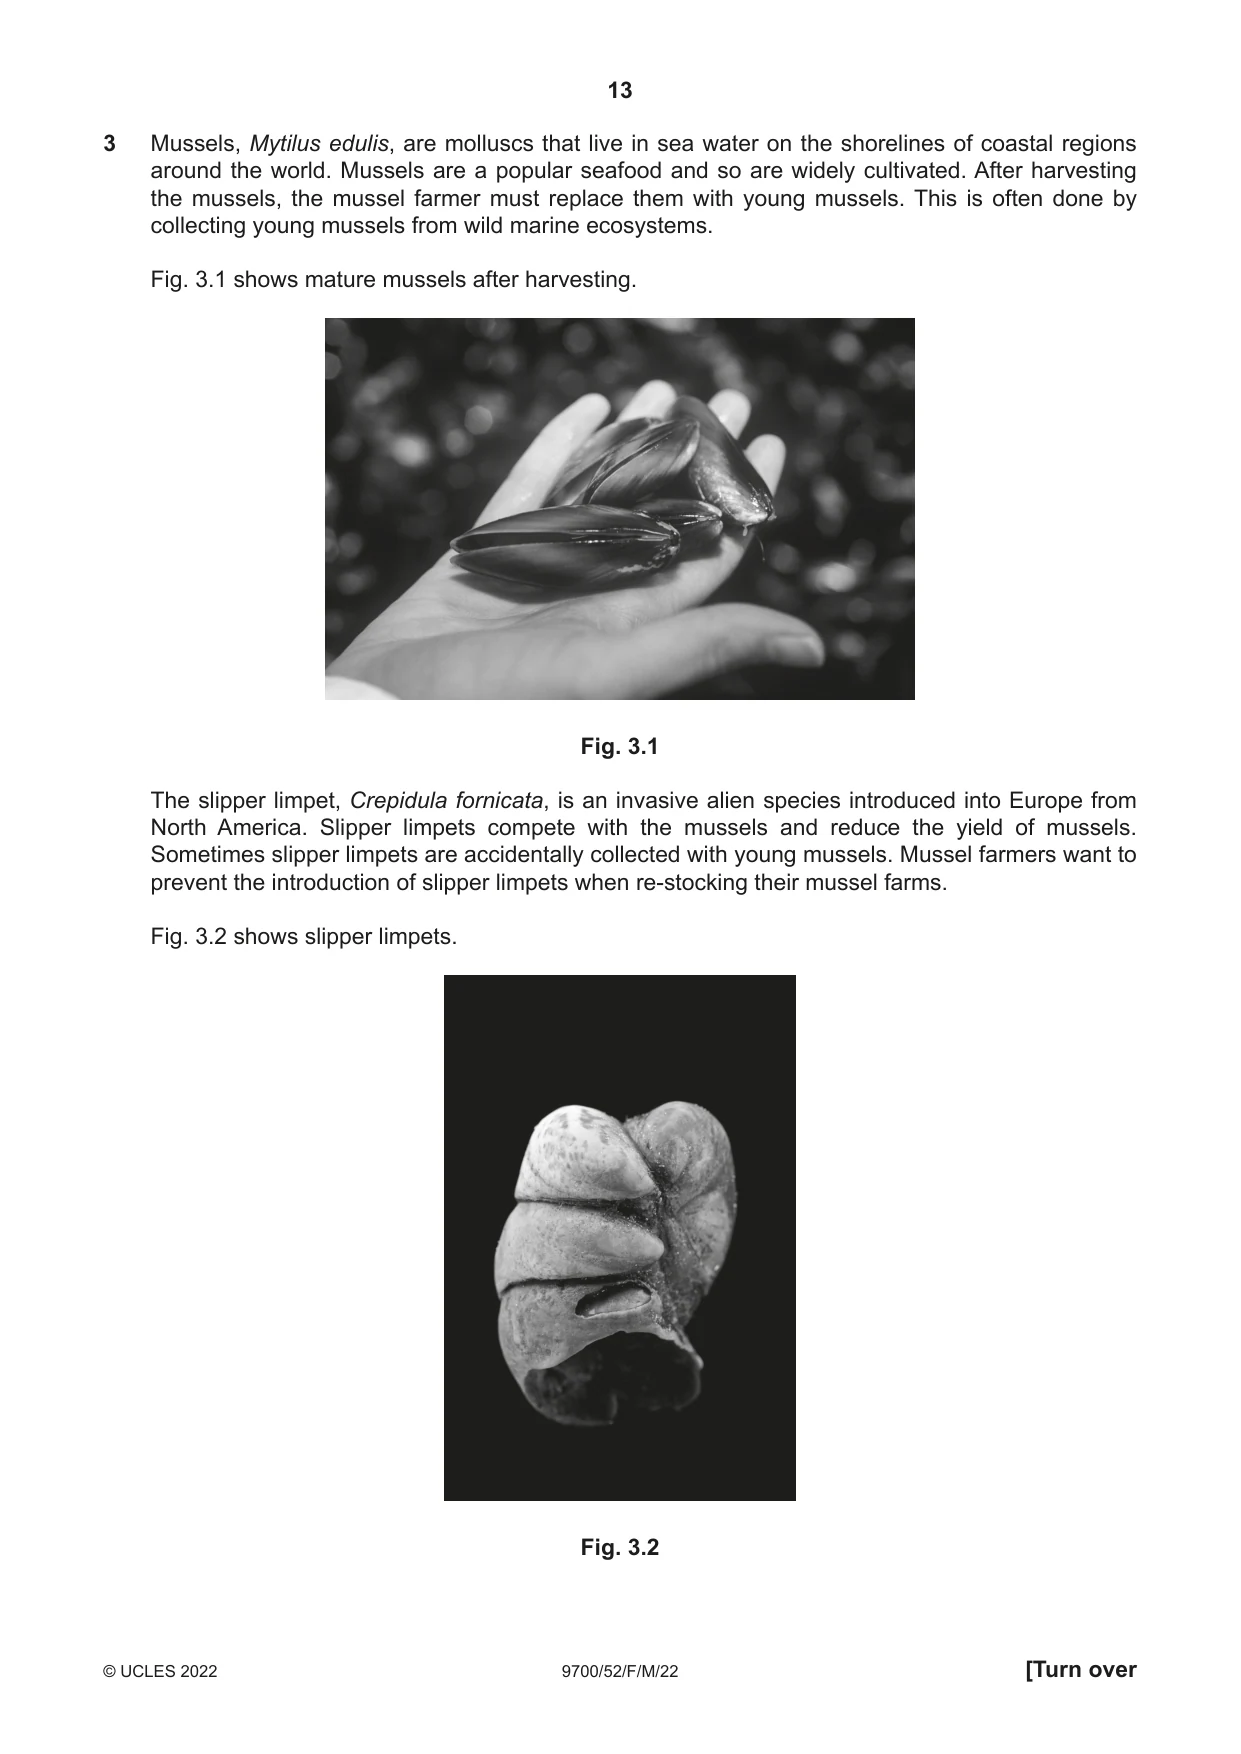
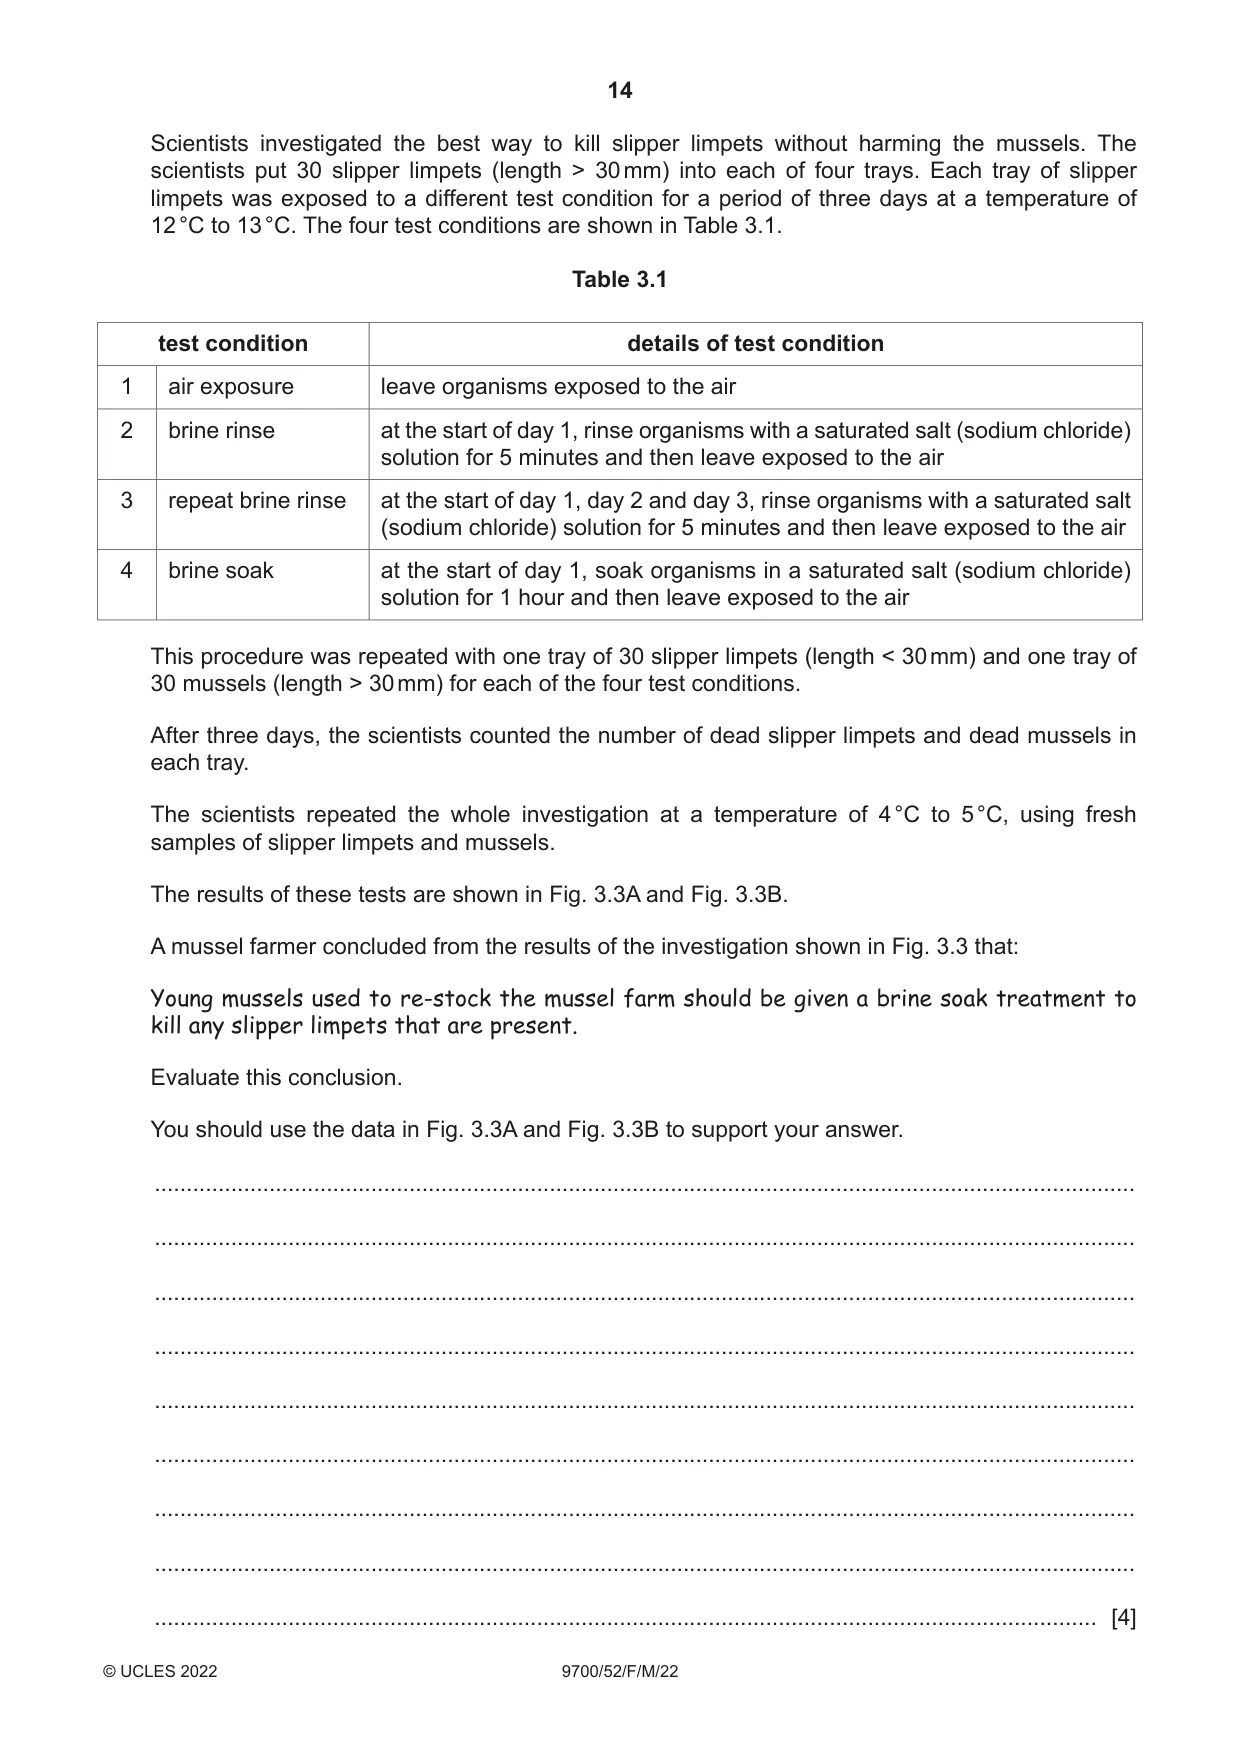
3 Mussels, Mytilus edulis, are molluscs that live in sea water on the shorelines of coastal regions around the world. Mussels are a popular seafood and so are widely cultivated. After harvesting the mussels, the mussel farmer must replace them with young mussels. This is often done by collecting young mussels from wild marine ecosystems. Fig. 3.1 shows mature mussels after harvesting. Fig. 3.1 The slipper limpet, Crepidula fornicata, is an invasive alien species introduced into Europe from North America. Slipper limpets compete with the mussels and reduce the yield of mussels. Sometimes slipper limpets are accidentally collected with young mussels. Mussel farmers want to prevent the introduction of slipper limpets when re-stocking their mussel farms. Fig. 3.2 shows slipper limpets. Fig. 3.2 Scientists investigated the best way to kill slipper limpets without harming the mussels. The scientists put 30 slipper limpets (length > 30 mm) into each of four trays. Each tray of slipper limpets was exposed to a different test condition for a period of three days at a temperature of 12 °C to 13 °C. The four test conditions are shown in Table 3.1. Table 3.1 test condition details of test condition 1 air exposure leave organisms exposed to the air 2 brine rinse at the start of day 1, rinse organisms with a saturated salt (sodium chloride) solution for 5 minutes and then leave exposed to the air 3 repeat brine rinse at the start of day 1, day 2 and day 3, rinse organisms with a saturated salt (sodium chloride) solution for 5 minutes and then leave exposed to the air
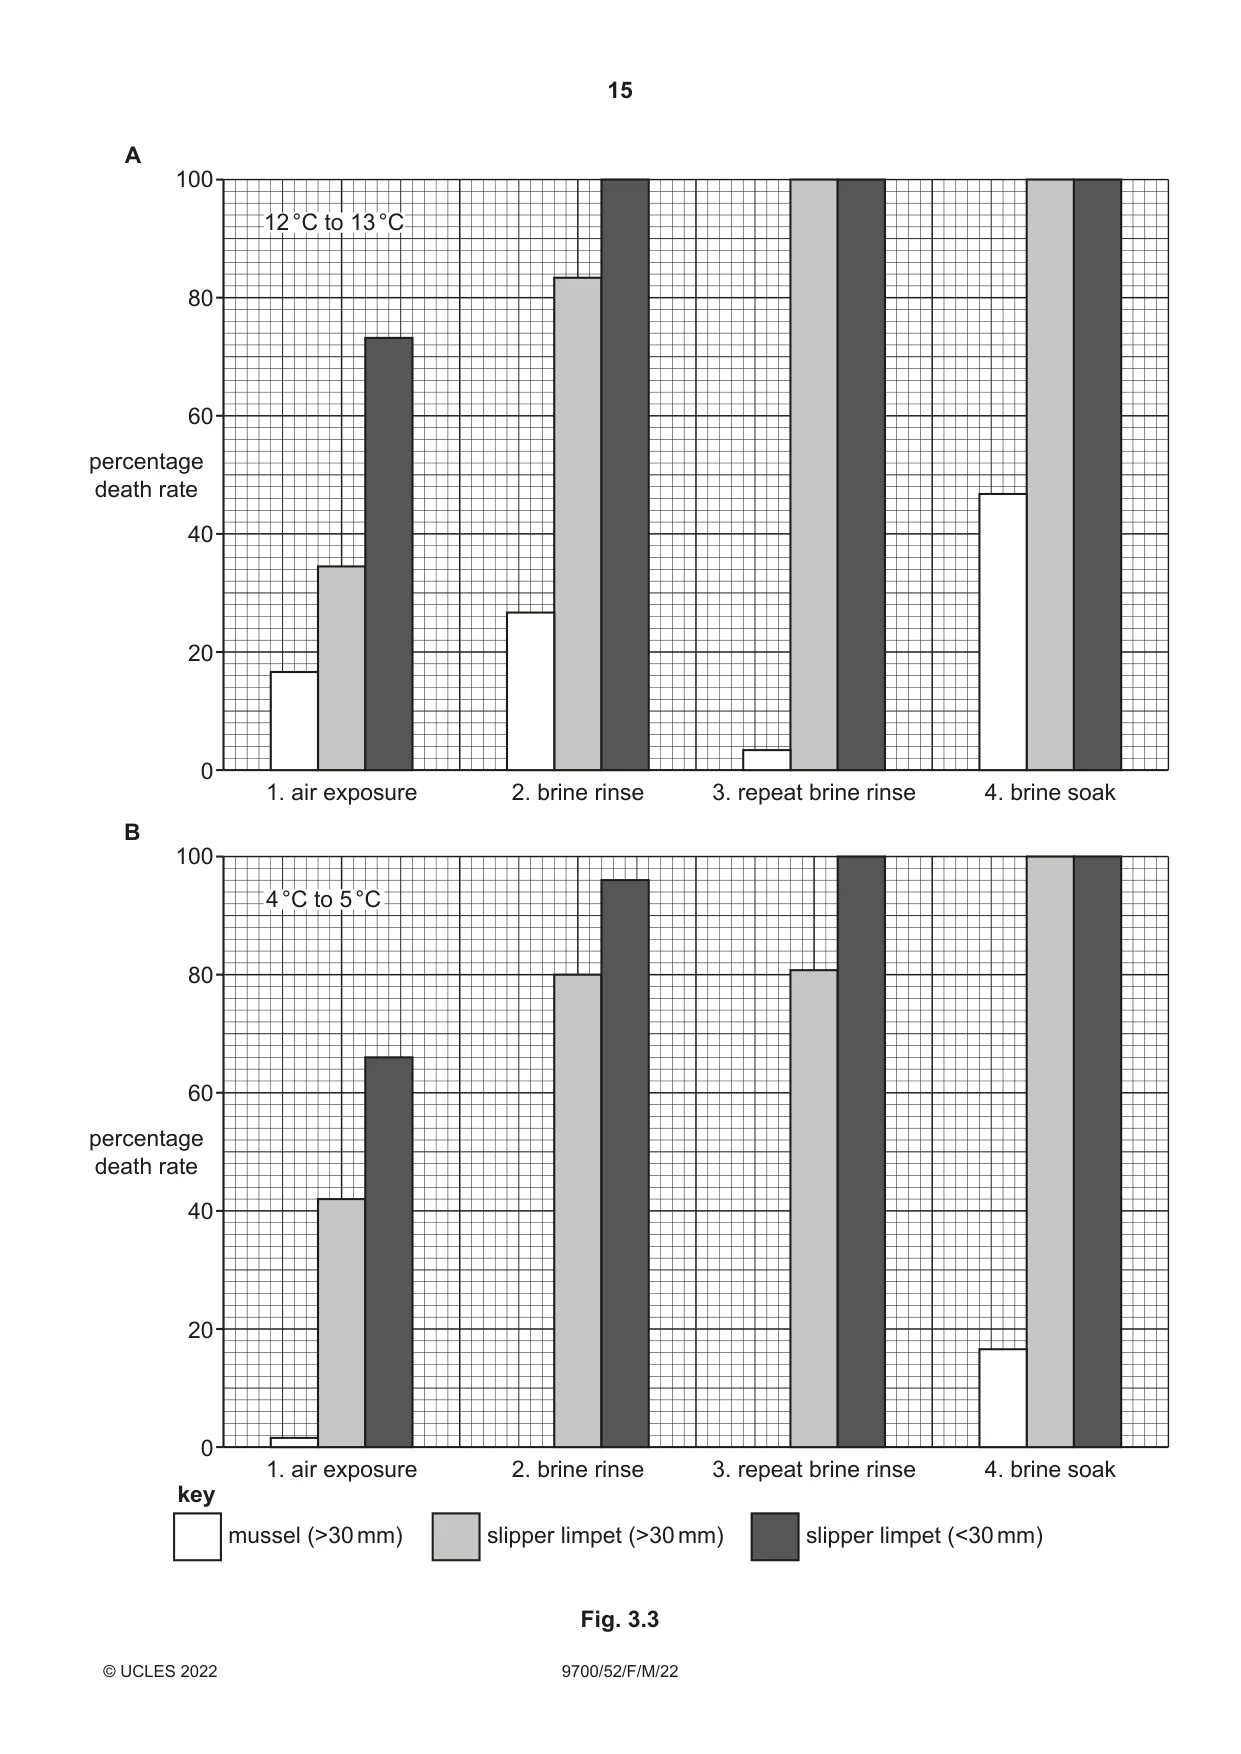
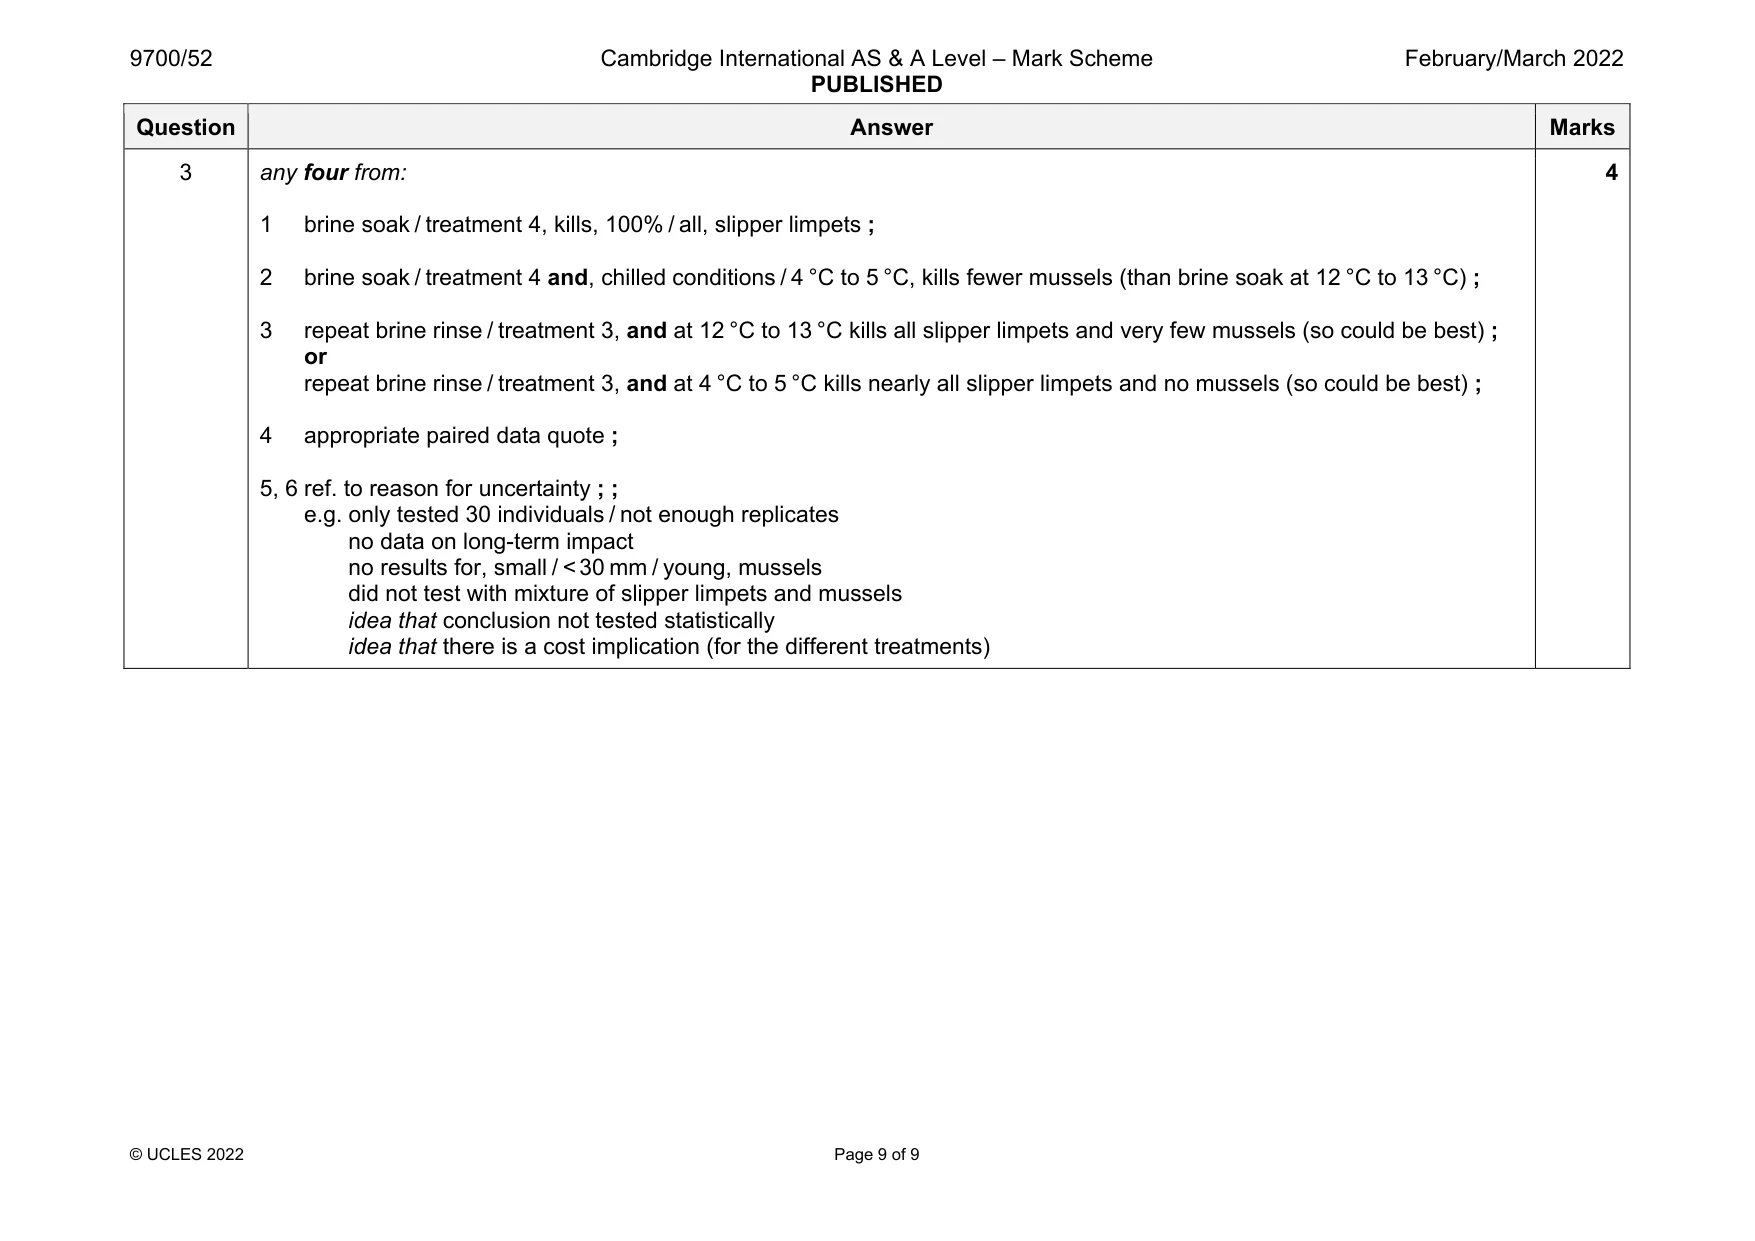
Mark scheme: 3 any four from: 1 brine soak / treatment 4, kills, 100% / all, slipper limpets ; 2 brine soak / treatment 4 and, chilled conditions / 4 °C to 5 °C, kills fewer mussels (than brine soak at 12 °C to 13 °C) ; 3 repeat brine rinse / treatment 3, and at 12 °C to 13 °C kills all slipper limpets and very few mussels (so could be best) ; or repeat brine rinse / treatment 3, and at 4 °C to 5 °C kills nearly all slipper limpets and no mussels (so could be best) ; 4 appropriate paired data quote ; 5, 6 ref. to reason for uncertainty ; ; e.g. only tested 30 individuals / not enough replicates no data on long-term impact no results for, small / < 30 mm / young, mussels did not test with mixture of slipper limpets and mussels idea that conclusion not tested statistically idea that there is a cost implication (for the different treatments)
Q4 · Brine soak at the start of day 1, soak organisms in a saturated salt (sodium chloride)…
4 brine soak at the start of day 1, soak organisms in a saturated salt (sodium chloride) solution for 1 hour and then leave exposed to the air This procedure was repeated with one tray of 30 slipper limpets (length < 30 mm) and one tray of 30 mussels (length > 30 mm) for each of the four test conditions. After three days, the scientists counted the number of dead slipper limpets and dead mussels in each tray. The scientists repeated the whole investigation at a temperature of 4 °C to 5 °C, using fresh samples of slipper limpets and mussels. The results of these tests are shown in Fig. 3.3A and Fig. 3.3B. A mussel farmer concluded from the results of the investigation shown in Fig. 3.3 that: Young mussels used to re-stock the mussel farm should be given a brine soak treatment to kill any slipper limpets that are present. Evaluate this conclusion. You should use the data in Fig. 3.3A and Fig. 3.3B to support your answer. .......................................................................................................................................................... .......................................................................................................................................................... .......................................................................................................................................................... .......................................................................................................................................................... .......................................................................................................................................................... .......................................................................................................................................................... .......................................................................................................................................................... .......................................................................................................................................................... .................................................................................................................................................... [4] A 100 12 °C to 13 °C 80 60 percentage death rate 40 20 0 1. air exposure 2. brine rinse 3. repeat brine rinse 4. brine soak B 100 4 °C to 5 °C 80 60 percentage death rate 40 20 0 1. air exposure 2. brine rinse 3. repeat brine rinse 4. brine soak key mussel (>30 mm) slipper limpet (>30 mm) slipper limpet (<30 mm) Fig. 3.3
What was in this paper
The subtopics covered by these 4 questions, and how many questions each got. Open one in a new tab to see every Cambridge question on it.
What you needed in this session
Cambridge’s own grade thresholds for 2022 Feb/March, Paper 5 · Variant 2. A higher threshold means an easier paper — the bar moves with how the cohort did.