Cambridge A Level Biology 9700 — 2021 May/June Paper 5 · Variant 1
9700/51/M/J/21 · 2 questions · 30 marks · ≈34 min
The question paper and its mark scheme, free to read here and free to download. This is Cambridge’s own paper, exactly as it was sat.
Question paper12 pages




Mark scheme10 pages
Answers below. Sit the paper first if you are practising.


Questions as text
Q1 · The enzyme β-galactosidase catalyses the breakdown of the compound ONPG (o-nitrophenyl…
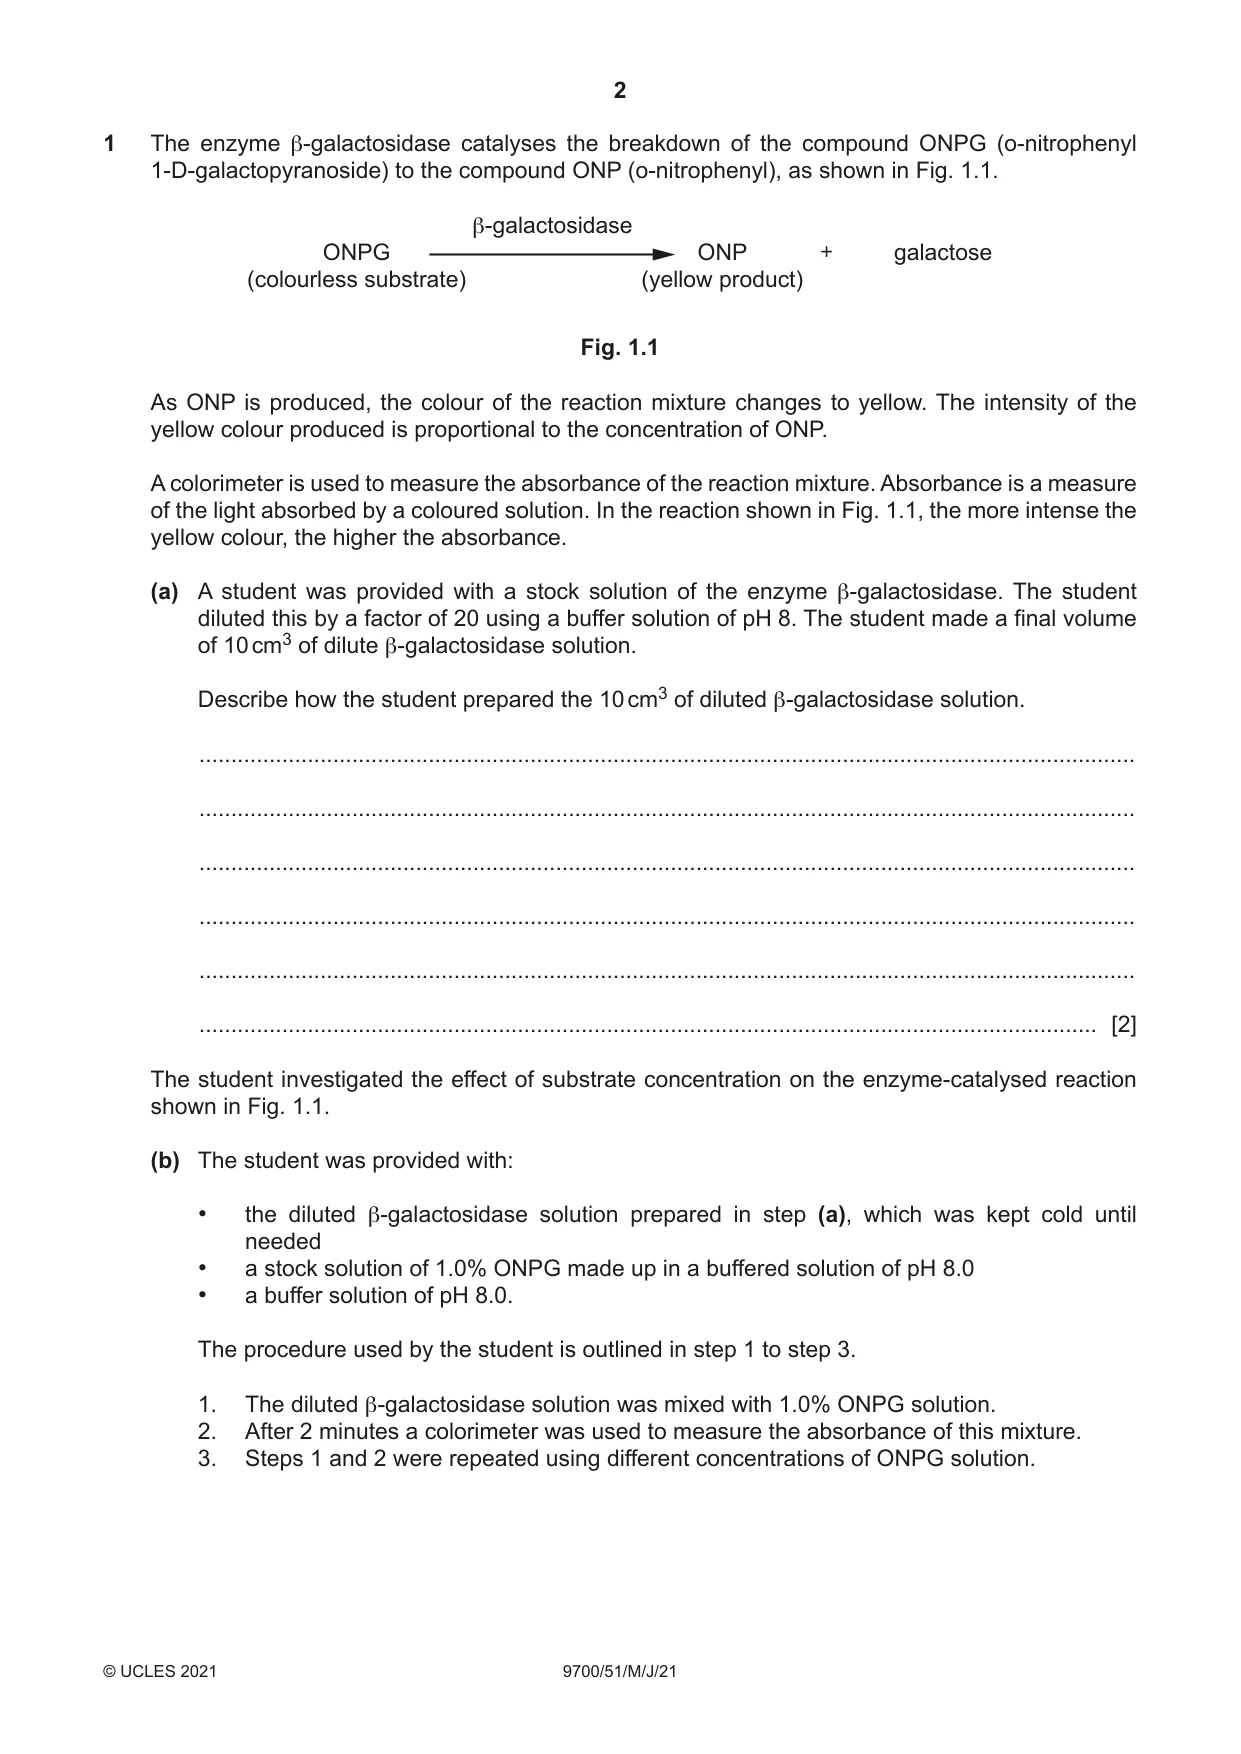
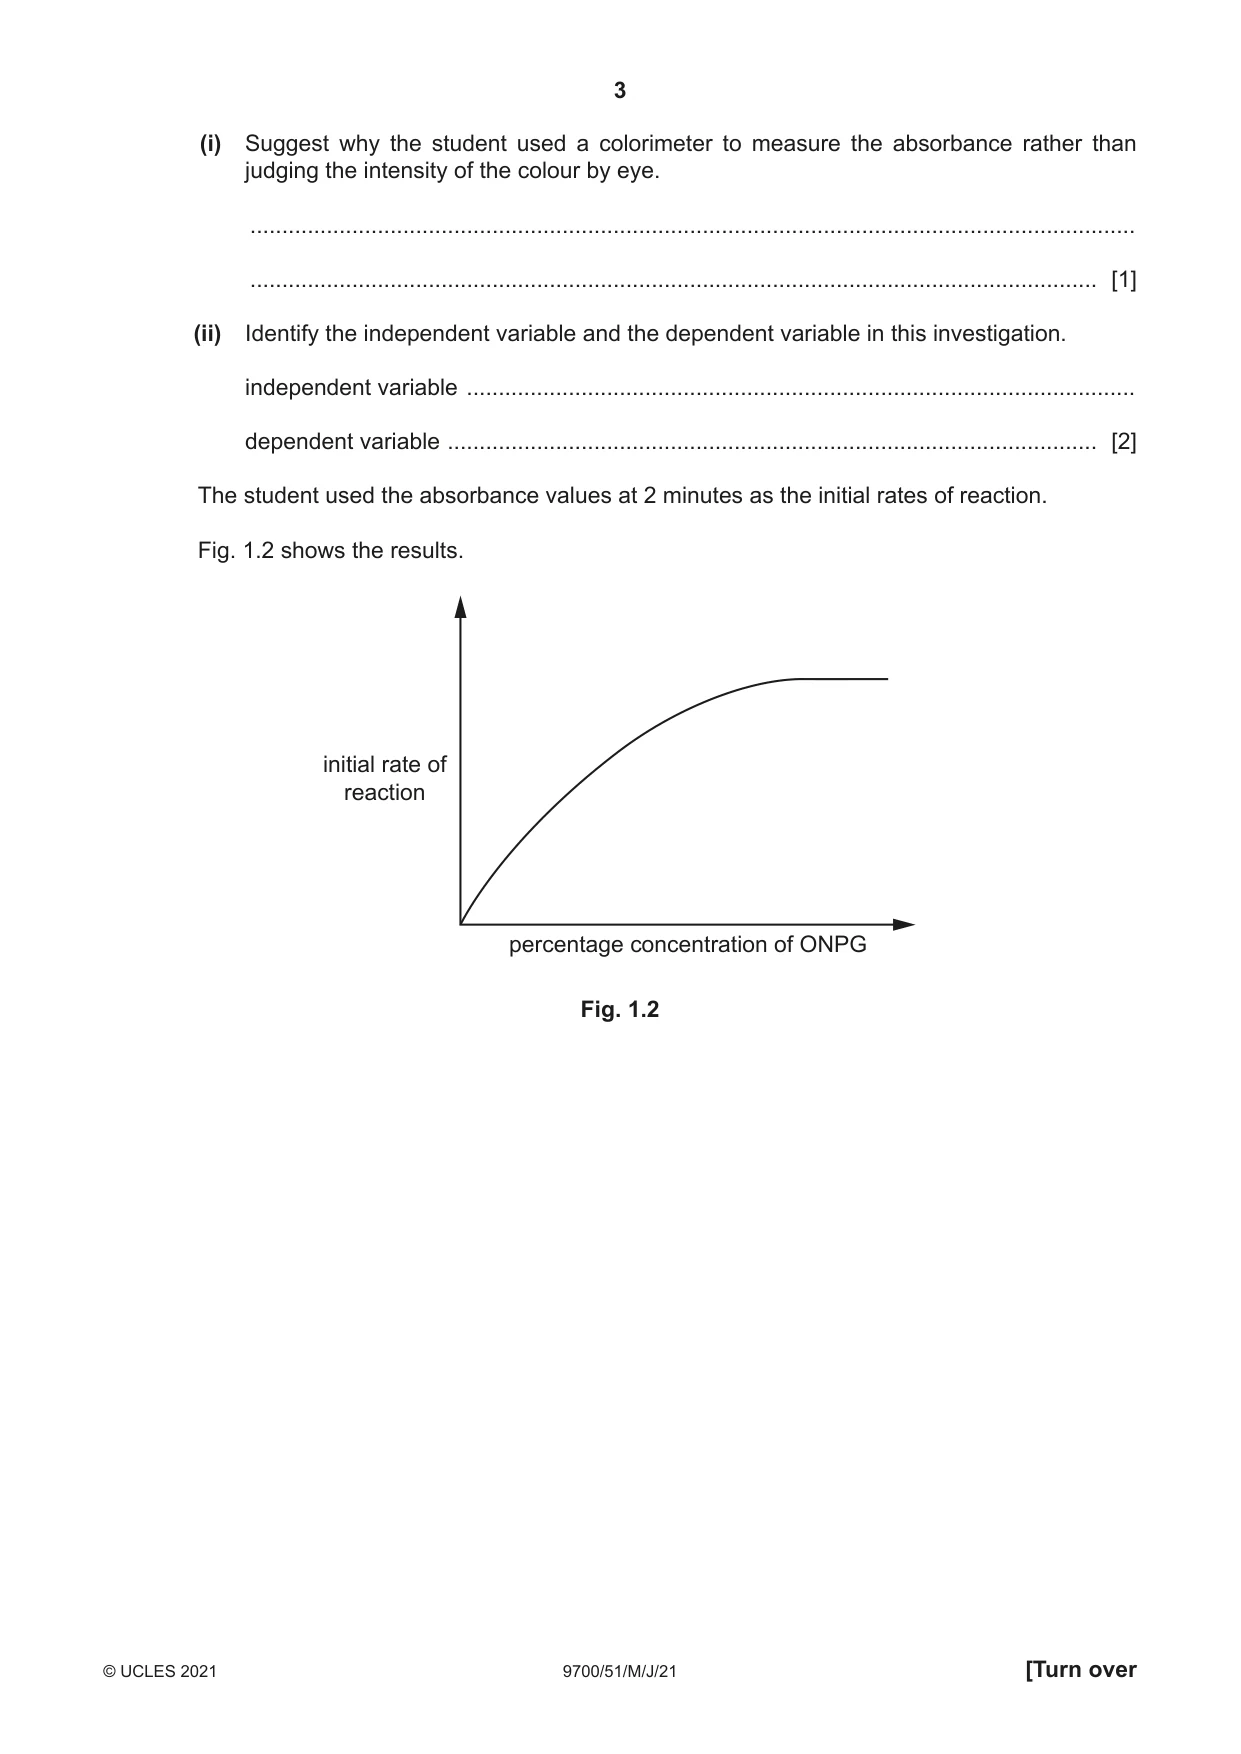
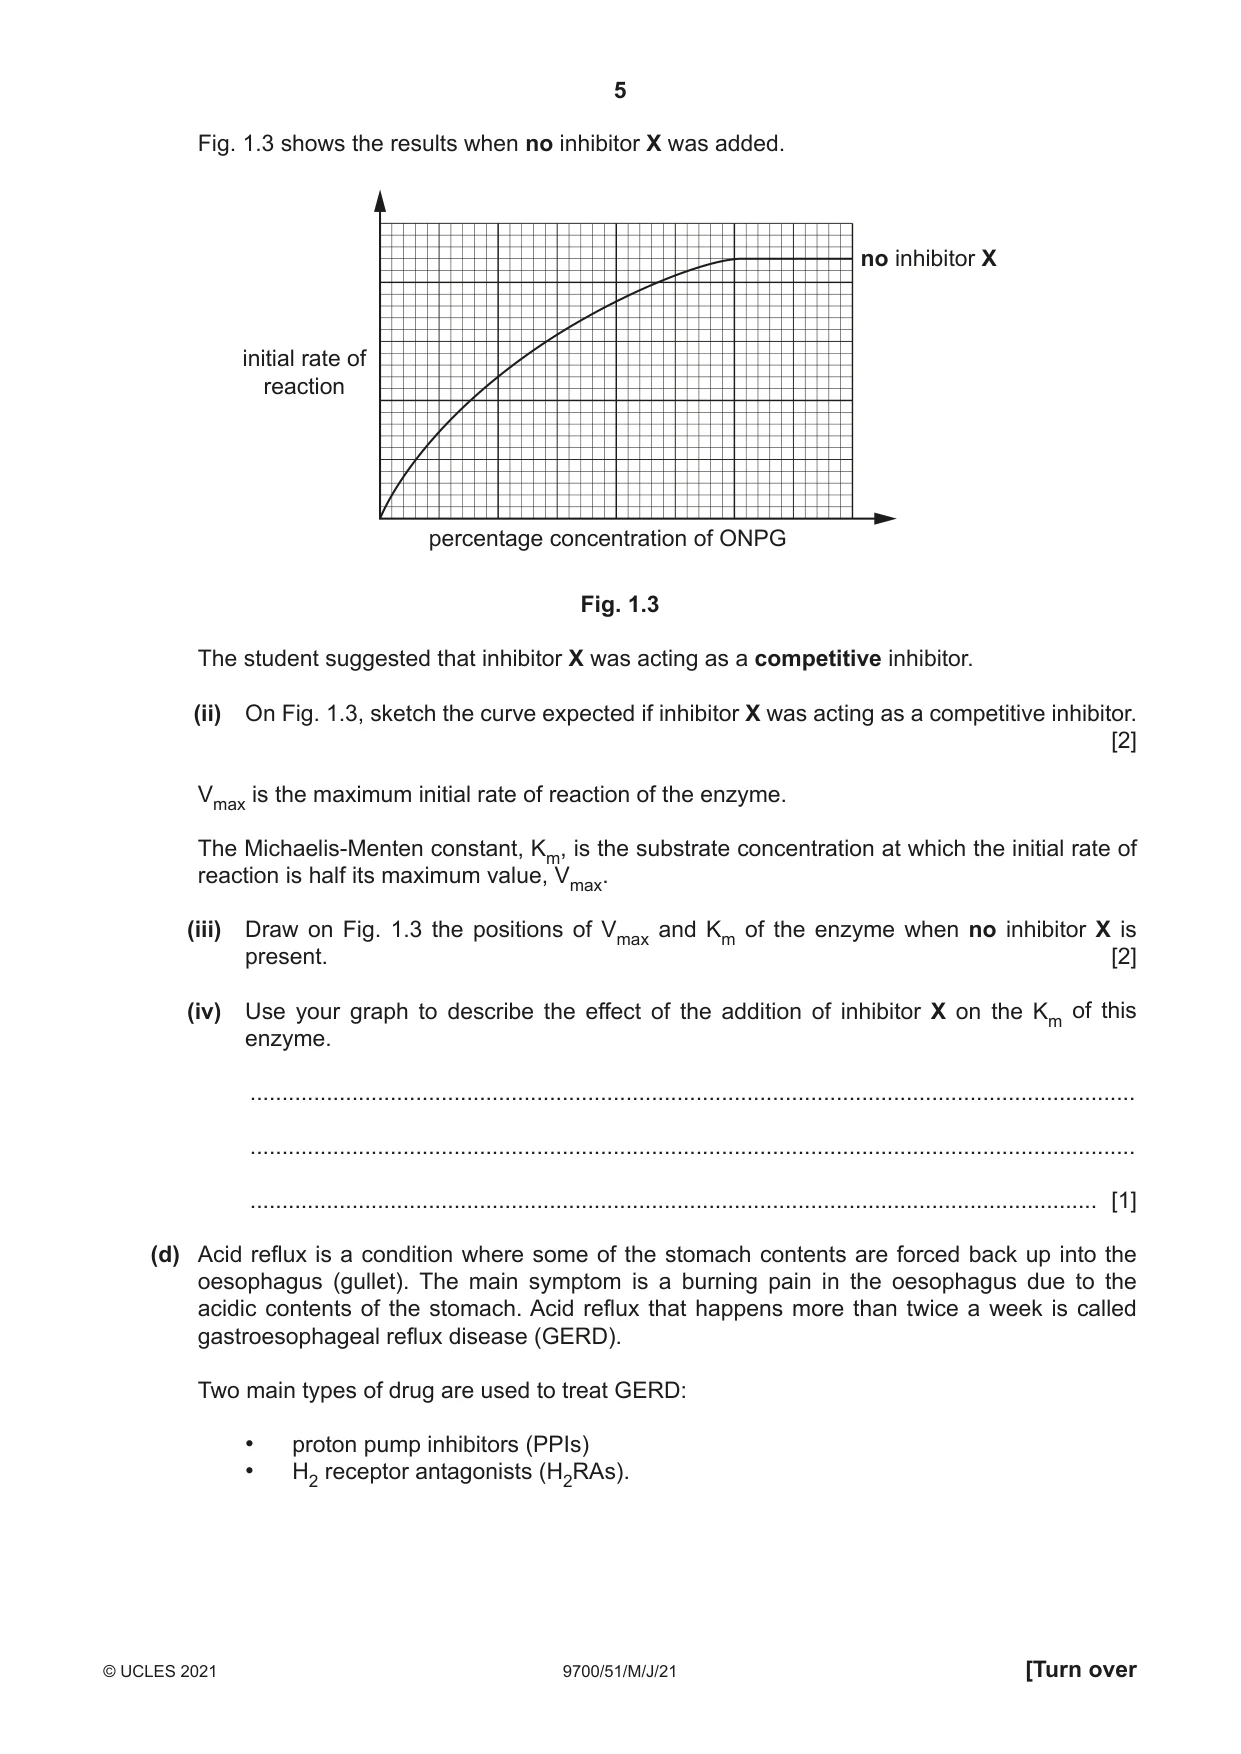
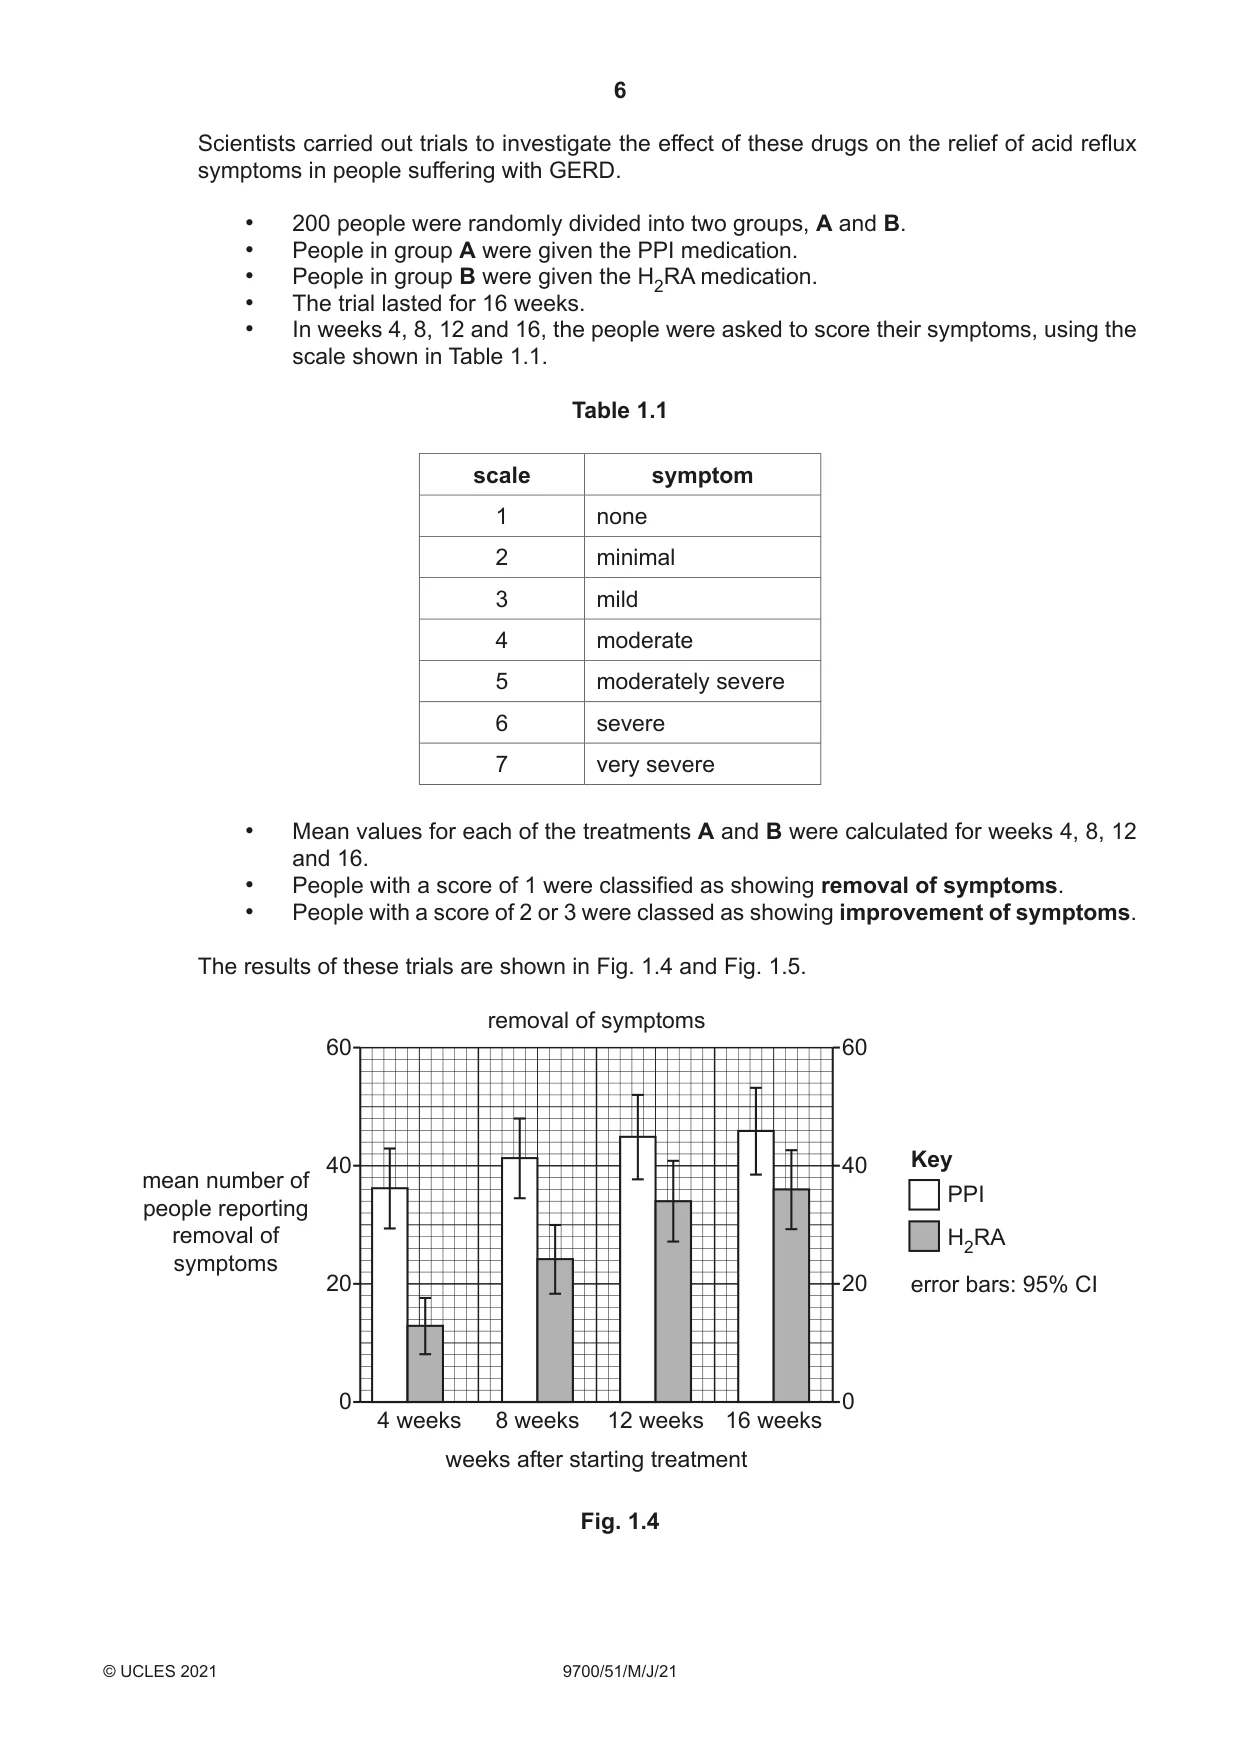
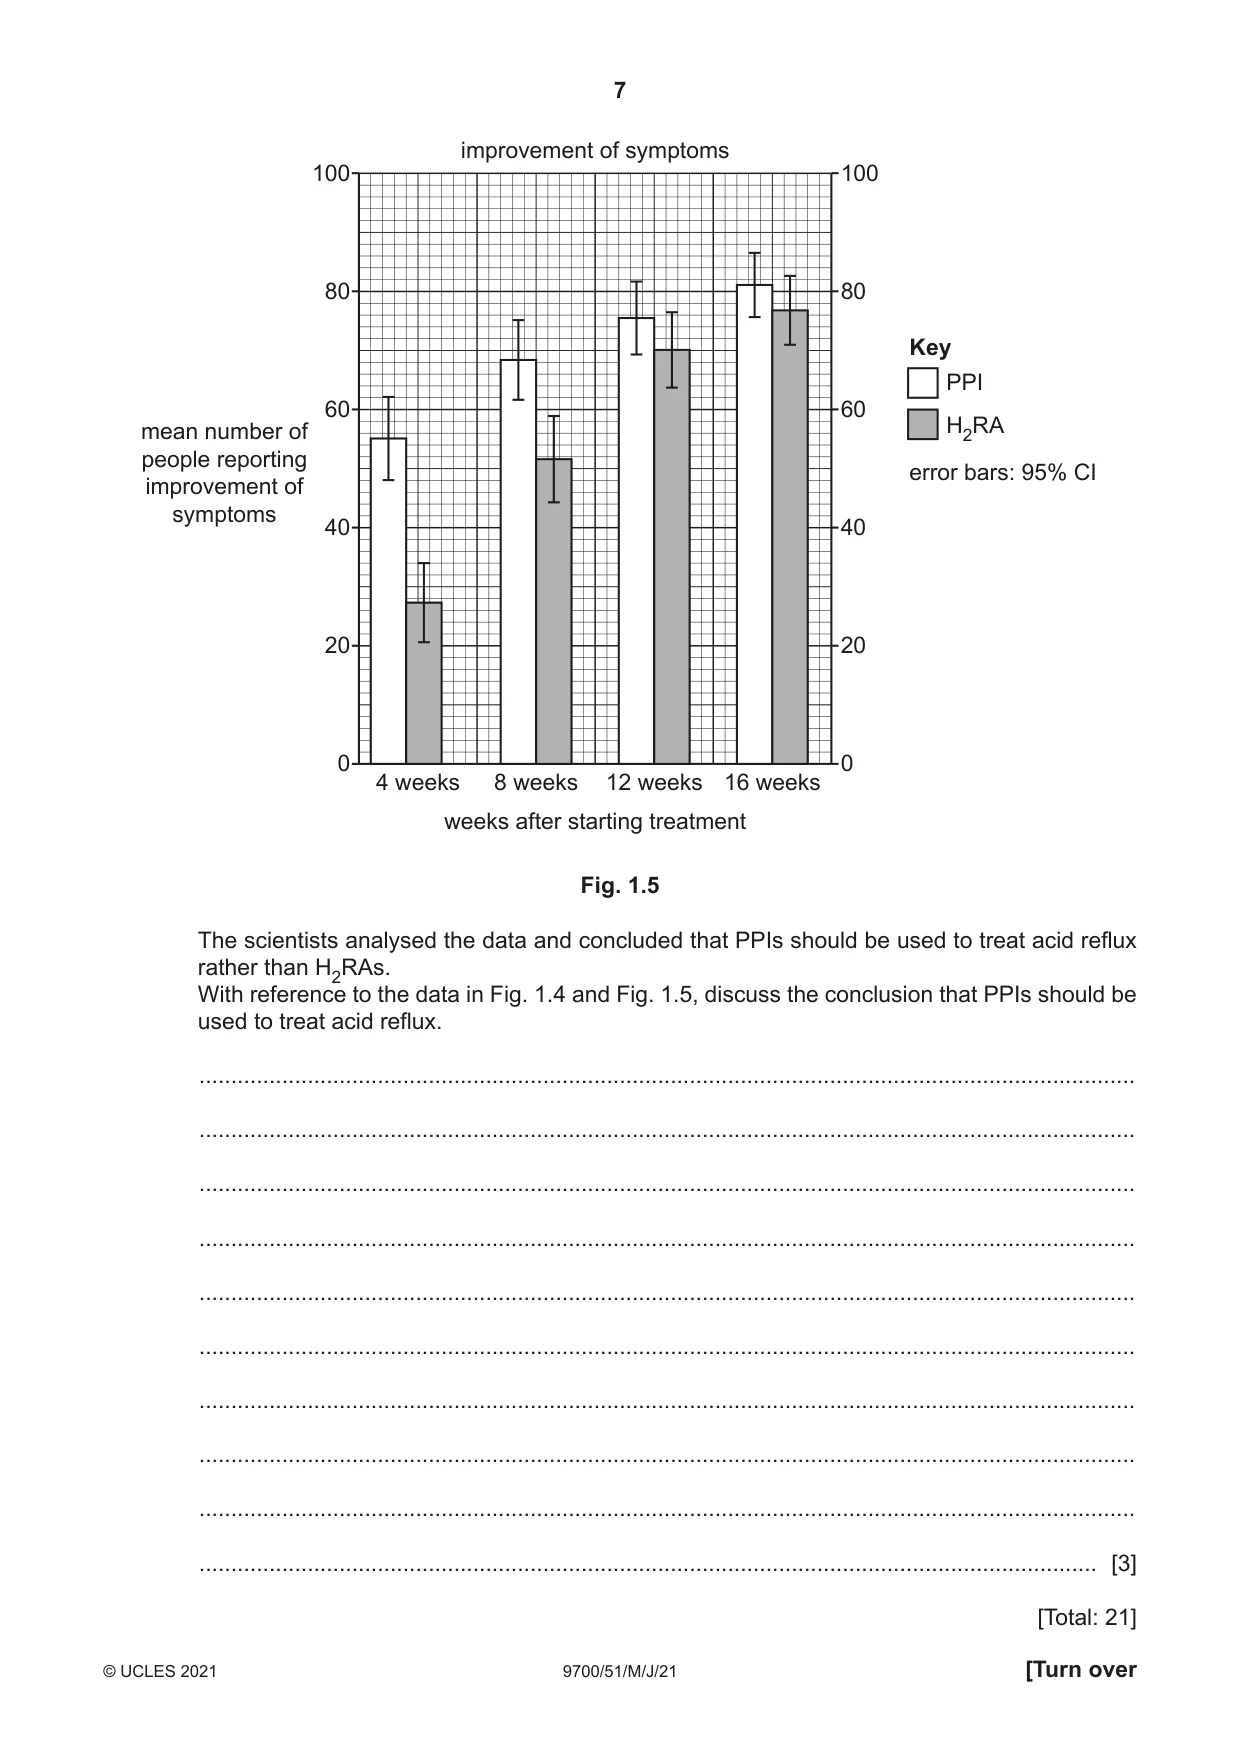
1 The enzyme β-galactosidase catalyses the breakdown of the compound ONPG (o-nitrophenyl 1-D-galactopyranoside) to the compound ONP (o-nitrophenyl), as shown in Fig. 1.1. β-galactosidase ONPG ONP + galactose (colourless substrate) (yellow product) Fig. 1.1 As ONP is produced, the colour of the reaction mixture changes to yellow. The intensity of the yellow colour produced is proportional to the concentration of ONP. A colorimeter is used to measure the absorbance of the reaction mixture. Absorbance is a measure of the light absorbed by a coloured solution. In the reaction shown in Fig. 1.1, the more intense the yellow colour, the higher the absorbance. (a) A student was provided with a stock solution of the enzyme β-galactosidase. The student diluted this by a factor of 20 using a buffer solution of pH 8. The student made a final volume of 10 cm3 of dilute β-galactosidase solution. Describe how the student prepared the 10 cm3 of diluted β-galactosidase solution. ................................................................................................................................................... ................................................................................................................................................... ................................................................................................................................................... ................................................................................................................................................... ................................................................................................................................................... ............................................................................................................................................. [2] The student investigated the effect of substrate concentration on the enzyme-catalysed reaction shown in Fig. 1.1. (b) The student was provided with: • the diluted β-galactosidase solution prepared in step (a), which was kept cold until needed • a stock solution of 1.0% ONPG made up in a buffered solution of pH 8.0 • a buffer solution of pH 8.0. The procedure used by the student is outlined in step 1 to step 3. 1. The diluted β-galactosidase solution was mixed with 1.0% ONPG solution. 2. After 2 minutes a colorimeter was used to measure the absorbance of this mixture. 3. Steps 1 and 2 were repeated using different concentrations of ONPG solution. (i) Suggest why the student used a colorimeter to measure the absorbance rather than judging the intensity of the colour by eye. ........................................................................................................................................... ..................................................................................................................................... [1] (ii) Identify the independent variable and the dependent variable in this investigation. independent variable ......................................................................................................... dependent variable ...................................................................................................... [2] The student used the absorbance values at 2 minutes as the initial rates of reaction. Fig. 1.2 shows the results. initial rate of reaction percentage concentration of ONPG Fig. 1.2 (c) The student decided to investigate the effect of inhibitors on the reaction shown in Fig. 1.1. The student planned to add an inhibitor, inhibitor X, to reaction mixtures containing different concentrations of ONPG solution. (i) Describe a method the student could use to collect the data needed to test the effect of inhibitor X in reaction mixtures containing different concentrations of ONPG solution. The description of your method should be set out in a logical way and be detailed enough for another person to follow. You should not repeat the details from (a) describing how to dilute the stock solution of β-galactosidase. ........................................................................................................................................... ........................................................................................................................................... ........................................................................................................................................... ........................................................................................................................................... ........................................................................................................................................... ........................................................................................................................................... ........................................................................................................................................... ........................................................................................................................................... ........................................................................................................................................... ........................................................................................................................................... ........................................................................................................................................... ........................................................................................................................................... ........................................................................................................................................... ........................................................................................................................................... ........................................................................................................................................... ........................................................................................................................................... ........................................................................................................................................... ........................................................................................................................................... ........................................................................................................................................... ........................................................................................................................................... ........................................................................................................................................... ..................................................................................................................................... [8] Fig. 1.3 shows the results when no inhibitor X was added. no inhibitor X initial rate of reaction percentage concentration of ONPG Fig. 1.3 The student suggested that inhibitor X was acting as a competitive inhibitor. (ii) On Fig. 1.3, sketch the curve expected if inhibitor X was acting as a competitive inhibitor. [2] Vmax is the maximum initial rate of reaction of the enzyme. The Michaelis-Menten constant, Km, is the substrate concentration at which the initial rate of reaction is half its maximum value, Vmax. (iii) Draw on Fig. 1.3 the positions of Vmax and Km of the enzyme when no inhibitor X is present. [2] (iv) Use your graph to describe the effect of the addition of inhibitor X on the Km of this enzyme. ........................................................................................................................................... ........................................................................................................................................... ..................................................................................................................................... [1] (d) Acid reflux is a condition where some of the stomach contents are forced back up into the oesophagus (gullet). The main symptom is a burning pain in the oesophagus due to the acidic contents of the stomach. Acid reflux that happens more than twice a week is called gastroesophageal reflux disease (GERD). Two main types of drug are used to treat GERD: • proton pump inhibitors (PPIs) • H2 receptor antagonists (H2RAs). Scientists carried out trials to investigate the effect of these drugs on the relief of acid reflux symptoms in people suffering with GERD. • 200 people were randomly divided into two groups, A and B. • People in group A were given the PPI medication. • People in group B were given the H2RA medication. • The trial lasted for 16 weeks. • In weeks 4, 8, 12 and 16, the people were asked to score their symptoms, using the scale shown in Table 1.1. Table 1.1 scale symptom 1 none 2 minimal 3 mild 4 moderate 5 moderately severe 6 severe 7 very severe • Mean values for each of the treatments A and B were calculated for weeks 4, 8, 12 and 16. • People with a score of 1 were classified as showing removal of symptoms. • People with a score of 2 or 3 were classed as showing improvement of symptoms. The results of these trials are shown in Fig. 1.4 and Fig. 1.5. removal of symptoms 60 60 40 40 Keymean number of PPIpeople reporting removal of H2RA symptoms 20 20 error bars: 95% CI 0 0 4 weeks 8 weeks 12 weeks 16 weeks weeks after starting treatment Fig. 1.4 improvement of symptoms 100 100 80 80 Key PPI 60 60 mean number of H2RA people reporting error bars: 95% CIimprovement of symptoms 40 40 20 20 0 0 4 weeks 8 weeks 12 weeks 16 weeks weeks after starting treatment Fig. 1.5 The scientists analysed the data and concluded that PPIs should be used to treat acid reflux rather than H2RAs. With reference to the data in Fig. 1.4 and Fig. 1.5, discuss the conclusion that PPIs should be used to treat acid reflux. ................................................................................................................................................... ................................................................................................................................................... ................................................................................................................................................... ................................................................................................................................................... ................................................................................................................................................... ................................................................................................................................................... ................................................................................................................................................... ................................................................................................................................................... ................................................................................................................................................... ............................................................................................................................................. [3] [Total: 21]
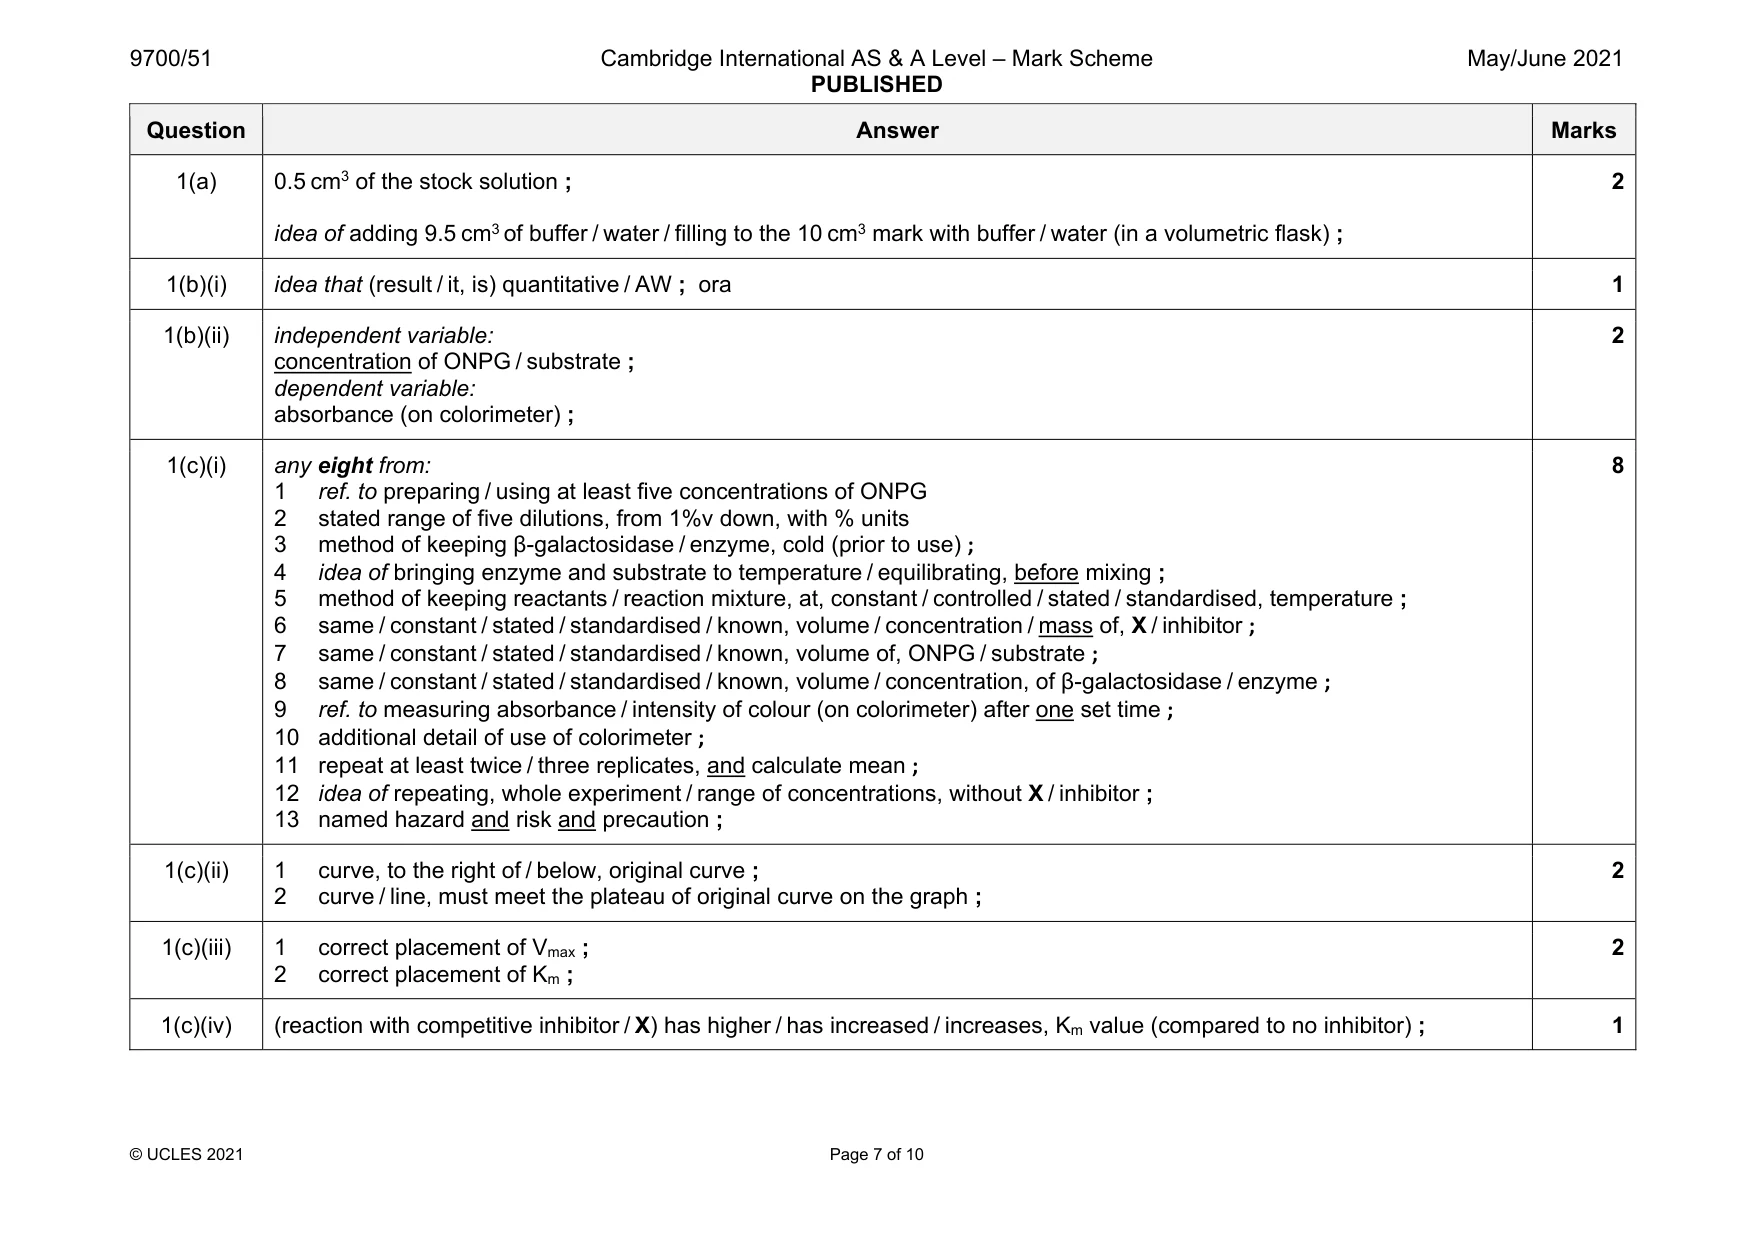
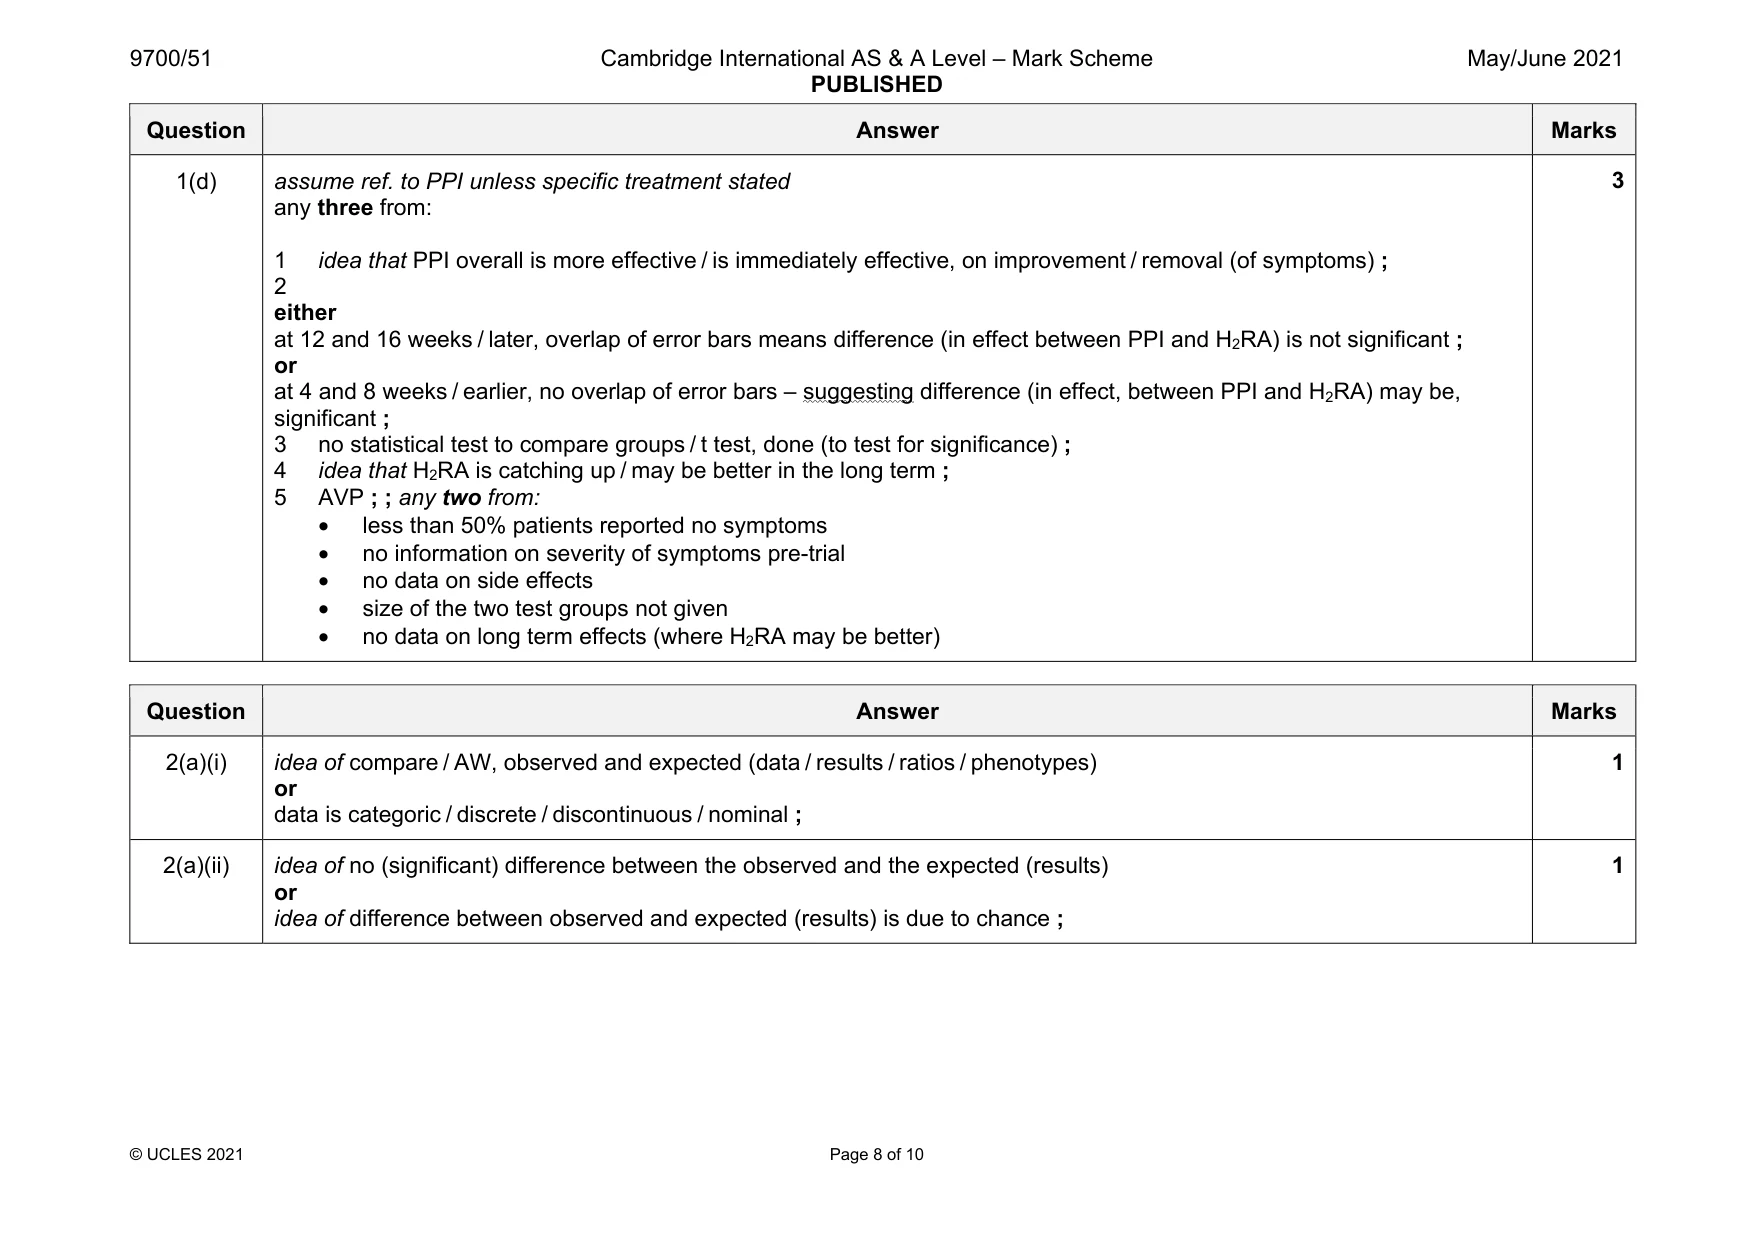
Mark scheme: 1(a) 0.5 cm3 of the stock solution ; idea of adding 9.5 cm3 of buffer / water / filling to the 10 cm3 mark with buffer / water (in a volumetric flask) ; 2 1(b)(i) idea that (result / it, is) quantitative / AW ; ora 1 1(b)(ii) independent variable: concentration of ONPG / substrate ; dependent variable: absorbance (on colorimeter) ; 2 1(c)(i) any eight from: 1 ref. to preparing / using at least five concentrations of ONPG 2 stated range of five dilutions, from 1%v down, with % units 3 method of keeping β-galactosidase / enzyme, cold (prior to use) ; 4 idea of bringing enzyme and substrate to temperature / equilibrating, before mixing ; 5 method of keeping reactants / reaction mixture, at, constant / controlled / stated / standardised, temperature ; 6 same / constant / stated / standardised / known, volume / concentration / mass of, X / inhibitor ; 7 same / constant / stated / standardised / known, volume of, ONPG / substrate ; 8 same / constant / stated / standardised / known, volume / concentration, of β-galactosidase / enzyme ; 9 ref. to measuring absorbance / intensity of colour (on colorimeter) after one set time ; 10 additional detail of use of colorimeter ; 11 repeat at least twice / three replicates, and calculate mean ; 12 idea of repeating, whole experiment / range of concentrations, without X / inhibitor ; 13 named hazard and risk and precaution ; 8 1(c)(ii) 1 curve, to the right of / below, original curve ; 2 curve / line, must meet the plateau of original curve on the graph ; 2 1(c)(iii) 1 correct placement of Vmax ; 2 correct placement of Km ; 2 1(c)(iv) (reaction with competitive inhibitor / X) has higher / has increased / increases, Km value (compared to no inhibitor) ; 1 Question Answer Marks 1(d) assume ref. to PPI unless specific treatment stated any three from: 1 idea that PPI overall is more effective / is immediately effective, on improvement / removal (of symptoms) ; 2 either at 12 and 16 weeks / later, overlap of error bars means difference (in effect between PPI and H2RA) is not significant ; or at 4 and 8 weeks / earlier, no overlap of error bars – suggesting difference (in effect, between PPI and H2RA) may be, significant ; 3 no statistical test to compare groups / t test, done (to test for significance) ; 4 idea that H2RA is catching up / may be better in the long term ; 5 AVP ; ; any two from: • less than 50% patients reported no symptoms • no information on severity of symptoms pre-trial • no data on side effects • size of the two test groups not given • no data on long term effects (where H2RA may be better) 3
Q2 · Inheritance of flower colour and flower position in pea plants are controlled by two genes
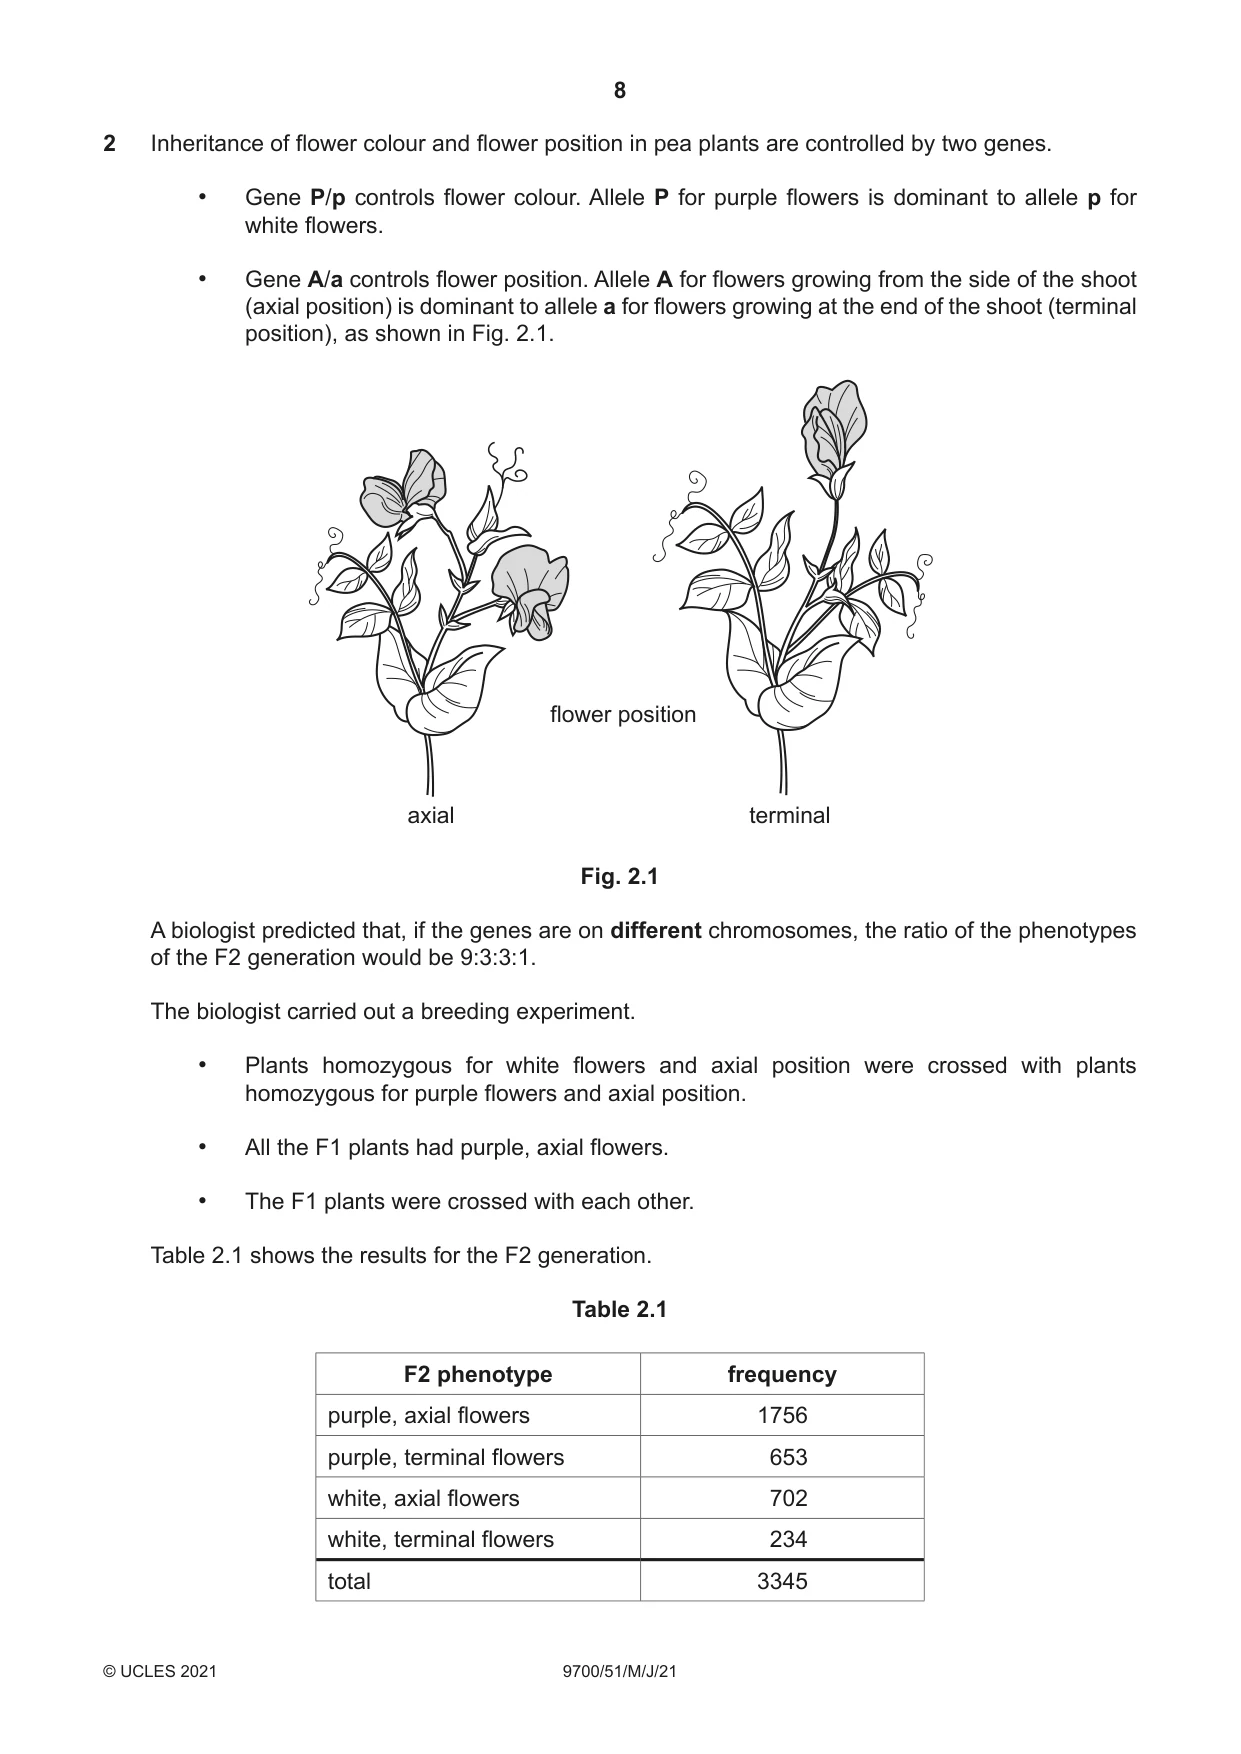
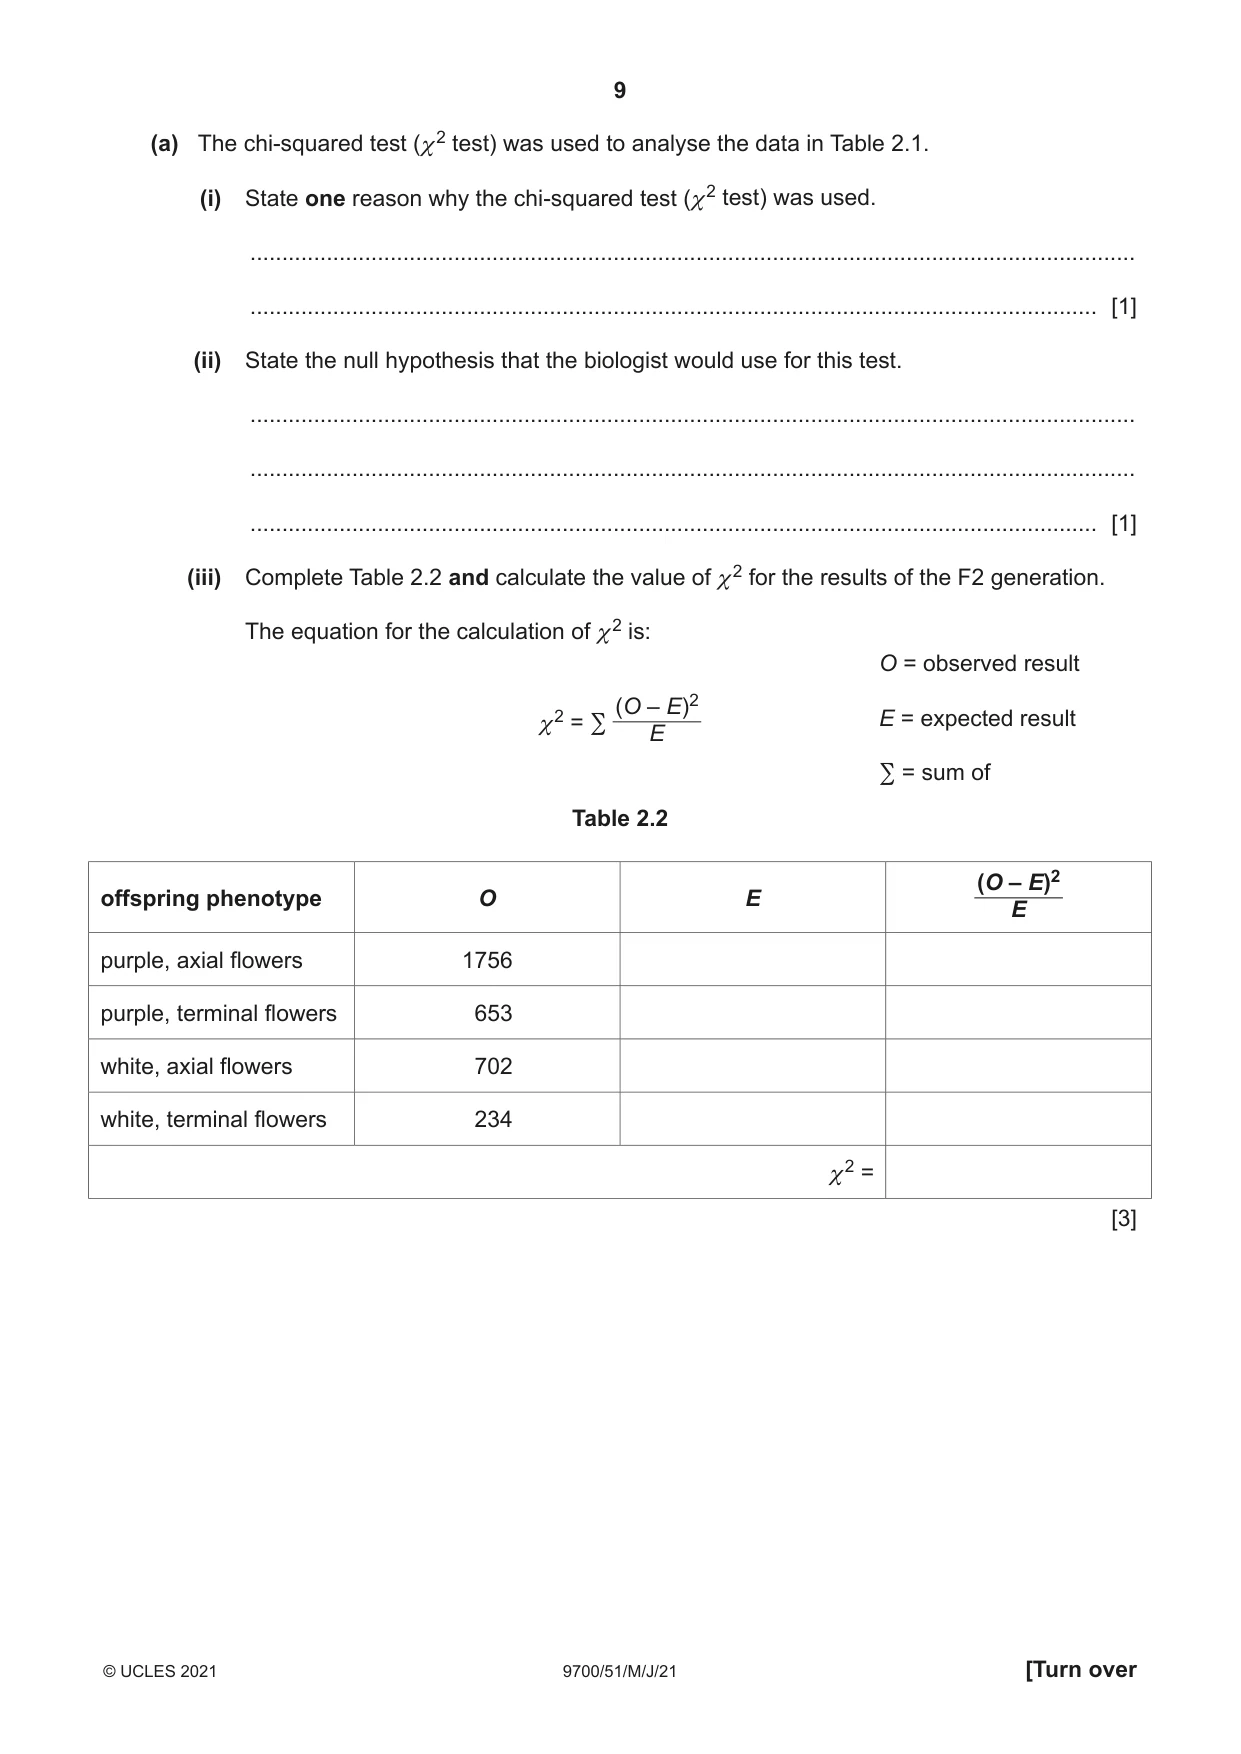
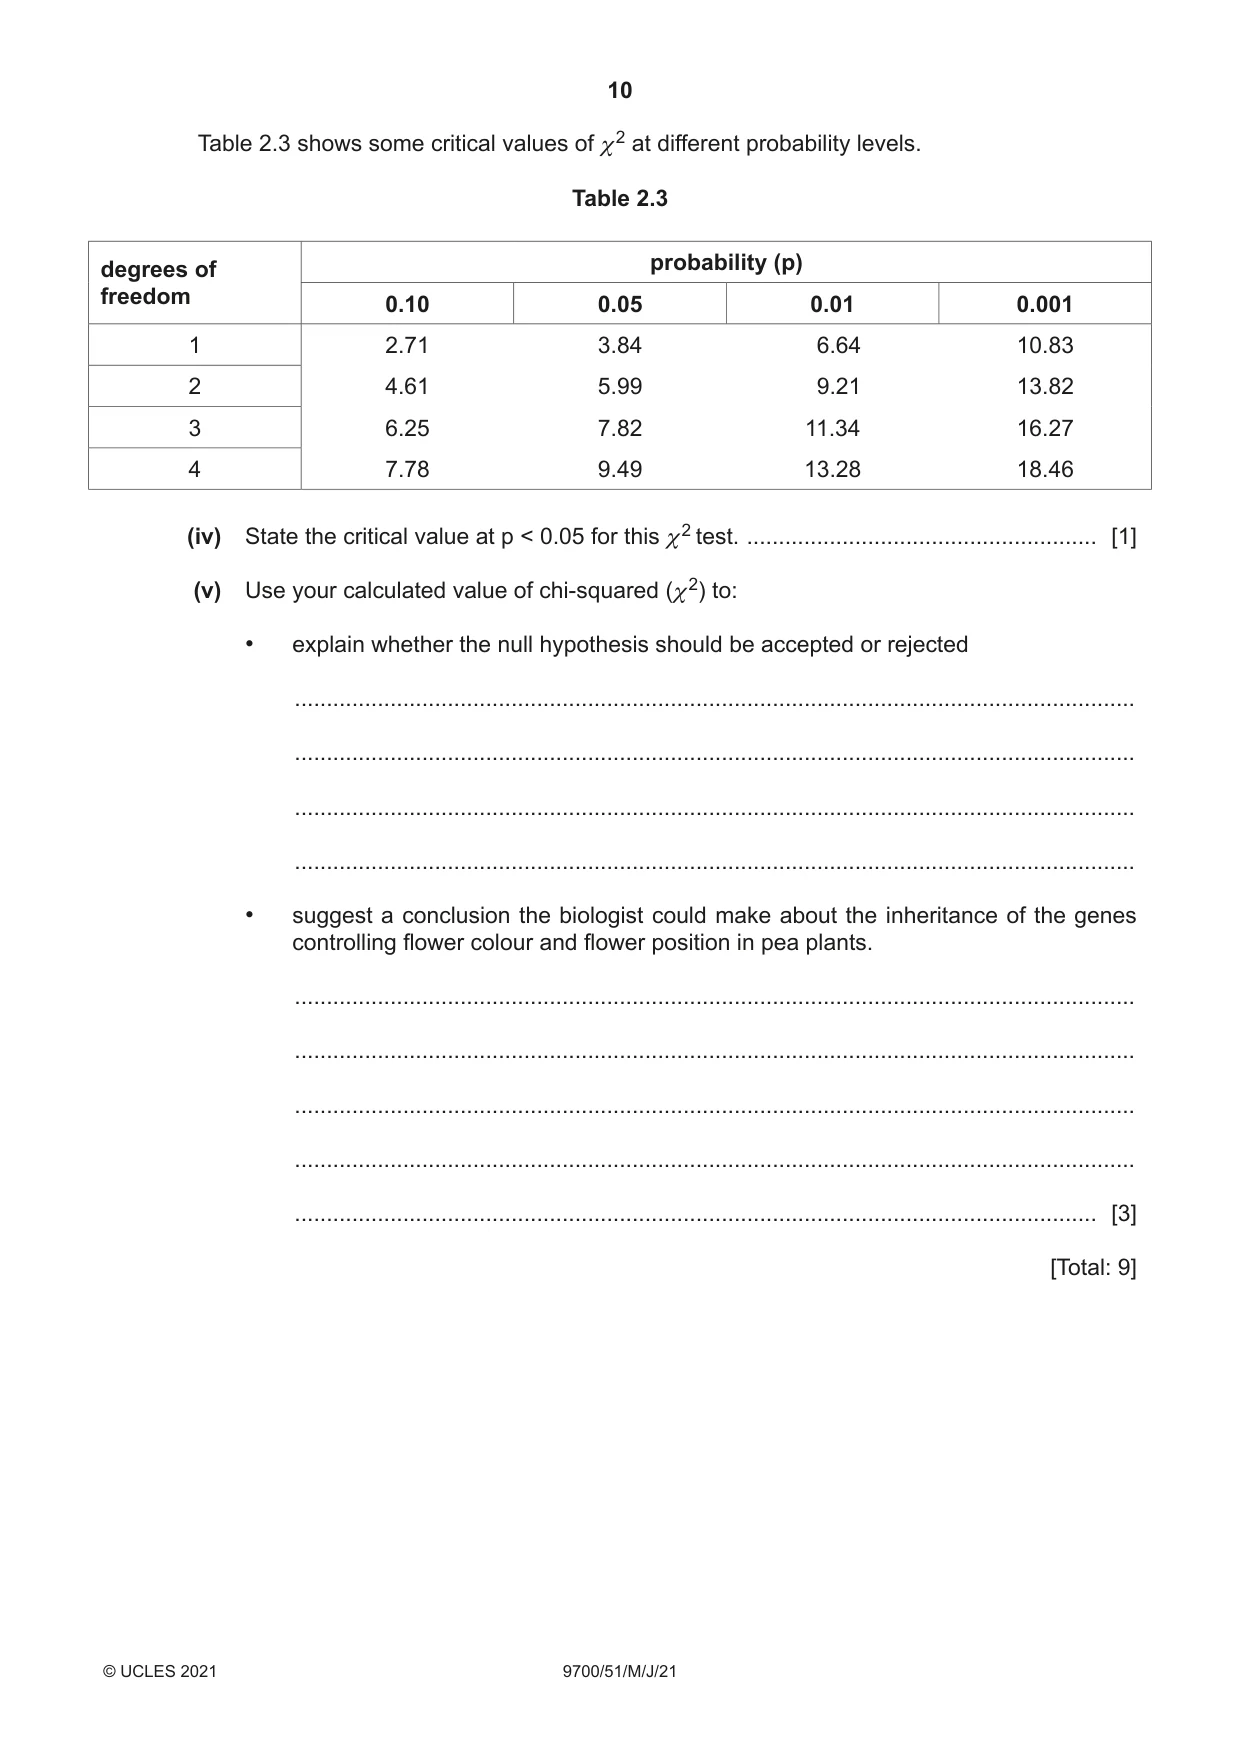
2 Inheritance of flower colour and flower position in pea plants are controlled by two genes. • Gene P/p controls flower colour. Allele P for purple flowers is dominant to allele p for white flowers. • Gene A/a controls flower position. Allele A for flowers growing from the side of the shoot (axial position) is dominant to allele a for flowers growing at the end of the shoot (terminal position), as shown in Fig. 2.1. flower position axial terminal Fig. 2.1 A biologist predicted that, if the genes are on different chromosomes, the ratio of the phenotypes of the F2 generation would be 9:3:3:1. The biologist carried out a breeding experiment. • Plants homozygous for white flowers and axial position were crossed with plants homozygous for purple flowers and axial position. • All the F1 plants had purple, axial flowers. • The F1 plants were crossed with each other. Table 2.1 shows the results for the F2 generation. Table 2.1 F2 phenotype frequency purple, axial flowers 1756 purple, terminal flowers 653 white, axial flowers 702 white, terminal flowers 234 total 3345 (a) The chi-squared test (χ2 test) was used to analyse the data in Table 2.1. (i) State one reason why the chi-squared test (χ2 test) was used. ........................................................................................................................................... ..................................................................................................................................... [1] (ii) State the null hypothesis that the biologist would use for this test. ........................................................................................................................................... ........................................................................................................................................... ..................................................................................................................................... [1] (iii) Complete Table 2.2 and calculate the value of χ2 for the results of the F2 generation. The equation for the calculation of χ2 is: O = observed result (O – E)2 E = expected result χ 2 = ∑ E ∑ = sum of Table 2.2 (O – E)2offspring phenotype O E E purple, axial flowers 1756 purple, terminal flowers 653 white, axial flowers 702 white, terminal flowers 234 2 χ = [3] Table 2.3 shows some critical values of χ2 at different probability levels. Table 2.3 probability (p)degrees of freedom 0.10 0.05 0.01 0.001 1 2.71 3.84 6.64 10.83 2 4.61 5.99 9.21 13.82 3 6.25 7.82 11.34 16.27 4 7.78 9.49 13.28 18.46 (iv) State the critical value at p < 0.05 for this χ2 test. ....................................................... [1] (v) Use your calculated value of chi-squared (χ2) to: • explain whether the null hypothesis should be accepted or rejected .................................................................................................................................... .................................................................................................................................... .................................................................................................................................... .................................................................................................................................... • suggest a conclusion the biologist could make about the inheritance of the genes controlling flower colour and flower position in pea plants. .................................................................................................................................... .................................................................................................................................... .................................................................................................................................... .................................................................................................................................... .............................................................................................................................. [3] [Total: 9]
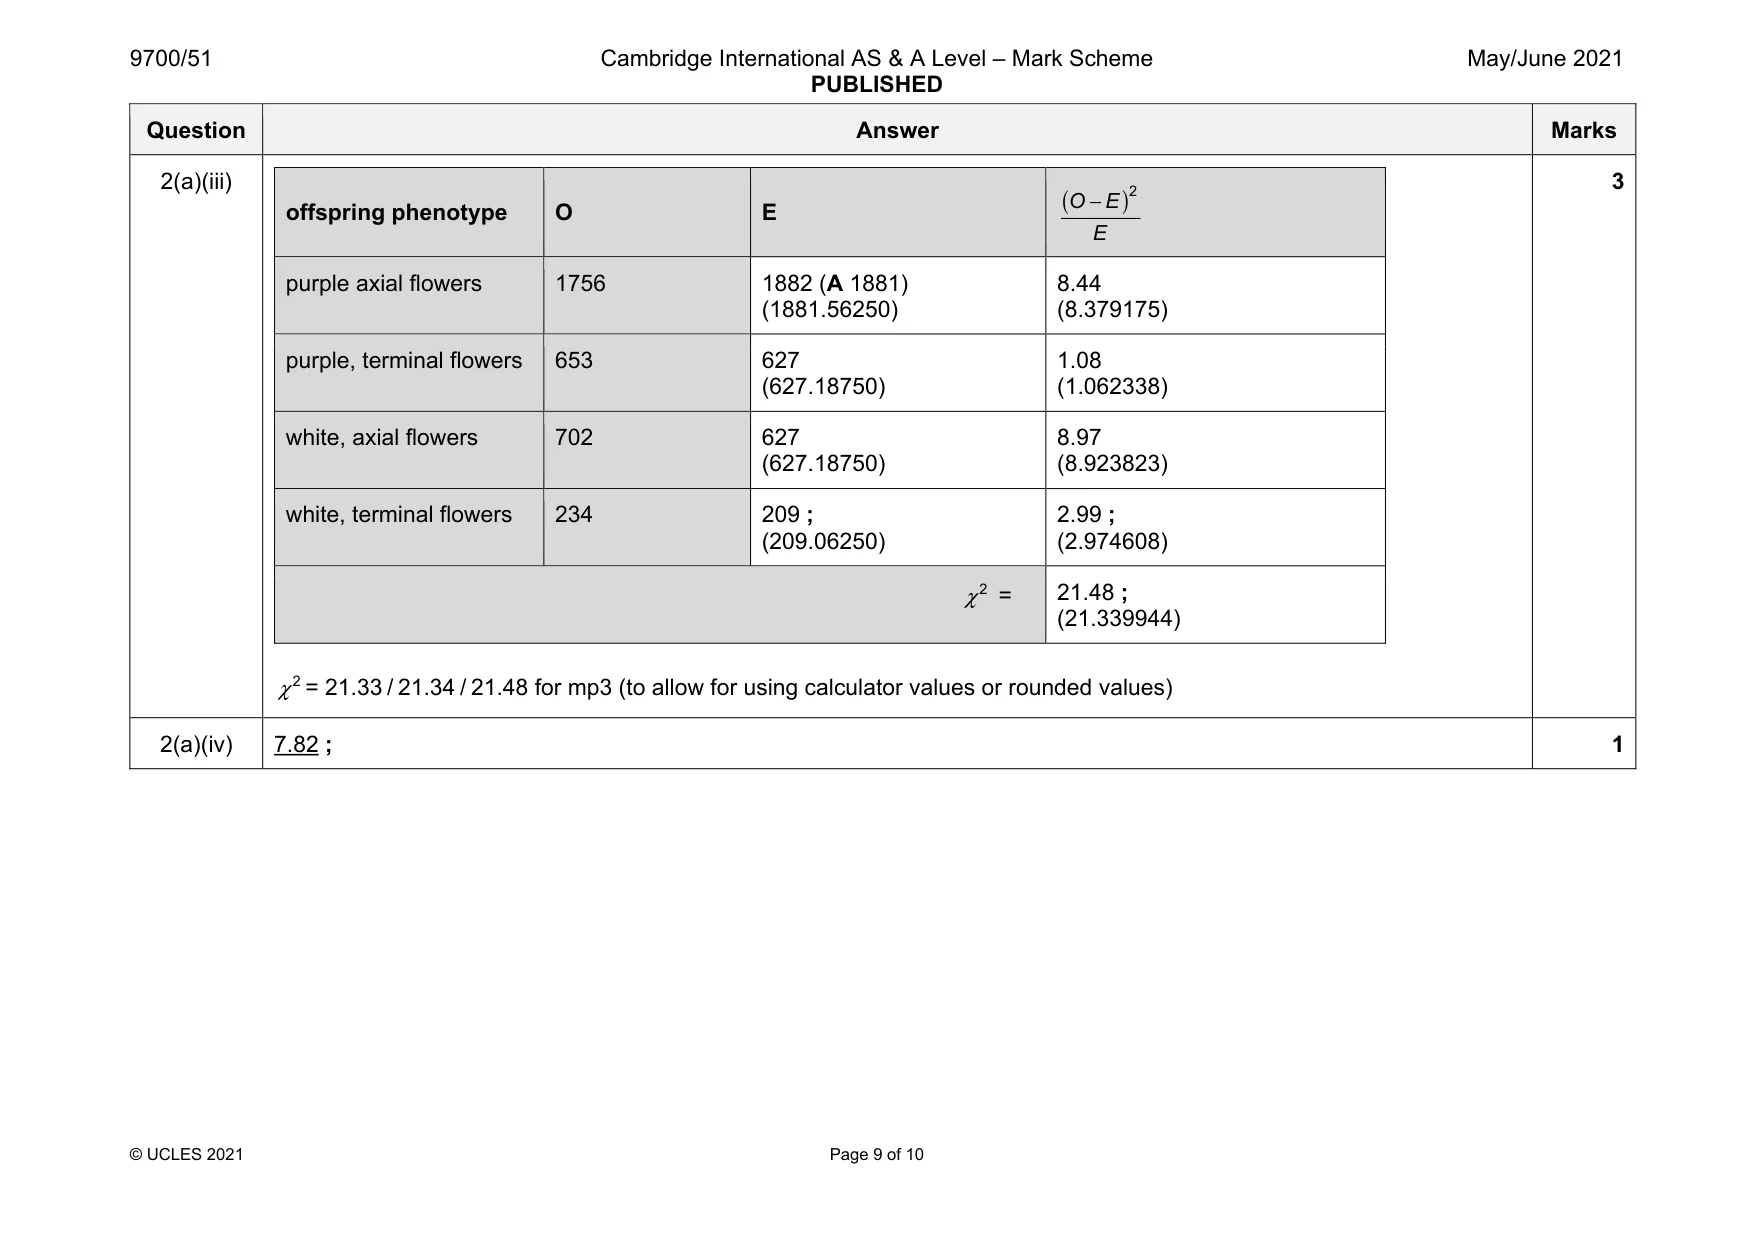
Mark scheme: 2(a)(i) idea of compare / AW, observed and expected (data / results / ratios / phenotypes) or data is categoric / discrete / discontinuous / nominal ; 1 2(a)(ii) idea of no (significant) difference between the observed and the expected (results) or idea of difference between observed and expected (results) is due to chance ; 1 Question Answer Marks 2(a)(iii) offspring phenotype O E ( ) 2 O E E − purple axial flowers 1756 1882 (A 1881) (1881.56250) 8.44 (8.379175) purple, terminal flowers 653 627 (627.18750) 1.08 (1.062338) white, axial flowers 702 627 (627.18750) 8.97 (8.923823) white, terminal flowers 234 209 ; (209.06250) 2.99 ; (2.974608) 2 χ = 21.48 ; (21.339944) 2 χ = 21.33 / 21.34 / 21.48 for mp3 (to allow for using calculator values or rounded values) 3 2(a)(iv) 7.82 ; 1 Question Answer Marks 2(a)(v) apply ecf as needed 1 reject (null hypothesis) and state that, the calculated value / 2 χ , is higher than, 7.82 / the critical value / the critical value they give in (iv) from the table ; 2 If null hypothesis rejected: (between O and E): there is a significant difference / the difference is not due to chance idea that there is a less than 5% probability that the difference is due to chance / there is a more than 95% probability that the difference is not due to chance ; 3 From mp1 If null hypothesis rejected or mp2 If there is a significant difference / AW stated idea that: genes are on the same chromosome / are not on different chromosomes / are linked / show autosomal linkage / do not assort independently ; A idea of, ‘may be / can be’, throughout 3
What was in this paper
The subtopics covered by these 2 questions, and how many questions each got. Open one in a new tab to see every Cambridge question on it.
What you needed in this session
Cambridge’s own grade thresholds for 2021 May/June, Paper 5 · Variant 1. A higher threshold means an easier paper — the bar moves with how the cohort did.