Cambridge A Level Biology 9700 — 2021 Feb/March Paper 5 · Variant 2
9700/52/F/M/21 · 2 questions · 30 marks · ≈34 min
The question paper and its mark scheme, free to read here and free to download. This is Cambridge’s own paper, exactly as it was sat.
Question paper12 pages


Mark scheme9 pages
Answers below. Sit the paper first if you are practising.
Questions as text
Q1 · Students at a college often took a shortcut between the library and the tennis courts…
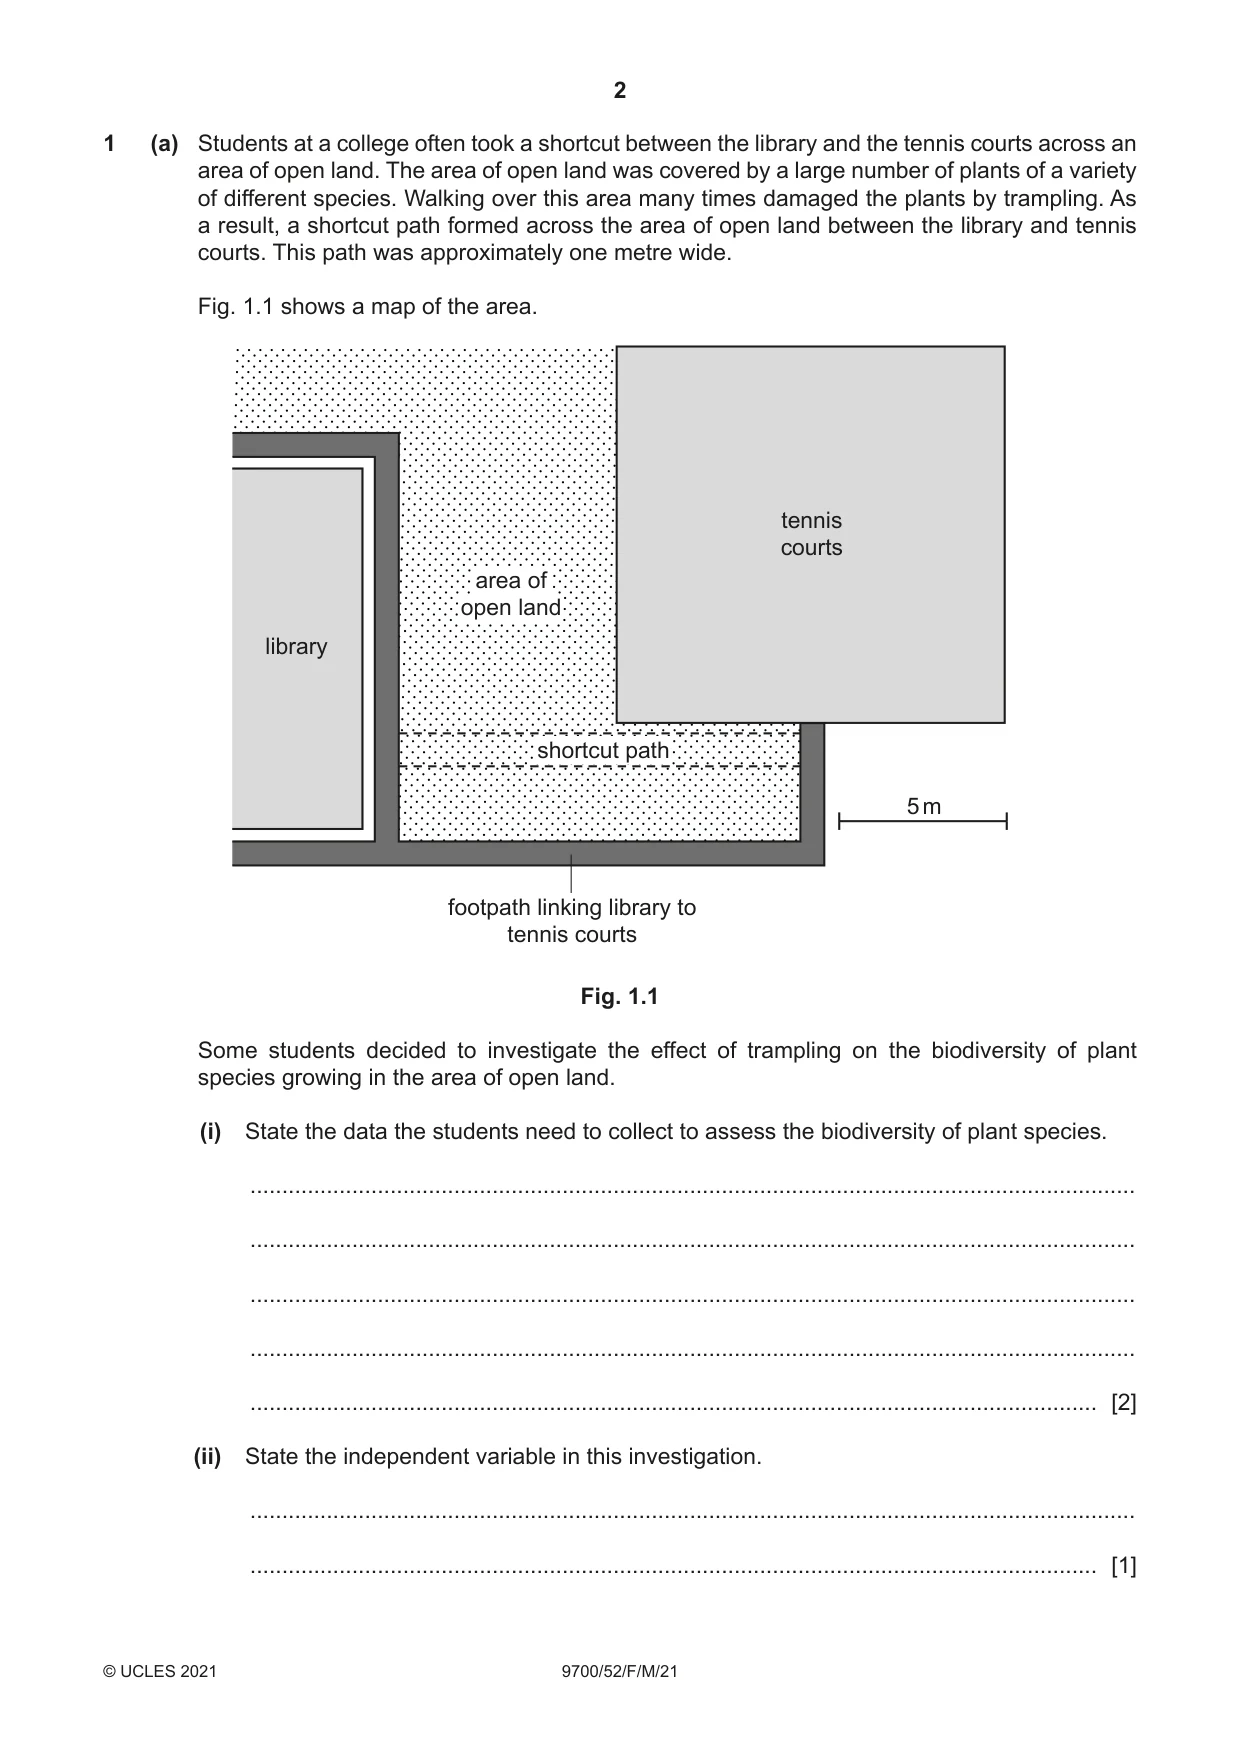
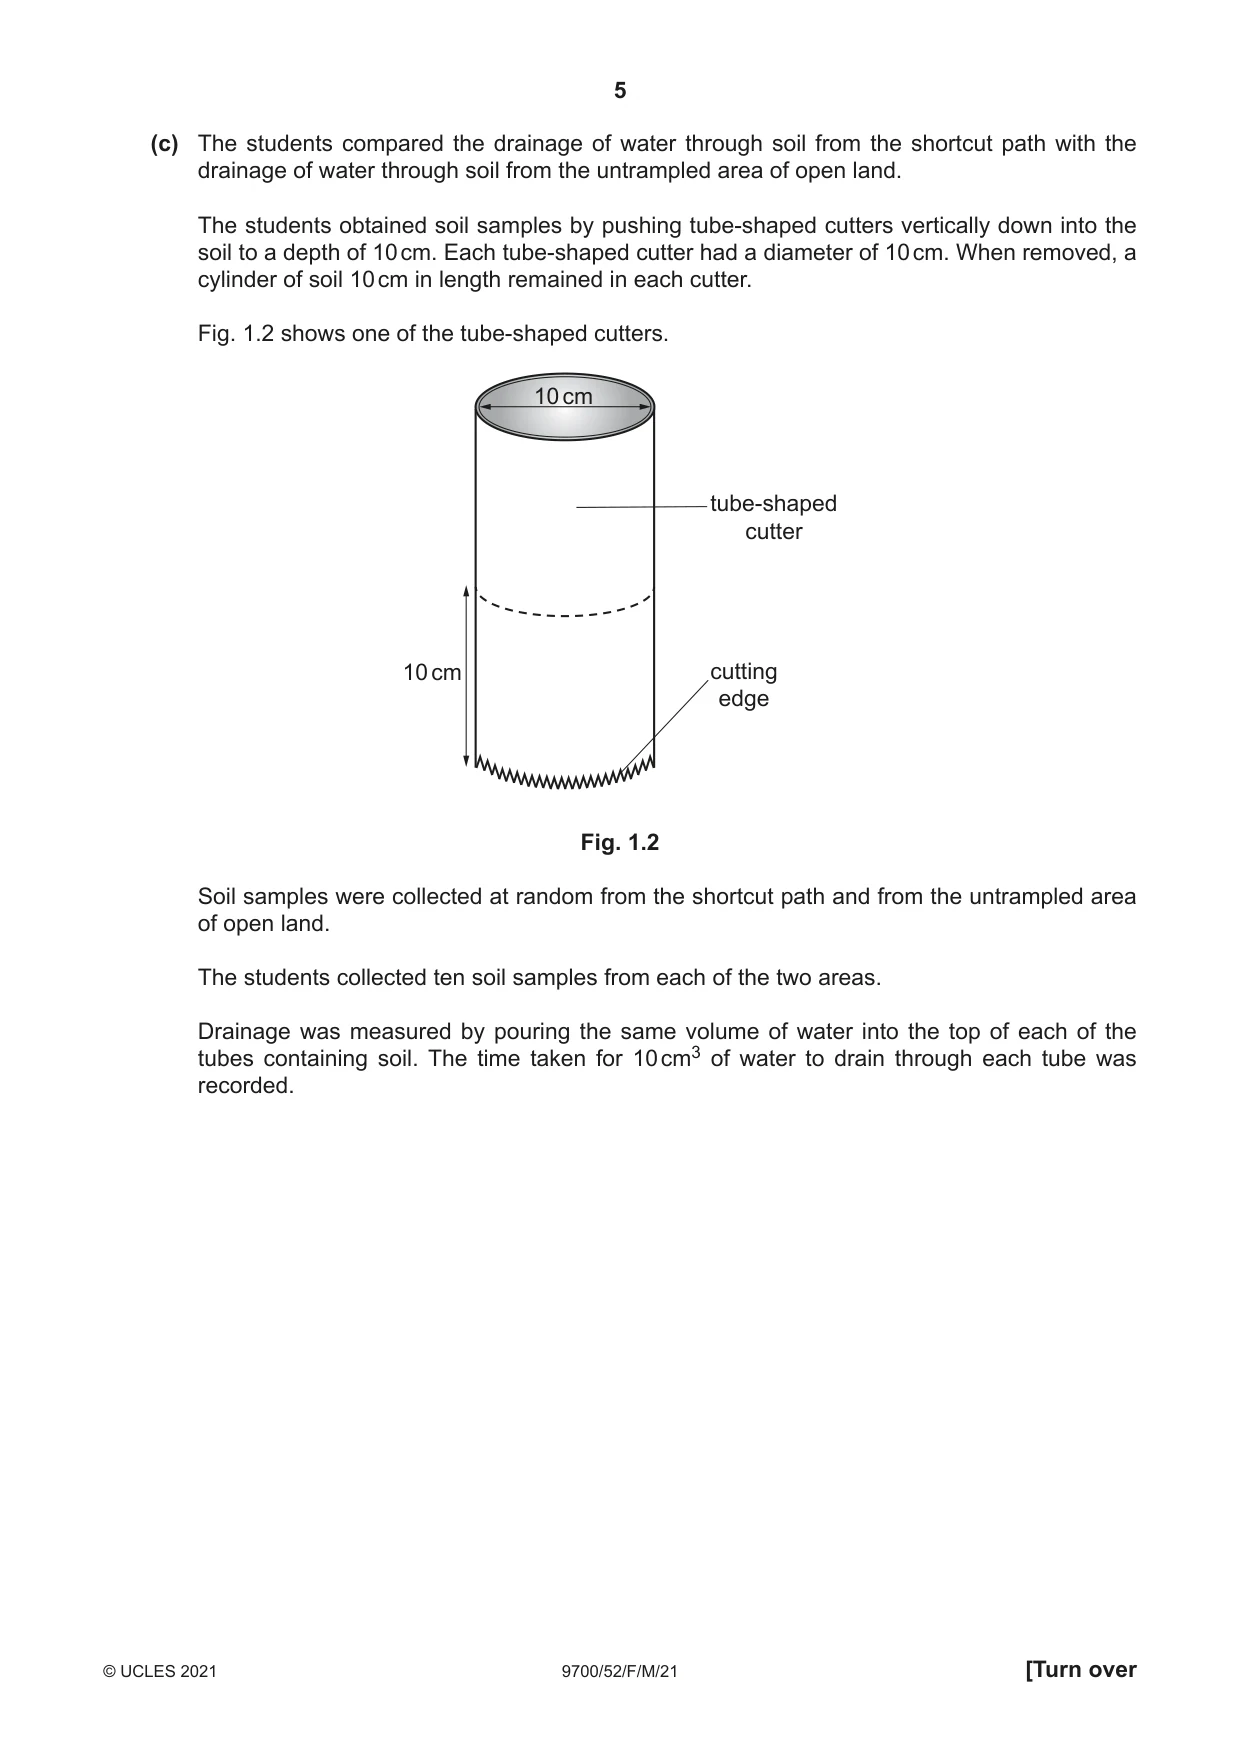
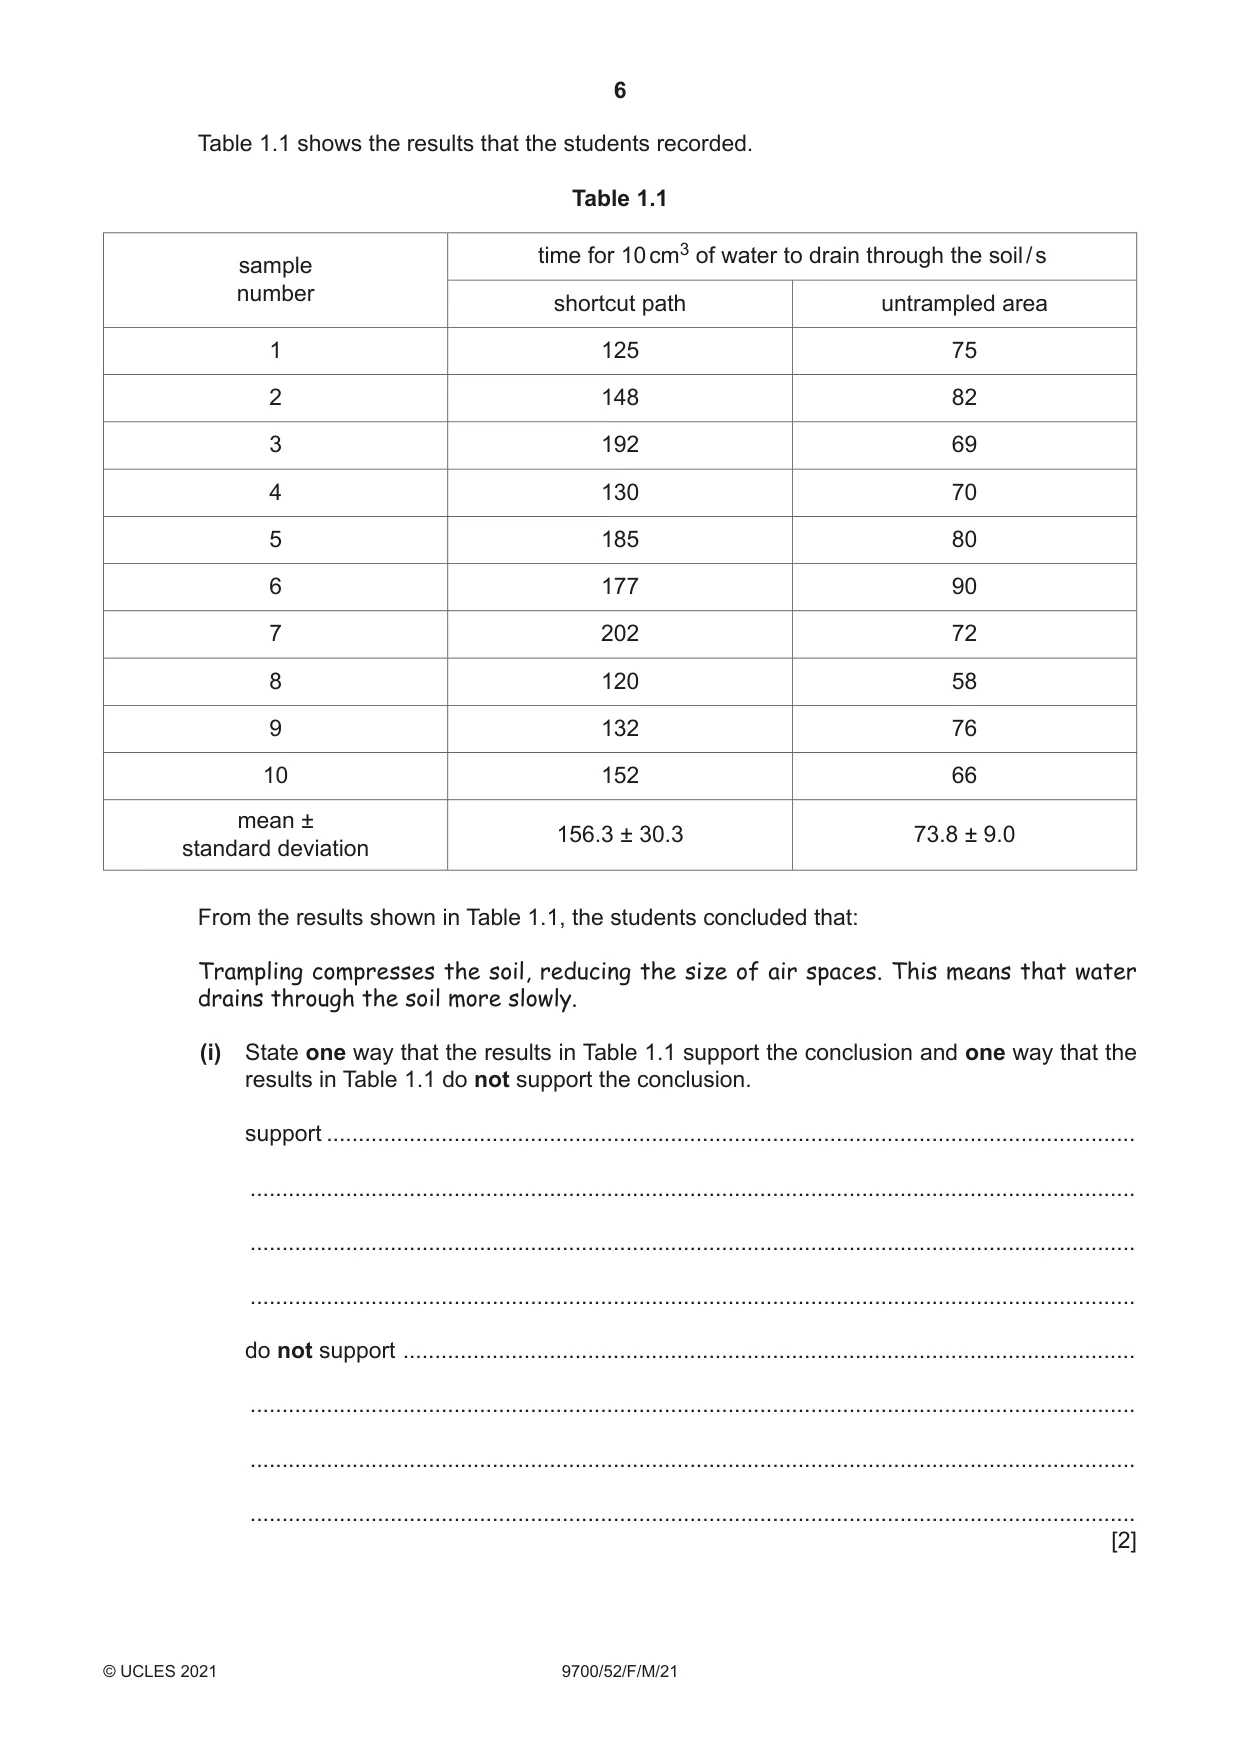
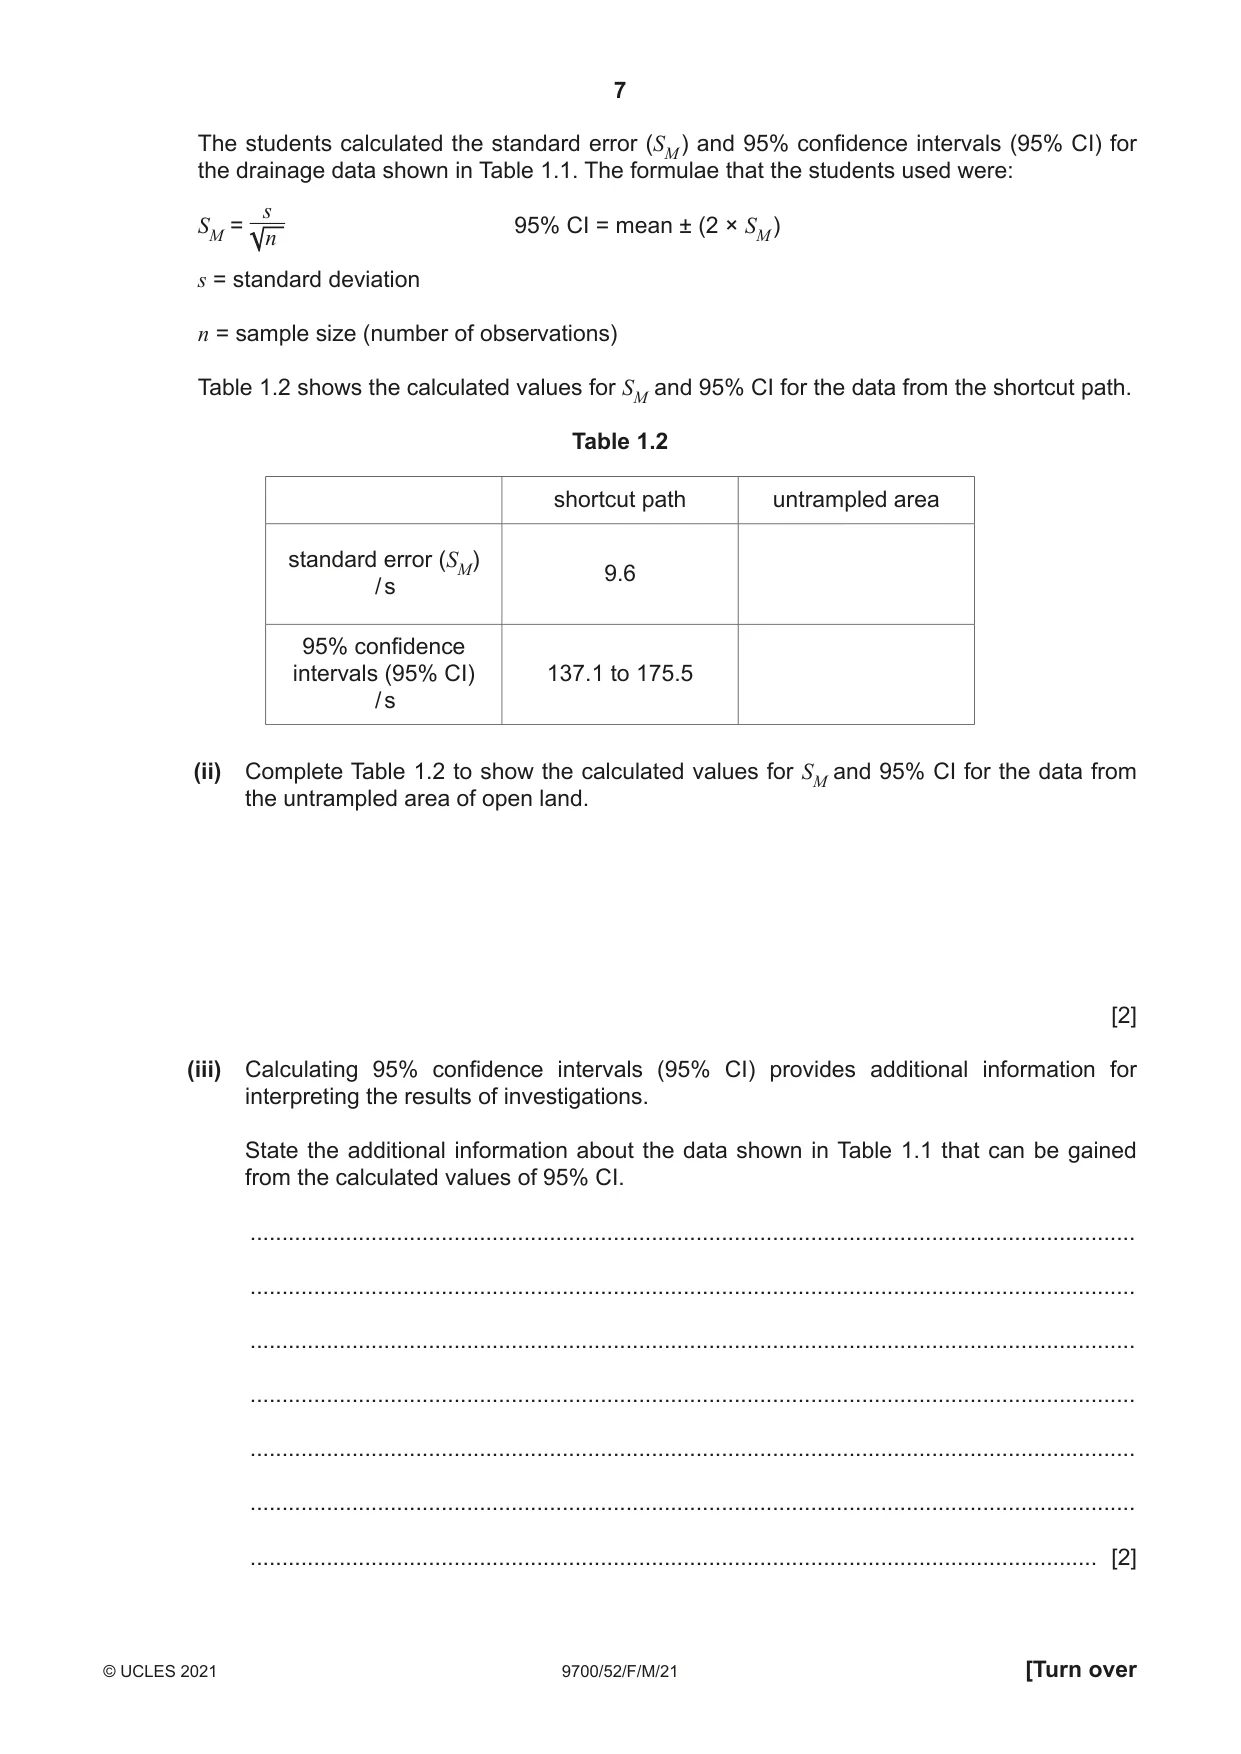
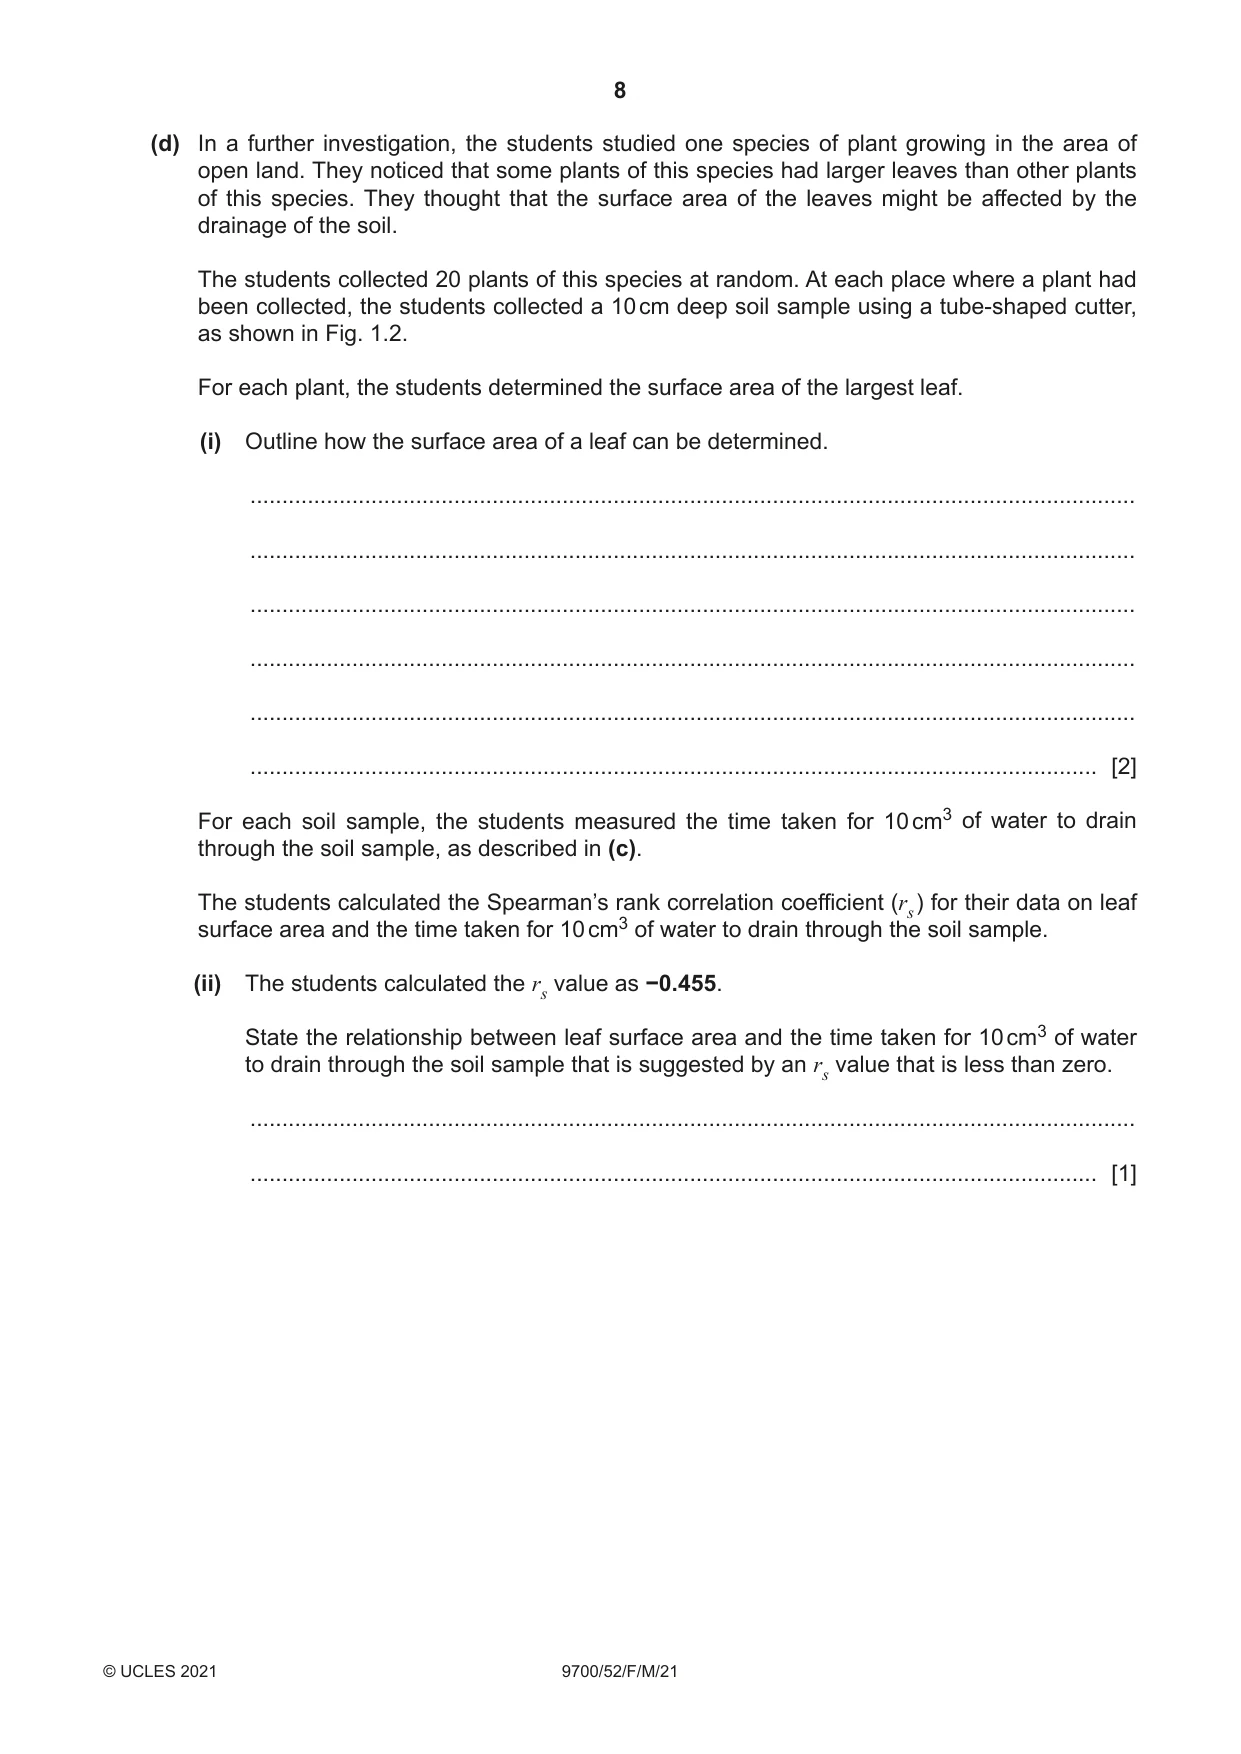
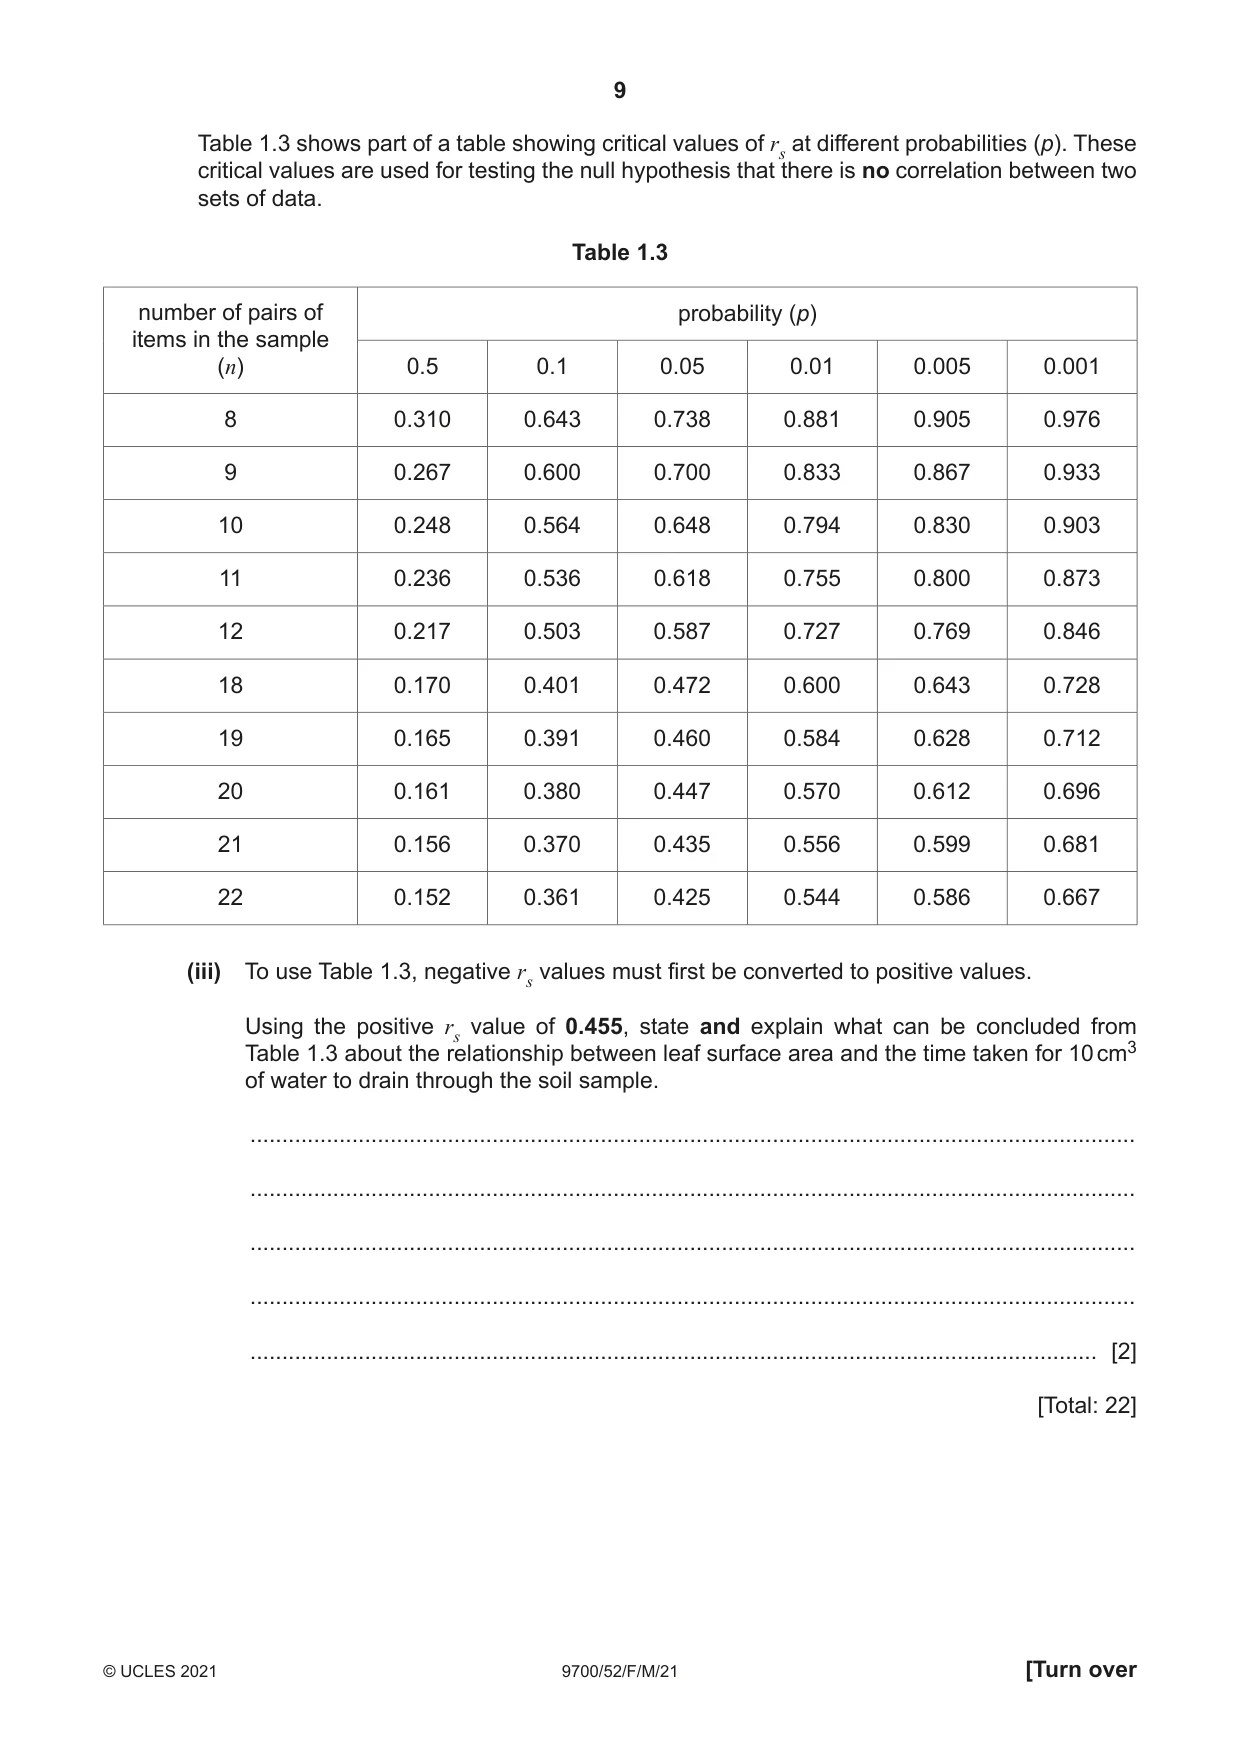
1 (a) Students at a college often took a shortcut between the library and the tennis courts across an area of open land. The area of open land was covered by a large number of plants of a variety of different species. Walking over this area many times damaged the plants by trampling. As a result, a shortcut path formed across the area of open land between the library and tennis courts. This path was approximately one metre wide. Fig. 1.1 shows a map of the area. tennis courts area of open land library shortcut path 5 m footpath linking library to tennis courts Fig. 1.1 Some students decided to investigate the effect of trampling on the biodiversity of plant species growing in the area of open land. (i) State the data the students need to collect to assess the biodiversity of plant species. ........................................................................................................................................... ........................................................................................................................................... ........................................................................................................................................... ........................................................................................................................................... ..................................................................................................................................... [2] (ii) State the independent variable in this investigation. ........................................................................................................................................... ..................................................................................................................................... [1] (b) Describe a method the students could use to compare the biodiversity of plant species growing in the area of untrampled open land with the biodiversity of plant species growing on the shortcut path. Your method should be set out in a logical order and be detailed enough to let another person follow it. ................................................................................................................................................... ................................................................................................................................................... ................................................................................................................................................... ................................................................................................................................................... ................................................................................................................................................... ................................................................................................................................................... ................................................................................................................................................... ................................................................................................................................................... ................................................................................................................................................... ................................................................................................................................................... ................................................................................................................................................... ................................................................................................................................................... ................................................................................................................................................... ................................................................................................................................................... ................................................................................................................................................... ................................................................................................................................................... ................................................................................................................................................... ................................................................................................................................................... ................................................................................................................................................... ................................................................................................................................................... ................................................................................................................................................... ................................................................................................................................................... ................................................................................................................................................... ............................................................................................................................................. [8] Question 1 continues on page 5 (c) The students compared the drainage of water through soil from the shortcut path with the drainage of water through soil from the untrampled area of open land. The students obtained soil samples by pushing tube-shaped cutters vertically down into the soil to a depth of 10 cm. Each tube-shaped cutter had a diameter of 10 cm. When removed, a cylinder of soil 10 cm in length remained in each cutter. Fig. 1.2 shows one of the tube-shaped cutters. 10 cm tube-shaped cutter 10 cm cutting edge Fig. 1.2 Soil samples were collected at random from the shortcut path and from the untrampled area of open land. The students collected ten soil samples from each of the two areas. Drainage was measured by pouring the same volume of water into the top of each of the tubes containing soil. The time taken for 10 cm3 of water to drain through each tube was recorded. Table 1.1 shows the results that the students recorded. Table 1.1 time for 10 cm3 of water to drain through the soil / s sample number shortcut path untrampled area 1 125 75 2 148 82 3 192 69 4 130 70 5 185 80 6 177 90 7 202 72 8 120 58 9 132 76 10 152 66 mean ± 156.3 ± 30.3 73.8 ± 9.0standard deviation From the results shown in Table 1.1, the students concluded that: Trampling compresses the soil, reducing the size of air spaces. This means that water drains through the soil more slowly. (i) State one way that the results in Table 1.1 support the conclusion and one way that the results in Table 1.1 do not support the conclusion. support ............................................................................................................................... ........................................................................................................................................... ........................................................................................................................................... ........................................................................................................................................... do not support ................................................................................................................... ........................................................................................................................................... ........................................................................................................................................... ........................................................................................................................................... [2] The students calculated the standard error (SM ) and 95% confidence intervals (95% CI) for the drainage data shown in Table 1.1. The formulae that the students used were: s SM = 95% CI = mean ± (2 × SM ) n s = standard deviation n = sample size (number of observations) Table 1.2 shows the calculated values for SM and 95% CI for the data from the shortcut path. Table 1.2 shortcut path untrampled area standard error (SM) 9.6 / s 95% confidence intervals (95% CI) 137.1 to 175.5 / s (ii) Complete Table 1.2 to show the calculated values for SM and 95% CI for the data from the untrampled area of open land. [2] (iii) Calculating 95% confidence intervals (95% CI) provides additional information for interpreting the results of investigations. State the additional information about the data shown in Table 1.1 that can be gained from the calculated values of 95% CI. ........................................................................................................................................... ........................................................................................................................................... ........................................................................................................................................... ........................................................................................................................................... ........................................................................................................................................... ........................................................................................................................................... ..................................................................................................................................... [2] (d) In a further investigation, the students studied one species of plant growing in the area of open land. They noticed that some plants of this species had larger leaves than other plants of this species. They thought that the surface area of the leaves might be affected by the drainage of the soil. The students collected 20 plants of this species at random. At each place where a plant had been collected, the students collected a 10 cm deep soil sample using a tube-shaped cutter, as shown in Fig. 1.2. For each plant, the students determined the surface area of the largest leaf. (i) Outline how the surface area of a leaf can be determined. ........................................................................................................................................... ........................................................................................................................................... ........................................................................................................................................... ........................................................................................................................................... ........................................................................................................................................... ..................................................................................................................................... [2] For each soil sample, the students measured the time taken for 10 cm3 of water to drain through the soil sample, as described in (c). The students calculated the Spearman’s rank correlation coefficient (rs ) for their data on leaf surface area and the time taken for 10 cm3 of water to drain through the soil sample. (ii) The students calculated the rs value as −0.455. State the relationship between leaf surface area and the time taken for 10 cm3 of water to drain through the soil sample that is suggested by an rs value that is less than zero. ........................................................................................................................................... ..................................................................................................................................... [1] Table 1.3 shows part of a table showing critical values of rs at different probabilities (p). These critical values are used for testing the null hypothesis that there is no correlation between two sets of data. Table 1.3 number of pairs of probability (p) items in the sample (n) 0.5 0.1 0.05 0.01 0.005 0.001 8 0.310 0.643 0.738 0.881 0.905 0.976 9 0.267 0.600 0.700 0.833 0.867 0.933 10 0.248 0.564 0.648 0.794 0.830 0.903 11 0.236 0.536 0.618 0.755 0.800 0.873 12 0.217 0.503 0.587 0.727 0.769 0.846 18 0.170 0.401 0.472 0.600 0.643 0.728 19 0.165 0.391 0.460 0.584 0.628 0.712 20 0.161 0.380 0.447 0.570 0.612 0.696 21 0.156 0.370 0.435 0.556 0.599 0.681 22 0.152 0.361 0.425 0.544 0.586 0.667 (iii) To use Table 1.3, negative rs values must first be converted to positive values. Using the positive rs value of 0.455, state and explain what can be concluded from Table 1.3 about the relationship between leaf surface area and the time taken for 10 cm3 of water to drain through the soil sample. ........................................................................................................................................... ........................................................................................................................................... ........................................................................................................................................... ........................................................................................................................................... ..................................................................................................................................... [2] [Total: 22]
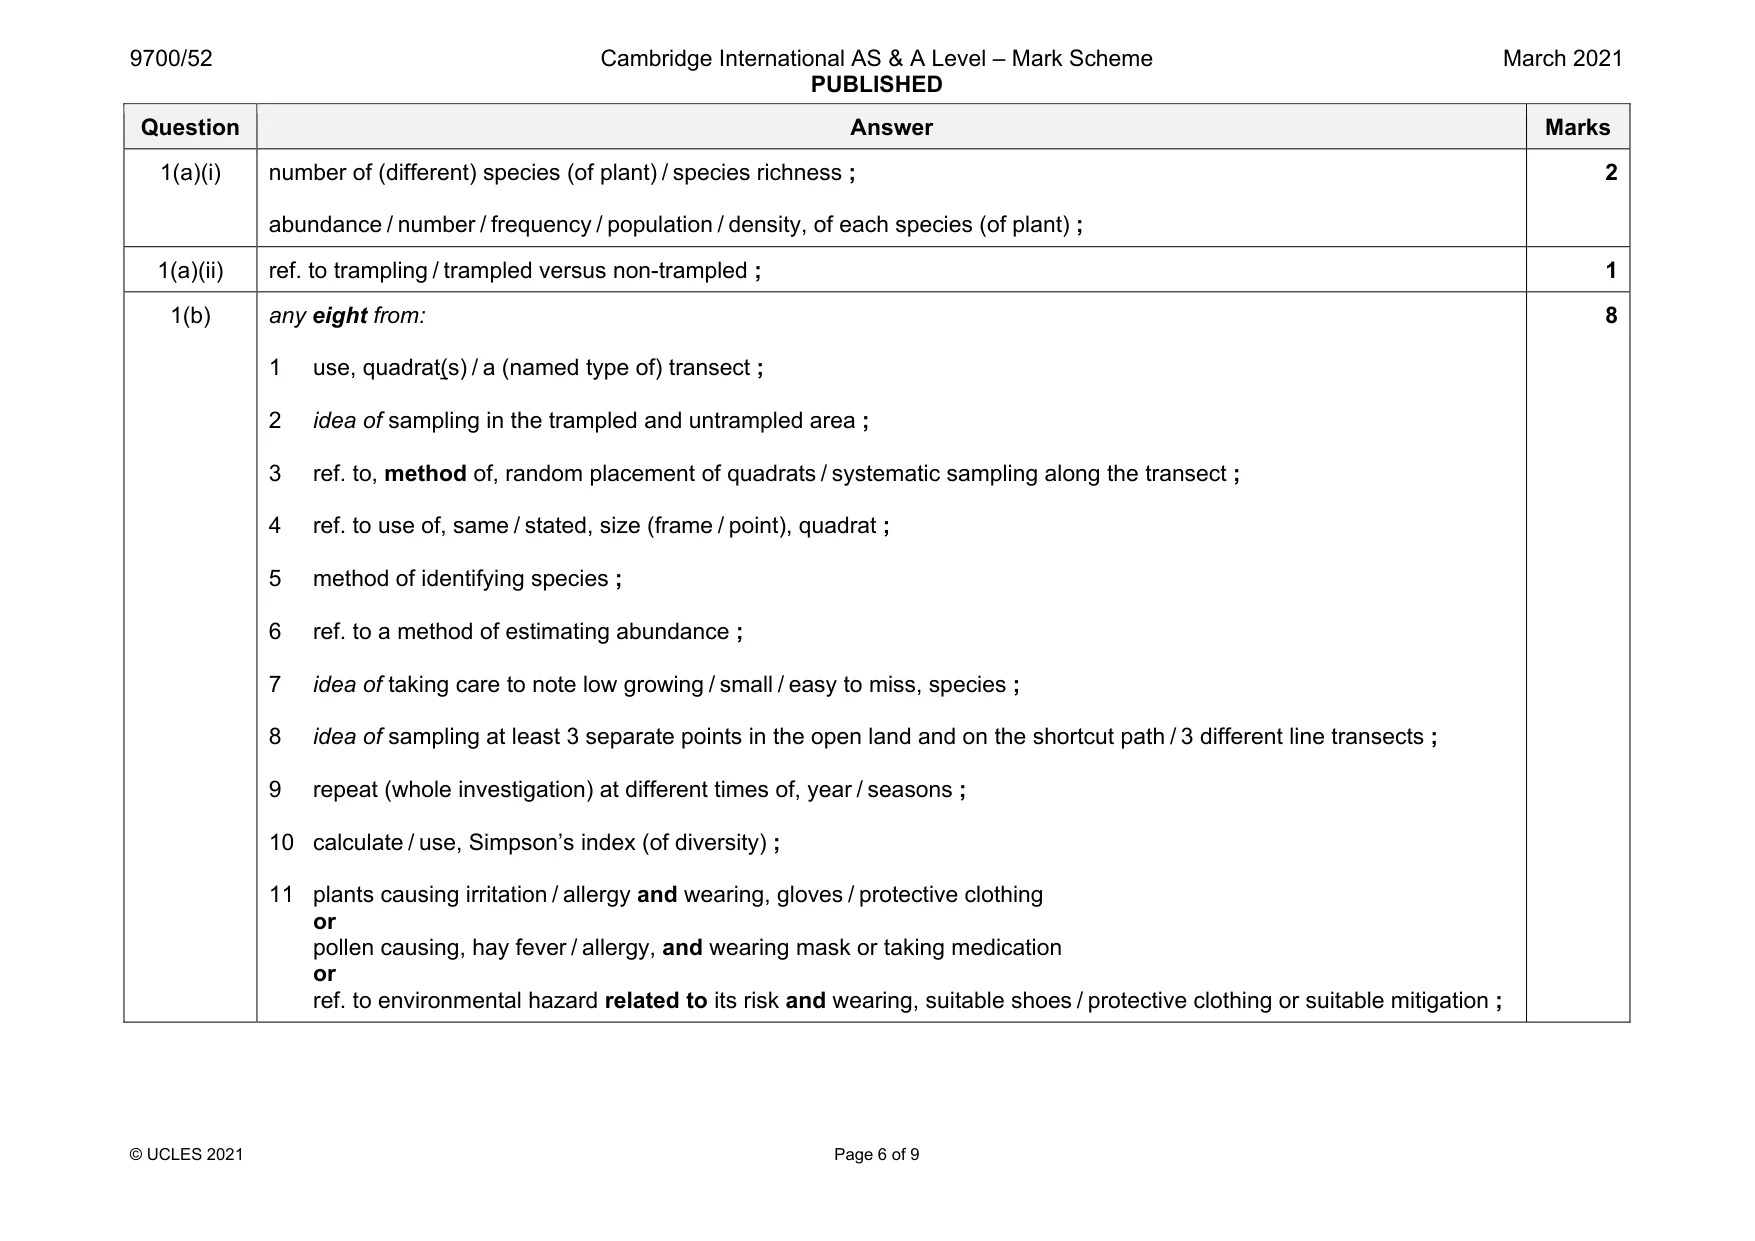
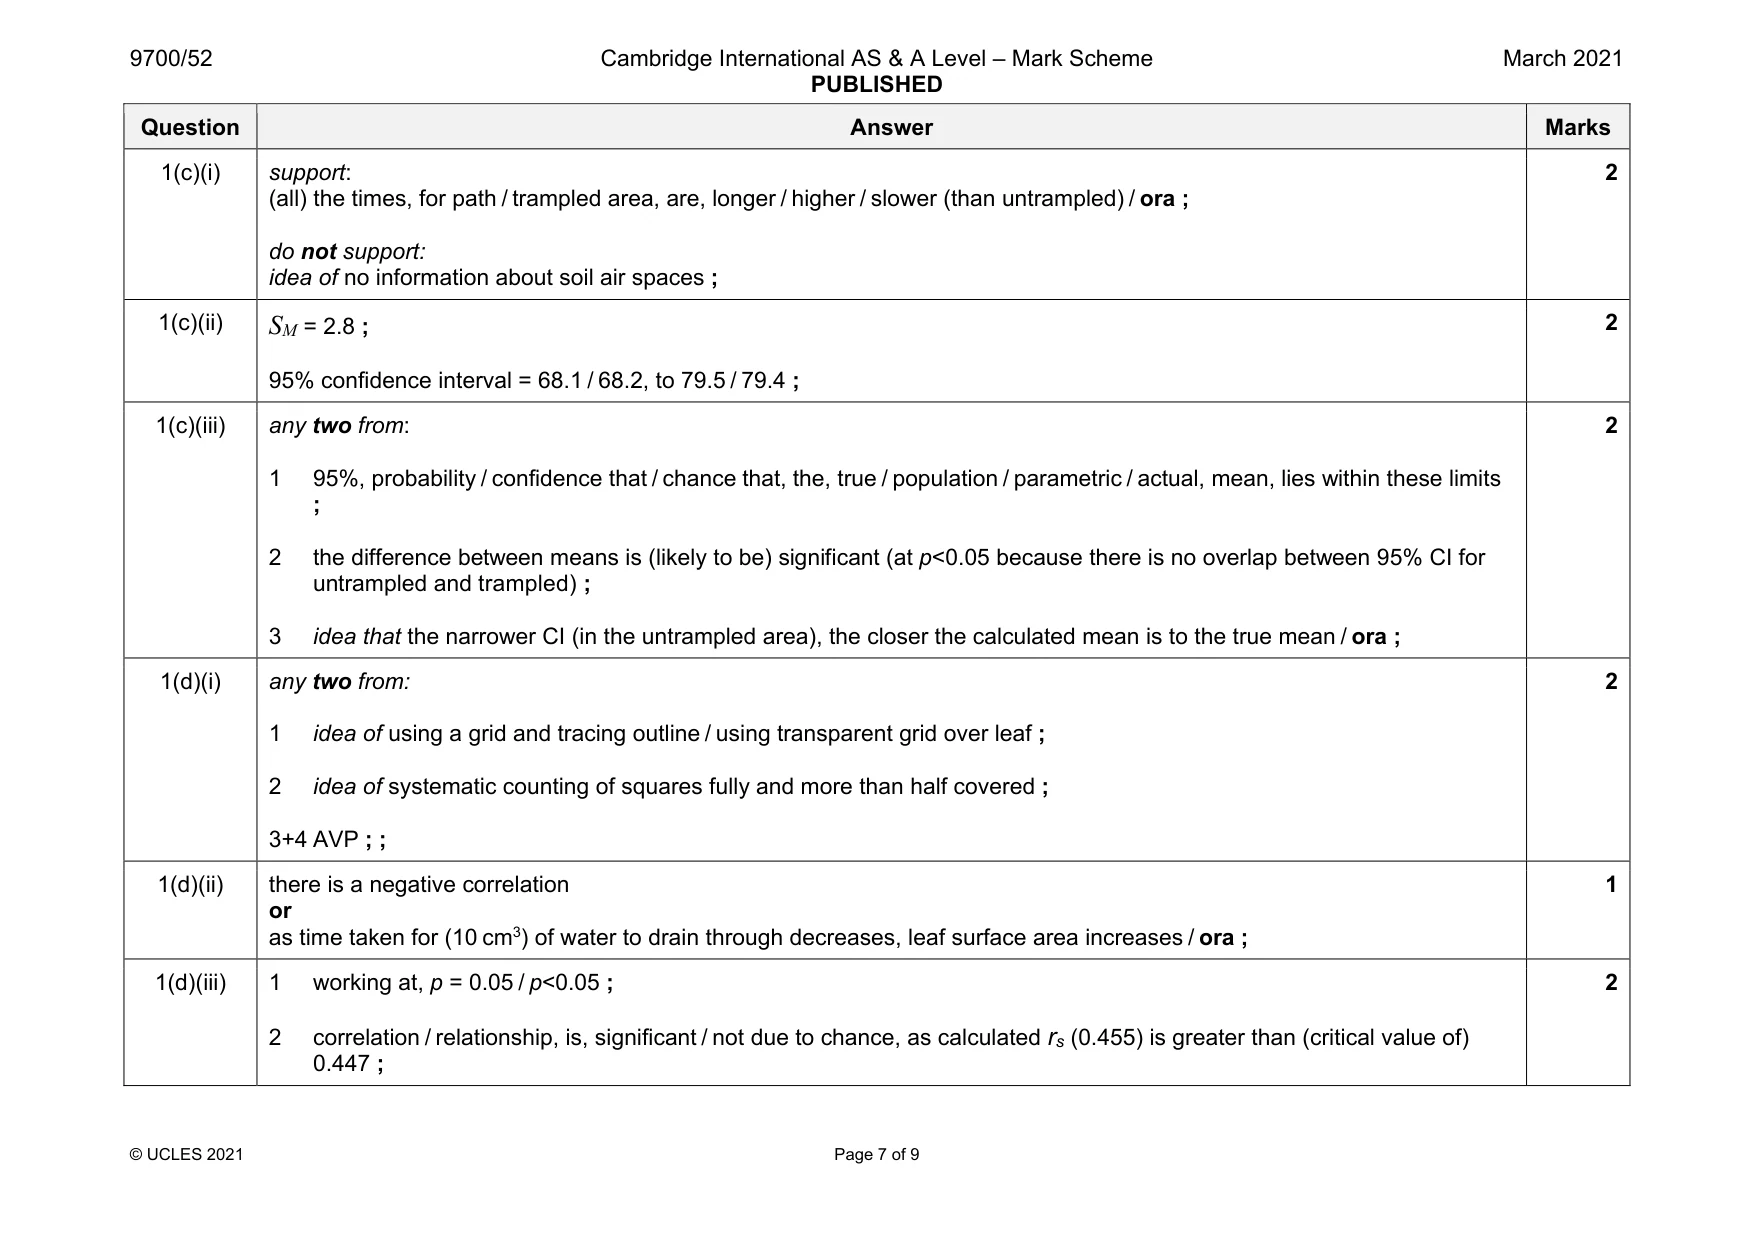
Mark scheme: 1(a)(i) number of (different) species (of plant) / species richness ; abundance / number / frequency / population / density, of each species (of plant) ; 2 1(a)(ii) ref. to trampling / trampled versus non-trampled ; 1 1(b) any eight from: 1 use, quadrat(s) / a (named type of) transect ; 2 idea of sampling in the trampled and untrampled area ; 3 ref. to, method of, random placement of quadrats / systematic sampling along the transect ; 4 ref. to use of, same / stated, size (frame / point), quadrat ; 5 method of identifying species ; 6 ref. to a method of estimating abundance ; 7 idea of taking care to note low growing / small / easy to miss, species ; 8 idea of sampling at least 3 separate points in the open land and on the shortcut path / 3 different line transects ; 9 repeat (whole investigation) at different times of, year / seasons ; 10 calculate / use, Simpson’s index (of diversity) ; 11 plants causing irritation / allergy and wearing, gloves / protective clothing or pollen causing, hay fever / allergy, and wearing mask or taking medication or ref. to environmental hazard related to its risk and wearing, suitable shoes / protective clothing or suitable mitigation ; 8 Question Answer Marks 1(c)(i) support: (all) the times, for path / trampled area, are, longer / higher / slower (than untrampled) / ora ; do not support: idea of no information about soil air spaces ; 2 1(c)(ii) SM = 2.8 ; 95% confidence interval = 68.1 / 68.2, to 79.5 / 79.4 ; 2 1(c)(iii) any two from: 1 95%, probability / confidence that / chance that, the, true / population / parametric / actual, mean, lies within these limits ; 2 the difference between means is (likely to be) significant (at p<0.05 because there is no overlap between 95% CI for untrampled and trampled) ; 3 idea that the narrower CI (in the untrampled area), the closer the calculated mean is to the true mean / ora ; 2 1(d)(i) any two from: 1 idea of using a grid and tracing outline / using transparent grid over leaf ; 2 idea of systematic counting of squares fully and more than half covered ; 3+4 AVP ; ; 2 1(d)(ii) there is a negative correlation or as time taken for (10 cm3) of water to drain through decreases, leaf surface area increases / ora ; 1 1(d)(iii) 1 working at, p = 0.05 / p<0.05 ; 2 correlation / relationship, is, significant / not due to chance, as calculated rs (0.455) is greater than (critical value of) 0.447 ; 2
Q2 · Indigo carmine is a water-soluble indicator
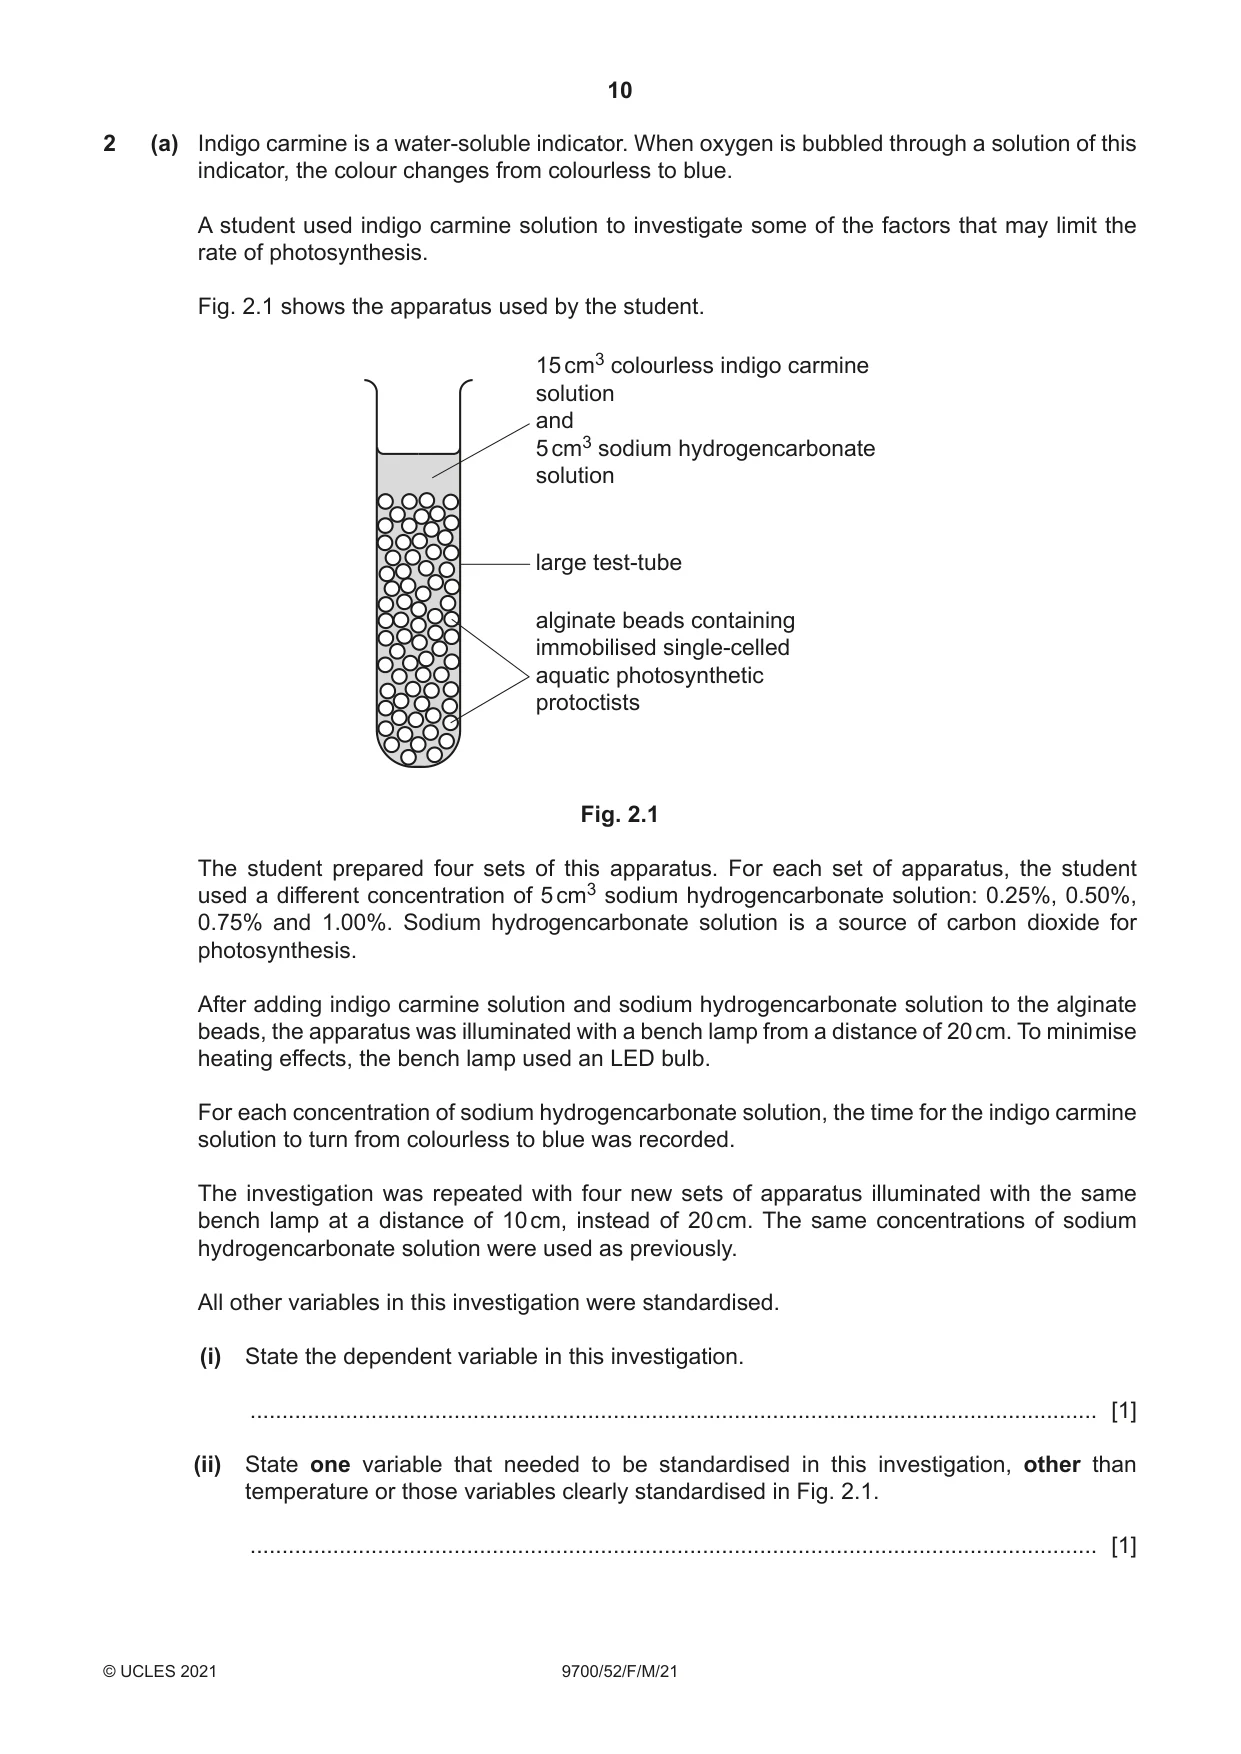
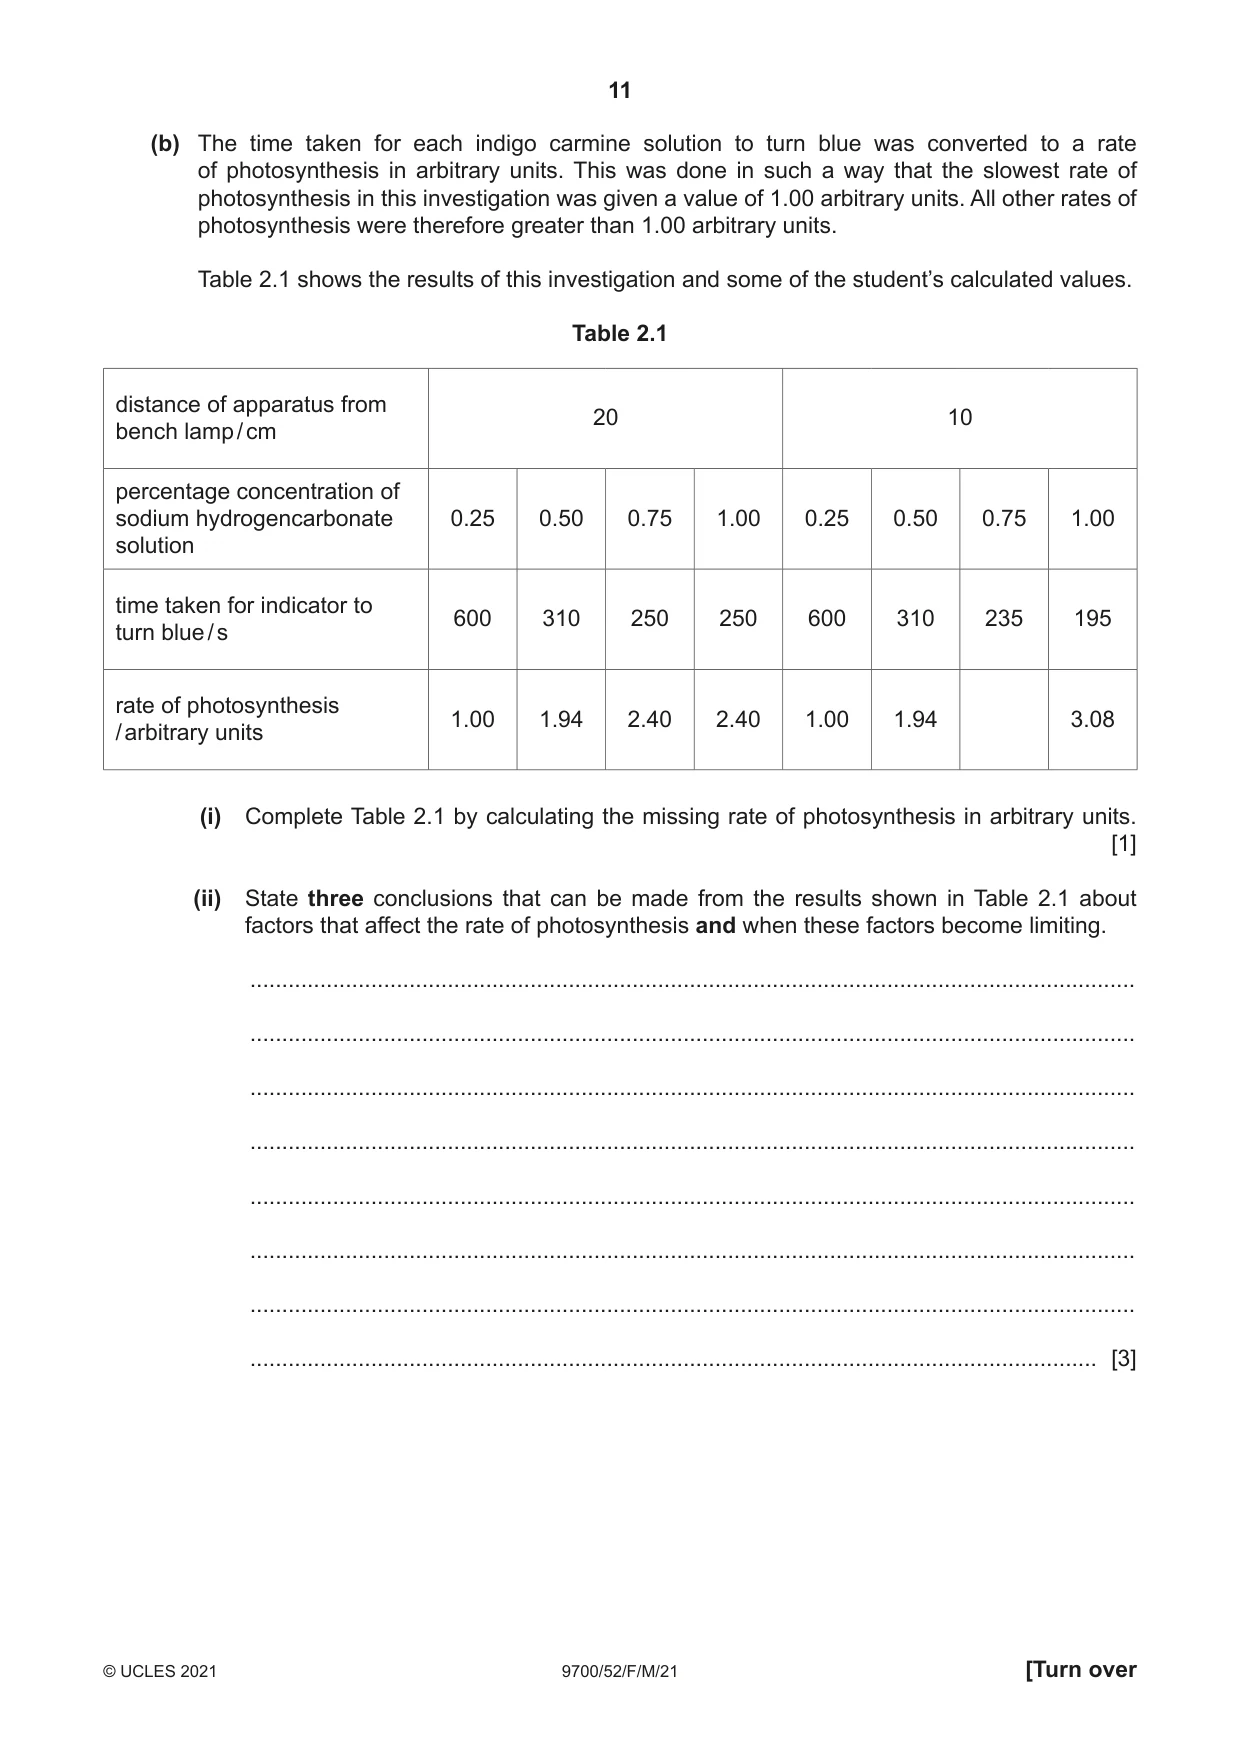
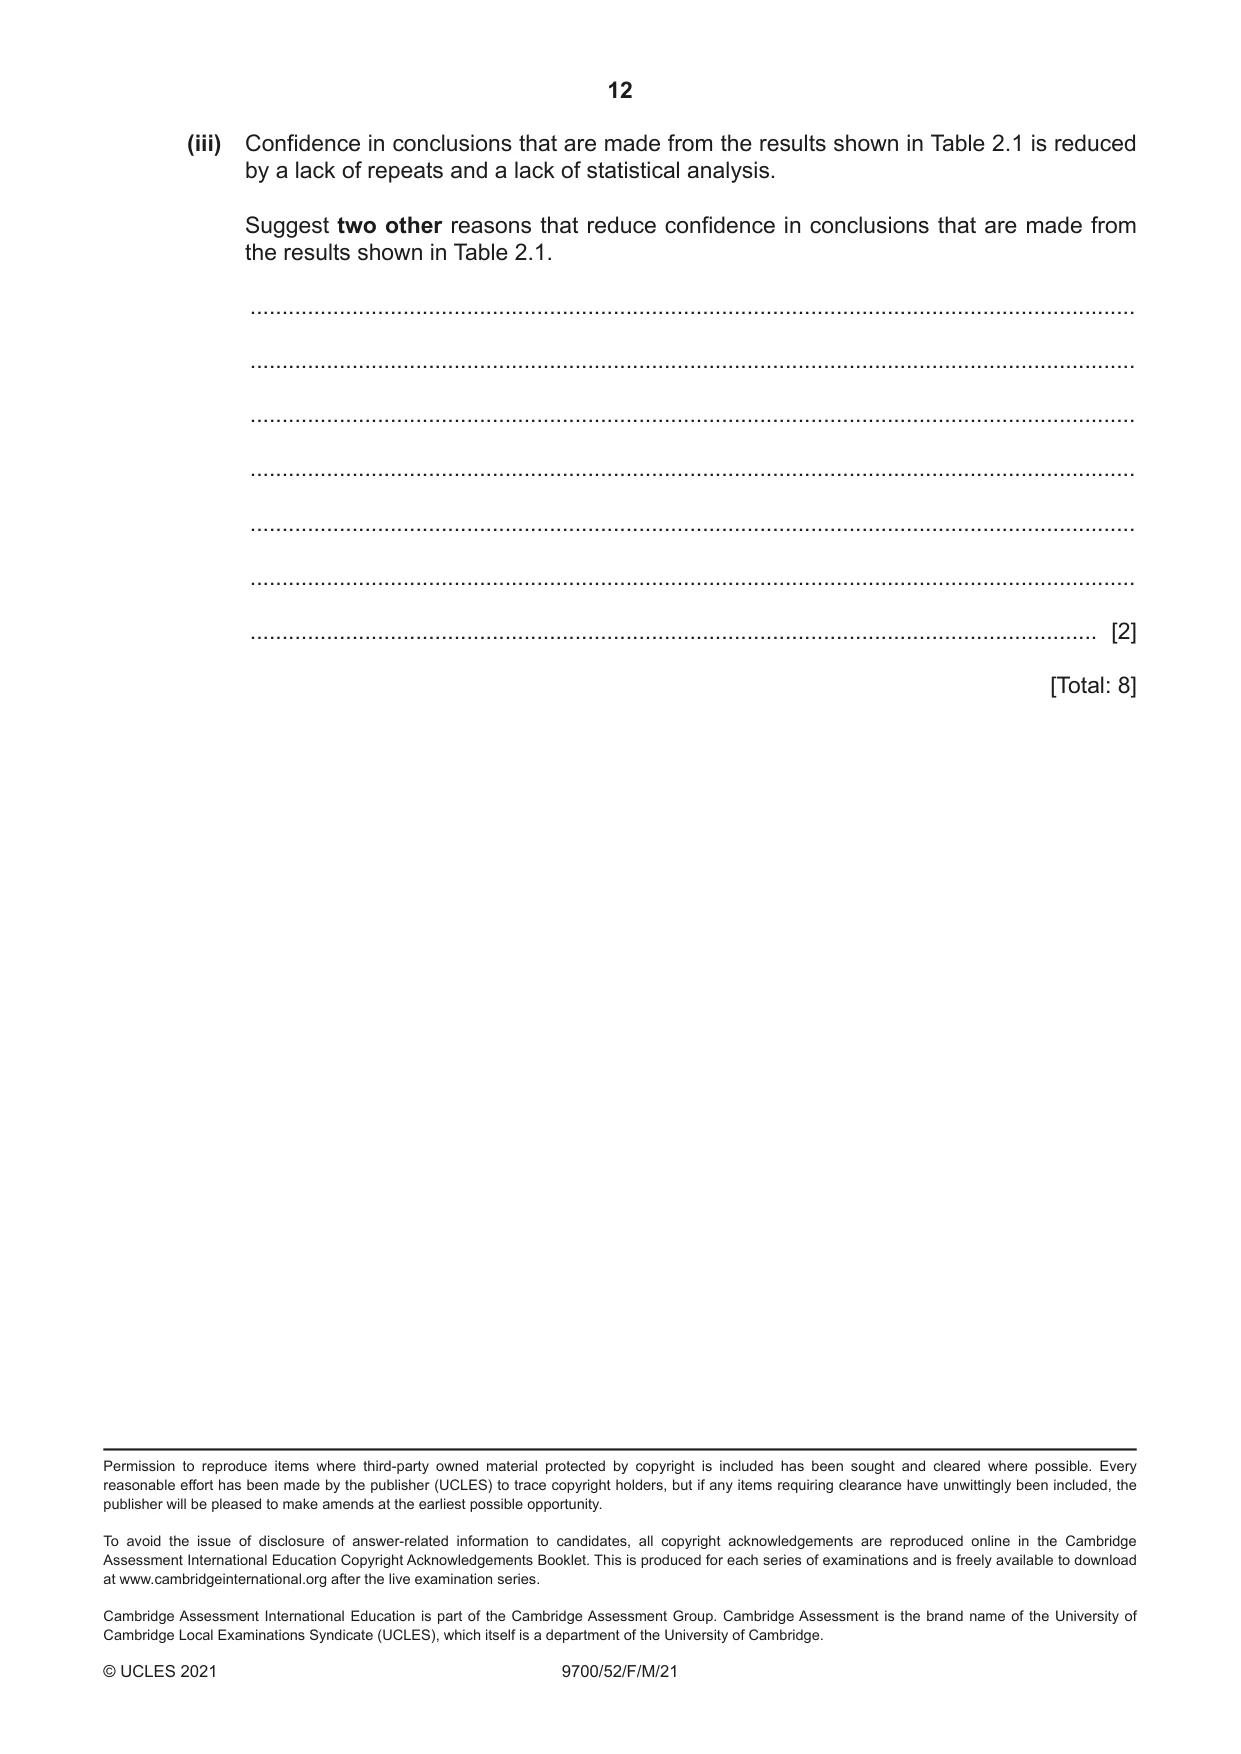
2 (a) Indigo carmine is a water-soluble indicator. When oxygen is bubbled through a solution of this indicator, the colour changes from colourless to blue. A student used indigo carmine solution to investigate some of the factors that may limit the rate of photosynthesis. Fig. 2.1 shows the apparatus used by the student. 15 cm3 colourless indigo carmine solution and 5 cm3 sodium hydrogencarbonate solution large test-tube alginate beads containing immobilised single-celled aquatic photosynthetic protoctists Fig. 2.1 The student prepared four sets of this apparatus. For each set of apparatus, the student used a different concentration of 5 cm3 sodium hydrogencarbonate solution: 0.25%, 0.50%, 0.75% and 1.00%. Sodium hydrogencarbonate solution is a source of carbon dioxide for photosynthesis. After adding indigo carmine solution and sodium hydrogencarbonate solution to the alginate beads, the apparatus was illuminated with a bench lamp from a distance of 20 cm. To minimise heating effects, the bench lamp used an LED bulb. For each concentration of sodium hydrogencarbonate solution, the time for the indigo carmine solution to turn from colourless to blue was recorded. The investigation was repeated with four new sets of apparatus illuminated with the same bench lamp at a distance of 10 cm, instead of 20 cm. The same concentrations of sodium hydrogencarbonate solution were used as previously. All other variables in this investigation were standardised. (i) State the dependent variable in this investigation. ..................................................................................................................................... [1] (ii) State one variable that needed to be standardised in this investigation, other than temperature or those variables clearly standardised in Fig. 2.1. ..................................................................................................................................... [1] (b) The time taken for each indigo carmine solution to turn blue was converted to a rate of photosynthesis in arbitrary units. This was done in such a way that the slowest rate of photosynthesis in this investigation was given a value of 1.00 arbitrary units. All other rates of photosynthesis were therefore greater than 1.00 arbitrary units. Table 2.1 shows the results of this investigation and some of the student’s calculated values. Table 2.1 distance of apparatus from 20 10bench lamp / cm percentage concentration of sodium hydrogencarbonate 0.25 0.50 0.75 1.00 0.25 0.50 0.75 1.00 solution time taken for indicator to 600 310 250 250 600 310 235 195turn blue / s rate of photosynthesis 1.00 1.94 2.40 2.40 1.00 1.94 3.08/ arbitrary units (i) Complete Table 2.1 by calculating the missing rate of photosynthesis in arbitrary units. [1] (ii) State three conclusions that can be made from the results shown in Table 2.1 about factors that affect the rate of photosynthesis and when these factors become limiting. ........................................................................................................................................... ........................................................................................................................................... ........................................................................................................................................... ........................................................................................................................................... ........................................................................................................................................... ........................................................................................................................................... ........................................................................................................................................... ..................................................................................................................................... [3] (iii) Confidence in conclusions that are made from the results shown in Table 2.1 is reduced by a lack of repeats and a lack of statistical analysis. Suggest two other reasons that reduce confidence in conclusions that are made from the results shown in Table 2.1. ........................................................................................................................................... ........................................................................................................................................... ........................................................................................................................................... ........................................................................................................................................... ........................................................................................................................................... ........................................................................................................................................... ..................................................................................................................................... [2] [Total: 8]
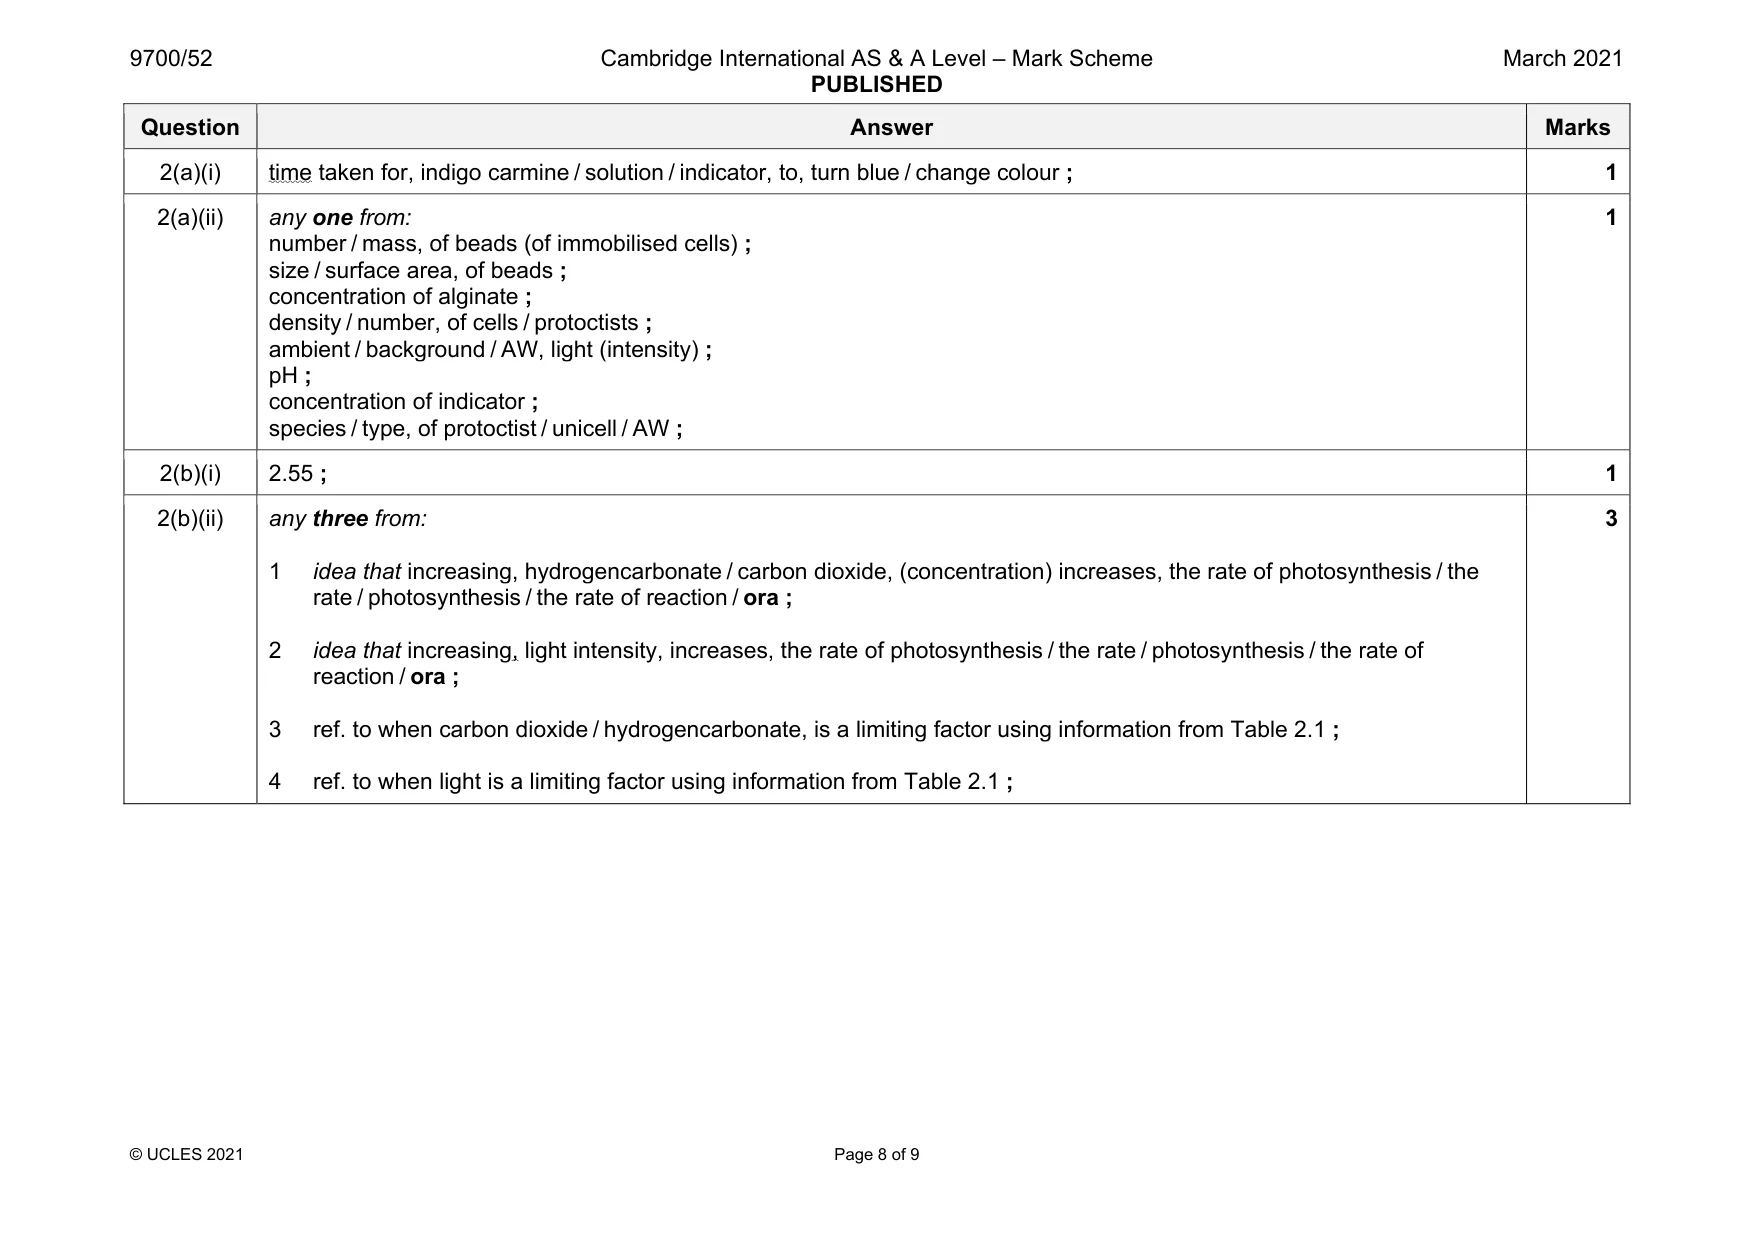
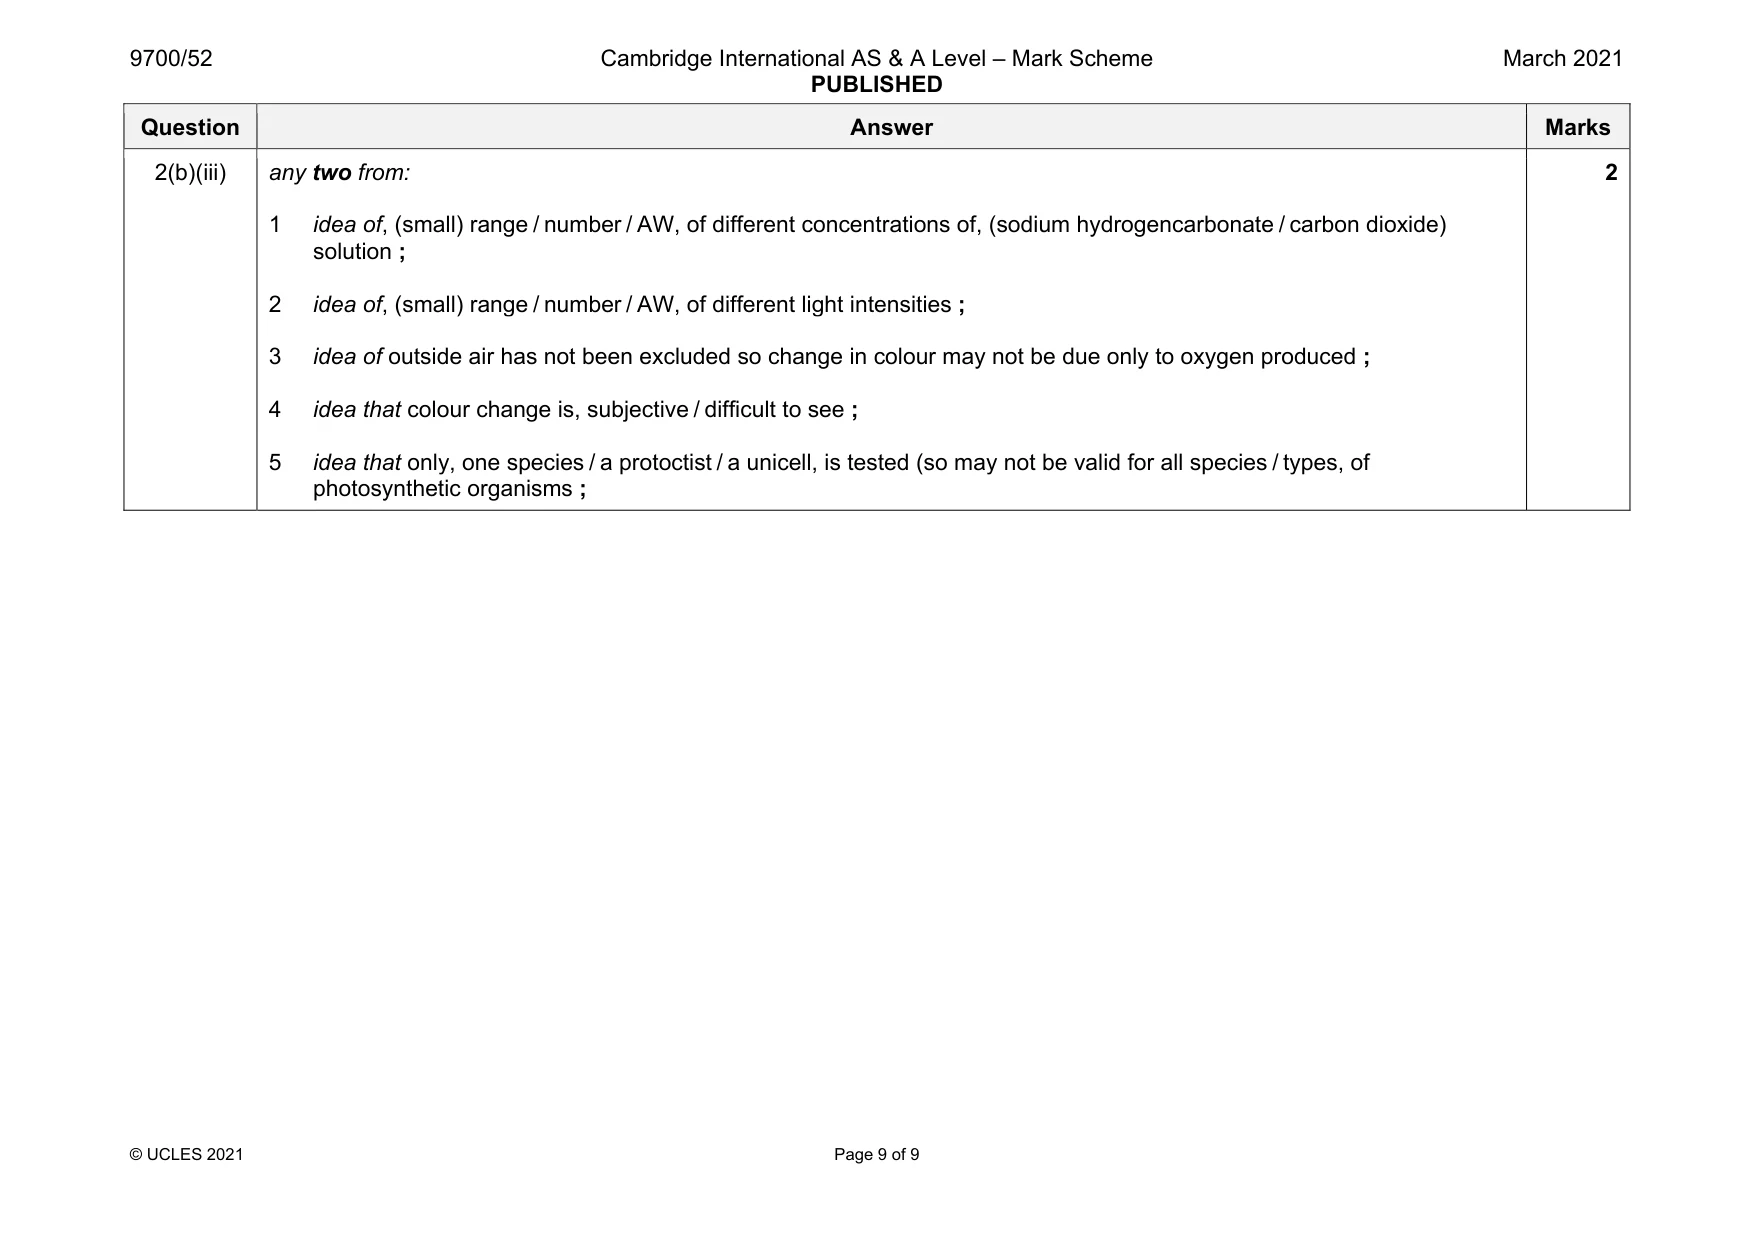
Mark scheme: 2(a)(i) time taken for, indigo carmine / solution / indicator, to, turn blue / change colour ; 1 2(a)(ii) any one from: number / mass, of beads (of immobilised cells) ; size / surface area, of beads ; concentration of alginate ; density / number, of cells / protoctists ; ambient / background / AW, light (intensity) ; pH ; concentration of indicator ; species / type, of protoctist / unicell / AW ; 1 2(b)(i) 2.55 ; 1 2(b)(ii) any three from: 1 idea that increasing, hydrogencarbonate / carbon dioxide, (concentration) increases, the rate of photosynthesis / the rate / photosynthesis / the rate of reaction / ora ; 2 idea that increasing, light intensity, increases, the rate of photosynthesis / the rate / photosynthesis / the rate of reaction / ora ; 3 ref. to when carbon dioxide / hydrogencarbonate, is a limiting factor using information from Table 2.1 ; 4 ref. to when light is a limiting factor using information from Table 2.1 ; 3 Question Answer Marks 2(b)(iii) any two from: 1 idea of, (small) range / number / AW, of different concentrations of, (sodium hydrogencarbonate / carbon dioxide) solution ; 2 idea of, (small) range / number / AW, of different light intensities ; 3 idea of outside air has not been excluded so change in colour may not be due only to oxygen produced ; 4 idea that colour change is, subjective / difficult to see ; 5 idea that only, one species / a protoctist / a unicell, is tested (so may not be valid for all species / types, of photosynthetic organisms ; 2
What was in this paper
The subtopics covered by these 2 questions, and how many questions each got. Open one in a new tab to see every Cambridge question on it.
What you needed in this session
Cambridge’s own grade thresholds for 2021 Feb/March, Paper 5 · Variant 2. A higher threshold means an easier paper — the bar moves with how the cohort did.