Cambridge A Level Biology 9700 — 2019 May/June Paper 5 · Variant 1
9700/51/M/J/19 · 2 questions · 30 marks · ≈34 min
The question paper and its mark scheme, free to read here and free to download. This is Cambridge’s own paper, exactly as it was sat.
Question paper12 pages
Mark scheme7 pages
Answers below. Sit the paper first if you are practising.
Questions as text
Q1 · A group of six students carried out an experiment to determine their reaction times using…
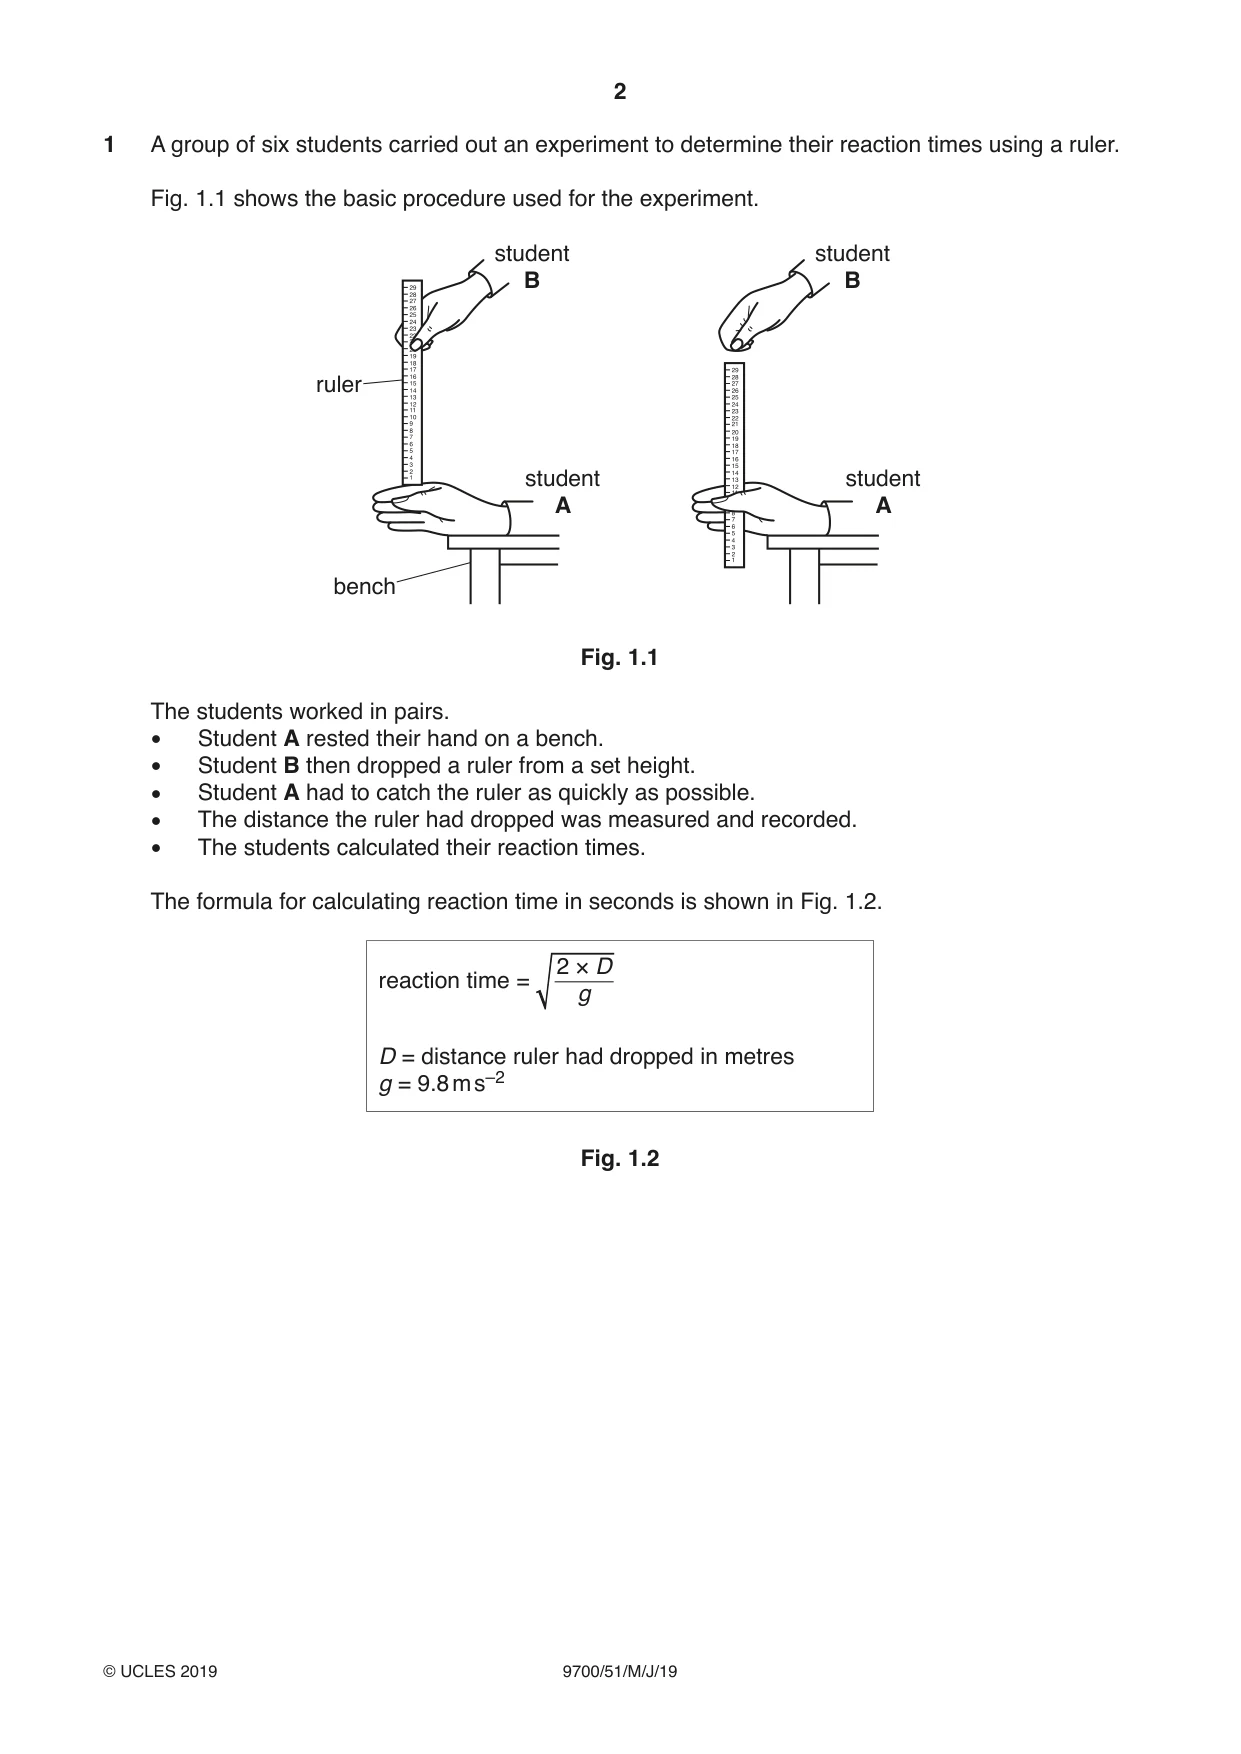
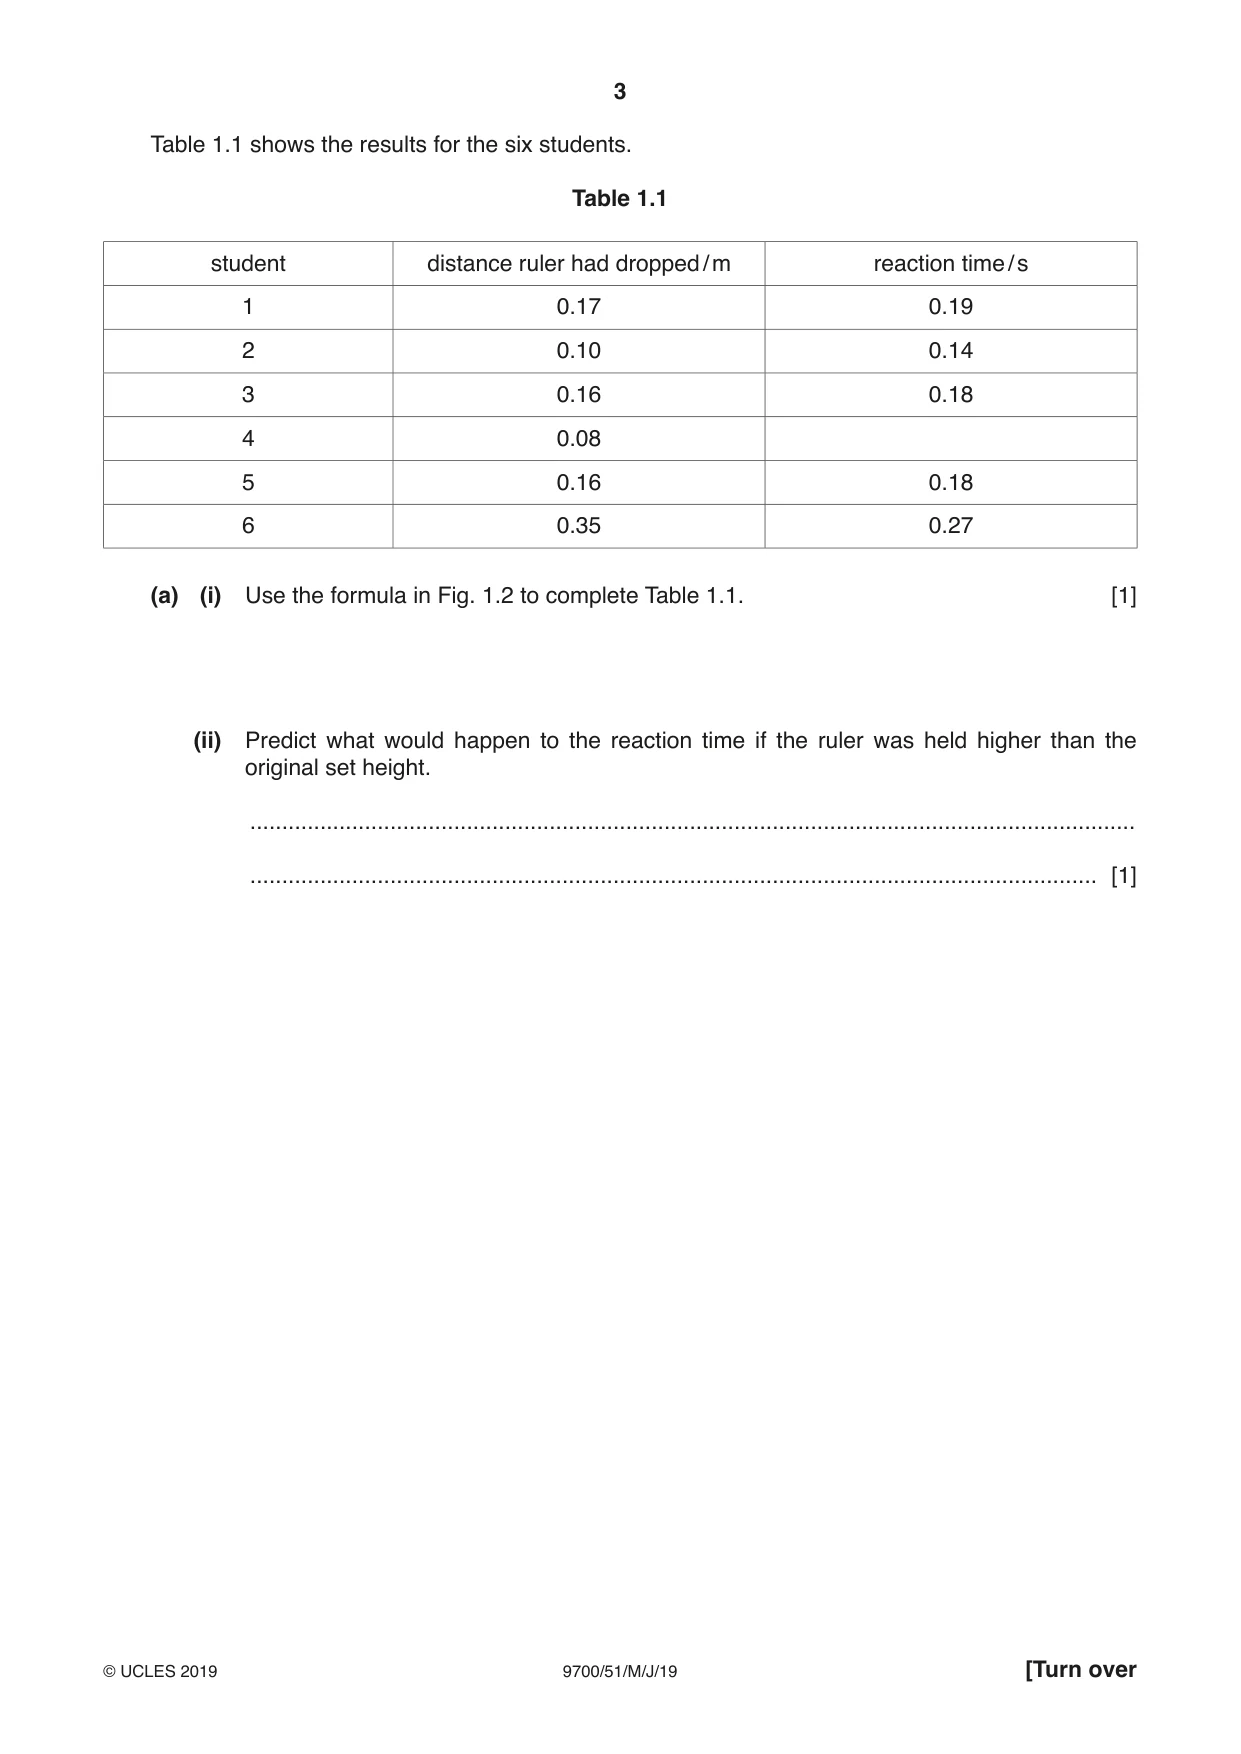
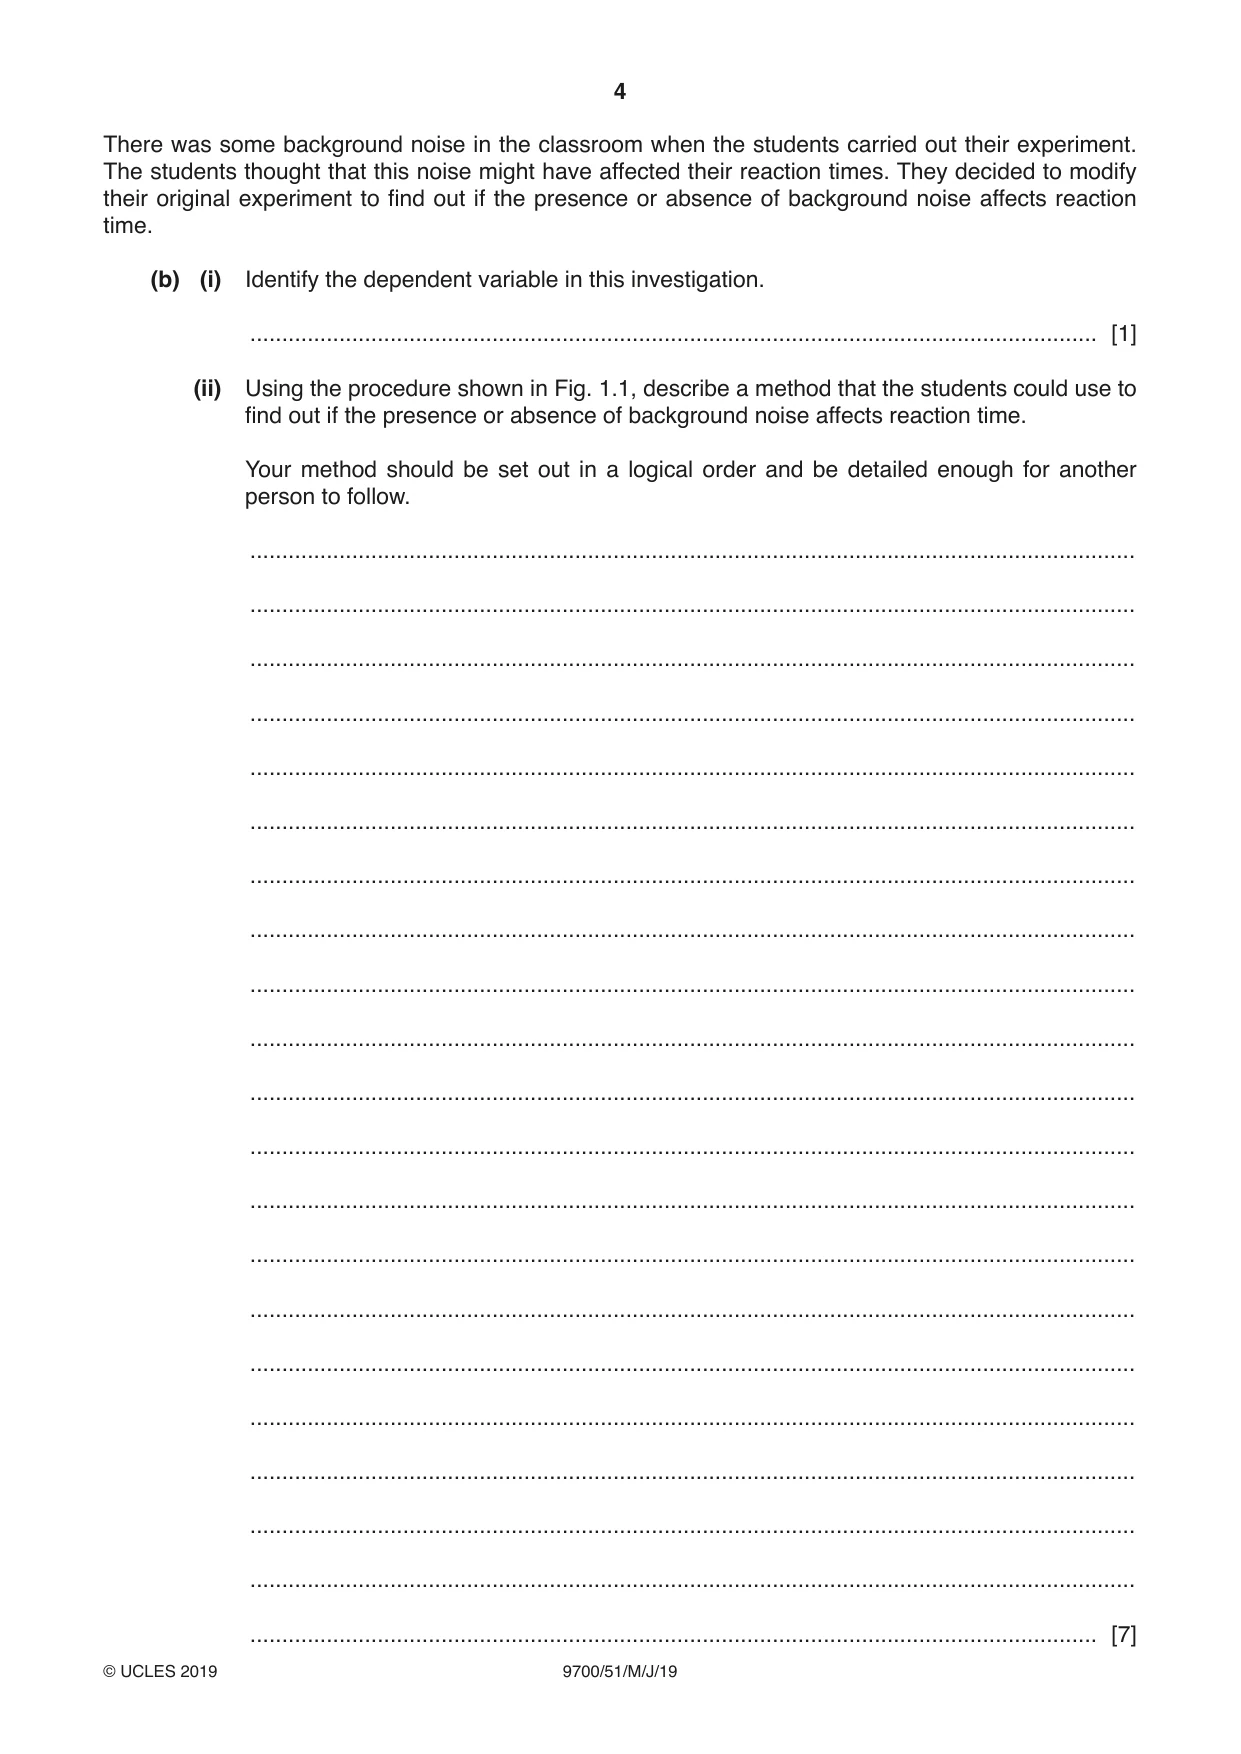
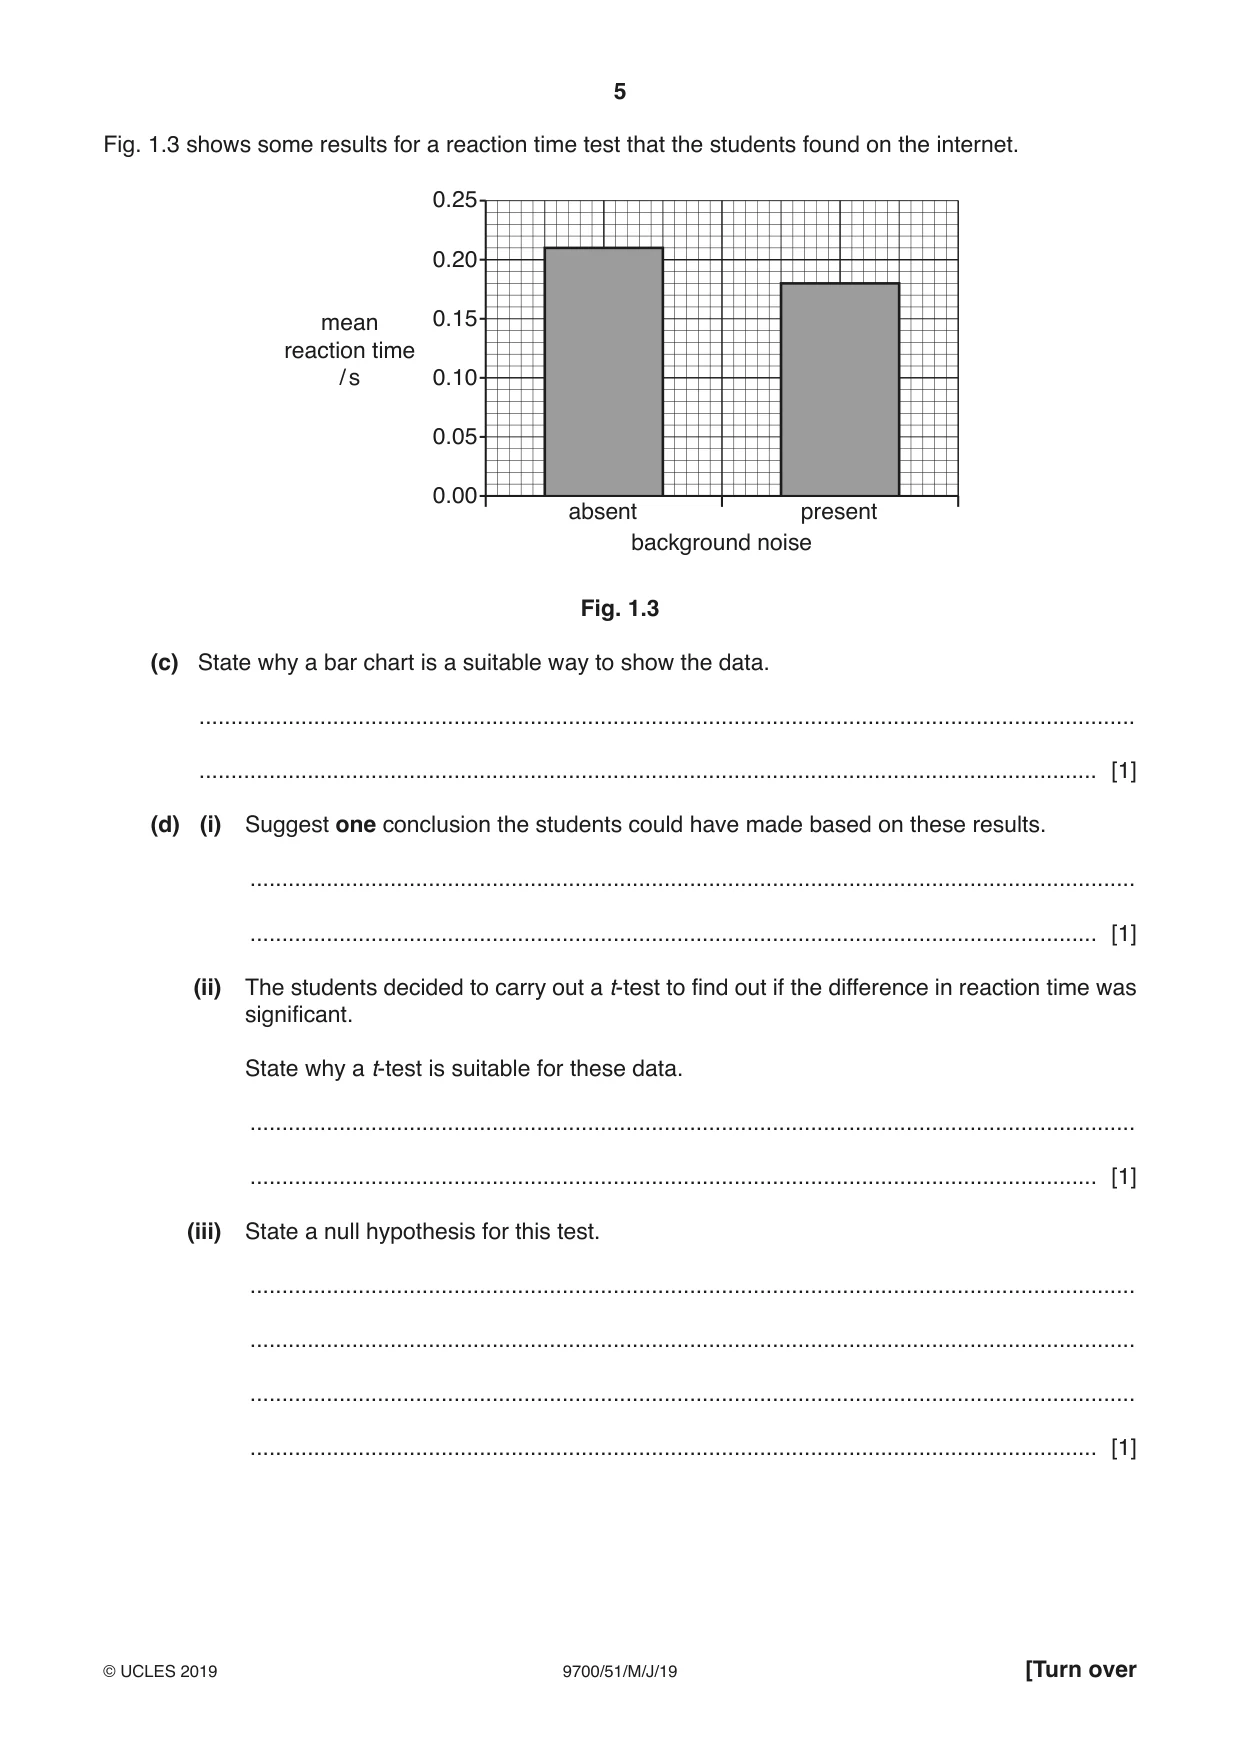
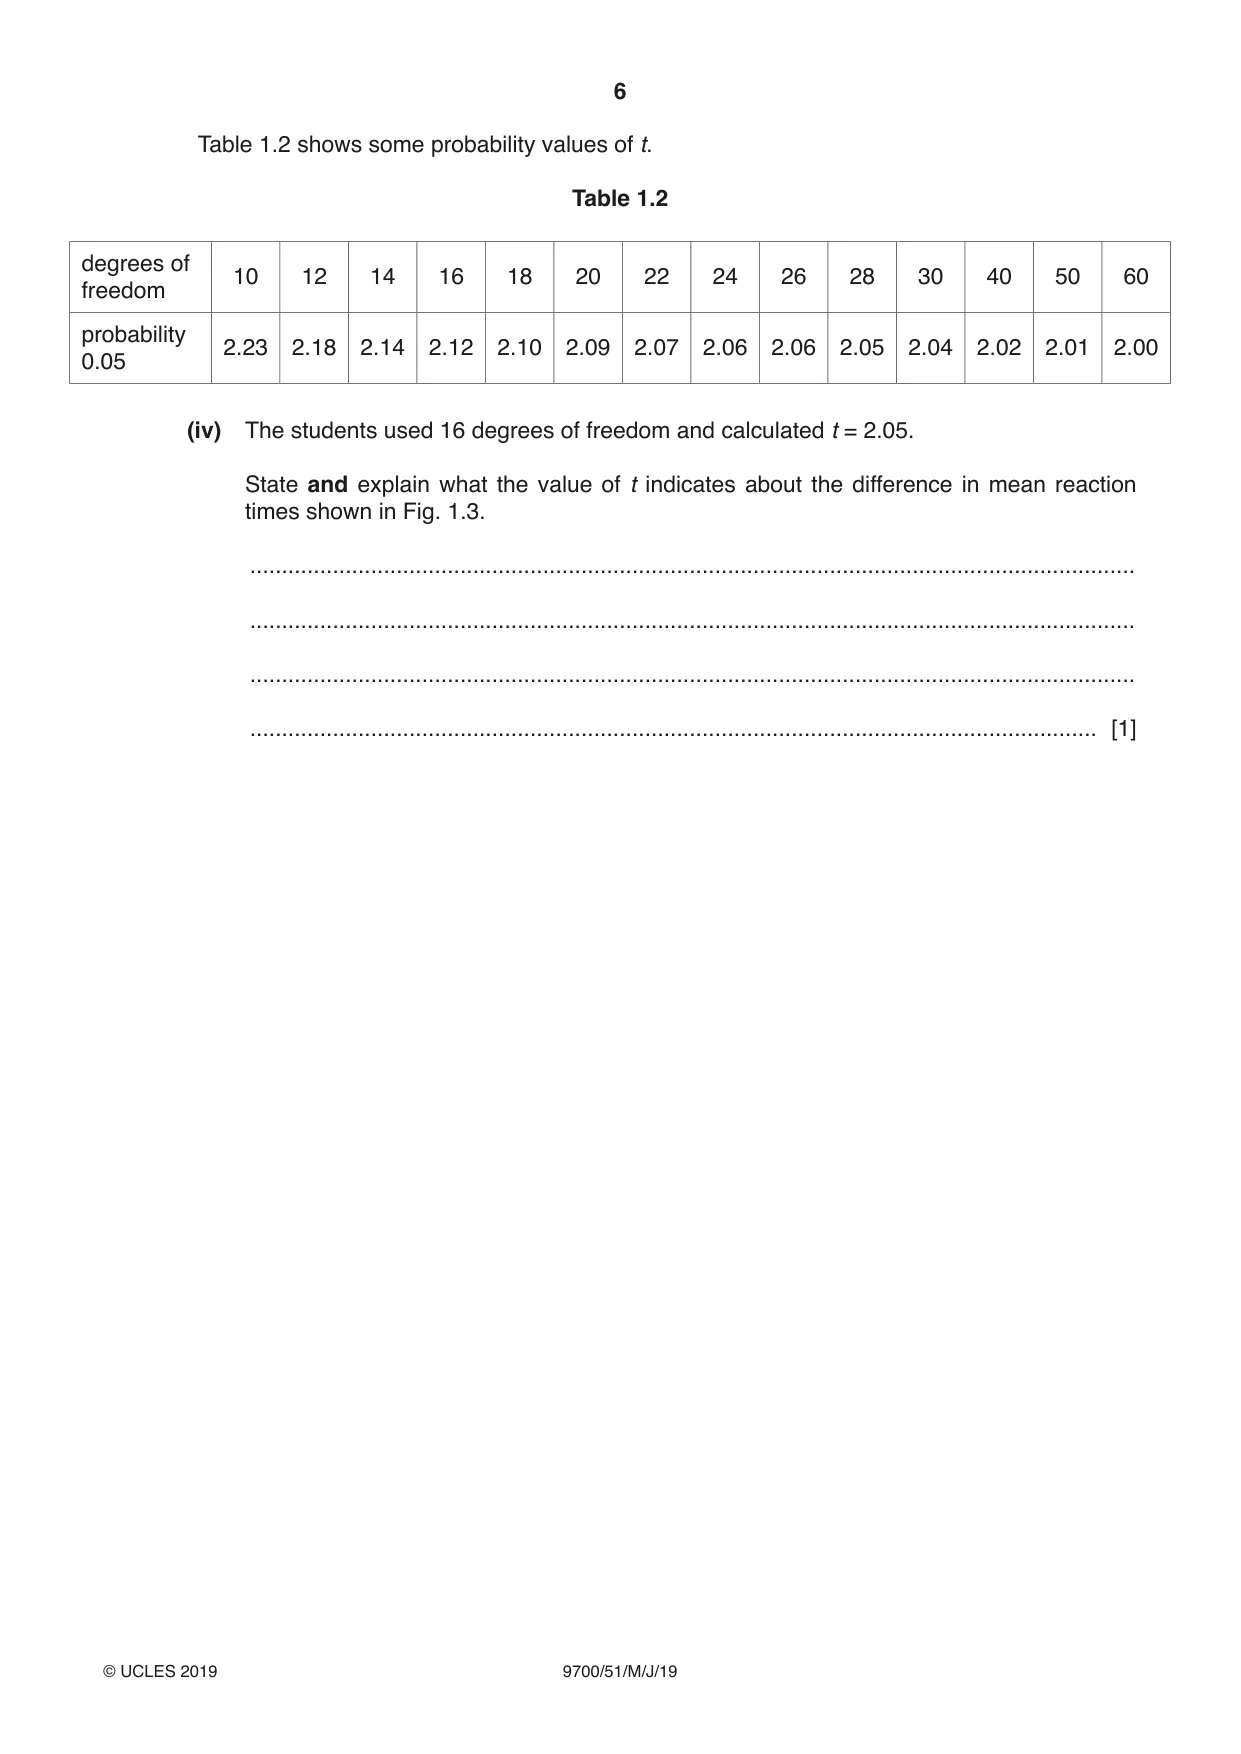
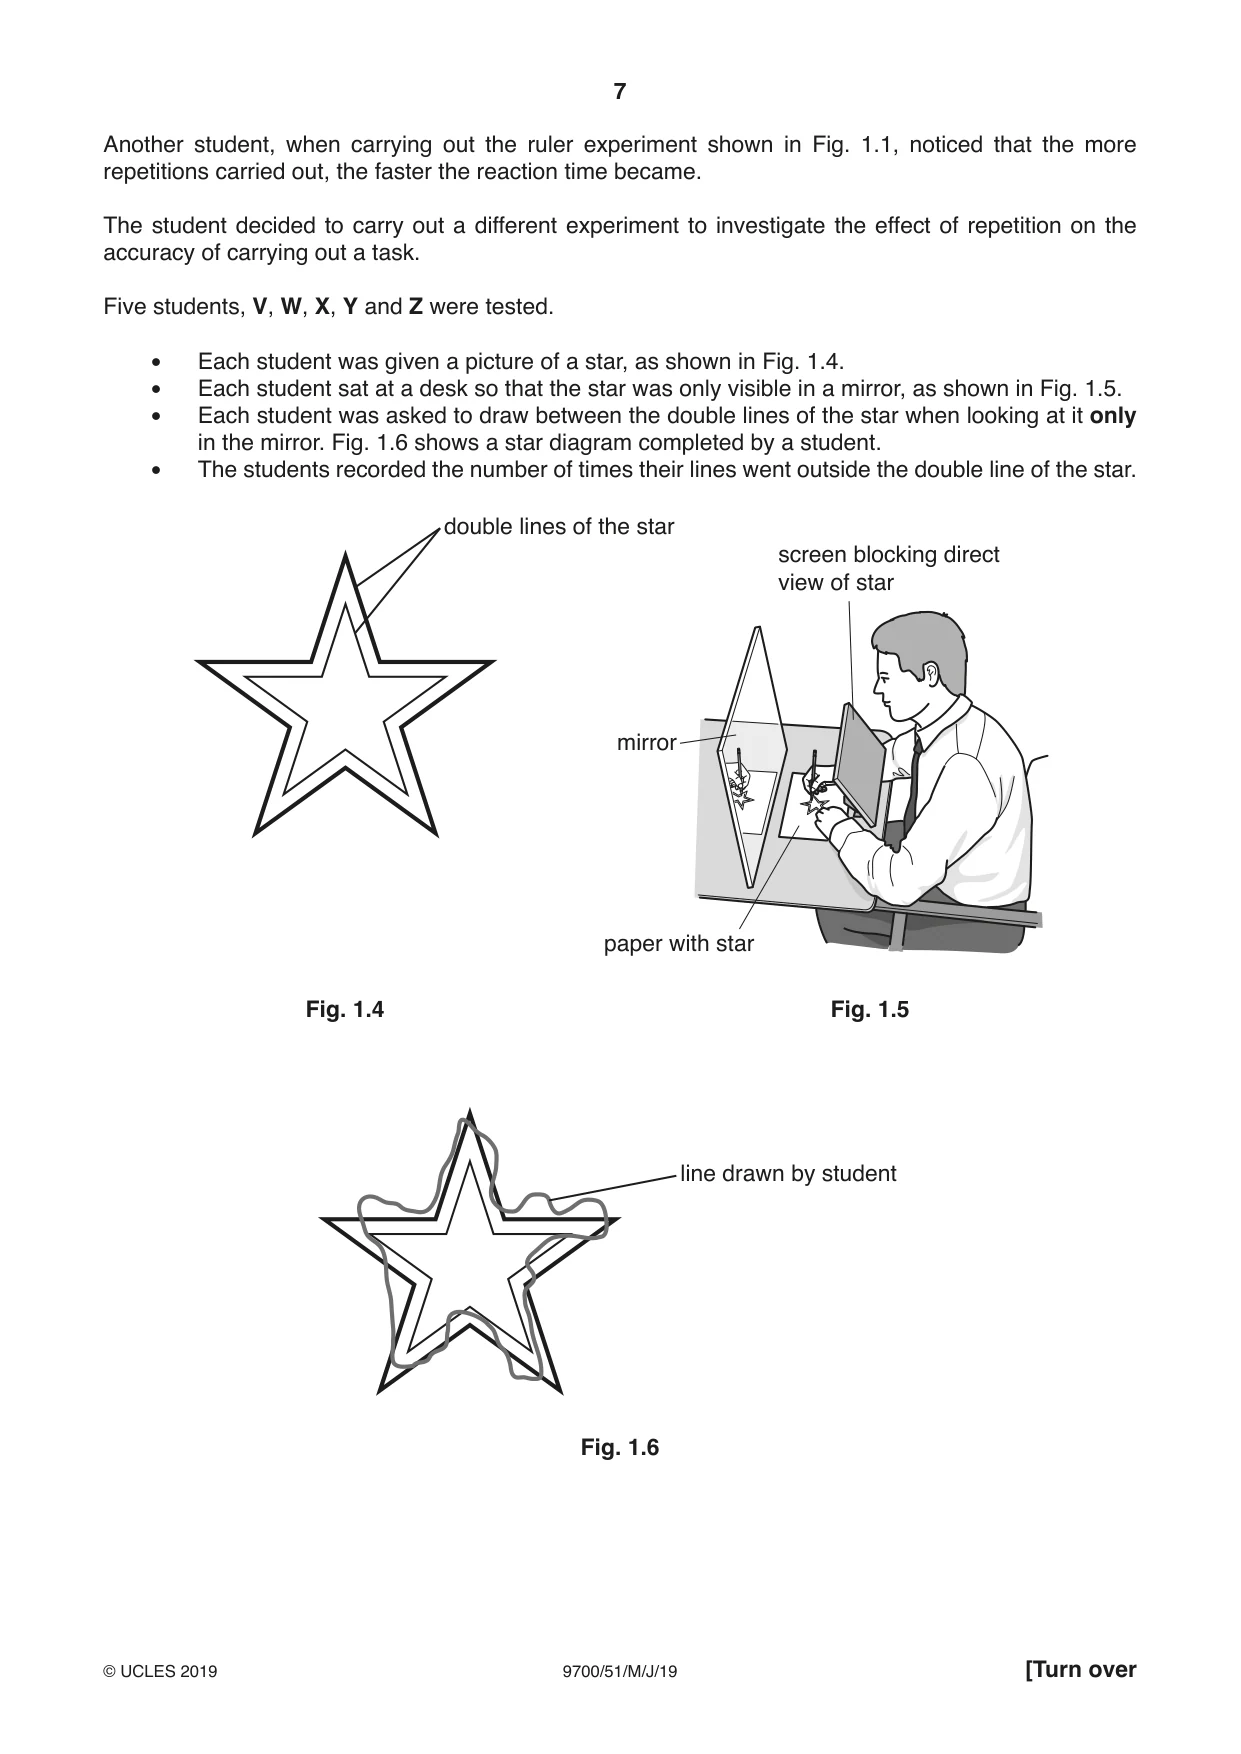
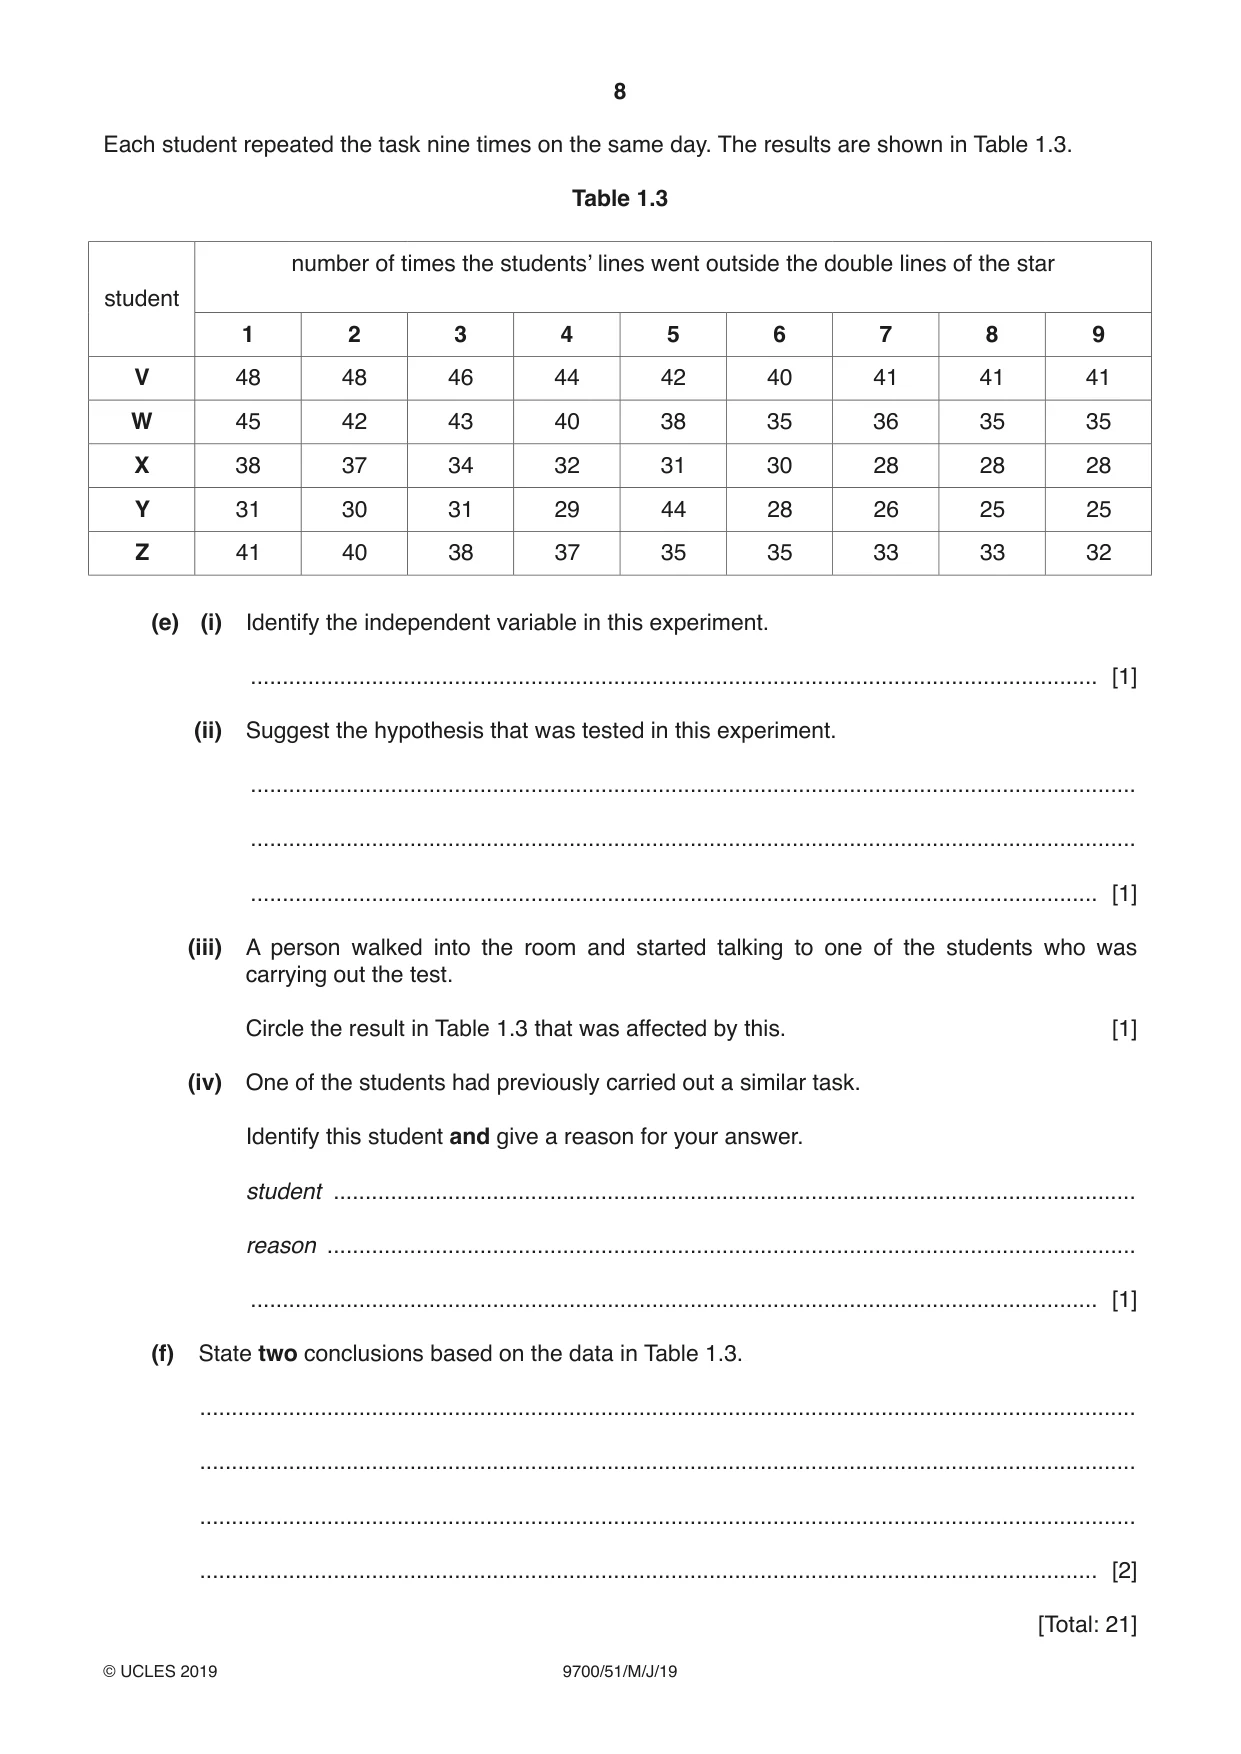
1 A group of six students carried out an experiment to determine their reaction times using a ruler. Fig. 1.1 shows the basic procedure used for the experiment. student student B B ruler student student A A bench Fig. 1.1 The students worked in pairs. • Student A rested their hand on a bench. • Student B then dropped a ruler from a set height. • Student A had to catch the ruler as quickly as possible. • The distance the ruler had dropped was measured and recorded. • The students calculated their reaction times. The formula for calculating reaction time in seconds is shown in Fig. 1.2. 2 × D reaction time = g D = distance ruler had dropped in metres g = 9.8 m s–2 Fig. 1.2 Table 1.1 shows the results for the six students. Table 1.1 student distance ruler had dropped / m reaction time / s 1 0.17 0.19 2 0.10 0.14 3 0.16 0.18 4 0.08 5 0.16 0.18 6 0.35 0.27 (a) (i) Use the formula in Fig. 1.2 to complete Table 1.1. [1] (ii) Predict what would happen to the reaction time if the ruler was held higher than the original set height. ........................................................................................................................................... ..................................................................................................................................... [1] There was some background noise in the classroom when the students carried out their experiment. The students thought that this noise might have affected their reaction times. They decided to modify their original experiment to find out if the presence or absence of background noise affects reaction time. (b) (i) Identify the dependent variable in this investigation. ..................................................................................................................................... [1] (ii) Using the procedure shown in Fig. 1.1, describe a method that the students could use to find out if the presence or absence of background noise affects reaction time. Your method should be set out in a logical order and be detailed enough for another person to follow. ........................................................................................................................................... ........................................................................................................................................... ........................................................................................................................................... ........................................................................................................................................... ........................................................................................................................................... ........................................................................................................................................... ........................................................................................................................................... ........................................................................................................................................... ........................................................................................................................................... ........................................................................................................................................... ........................................................................................................................................... ........................................................................................................................................... ........................................................................................................................................... ........................................................................................................................................... ........................................................................................................................................... ........................................................................................................................................... ........................................................................................................................................... ........................................................................................................................................... ........................................................................................................................................... ........................................................................................................................................... ..................................................................................................................................... [7] Fig. 1.3 shows some results for a reaction time test that the students found on the internet. 0.25 0.20 mean 0.15 reaction time / s 0.10 0.05 0.00 absent present background noise Fig. 1.3 (c) State why a bar chart is a suitable way to show the data. ................................................................................................................................................... ............................................................................................................................................. [1] (d) (i) Suggest one conclusion the students could have made based on these results. ........................................................................................................................................... ..................................................................................................................................... [1] (ii) The students decided to carry out a t-test to find out if the difference in reaction time was significant. State why a t-test is suitable for these data. ........................................................................................................................................... ..................................................................................................................................... [1] (iii) State a null hypothesis for this test. ........................................................................................................................................... ........................................................................................................................................... ........................................................................................................................................... ..................................................................................................................................... [1] Table 1.2 shows some probability values of t. Table 1.2 degrees of 10 12 14 16 18 20 22 24 26 28 30 40 50 60freedom probability 2.23 2.18 2.14 2.12 2.10 2.09 2.07 2.06 2.06 2.05 2.04 2.02 2.01 2.000.05 (iv) The students used 16 degrees of freedom and calculated t = 2.05. State and explain what the value of t indicates about the difference in mean reaction times shown in Fig. 1.3. ........................................................................................................................................... ........................................................................................................................................... ........................................................................................................................................... ..................................................................................................................................... [1] Another student, when carrying out the ruler experiment shown in Fig. 1.1, noticed that the more repetitions carried out, the faster the reaction time became. The student decided to carry out a different experiment to investigate the effect of repetition on the accuracy of carrying out a task. Five students, V, W, X, Y and Z were tested. • Each student was given a picture of a star, as shown in Fig. 1.4. • Each student sat at a desk so that the star was only visible in a mirror, as shown in Fig. 1.5. • Each student was asked to draw between the double lines of the star when looking at it only in the mirror. Fig. 1.6 shows a star diagram completed by a student. • The students recorded the number of times their lines went outside the double line of the star. double lines of the star screen blocking direct view of star mirror paper with star Fig. 1.4 Fig. 1.5 line drawn by student Fig. 1.6 Each student repeated the task nine times on the same day. The results are shown in Table 1.3. Table 1.3 number of times the students’ lines went outside the double lines of the star student 1 2 3 4 5 6 7 8 9 V 48 48 46 44 42 40 41 41 41 W 45 42 43 40 38 35 36 35 35 X 38 37 34 32 31 30 28 28 28 Y 31 30 31 29 44 28 26 25 25 Z 41 40 38 37 35 35 33 33 32 (e) (i) Identify the independent variable in this experiment. ..................................................................................................................................... [1] (ii) Suggest the hypothesis that was tested in this experiment. ........................................................................................................................................... ........................................................................................................................................... ..................................................................................................................................... [1] (iii) A person walked into the room and started talking to one of the students who was carrying out the test. Circle the result in Table 1.3 that was affected by this. [1] (iv) One of the students had previously carried out a similar task. Identify this student and give a reason for your answer. student .............................................................................................................................. reason ............................................................................................................................... ..................................................................................................................................... [1] (f) State two conclusions based on the data in Table 1.3. ................................................................................................................................................... ................................................................................................................................................... ................................................................................................................................................... ............................................................................................................................................. [2] [Total: 21]
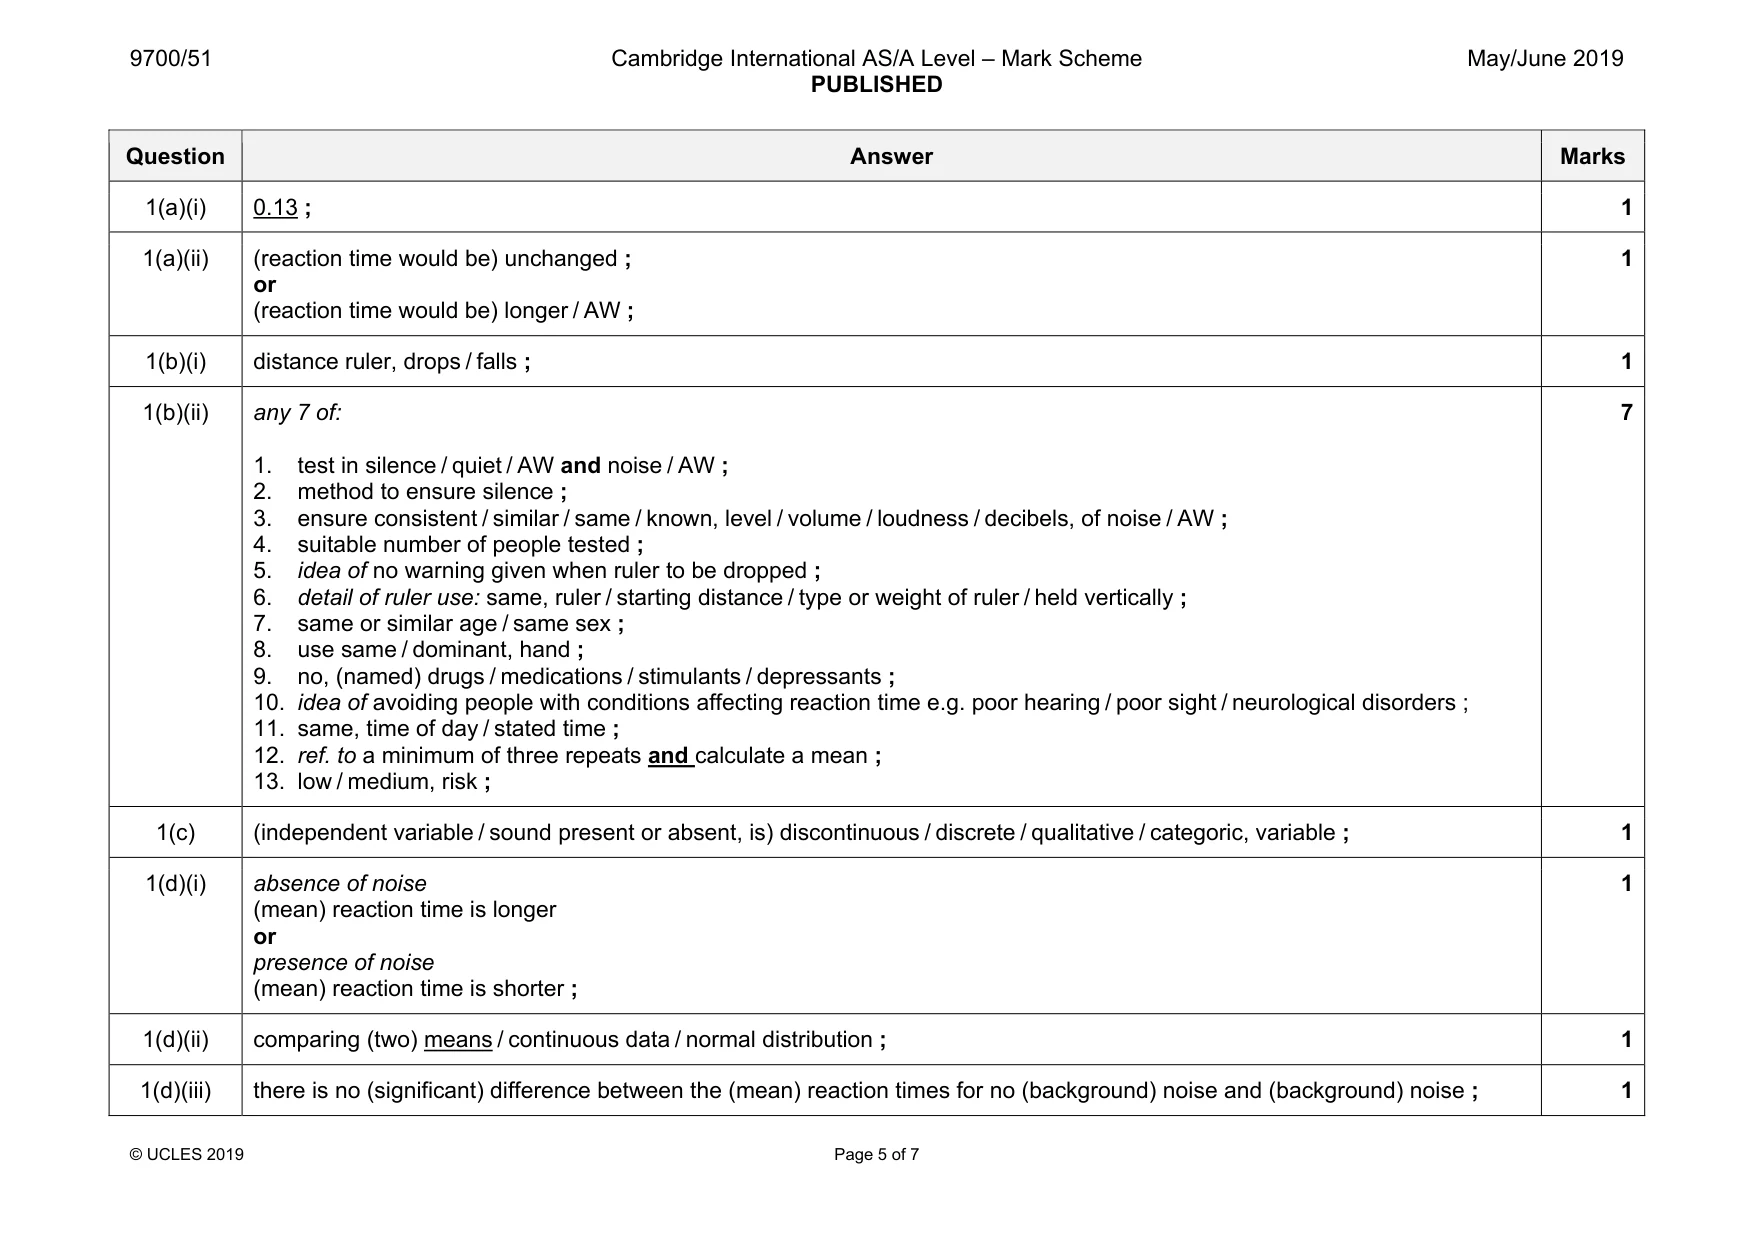
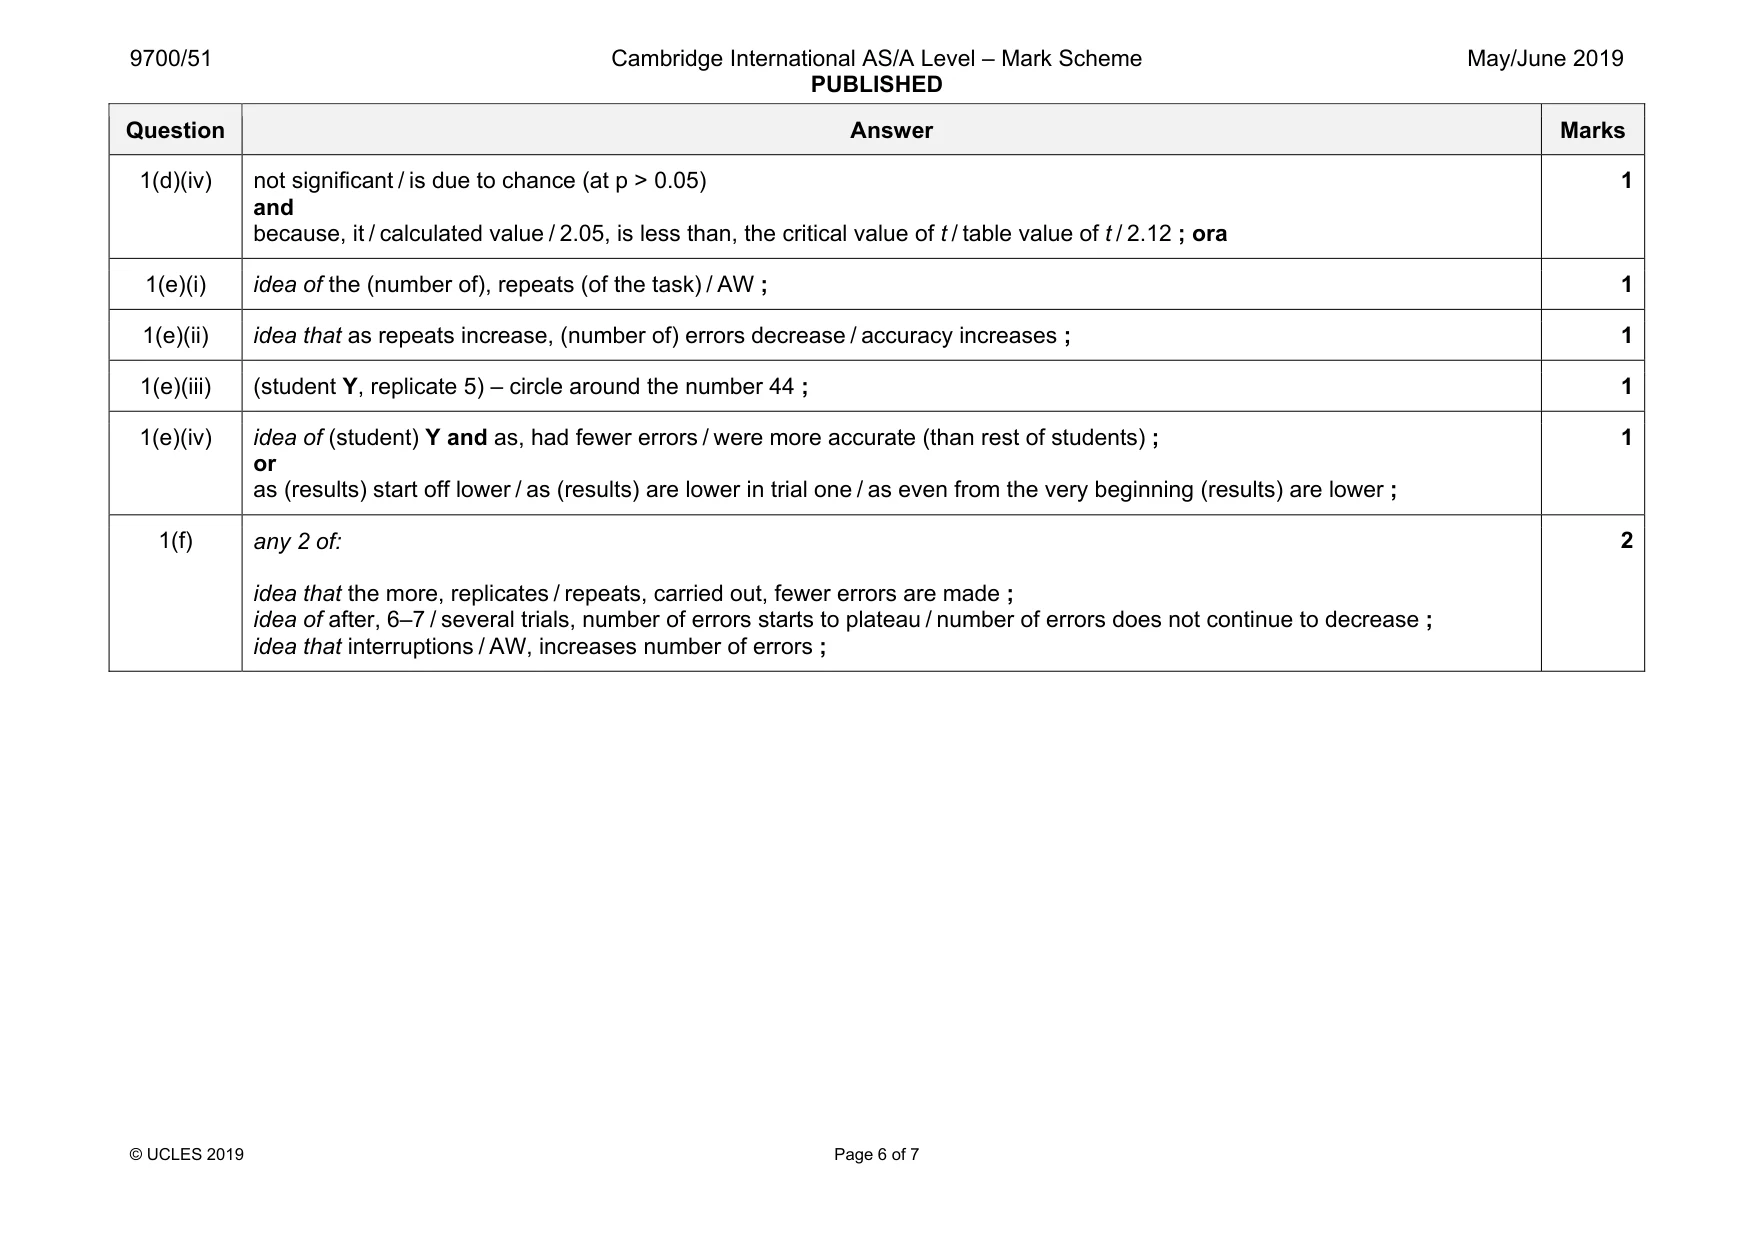
Mark scheme: 1(a)(i) 0.13 ; 1 1(a)(ii) (reaction time would be) unchanged ; or (reaction time would be) longer / AW ; 1 1(b)(i) distance ruler, drops / falls ; 1 1(b)(ii) any 7 of: 1. test in silence / quiet / AW and noise / AW ; 2. method to ensure silence ; 3. ensure consistent / similar / same / known, level / volume / loudness / decibels, of noise / AW ; 4. suitable number of people tested ; 5. idea of no warning given when ruler to be dropped ; 6. detail of ruler use: same, ruler / starting distance / type or weight of ruler / held vertically ; 7. same or similar age / same sex ; 8. use same / dominant, hand ; 9. no, (named) drugs / medications / stimulants / depressants ; 10. idea of avoiding people with conditions affecting reaction time e.g. poor hearing / poor sight / neurological disorders ; 11. same, time of day / stated time ; 12. ref. to a minimum of three repeats and calculate a mean ; 13. low / medium, risk ; 7 1(c) (independent variable / sound present or absent, is) discontinuous / discrete / qualitative / categoric, variable ; 1 1(d)(i) absence of noise (mean) reaction time is longer or presence of noise (mean) reaction time is shorter ; 1 1(d)(ii) comparing (two) means / continuous data / normal distribution ; 1 1(d)(iii) there is no (significant) difference between the (mean) reaction times for no (background) noise and (background) noise ; 1 Question Answer Marks 1(d)(iv) not significant / is due to chance (at p > 0.05) and because, it / calculated value / 2.05, is less than, the critical value of t / table value of t / 2.12 ; ora 1 1(e)(i) idea of the (number of), repeats (of the task) / AW ; 1 1(e)(ii) idea that as repeats increase, (number of) errors decrease / accuracy increases ; 1 1(e)(iii) (student Y, replicate 5) – circle around the number 44 ; 1 1(e)(iv) idea of (student) Y and as, had fewer errors / were more accurate (than rest of students) ; or as (results) start off lower / as (results) are lower in trial one / as even from the very beginning (results) are lower ; 1 1(f) any 2 of: idea that the more, replicates / repeats, carried out, fewer errors are made ; idea of after, 6–7 / several trials, number of errors starts to plateau / number of errors does not continue to decrease ; idea that interruptions / AW, increases number of errors ; 2
Q2 · Artificial insemination (AI) is one method used in assisted reproduction programmes for…
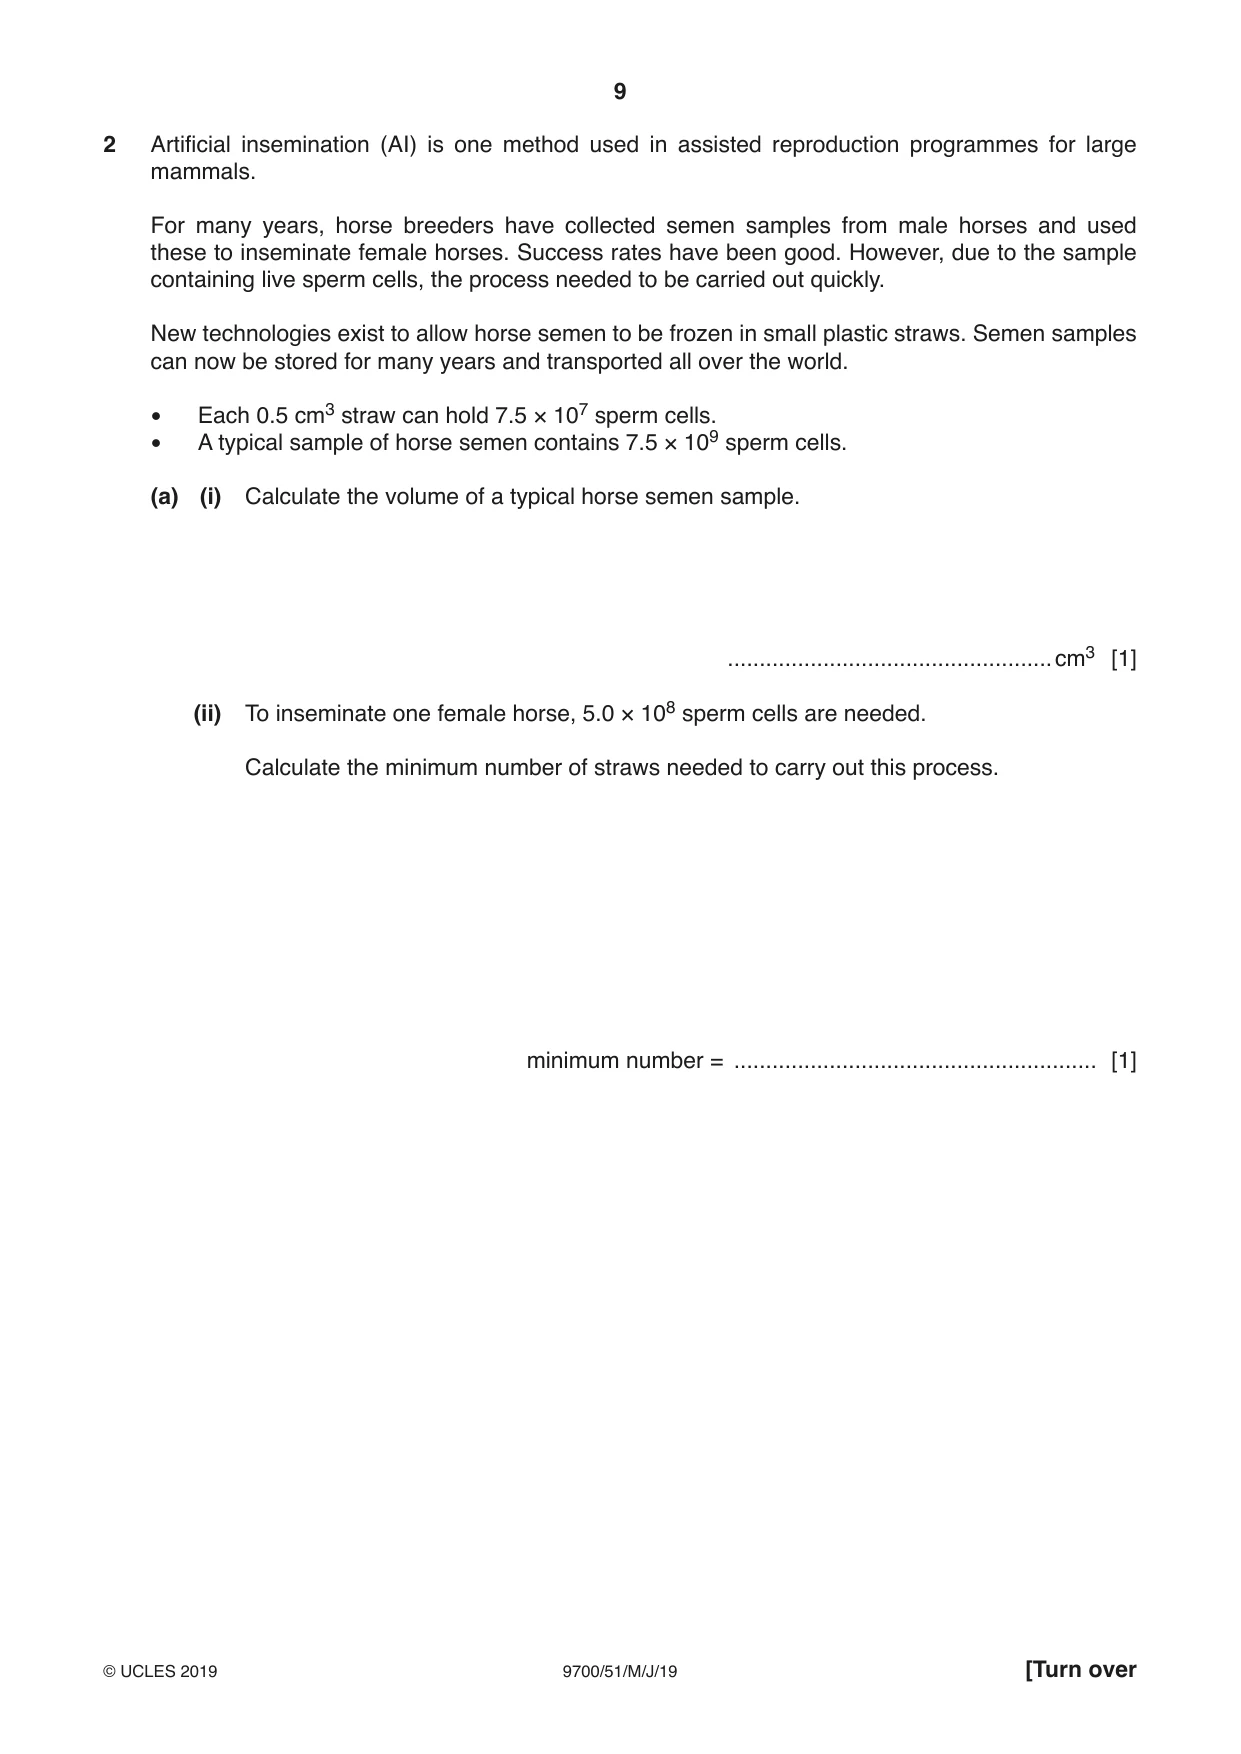
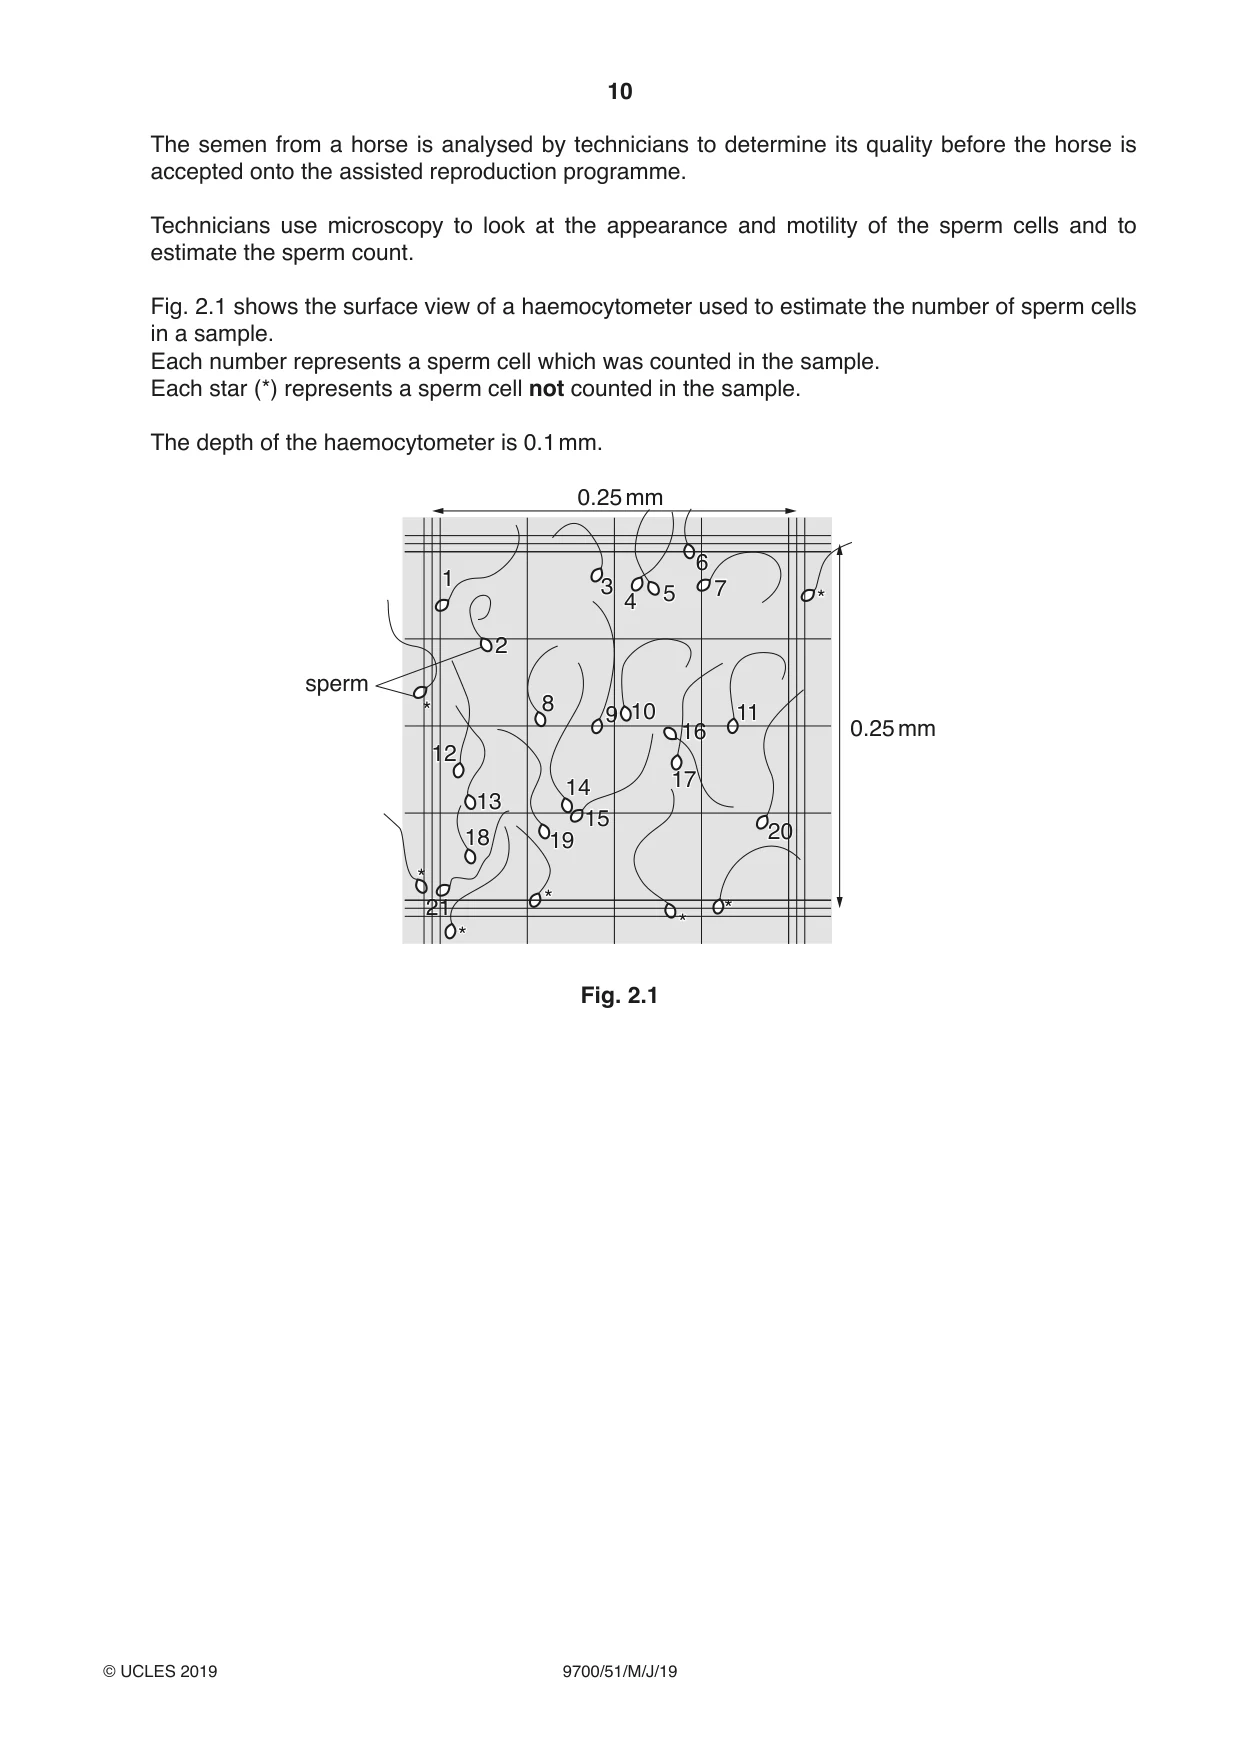
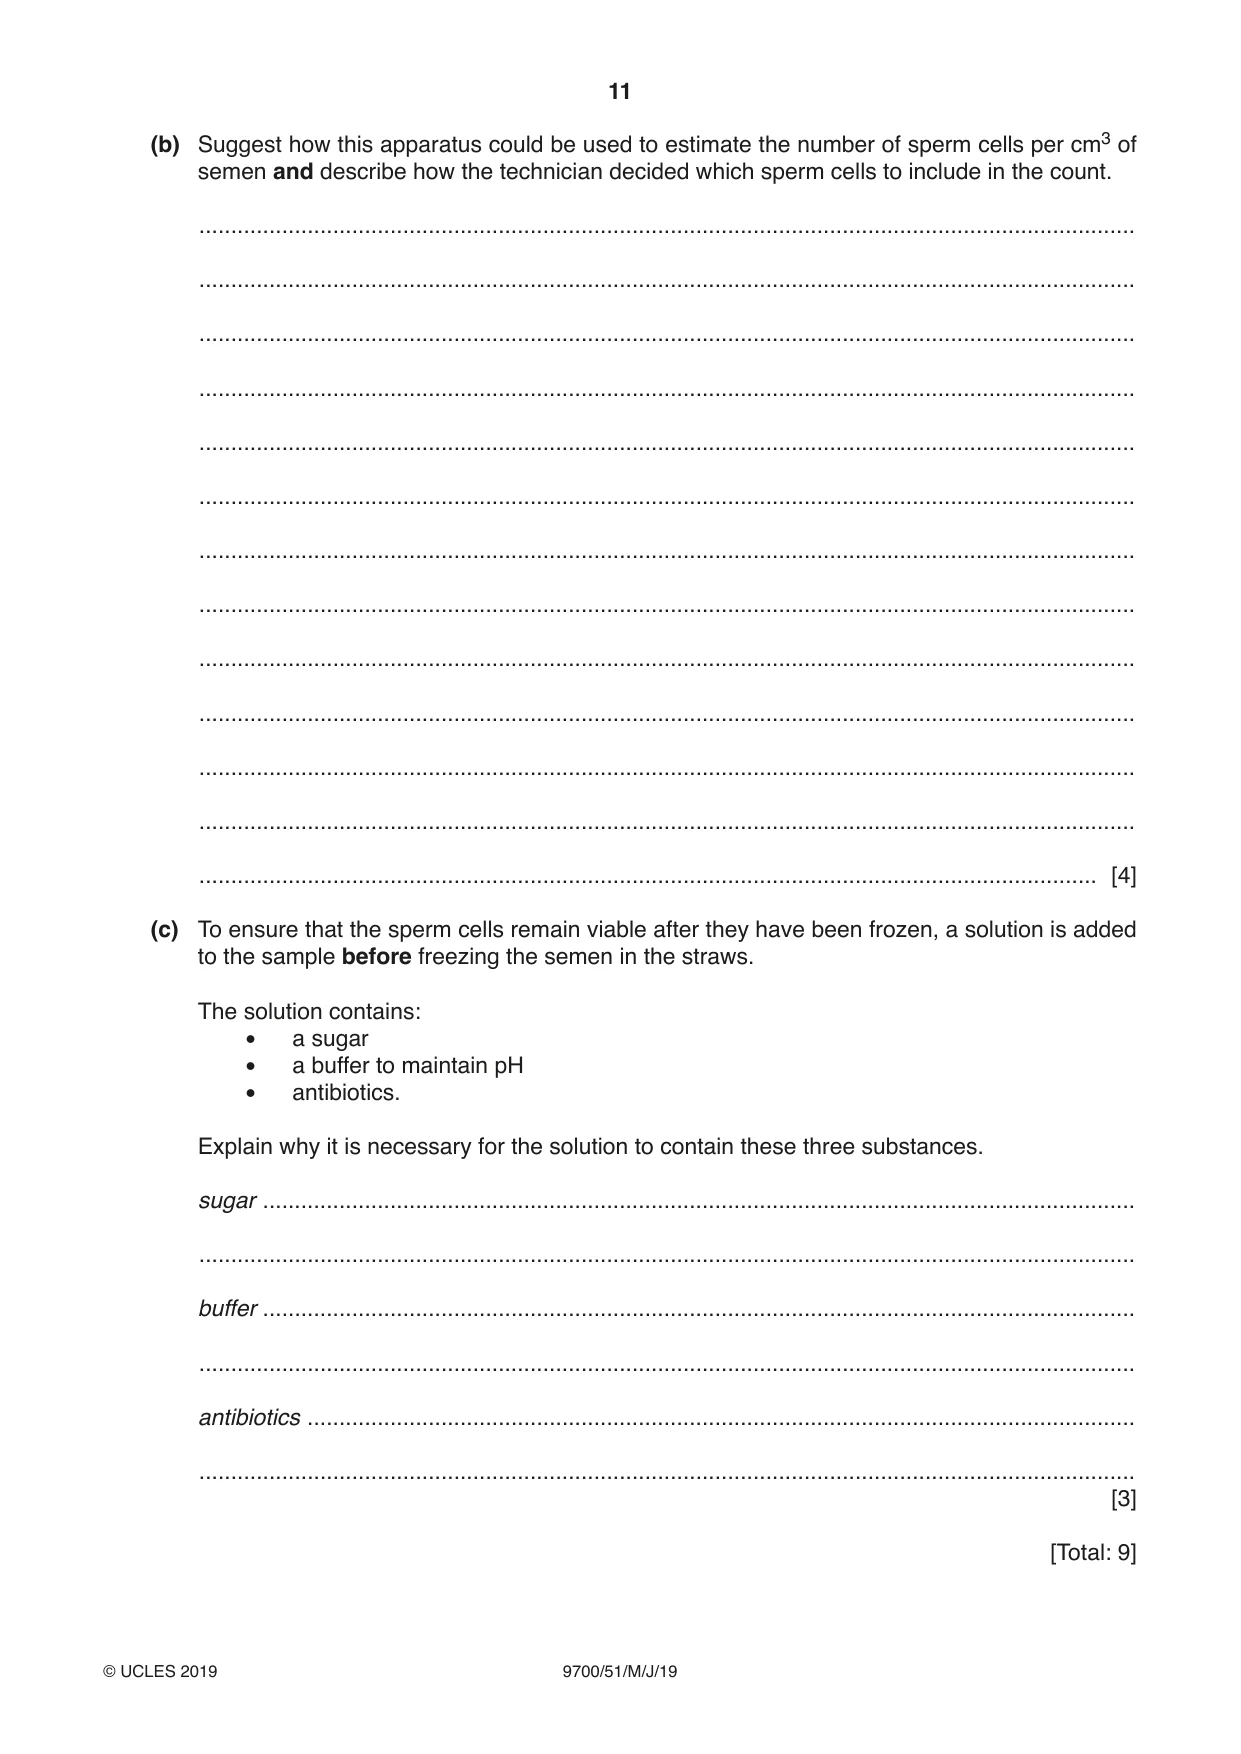
2 Artificial insemination (AI) is one method used in assisted reproduction programmes for large mammals. For many years, horse breeders have collected semen samples from male horses and used these to inseminate female horses. Success rates have been good. However, due to the sample containing live sperm cells, the process needed to be carried out quickly. New technologies exist to allow horse semen to be frozen in small plastic straws. Semen samples can now be stored for many years and transported all over the world. • Each 0.5 cm3 straw can hold 7.5 × 10⁷ sperm cells. • A typical sample of horse semen contains 7.5 × 10⁹ sperm cells. (a) (i) Calculate the volume of a typical horse semen sample. ................................................... cm3 [1] (ii) To inseminate one female horse, 5.0 × 10⁸ sperm cells are needed. Calculate the minimum number of straws needed to carry out this process. minimum number = ......................................................... [1] The semen from a horse is analysed by technicians to determine its quality before the horse is accepted onto the assisted reproduction programme. Technicians use microscopy to look at the appearance and motility of the sperm cells and to estimate the sperm count. Fig. 2.1 shows the surface view of a haemocytometer used to estimate the number of sperm cells in a sample. Each number represents a sperm cell which was counted in the sample. Each star (*) represents a sperm cell not counted in the sample. The depth of the haemocytometer is 0.1 mm. 0.25 mm 6 1 3 5 7 * 4 2 sperm 8 * 9 10 11 16 0.25 mm 12 17 14 13 15 18 19 20 * * 21 * * * Fig. 2.1 (b) Suggest how this apparatus could be used to estimate the number of sperm cells per cm3 of semen and describe how the technician decided which sperm cells to include in the count. ................................................................................................................................................... ................................................................................................................................................... ................................................................................................................................................... ................................................................................................................................................... ................................................................................................................................................... ................................................................................................................................................... ................................................................................................................................................... ................................................................................................................................................... ................................................................................................................................................... ................................................................................................................................................... ................................................................................................................................................... ................................................................................................................................................... ............................................................................................................................................. [4] (c) To ensure that the sperm cells remain viable after they have been frozen, a solution is added to the sample before freezing the semen in the straws. The solution contains: • a sugar • a buffer to maintain pH • antibiotics. Explain why it is necessary for the solution to contain these three substances. sugar ......................................................................................................................................... ................................................................................................................................................... buffer ......................................................................................................................................... ................................................................................................................................................... antibiotics .................................................................................................................................. ................................................................................................................................................... [3] [Total: 9]
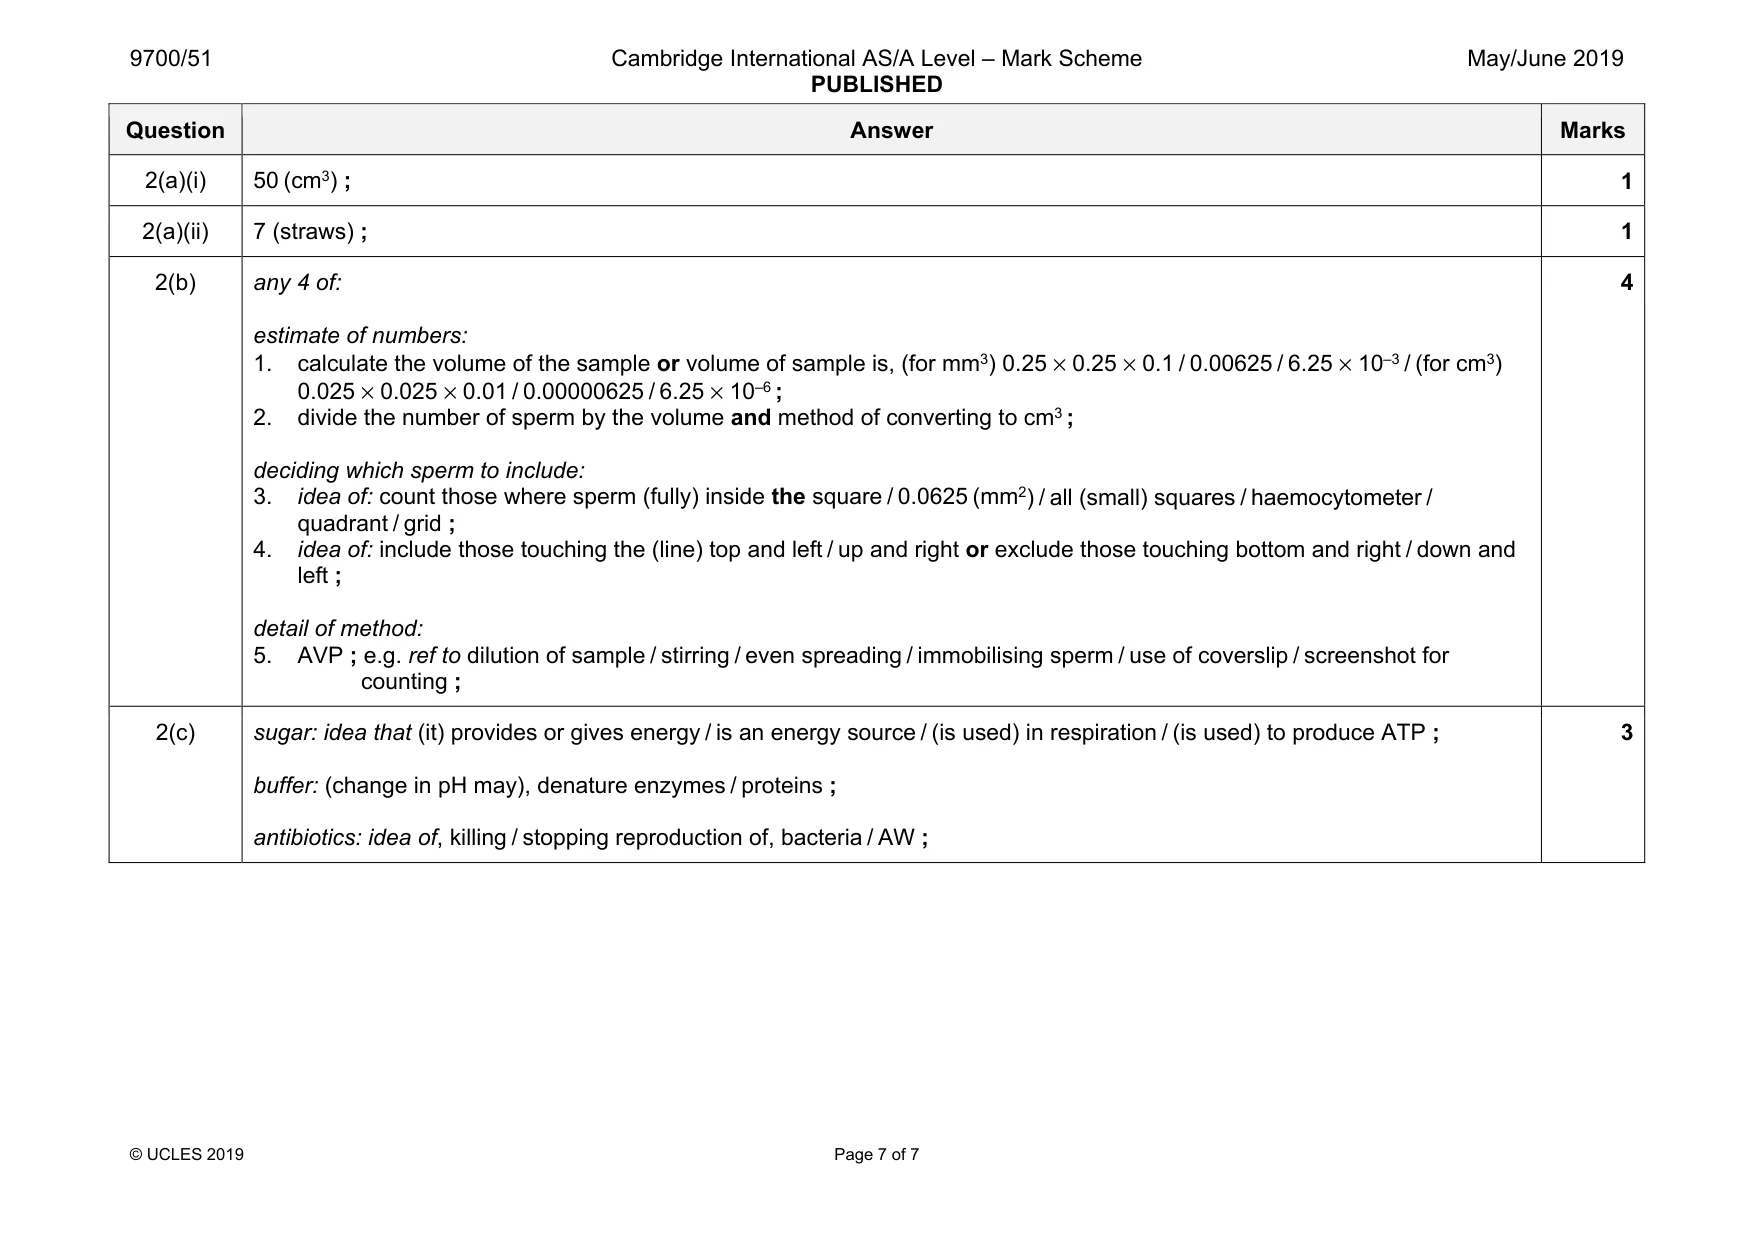
Mark scheme: 2(a)(i) 50 (cm3) ; 1 2(a)(ii) 7 (straws) ; 1 2(b) any 4 of: estimate of numbers: 1. calculate the volume of the sample or volume of sample is, (for mm3) 0.25 × 0.25 × 0.1 / 0.00625 / 6.25 × 10⁻³ / (for cm3) 0.025 × 0.025 × 0.01 / 0.00000625 / 6.25 × 10⁻⁶ ; 2. divide the number of sperm by the volume and method of converting to cm3 ; deciding which sperm to include: 3. idea of: count those where sperm (fully) inside the square / 0.0625 (mm2) / all (small) squares / haemocytometer / quadrant / grid ; 4. idea of: include those touching the (line) top and left / up and right or exclude those touching bottom and right / down and left ; detail of method: 5. AVP ; e.g. ref to dilution of sample / stirring / even spreading / immobilising sperm / use of coverslip / screenshot for counting ; 4 2(c) sugar: idea that (it) provides or gives energy / is an energy source / (is used) in respiration / (is used) to produce ATP ; buffer: (change in pH may), denature enzymes / proteins ; antibiotics: idea of, killing / stopping reproduction of, bacteria / AW ; 3
What was in this paper
The subtopics covered by these 2 questions, and how many questions each got. Open one in a new tab to see every Cambridge question on it.
What you needed in this session
Cambridge’s own grade thresholds for 2019 May/June, Paper 5 · Variant 1. A higher threshold means an easier paper — the bar moves with how the cohort did.