Cambridge A Level Biology 9700 — 2019 Feb/March Paper 5 · Variant 2
9700/52/F/M/19 · 2 questions · 30 marks · ≈34 min
The question paper and its mark scheme, free to read here and free to download. This is Cambridge’s own paper, exactly as it was sat.
Question paper8 pages
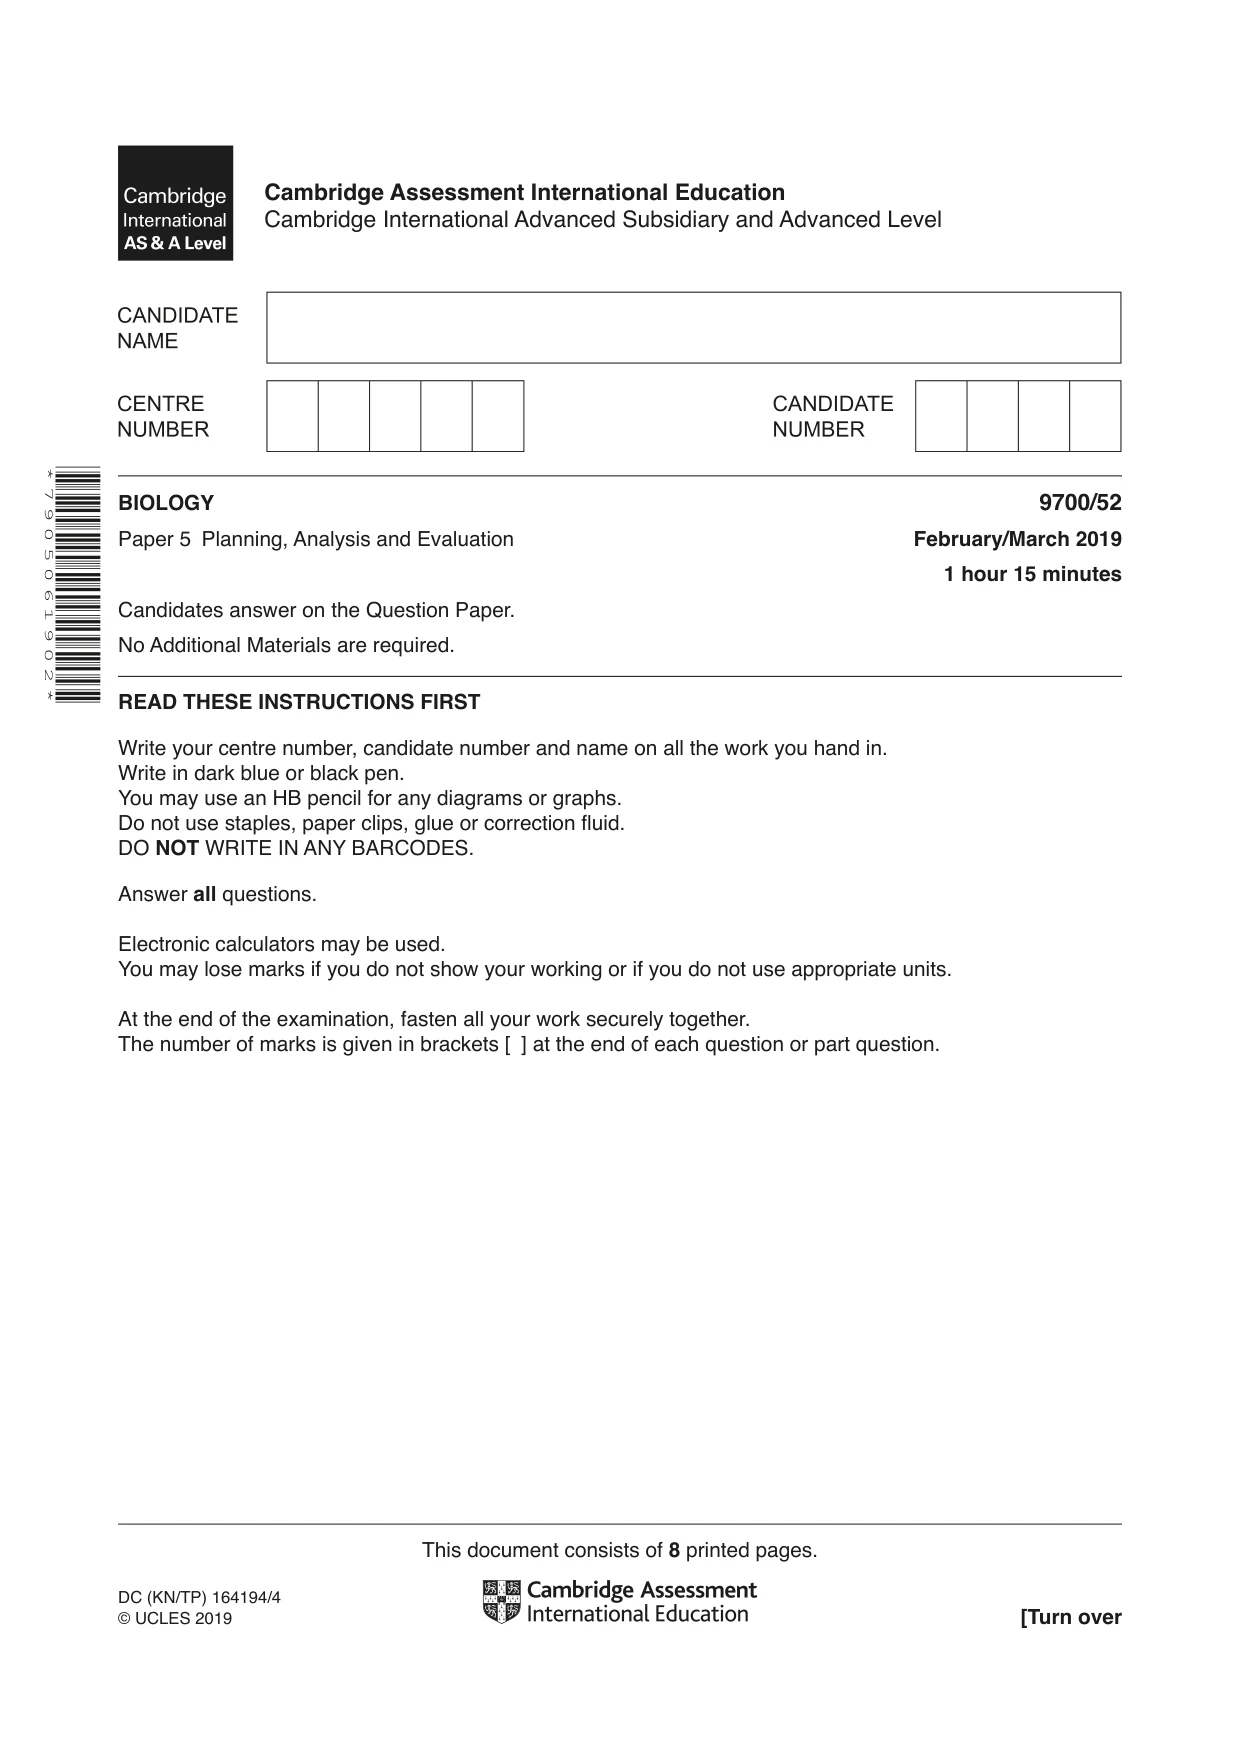
Mark scheme8 pages
Answers below. Sit the paper first if you are practising.
Questions as text
Q1 · In an investigation to find the water potential of onion tissue, some students used…
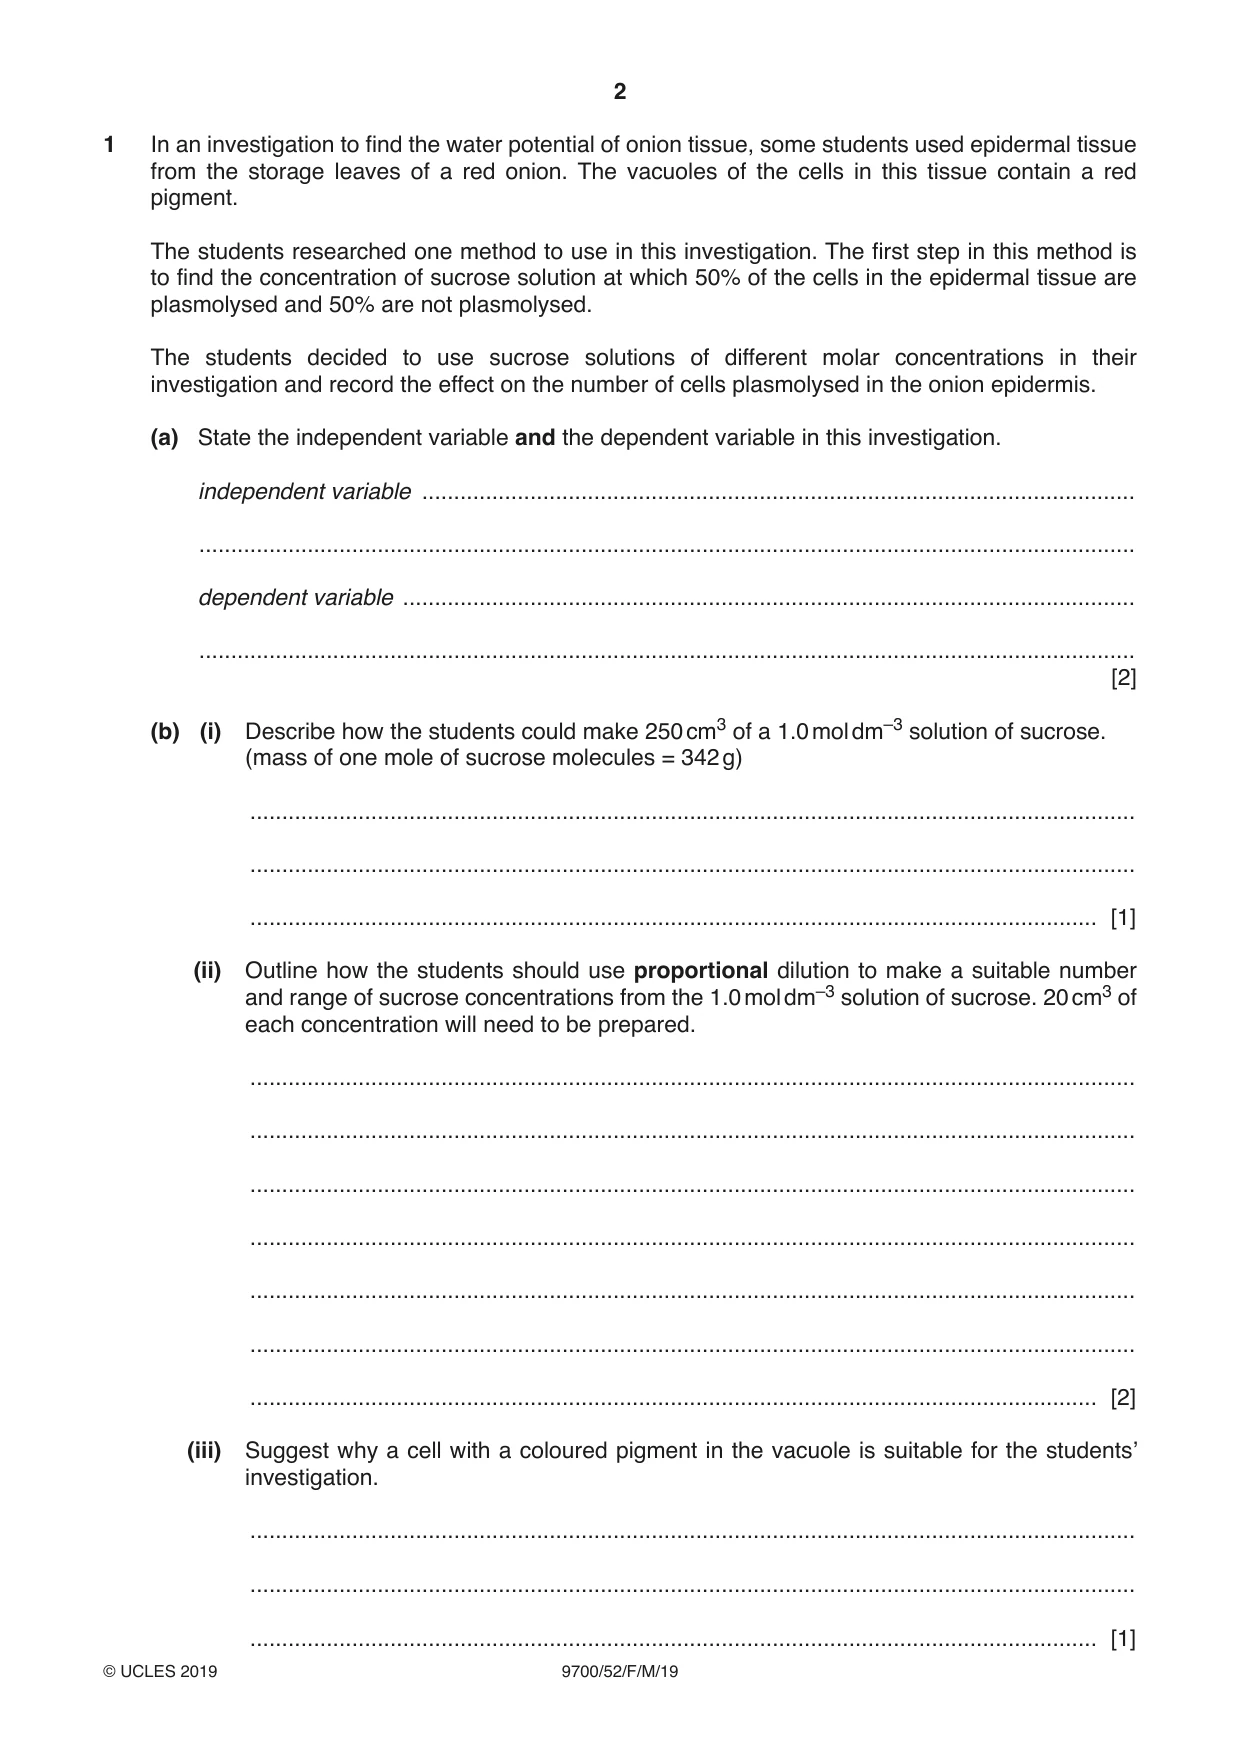
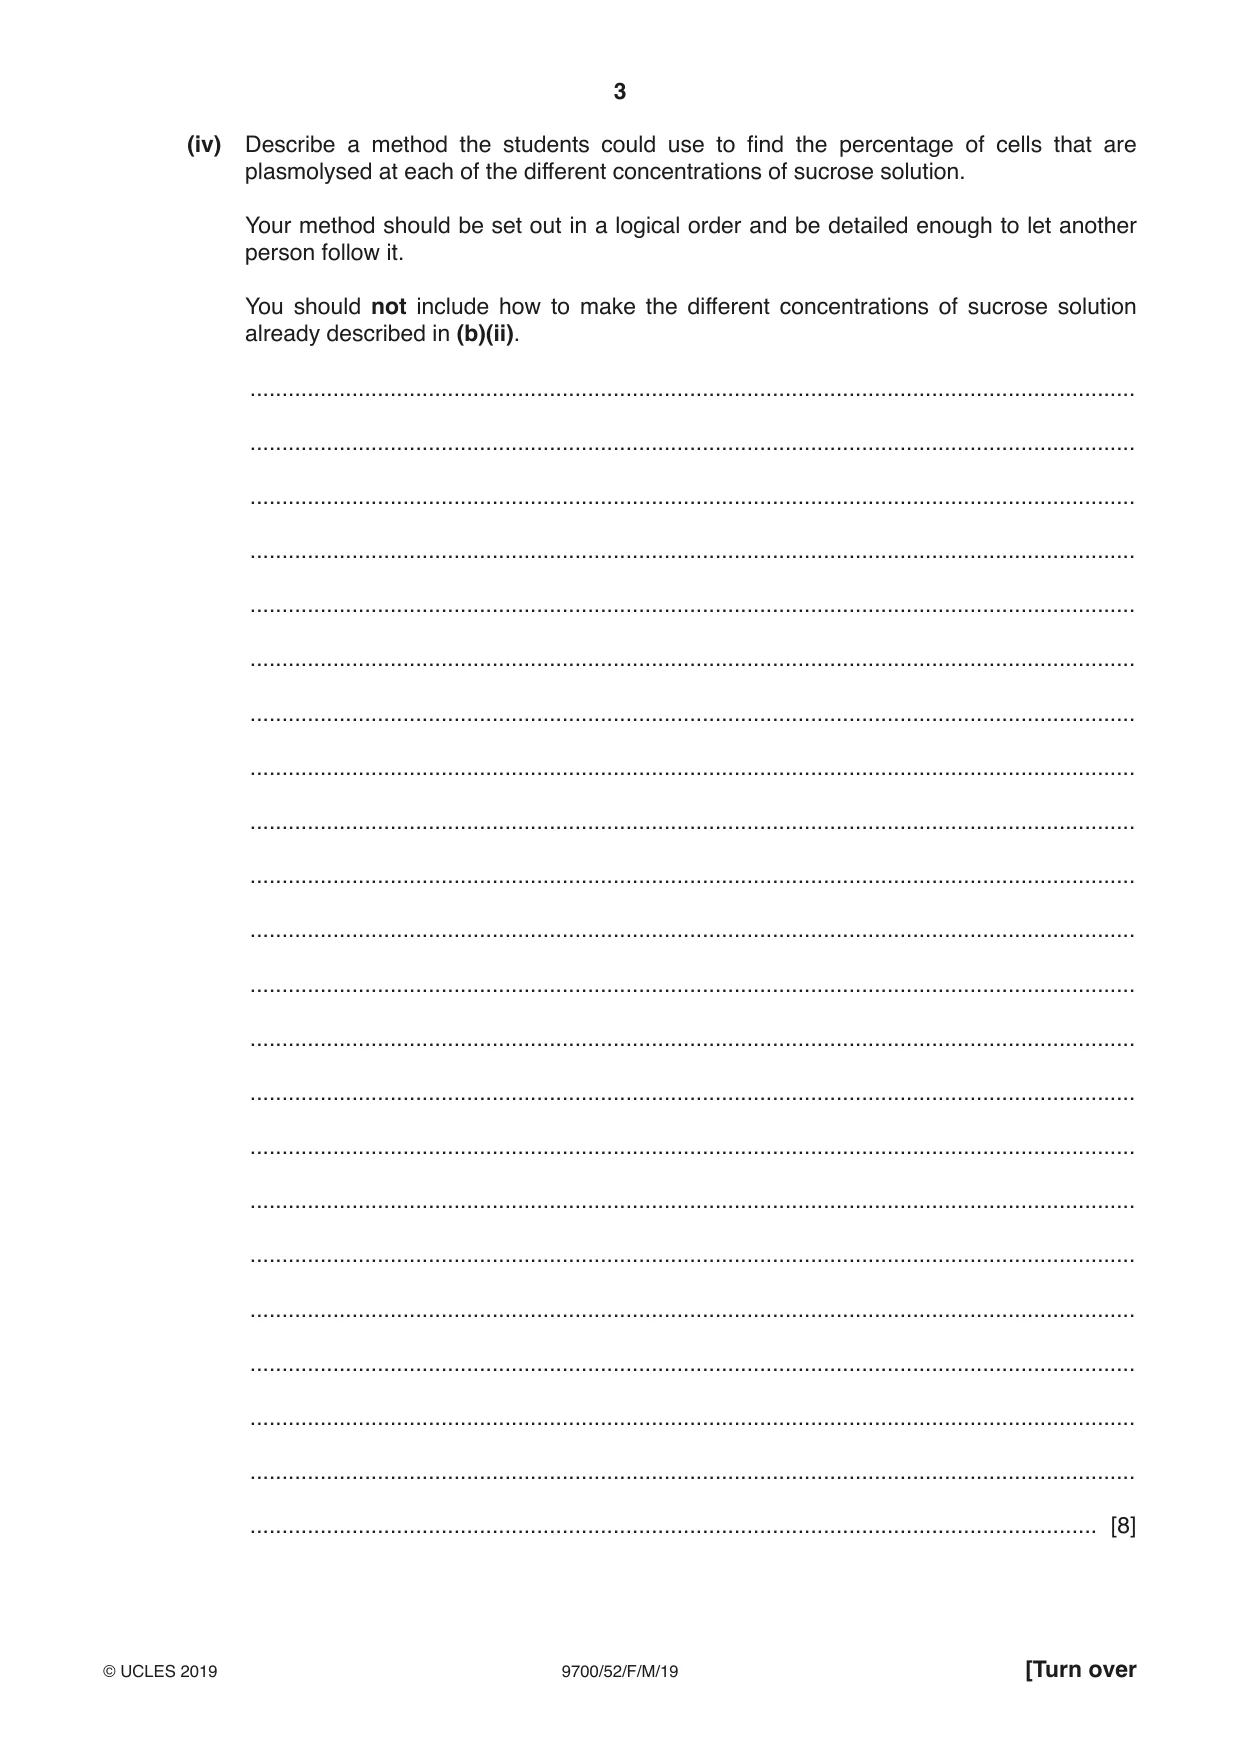
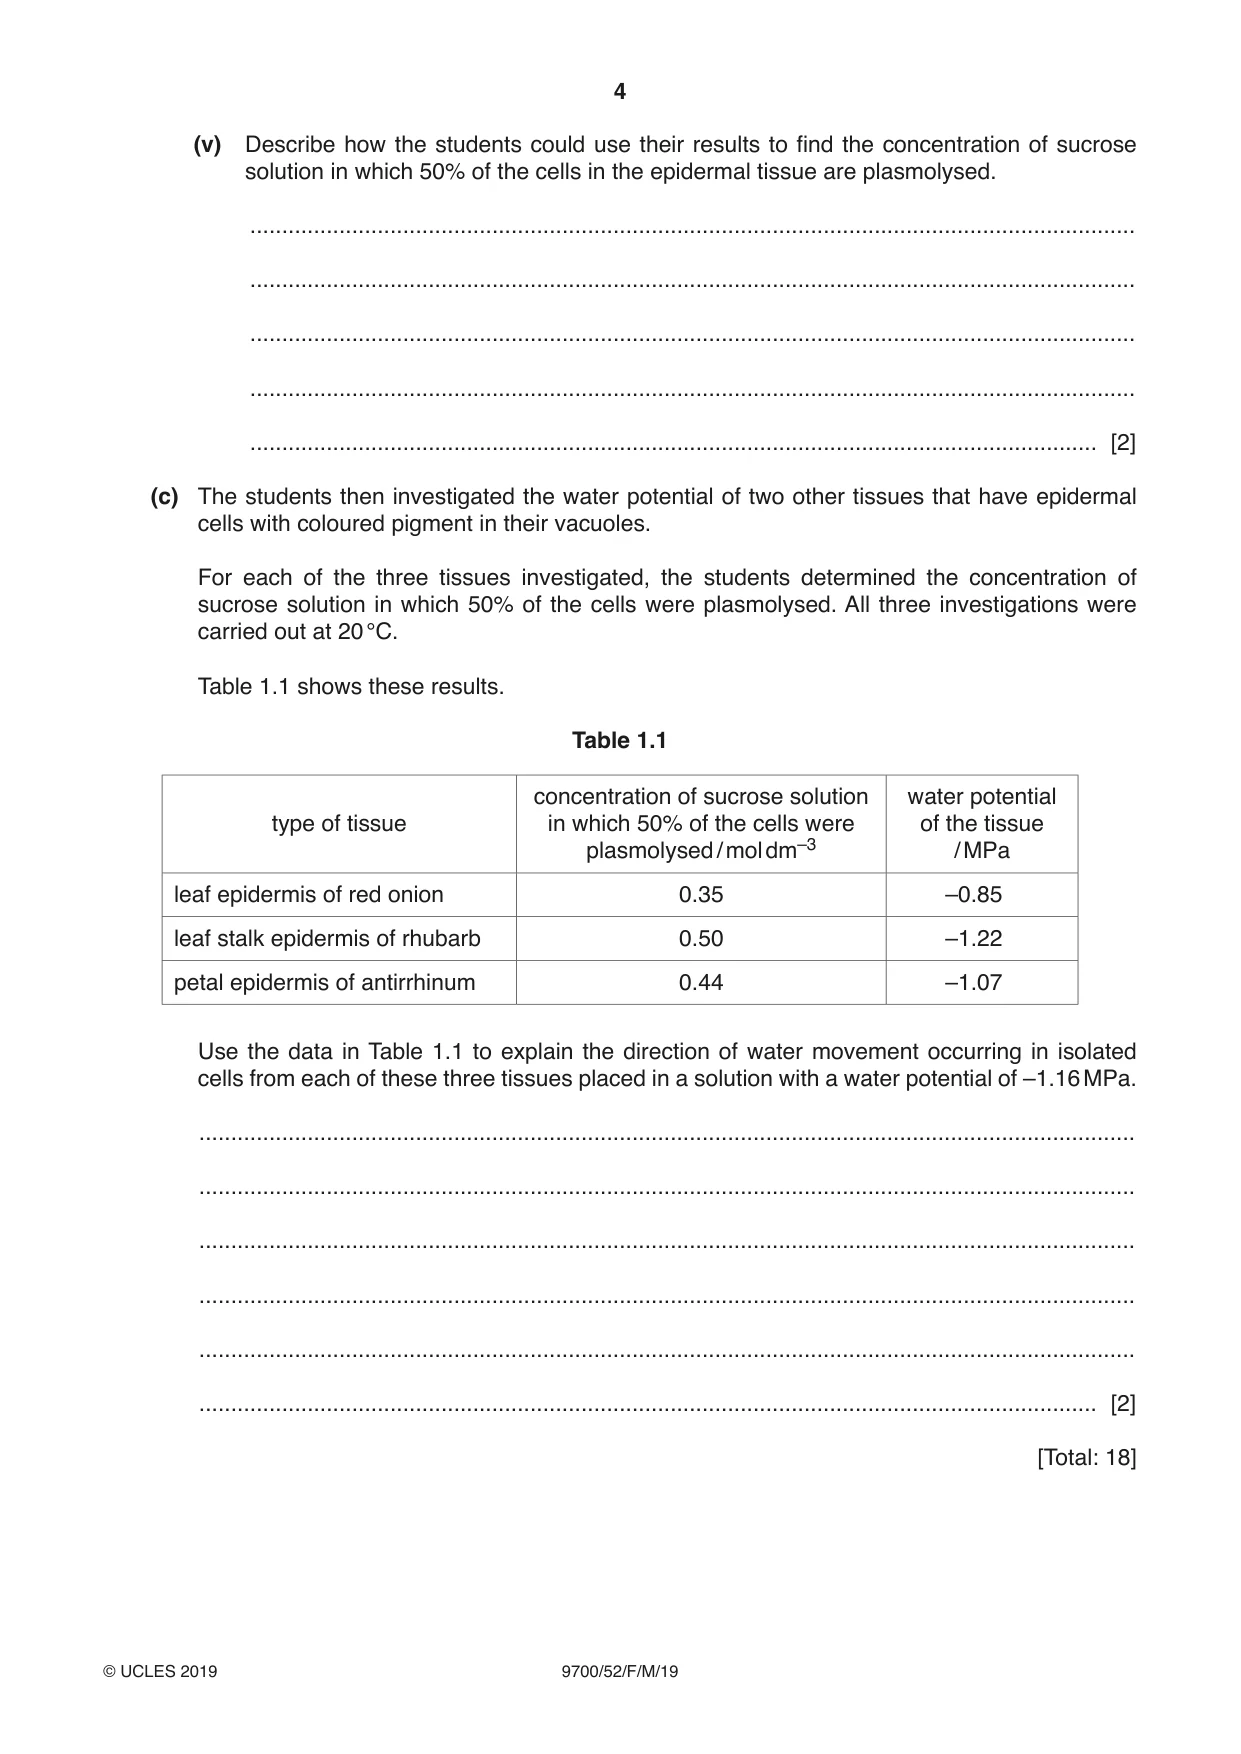
1 In an investigation to find the water potential of onion tissue, some students used epidermal tissue from the storage leaves of a red onion. The vacuoles of the cells in this tissue contain a red pigment. The students researched one method to use in this investigation. The first step in this method is to find the concentration of sucrose solution at which 50% of the cells in the epidermal tissue are plasmolysed and 50% are not plasmolysed. The students decided to use sucrose solutions of different molar concentrations in their investigation and record the effect on the number of cells plasmolysed in the onion epidermis. (a) State the independent variable and the dependent variable in this investigation. independent variable ................................................................................................................ ................................................................................................................................................... dependent variable ................................................................................................................... ................................................................................................................................................... [2] (b) (i) Describe how the students could make 250 cm3 of a 1.0 mol dm–3 solution of sucrose. (mass of one mole of sucrose molecules = 342 g) ........................................................................................................................................... ........................................................................................................................................... ..................................................................................................................................... [1] (ii) Outline how the students should use proportional dilution to make a suitable number and range of sucrose concentrations from the 1.0 mol dm–3 solution of sucrose. 20 cm3 of each concentration will need to be prepared. ........................................................................................................................................... ........................................................................................................................................... ........................................................................................................................................... ........................................................................................................................................... ........................................................................................................................................... ........................................................................................................................................... ..................................................................................................................................... [2] (iii) Suggest why a cell with a coloured pigment in the vacuole is suitable for the students’ investigation. ........................................................................................................................................... ........................................................................................................................................... ..................................................................................................................................... [1] (iv) Describe a method the students could use to find the percentage of cells that are plasmolysed at each of the different concentrations of sucrose solution. Your method should be set out in a logical order and be detailed enough to let another person follow it. You should not include how to make the different concentrations of sucrose solution already described in (b)(ii). ........................................................................................................................................... ........................................................................................................................................... ........................................................................................................................................... ........................................................................................................................................... ........................................................................................................................................... ........................................................................................................................................... ........................................................................................................................................... ........................................................................................................................................... ........................................................................................................................................... ........................................................................................................................................... ........................................................................................................................................... ........................................................................................................................................... ........................................................................................................................................... ........................................................................................................................................... ........................................................................................................................................... ........................................................................................................................................... ........................................................................................................................................... ........................................................................................................................................... ........................................................................................................................................... ........................................................................................................................................... ........................................................................................................................................... ..................................................................................................................................... [8] (v) Describe how the students could use their results to find the concentration of sucrose solution in which 50% of the cells in the epidermal tissue are plasmolysed. ........................................................................................................................................... ........................................................................................................................................... ........................................................................................................................................... ........................................................................................................................................... ..................................................................................................................................... [2] (c) The students then investigated the water potential of two other tissues that have epidermal cells with coloured pigment in their vacuoles. For each of the three tissues investigated, the students determined the concentration of sucrose solution in which 50% of the cells were plasmolysed. All three investigations were carried out at 20 °C. Table 1.1 shows these results. Table 1.1 concentration of sucrose solution water potential type of tissue in which 50% of the cells were of the tissue plasmolysed / mol dm–3 / MPa leaf epidermis of red onion 0.35 –0.85 leaf stalk epidermis of rhubarb 0.50 –1.22 petal epidermis of antirrhinum 0.44 –1.07 Use the data in Table 1.1 to explain the direction of water movement occurring in isolated cells from each of these three tissues placed in a solution with a water potential of –1.16 MPa. ................................................................................................................................................... ................................................................................................................................................... ................................................................................................................................................... ................................................................................................................................................... ................................................................................................................................................... ............................................................................................................................................. [2] [Total: 18]
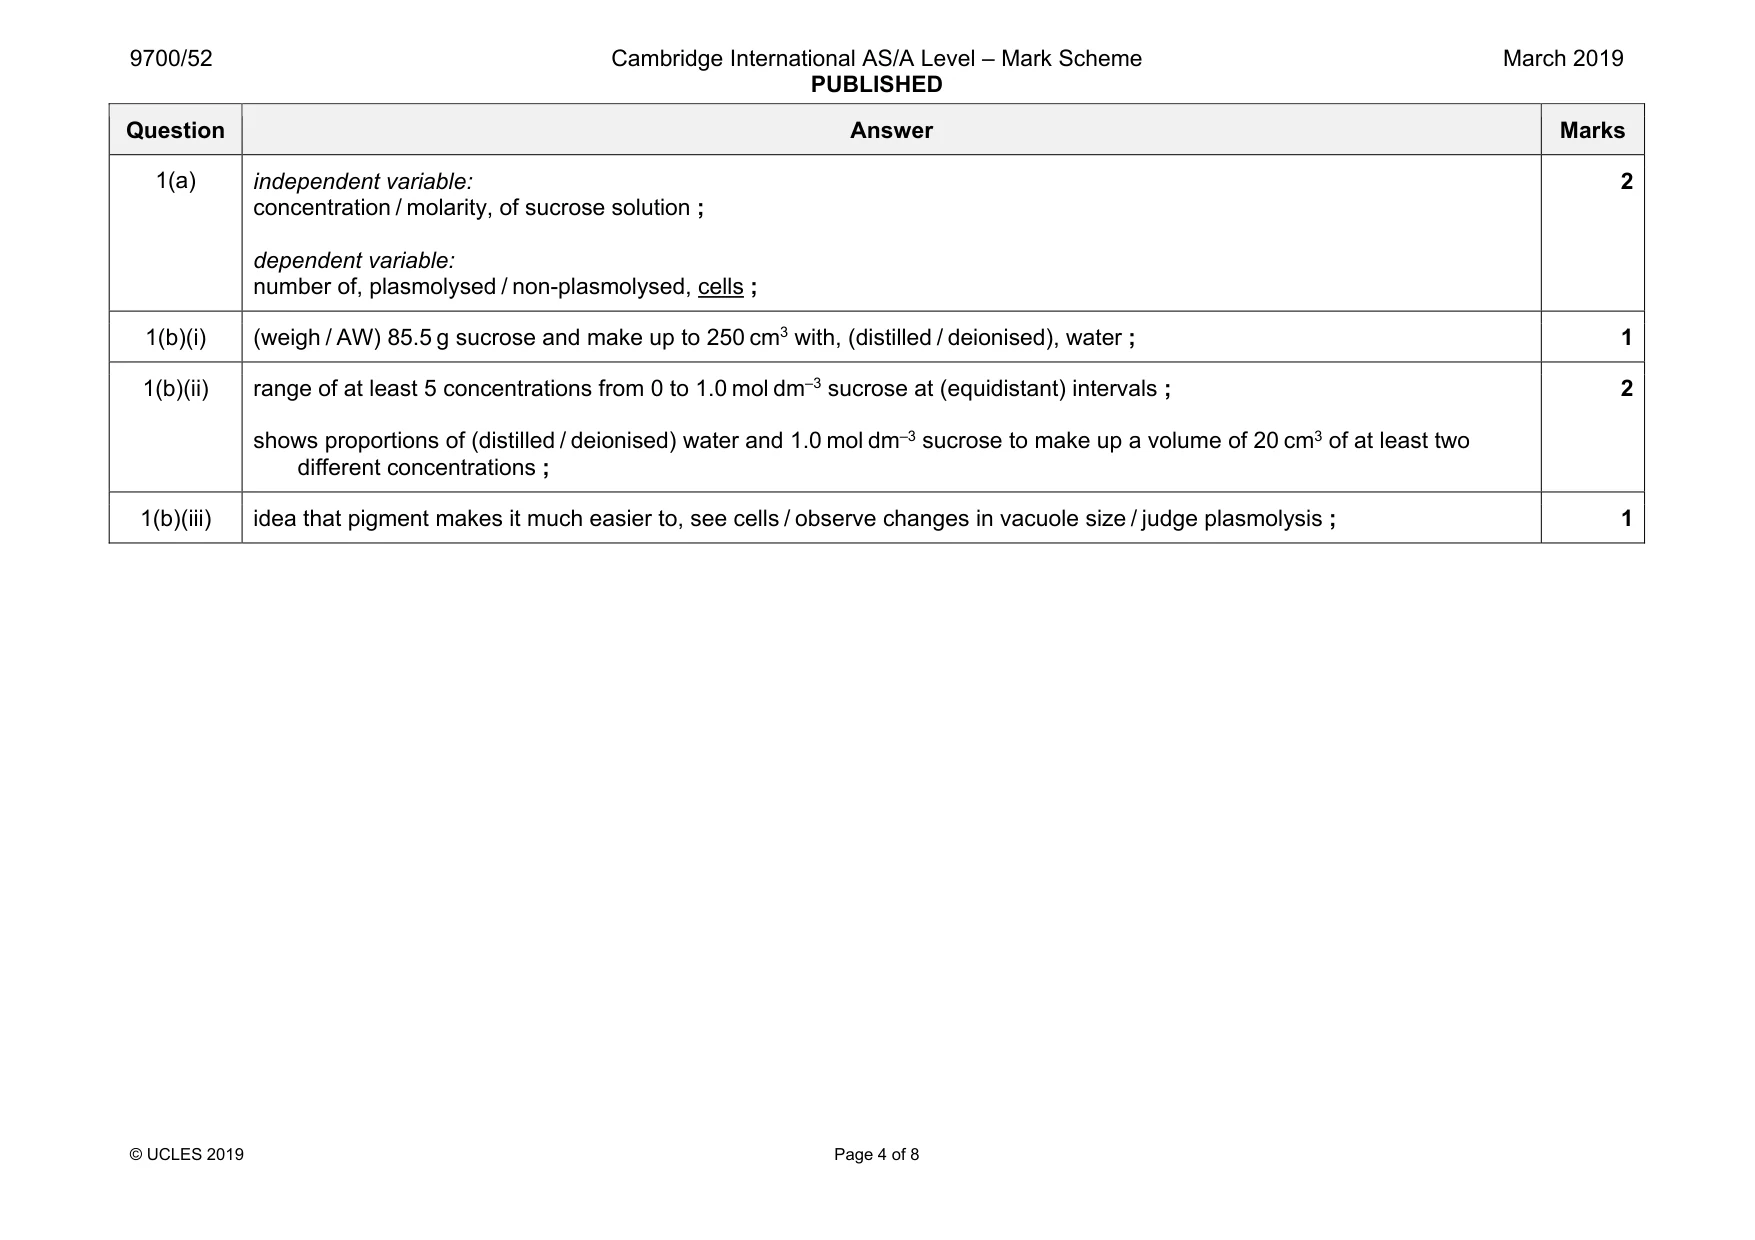
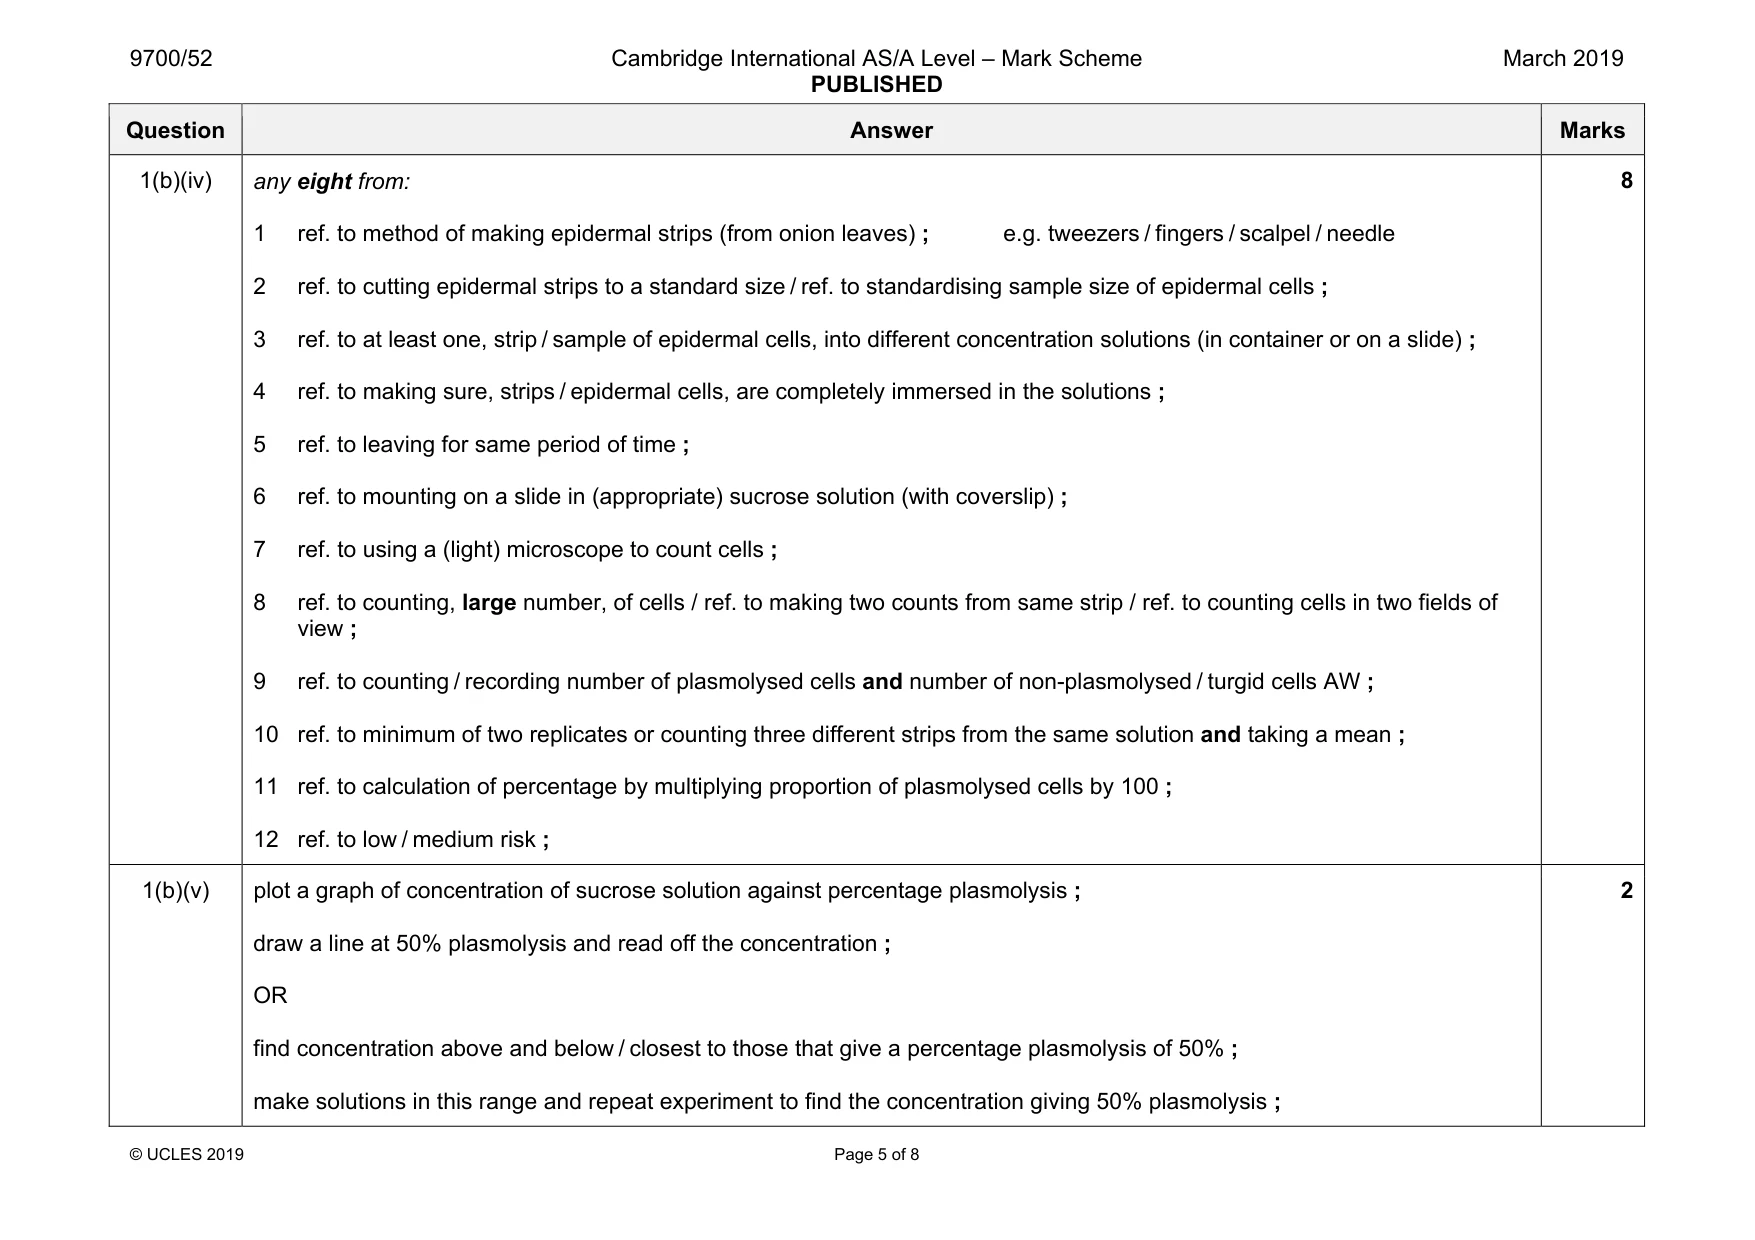
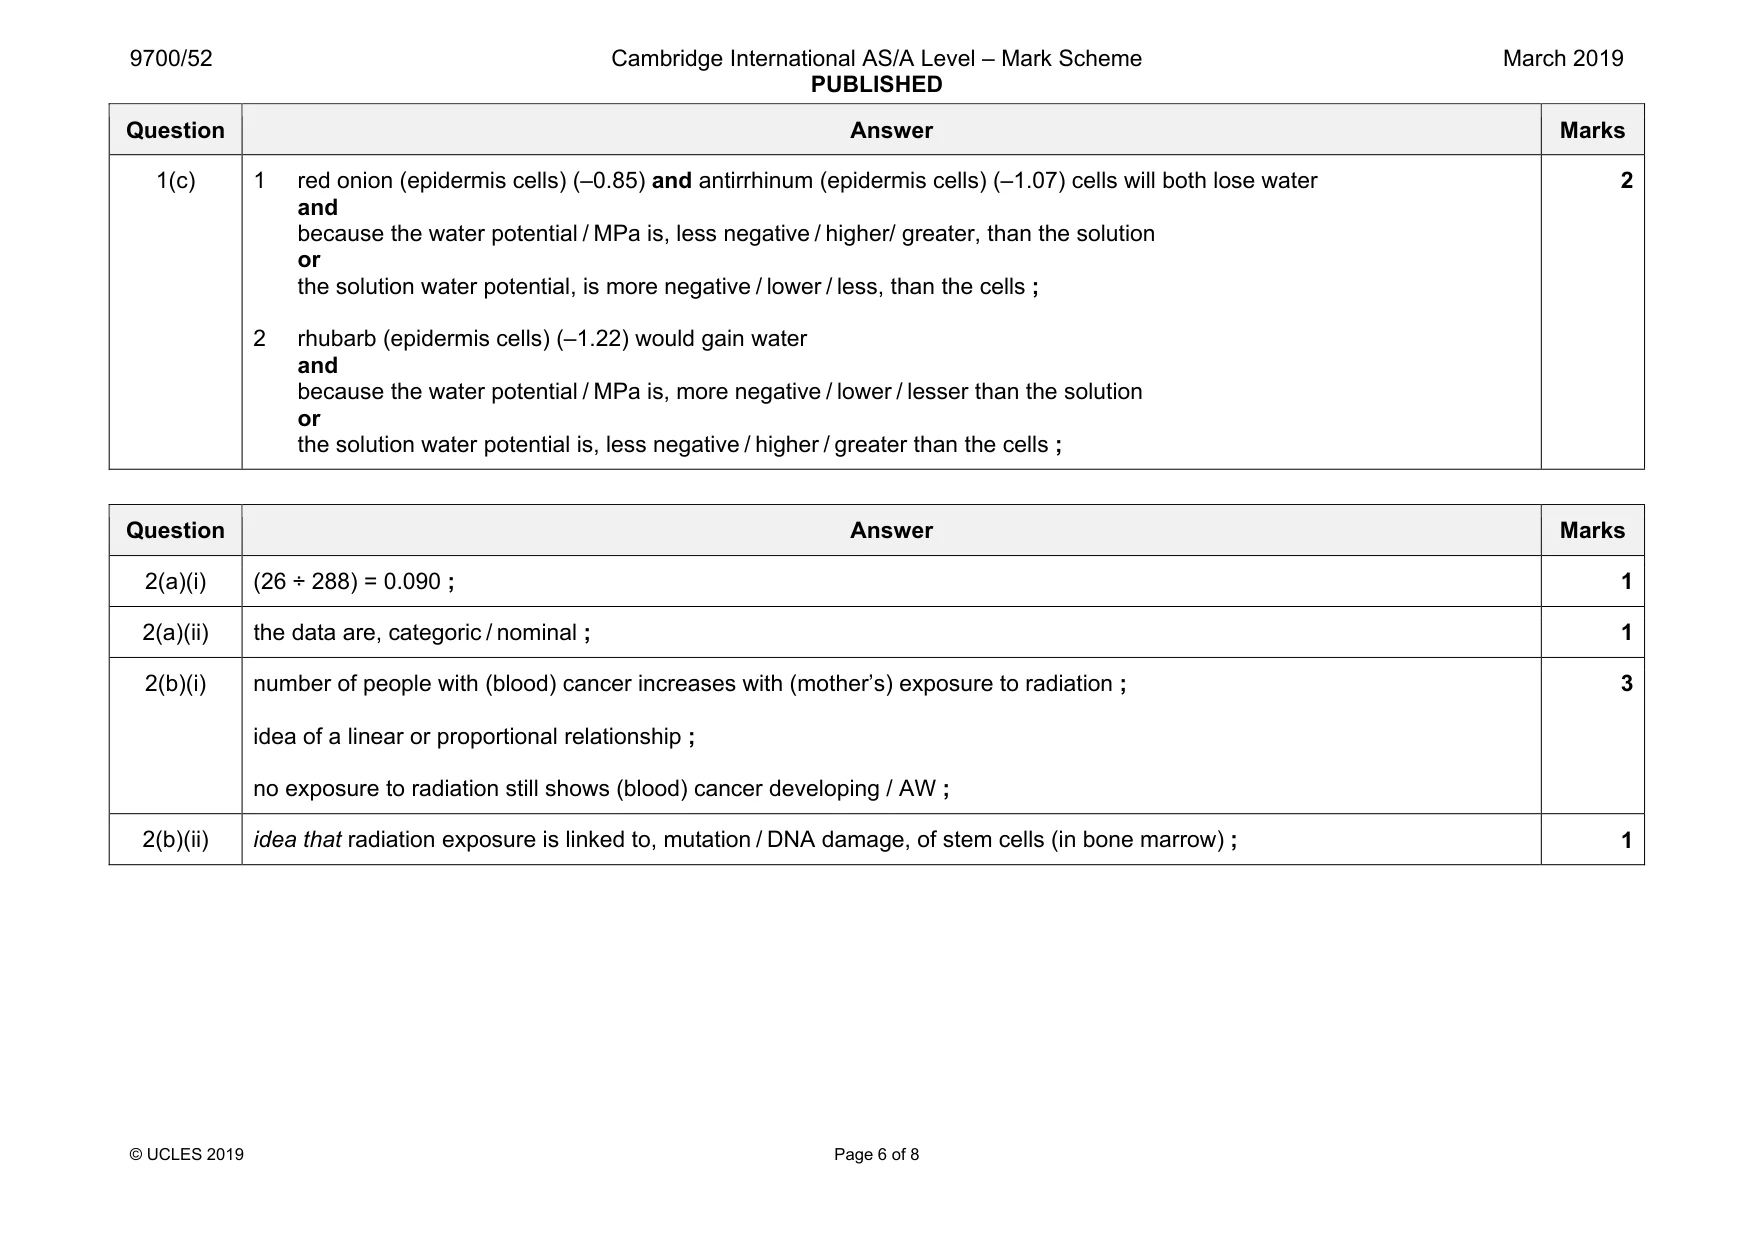
Mark scheme: 1(a) independent variable: concentration / molarity, of sucrose solution ; dependent variable: number of, plasmolysed / non-plasmolysed, cells ; 2 1(b)(i) (weigh / AW) 85.5 g sucrose and make up to 250 cm3 with, (distilled / deionised), water ; 1 1(b)(ii) range of at least 5 concentrations from 0 to 1.0 mol dm–3 sucrose at (equidistant) intervals ; shows proportions of (distilled / deionised) water and 1.0 mol dm–3 sucrose to make up a volume of 20 cm3 of at least two different concentrations ; 2 1(b)(iii) idea that pigment makes it much easier to, see cells / observe changes in vacuole size / judge plasmolysis ; 1 Question Answer Marks 1(b)(iv) any eight from: 1 ref. to method of making epidermal strips (from onion leaves) ; e.g. tweezers / fingers / scalpel / needle 2 ref. to cutting epidermal strips to a standard size / ref. to standardising sample size of epidermal cells ; 3 ref. to at least one, strip / sample of epidermal cells, into different concentration solutions (in container or on a slide) ; 4 ref. to making sure, strips / epidermal cells, are completely immersed in the solutions ; 5 ref. to leaving for same period of time ; 6 ref. to mounting on a slide in (appropriate) sucrose solution (with coverslip) ; 7 ref. to using a (light) microscope to count cells ; 8 ref. to counting, large number, of cells / ref. to making two counts from same strip / ref. to counting cells in two fields of view ; 9 ref. to counting / recording number of plasmolysed cells and number of non-plasmolysed / turgid cells AW ; 10 ref. to minimum of two replicates or counting three different strips from the same solution and taking a mean ; 11 ref. to calculation of percentage by multiplying proportion of plasmolysed cells by 100 ; 12 ref. to low / medium risk ; 8 1(b)(v) plot a graph of concentration of sucrose solution against percentage plasmolysis ; draw a line at 50% plasmolysis and read off the concentration ; OR find concentration above and below / closest to those that give a percentage plasmolysis of 50% ; make solutions in this range and repeat experiment to find the concentration giving 50% plasmolysis ; 2 Question Answer Marks 1(c) 1 red onion (epidermis cells) (–0.85) and antirrhinum (epidermis cells) (–1.07) cells will both lose water and because the water potential / MPa is, less negative / higher/ greater, than the solution or the solution water potential, is more negative / lower / less, than the cells ; 2 rhubarb (epidermis cells) (–1.22) would gain water and because the water potential / MPa is, more negative / lower / lesser than the solution or the solution water potential is, less negative / higher / greater than the cells ; 2
Q2 · Cancer of the blood, including leukaemia and lymphoma, can be caused by mutations of stem…
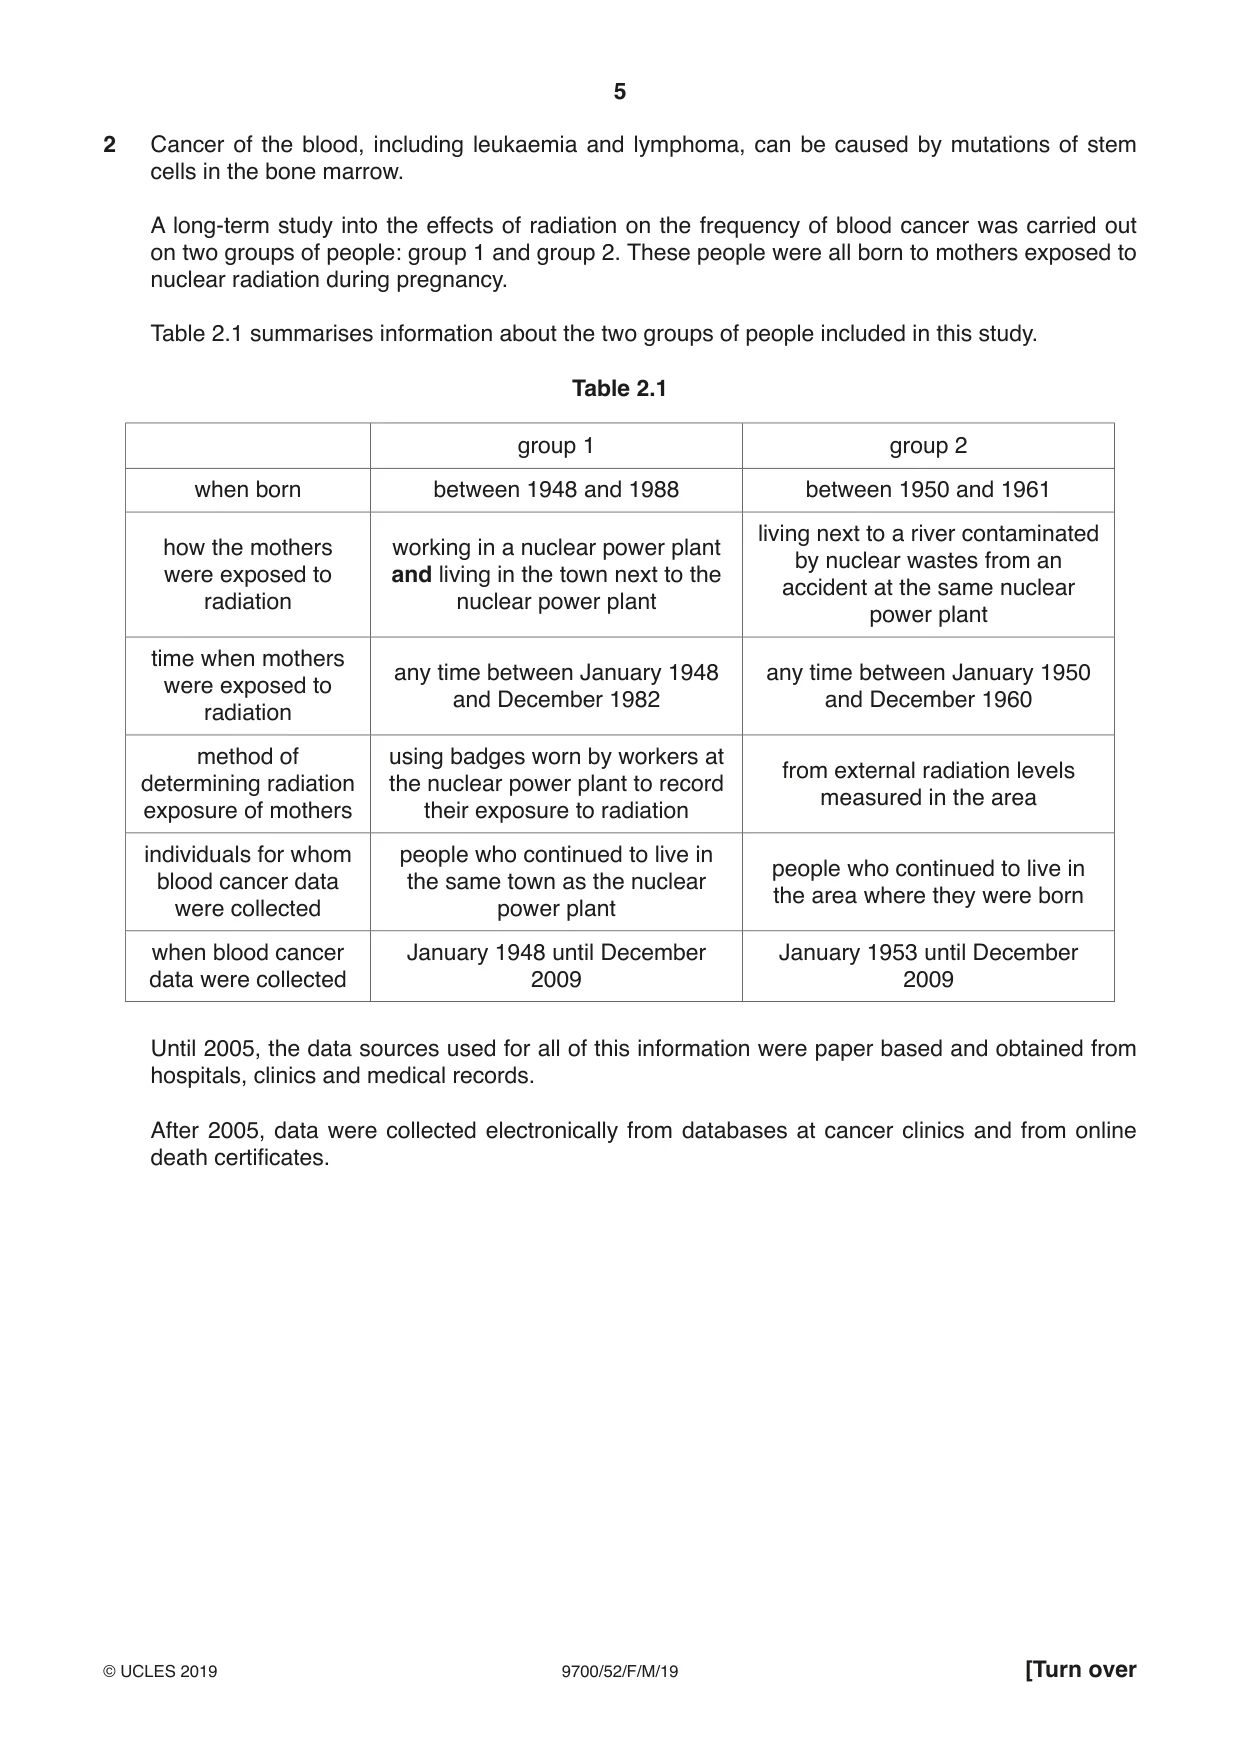
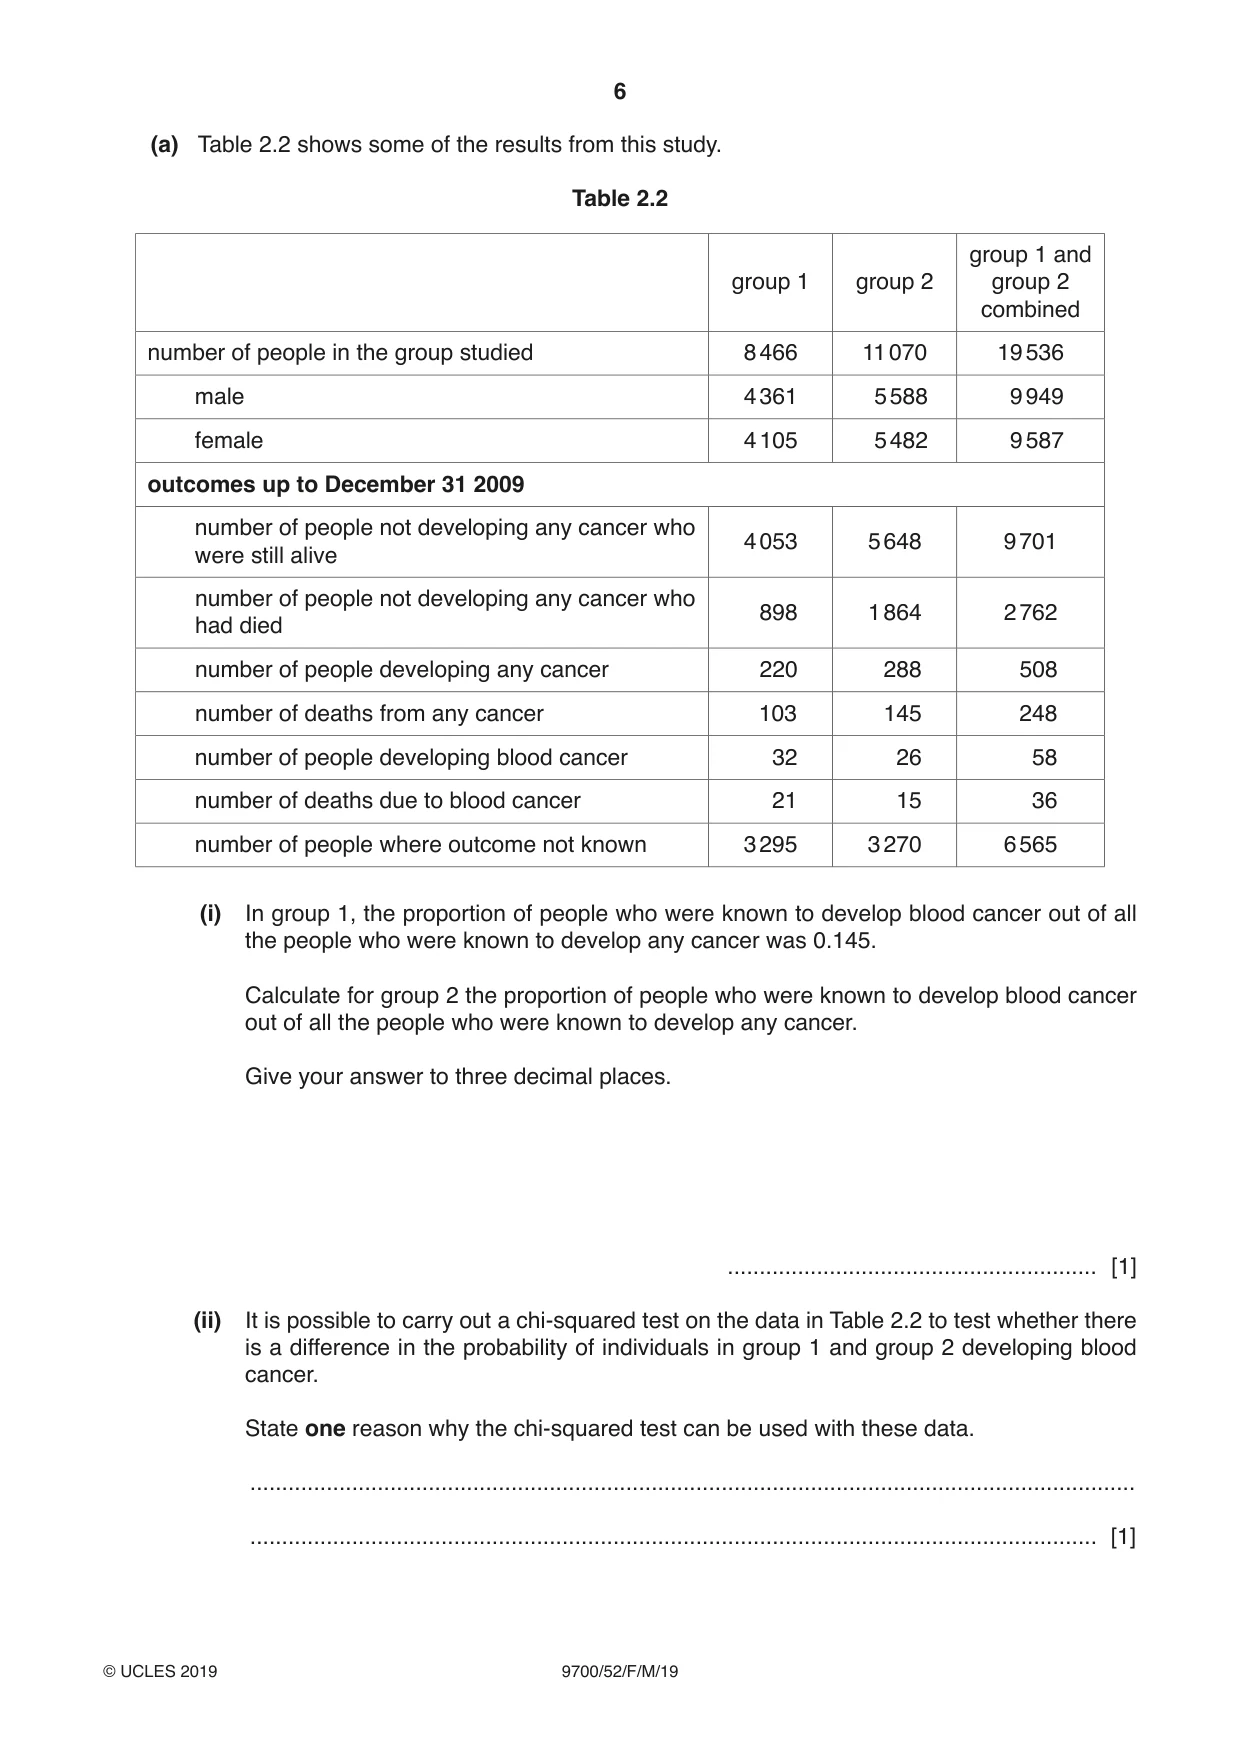
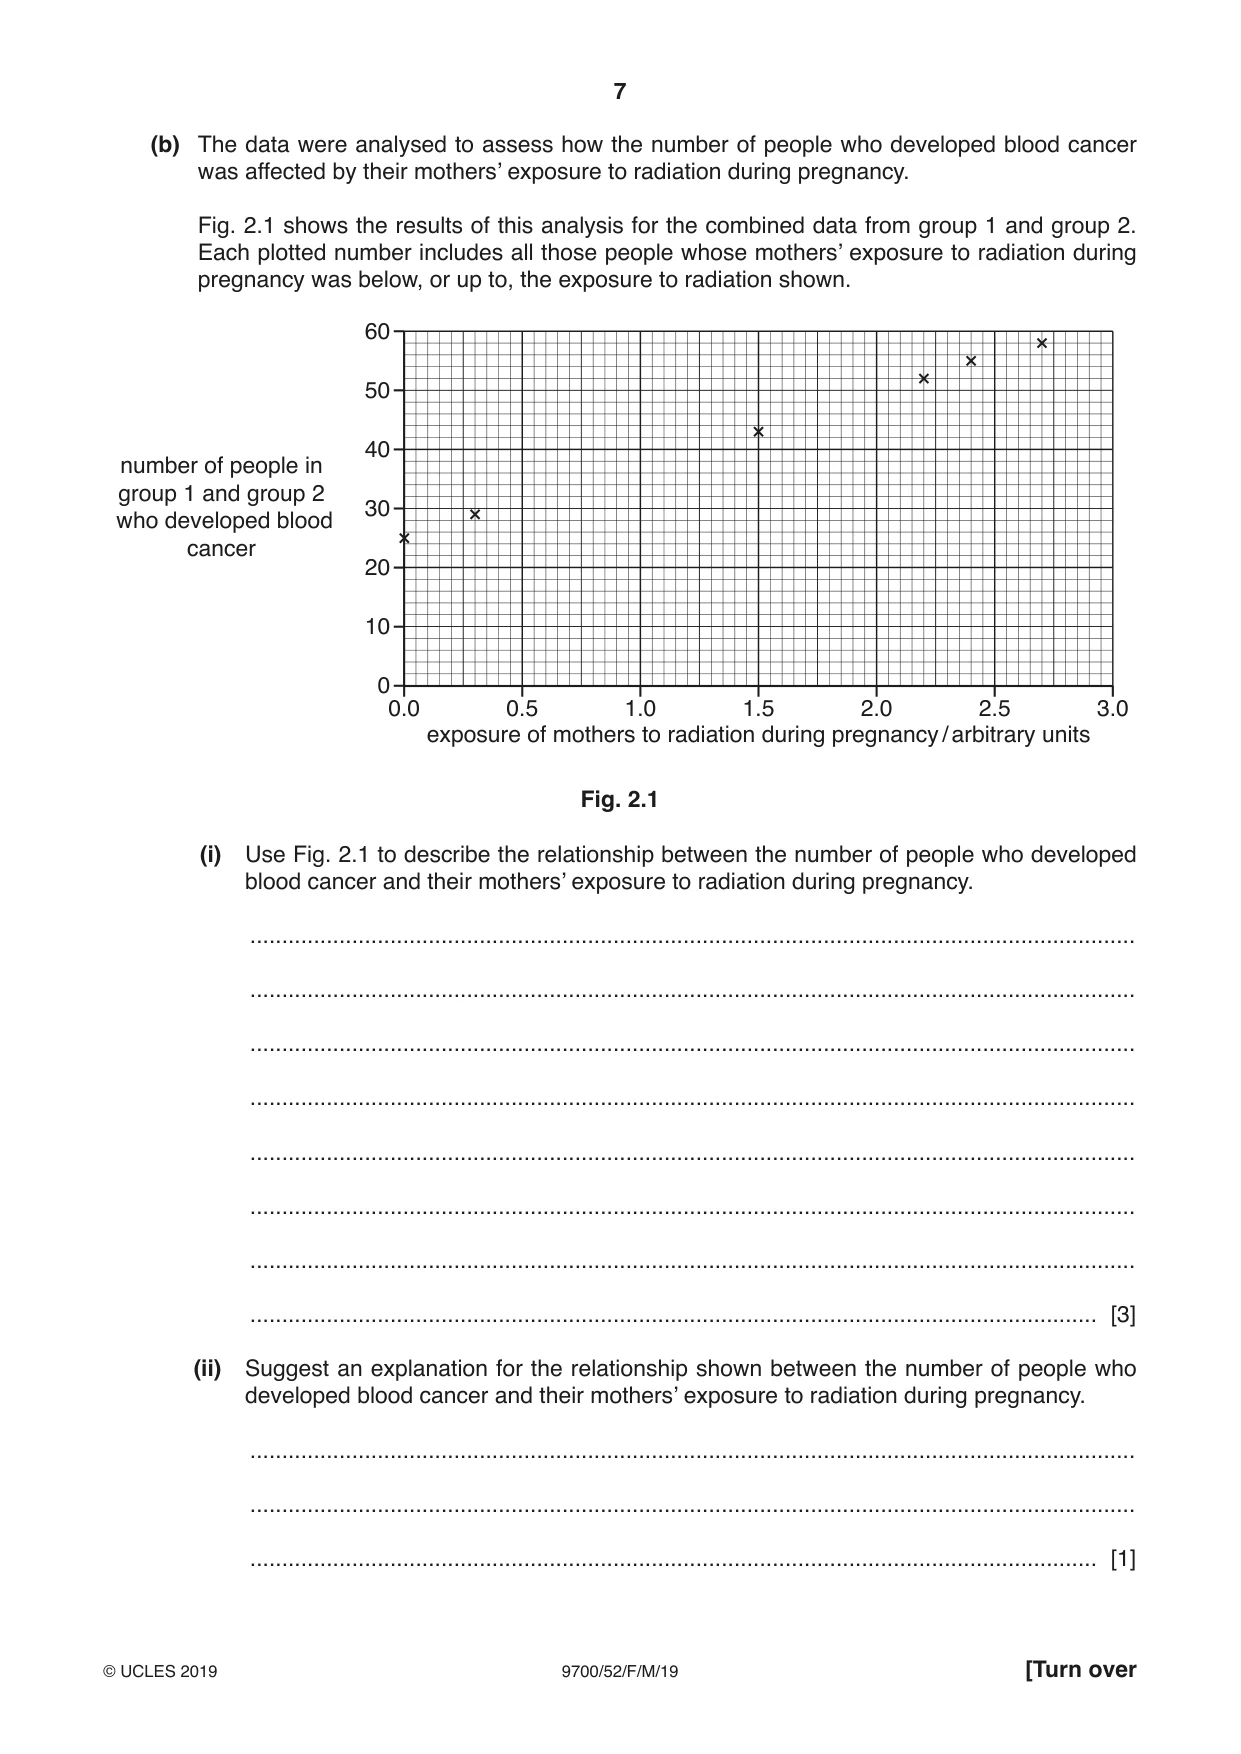
2 Cancer of the blood, including leukaemia and lymphoma, can be caused by mutations of stem cells in the bone marrow. A long-term study into the effects of radiation on the frequency of blood cancer was carried out on two groups of people: group 1 and group 2. These people were all born to mothers exposed to nuclear radiation during pregnancy. Table 2.1 summarises information about the two groups of people included in this study. Table 2.1 group 1 group 2 when born between 1948 and 1988 between 1950 and 1961 living next to a river contaminated how the mothers working in a nuclear power plant by nuclear wastes from an were exposed to and living in the town next to the accident at the same nuclear radiation nuclear power plant power plant time when mothers any time between January 1948 any time between January 1950 were exposed to and December 1982 and December 1960 radiation method of using badges worn by workers at from external radiation levels determining radiation the nuclear power plant to record measured in the area exposure of mothers their exposure to radiation individuals for whom people who continued to live in people who continued to live in blood cancer data the same town as the nuclear the area where they were born were collected power plant when blood cancer January 1948 until December January 1953 until December data were collected 2009 2009 Until 2005, the data sources used for all of this information were paper based and obtained from hospitals, clinics and medical records. After 2005, data were collected electronically from databases at cancer clinics and from online death certificates. (a) Table 2.2 shows some of the results from this study. Table 2.2 group 1 and group 1 group 2 group 2 combined number of people in the group studied 8 466 11 070 19 536 male 4 361 5 588 9 949 female 4 105 5 482 9 587 outcomes up to December 31 2009 number of people not developing any cancer who 4 053 5 648 9 701 were still alive number of people not developing any cancer who 898 1 864 2 762 had died number of people developing any cancer 220 288 508 number of deaths from any cancer 103 145 248 number of people developing blood cancer 32 26 58 number of deaths due to blood cancer 21 15 36 number of people where outcome not known 3 295 3 270 6 565 (i) In group 1, the proportion of people who were known to develop blood cancer out of all the people who were known to develop any cancer was 0.145. Calculate for group 2 the proportion of people who were known to develop blood cancer out of all the people who were known to develop any cancer. Give your answer to three decimal places. .......................................................... [1] (ii) It is possible to carry out a chi-squared test on the data in Table 2.2 to test whether there is a difference in the probability of individuals in group 1 and group 2 developing blood cancer. State one reason why the chi-squared test can be used with these data. ........................................................................................................................................... ..................................................................................................................................... [1] (b) The data were analysed to assess how the number of people who developed blood cancer was affected by their mothers’ exposure to radiation during pregnancy. Fig. 2.1 shows the results of this analysis for the combined data from group 1 and group 2. Each plotted number includes all those people whose mothers’ exposure to radiation during pregnancy was below, or up to, the exposure to radiation shown. 60 50 40number of people in group 1 and group 2 30who developed blood cancer 20 10 0 0.0 0.5 1.0 1.5 2.0 2.5 3.0 exposure of mothers to radiation during pregnancy / arbitrary units Fig. 2.1 (i) Use Fig. 2.1 to describe the relationship between the number of people who developed blood cancer and their mothers’ exposure to radiation during pregnancy. ........................................................................................................................................... ........................................................................................................................................... ........................................................................................................................................... ........................................................................................................................................... ........................................................................................................................................... ........................................................................................................................................... ........................................................................................................................................... ..................................................................................................................................... [3] (ii) Suggest an explanation for the relationship shown between the number of people who developed blood cancer and their mothers’ exposure to radiation during pregnancy. ........................................................................................................................................... ........................................................................................................................................... ..................................................................................................................................... [1]
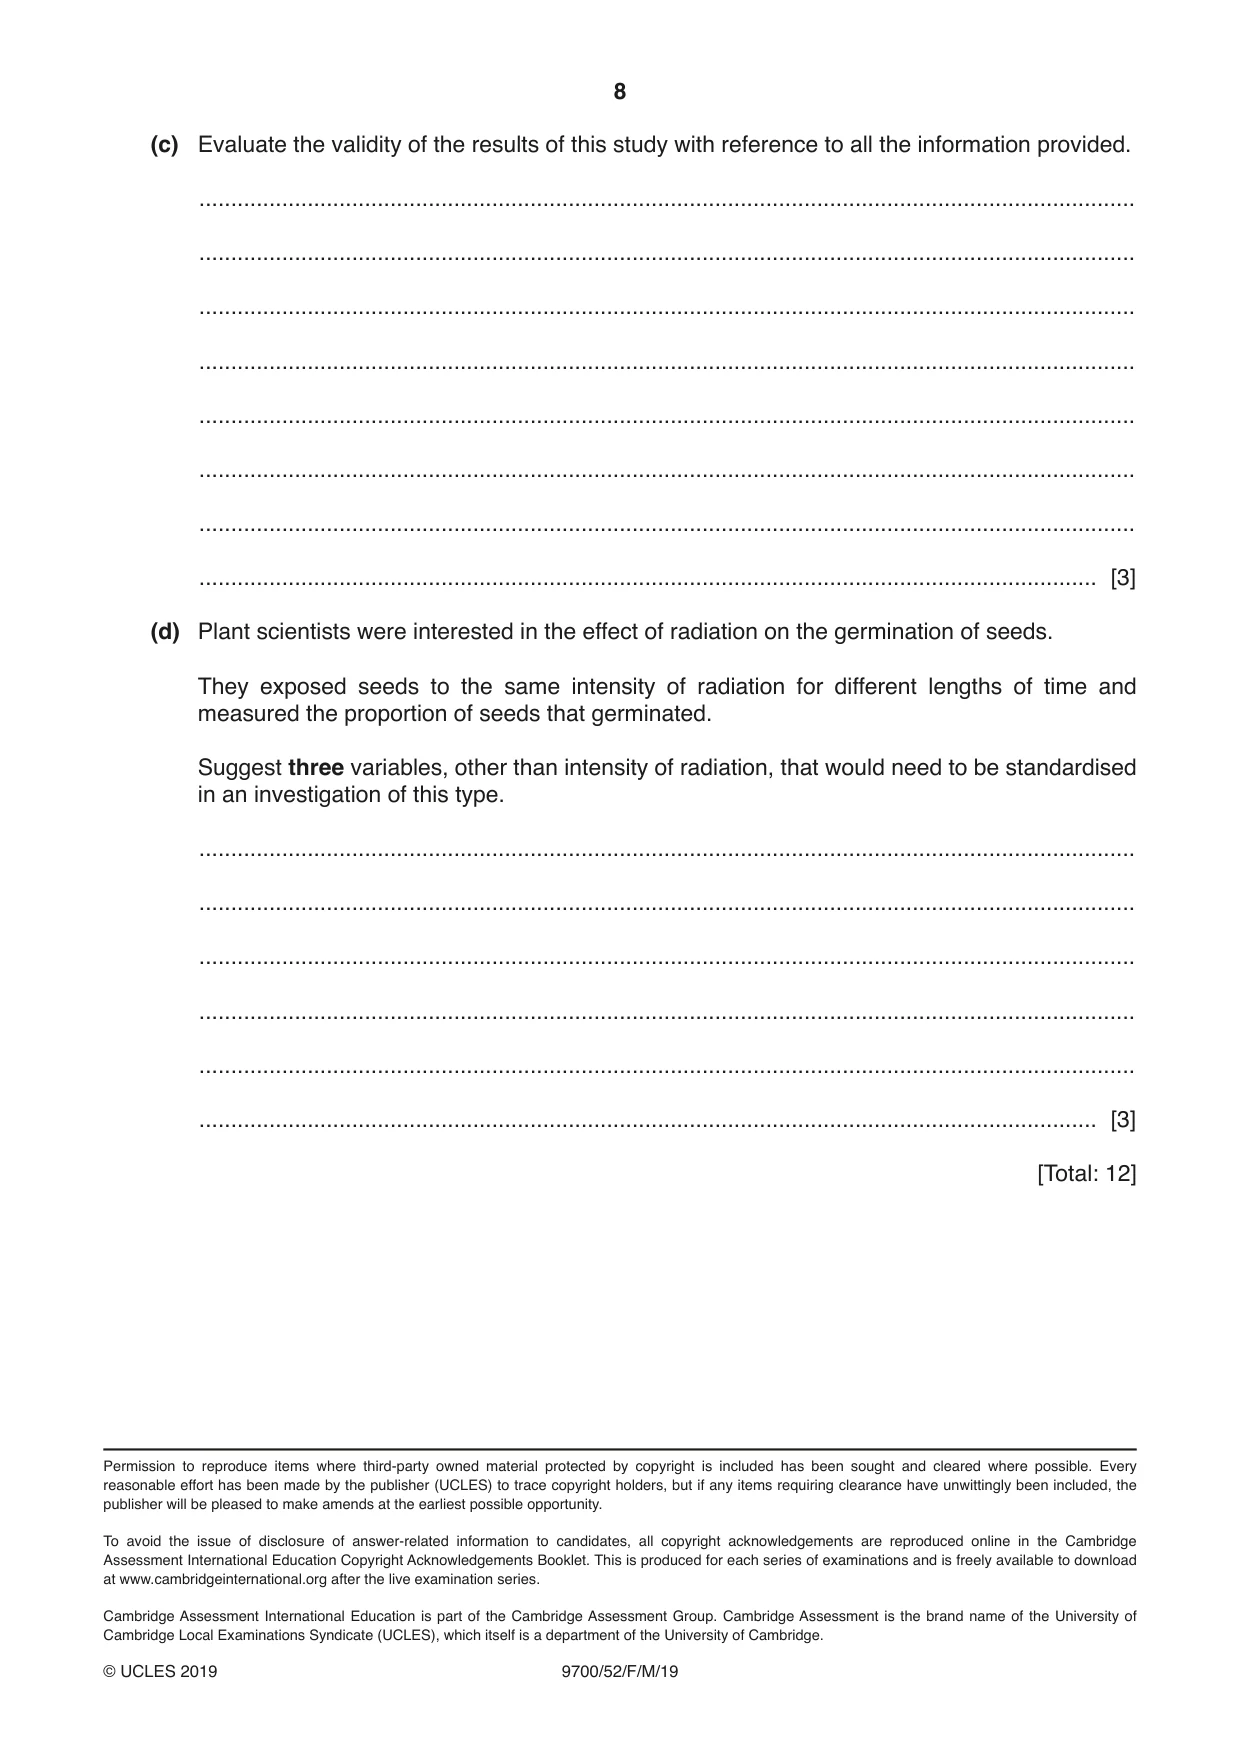
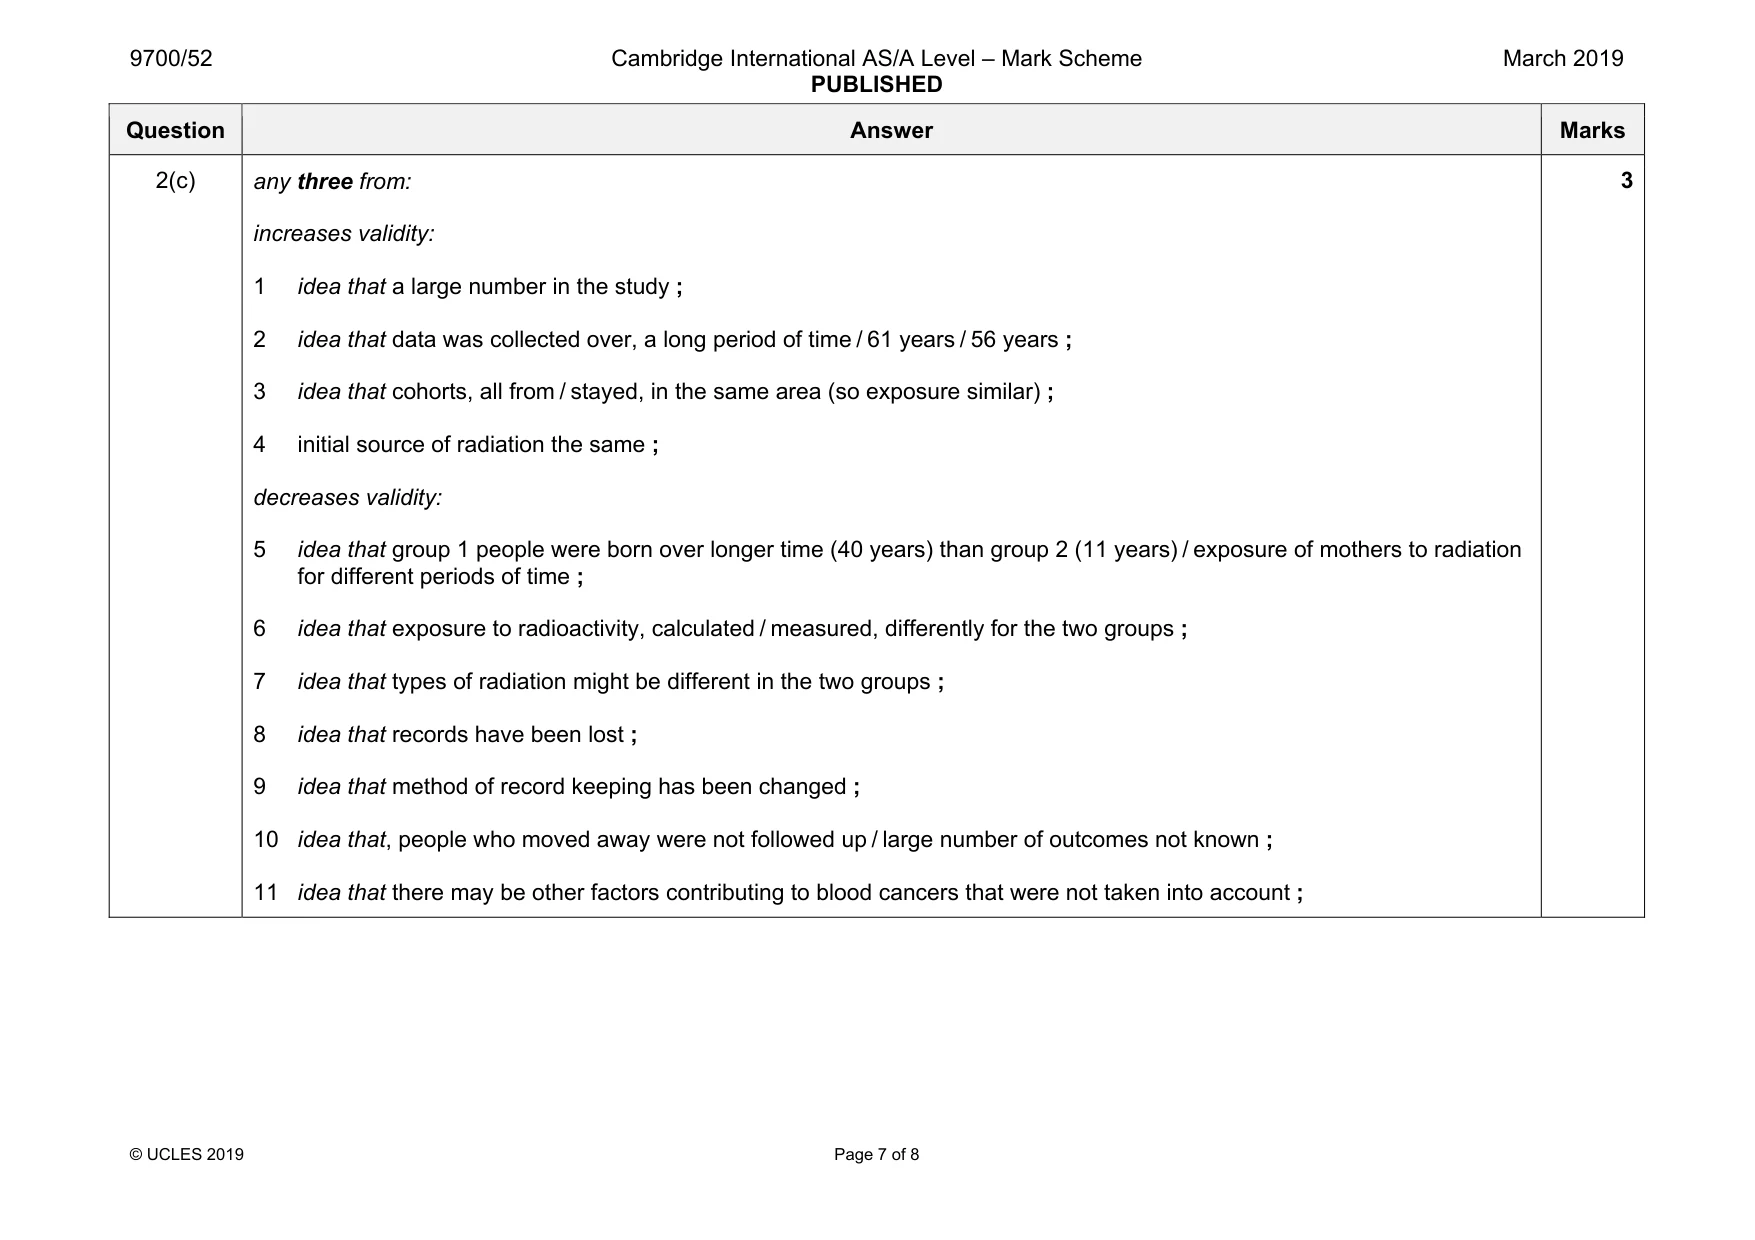
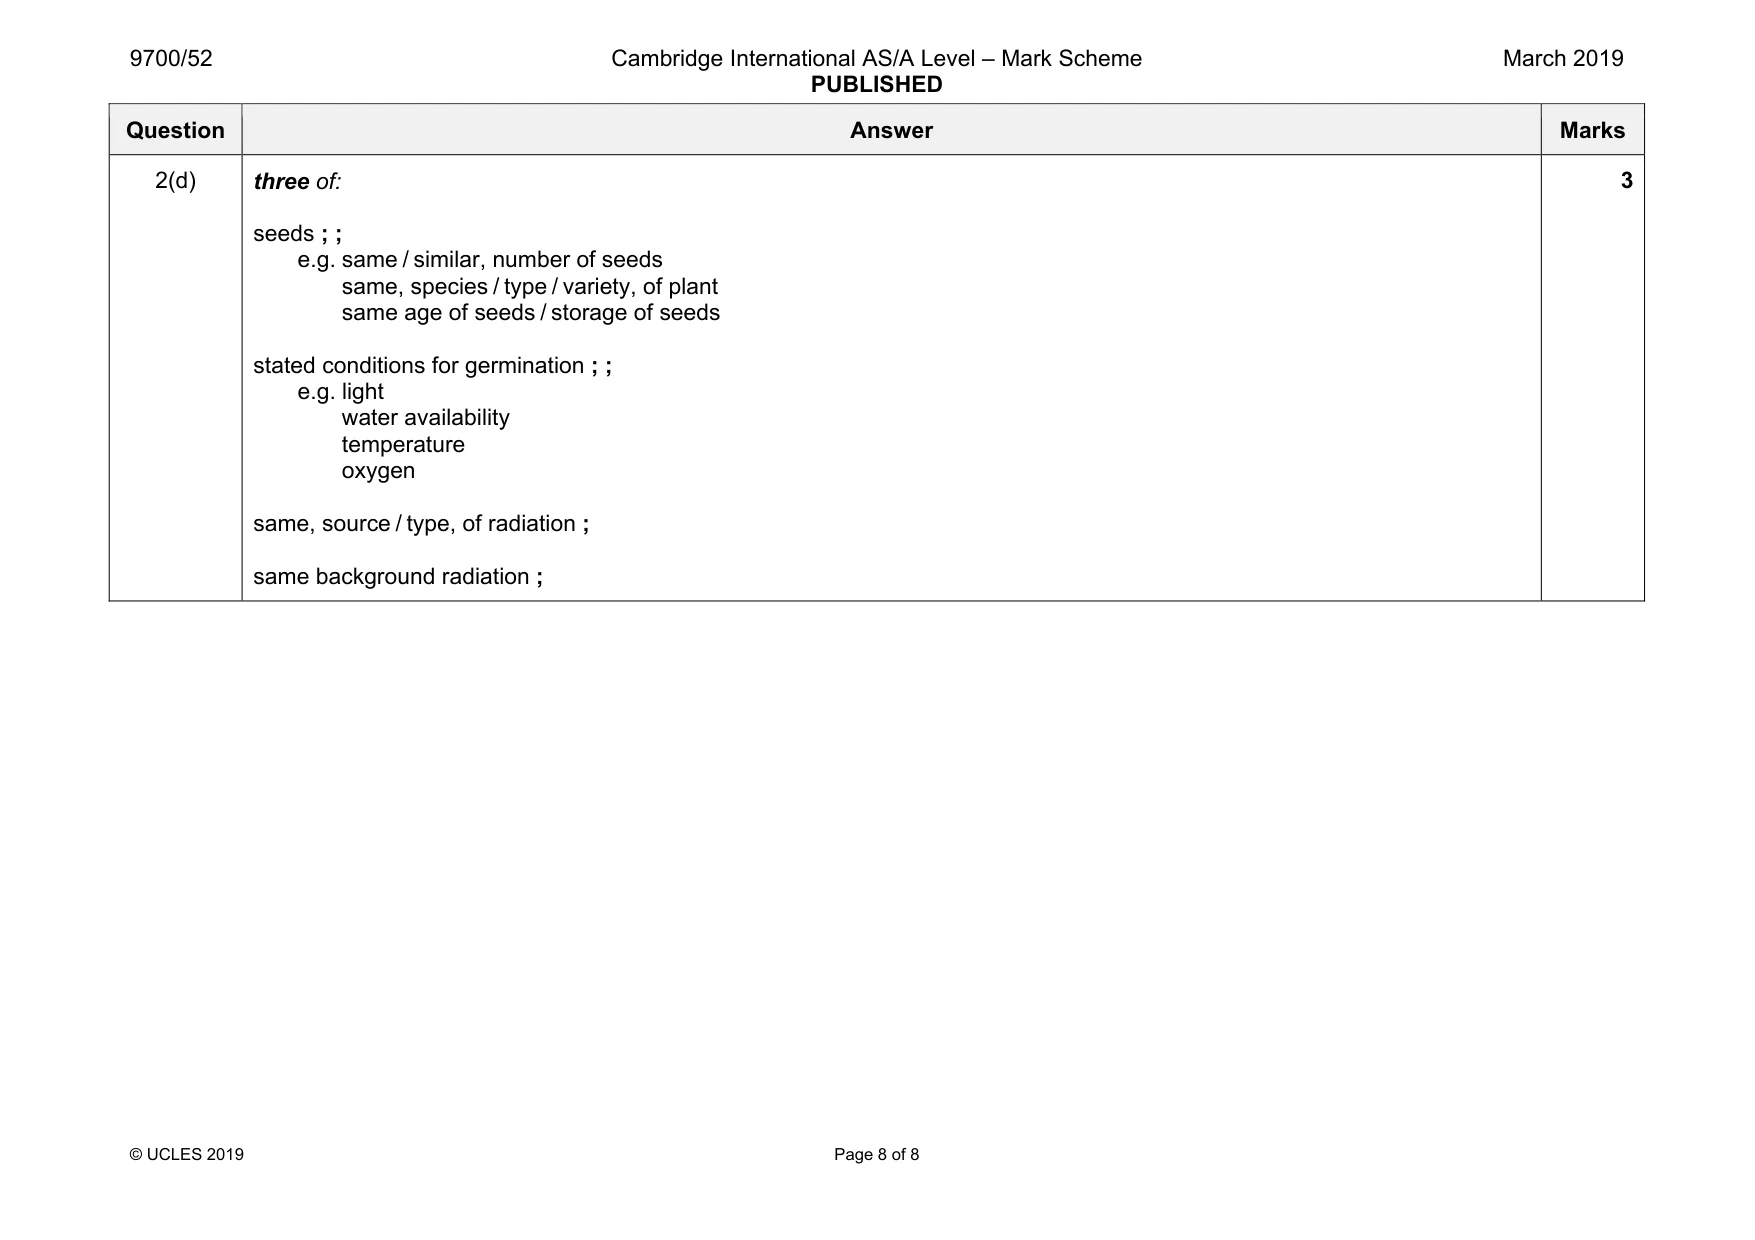
Mark scheme: 2(a)(i) (26 ÷ 288) = 0.090 ; 1 2(a)(ii) the data are, categoric / nominal ; 1 2(b)(i) number of people with (blood) cancer increases with (mother’s) exposure to radiation ; idea of a linear or proportional relationship ; no exposure to radiation still shows (blood) cancer developing / AW ; 3 2(b)(ii) idea that radiation exposure is linked to, mutation / DNA damage, of stem cells (in bone marrow) ; 1 Question Answer Marks 2(c) any three from: increases validity: 1 idea that a large number in the study ; 2 idea that data was collected over, a long period of time / 61 years / 56 years ; 3 idea that cohorts, all from / stayed, in the same area (so exposure similar) ; 4 initial source of radiation the same ; decreases validity: 5 idea that group 1 people were born over longer time (40 years) than group 2 (11 years) / exposure of mothers to radiation for different periods of time ; 6 idea that exposure to radioactivity, calculated / measured, differently for the two groups ; 7 idea that types of radiation might be different in the two groups ; 8 idea that records have been lost ; 9 idea that method of record keeping has been changed ; 10 idea that, people who moved away were not followed up / large number of outcomes not known ; 11 idea that there may be other factors contributing to blood cancers that were not taken into account ; 3 Question Answer Marks 2(d) three of: seeds ; ; e.g. same / similar, number of seeds same, species / type / variety, of plant same age of seeds / storage of seeds stated conditions for germination ; ; e.g. light water availability temperature oxygen same, source / type, of radiation ; same background radiation ; 3
What was in this paper
The subtopics covered by these 2 questions, and how many questions each got. Open one in a new tab to see every Cambridge question on it.
What you needed in this session
Cambridge’s own grade thresholds for 2019 Feb/March, Paper 5 · Variant 2. A higher threshold means an easier paper — the bar moves with how the cohort did.