Cambridge A Level Biology 9700 — 2018 Feb/March Paper 5 · Variant 2
9700/52/F/M/18 · 2 questions · 30 marks · ≈34 min
The question paper and its mark scheme, free to read here and free to download. This is Cambridge’s own paper, exactly as it was sat.
Question paper8 pages


Mark scheme10 pages
Answers below. Sit the paper first if you are practising.


Questions as text
Q1 · Biological washing liquids are solutions that contain enzymes to help remove stains…
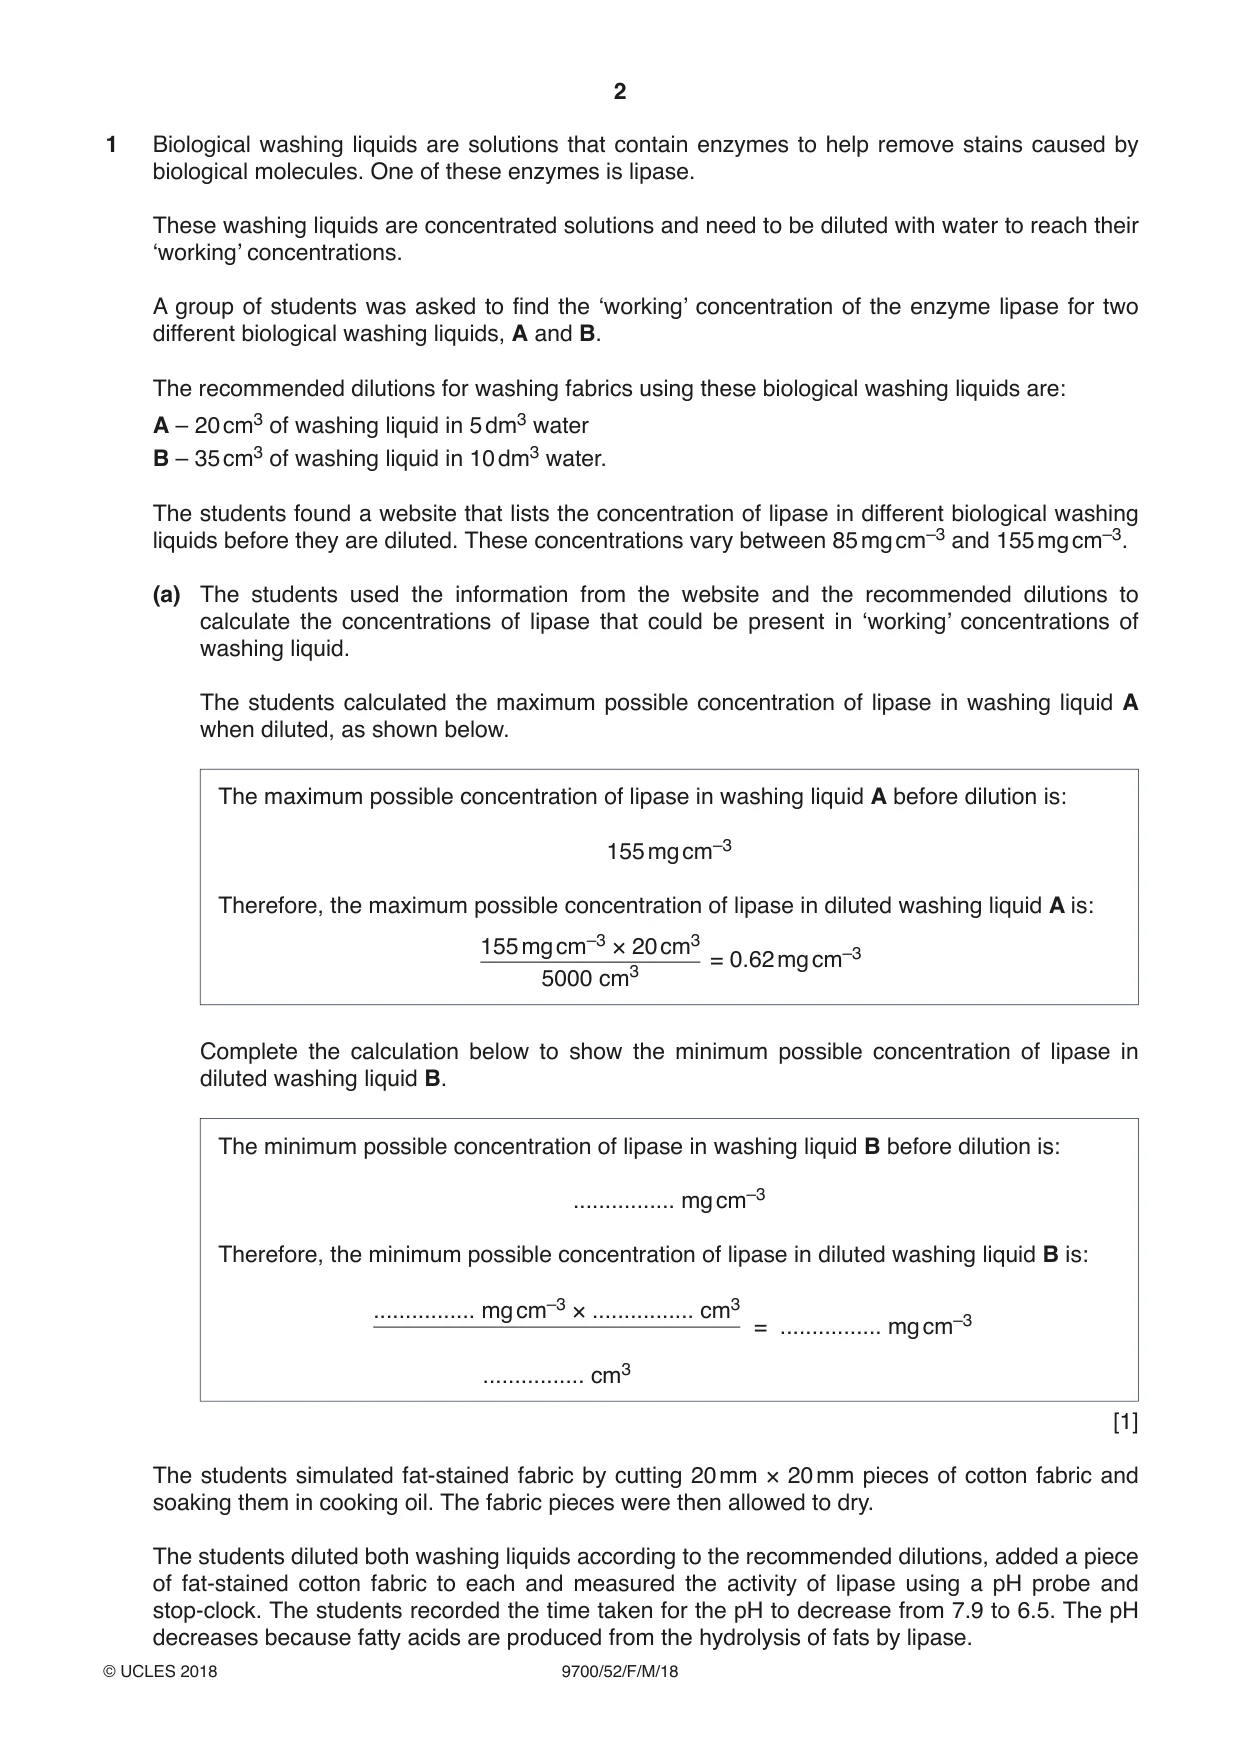
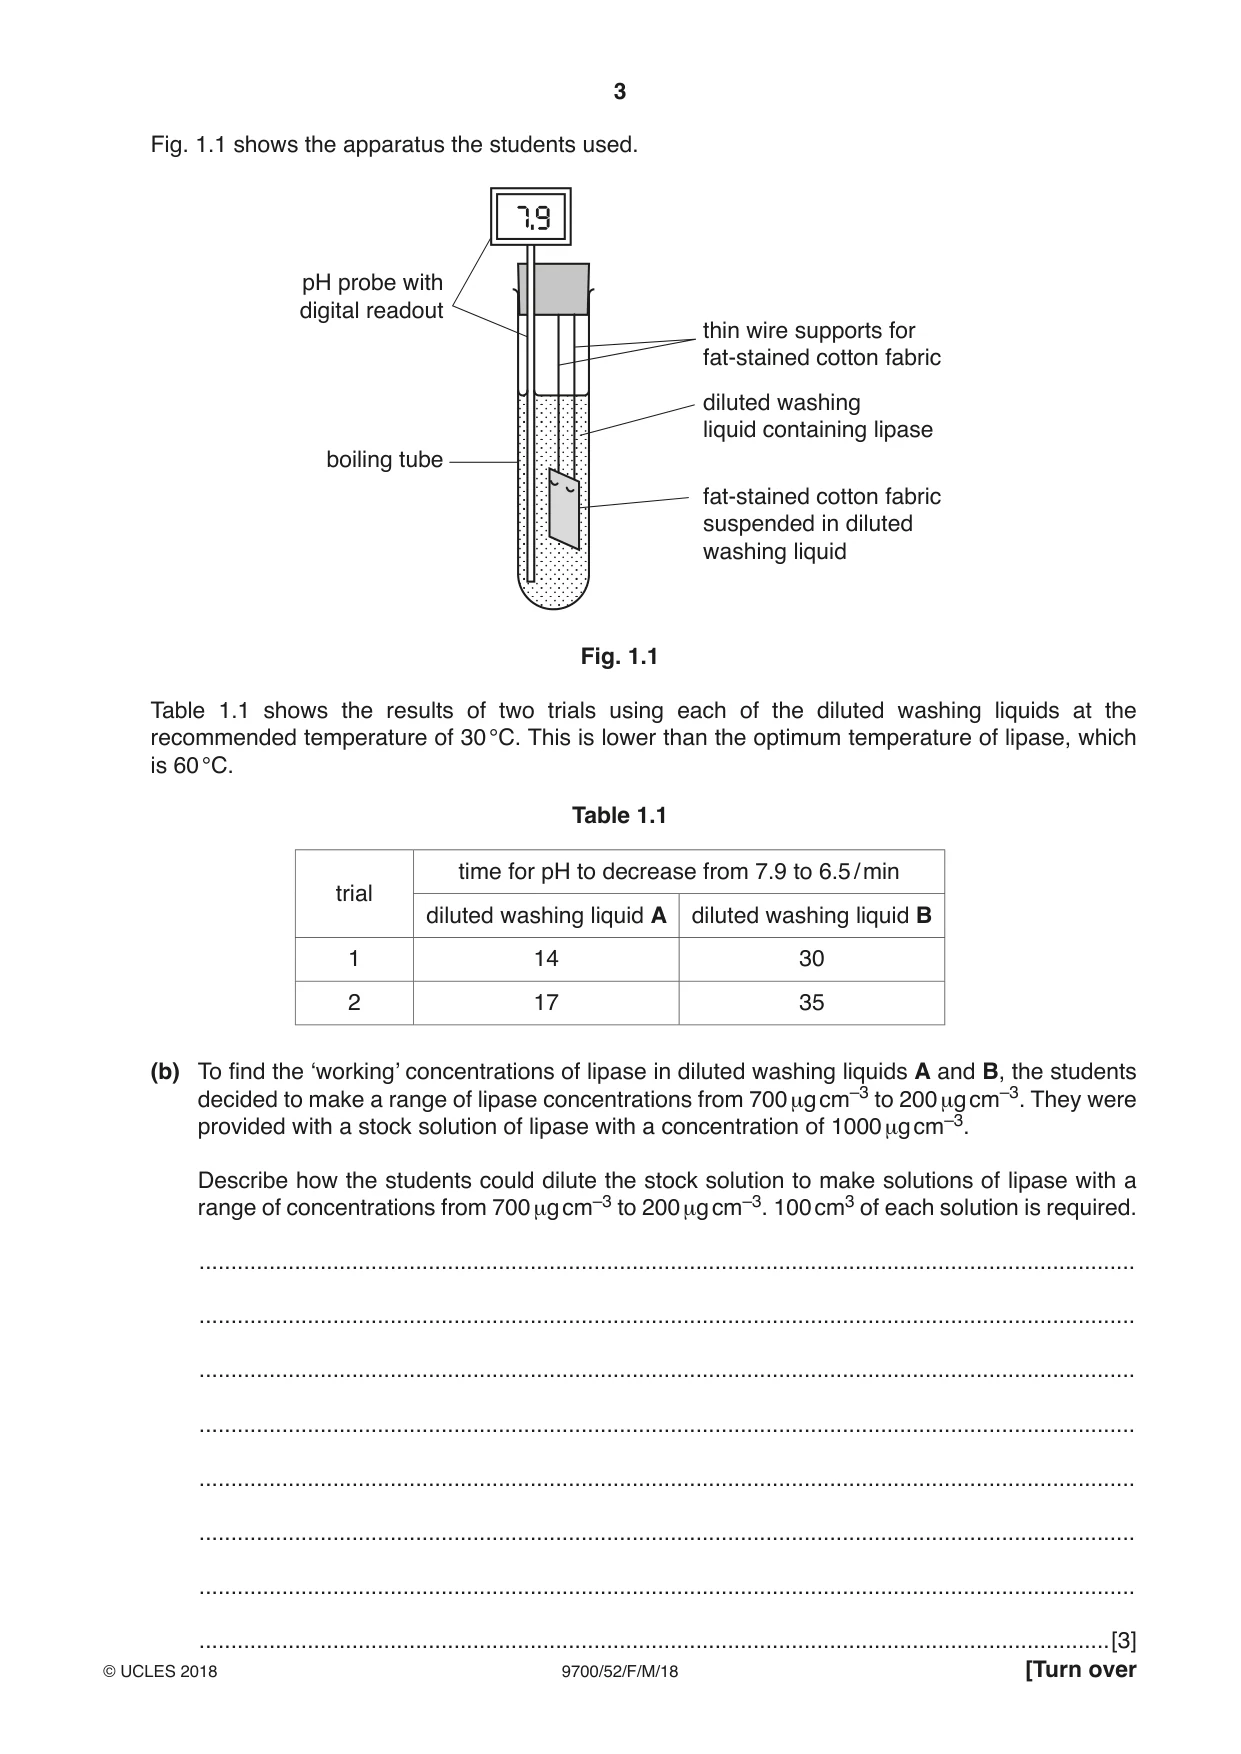
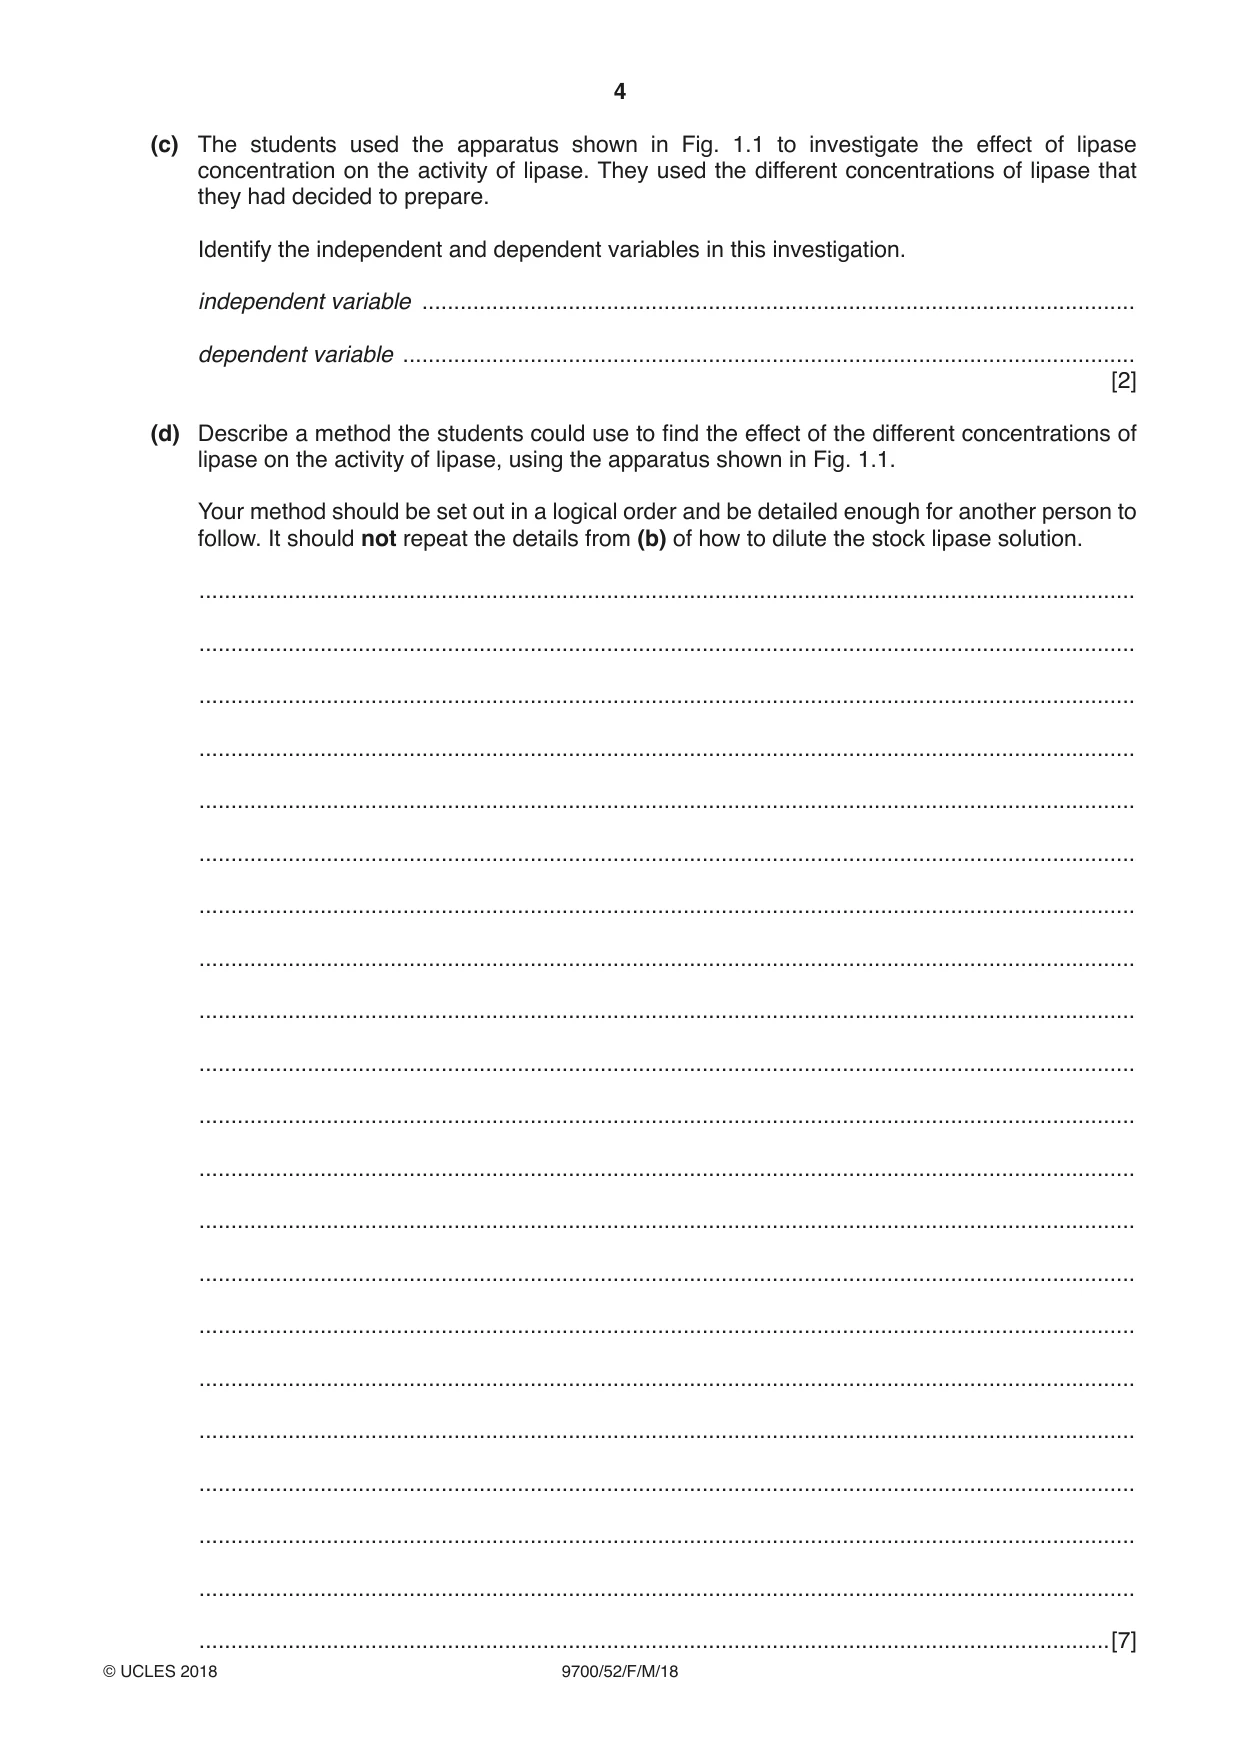
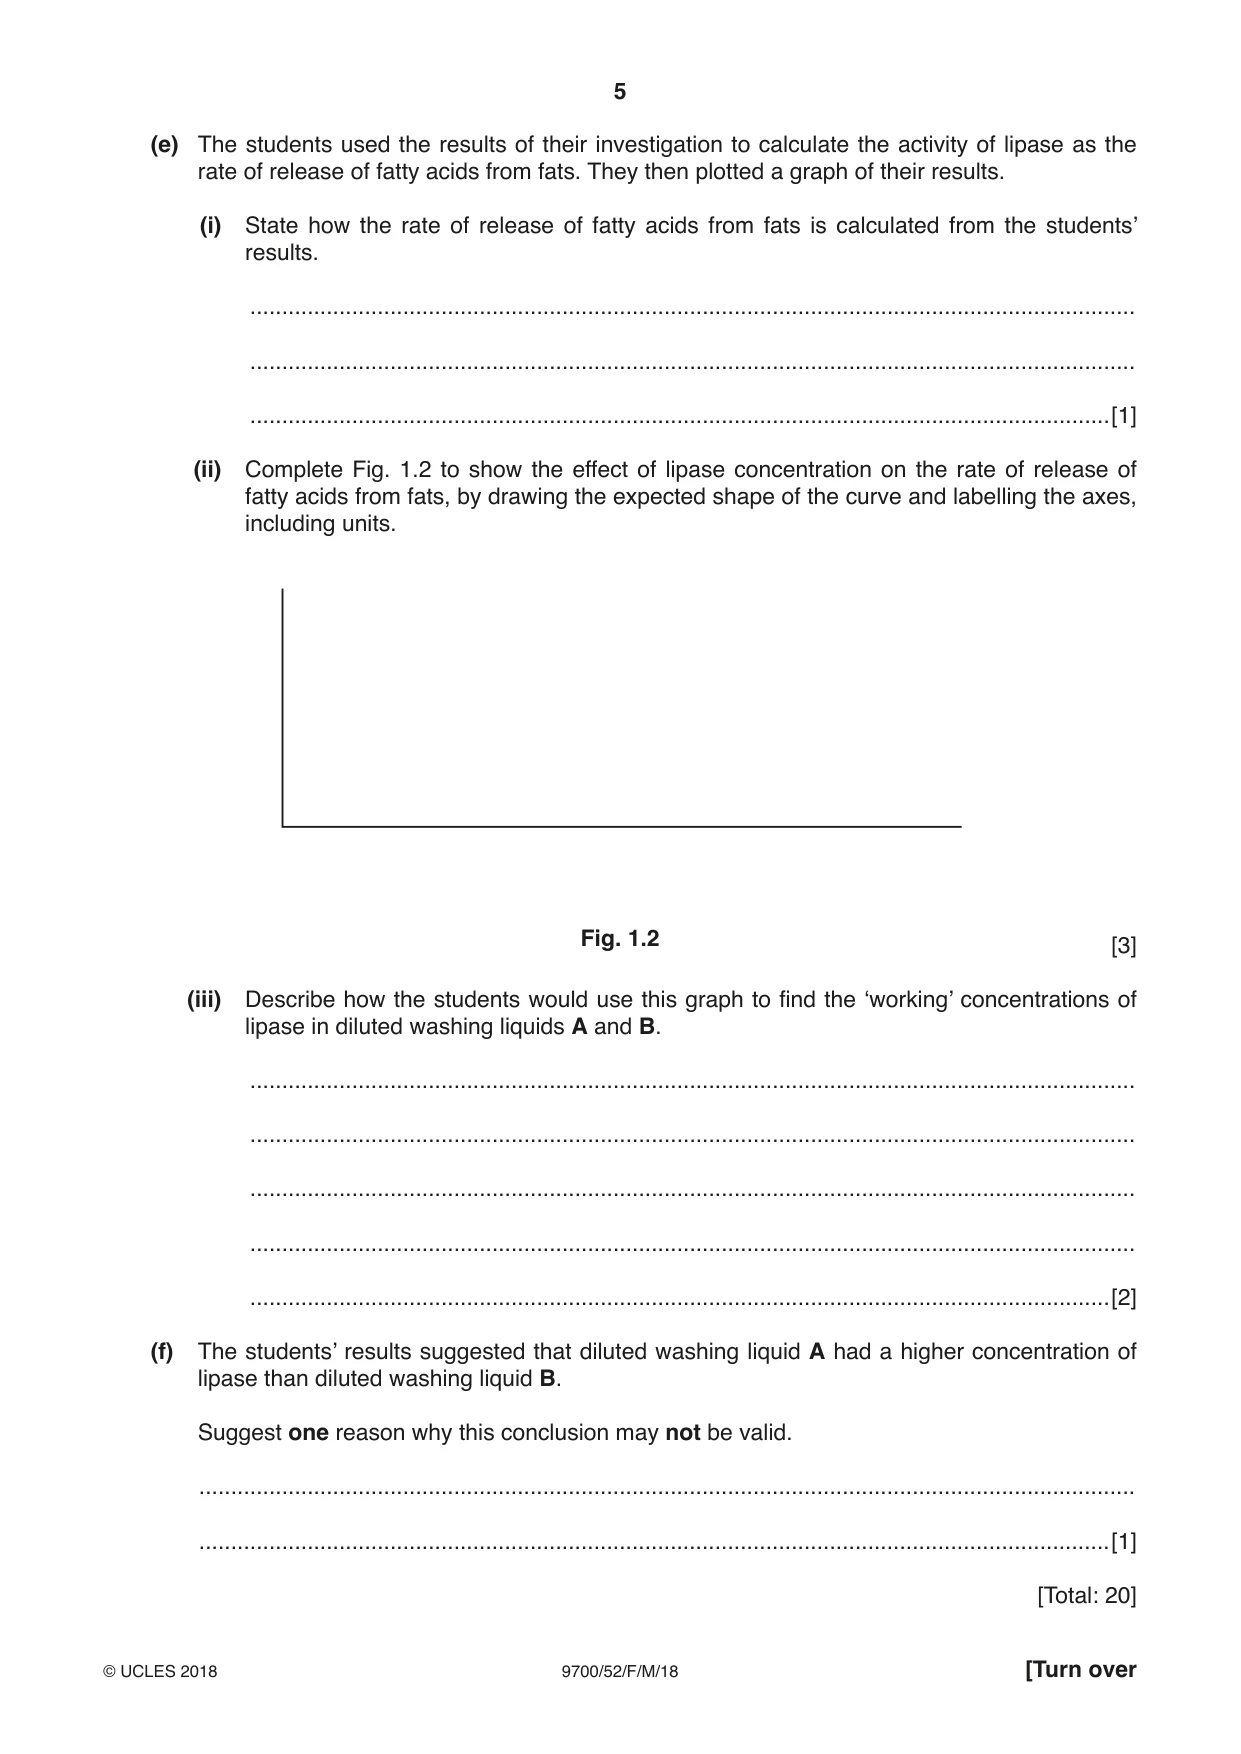
1 Biological washing liquids are solutions that contain enzymes to help remove stains caused by biological molecules. One of these enzymes is lipase. These washing liquids are concentrated solutions and need to be diluted with water to reach their ‘working’ concentrations. A group of students was asked to find the ‘working’ concentration of the enzyme lipase for two different biological washing liquids, A and B. The recommended dilutions for washing fabrics using these biological washing liquids are: A – 20 cm3 of washing liquid in 5 dm3 water B – 35 cm3 of washing liquid in 10 dm3 water. The students found a website that lists the concentration of lipase in different biological washing liquids before they are diluted. These concentrations vary between 85 mg cm–3 and 155 mg cm–3. (a) The students used the information from the website and the recommended dilutions to calculate the concentrations of lipase that could be present in ‘working’ concentrations of washing liquid. The students calculated the maximum possible concentration of lipase in washing liquid A when diluted, as shown below. The maximum possible concentration of lipase in washing liquid A before dilution is: 155 mg cm–3 Therefore, the maximum possible concentration of lipase in diluted washing liquid A is: 155 mg cm–3 × 20 cm3 = 0.62 mg cm–3 5000 cm3 Complete the calculation below to show the minimum possible concentration of lipase in diluted washing liquid B. The minimum possible concentration of lipase in washing liquid B before dilution is: ................ mg cm–3 Therefore, the minimum possible concentration of lipase in diluted washing liquid B is: ................ mg cm–3 × ................ cm3 = ................ mg cm–3 ................ cm3 [1] The students simulated fat-stained fabric by cutting 20 mm × 20 mm pieces of cotton fabric and soaking them in cooking oil. The fabric pieces were then allowed to dry. The students diluted both washing liquids according to the recommended dilutions, added a piece of fat-stained cotton fabric to each and measured the activity of lipase using a pH probe and stop-clock. The students recorded the time taken for the pH to decrease from 7.9 to 6.5. The pH decreases because fatty acids are produced from the hydrolysis of fats by lipase. Fig. 1.1 shows the apparatus the students used. pH probe with digital readout thin wire supports for fat-stained cotton fabric diluted washing liquid containing lipase boiling tube fat-stained cotton fabric suspended in diluted washing liquid Fig. 1.1 Table 1.1 shows the results of two trials using each of the diluted washing liquids at the recommended temperature of 30 °C. This is lower than the optimum temperature of lipase, which is 60 °C. Table 1.1 time for pH to decrease from 7.9 to 6.5 / min trial diluted washing liquid A diluted washing liquid B 1 14 30 2 17 35 (b) To find the ‘working’ concentrations of lipase in diluted washing liquids A and B, the students decided to make a range of lipase concentrations from 700 µg cm–3 to 200 µg cm–3. They were provided with a stock solution of lipase with a concentration of 1000 µg cm–3. Describe how the students could dilute the stock solution to make solutions of lipase with a range of concentrations from 700 µg cm–3 to 200 µg cm–3. 100 cm3 of each solution is required. ................................................................................................................................................... ................................................................................................................................................... ................................................................................................................................................... ................................................................................................................................................... ................................................................................................................................................... ................................................................................................................................................... ................................................................................................................................................... (c) The students used the apparatus shown in Fig. 1.1 to investigate the effect of lipase concentration on the activity of lipase. They used the different concentrations of lipase that they had decided to prepare. Identify the independent and dependent variables in this investigation. independent variable ................................................................................................................ dependent variable ................................................................................................................... [2] (d) Describe a method the students could use to find the effect of the different concentrations of lipase on the activity of lipase, using the apparatus shown in Fig. 1.1. Your method should be set out in a logical order and be detailed enough for another person to follow. It should not repeat the details from (b) of how to dilute the stock lipase solution. ................................................................................................................................................... ................................................................................................................................................... ................................................................................................................................................... ................................................................................................................................................... ................................................................................................................................................... ................................................................................................................................................... ................................................................................................................................................... ................................................................................................................................................... ................................................................................................................................................... ................................................................................................................................................... ................................................................................................................................................... ................................................................................................................................................... ................................................................................................................................................... ................................................................................................................................................... ................................................................................................................................................... ................................................................................................................................................... ................................................................................................................................................... ................................................................................................................................................... ................................................................................................................................................... ................................................................................................................................................... ...............................................................................................................................................[7] (e) The students used the results of their investigation to calculate the activity of lipase as the rate of release of fatty acids from fats. They then plotted a graph of their results. (i) State how the rate of release of fatty acids from fats is calculated from the students’ results. ........................................................................................................................................... ........................................................................................................................................... .......................................................................................................................................[1] (ii) Complete Fig. 1.2 to show the effect of lipase concentration on the rate of release of fatty acids from fats, by drawing the expected shape of the curve and labelling the axes, including units. Fig. 1.2 [3] (iii) Describe how the students would use this graph to find the ‘working’ concentrations of lipase in diluted washing liquids A and B. ........................................................................................................................................... ........................................................................................................................................... ........................................................................................................................................... ........................................................................................................................................... .......................................................................................................................................[2] (f) The students’ results suggested that diluted washing liquid A had a higher concentration of lipase than diluted washing liquid B. Suggest one reason why this conclusion may not be valid. ................................................................................................................................................... ...............................................................................................................................................[1] [Total: 20]
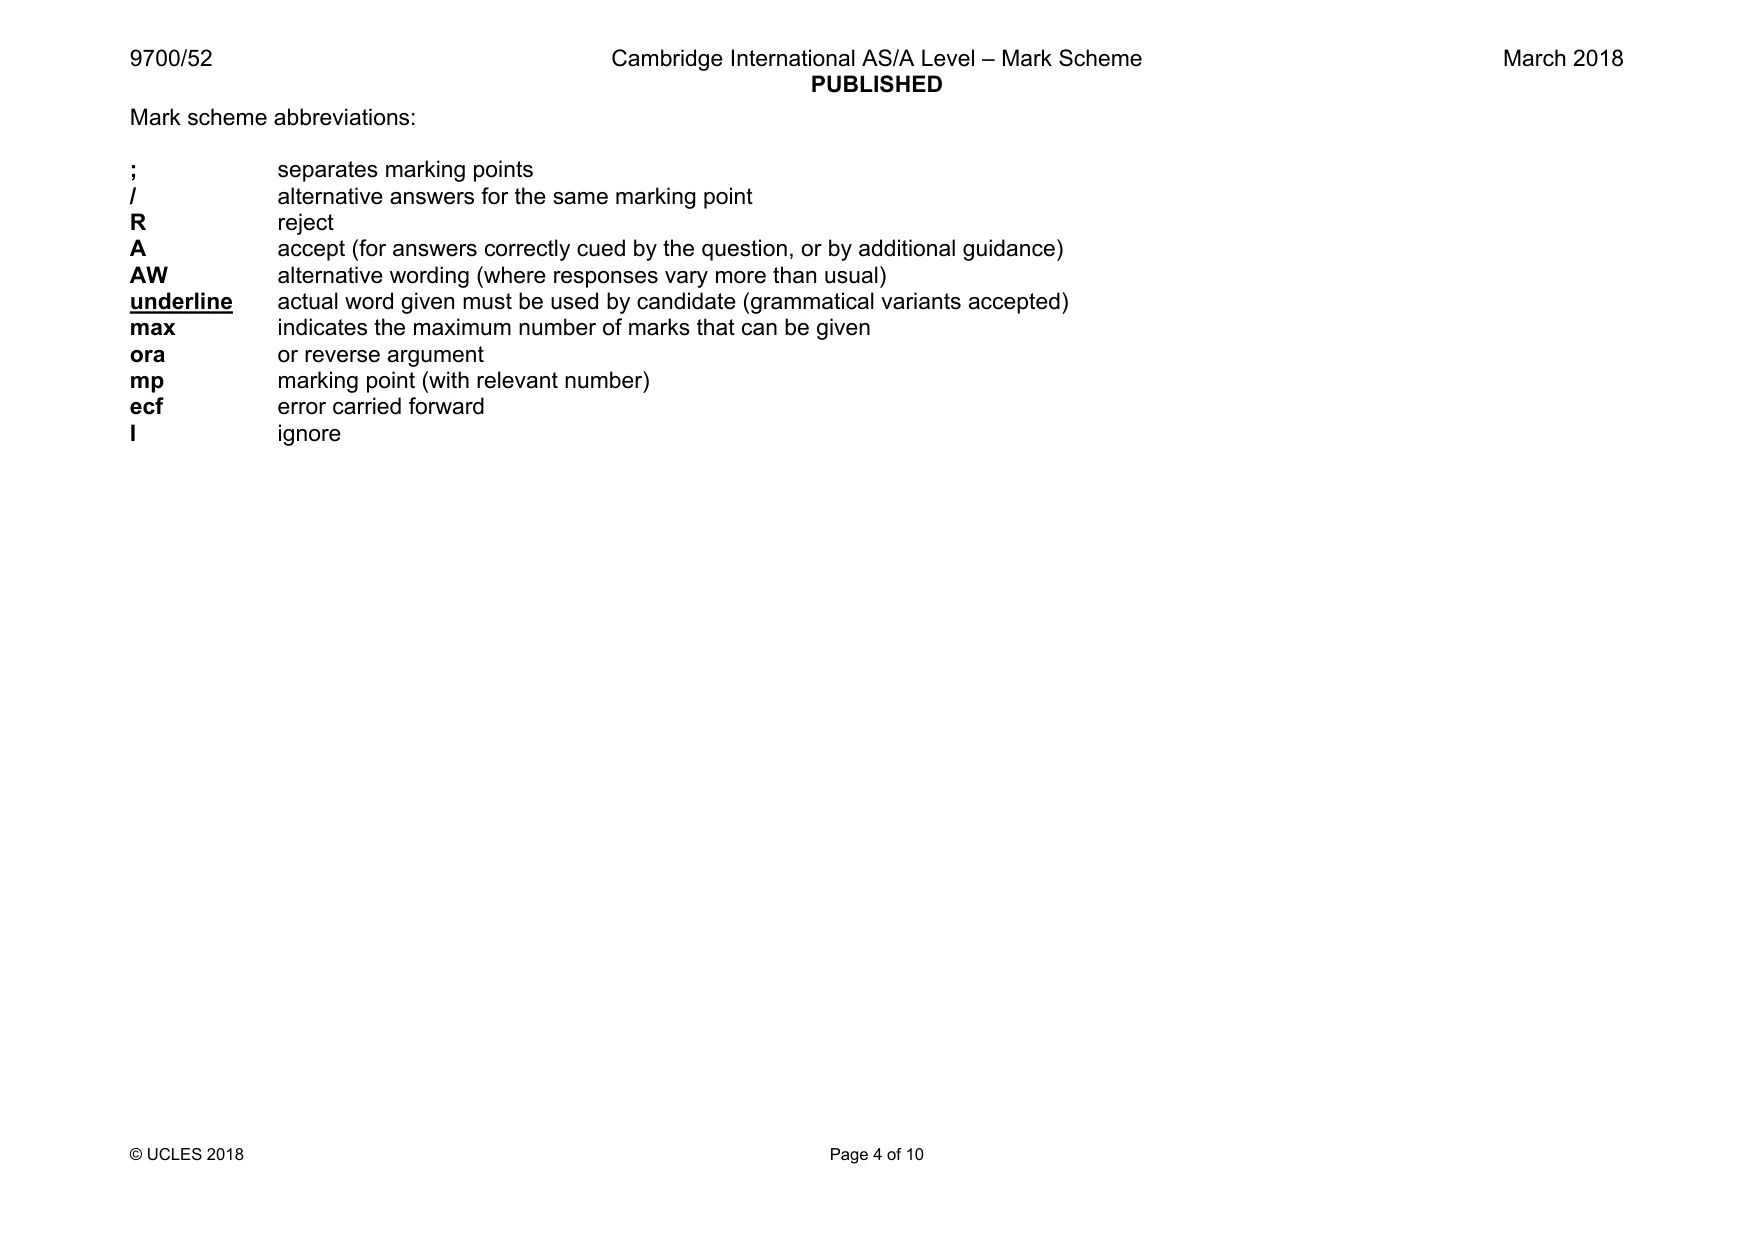
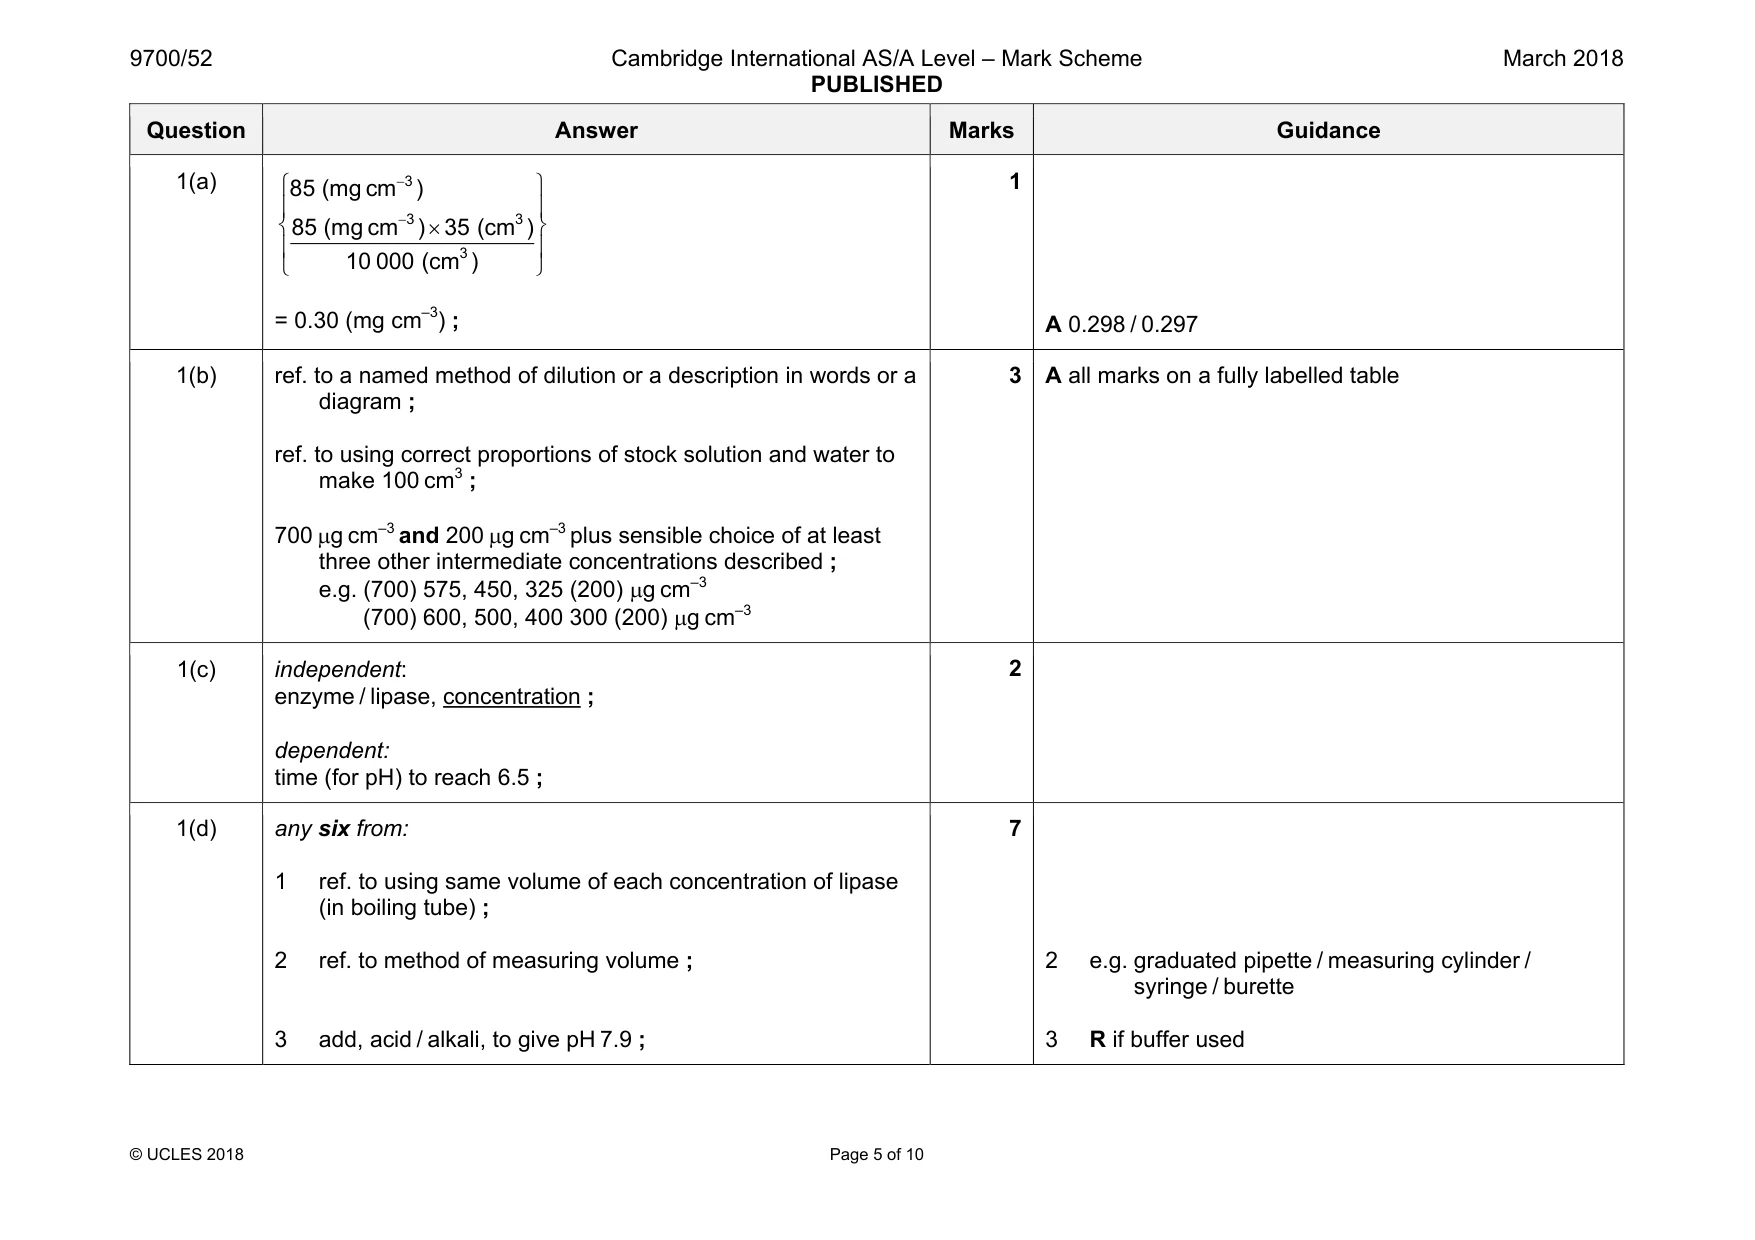
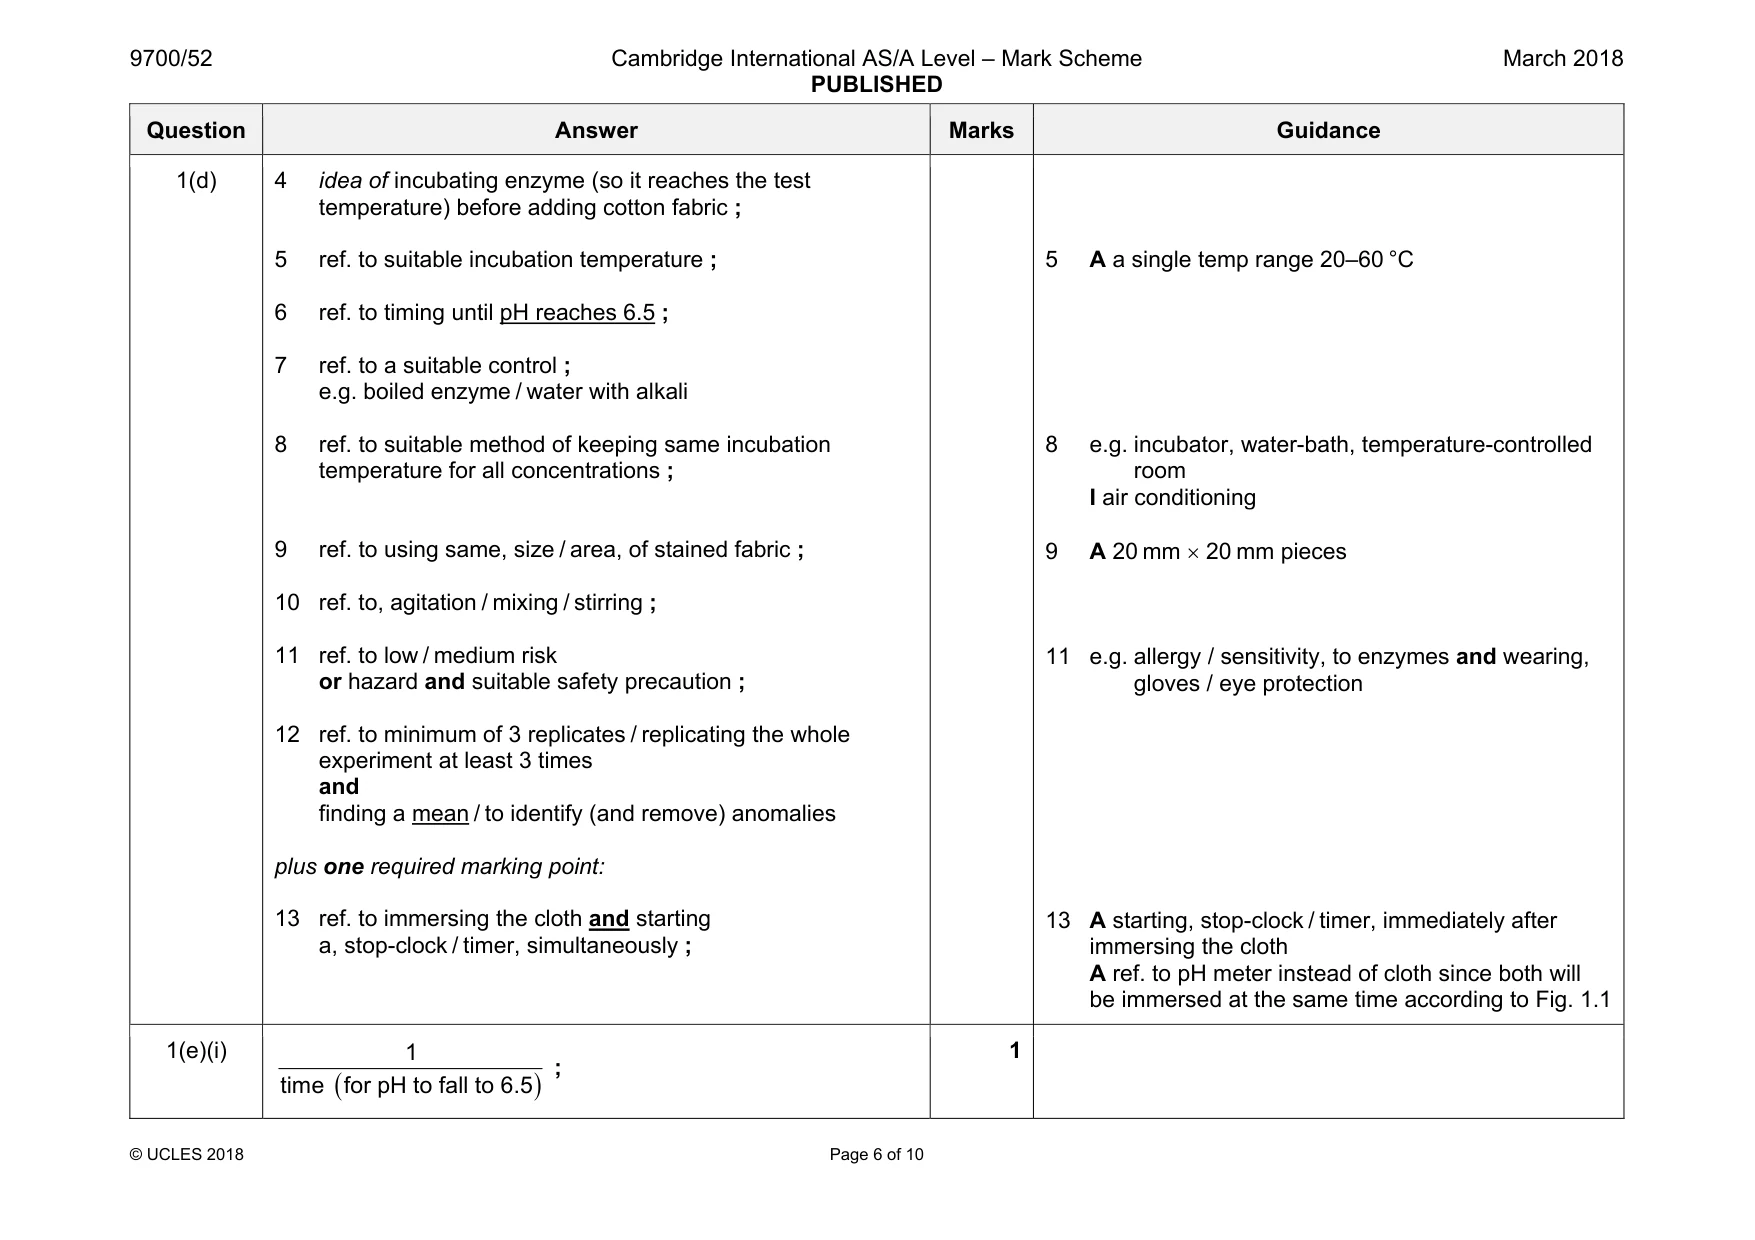
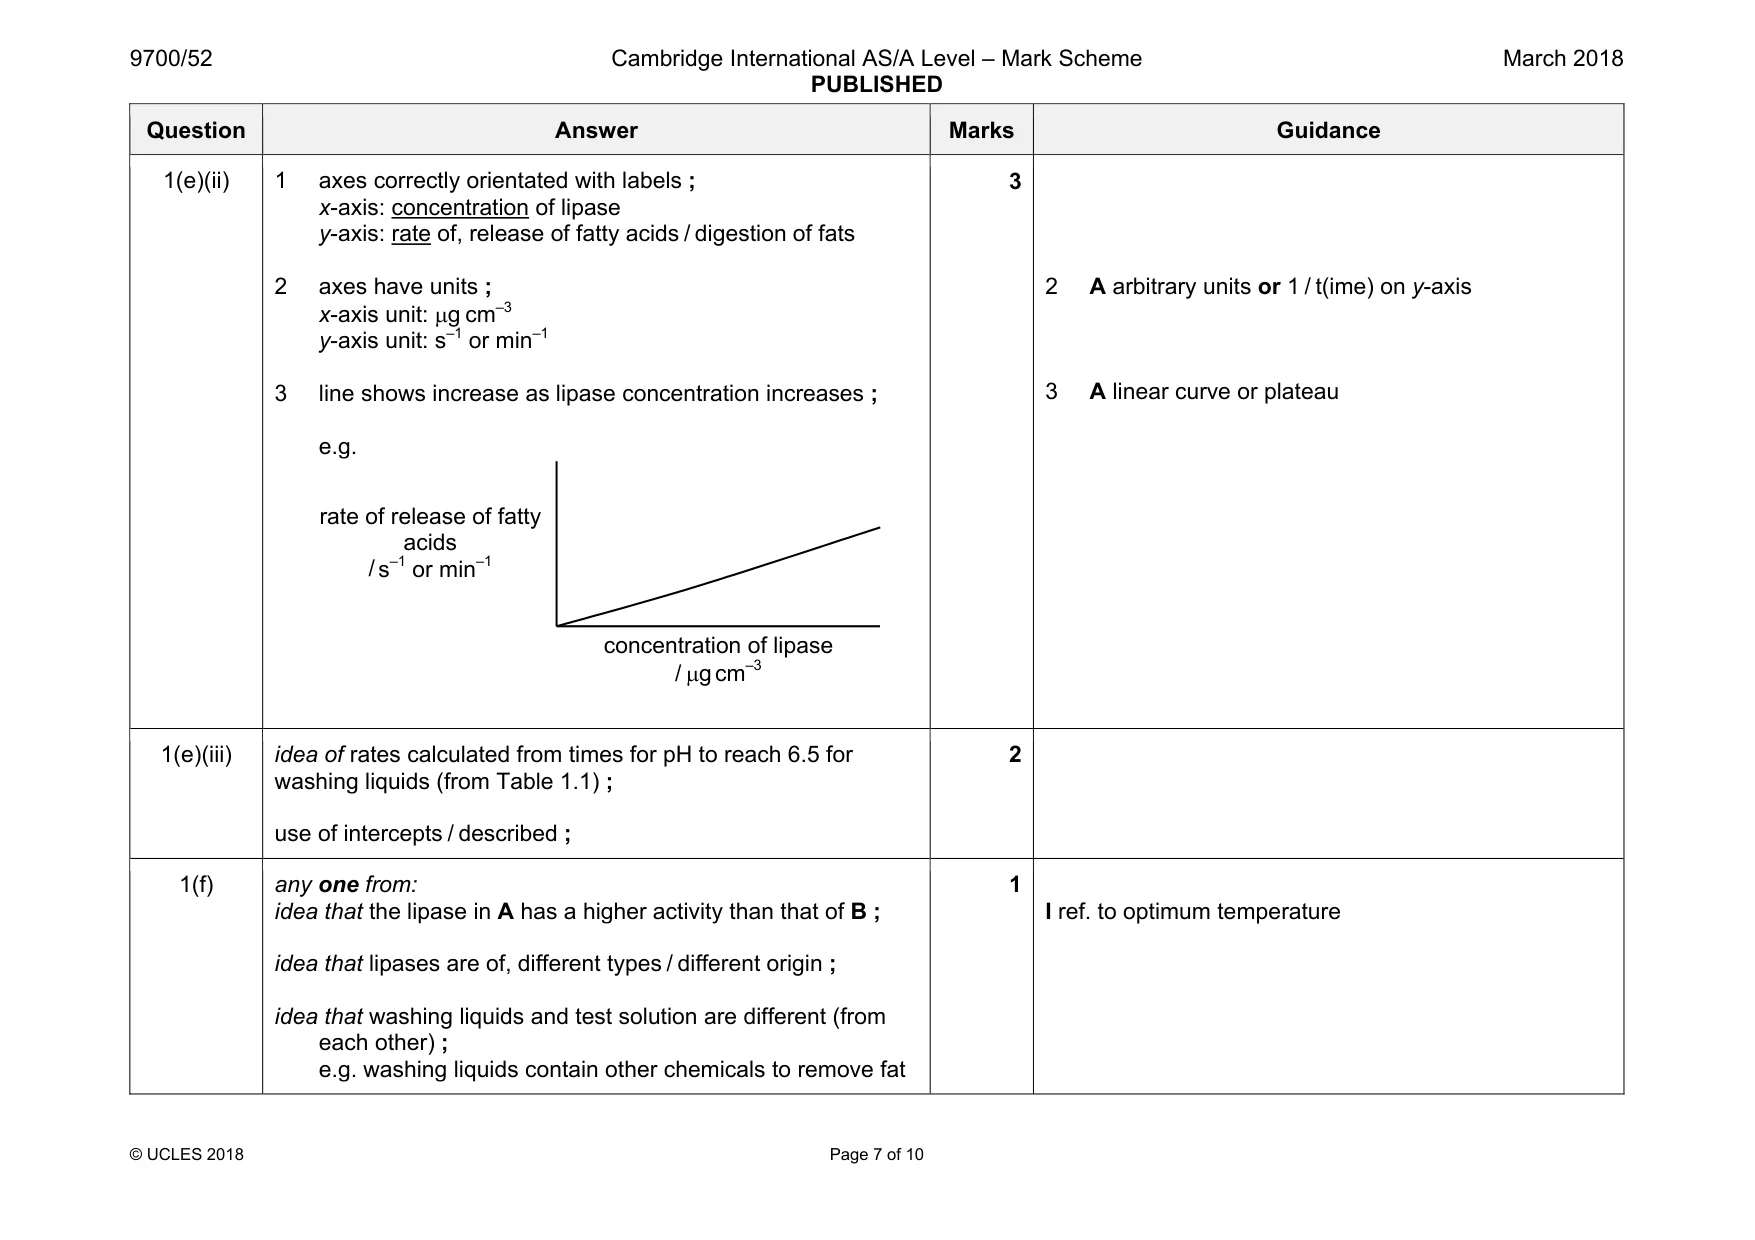
Mark scheme: 1(a) 3 3 3 3 85 (mg cm ) 85 (mg cm ) 35 (cm ) 10 000 (cm ) − − × = 0.30 (mg cm–3) ; A 0.298 / 0.297 1(b) ref. to a named method of dilution or a description in words or a diagram ; ref. to using correct proportions of stock solution and water to make 100 cm3 ; 700 µg cm–3 and 200 µg cm–3 plus sensible choice of at least three other intermediate concentrations described ; e.g. (700) 575, 450, 325 (200) µg cm–3 (700) 600, 500, 400 300 (200) µg cm–3 3 A all marks on a fully labelled table 1(c) independent: enzyme / lipase, concentration ; dependent: time (for pH) to reach 6.5 ; 2 1(d) any six from: 1 ref. to using same volume of each concentration of lipase (in boiling tube) ; 2 ref. to method of measuring volume ; 3 add, acid / alkali, to give pH 7.9 ; 7 2 e.g. graduated pipette / measuring cylinder / syringe / burette 3 R if buffer used Question Answer Marks Guidance 1(d) 4 idea of incubating enzyme (so it reaches the test temperature) before adding cotton fabric ; 5 ref. to suitable incubation temperature ; 6 ref. to timing until pH reaches 6.5 ; 7 ref. to a suitable control ; e.g. boiled enzyme / water with alkali 8 ref. to suitable method of keeping same incubation temperature for all concentrations ; 9 ref. to using same, size / area, of stained fabric ; 10 ref. to, agitation / mixing / stirring ; 11 ref. to low / medium risk or hazard and suitable safety precaution ; 12 ref. to minimum of 3 replicates / replicating the whole experiment at least 3 times and finding a mean / to identify (and remove) anomalies plus one required marking point: 13 ref. to immersing the cloth and starting a, stop-clock / timer, simultaneously ; 5 A a single temp range 20–60 °C 8 e.g. incubator, water-bath, temperature-controlled room I air conditioning 9 A 20 mm × 20 mm pieces 11 e.g. allergy / sensitivity, to enzymes and wearing, gloves / eye protection 13 A starting, stop-clock / timer, immediately after immersing the cloth A ref. to pH meter instead of cloth since both will be immersed at the same time according to Fig. 1.1 1(e)(i) ( ) time for pH to fall 1 to 6.5 ; 1 Question Answer Marks Guidance 1(e)(ii) 1 axes correctly orientated with labels ; x-axis: concentration of lipase y-axis: rate of, release of fatty acids / digestion of fats 2 axes have units ; x-axis unit: µg cm–3 y-axis unit: s–1 or min–1 3 line shows increase as lipase concentration increases ; e.g. 3 2 A arbitrary units or 1 / t(ime) on y-axis 3 A linear curve or plateau 1(e)(iii) idea of rates calculated from times for pH to reach 6.5 for washing liquids (from Table 1.1) ; use of intercepts / described ; 2 1(f) any one from: idea that the lipase in A has a higher activity than that of B ; idea that lipases are of, different types / different origin ; idea that washing liquids and test solution are different (from each other) ; e.g. washing liquids contain other chemicals to remove fat 1 I ref. to optimum temperature rate of release of fatty acids / s–1 or min–1 concentration of lipase / µg cm–3
Q2 · The eye has sensory receptors that convert light energy into nerve impulses
2 The eye has sensory receptors that convert light energy into nerve impulses. The ability of the human eye to detect separate stimuli one after another has been studied. • The eye is able to distinguish separate stimuli from a flickering light up to a threshold frequency of about 16 flickers per second. This is referred to as a frequency of 16 hertz (Hz). 1 Hz = 1 flicker per second. • Once the threshold frequency is reached, the eye can no longer distinguish the separate stimuli so they are detected as one continuous stimulus. • The frequency at which this happens is called the critical flicker fusion threshold (CFFT). To find a person’s CFFT, a test is carried out. • The person looks into a binocular eyepiece at two white lights that flicker simultaneously. • The flickering frequency is started at 4 Hz and is gradually increased at a constant rate. • When the person first notices that the flickering stimulus appears to have become constant they press a button, which gives their CFFT. • This is repeated to give ten values for each person. An investigation was carried out into the effect of alcohol on the CFFT of thirteen females aged from 18 to 35 years old. Before starting the investigation, the women were given time to become familiar with the equipment. The investigation was then carried out over two days. Day 1 – the women were allowed 5 minutes to drink 250 cm3 of pure orange juice. The CFFT was tested 40 minutes later. Day 2 – the women were allowed 5 minutes to drink 250 cm3 of orange juice containing 16 mg of alcohol. The CFFT was tested 40 minutes later. The reason for carrying out the test 40 minutes after drinking alcohol is to allow time for the alcohol to reach its peak concentration in the blood. Fig. 2.1 shows the results of this investigation. key 20.0 no alcohol (day 1) 19.0 alcohol (day 2) ± standard deviation 18.0 17.0 mean critical 16.0 flicker fusion threshold 15.0 / Hz 14.0 13.0 12.0 11.0 10.0 1 2 3 4 5 6 7 8 9 10 11 12 13 woman Fig. 2.1 (a) Identify two key variables that have been controlled in this investigation. 1 ................................................................................................................................................ 2 ................................................................................................................................................ [2] (b) Explain why the investigators calculated the standard deviation of the results for each person. ................................................................................................................................................... ................................................................................................................................................... ................................................................................................................................................... ...............................................................................................................................................[2] (c) Identify three features about the CFFT from the data shown in Fig. 2.1. ................................................................................................................................................... ................................................................................................................................................... ................................................................................................................................................... ................................................................................................................................................... ................................................................................................................................................... ................................................................................................................................................... ................................................................................................................................................... ...............................................................................................................................................[3] (d) Suggest three reasons why the results shown in Fig. 2.1 may not be representative of the whole human population. 1 ................................................................................................................................................ ................................................................................................................................................... 2 ................................................................................................................................................ ................................................................................................................................................... 3 ................................................................................................................................................ ................................................................................................................................................... ................................................................................................................................................... [3] [Total: 10]
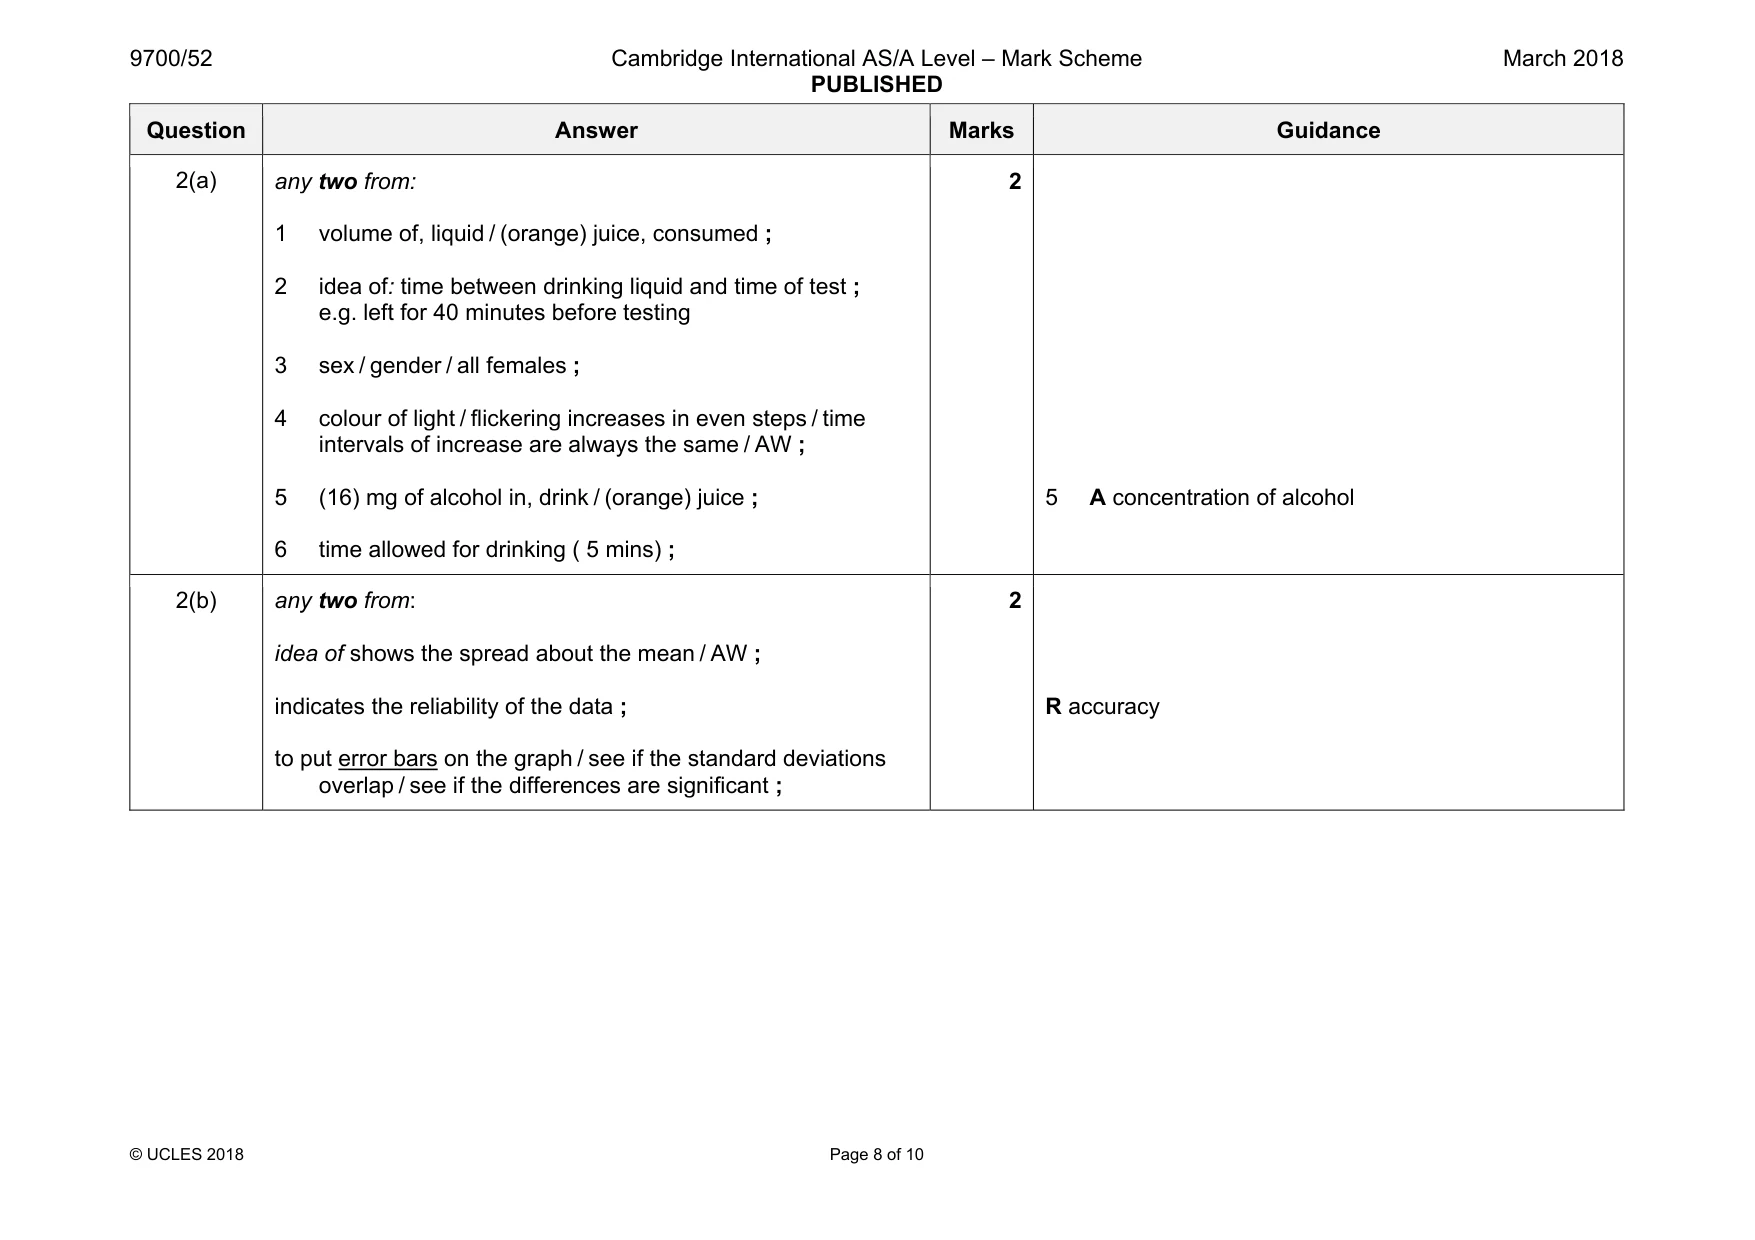
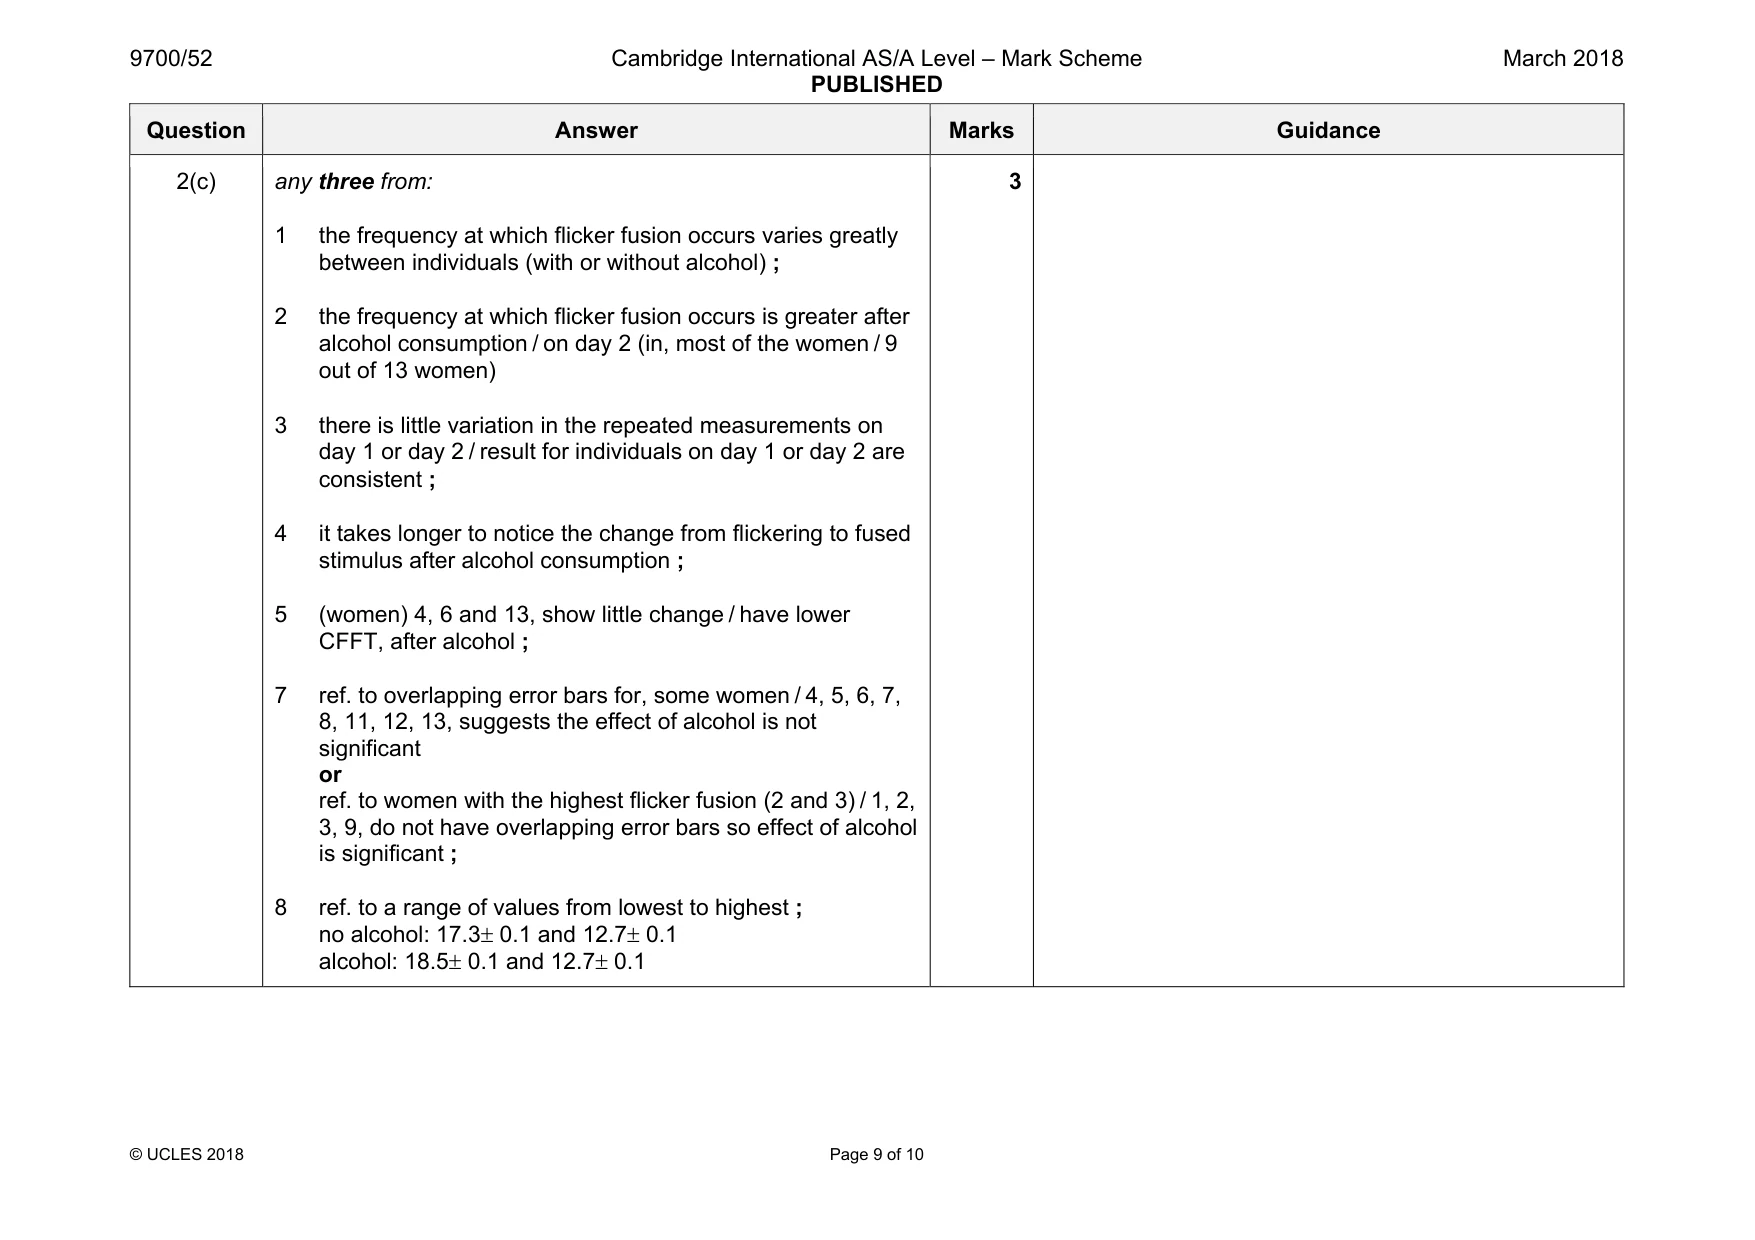
Mark scheme: 2(a) any two from: 1 volume of, liquid / (orange) juice, consumed ; 2 idea of: time between drinking liquid and time of test ; e.g. left for 40 minutes before testing 3 sex / gender / all females ; 4 colour of light / flickering increases in even steps / time intervals of increase are always the same / AW ; 5 (16) mg of alcohol in, drink / (orange) juice ; 6 time allowed for drinking ( 5 mins) ; 2 5 A concentration of alcohol 2(b) any two from: idea of shows the spread about the mean / AW ; indicates the reliability of the data ; to put error bars on the graph / see if the standard deviations overlap / see if the differences are significant ; 2 R accuracy Question Answer Marks Guidance 2(c) any three from: 1 the frequency at which flicker fusion occurs varies greatly between individuals (with or without alcohol) ; 2 the frequency at which flicker fusion occurs is greater after alcohol consumption / on day 2 (in, most of the women / 9 out of 13 women) 3 there is little variation in the repeated measurements on day 1 or day 2 / result for individuals on day 1 or day 2 are consistent ; 4 it takes longer to notice the change from flickering to fused stimulus after alcohol consumption ; 5 (women) 4, 6 and 13, show little change / have lower CFFT, after alcohol ; 7 ref. to overlapping error bars for, some women / 4, 5, 6, 7, 8, 11, 12, 13, suggests the effect of alcohol is not significant or ref. to women with the highest flicker fusion (2 and 3) / 1, 2, 3, 9, do not have overlapping error bars so effect of alcohol is significant ; 8 ref. to a range of values from lowest to highest ; no alcohol: 17.3± 0.1 and 12.7± 0.1 alcohol: 18.5± 0.1 and 12.7± 0.1 3 Question Answer Marks Guidance 2(d) any three from: very small sample / only 13 subjects ; all test subjects are female ; idea of habituation (as 10 tests carried out) ; not all age ranges included ; no indication of body mass ; 3
What was in this paper
The subtopics covered by these 2 questions, and how many questions each got. Open one in a new tab to see every Cambridge question on it.
What you needed in this session
Cambridge’s own grade thresholds for 2018 Feb/March, Paper 5 · Variant 2. A higher threshold means an easier paper — the bar moves with how the cohort did.