Cambridge A Level Biology 9700 — 2017 Feb/March Paper 5 · Variant 2
9700/52/F/M/17 · 2 questions · 30 marks · ≈34 min
The question paper and its mark scheme, free to read here and free to download. This is Cambridge’s own paper, exactly as it was sat.
Question paper8 pages

Mark scheme8 pages
Answers below. Sit the paper first if you are practising.

Questions as text
Q1 · A group of students investigated the effects of glucose and ATP on the contraction of…
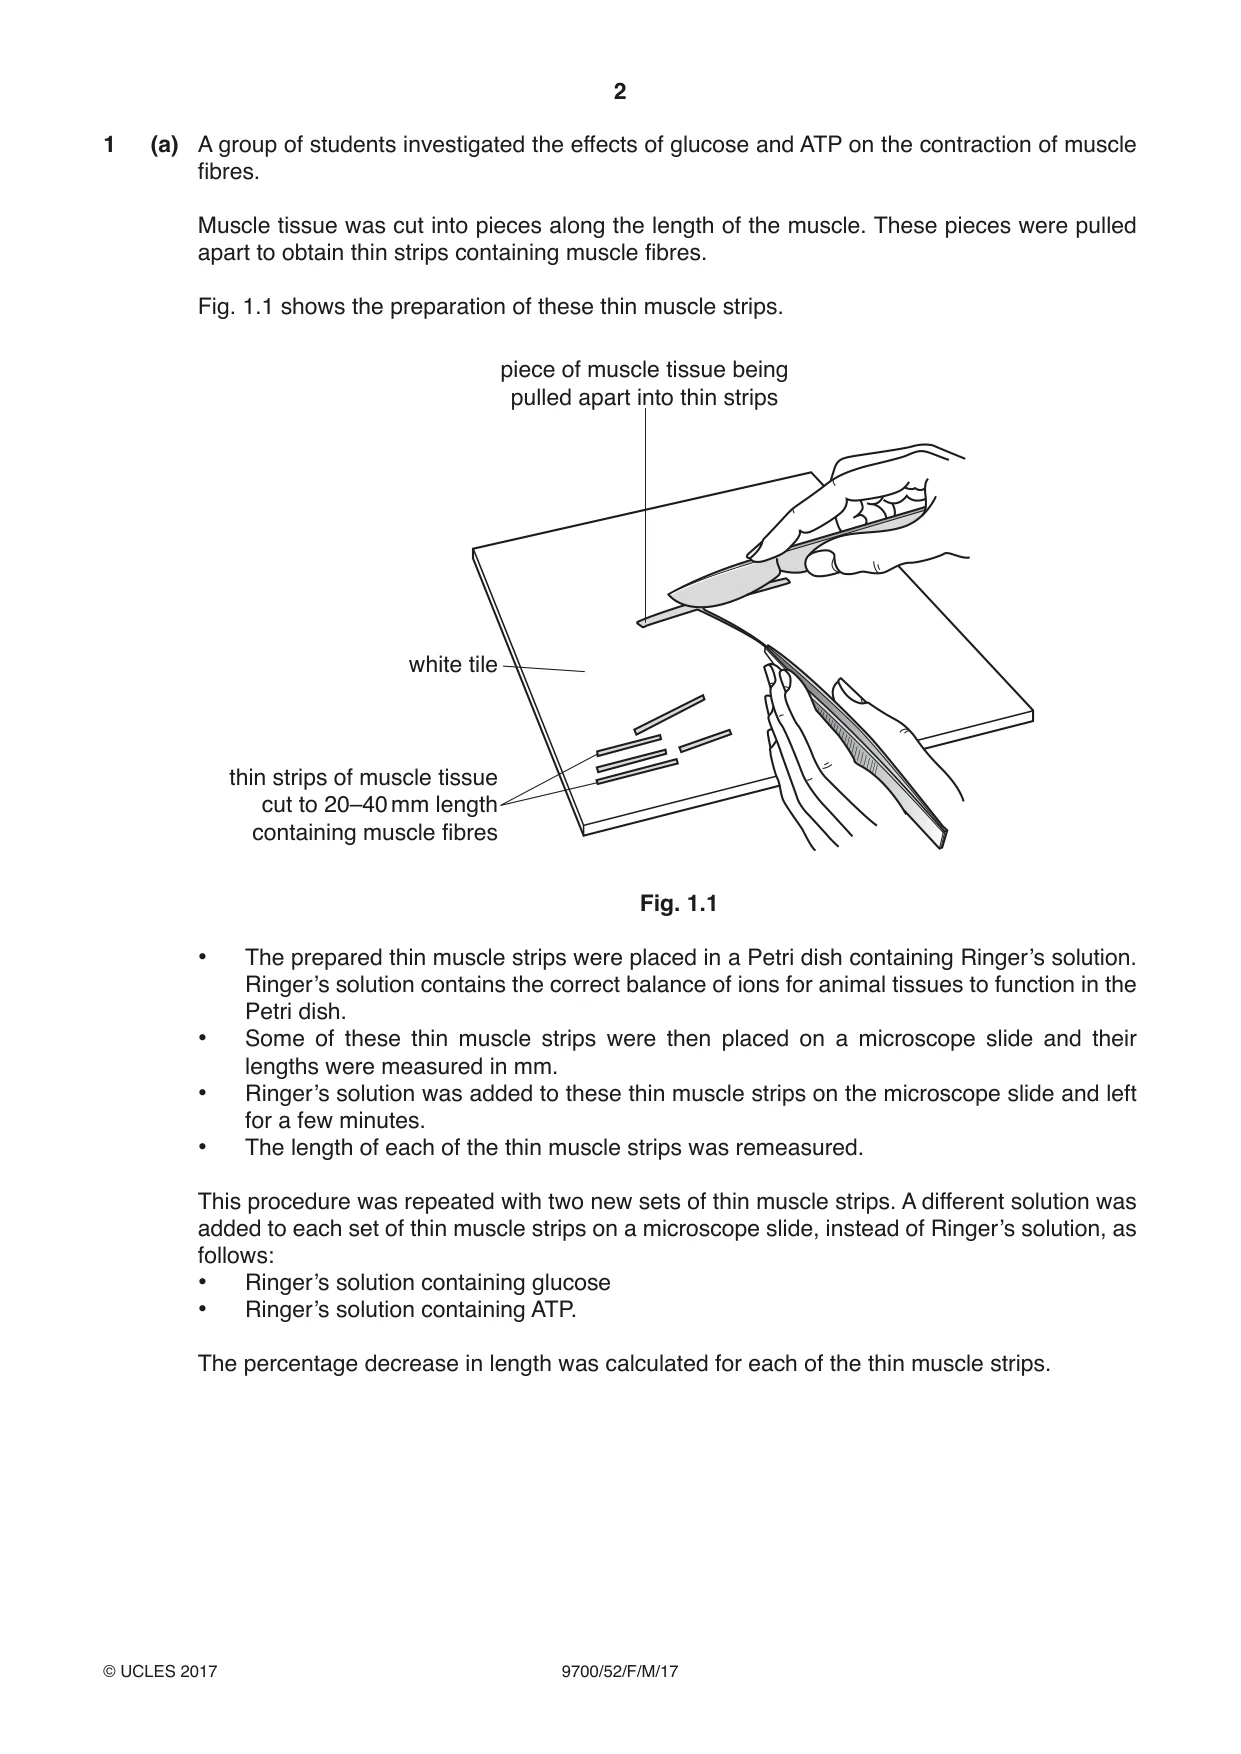
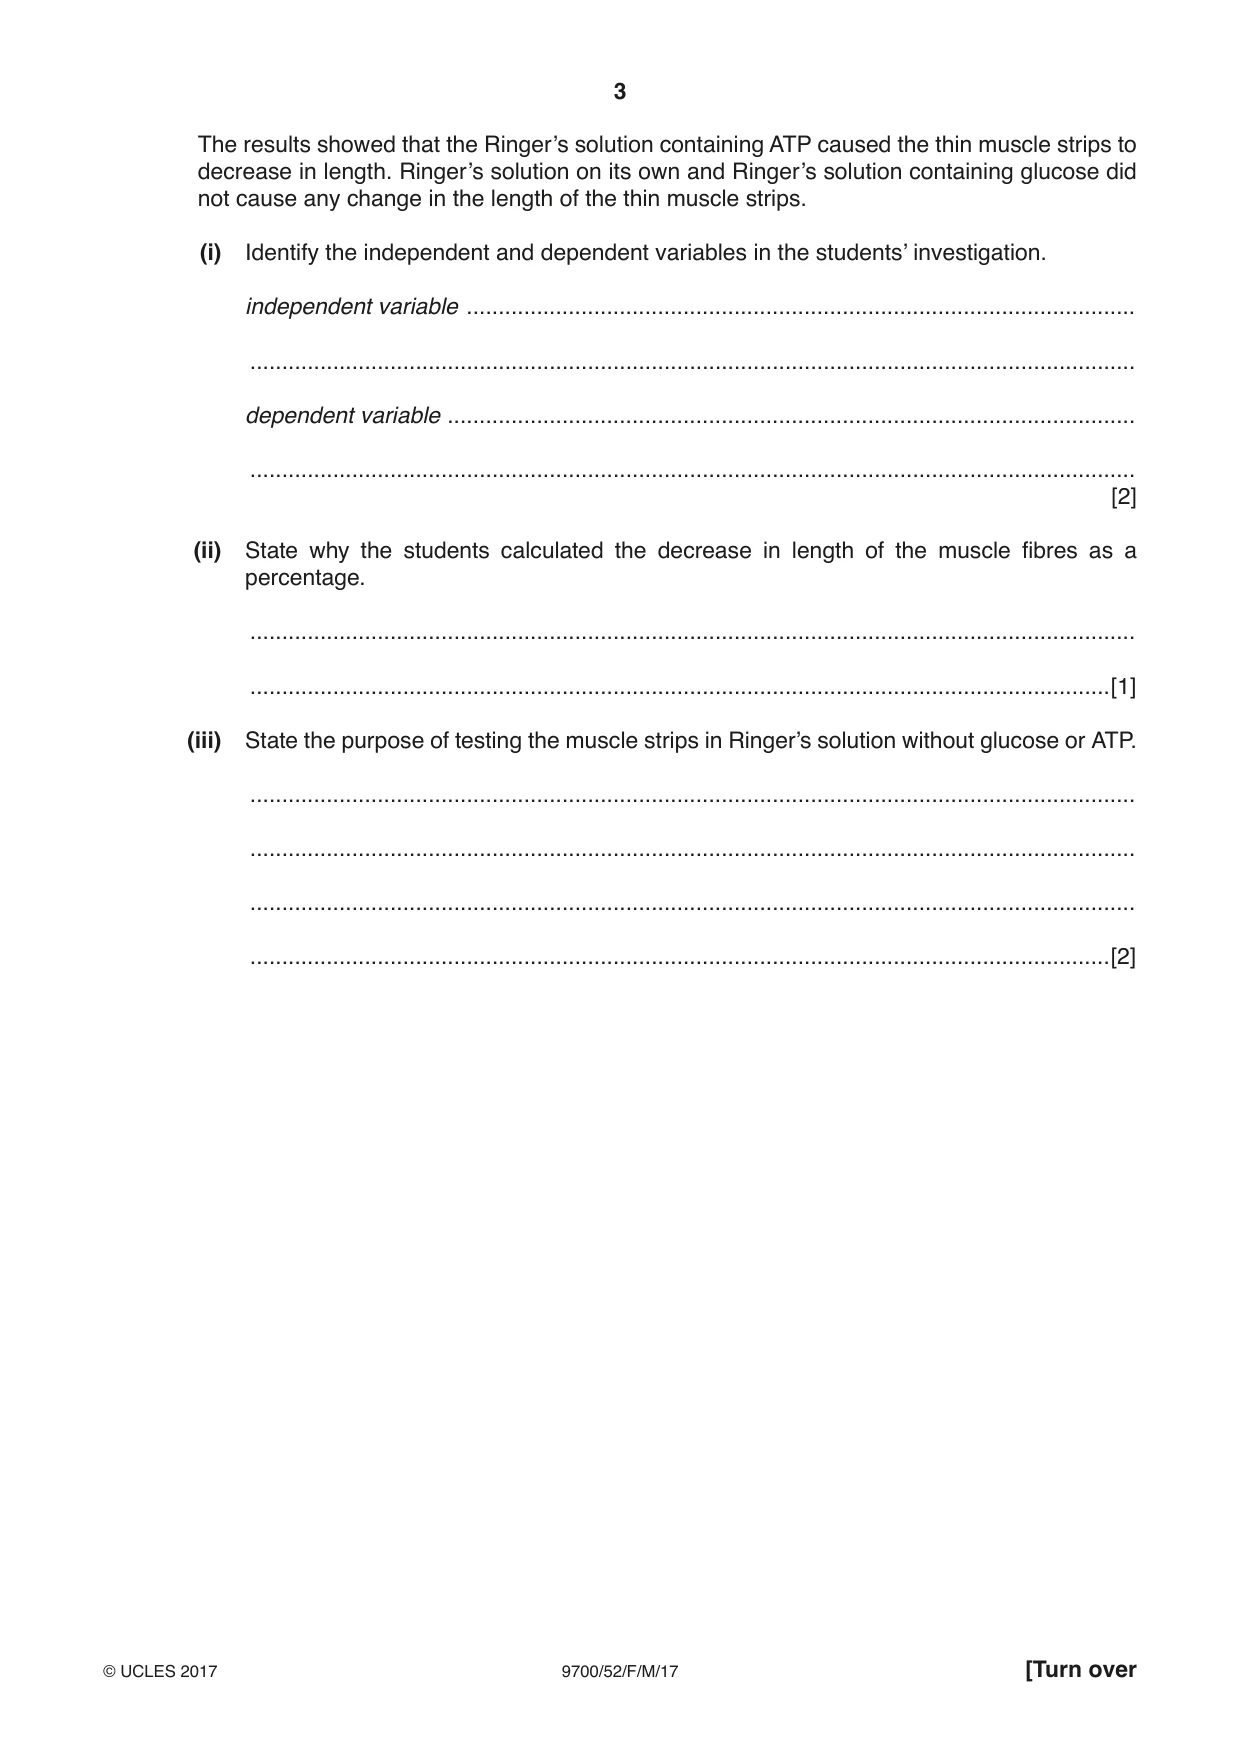
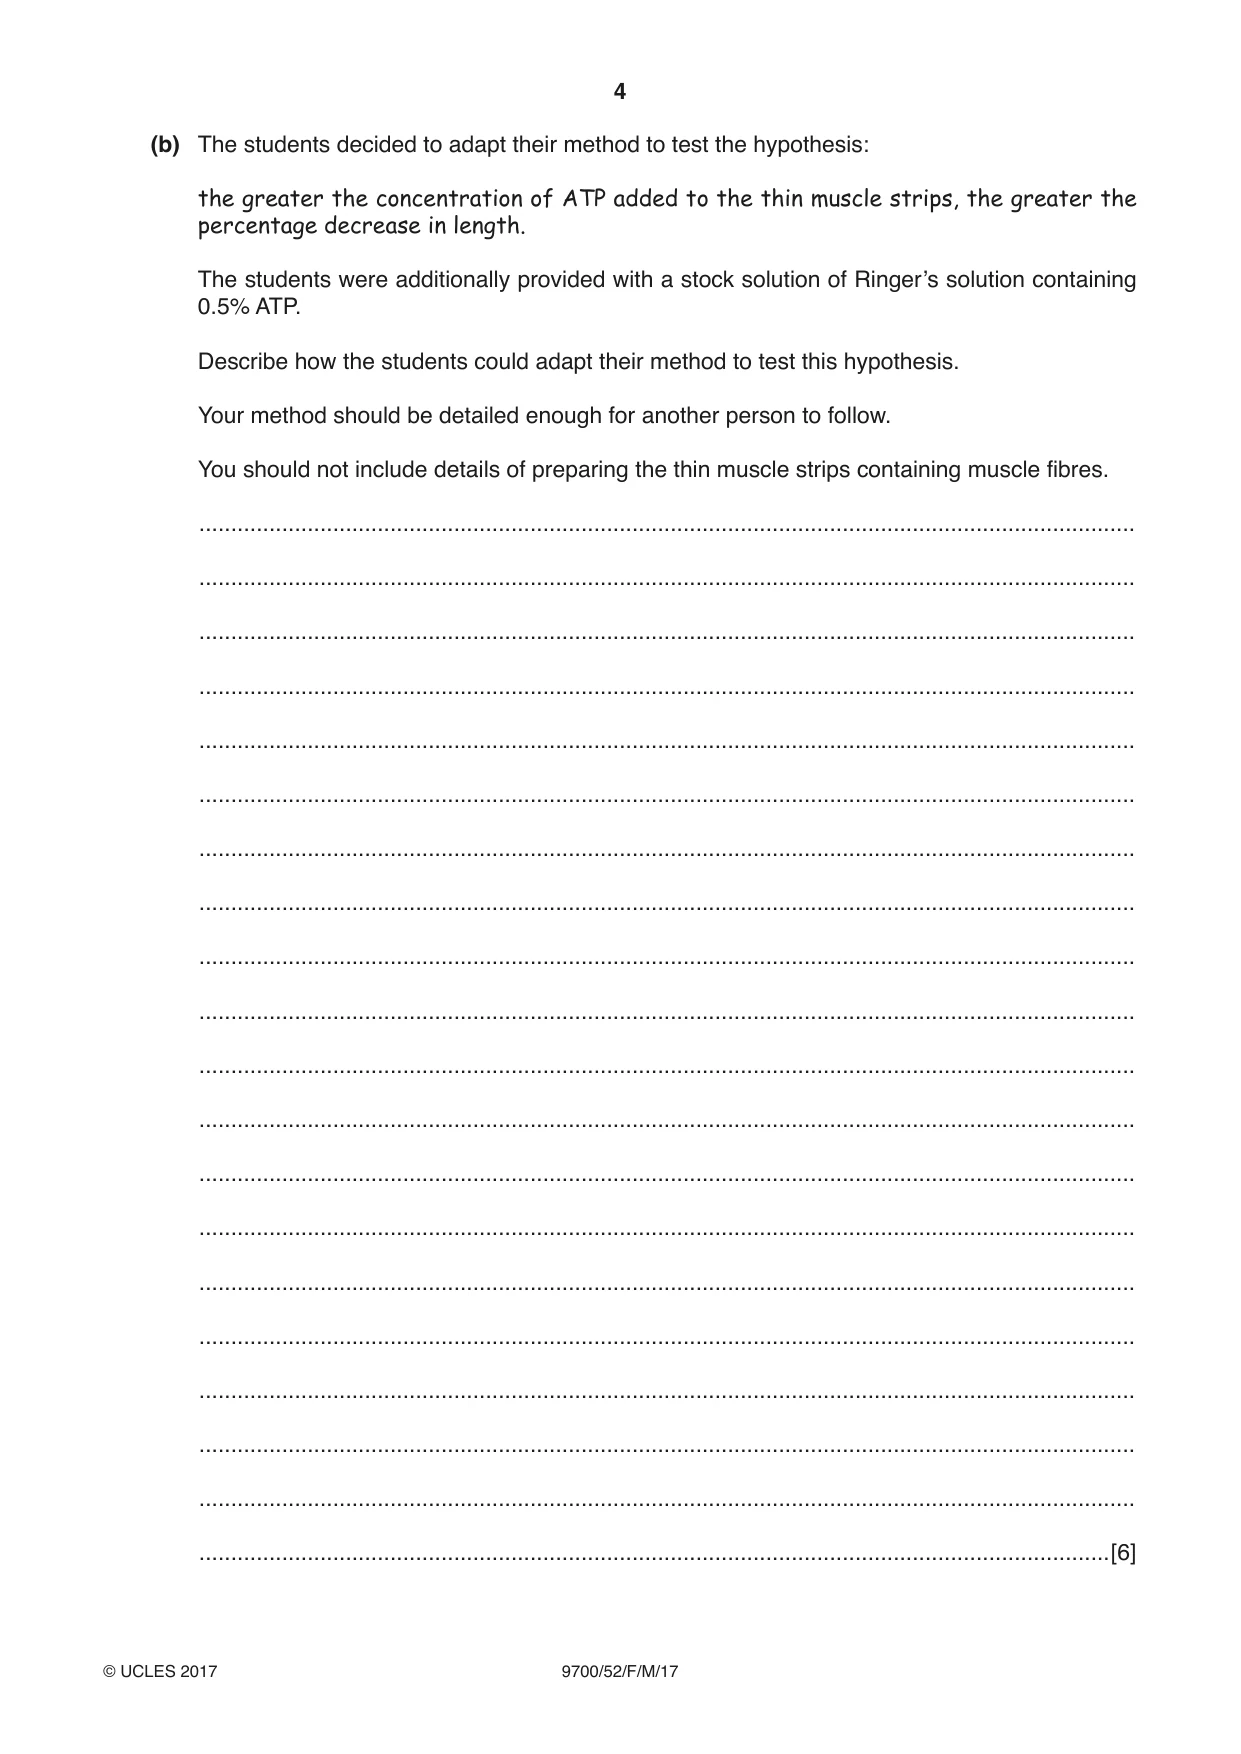
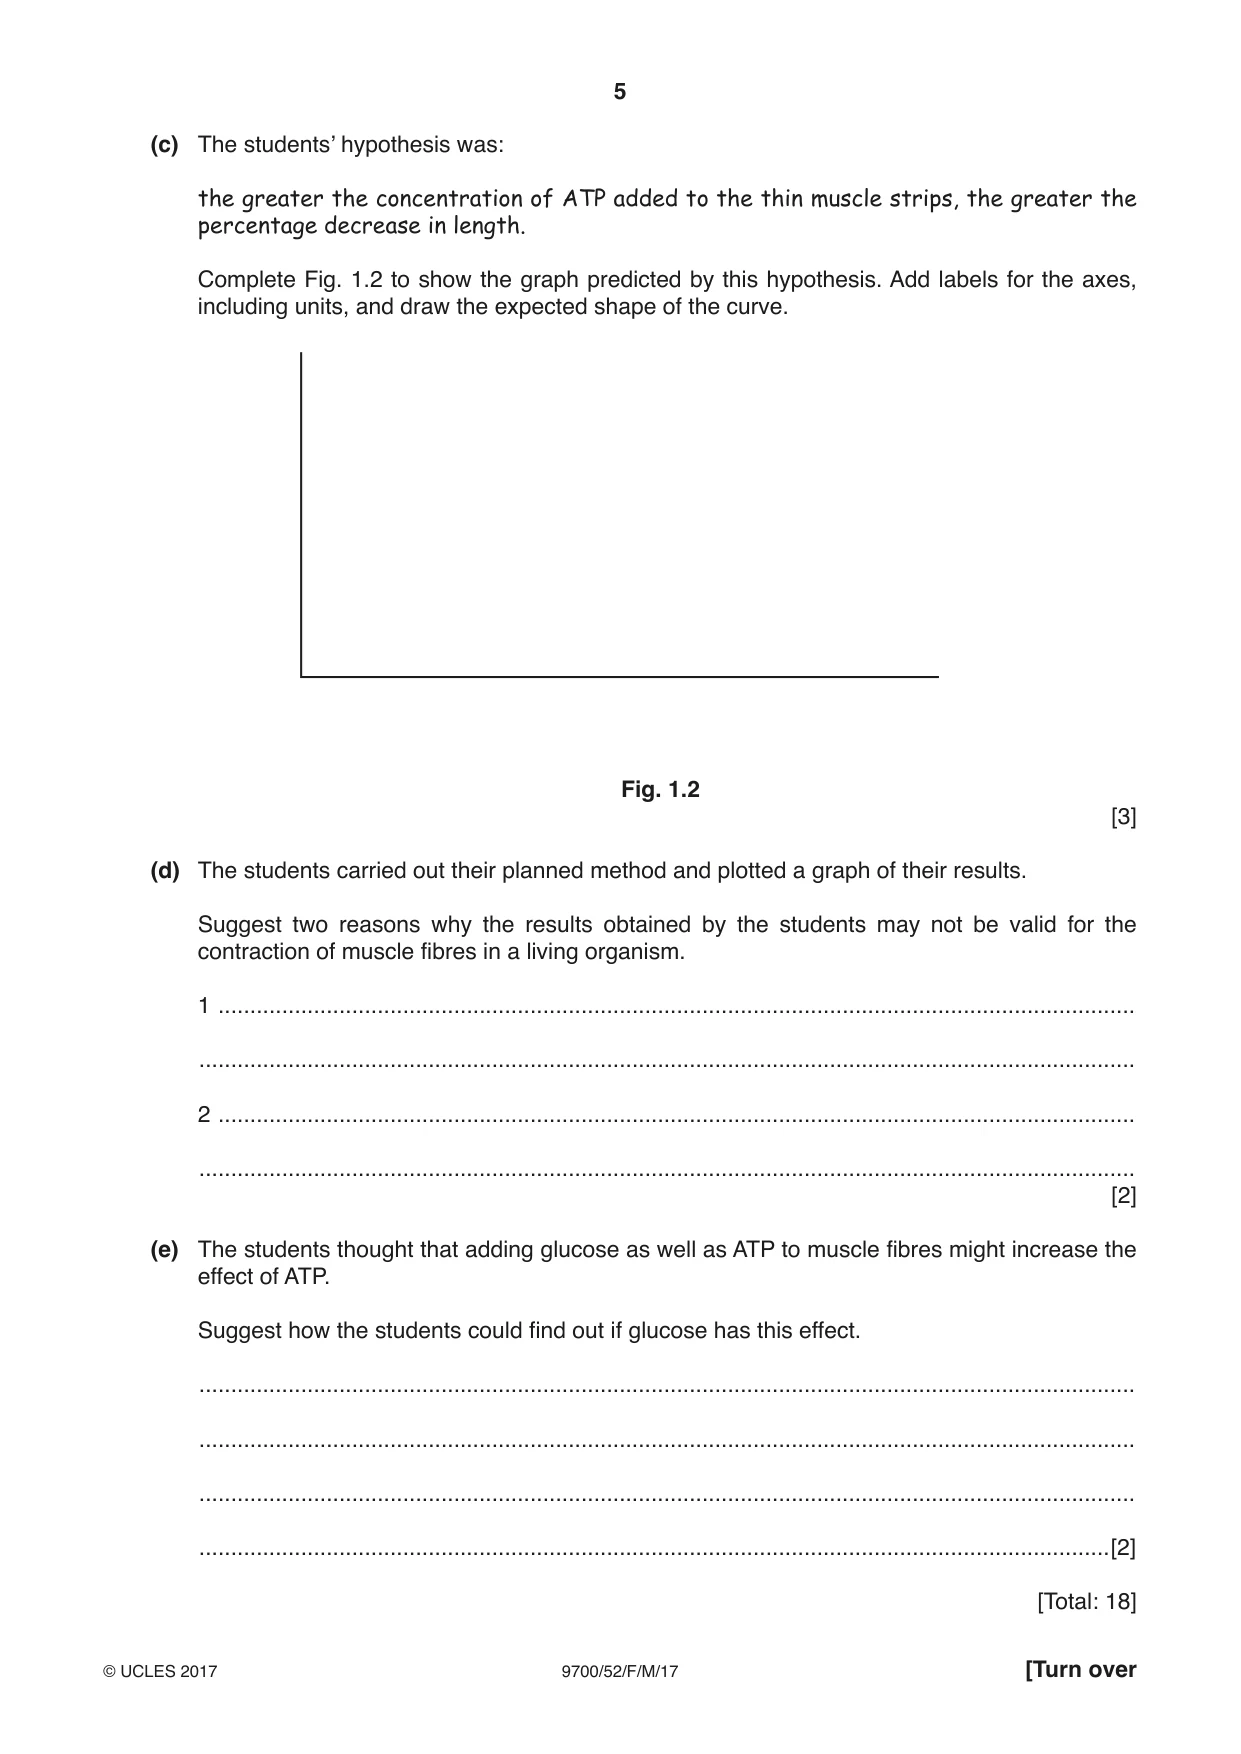
1 (a) A group of students investigated the effects of glucose and ATP on the contraction of muscle fibres. Muscle tissue was cut into pieces along the length of the muscle. These pieces were pulled apart to obtain thin strips containing muscle fibres. Fig. 1.1 shows the preparation of these thin muscle strips. piece of muscle tissue being pulled apart into thin strips white tile thin strips of muscle tissue cut to 20–40 mm length containing muscle fibres Fig. 1.1 • The prepared thin muscle strips were placed in a Petri dish containing Ringer’s solution. Ringer’s solution contains the correct balance of ions for animal tissues to function in the Petri dish. • Some of these thin muscle strips were then placed on a microscope slide and their lengths were measured in mm. • Ringer’s solution was added to these thin muscle strips on the microscope slide and left for a few minutes. • The length of each of the thin muscle strips was remeasured. This procedure was repeated with two new sets of thin muscle strips. A different solution was added to each set of thin muscle strips on a microscope slide, instead of Ringer’s solution, as follows: • Ringer’s solution containing glucose • Ringer’s solution containing ATP. The percentage decrease in length was calculated for each of the thin muscle strips. The results showed that the Ringer’s solution containing ATP caused the thin muscle strips to decrease in length. Ringer’s solution on its own and Ringer’s solution containing glucose did not cause any change in the length of the thin muscle strips. (i) Identify the independent and dependent variables in the students’ investigation. independent variable ......................................................................................................... ........................................................................................................................................... dependent variable ............................................................................................................ ........................................................................................................................................... [2] (ii) State why the students calculated the decrease in length of the muscle fibres as a percentage. ........................................................................................................................................... .......................................................................................................................................[1] (iii) State the purpose of testing the muscle strips in Ringer’s solution without glucose or ATP. ........................................................................................................................................... ........................................................................................................................................... ........................................................................................................................................... .......................................................................................................................................[2] (b) The students decided to adapt their method to test the hypothesis: the greater the concentration of ATP added to the thin muscle strips, the greater the percentage decrease in length. The students were additionally provided with a stock solution of Ringer’s solution containing 0.5% ATP. Describe how the students could adapt their method to test this hypothesis. Your method should be detailed enough for another person to follow. You should not include details of preparing the thin muscle strips containing muscle fibres. ................................................................................................................................................... ................................................................................................................................................... ................................................................................................................................................... ................................................................................................................................................... ................................................................................................................................................... ................................................................................................................................................... ................................................................................................................................................... ................................................................................................................................................... ................................................................................................................................................... ................................................................................................................................................... ................................................................................................................................................... ................................................................................................................................................... ................................................................................................................................................... ................................................................................................................................................... ................................................................................................................................................... ................................................................................................................................................... ................................................................................................................................................... ................................................................................................................................................... ................................................................................................................................................... ...............................................................................................................................................[6] (c) The students’ hypothesis was: the greater the concentration of ATP added to the thin muscle strips, the greater the percentage decrease in length. Complete Fig. 1.2 to show the graph predicted by this hypothesis. Add labels for the axes, including units, and draw the expected shape of the curve. Fig. 1.2 [3] (d) The students carried out their planned method and plotted a graph of their results. Suggest two reasons why the results obtained by the students may not be valid for the contraction of muscle fibres in a living organism. 1 ................................................................................................................................................ ................................................................................................................................................... 2 ................................................................................................................................................ ................................................................................................................................................... [2] (e) The students thought that adding glucose as well as ATP to muscle fibres might increase the effect of ATP. Suggest how the students could find out if glucose has this effect. ................................................................................................................................................... ................................................................................................................................................... ................................................................................................................................................... ...............................................................................................................................................[2] [Total: 18]
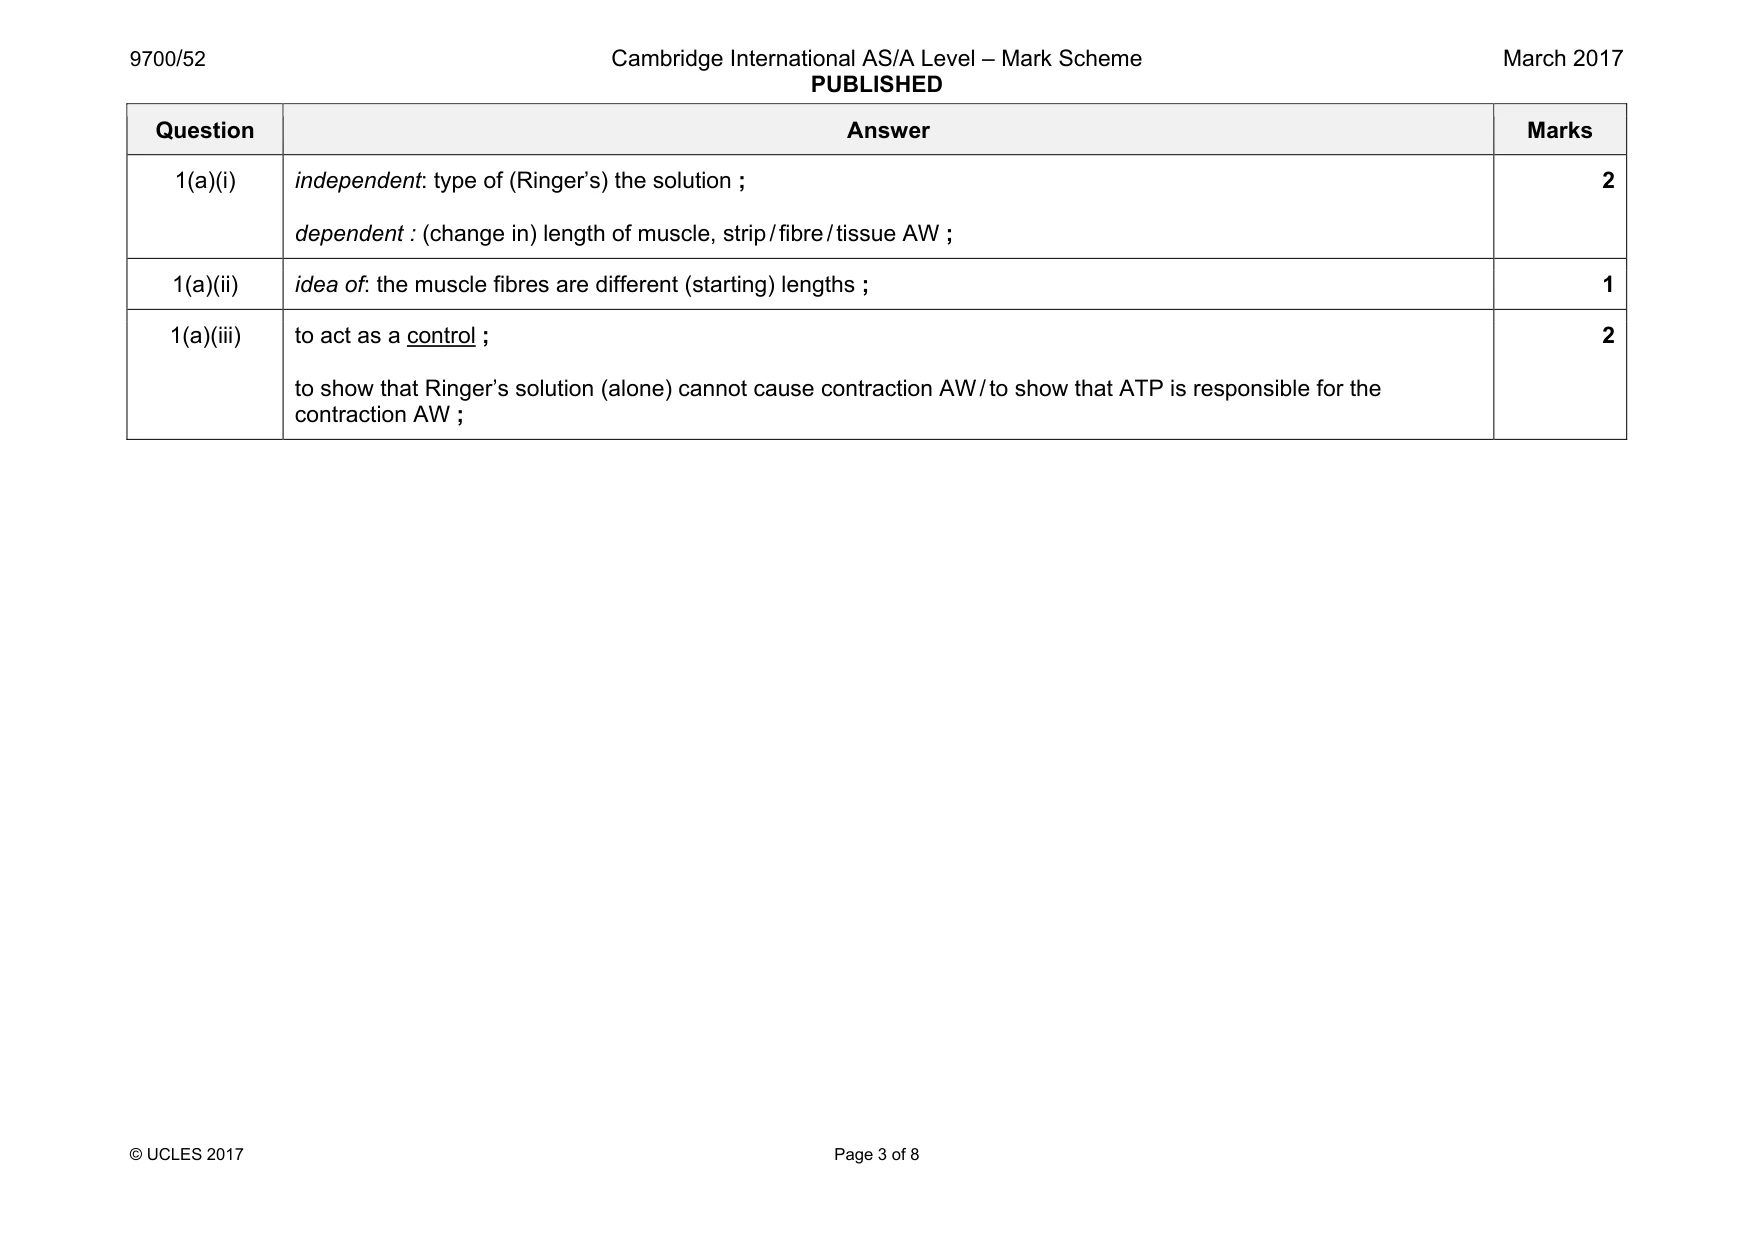
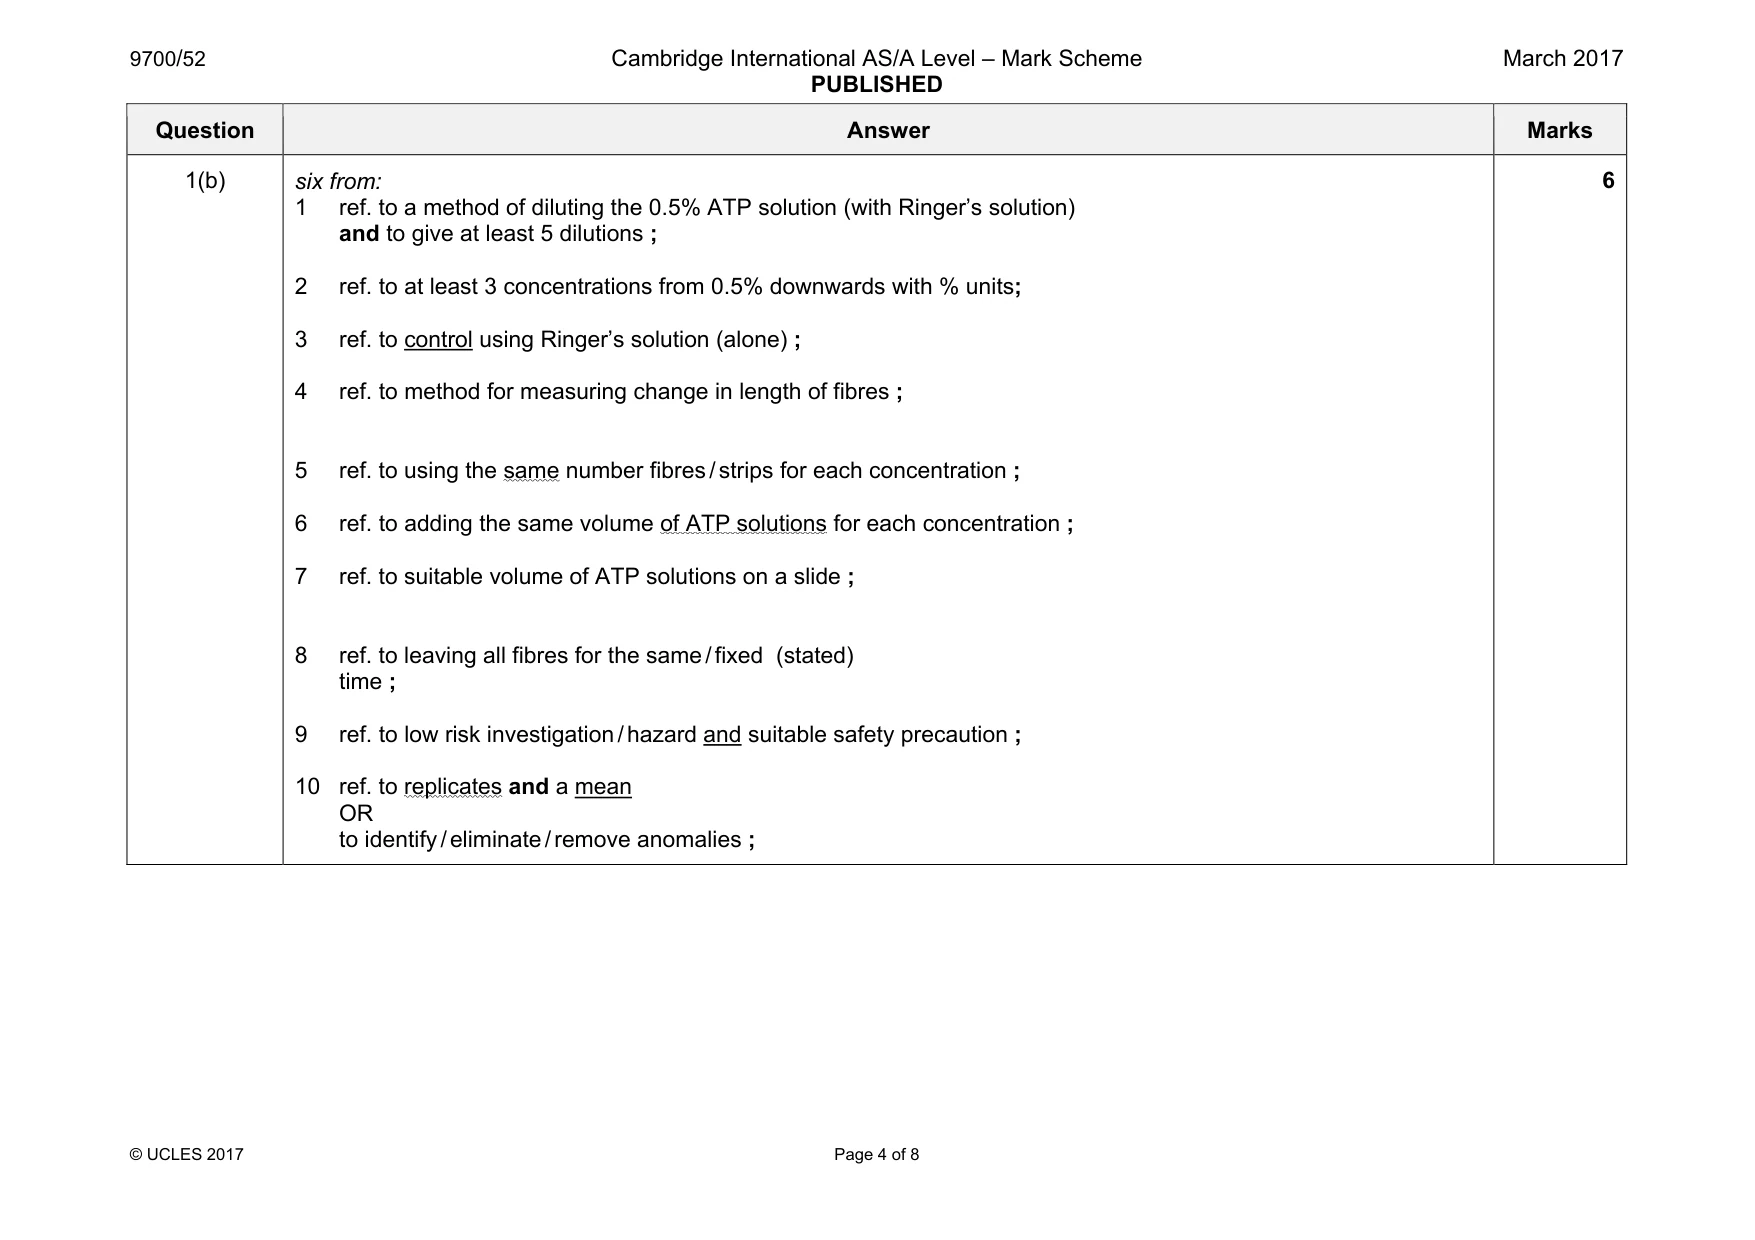
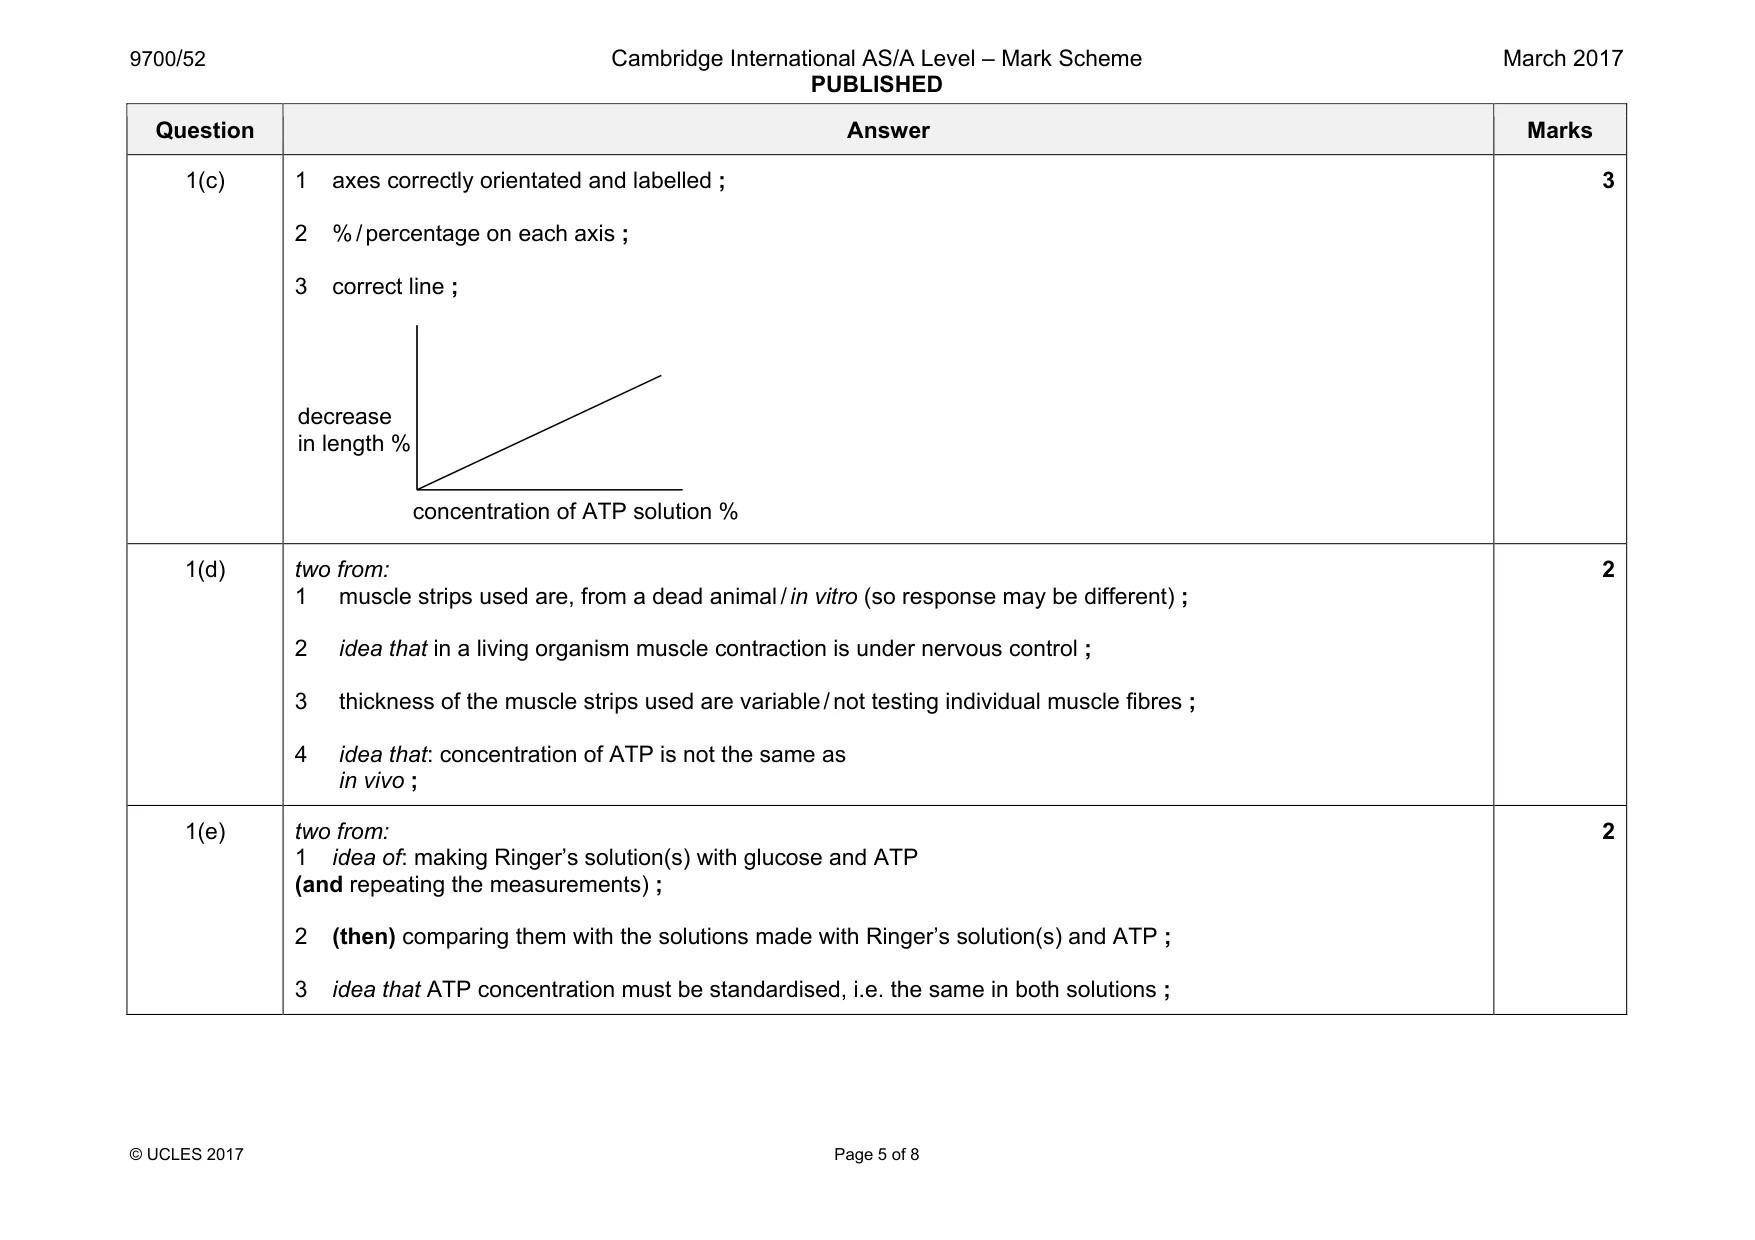
Mark scheme: 1(a)(i) independent: type of (Ringer’s) the solution ; dependent : (change in) length of muscle, strip / fibre / tissue AW ; 2 1(a)(ii) idea of: the muscle fibres are different (starting) lengths ; 1 1(a)(iii) to act as a control ; to show that Ringer’s solution (alone) cannot cause contraction AW / to show that ATP is responsible for the contraction AW ; 2 Question Answer Marks 1(b) six from: 1 ref. to a method of diluting the 0.5% ATP solution (with Ringer’s solution) and to give at least 5 dilutions ; 2 ref. to at least 3 concentrations from 0.5% downwards with % units; 3 ref. to control using Ringer’s solution (alone) ; 4 ref. to method for measuring change in length of fibres ; 5 ref. to using the same number fibres / strips for each concentration ; 6 ref. to adding the same volume of ATP solutions for each concentration ; 7 ref. to suitable volume of ATP solutions on a slide ; 8 ref. to leaving all fibres for the same / fixed (stated) time ; 9 ref. to low risk investigation / hazard and suitable safety precaution ; 10 ref. to replicates and a mean OR to identify / eliminate / remove anomalies ; 6 Question Answer Marks 1(c) 1 axes correctly orientated and labelled ; 2 % / percentage on each axis ; 3 correct line ; 3 1(d) two from: 1 muscle strips used are, from a dead animal / in vitro (so response may be different) ; 2 idea that in a living organism muscle contraction is under nervous control ; 3 thickness of the muscle strips used are variable / not testing individual muscle fibres ; 4 idea that: concentration of ATP is not the same as in vivo ; 2 1(e) two from: 1 idea of: making Ringer’s solution(s) with glucose and ATP (and repeating the measurements) ; 2 (then) comparing them with the solutions made with Ringer’s solution(s) and ATP ; 3 idea that ATP concentration must be standardised, i.e. the same in both solutions ; 2 concentration of ATP solution % decrease in length %
Q2 · Melanism (dark-coloured wings) in a species of moth is controlled by a gene with two…
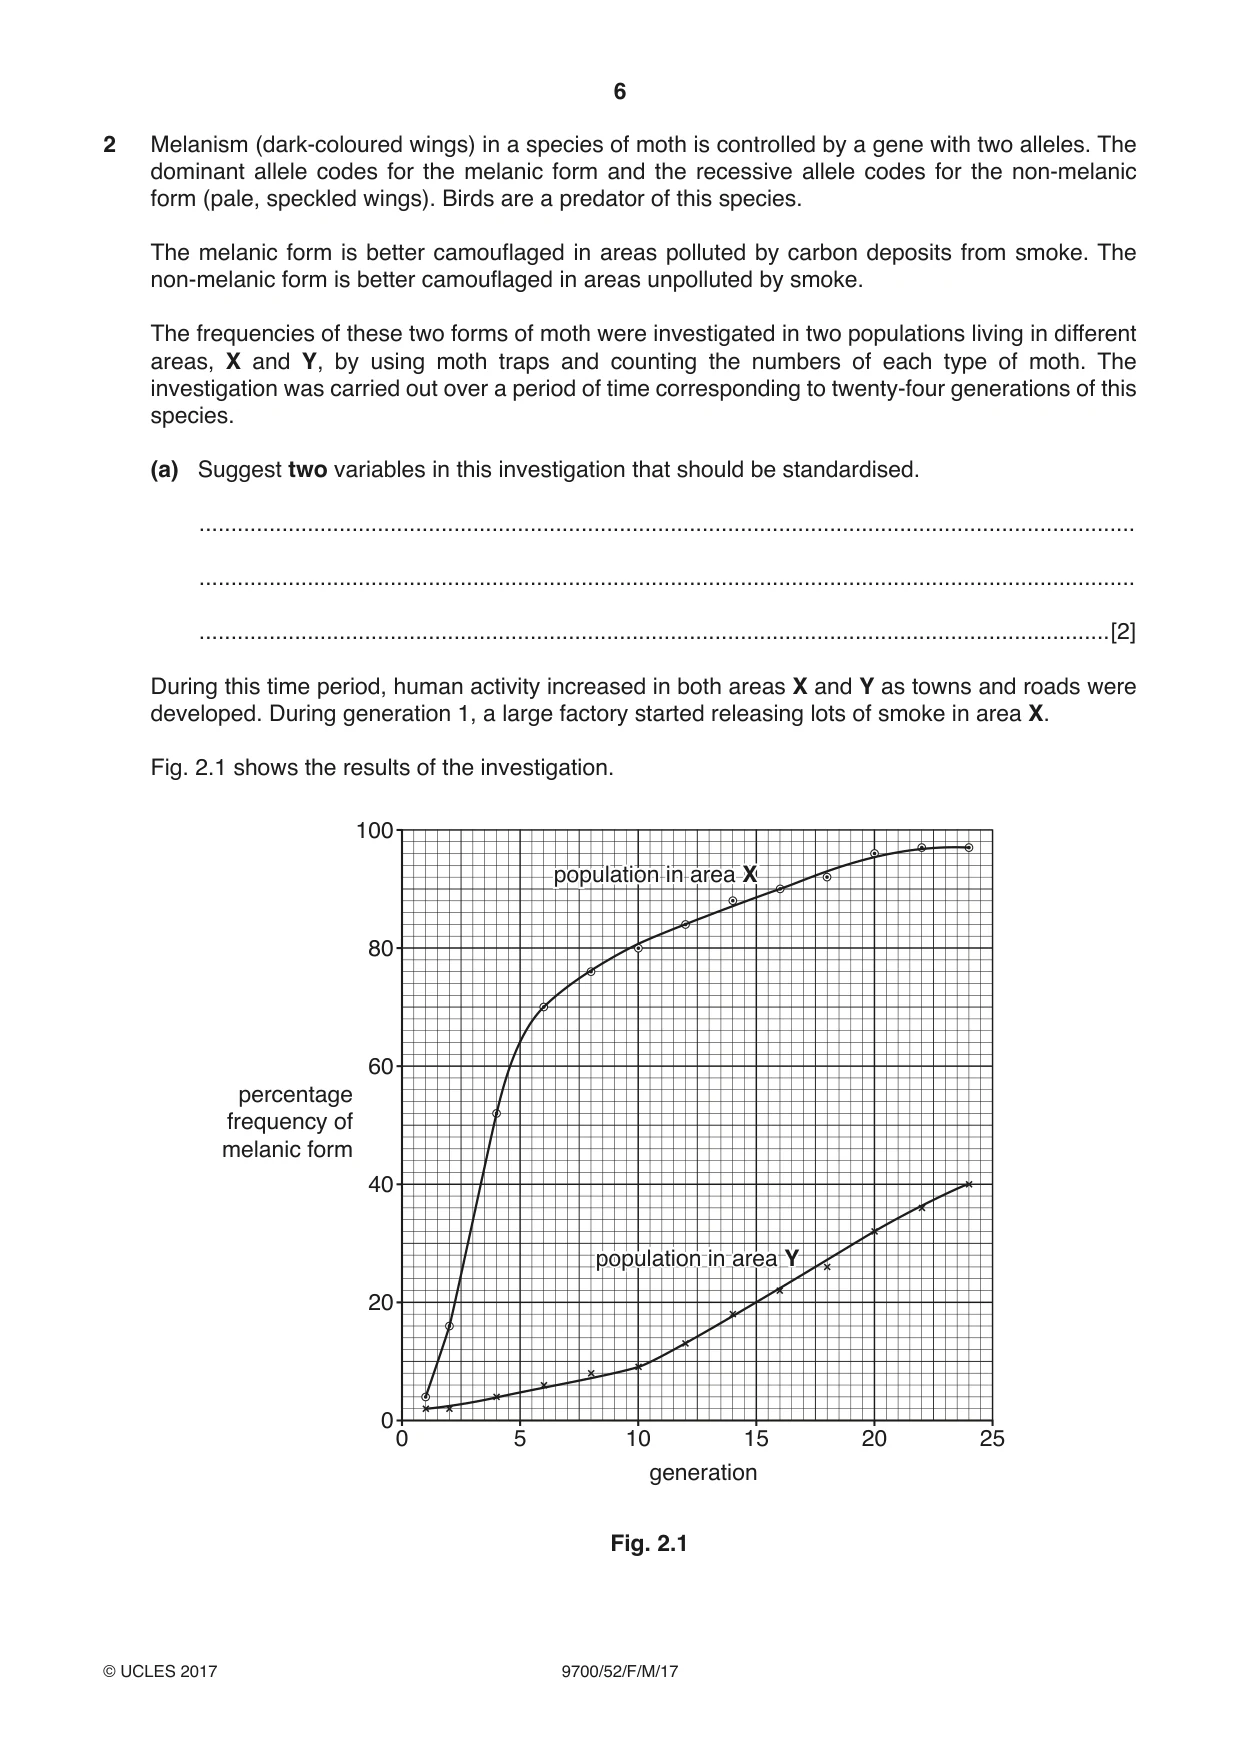
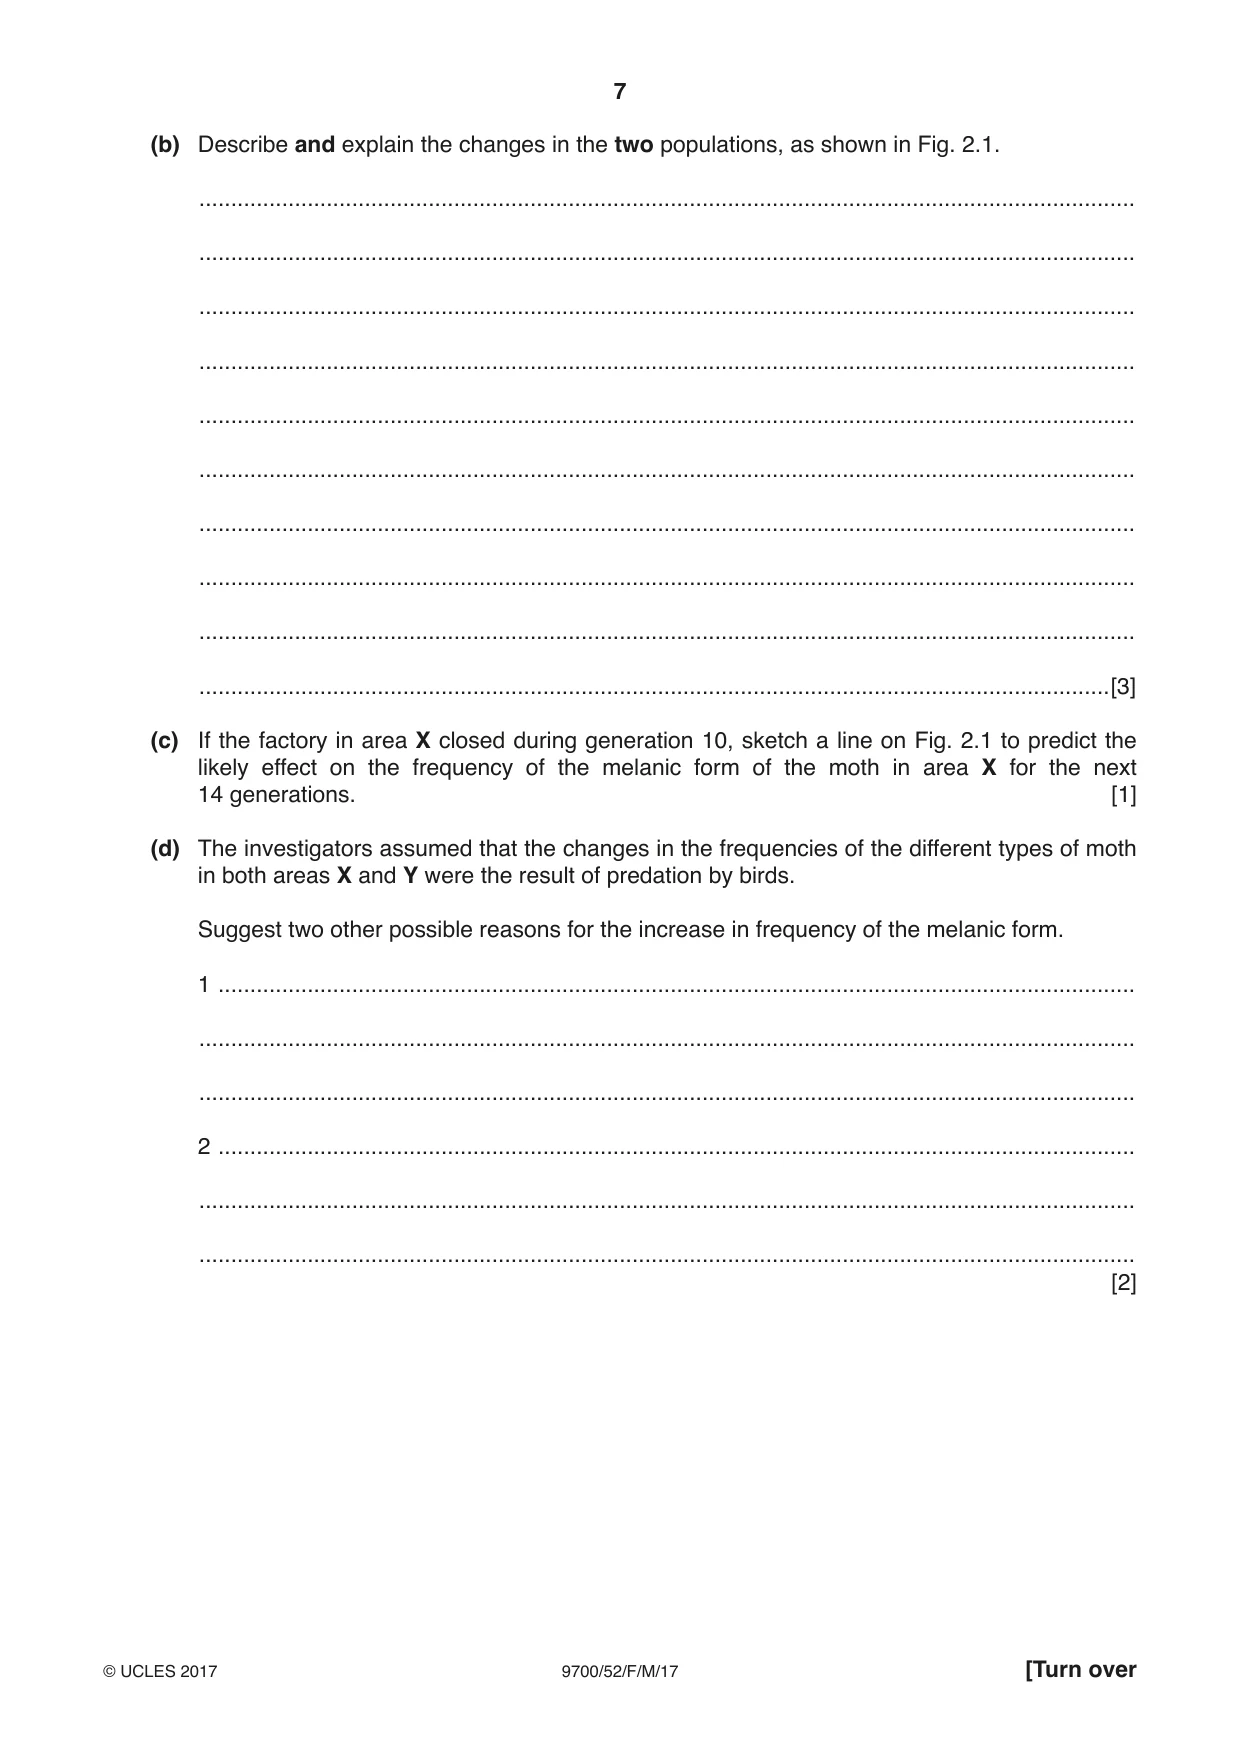
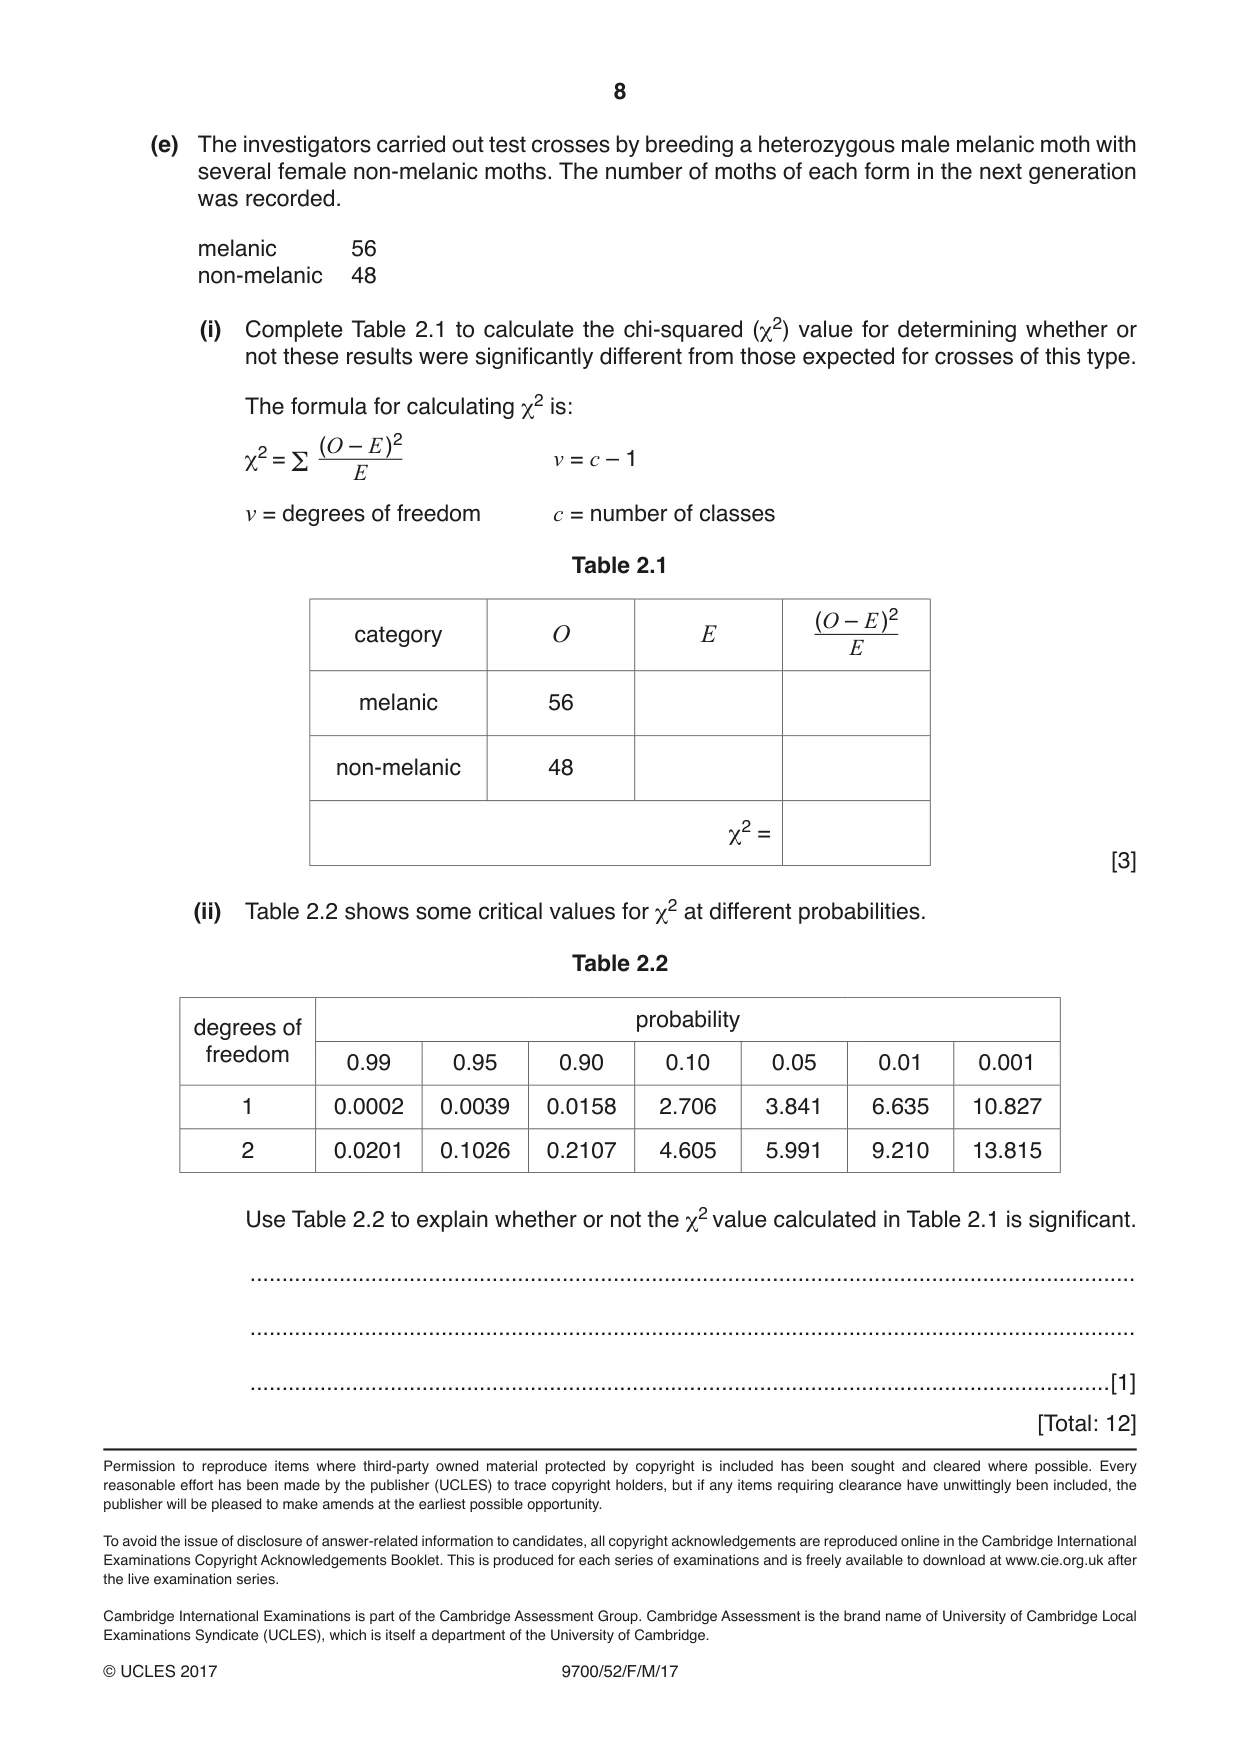
2 Melanism (dark-coloured wings) in a species of moth is controlled by a gene with two alleles. The dominant allele codes for the melanic form and the recessive allele codes for the non-melanic form (pale, speckled wings). Birds are a predator of this species. The melanic form is better camouflaged in areas polluted by carbon deposits from smoke. The non-melanic form is better camouflaged in areas unpolluted by smoke. The frequencies of these two forms of moth were investigated in two populations living in different areas, X and Y, by using moth traps and counting the numbers of each type of moth. The investigation was carried out over a period of time corresponding to twenty-four generations of this species. (a) Suggest two variables in this investigation that should be standardised. ................................................................................................................................................... ................................................................................................................................................... ...............................................................................................................................................[2] During this time period, human activity increased in both areas X and Y as towns and roads were developed. During generation 1, a large factory started releasing lots of smoke in area X. Fig. 2.1 shows the results of the investigation. 100 populationpopulation inin areaarea XX 80 60 percentage frequency of melanic form 40 populationpopulation inin areaarea YY 20 0 0 5 10 15 20 25 generation Fig. 2.1 (b) Describe and explain the changes in the two populations, as shown in Fig. 2.1. ................................................................................................................................................... ................................................................................................................................................... ................................................................................................................................................... ................................................................................................................................................... ................................................................................................................................................... ................................................................................................................................................... ................................................................................................................................................... ................................................................................................................................................... ................................................................................................................................................... ...............................................................................................................................................[3] (c) If the factory in area X closed during generation 10, sketch a line on Fig. 2.1 to predict the likely effect on the frequency of the melanic form of the moth in area X for the next 14 generations. [1] (d) The investigators assumed that the changes in the frequencies of the different types of moth in both areas X and Y were the result of predation by birds. Suggest two other possible reasons for the increase in frequency of the melanic form. 1 ................................................................................................................................................ ................................................................................................................................................... ................................................................................................................................................... 2 ................................................................................................................................................ ................................................................................................................................................... ................................................................................................................................................... [2] (e) The investigators carried out test crosses by breeding a heterozygous male melanic moth with several female non-melanic moths. The number of moths of each form in the next generation was recorded. melanic 56 non-melanic 48 (i) Complete Table 2.1 to calculate the chi-squared (χ2) value for determining whether or not these results were significantly different from those expected for crosses of this type. The formula for calculating χ2 is: (O – E )2 χ2 = Σ v = c – 1 E v = degrees of freedom c = number of classes Table 2.1 (O – E )2 category O E E melanic 56 non-melanic 48 χ2 = [3] (ii) Table 2.2 shows some critical values for χ2 at different probabilities. Table 2.2 probability degrees of freedom 0.99 0.95 0.90 0.10 0.05 0.01 0.001 1 0.0002 0.0039 0.0158 2.706 3.841 6.635 10.827 2 0.0201 0.1026 0.2107 4.605 5.991 9.210 13.815 Use Table 2.2 to explain whether or not the χ2 value calculated in Table 2.1 is significant. ........................................................................................................................................... ........................................................................................................................................... .......................................................................................................................................[1] [Total: 12]
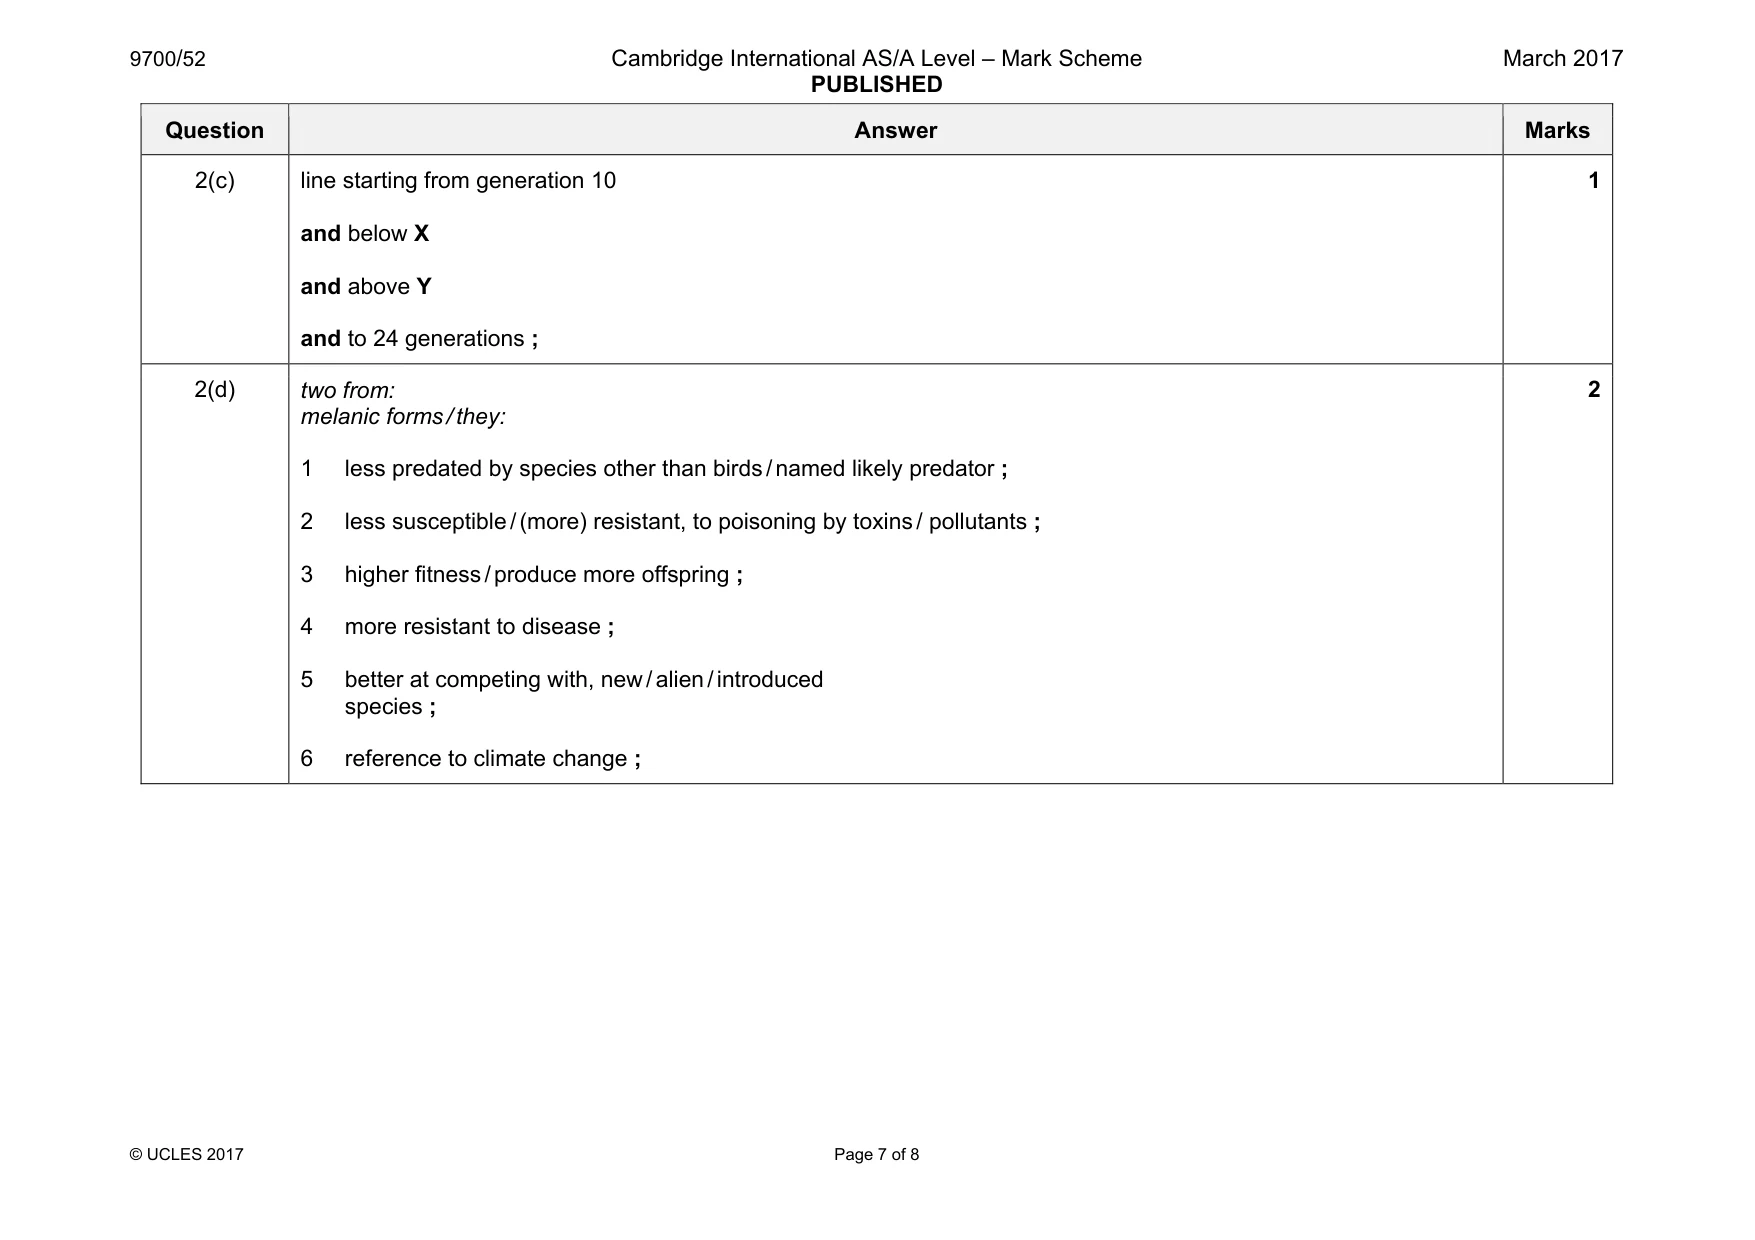
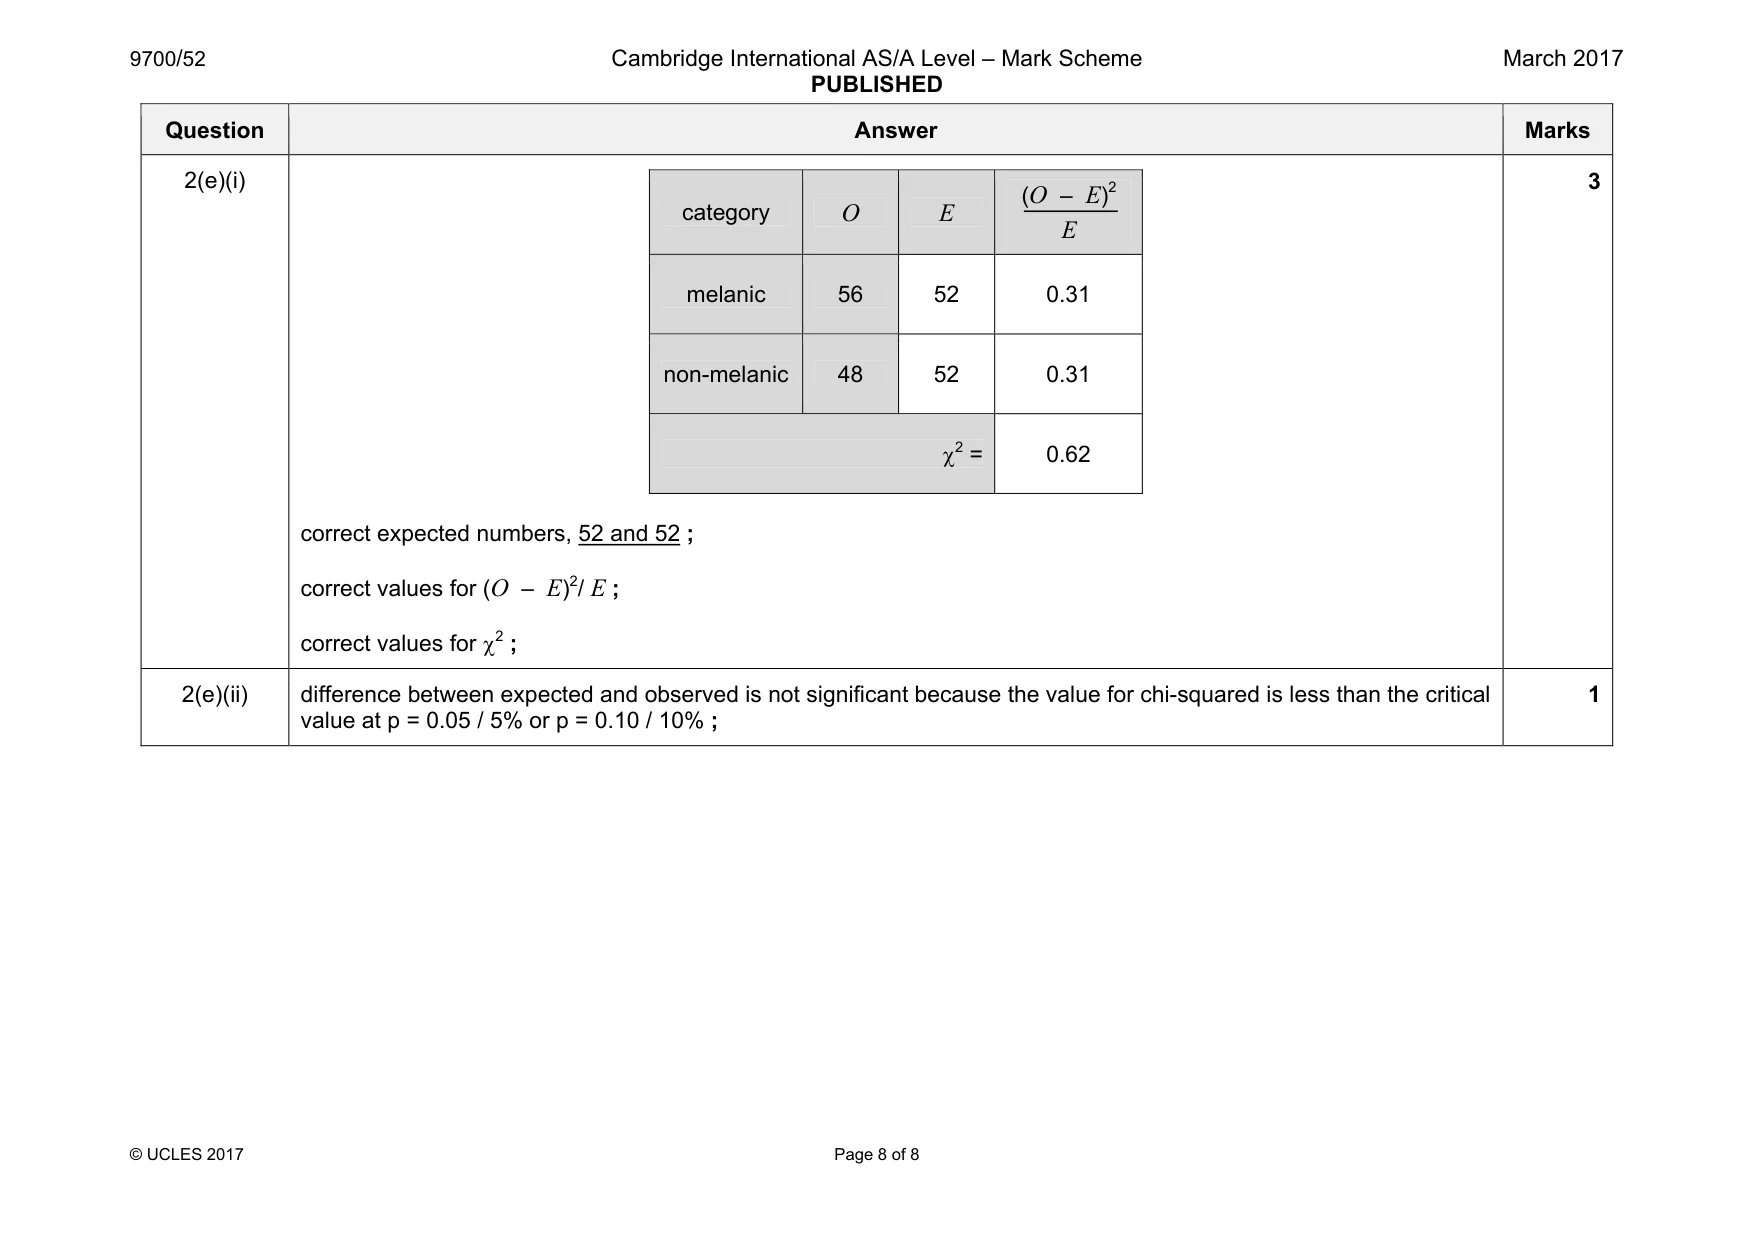
Mark scheme: 2(a) two from: 1 the number of times traps used ; 2 the type of trap used ; 3 time (of day) moths were trapped ; 4 time of year moths were trapped ; 5 ref. to positioning / spacing of traps ; 6 number of traps used ; 7 size of area from which samples taken ; 8 method of counting ; 2 2(b) three from: description: 1 (melanic moths) increase in frequency more in area X than in area Y ; 2 melanic moths in area X increase, most rapidly / linearly, and then starts to slow and Y increases more slowly at first and then increases more rapidly ; explanation: 3 area X more polluted than Y so selection acts more strongly AW / ORA ; 4 some non-melanics remain in population X because of breeding between heterozygotes ; 3 Question Answer Marks 2(c) line starting from generation 10 and below X and above Y and to 24 generations ; 1 2(d) two from: melanic forms / they: 1 less predated by species other than birds / named likely predator ; 2 less susceptible / (more) resistant, to poisoning by toxins / pollutants ; 3 higher fitness / produce more offspring ; 4 more resistant to disease ; 5 better at competing with, new / alien / introduced species ; 6 reference to climate change ; 2 Question Answer Marks 2(e)(i) category O E melanic 56 52 0.31 non-melanic 48 52 0.31 χ2 = 0.62 correct expected numbers, 52 and 52 ; correct values for (O – E)2/ E ; correct values for χ2 ; 3 2(e)(ii) difference between expected and observed is not significant because the value for chi-squared is less than the critical value at p = 0.05 / 5% or p = 0.10 / 10% ; 1 (O – E)2 E
What was in this paper
The subtopics covered by these 2 questions, and how many questions each got. Open one in a new tab to see every Cambridge question on it.
What you needed in this session
Cambridge’s own grade thresholds for 2017 Feb/March, Paper 5 · Variant 2. A higher threshold means an easier paper — the bar moves with how the cohort did.