Cambridge A Level Biology 9700 — 2016 May/June Paper 5 · Variant 2
9700/52/M/J/16 · 30 marks · ≈34 min
The question paper and its mark scheme, free to read here and free to download. This is Cambridge’s own paper, exactly as it was sat.
Question paper12 pages




Mark scheme8 pages
Answers below. Sit the paper first if you are practising.
Paper as text
Question paper, page 1
This document consists of 10 printed pages and 2 blank pages. DC (NF/SW) 109247/3 © UCLES 2016 [Turn over Cambridge International Examinations Cambridge International Advanced Subsidiary and Advanced Level * 0 6 7 4 7 3 0 7 1 7 * BIOLOGY 9700/52 Paper 5 Planning, Analysis and Evaluation May/June 2016 1 hour 15 minutes Candidates answer on the Question Paper. No Additional Materials are required. READ THESE INSTRUCTIONS FIRST Write your Centre number, candidate number and name on all the work you hand in. Write in dark blue or black pen. You may use an HB pencil for any diagrams or graphs. Do not use staples, paper clips, glue or correction fluid. DO NOT WRITE IN ANY BARCODES. Answer all questions. Electronic calculators may be used. You may lose marks if you do not show your working or if you do not use appropriate units. At the end of the examination, fasten all your work securely together. The number of marks is given in brackets [ ] at the end of each question or part question.
Question paper, page 2
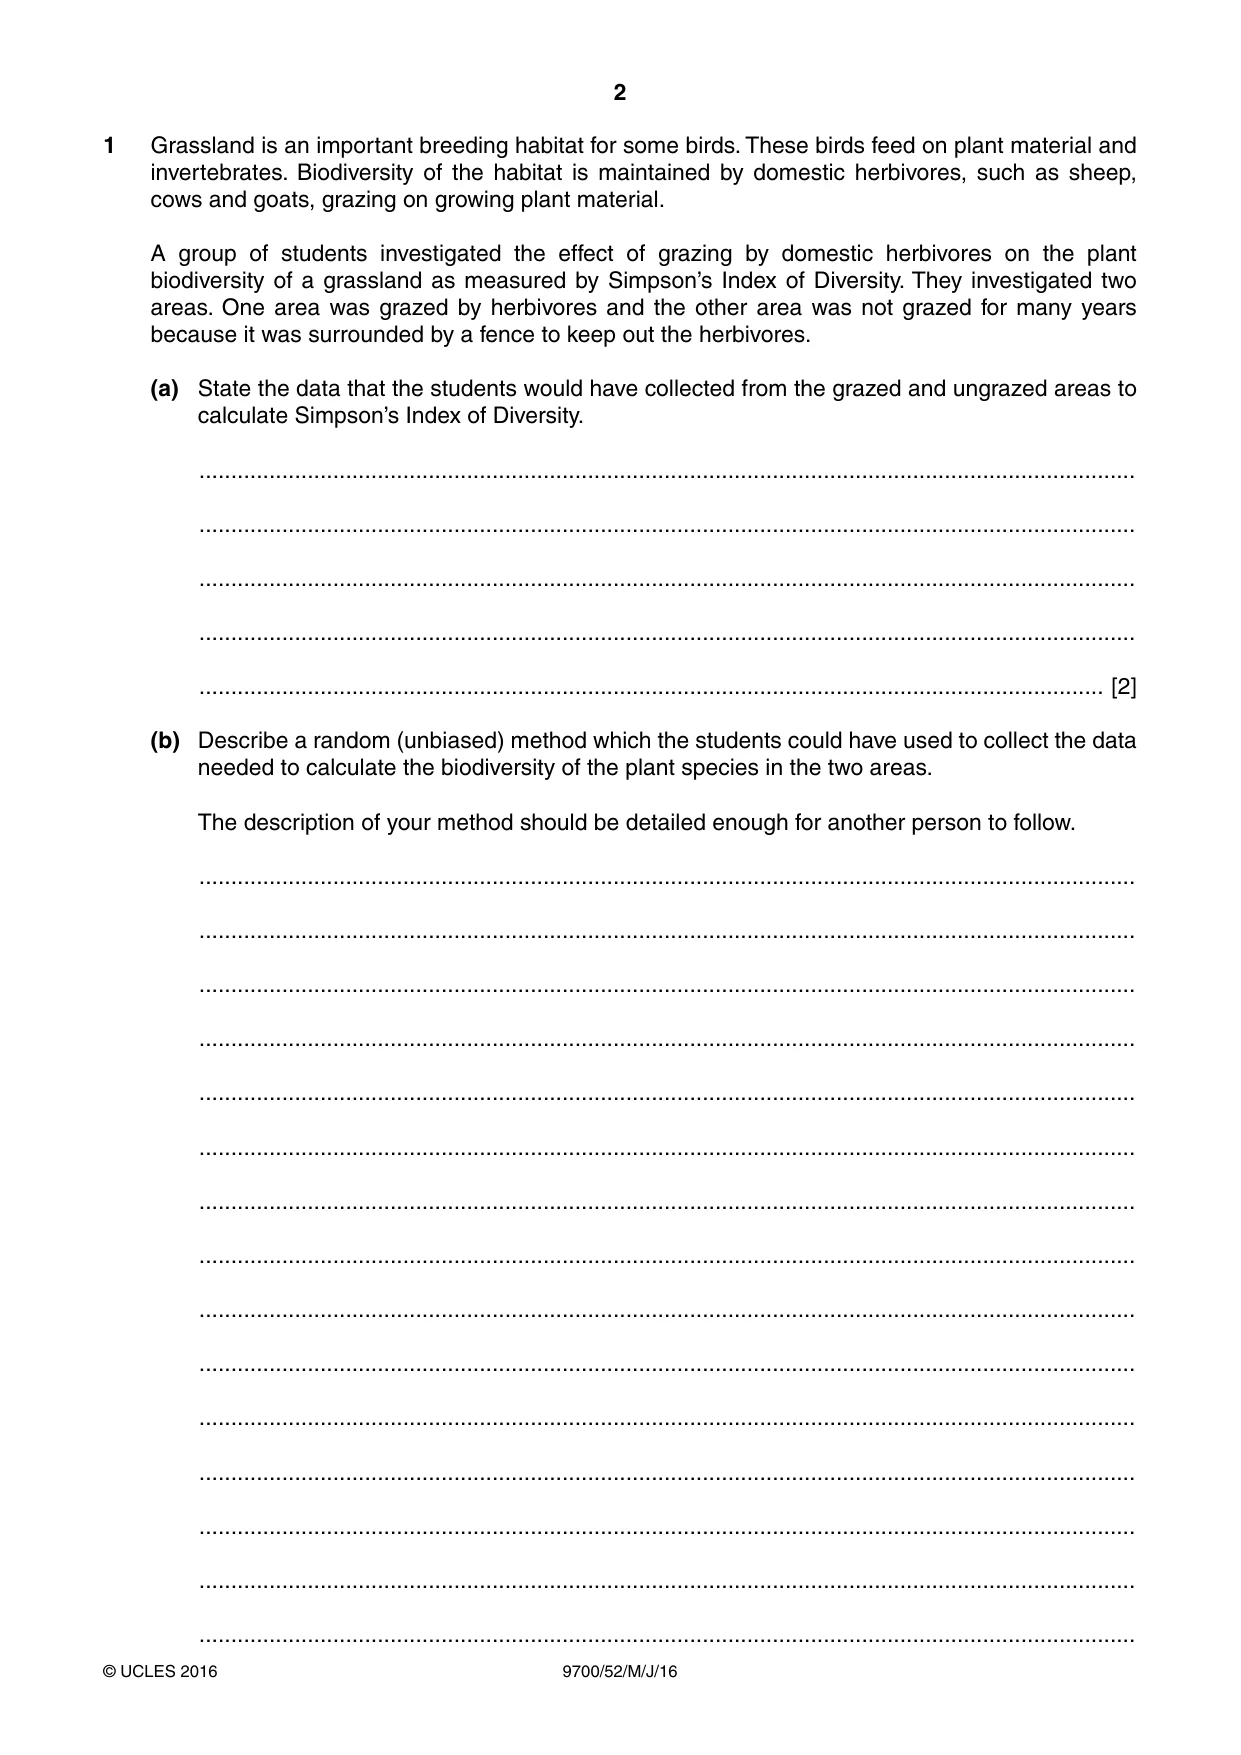
2 9700/52/M/J/16 © UCLES 2016 1 Grassland is an important breeding habitat for some birds. These birds feed on plant material and invertebrates. Biodiversity of the habitat is maintained by domestic herbivores, such as sheep, cows and goats, grazing on growing plant material. A group of students investigated the effect of grazing by domestic herbivores on the plant biodiversity of a grassland as measured by Simpson’s Index of Diversity. They investigated two areas. One area was grazed by herbivores and the other area was not grazed for many years because it was surrounded by a fence to keep out the herbivores. (a) State the data that the students would have collected from the grazed and ungrazed areas to calculate Simpson’s Index of Diversity. … … … … … [2] (b) Describe a random (unbiased) method which the students could have used to collect the data needed to calculate the biodiversity of the plant species in the two areas. The description of your method should be detailed enough for another person to follow. … … … … … … … … … … … … … … …
Question paper, page 3
3 9700/52/M/J/16 © UCLES 2016 [Turn over … … … … … … … … … … … … … … … … … … … … … … … … … … … … [8]
Question paper, page 4
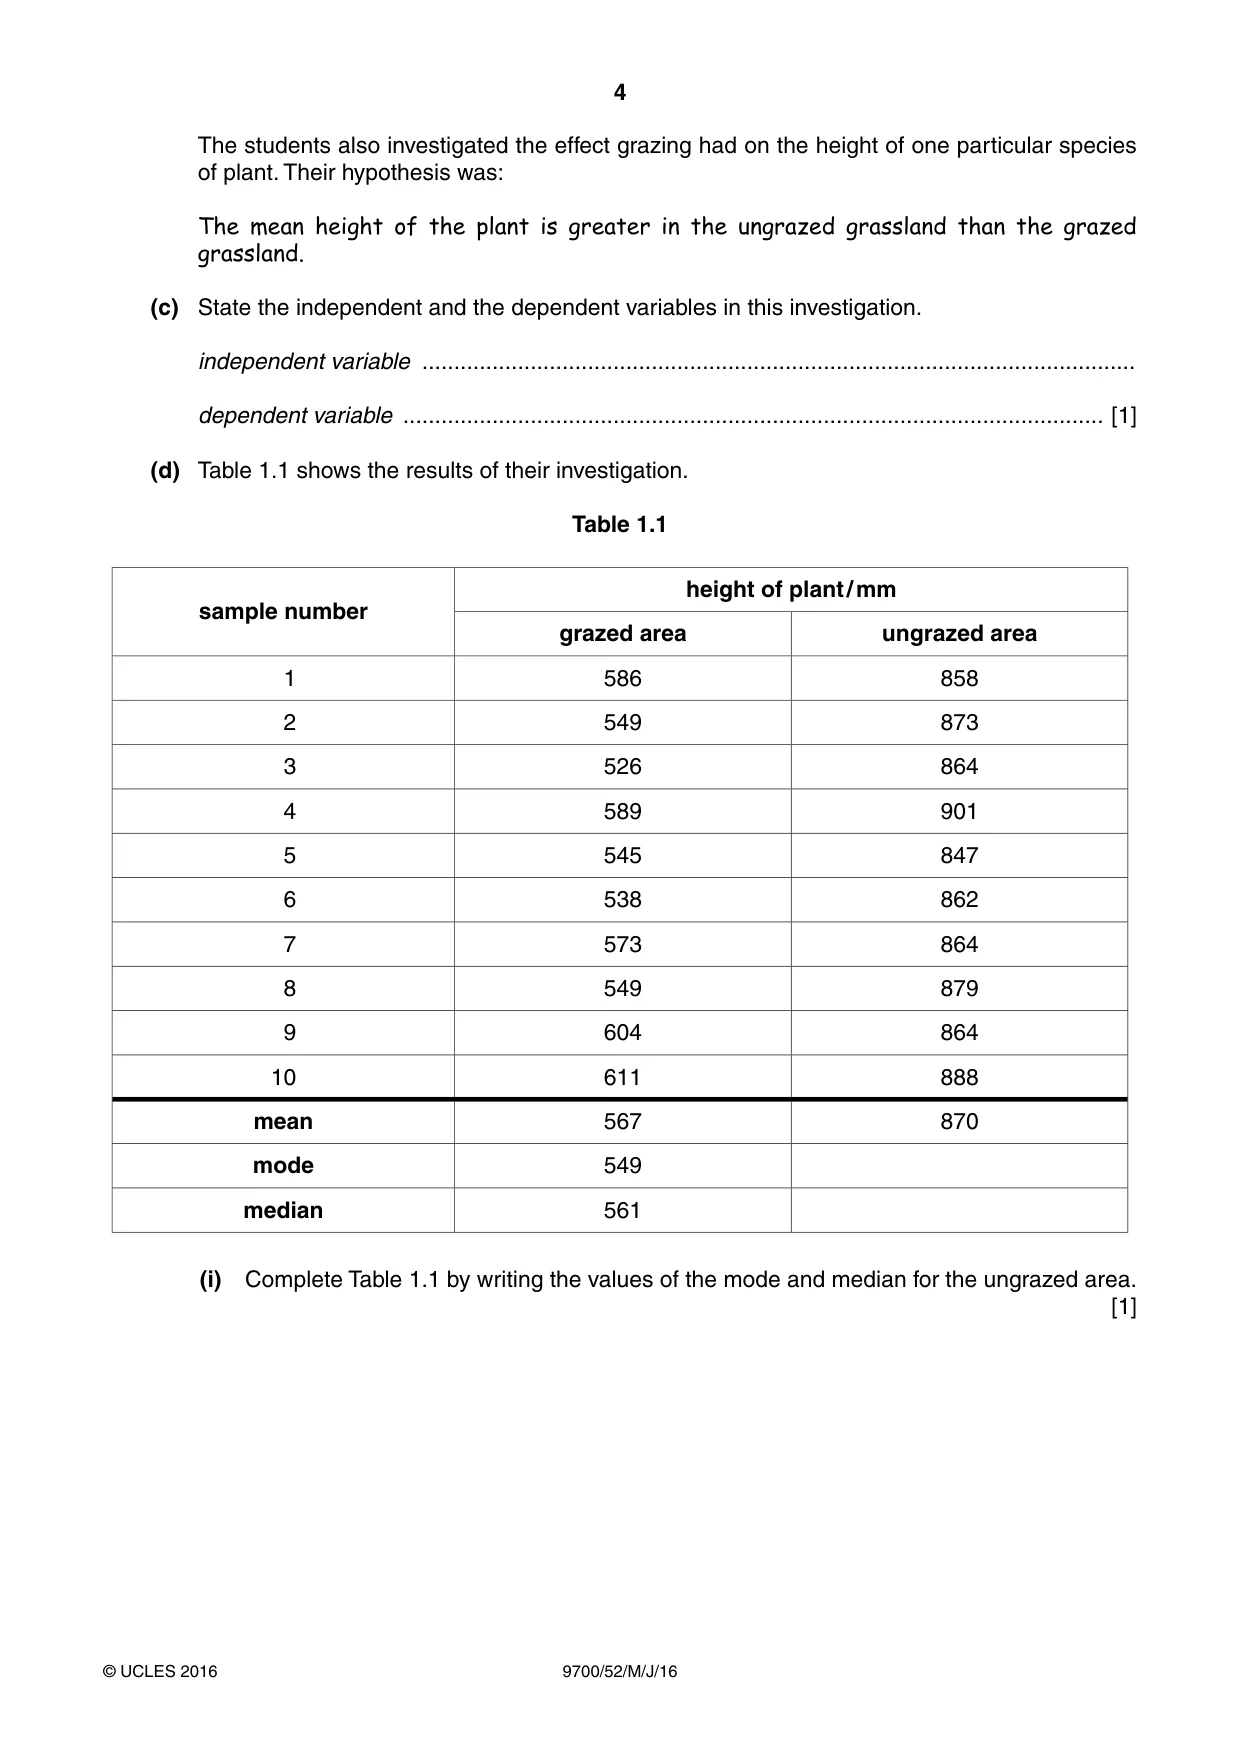
4 9700/52/M/J/16 © UCLES 2016 The students also investigated the effect grazing had on the height of one particular species of plant. Their hypothesis was: The mean height of the plant is greater in the ungrazed grassland than the grazed grassland. (c) State the independent and the dependent variables in this investigation. independent variable … dependent variable … [1] (d) Table 1.1 shows the results of their investigation. Table 1.1 sample number height of plant / mm grazed area ungrazed area 1 586 858 2 549 873 3 526 864 4 589 901 5 545 847 6 538 862 7 573 864 8 549 879 9 604 864 10 611 888 mean 567 870 mode 549 median 561 (i) Complete Table 1.1 by writing the values of the mode and median for the ungrazed area. [1]
Question paper, page 5
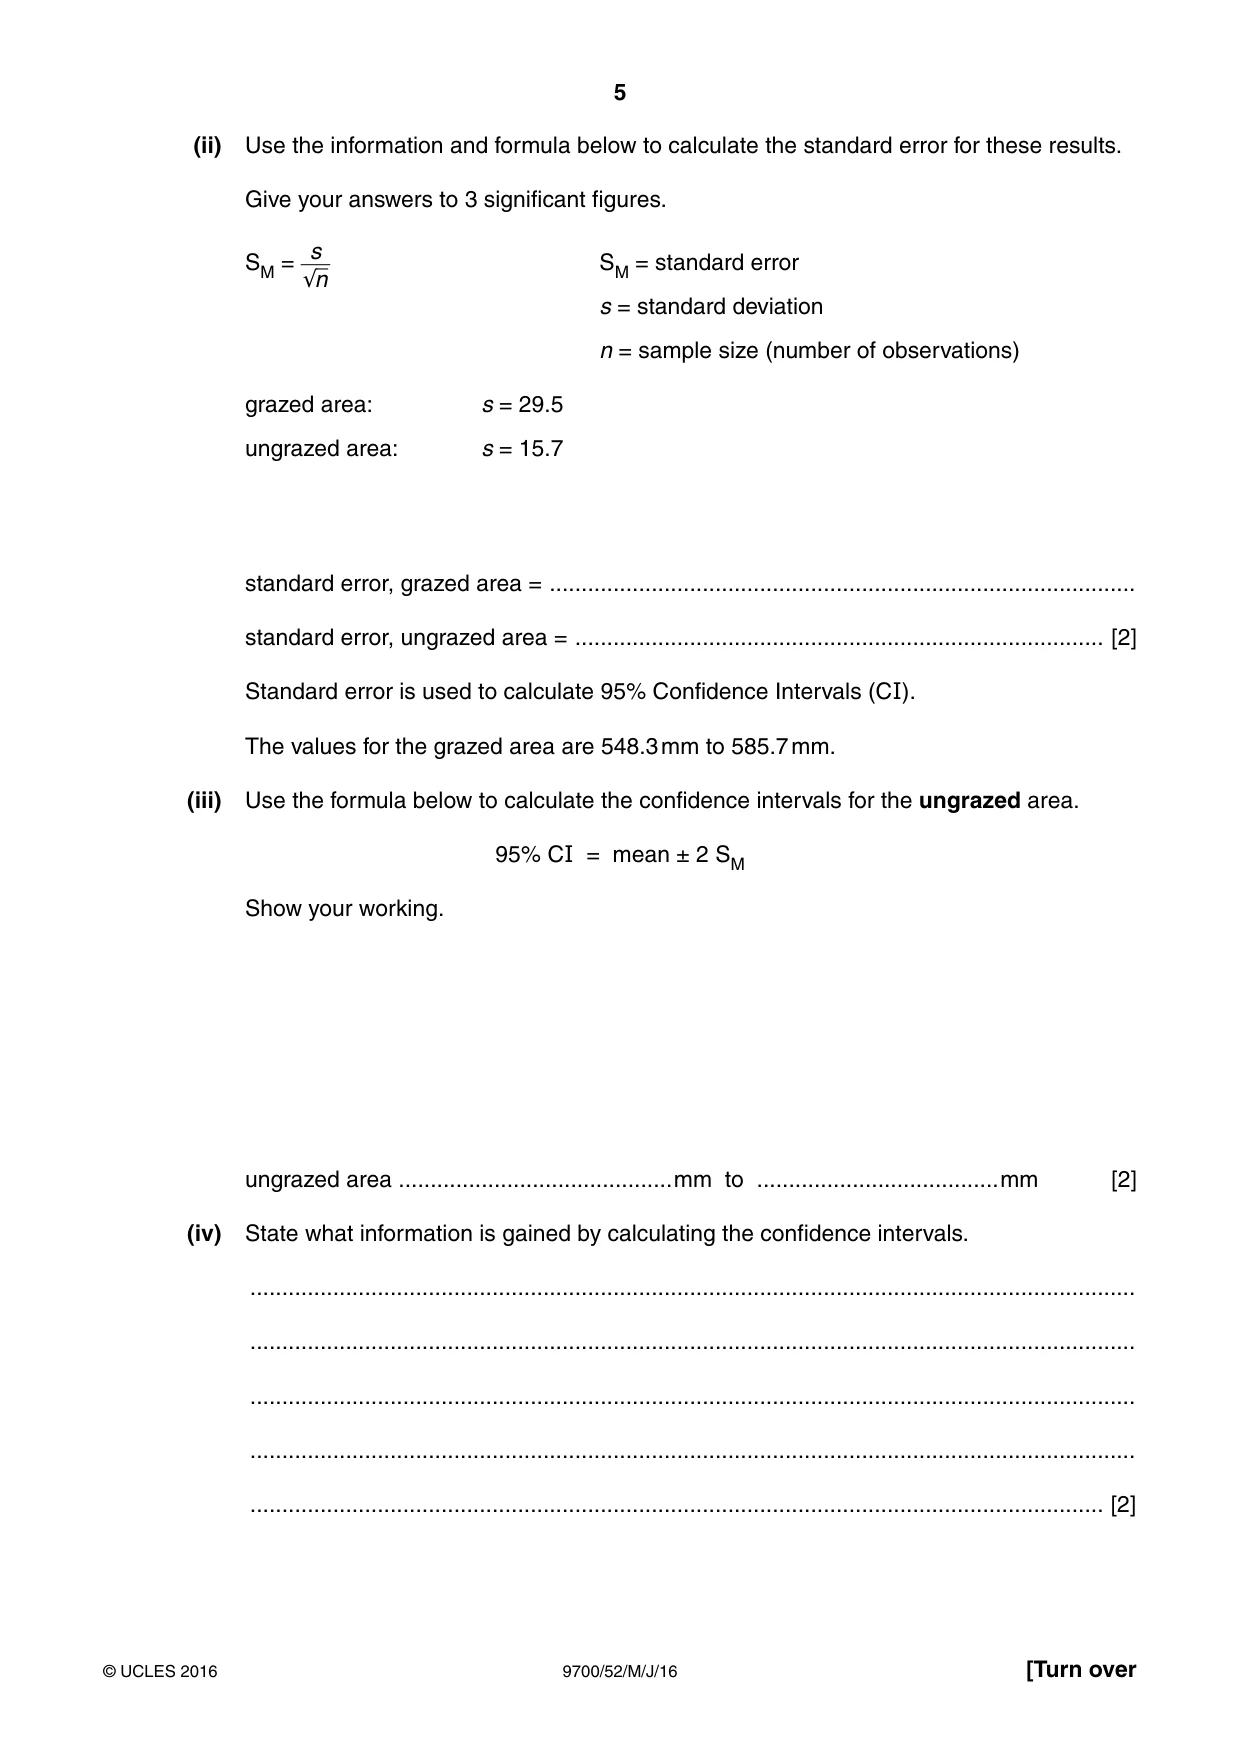
5 9700/52/M/J/16 © UCLES 2016 [Turn over (ii) Use the information and formula below to calculate the standard error for these results. Give your answers to 3 significant figures. SM = s √⎯n SM = standard error s = standard deviation n = sample size (number of observations) grazed area: s = 29.5 ungrazed area: s = 15.7 standard error, grazed area = … standard error, ungrazed area = … [2] Standard error is used to calculate 95% Confidence Intervals (CI). The values for the grazed area are 548.3 mm to 585.7 mm. (iii) Use the formula below to calculate the confidence intervals for the ungrazed area. 95% CI = mean ± 2 SM Show your working. ungrazed area … mm to … mm [2] (iv) State what information is gained by calculating the confidence intervals. … … … … … [2]
Question paper, page 6
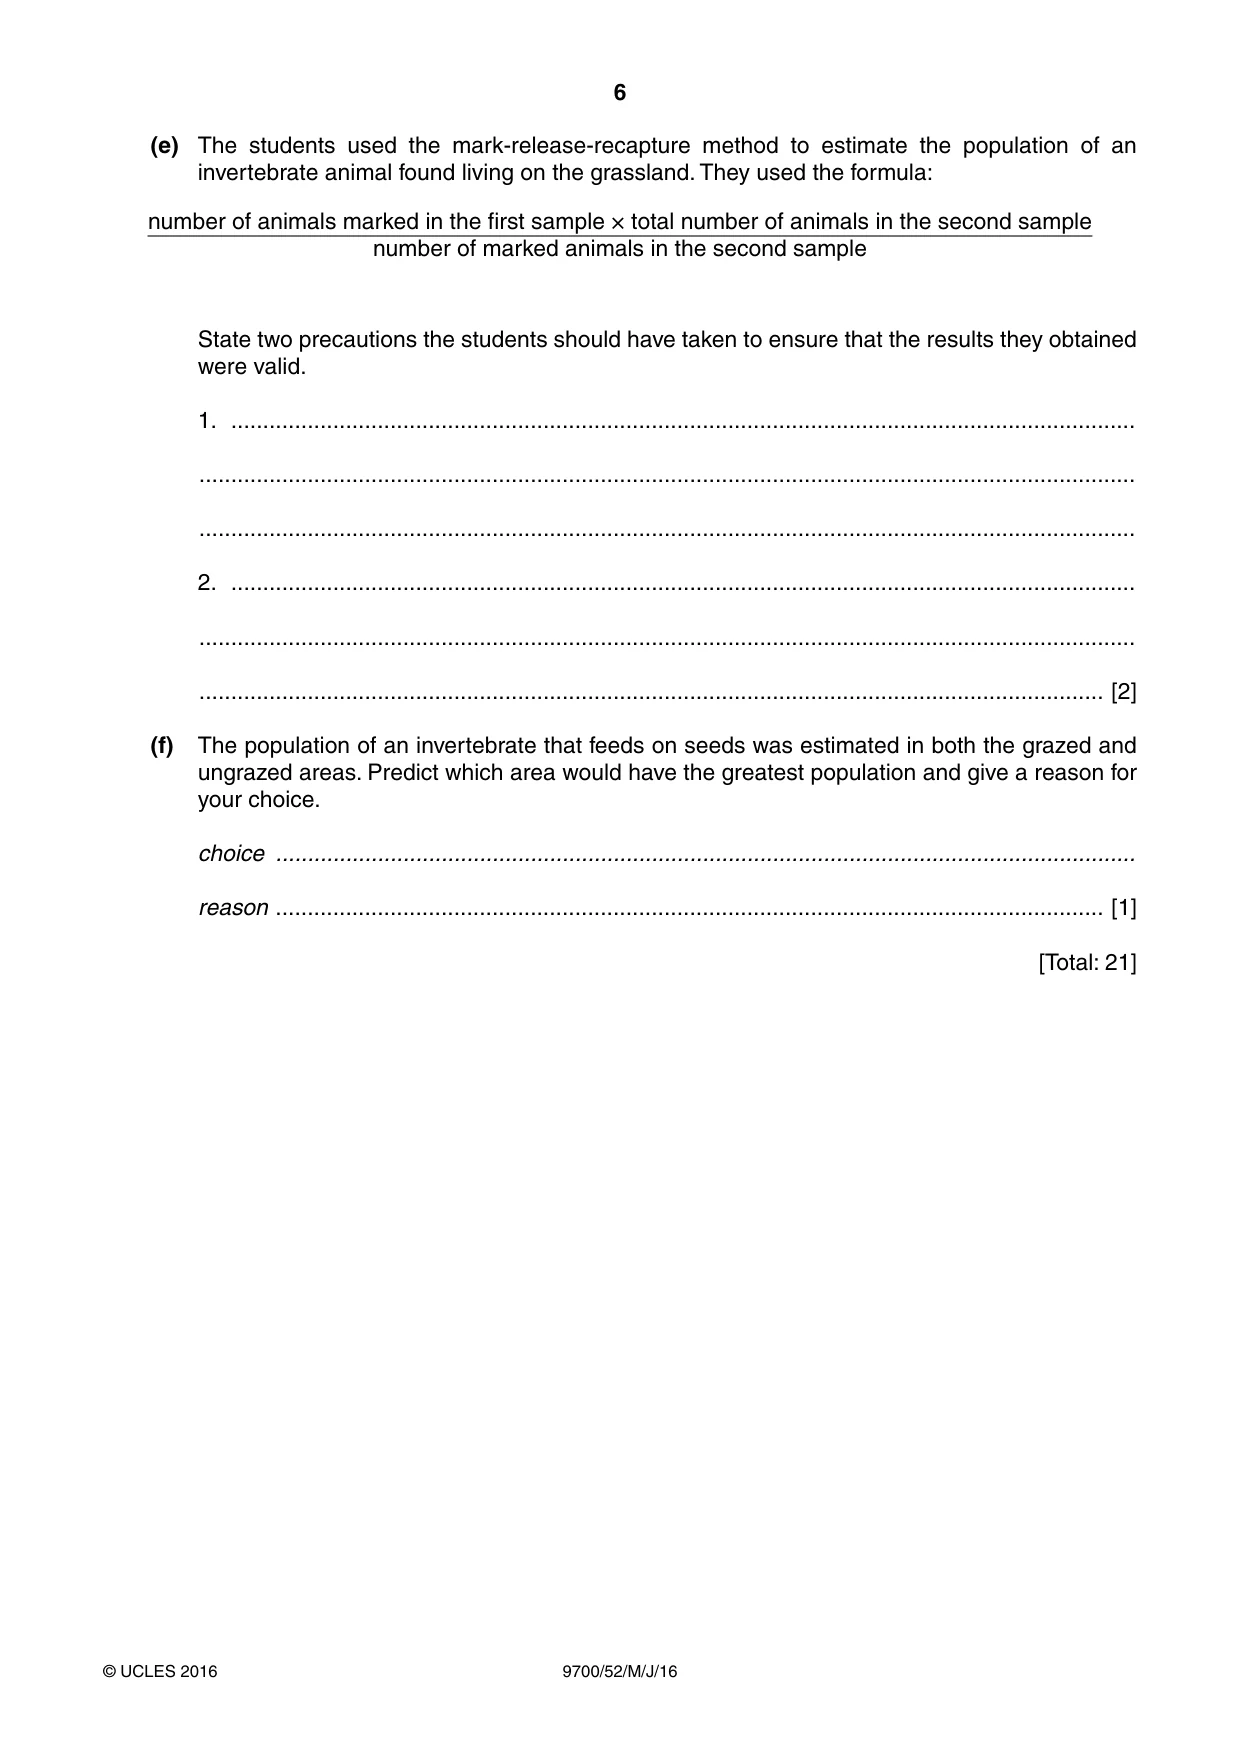
6 9700/52/M/J/16 © UCLES 2016 (e) The students used the mark-release-recapture method to estimate the population of an invertebrate animal found living on the grassland. They used the formula: number of animals marked in the first sample × total number of animals in the second sample number of marked animals in the second sample State two precautions the students should have taken to ensure that the results they obtained were valid. 1. … … … 2. … … … [2] (f) The population of an invertebrate that feeds on seeds was estimated in both the grazed and ungrazed areas. Predict which area would have the greatest population and give a reason for your choice. choice … reason … [1] [Total: 21]
Question paper, page 7
7 9700/52/M/J/16 © UCLES 2016 [Turn over Question 2 starts on page 8
Question paper, page 8
8 9700/52/M/J/16 © UCLES 2016 2 Medical researchers carried out an investigation into the effect of smoking in a country. A group of male volunteers had their peak expiratory flow rate (PEFR) measured as shown in Fig. 2.1. Fig. 2.1 PEFR measures the maximum speed of airflow through the bronchi during breathing out in dm3 per minute (dm3 min−1). Peak flow readings are lower when the airways are constricted. The volunteers were grouped according to the number of packets of cigarettes that they smoked per year. Each packet contains 20 cigarettes. Table 2.1 shows the results of the investigation. Table 2.1 group 1 2 3 4 5 number of packets of cigarettes smoked per year 0 1–50 51–100 101–150 151–230 mean number of packets smoked per group ± s 0 30.61 ± 10.47 73.80 ± 16.52 127.27 ± 9.66 189.22 ± 27.51 mean age of volunteers ± s / years 26.42 ± 5.61 22.82 ± 3.28 26.66 ± 3.59 28.90 ± 4.20 36.22 ± 3.21 mean PEFR ± s / dm3 min−1 513.43 ± 87.58 494.70 ± 79.22 443.33 ± 45.14 350.90 ± 32.38 300.00 ± 46.90 number of volunteers tested 64 14 15 12 8 s = standard deviation
Question paper, page 9
9 9700/52/M/J/16 © UCLES 2016 [Turn over (a) State three variables which should have been standardised in this investigation. … … … … … … … … … [3] (b) The medical researchers made two conclusions based on the data shown in Table 2.1. 1. An increase in the number of packets smoked decreases the PEFR measurement. 2. The number of packets smoked increases with age. State how the results from Table 2.1 support these conclusions and how they do not support these conclusions. support … … … … … do not support … … … … … [3]
Question paper, page 10
10 9700/52/M/J/16 © UCLES 2016 (c) (i) State a null hypothesis for a statistical test to find out whether the data in Table 2.1 supports the conclusion that: An increase in the number of packets smoked decreases the PEFR measurement. … … … [1] (ii) State two ways in which the data for group 5 is less trustworthy compared with the data for the other groups. … … … … … [2] [Total: 9]
Question paper, page 11
11 9700/52/M/J/16 © UCLES 2016 BLANK PAGE
Question paper, page 12
12 9700/52/M/J/16 © UCLES 2016 BLANK PAGE Permission to reproduce items where third-party owned material protected by copyright is included has been sought and cleared where possible. Every reasonable effort has been made by the publisher (UCLES) to trace copyright holders, but if any items requiring clearance have unwittingly been included, the publisher will be pleased to make amends at the earliest possible opportunity. To avoid the issue of disclosure of answer-related information to candidates, all copyright acknowledgements are reproduced online in the Cambridge International Examinations Copyright Acknowledgements Booklet. This is produced for each series of examinations and is freely available to download at www.cie.org.uk after the live examination series. Cambridge International Examinations is part of the Cambridge Assessment Group. Cambridge Assessment is the brand name of University of Cambridge Local Examinations Syndicate (UCLES), which is itself a department of the University of Cambridge.
Mark scheme, page 1
® IGCSE is the registered trademark of Cambridge International Examinations. This document consists of 8 printed pages. © UCLES 2016 [Turn over Cambridge International Examinations Cambridge International Advanced Subsidiary and Advanced Level BIOLOGY 9700/52 Paper 5 Planning, Analysis and Evaluation May/June 2016 MARK SCHEME Maximum Mark: 30 Published This mark scheme is published as an aid to teachers and candidates, to indicate the requirements of the examination. It shows the basis on which Examiners were instructed to award marks. It does not indicate the details of the discussions that took place at an Examiners’ meeting before marking began, which would have considered the acceptability of alternative answers. Mark schemes should be read in conjunction with the question paper and the Principal Examiner Report for Teachers. Cambridge will not enter into discussions about these mark schemes. Cambridge is publishing the mark schemes for the May/June 2016 series for most Cambridge IGCSE®, Cambridge International A and AS Level components and some Cambridge O Level components.
Mark scheme, page 2
Page 2 Mark Scheme Syllabus Paper Cambridge International AS/A Level – May/June 2016 9700 52 © Cambridge International Examinations 2016 Mark scheme abbreviations: ; separates marking points / alternatives answers for the same point R reject A accept (for answers correctly cued by the question, or extra guidance) AW alternative wording (where responses vary more than usual) underline actual word given must be used by candidate (grammatical variants accepted) max indicates the maximum number of marks that can be given ora or reverse argument ecf error carried forward I ignore mp marking point (with relevant number)
Mark scheme, page 3
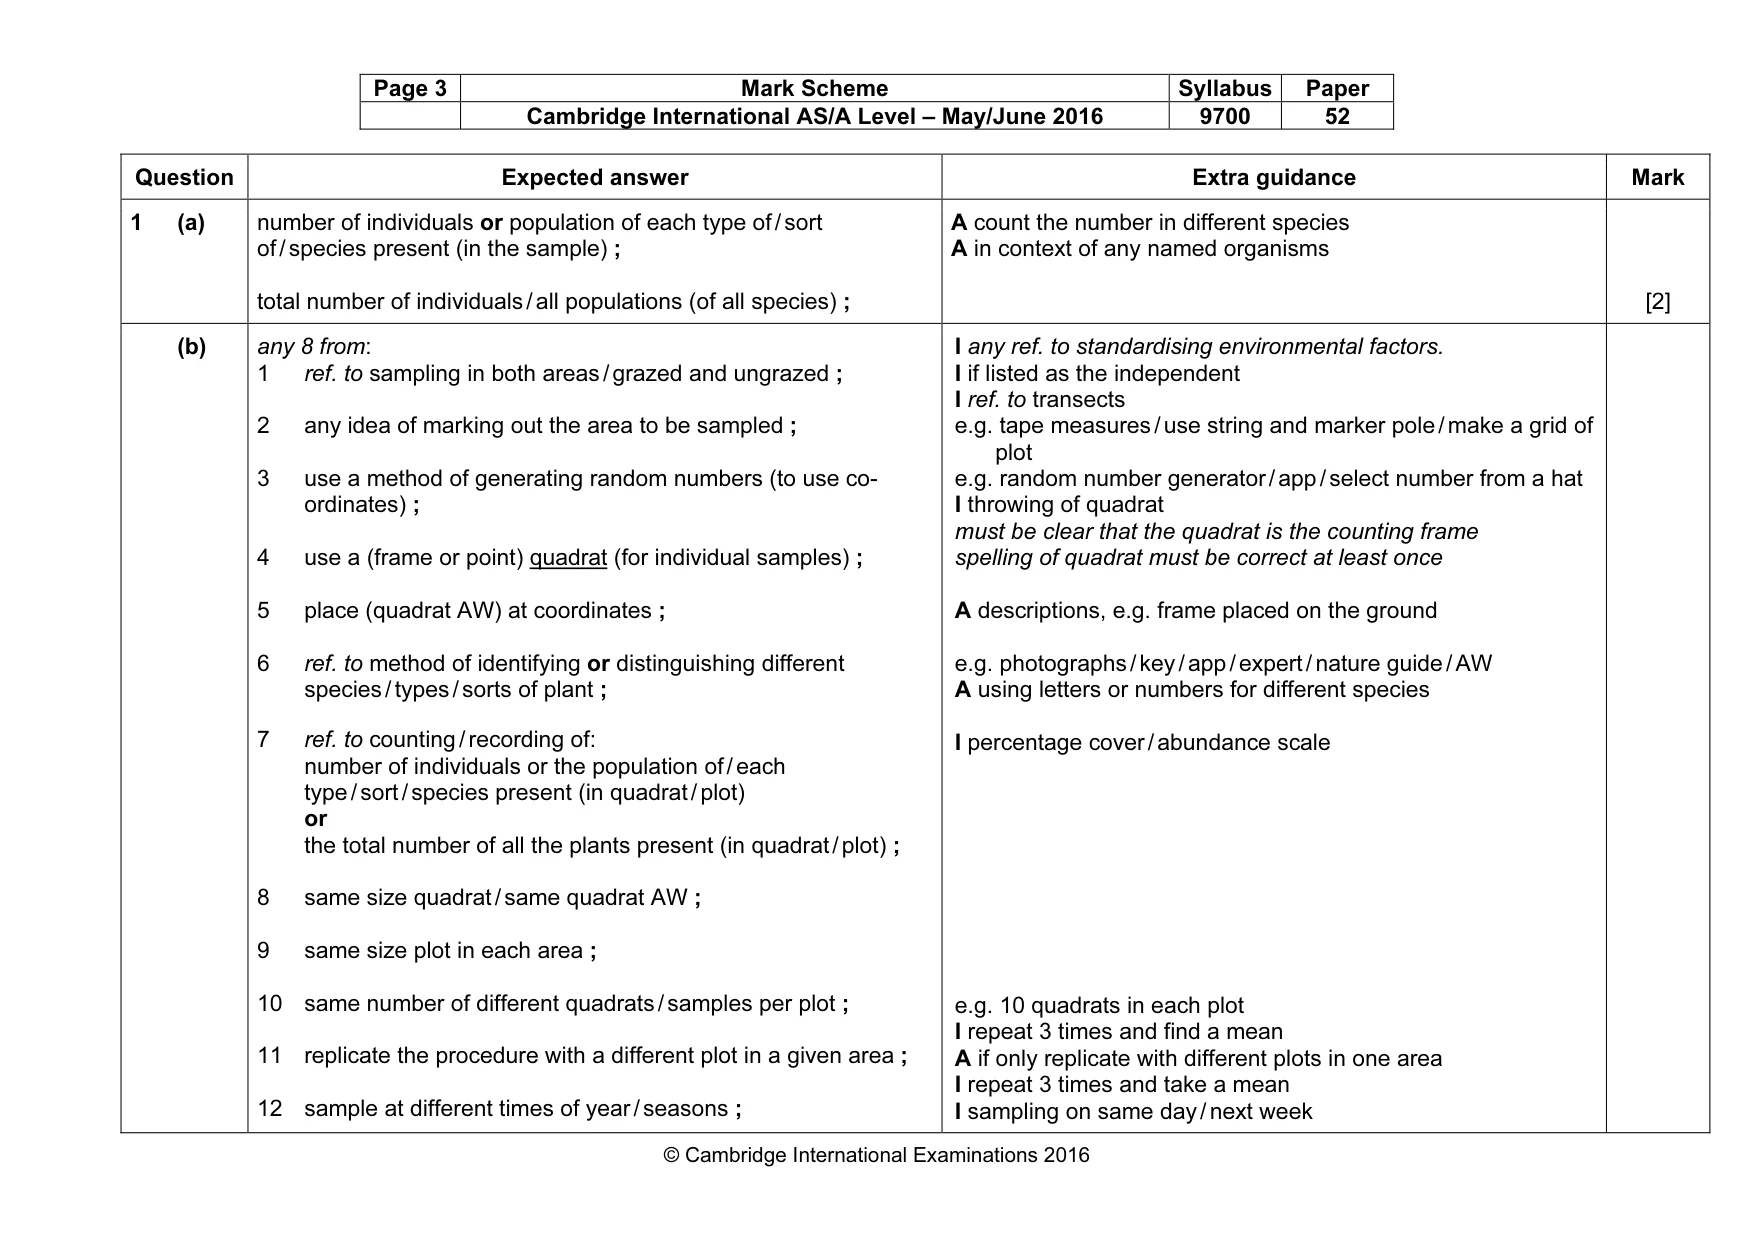
Page 3 Mark Scheme Syllabus Paper Cambridge International AS/A Level – May/June 2016 9700 52 © Cambridge International Examinations 2016 Question Expected answer Extra guidance Mark 1 (a) number of individuals or population of each type of / sort of / species present (in the sample) ; total number of individuals / all populations (of all species) ; A count the number in different species A in context of any named organisms [2] (b) any 8 from: 1 ref. to sampling in both areas / grazed and ungrazed ; 2 any idea of marking out the area to be sampled ; 3 use a method of generating random numbers (to use co- ordinates) ; 4 use a (frame or point) quadrat (for individual samples) ; 5 place (quadrat AW) at coordinates ; 6 ref. to method of identifying or distinguishing different species / types / sorts of plant ; 7 ref. to counting / recording of: number of individuals or the population of / each type / sort / species present (in quadrat / plot) or the total number of all the plants present (in quadrat / plot) ; 8 same size quadrat / same quadrat AW ; 9 same size plot in each area ; 10 same number of different quadrats / samples per plot ; 11 replicate the procedure with a different plot in a given area ; 12 sample at different times of year / seasons ; I any ref. to standardising environmental factors. I if listed as the independent I ref. to transects e.g. tape measures / use string and marker pole / make a grid of plot e.g. random number generator / app / select number from a hat I throwing of quadrat must be clear that the quadrat is the counting frame spelling of quadrat must be correct at least once A descriptions, e.g. frame placed on the ground e.g. photographs / key / app / expert / nature guide / AW A using letters or numbers for different species I percentage cover / abundance scale e.g. 10 quadrats in each plot I repeat 3 times and find a mean A if only replicate with different plots in one area I repeat 3 times and take a mean I sampling on same day / next week
Mark scheme, page 4
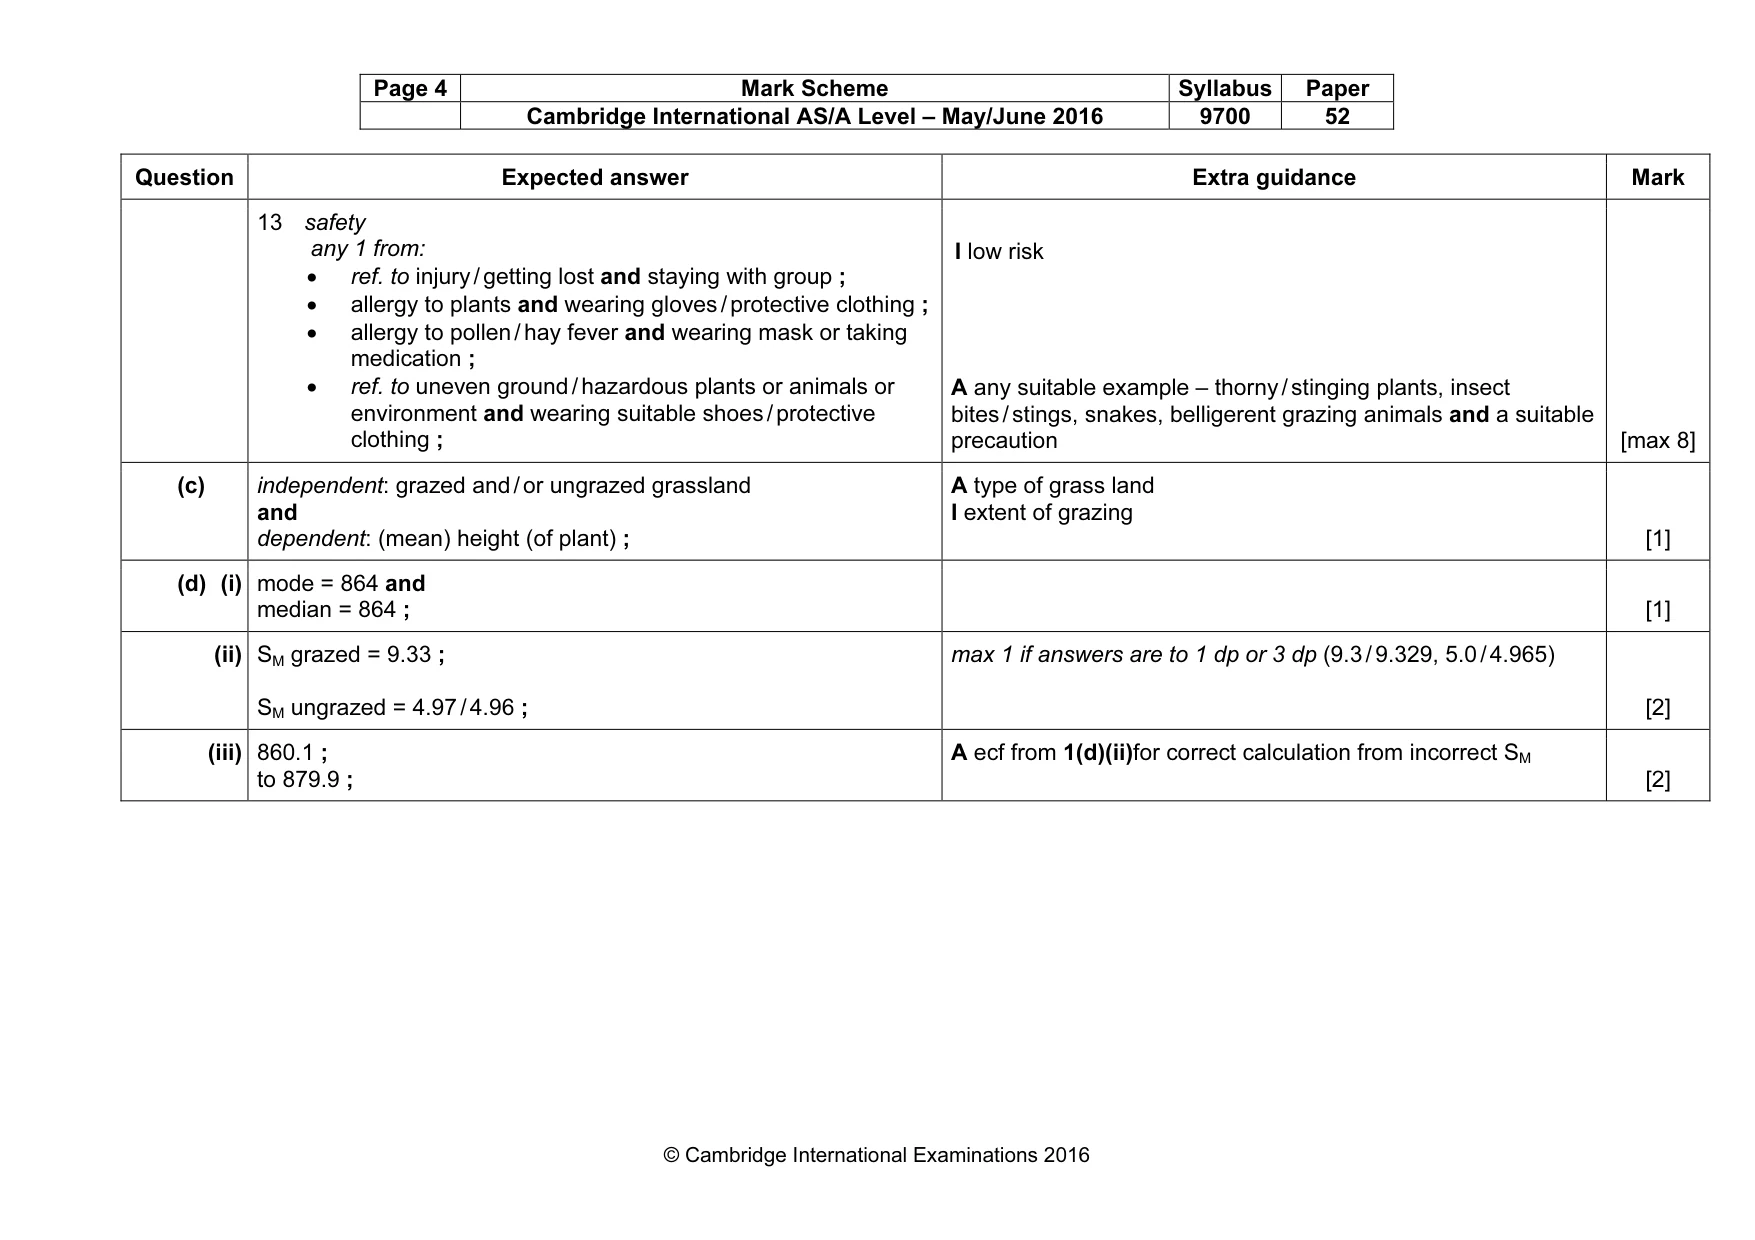
Page 4 Mark Scheme Syllabus Paper Cambridge International AS/A Level – May/June 2016 9700 52 © Cambridge International Examinations 2016 Question Expected answer Extra guidance Mark 13 safety any 1 from: • ref. to injury / getting lost and staying with group ; • allergy to plants and wearing gloves / protective clothing ; • allergy to pollen / hay fever and wearing mask or taking medication ; • ref. to uneven ground / hazardous plants or animals or environment and wearing suitable shoes / protective clothing ; I low risk A any suitable example – thorny / stinging plants, insect bites / stings, snakes, belligerent grazing animals and a suitable precaution [max 8] (c) independent: grazed and / or ungrazed grassland and dependent: (mean) height (of plant) ; A type of grass land I extent of grazing [1] (d) (i) mode = 864 and median = 864 ; [1] (ii) SM grazed = 9.33 ; SM ungrazed = 4.97 / 4.96 ; max 1 if answers are to 1 dp or 3 dp (9.3 / 9.329, 5.0 / 4.965) [2] (iii) 860.1 ; to 879.9 ; A ecf from 1(d)(ii)for correct calculation from incorrect SM [2]
Mark scheme, page 5
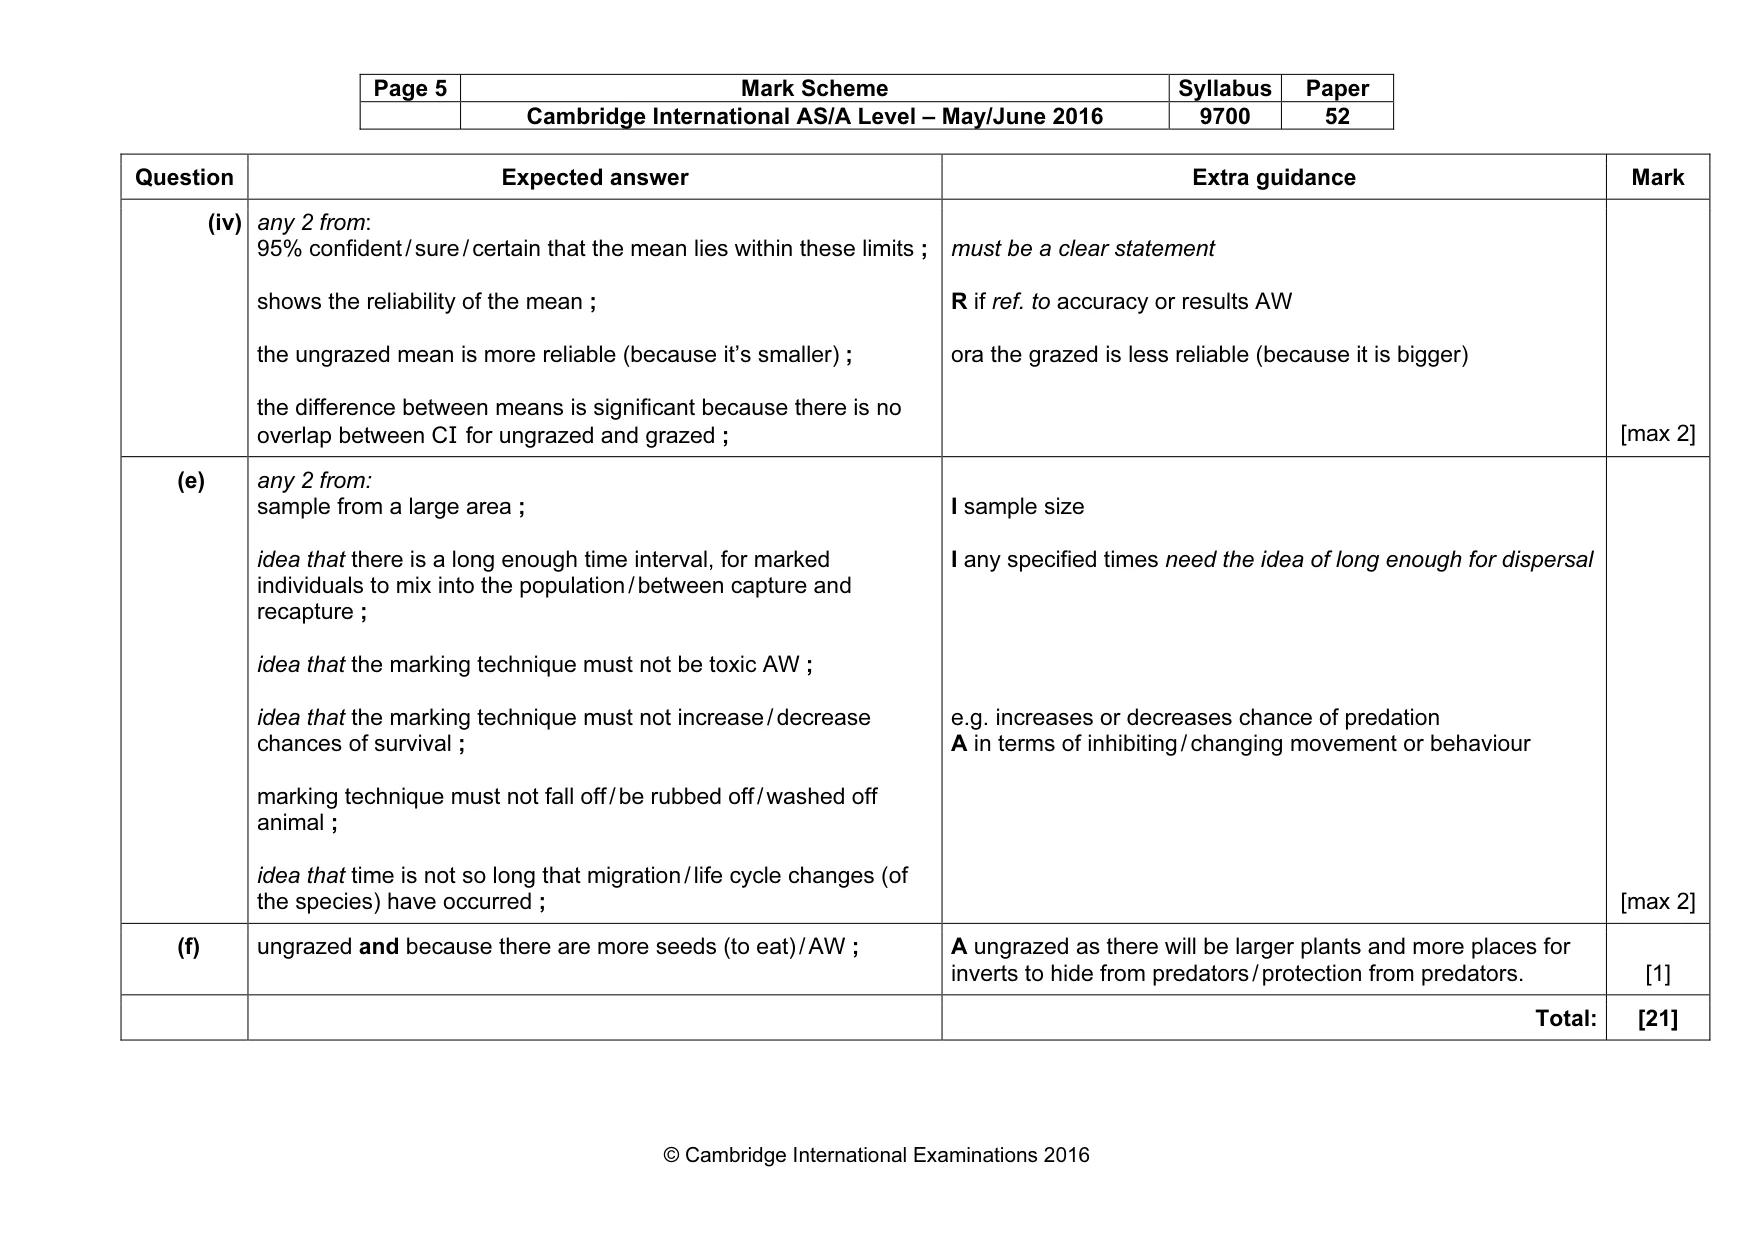
Page 5 Mark Scheme Syllabus Paper Cambridge International AS/A Level – May/June 2016 9700 52 © Cambridge International Examinations 2016 Question Expected answer Extra guidance Mark (iv) any 2 from: 95% confident / sure / certain that the mean lies within these limits ; shows the reliability of the mean ; the ungrazed mean is more reliable (because it’s smaller) ; the difference between means is significant because there is no overlap between CI for ungrazed and grazed ; must be a clear statement R if ref. to accuracy or results AW ora the grazed is less reliable (because it is bigger) [max 2] (e) any 2 from: sample from a large area ; idea that there is a long enough time interval, for marked individuals to mix into the population / between capture and recapture ; idea that the marking technique must not be toxic AW ; idea that the marking technique must not increase / decrease chances of survival ; marking technique must not fall off / be rubbed off / washed off animal ; idea that time is not so long that migration / life cycle changes (of the species) have occurred ; I sample size I any specified times need the idea of long enough for dispersal e.g. increases or decreases chance of predation A in terms of inhibiting / changing movement or behaviour [max 2] (f) ungrazed and because there are more seeds (to eat) / AW ; A ungrazed as there will be larger plants and more places for inverts to hide from predators / protection from predators. [1] Total: [21]
Mark scheme, page 6
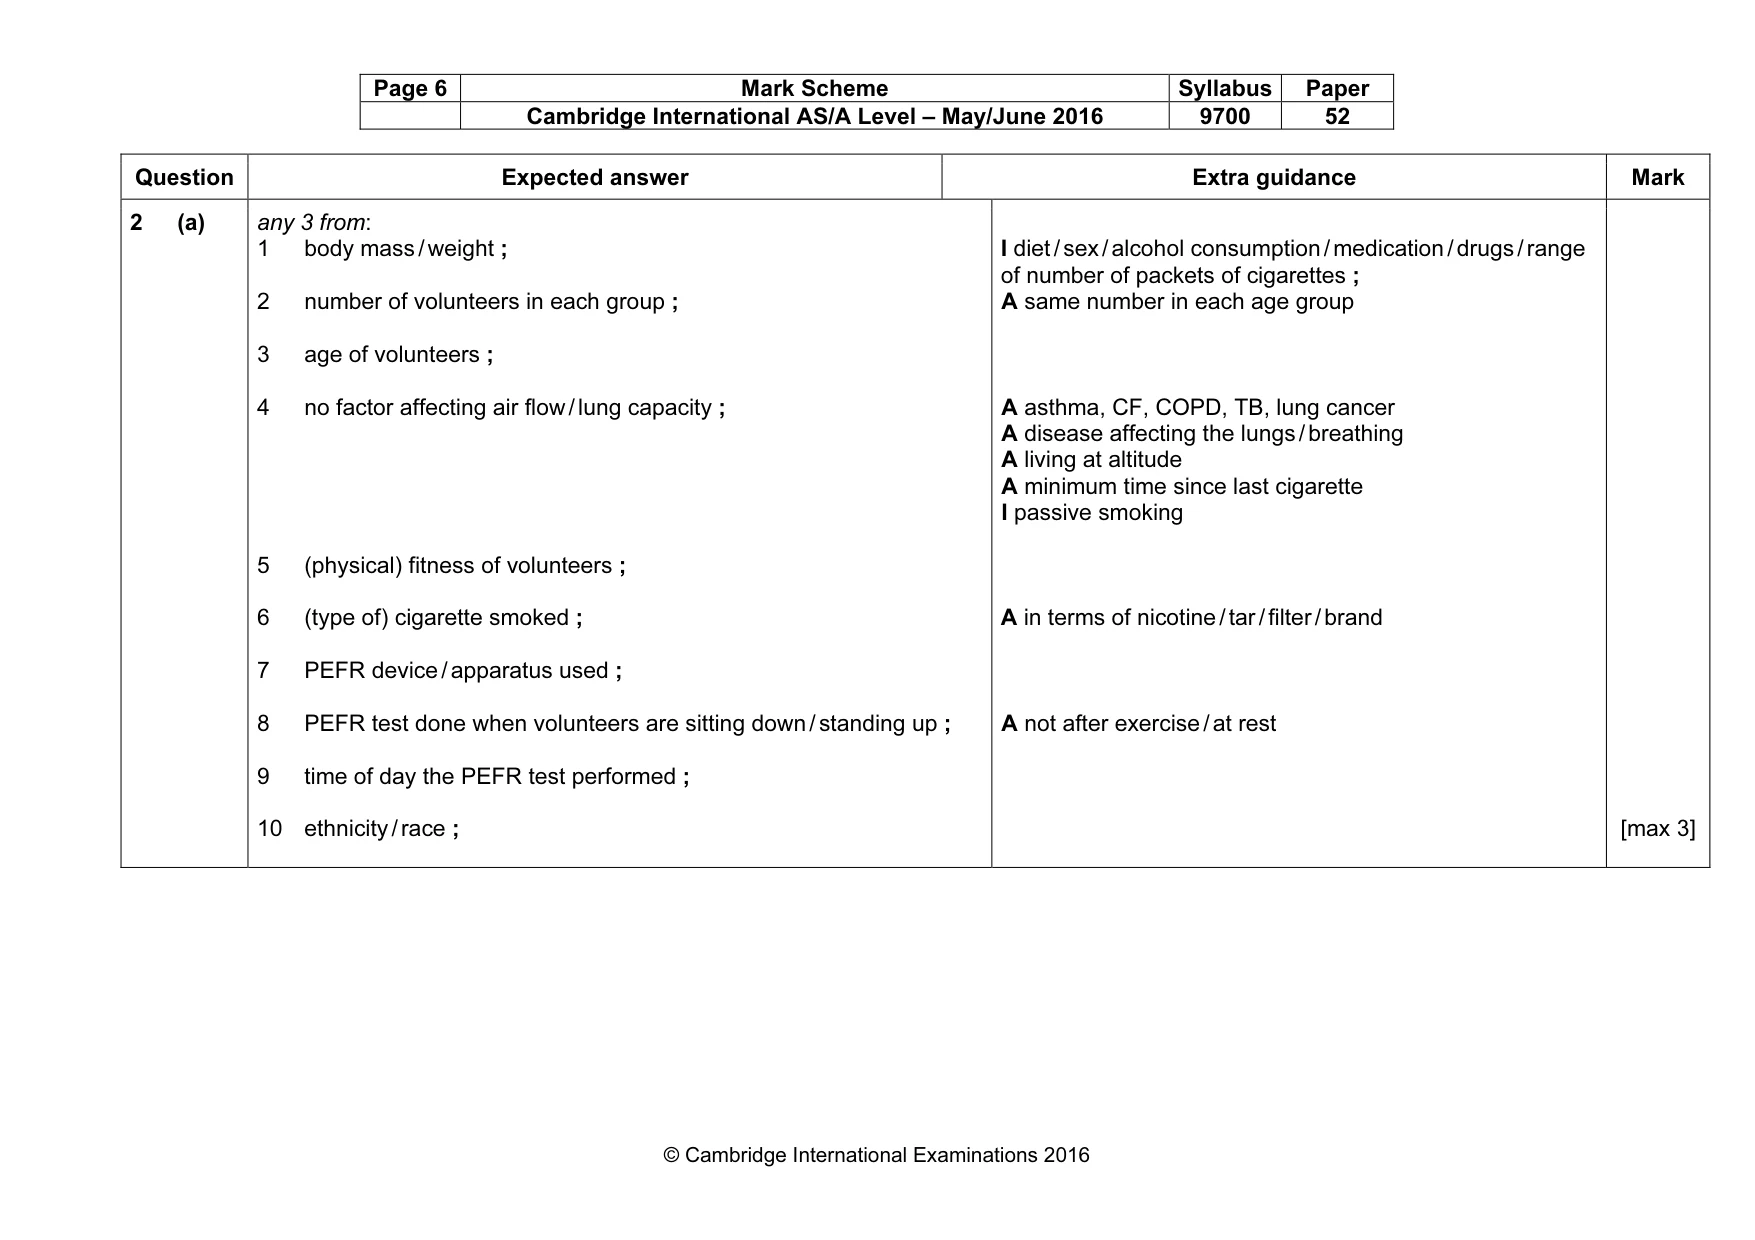
Page 6 Mark Scheme Syllabus Paper Cambridge International AS/A Level – May/June 2016 9700 52 © Cambridge International Examinations 2016 Question Expected answer Extra guidance Mark 2 (a) any 3 from: 1 body mass / weight ; 2 number of volunteers in each group ; 3 age of volunteers ; 4 no factor affecting air flow / lung capacity ; 5 (physical) fitness of volunteers ; 6 (type of) cigarette smoked ; 7 PEFR device / apparatus used ; 8 PEFR test done when volunteers are sitting down / standing up ; 9 time of day the PEFR test performed ; 10 ethnicity / race ; I diet / sex / alcohol consumption / medication / drugs / range of number of packets of cigarettes ; A same number in each age group A asthma, CF, COPD, TB, lung cancer A disease affecting the lungs / breathing A living at altitude A minimum time since last cigarette I passive smoking A in terms of nicotine / tar / filter / brand A not after exercise / at rest [max 3]
Mark scheme, page 7
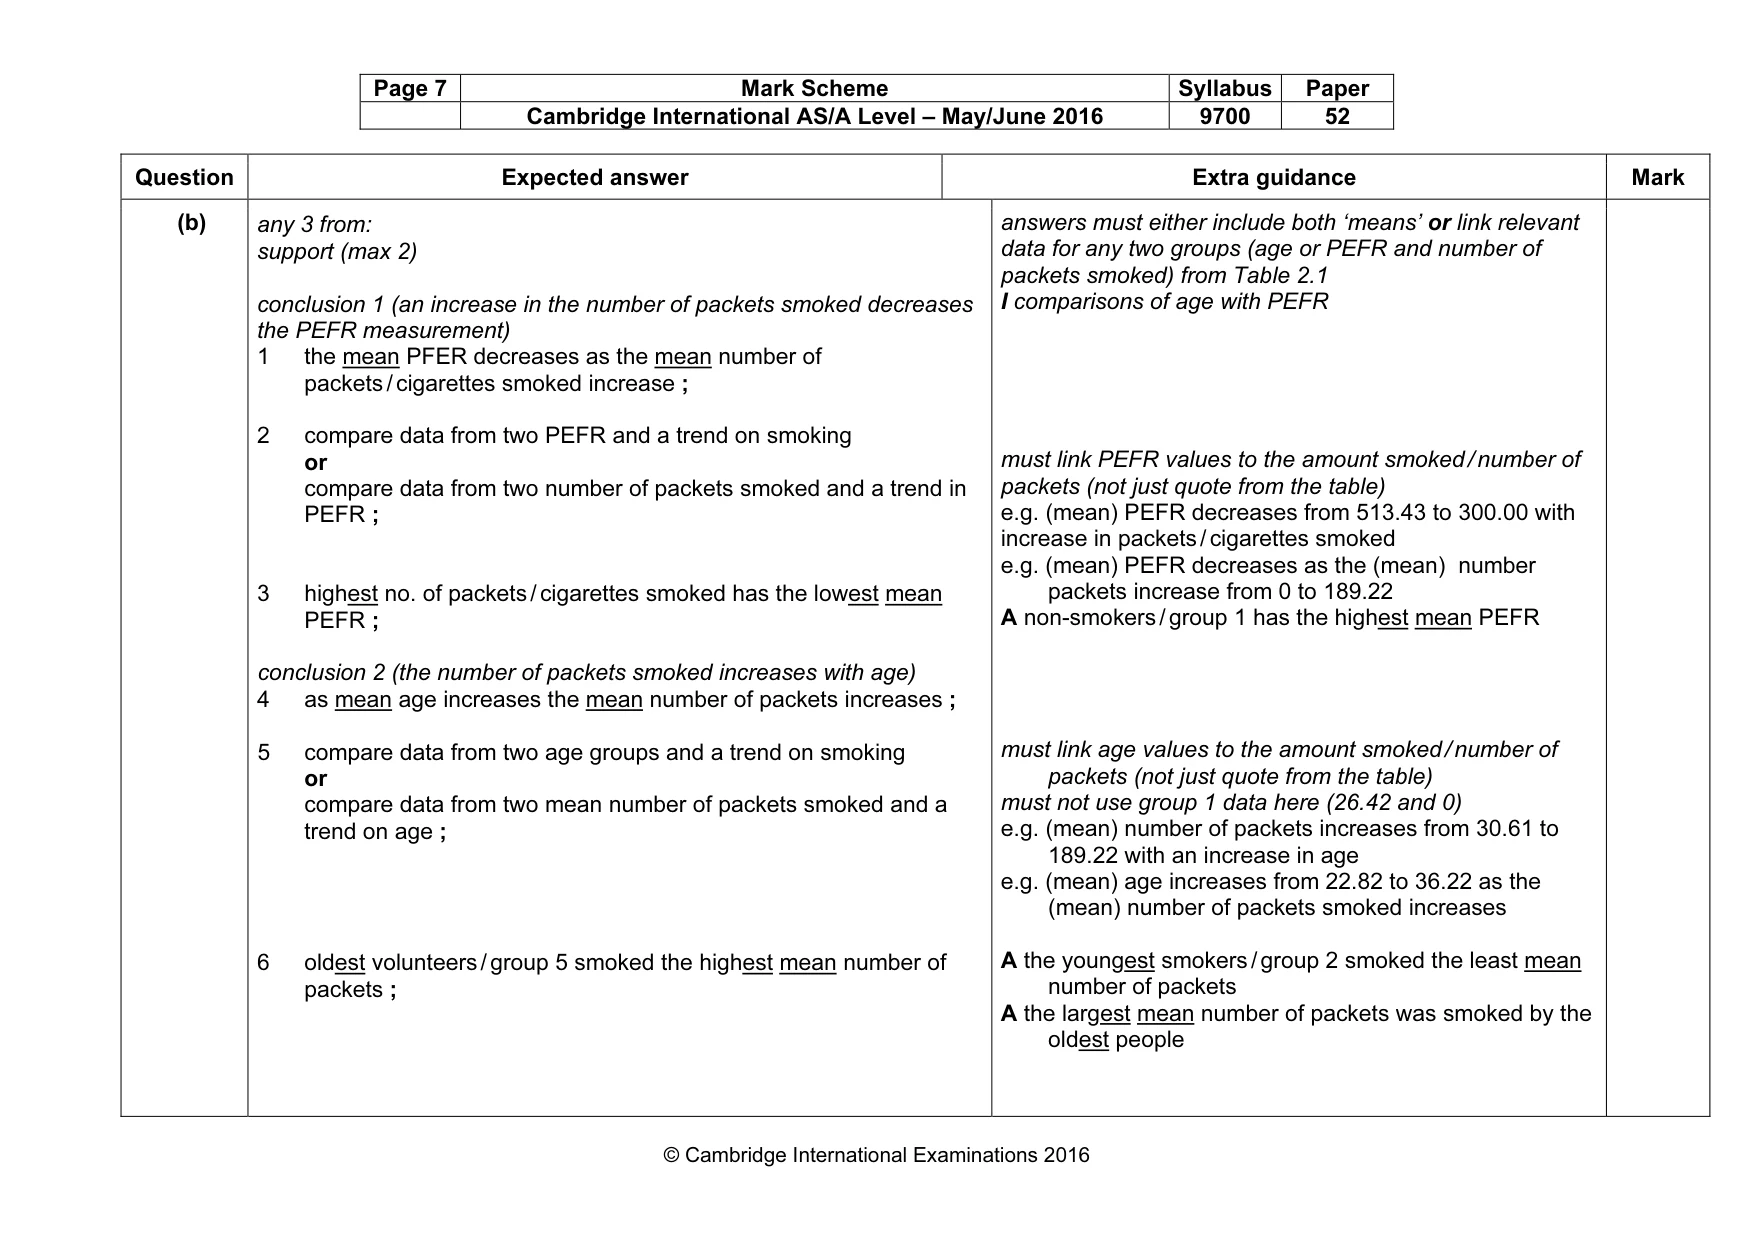
Page 7 Mark Scheme Syllabus Paper Cambridge International AS/A Level – May/June 2016 9700 52 © Cambridge International Examinations 2016 Question Expected answer Extra guidance Mark (b) any 3 from: support (max 2) conclusion 1 (an increase in the number of packets smoked decreases the PEFR measurement) 1 the mean PFER decreases as the mean number of packets / cigarettes smoked increase ; 2 compare data from two PEFR and a trend on smoking or compare data from two number of packets smoked and a trend in PEFR ; 3 highest no. of packets / cigarettes smoked has the lowest mean PEFR ; conclusion 2 (the number of packets smoked increases with age) 4 as mean age increases the mean number of packets increases ; 5 compare data from two age groups and a trend on smoking or compare data from two mean number of packets smoked and a trend on age ; 6 oldest volunteers / group 5 smoked the highest mean number of packets ; answers must either include both ‘means’ or link relevant data for any two groups (age or PEFR and number of packets smoked) from Table 2.1 I comparisons of age with PEFR must link PEFR values to the amount smoked / number of packets (not just quote from the table) e.g. (mean) PEFR decreases from 513.43 to 300.00 with increase in packets / cigarettes smoked e.g. (mean) PEFR decreases as the (mean) number packets increase from 0 to 189.22 A non-smokers / group 1 has the highest mean PEFR must link age values to the amount smoked / number of packets (not just quote from the table) must not use group 1 data here (26.42 and 0) e.g. (mean) number of packets increases from 30.61 to 189.22 with an increase in age e.g. (mean) age increases from 22.82 to 36.22 as the (mean) number of packets smoked increases A the youngest smokers / group 2 smoked the least mean number of packets A the largest mean number of packets was smoked by the oldest people
Mark scheme, page 8
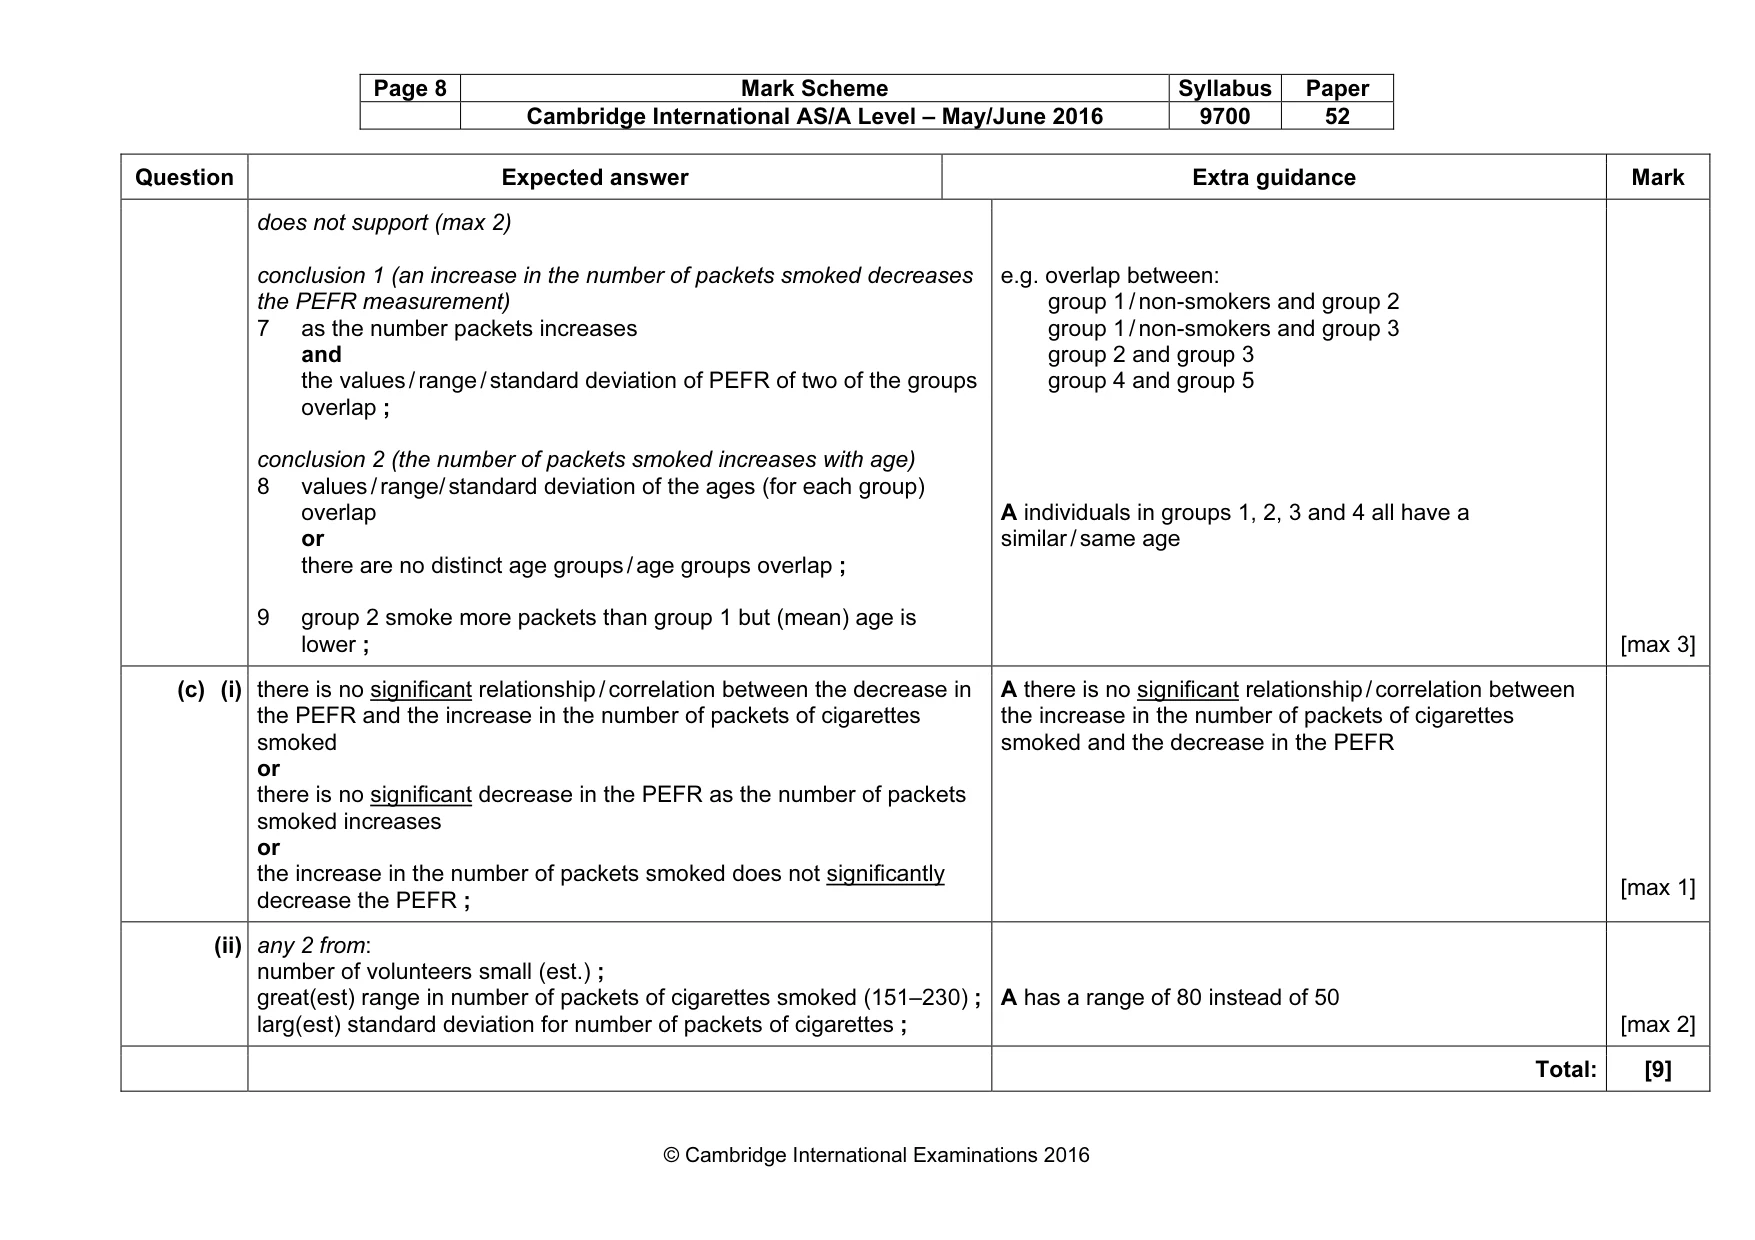
Page 8 Mark Scheme Syllabus Paper Cambridge International AS/A Level – May/June 2016 9700 52 © Cambridge International Examinations 2016 Question Expected answer Extra guidance Mark does not support (max 2) conclusion 1 (an increase in the number of packets smoked decreases the PEFR measurement) 7 as the number packets increases and the values / range / standard deviation of PEFR of two of the groups overlap ; conclusion 2 (the number of packets smoked increases with age) 8 values / range/ standard deviation of the ages (for each group) overlap or there are no distinct age groups / age groups overlap ; 9 group 2 smoke more packets than group 1 but (mean) age is lower ; e.g. overlap between: group 1 / non-smokers and group 2 group 1 / non-smokers and group 3 group 2 and group 3 group 4 and group 5 A individuals in groups 1, 2, 3 and 4 all have a similar / same age [max 3] (c) (i) there is no significant relationship / correlation between the decrease in the PEFR and the increase in the number of packets of cigarettes smoked or there is no significant decrease in the PEFR as the number of packets smoked increases or the increase in the number of packets smoked does not significantly decrease the PEFR ; A there is no significant relationship / correlation between the increase in the number of packets of cigarettes smoked and the decrease in the PEFR [max 1] (ii) any 2 from: number of volunteers small (est.) ; great(est) range in number of packets of cigarettes smoked (151–230) ; larg(est) standard deviation for number of packets of cigarettes ; A has a range of 80 instead of 50 [max 2] Total: [9]
What you needed in this session
Cambridge’s own grade thresholds for 2016 May/June, Paper 5 · Variant 2. A higher threshold means an easier paper — the bar moves with how the cohort did.