Cambridge A Level Biology 9700 — 2013 Oct/Nov Paper 5 · Variant 1
9700/51/O/N/13 · 30 marks · ≈34 min
The question paper and its mark scheme, free to read here and free to download. This is Cambridge’s own paper, exactly as it was sat.
Question paper8 pages
Mark scheme9 pages
Answers below. Sit the paper first if you are practising.
Paper as text
Question paper, page 1
This document consists of 8 printed pages. DC (AC/SW) 63043/3 © UCLES 2013 [Turn over UNIVERSITY OF CAMBRIDGE INTERNATIONAL EXAMINATIONS General Certificate of Education Advanced Level * 5 0 8 2 3 7 5 3 6 9 * BIOLOGY 9700/51 Paper 5 Planning, Analysis and Evaluation October/November 2013 1 hour 15 minutes Candidates answer on the Question Paper. No Additional Materials are required. READ THESE INSTRUCTIONS FIRST Write your Centre number, candidate number and name on all the work you hand in. Write in dark blue or black ink. You may use a pencil for any diagrams, graphs or rough working. Do not use staples, paper clips, highlighters, glue or correction fluid. DO NOT WRITE IN ANY BARCODES. Answer all questions. Electronic calculators may be used. At the end of the examination, fasten all your work securely together. The number of marks is given in brackets [ ] at the end of each question or part question.
Question paper, page 2
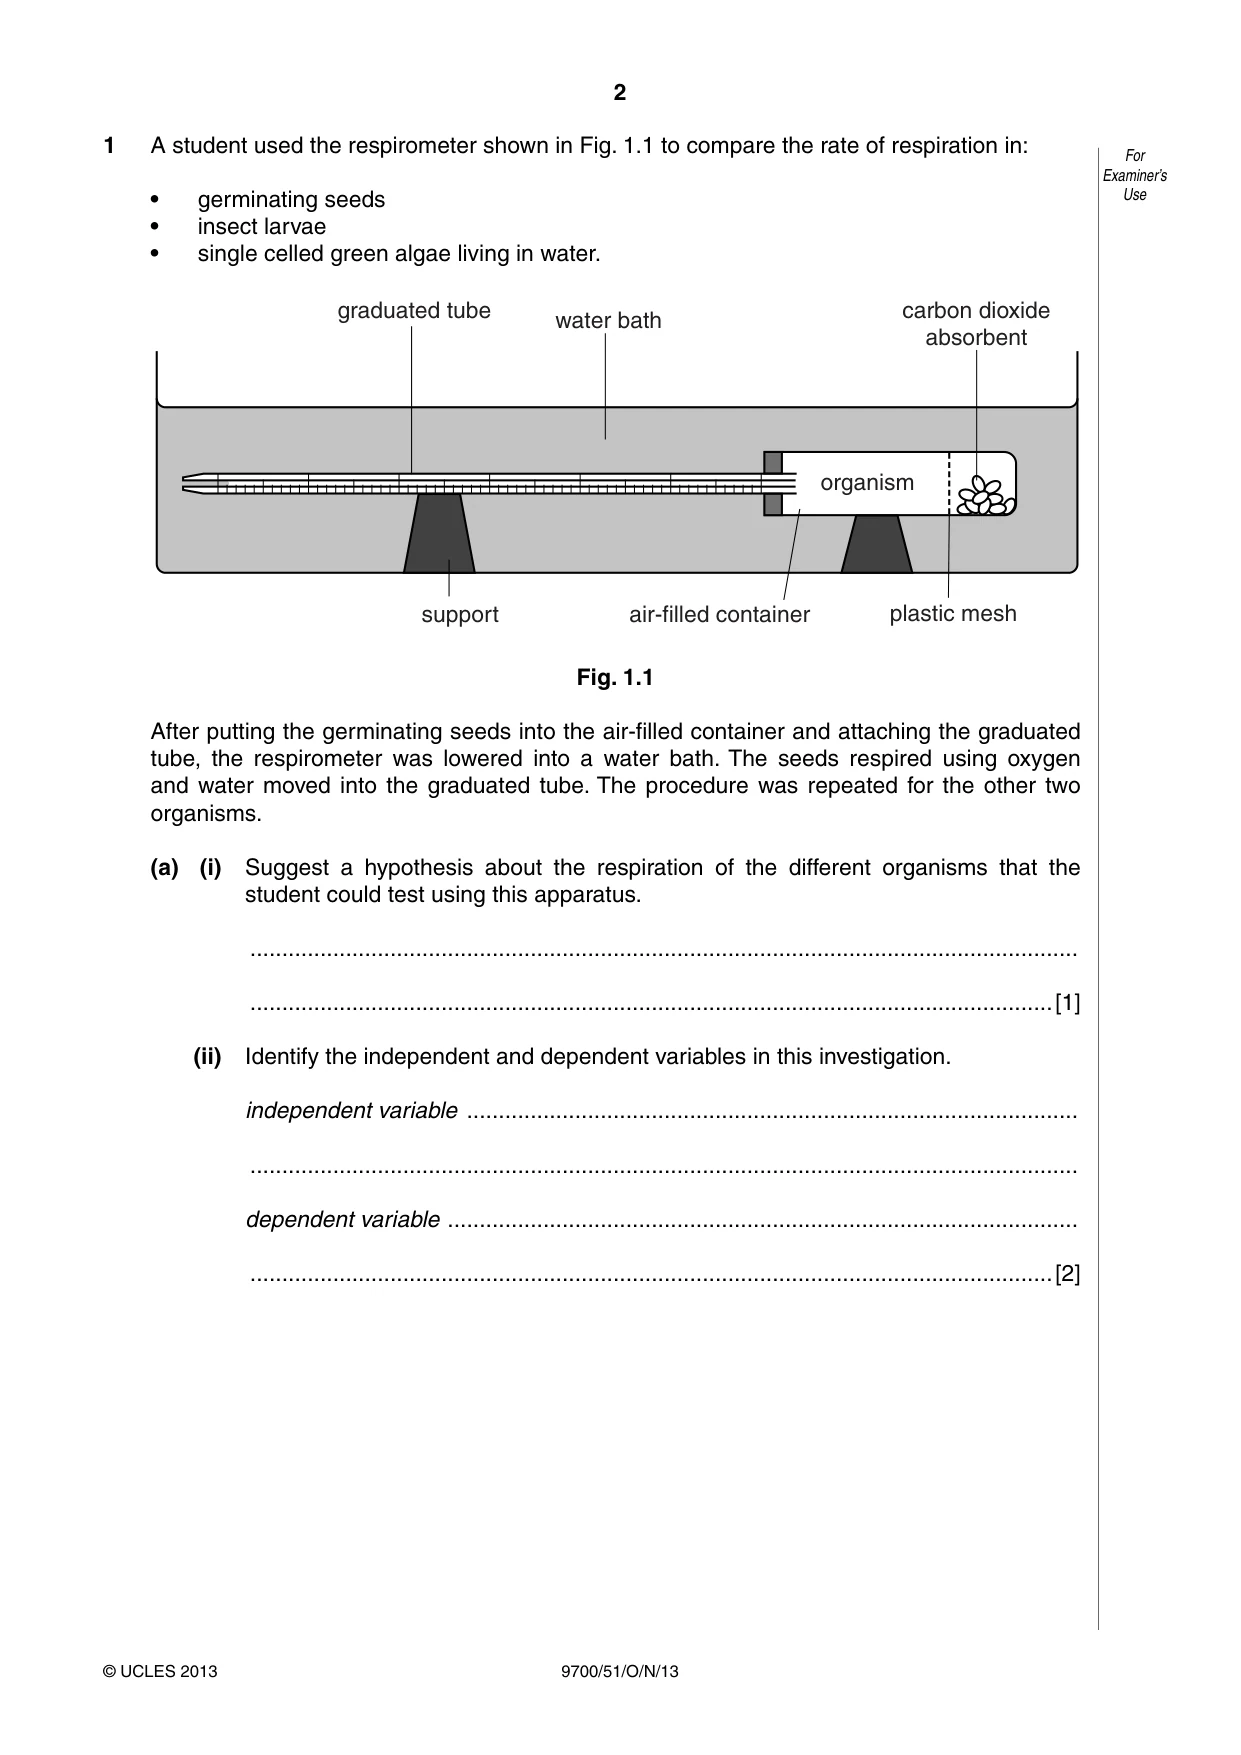
2 9700/51/O/N/13 © UCLES 2013 For Examiner’s Use 1 A student used the respirometer shown in Fig. 1.1 to compare the rate of respiration in: • germinating seeds • insect larvae • single celled green algae living in water. organism plastic mesh air-filled container support graduated tube water bath carbon dioxide absorbent Fig. 1.1 After putting the germinating seeds into the air-filled container and attaching the graduated tube, the respirometer was lowered into a water bath. The seeds respired using oxygen and water moved into the graduated tube. The procedure was repeated for the other two organisms. (a) (i) Suggest a hypothesis about the respiration of the different organisms that the student could test using this apparatus. … …[1] (ii) Identify the independent and dependent variables in this investigation. independent variable … … dependent variable … …[2]
Question paper, page 3
3 9700/51/O/N/13 © UCLES 2013 [Turn over For Examiner’s Use (iii) Describe a method, using the respirometer in Fig. 1.1, that the student could use to compare the rates of respiration of germinating seeds, insect larvae and a single celled green algae living in water. Your method should be detailed enough for another person to use. … … … … … … … … … … … … … … … … … … … … … … … … …[8]
Question paper, page 4
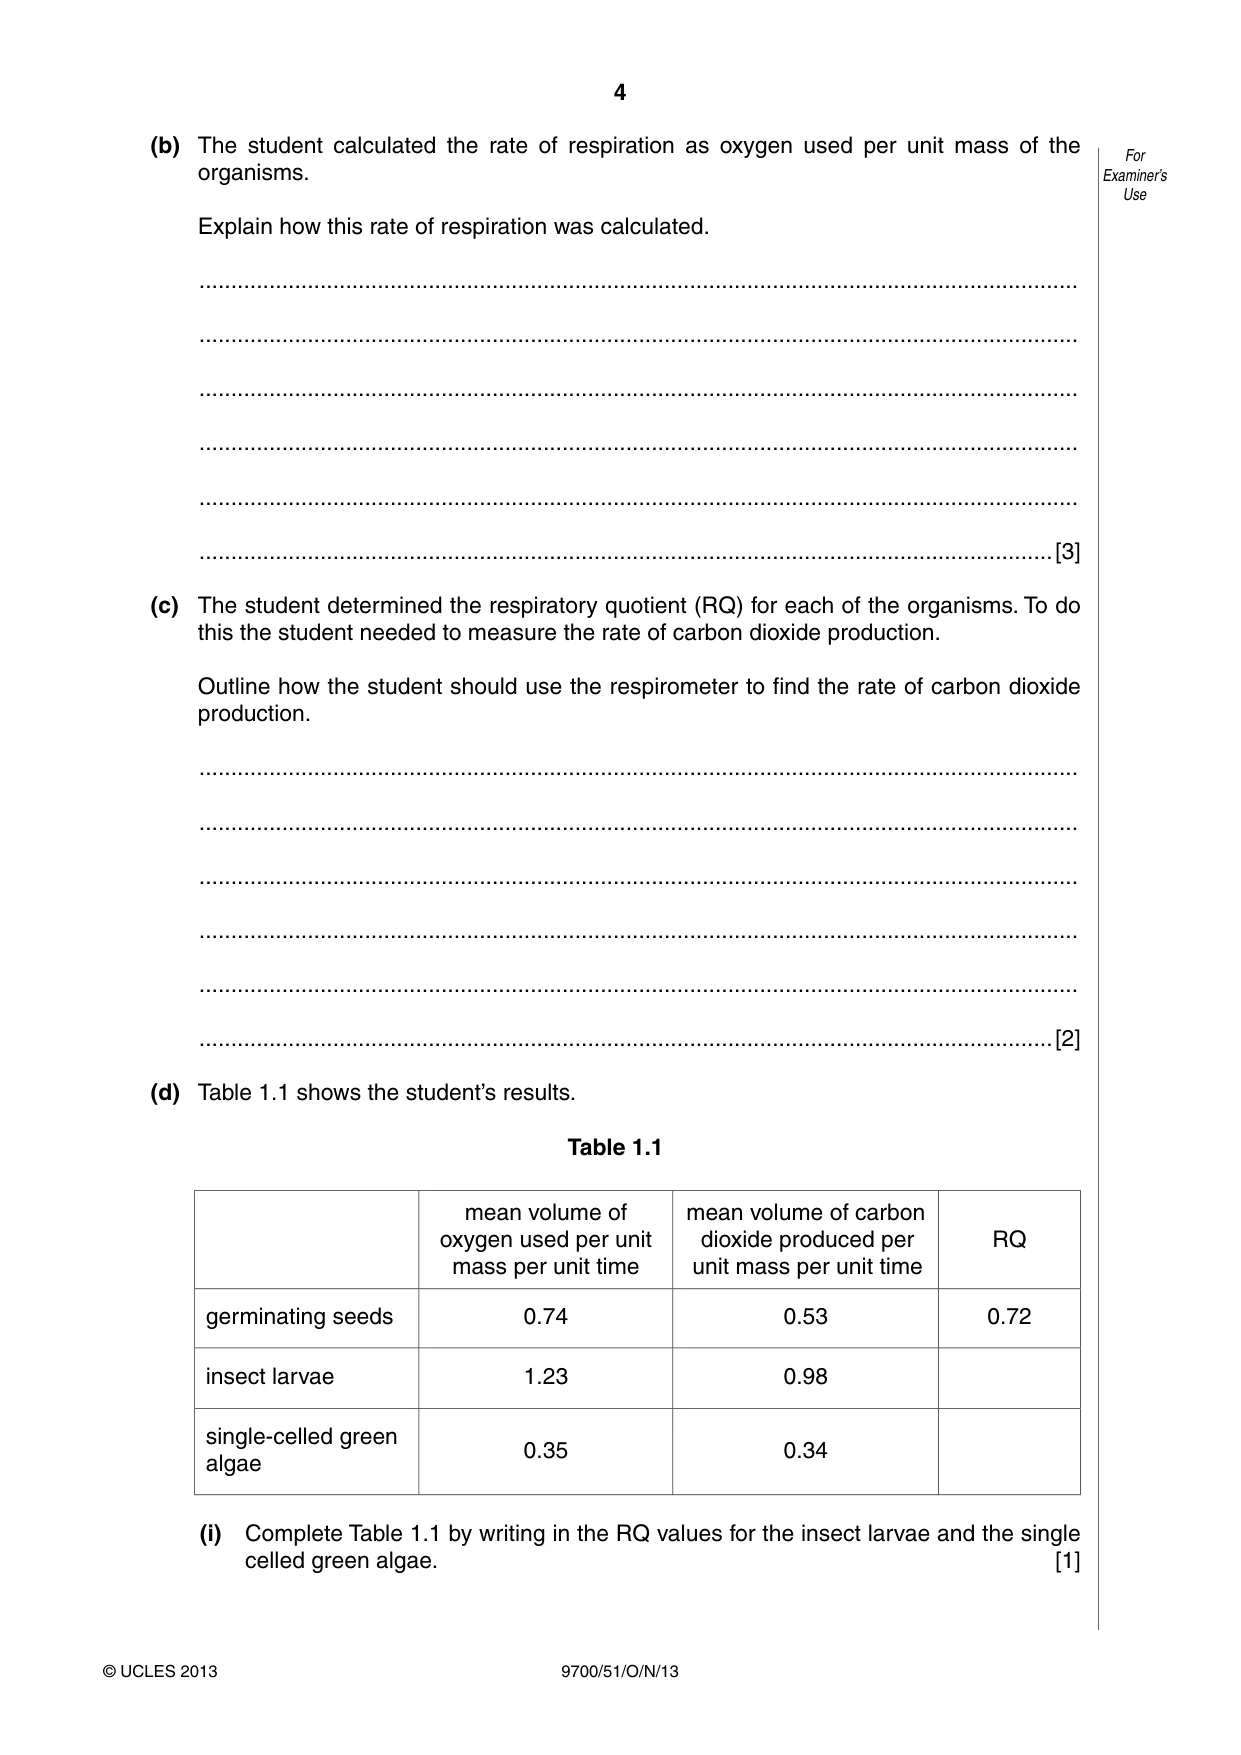
4 9700/51/O/N/13 © UCLES 2013 For Examiner’s Use (b) The student calculated the rate of respiration as oxygen used per unit mass of the organisms. Explain how this rate of respiration was calculated. … … … … … …[3] (c) The student determined the respiratory quotient (RQ) for each of the organisms. To do this the student needed to measure the rate of carbon dioxide production. Outline how the student should use the respirometer to find the rate of carbon dioxide production. … … … … … …[2] (d) Table 1.1 shows the student’s results. Table 1.1 mean volume of oxygen used per unit mass per unit time mean volume of carbon dioxide produced per unit mass per unit time RQ germinating seeds 0.74 0.53 0.72 insect larvae 1.23 0.98 single-celled green algae 0.35 0.34 (i) Complete Table 1.1 by writing in the RQ values for the insect larvae and the single celled green algae. [1]
Question paper, page 5
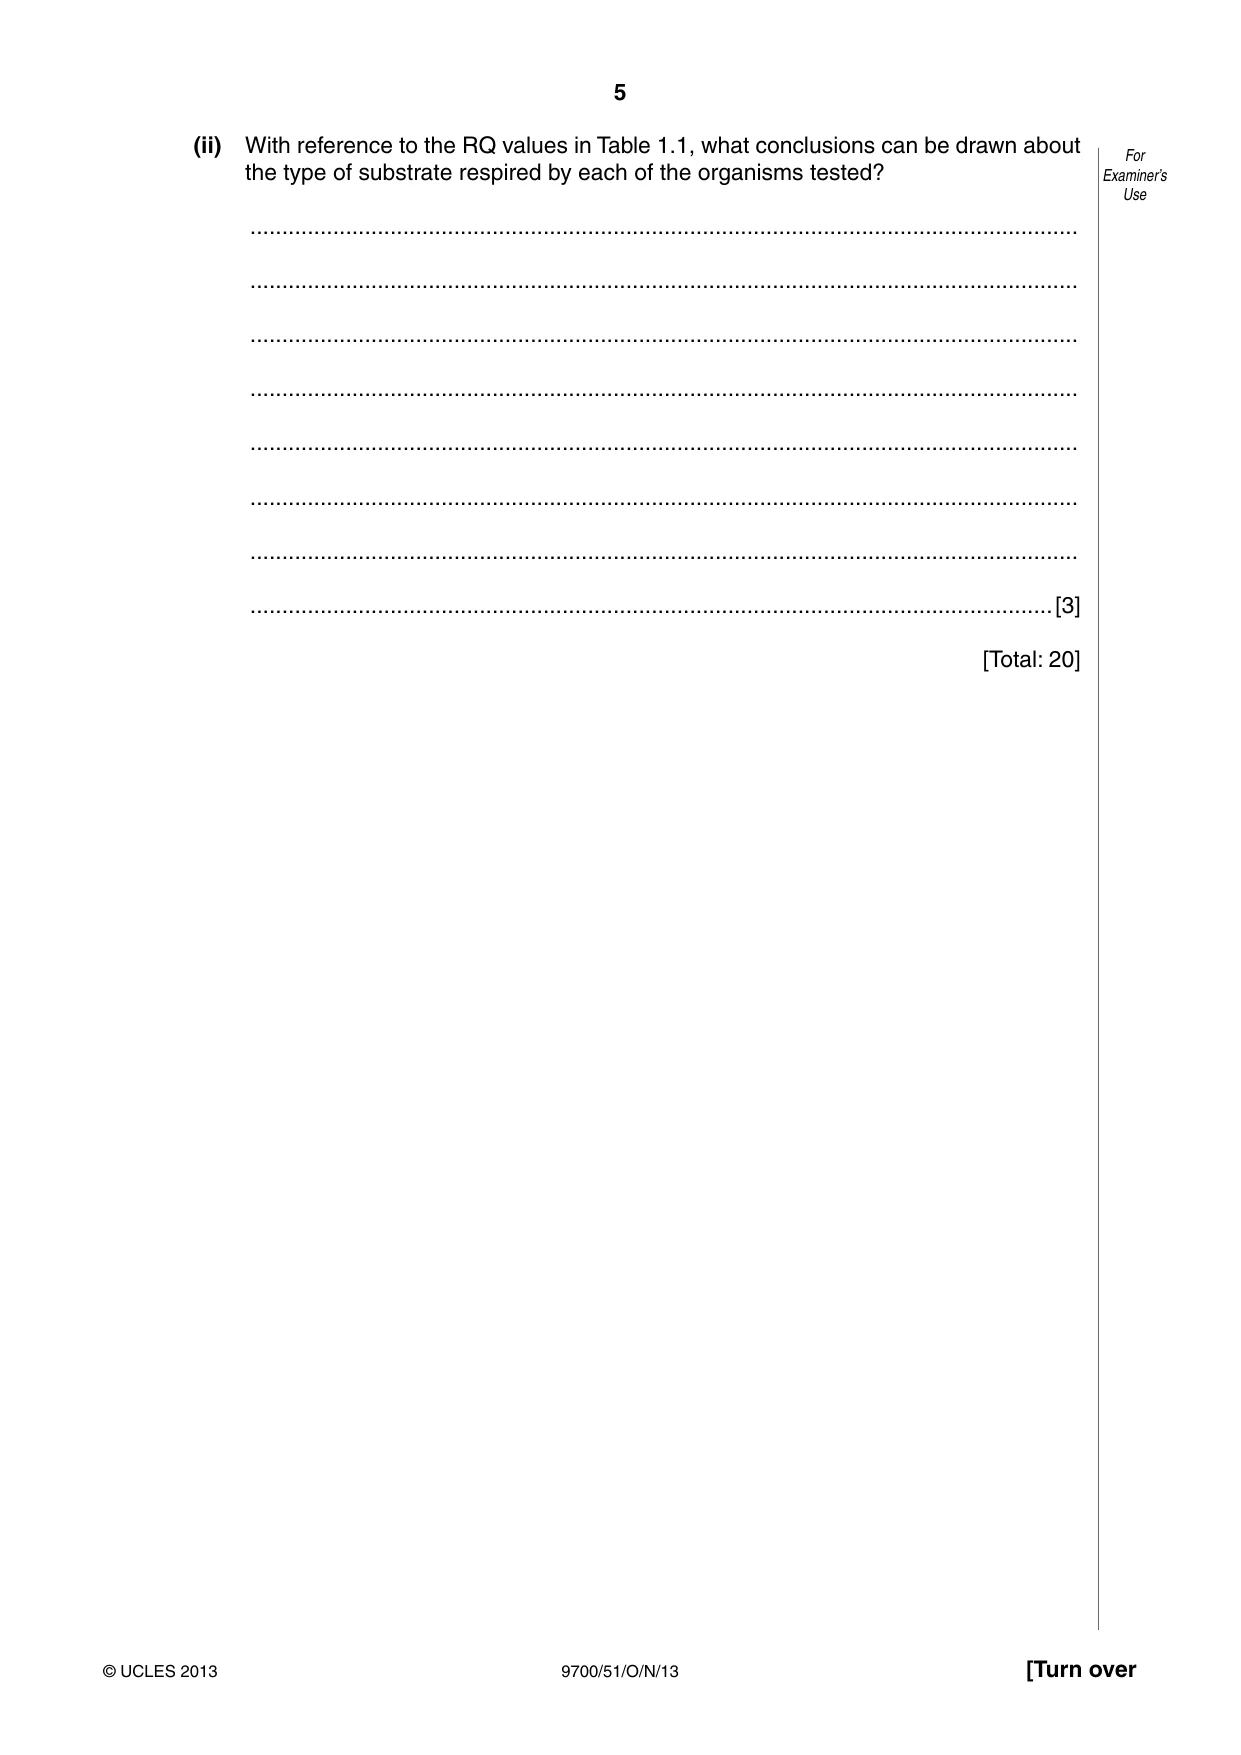
5 9700/51/O/N/13 © UCLES 2013 [Turn over For Examiner’s Use (ii) With reference to the RQ values in Table 1.1, what conclusions can be drawn about the type of substrate respired by each of the organisms tested? … … … … … … … …[3] [Total: 20]
Question paper, page 6
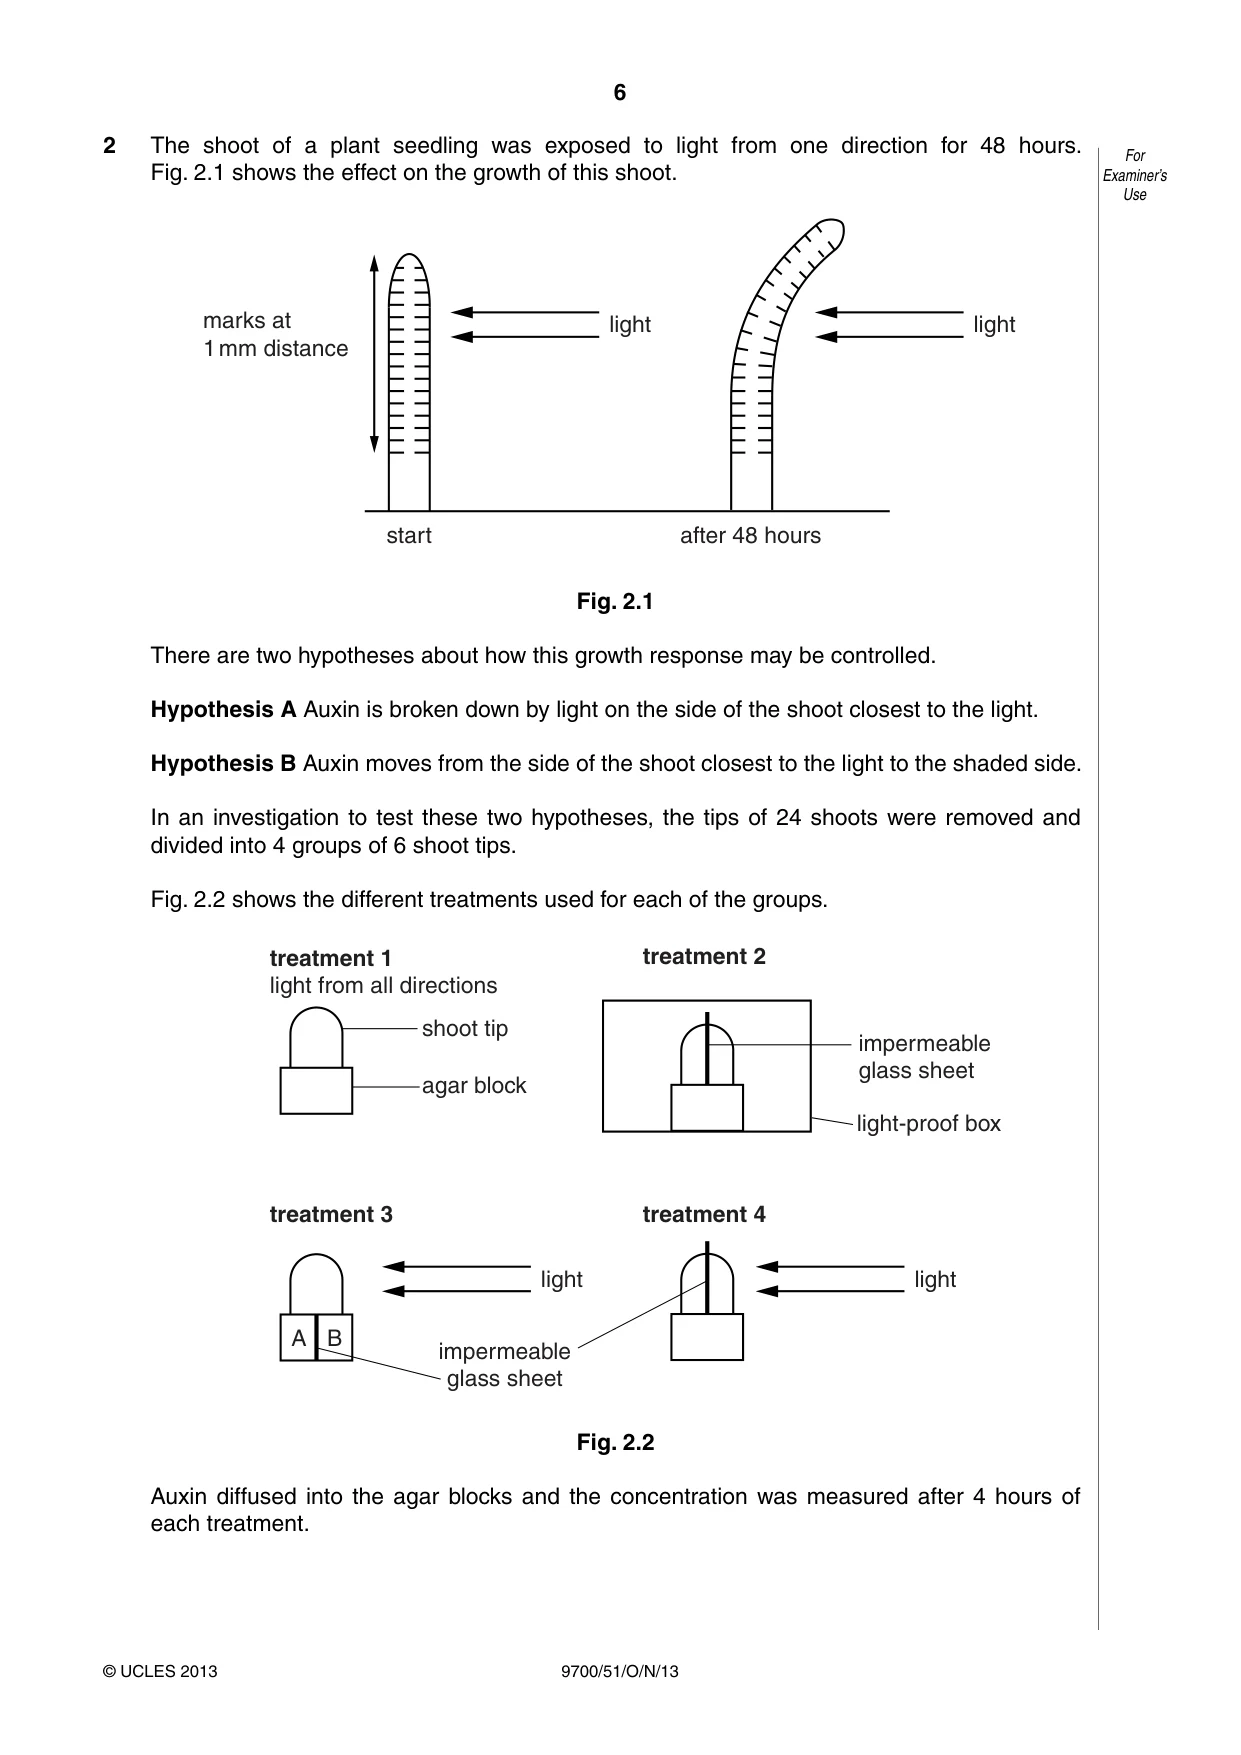
6 9700/51/O/N/13 © UCLES 2013 For Examiner’s Use 2 The shoot of a plant seedling was exposed to light from one direction for 48 hours. Fig. 2.1 shows the effect on the growth of this shoot. light marks at 1 mm distance start after 48 hours light Fig. 2.1 There are two hypotheses about how this growth response may be controlled. Hypothesis A Auxin is broken down by light on the side of the shoot closest to the light. Hypothesis B Auxin moves from the side of the shoot closest to the light to the shaded side. In an investigation to test these two hypotheses, the tips of 24 shoots were removed and divided into 4 groups of 6 shoot tips. Fig. 2.2 shows the different treatments used for each of the groups. light light treatment 1 light from all directions shoot tip impermeable glass sheet impermeable glass sheet light-proof box agar block treatment 3 treatment 2 treatment 4 A B Fig. 2.2 Auxin diffused into the agar blocks and the concentration was measured after 4 hours of each treatment.
Question paper, page 7
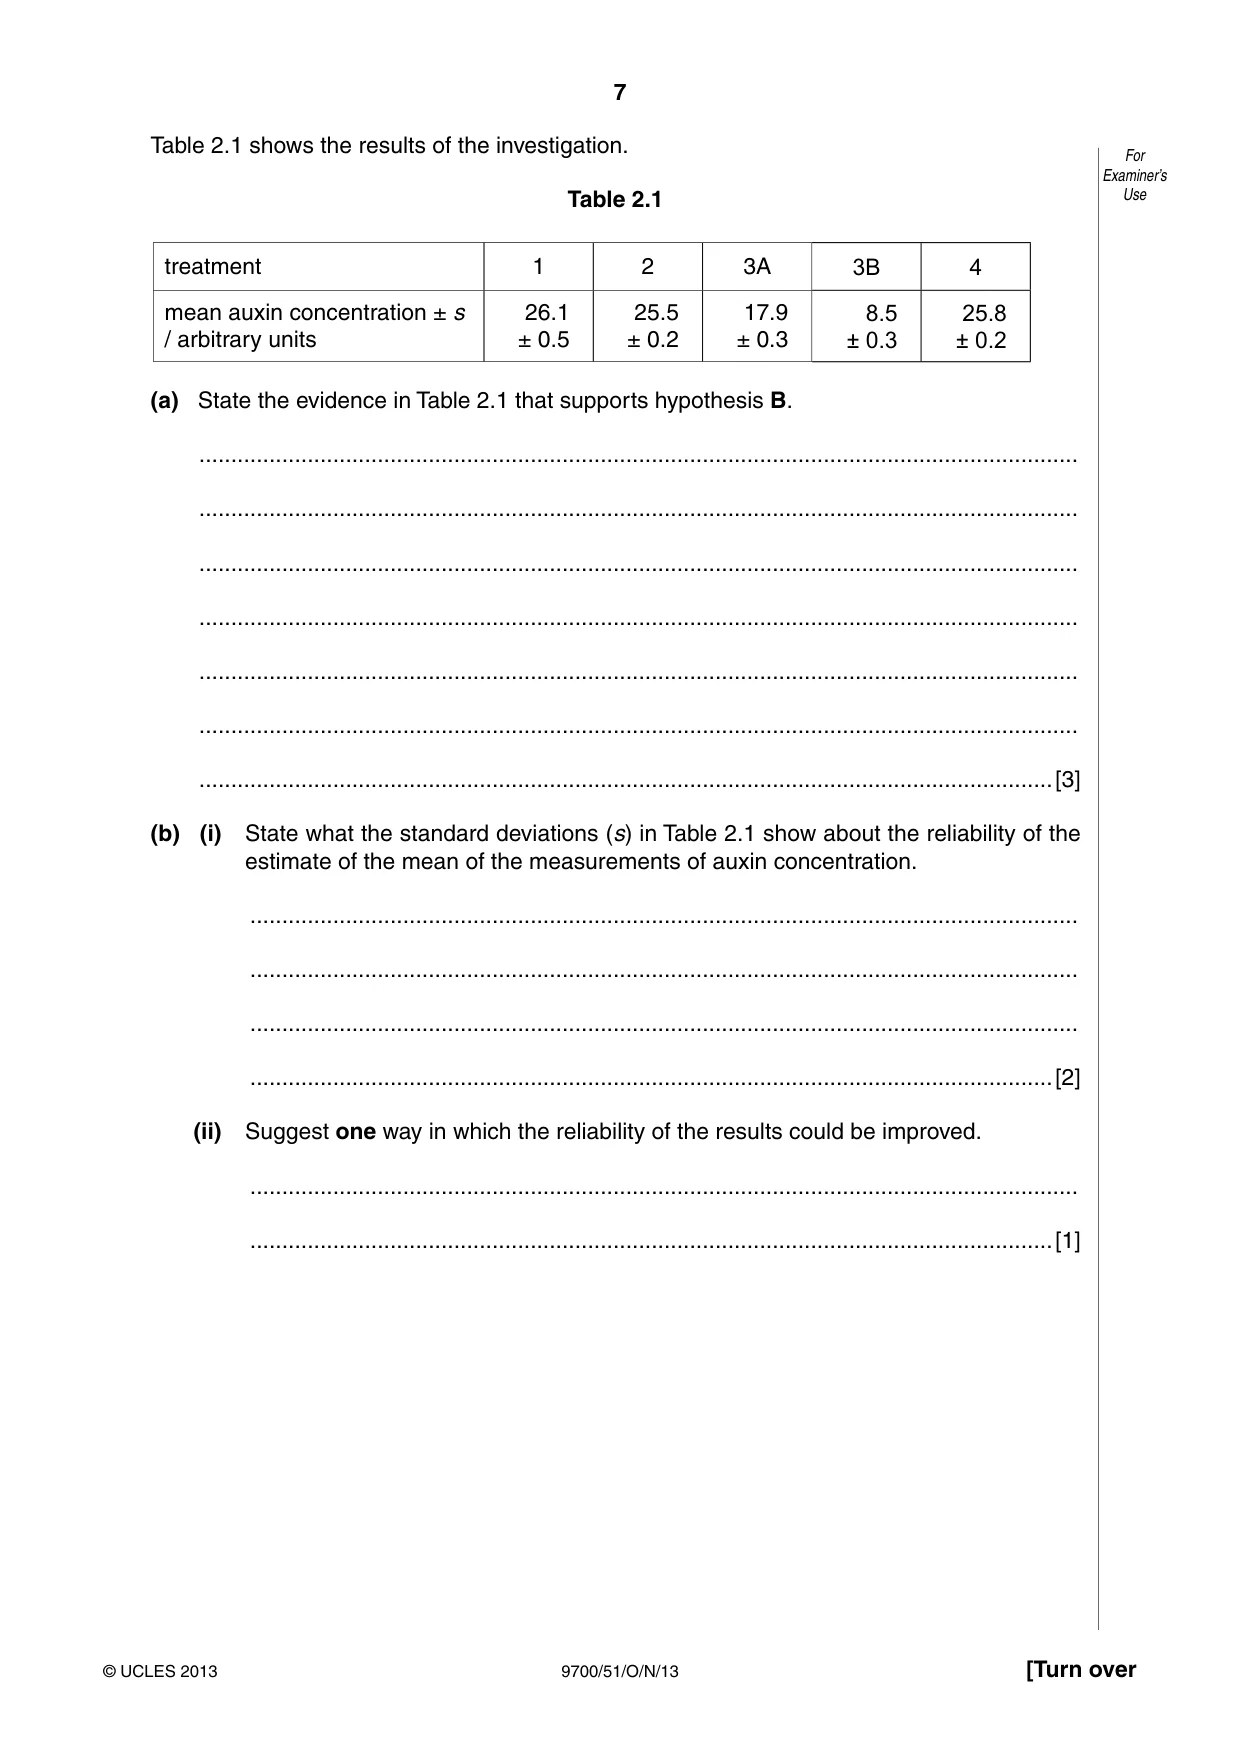
7 9700/51/O/N/13 © UCLES 2013 [Turn over For Examiner’s Use Table 2.1 shows the results of the investigation. Table 2.1 treatment 1 2 3A 3B 4 mean auxin concentration ± s / arbitrary units 26.1 ± 0.5 25.5 ± 0.2 17.9 ± 0.3 8.5 ± 0.3 25.8 ± 0.2 (a) State the evidence in Table 2.1 that supports hypothesis B. … … … … … … …[3] (b) (i) State what the standard deviations (s) in Table 2.1 show about the reliability of the estimate of the mean of the measurements of auxin concentration. … … … …[2] (ii) Suggest one way in which the reliability of the results could be improved. … …[1]
Question paper, page 8
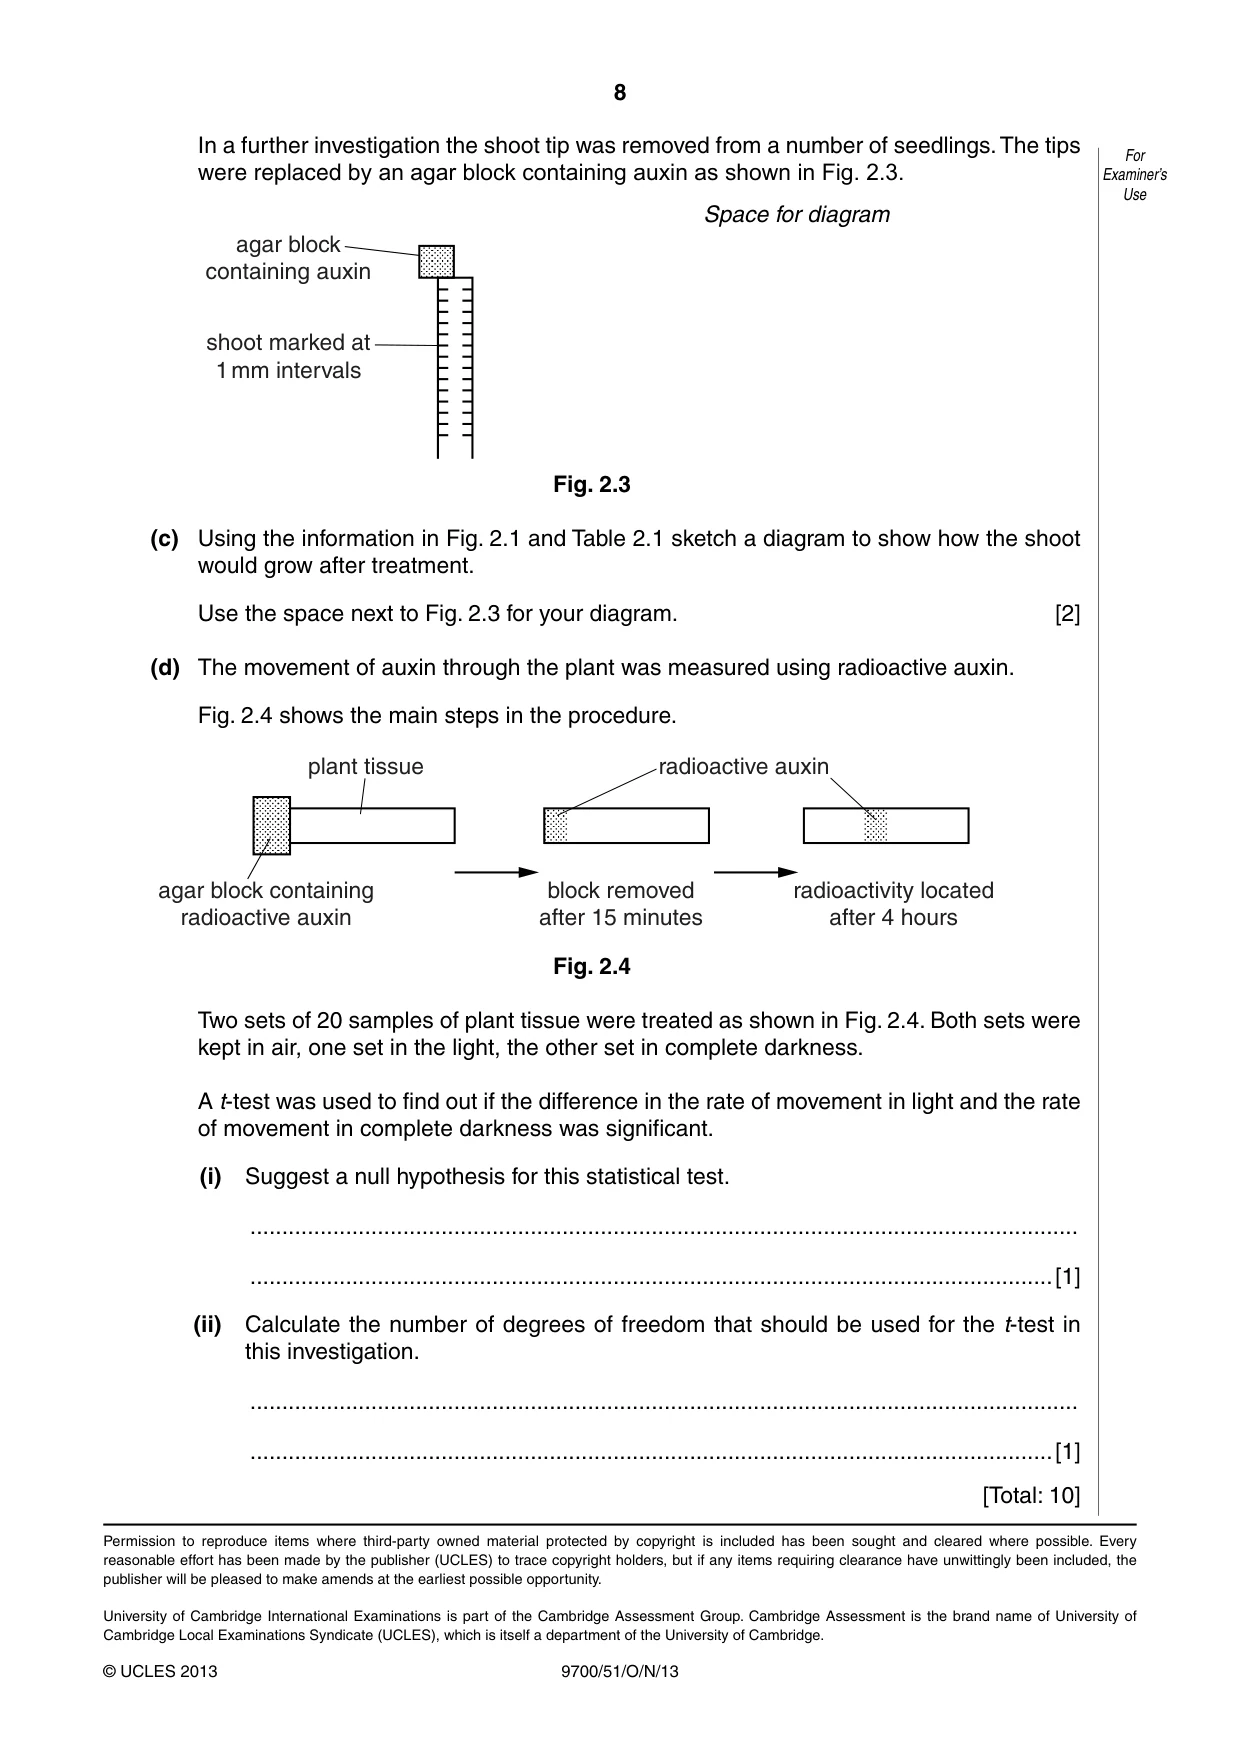
8 9700/51/O/N/13 © UCLES 2013 For Examiner’s Use In a further investigation the shoot tip was removed from a number of seedlings. The tips were replaced by an agar block containing auxin as shown in Fig. 2.3. Space for diagram agar block containing auxin shoot marked at 1 mm intervals Fig. 2.3 (c) Using the information in Fig. 2.1 and Table 2.1 sketch a diagram to show how the shoot would grow after treatment. Use the space next to Fig. 2.3 for your diagram. [2] (d) The movement of auxin through the plant was measured using radioactive auxin. Fig. 2.4 shows the main steps in the procedure. plant tissue radioactive auxin agar block containing radioactive auxin block removed after 15 minutes radioactivity located after 4 hours Fig. 2.4 Two sets of 20 samples of plant tissue were treated as shown in Fig. 2.4. Both sets were kept in air, one set in the light, the other set in complete darkness. A t-test was used to find out if the difference in the rate of movement in light and the rate of movement in complete darkness was significant. (i) Suggest a null hypothesis for this statistical test. … …[1] (ii) Calculate the number of degrees of freedom that should be used for the t-test in this investigation. … …[1] [Total: 10] Permission to reproduce items where third-party owned material protected by copyright is included has been sought and cleared where possible. Every reasonable effort has been made by the publisher (UCLES) to trace copyright holders, but if any items requiring clearance have unwittingly been included, the publisher will be pleased to make amends at the earliest possible opportunity. University of Cambridge International Examinations is part of the Cambridge Assessment Group. Cambridge Assessment is the brand name of University of Cambridge Local Examinations Syndicate (UCLES), which is itself a department of the University of Cambridge.
Mark scheme, page 1
CAMBRIDGE INTERNATIONAL EXAMINATIONS GCE Advanced Subsidiary Level and GCE Advanced Level MARK SCHEME for the October/November 2013 series 9700 BIOLOGY 9700/51 Paper 5 (Planning, Analysis and Evaluation), maximum raw mark 30 This mark scheme is published as an aid to teachers and candidates, to indicate the requirements of the examination. It shows the basis on which Examiners were instructed to award marks. It does not indicate the details of the discussions that took place at an Examiners’ meeting before marking began, which would have considered the acceptability of alternative answers. Mark schemes should be read in conjunction with the question paper and the Principal Examiner Report for Teachers. Cambridge will not enter into discussions about these mark schemes. Cambridge is publishing the mark schemes for the October/November 2013 series for most IGCSE, GCE Advanced Level and Advanced Subsidiary Level components and some Ordinary Level components.
Mark scheme, page 2
Page 2 Mark Scheme Syllabus Paper GCE AS / A LEVEL – October / November 2013 9700 51 © Cambridge International Examinations 2013 Mark scheme abbreviations: ; separates marking points / alternatives answers for the same point R reject A accept (for answers correctly cued by the question, or extra guidance) AW alternative wording (where responses vary more than usual) underline actual word given must be used by candidate (grammatical variants excepted) max indicates the maximum number of marks that can be given ora or reverse argument ecf error carried forward I ignore mp marking point (with relevant number)
Mark scheme, page 3
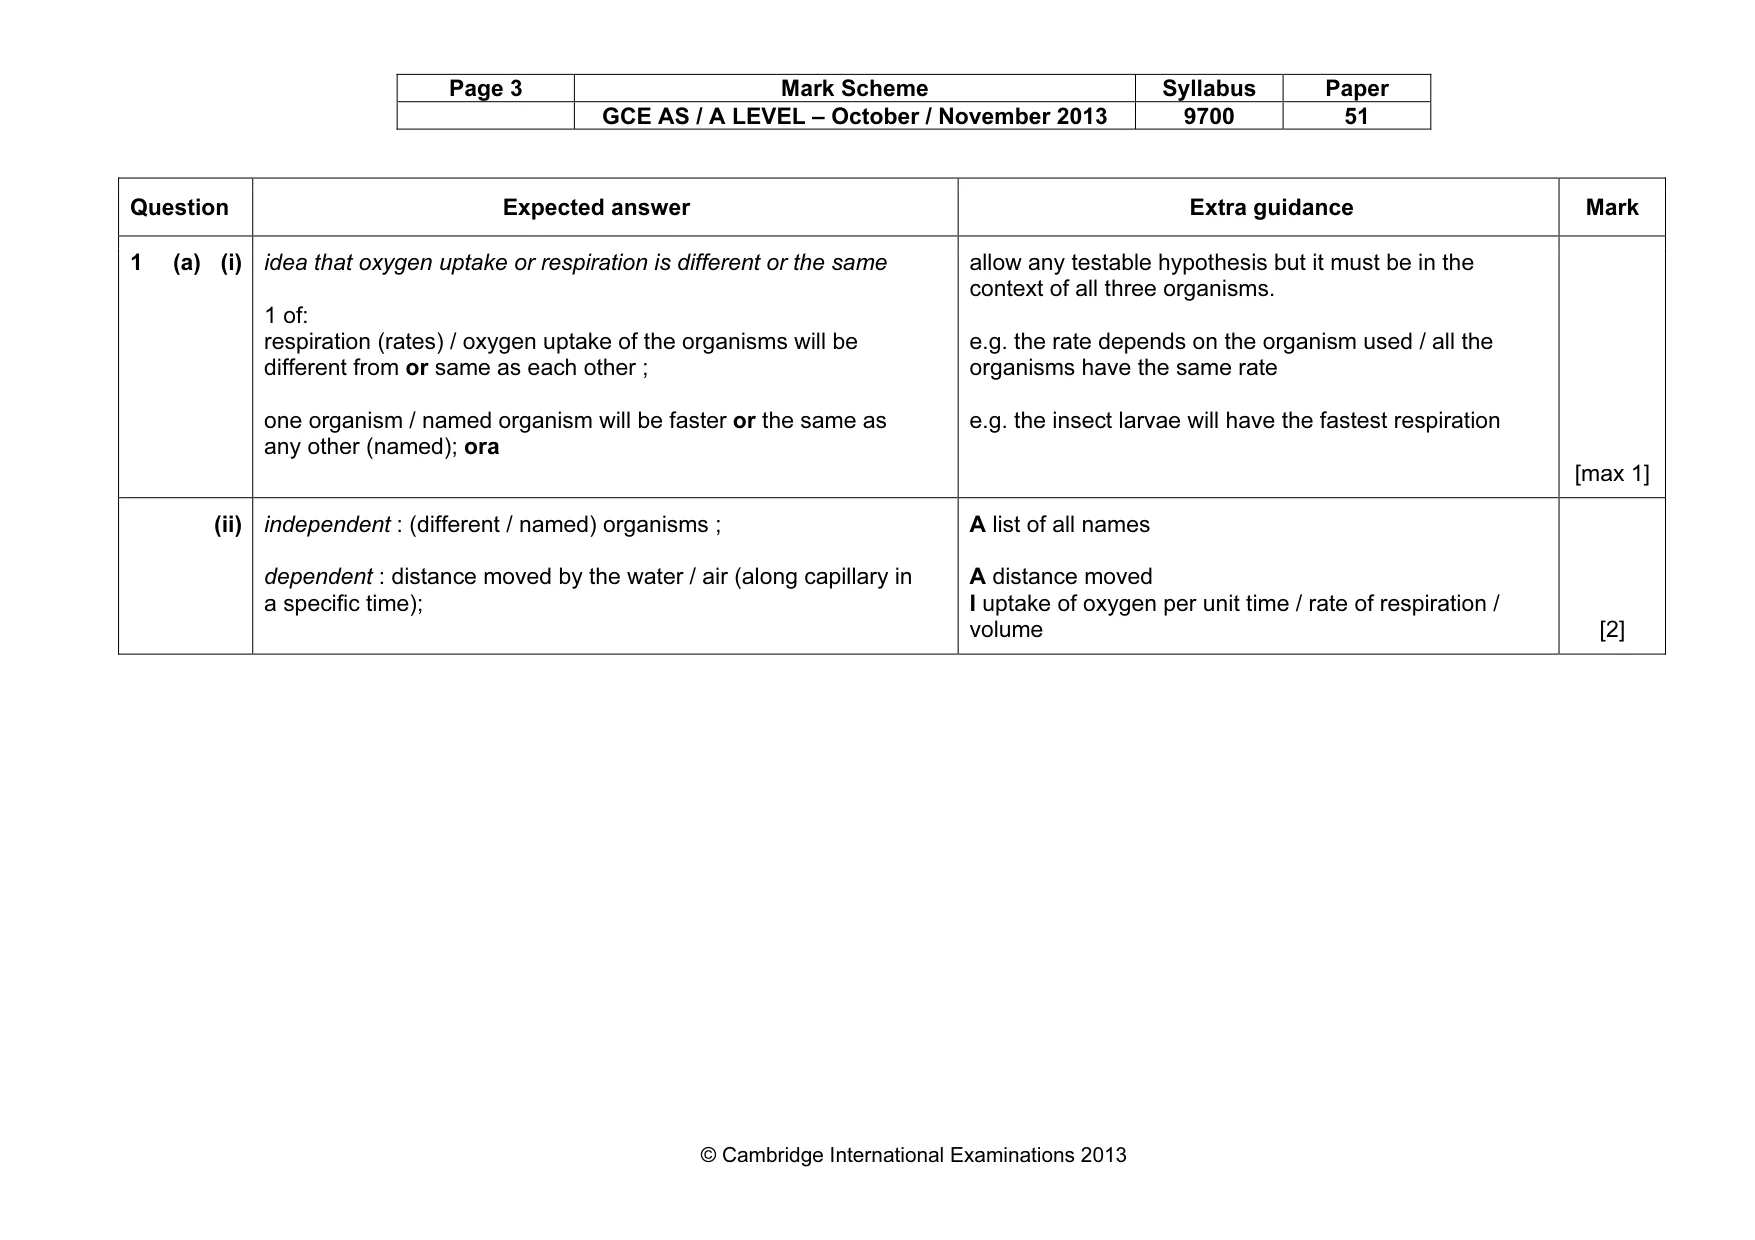
Page 3 Mark Scheme Syllabus Paper GCE AS / A LEVEL – October / November 2013 9700 51 © Cambridge International Examinations 2013 Question Expected answer Extra guidance Mark 1 (a) (i) idea that oxygen uptake or respiration is different or the same 1 of: respiration (rates) / oxygen uptake of the organisms will be different from or same as each other ; one organism / named organism will be faster or the same as any other (named); ora allow any testable hypothesis but it must be in the context of all three organisms. e.g. the rate depends on the organism used / all the organisms have the same rate e.g. the insect larvae will have the fastest respiration [max 1] (ii) independent : (different / named) organisms ; dependent : distance moved by the water / air (along capillary in a specific time); A list of all names A distance moved I uptake of oxygen per unit time / rate of respiration / volume [2]
Mark scheme, page 4
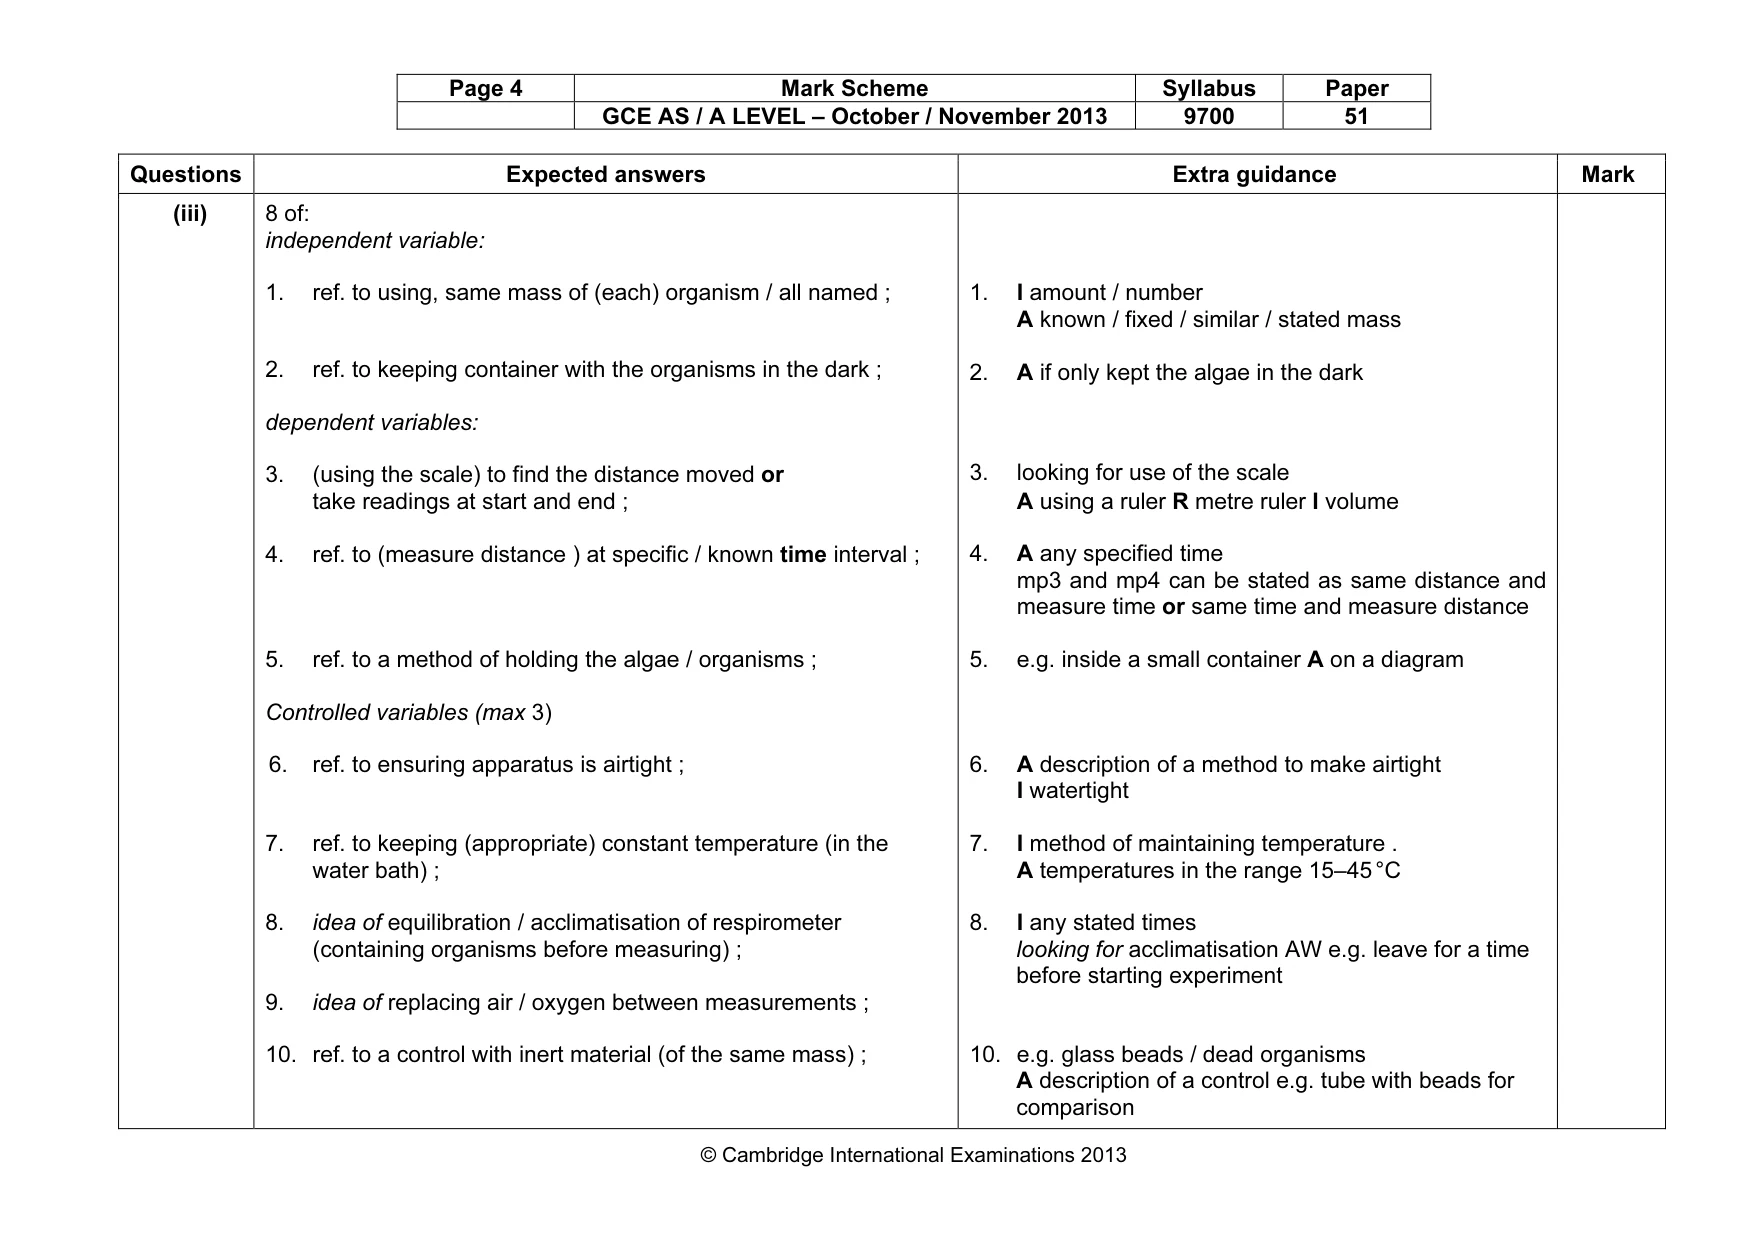
Page 4 Mark Scheme Syllabus Paper GCE AS / A LEVEL – October / November 2013 9700 51 © Cambridge International Examinations 2013 Questions Expected answers Extra guidance Mark (iii) 8 of: independent variable: 1. ref. to using, same mass of (each) organism / all named ; 2. ref. to keeping container with the organisms in the dark ; dependent variables: 3. (using the scale) to find the distance moved or take readings at start and end ; 4. ref. to (measure distance ) at specific / known time interval ; 5. ref. to a method of holding the algae / organisms ; Controlled variables (max 3) 6. ref. to ensuring apparatus is airtight ; 7. ref. to keeping (appropriate) constant temperature (in the water bath) ; 8. idea of equilibration / acclimatisation of respirometer (containing organisms before measuring) ; 9. idea of replacing air / oxygen between measurements ; 10. ref. to a control with inert material (of the same mass) ; 1. I amount / number A known / fixed / similar / stated mass 2. A if only kept the algae in the dark 3. looking for use of the scale A using a ruler R metre ruler I volume 4. A any specified time mp3 and mp4 can be stated as same distance and measure time or same time and measure distance 5. e.g. inside a small container A on a diagram 6. A description of a method to make airtight I watertight 7. I method of maintaining temperature . A temperatures in the range 15–45 °C 8. I any stated times looking for acclimatisation AW e.g. leave for a time before starting experiment 10. e.g. glass beads / dead organisms A description of a control e.g. tube with beads for comparison
Mark scheme, page 5
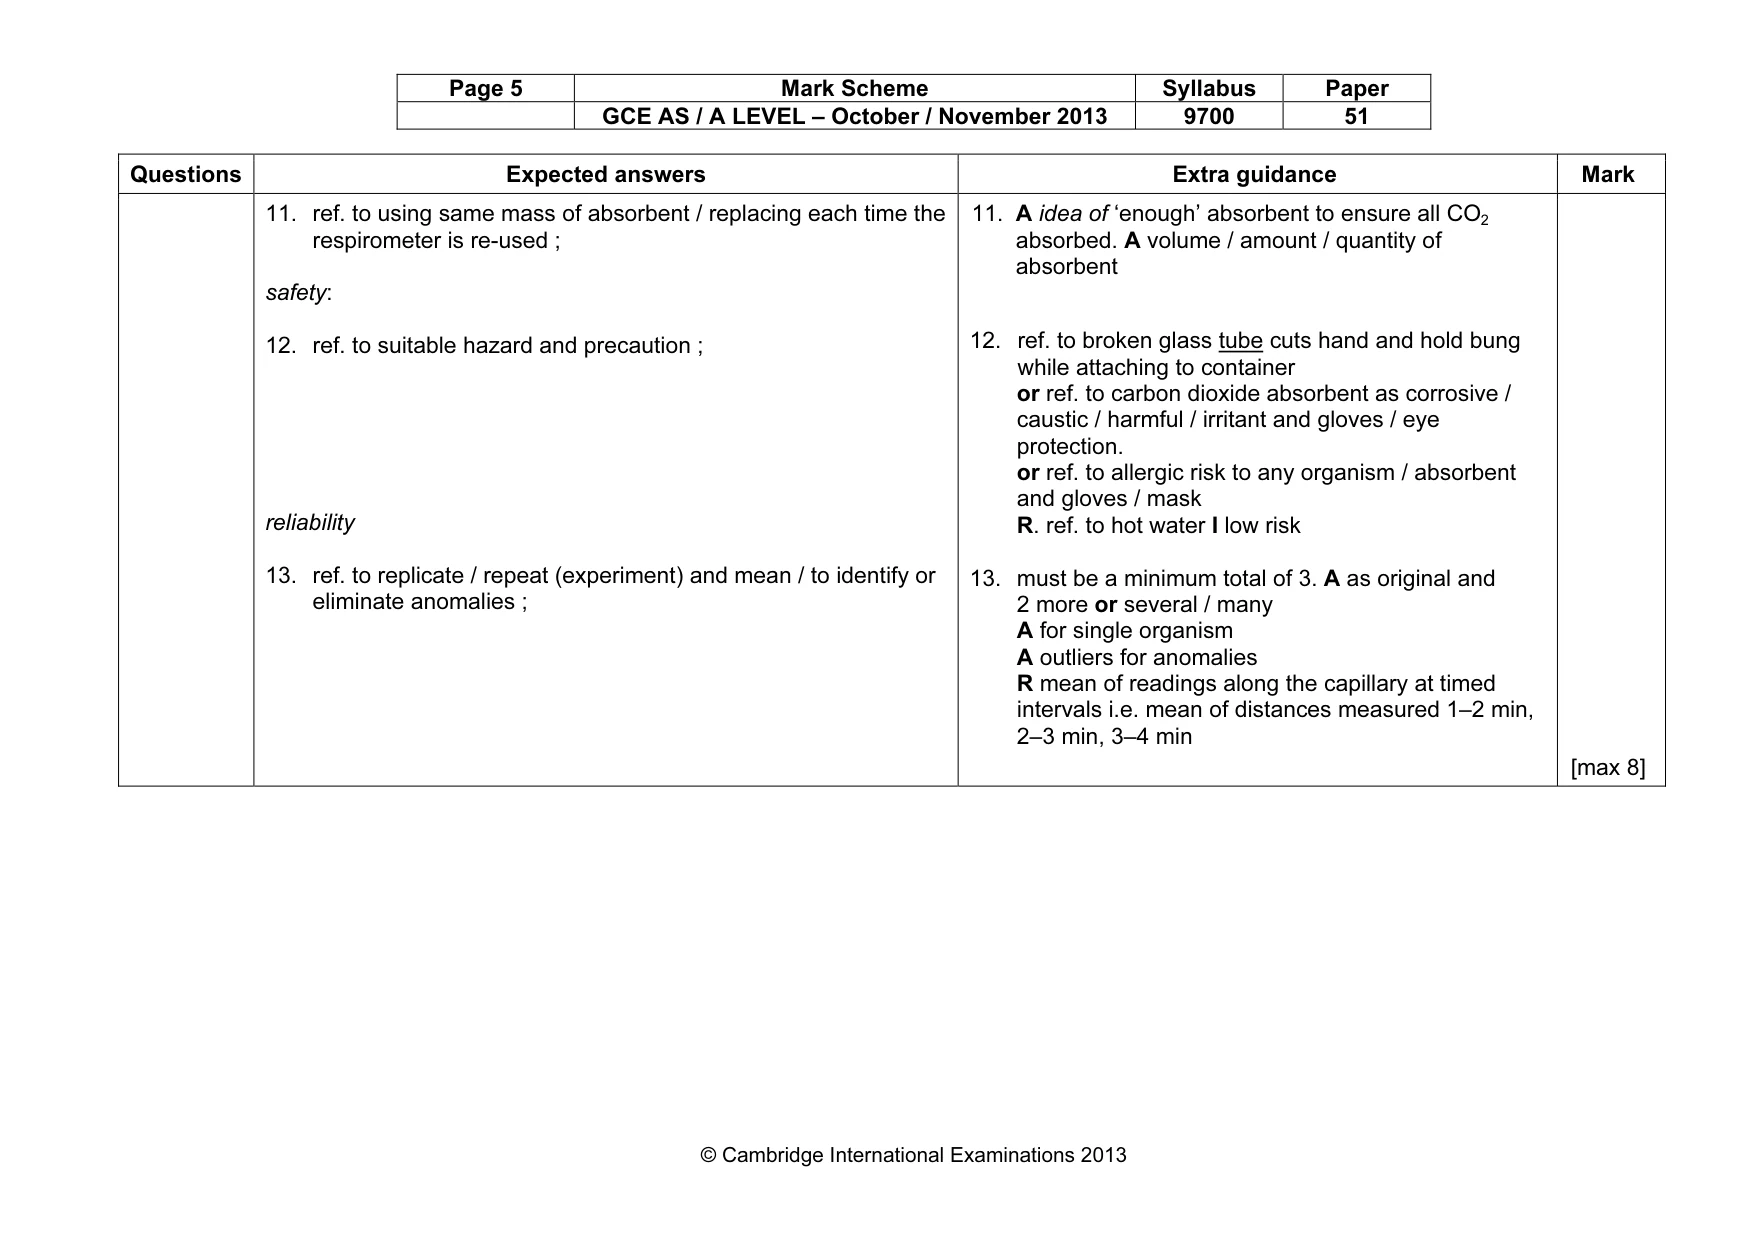
Page 5 Mark Scheme Syllabus Paper GCE AS / A LEVEL – October / November 2013 9700 51 © Cambridge International Examinations 2013 Questions Expected answers Extra guidance Mark 11. ref. to using same mass of absorbent / replacing each time the respirometer is re-used ; safety: 12. ref. to suitable hazard and precaution ; reliability 13. ref. to replicate / repeat (experiment) and mean / to identify or eliminate anomalies ; 11. A idea of ‘enough’ absorbent to ensure all CO2 absorbed. A volume / amount / quantity of absorbent 12. ref. to broken glass tube cuts hand and hold bung while attaching to container or ref. to carbon dioxide absorbent as corrosive / caustic / harmful / irritant and gloves / eye protection. or ref. to allergic risk to any organism / absorbent and gloves / mask R. ref. to hot water I low risk 13. must be a minimum total of 3. A as original and 2 more or several / many A for single organism A outliers for anomalies R mean of readings along the capillary at timed intervals i.e. mean of distances measured 1–2 min, 2–3 min, 3–4 min [max 8]
Mark scheme, page 6
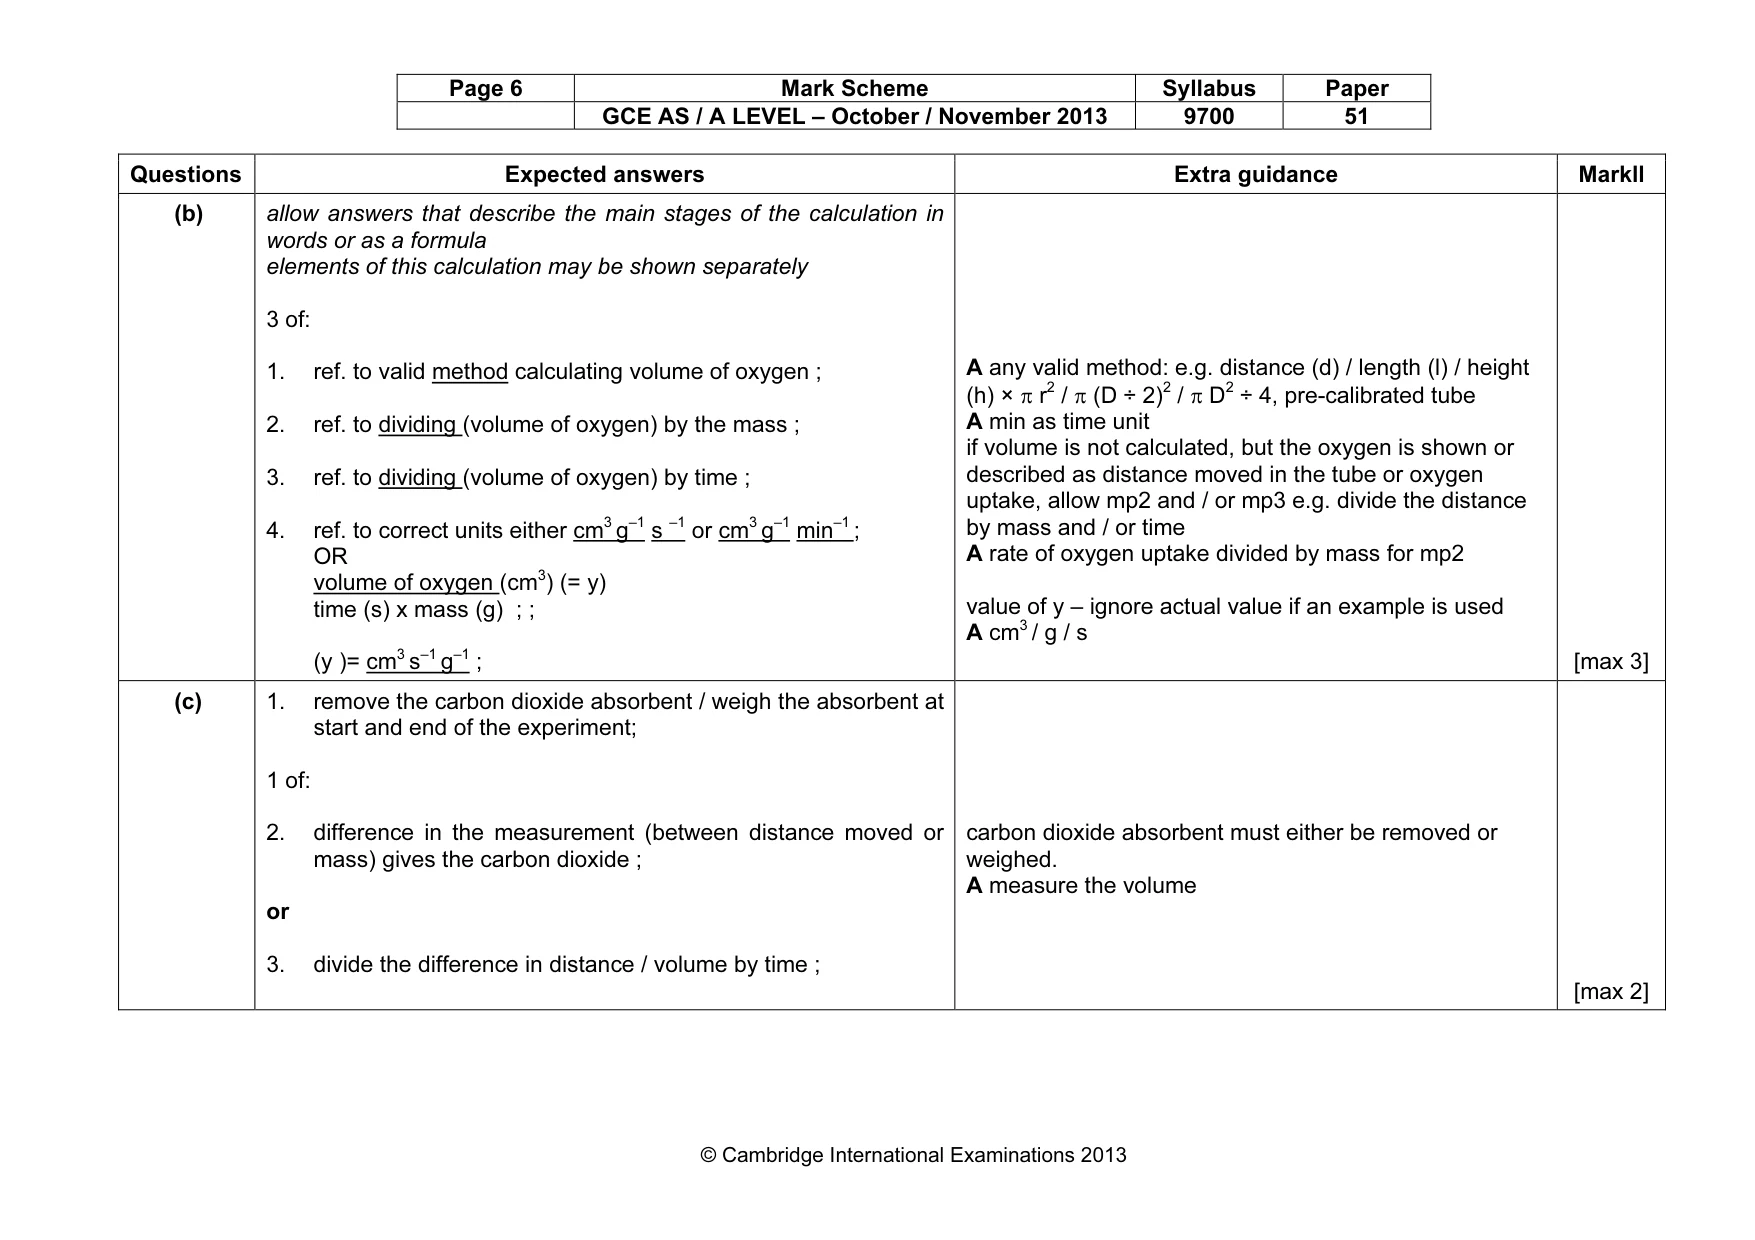
Page 6 Mark Scheme Syllabus Paper GCE AS / A LEVEL – October / November 2013 9700 51 © Cambridge International Examinations 2013 Questions Expected answers Extra guidance Markll (b) allow answers that describe the main stages of the calculation in words or as a formula elements of this calculation may be shown separately 3 of: 1. ref. to valid method calculating volume of oxygen ; 2. ref. to dividing (volume of oxygen) by the mass ; 3. ref. to dividing (volume of oxygen) by time ; 4. ref. to correct units either cm3 g–1 s –1 or cm3 g–1 min–1 ; OR volume of oxygen (cm3) (= y) time (s) x mass (g) ; ; (y )= cm3 s–1 g–1 ; A any valid method: e.g. distance (d) / length (l) / height (h) × π r2 / π (D ÷ 2)2 / π D2 ÷ 4, pre-calibrated tube A min as time unit if volume is not calculated, but the oxygen is shown or described as distance moved in the tube or oxygen uptake, allow mp2 and / or mp3 e.g. divide the distance by mass and / or time A rate of oxygen uptake divided by mass for mp2 value of y – ignore actual value if an example is used A cm3 / g / s [max 3] (c) 1. remove the carbon dioxide absorbent / weigh the absorbent at start and end of the experiment; 1 of: 2. difference in the measurement (between distance moved or mass) gives the carbon dioxide ; or 3. divide the difference in distance / volume by time ; carbon dioxide absorbent must either be removed or weighed. A measure the volume [max 2]
Mark scheme, page 7
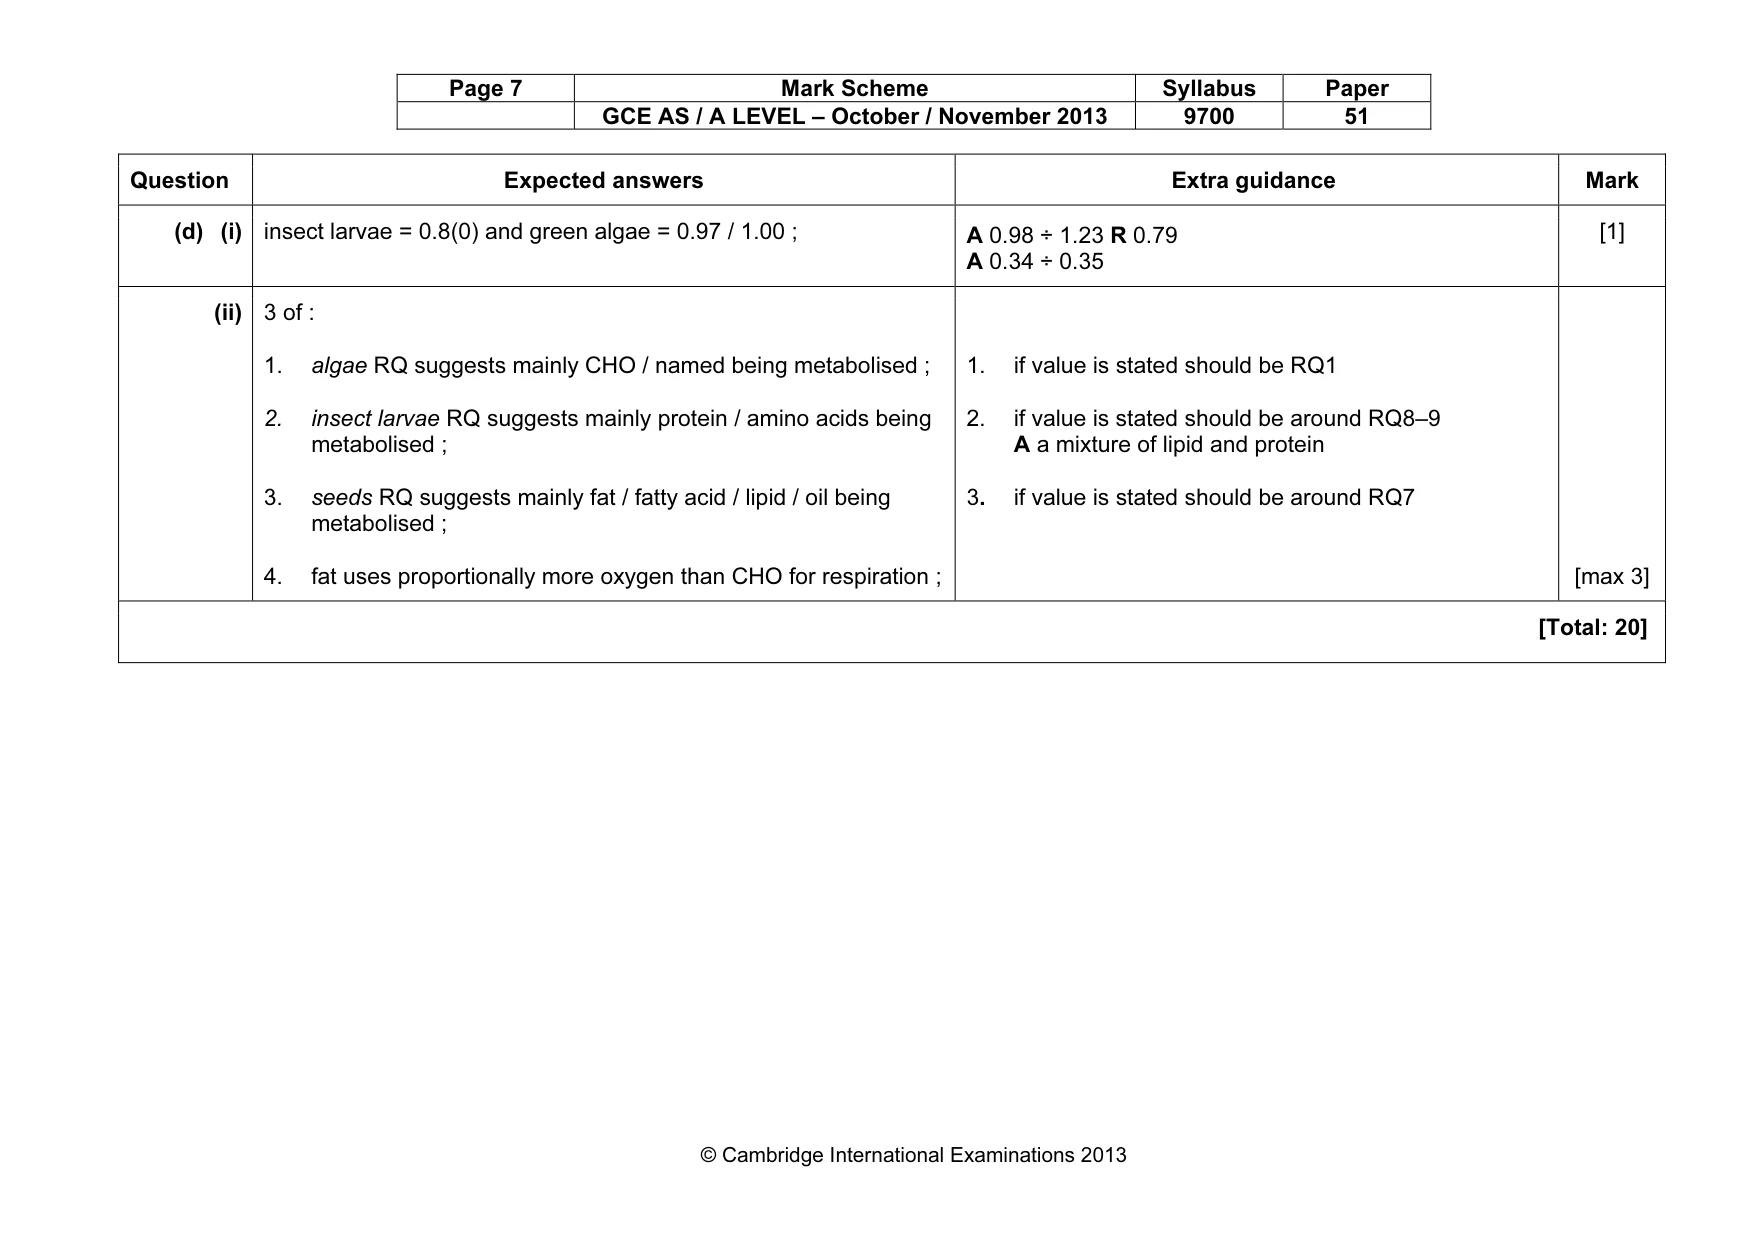
Page 7 Mark Scheme Syllabus Paper GCE AS / A LEVEL – October / November 2013 9700 51 © Cambridge International Examinations 2013 Question Expected answers Extra guidance Mark (d) (i) insect larvae = 0.8(0) and green algae = 0.97 / 1.00 ; A 0.98 ÷ 1.23 R 0.79 A 0.34 ÷ 0.35 [1] (ii) 3 of : 1. algae RQ suggests mainly CHO / named being metabolised ; 2. insect larvae RQ suggests mainly protein / amino acids being metabolised ; 3. seeds RQ suggests mainly fat / fatty acid / lipid / oil being metabolised ; 4. fat uses proportionally more oxygen than CHO for respiration ; 1. if value is stated should be RQ1 2. if value is stated should be around RQ8–9 A a mixture of lipid and protein 3. if value is stated should be around RQ7 [max 3] [Total: 20]
Mark scheme, page 8
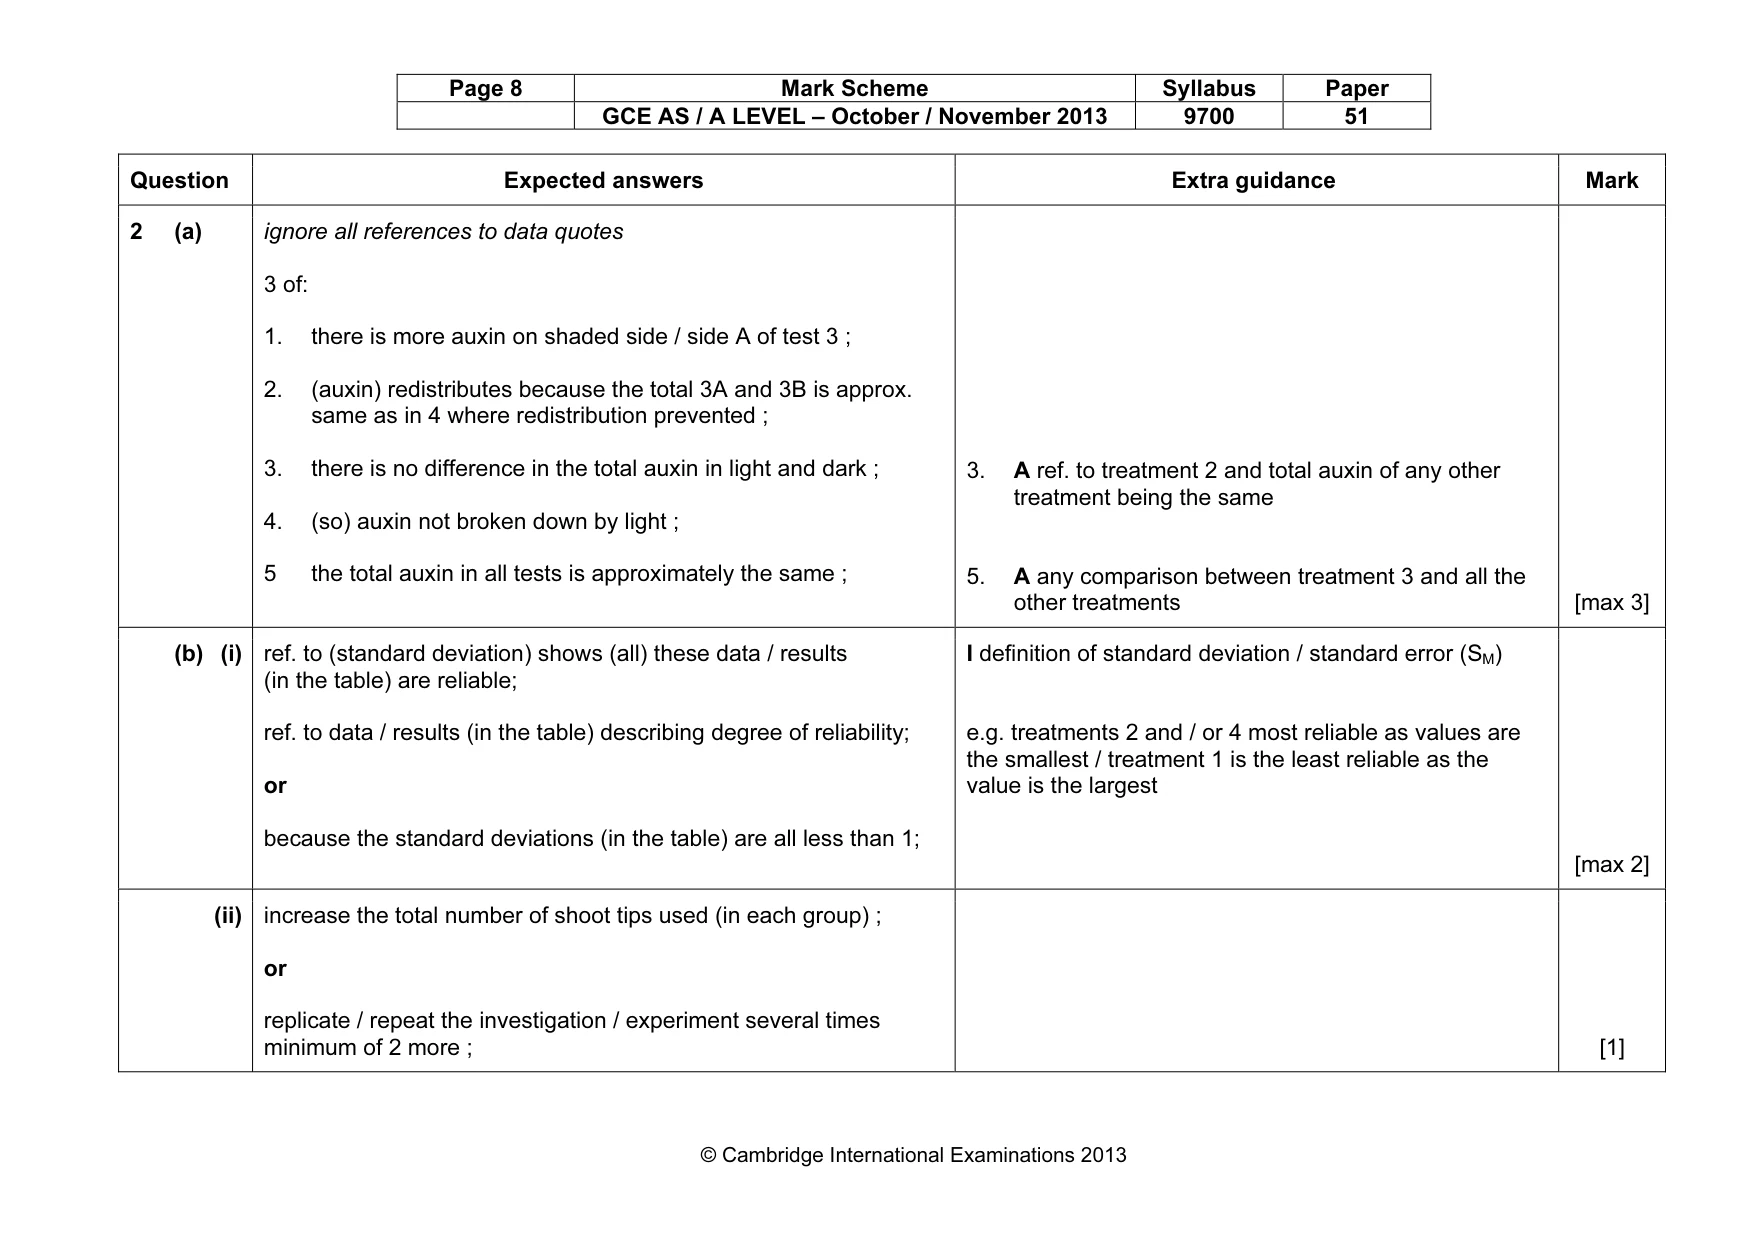
Page 8 Mark Scheme Syllabus Paper GCE AS / A LEVEL – October / November 2013 9700 51 © Cambridge International Examinations 2013 Question Expected answers Extra guidance Mark 2 (a) ignore all references to data quotes 3 of: 1. there is more auxin on shaded side / side A of test 3 ; 2. (auxin) redistributes because the total 3A and 3B is approx. same as in 4 where redistribution prevented ; 3. there is no difference in the total auxin in light and dark ; 4. (so) auxin not broken down by light ; 5 the total auxin in all tests is approximately the same ; 3. A ref. to treatment 2 and total auxin of any other treatment being the same 5. A any comparison between treatment 3 and all the other treatments [max 3] (b) (i) ref. to (standard deviation) shows (all) these data / results (in the table) are reliable; ref. to data / results (in the table) describing degree of reliability; or because the standard deviations (in the table) are all less than 1; I definition of standard deviation / standard error (SM) e.g. treatments 2 and / or 4 most reliable as values are the smallest / treatment 1 is the least reliable as the value is the largest [max 2] (ii) increase the total number of shoot tips used (in each group) ; or replicate / repeat the investigation / experiment several times minimum of 2 more ; [1]
Mark scheme, page 9
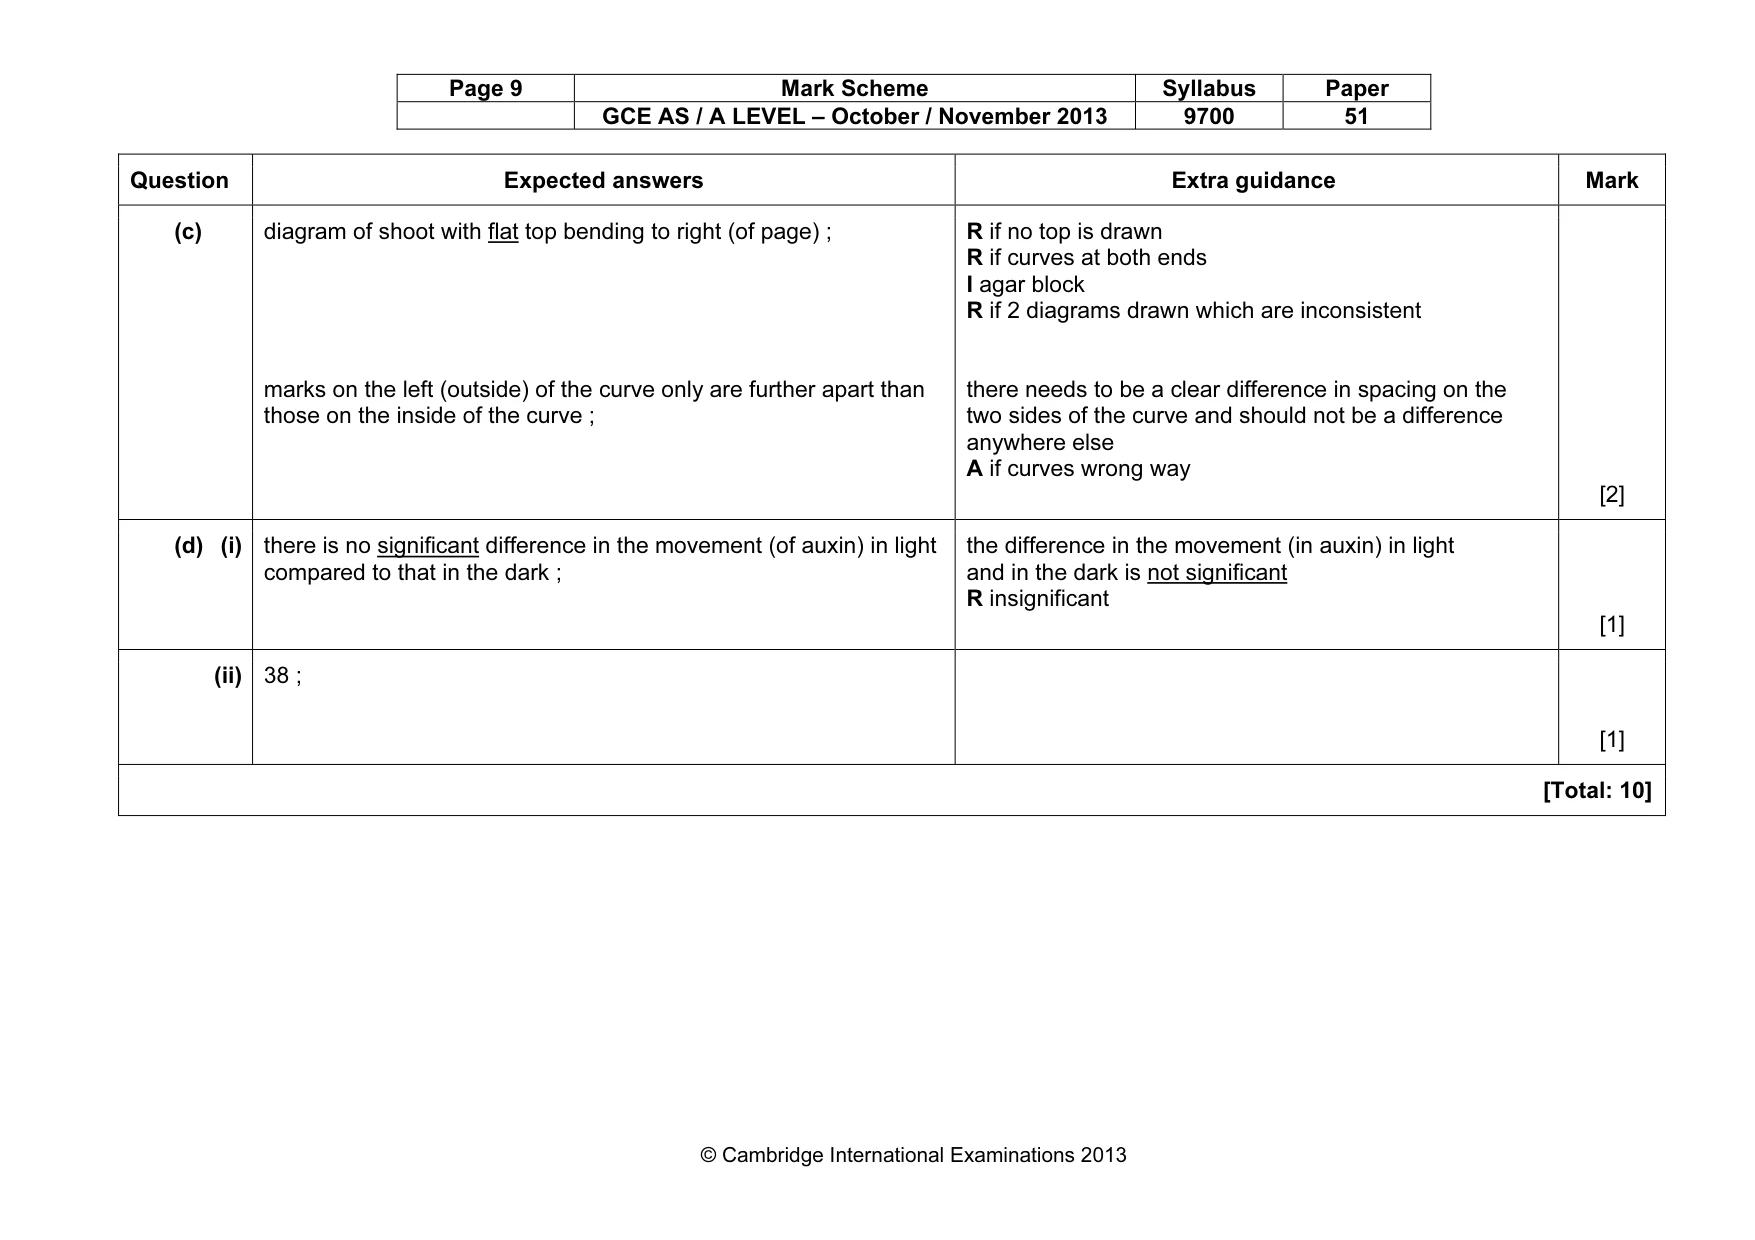
Page 9 Mark Scheme Syllabus Paper GCE AS / A LEVEL – October / November 2013 9700 51 © Cambridge International Examinations 2013 Question Expected answers Extra guidance Mark (c) diagram of shoot with flat top bending to right (of page) ; marks on the left (outside) of the curve only are further apart than those on the inside of the curve ; R if no top is drawn R if curves at both ends I agar block R if 2 diagrams drawn which are inconsistent there needs to be a clear difference in spacing on the two sides of the curve and should not be a difference anywhere else A if curves wrong way [2] (d) (i) there is no significant difference in the movement (of auxin) in light compared to that in the dark ; the difference in the movement (in auxin) in light and in the dark is not significant R insignificant [1] (ii) 38 ; [1] [Total: 10]
What you needed in this session
Cambridge’s own grade thresholds for 2013 Oct/Nov, Paper 5 · Variant 1. A higher threshold means an easier paper — the bar moves with how the cohort did.