Cambridge A Level Biology 9700 — 2012 May/June Paper 3 · Variant 1
9700/31/M/J/12 · 40 marks · ≈45 min
The question paper and its mark scheme, free to read here and free to download. This is Cambridge’s own paper, exactly as it was sat.
Question paper12 pages
Mark scheme9 pages
Answers below. Sit the paper first if you are practising.
Paper as text
Question paper, page 1
This document consists of 9 printed pages and 3 blank pages. DC (LEO/CGW) 37140/6 © UCLES 2012 [Turn over UNIVERSITY OF CAMBRIDGE INTERNATIONAL EXAMINATIONS General Certificate of Education Advanced Subsidiary Level and Advanced Level READ THESE INSTRUCTIONS FIRST Write your Centre number, candidate number and name on all the work you hand in. Write in dark blue or black ink. You may use a pencil for any diagrams, graphs or rough working. Do not use red ink, staples, paper clips, highlighters, glue or correction fluid. DO NOT WRITE IN ANY BARCODES. Answer all questions. You may lose marks if you do not show your working or if you do not use appropriate units. At the end of the examination, fasten all your work securely together. The number of marks is given in brackets [ ] at the end of each question or part question. * 8 3 7 6 7 2 9 6 7 3 * BIOLOGY 9700/31 Advanced Practical Skills 1 May/June 2012 2 hours Candidates answer on the Question Paper. Additional Materials: As listed in the Confidential Instructions. For Examiner’s Use 1 2 Total
Question paper, page 2
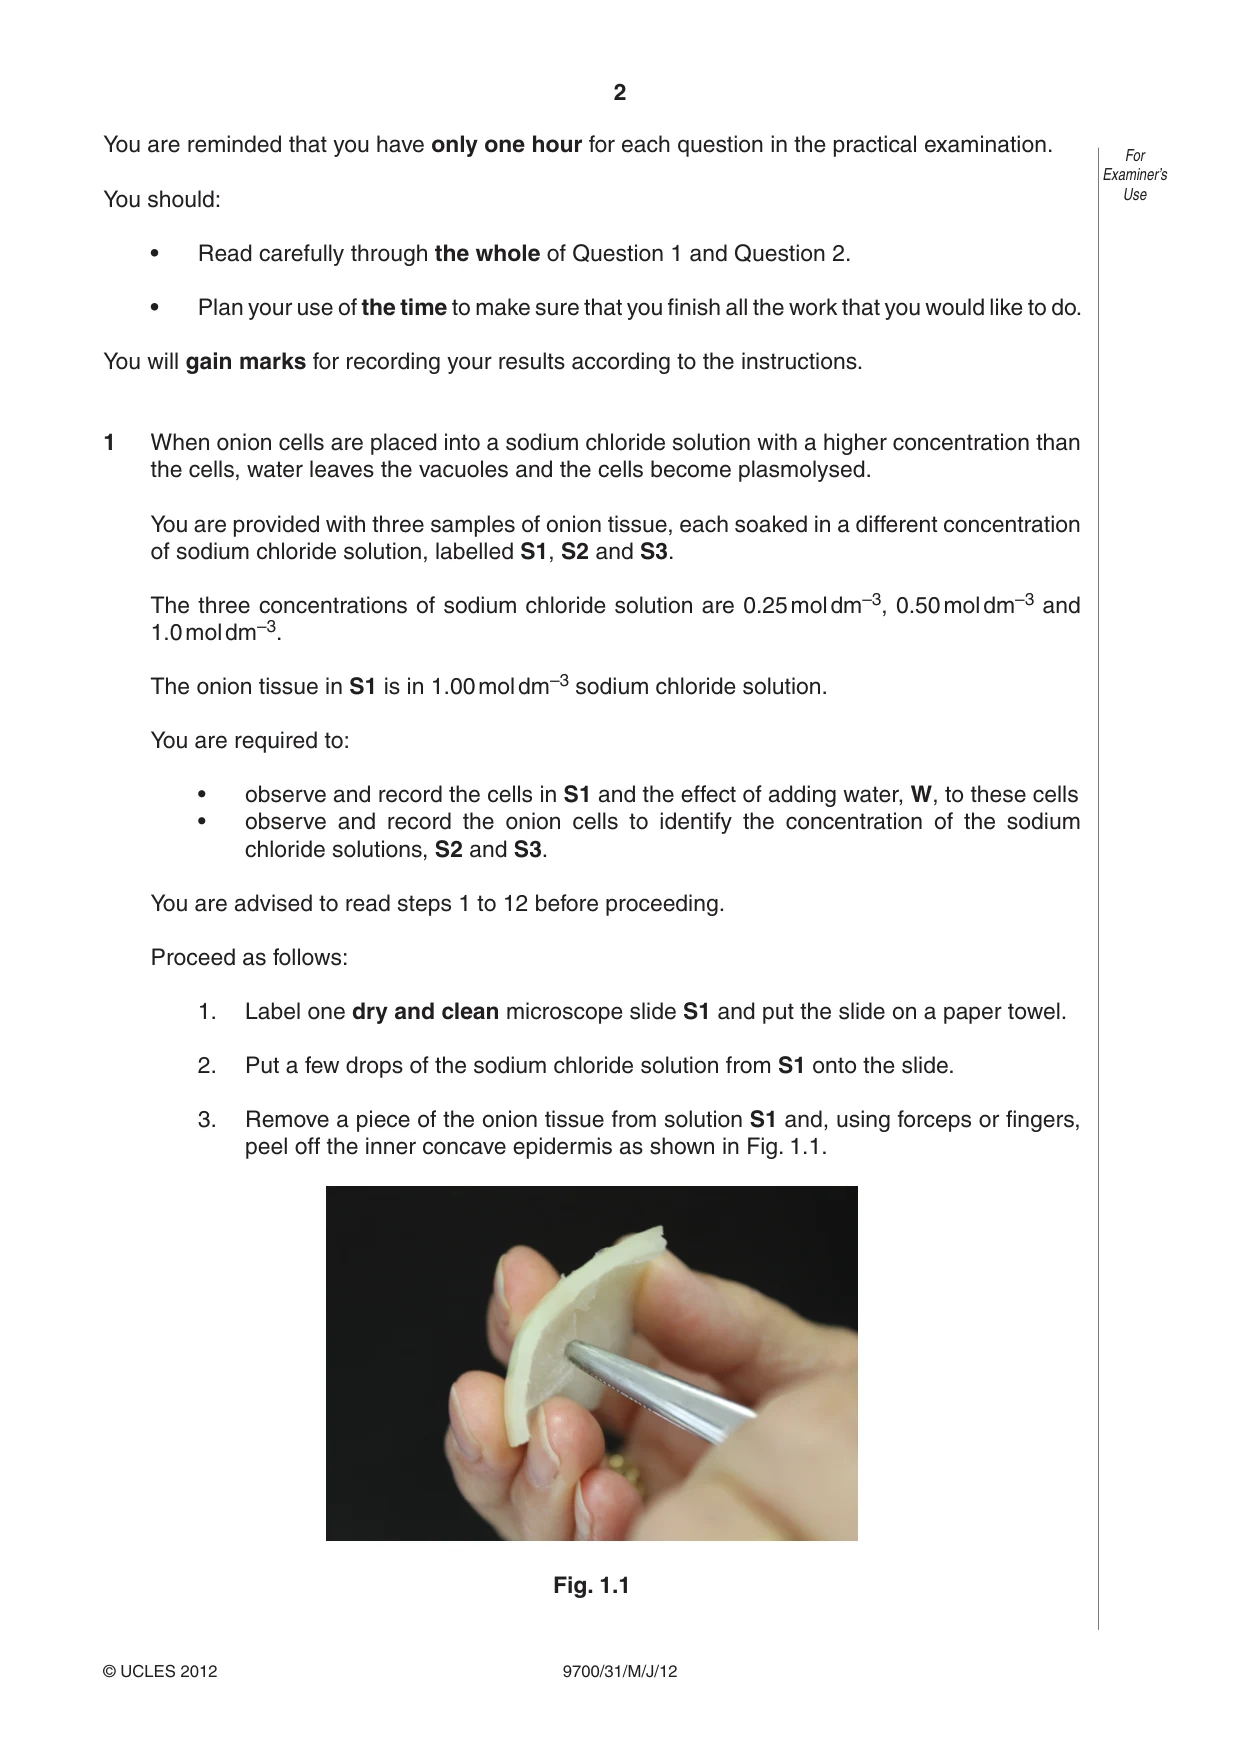
2 9700/31/M/J/12 © UCLES 2012 For Examiner’s Use You are reminded that you have only one hour for each question in the practical examination. You should: • Read carefully through the whole of Question 1 and Question 2. • Plan your use of the time to make sure that you finish all the work that you would like to do. You will gain marks for recording your results according to the instructions. 1 When onion cells are placed into a sodium chloride solution with a higher concentration than the cells, water leaves the vacuoles and the cells become plasmolysed. You are provided with three samples of onion tissue, each soaked in a different concentration of sodium chloride solution, labelled S1, S2 and S3. The three concentrations of sodium chloride solution are 0.25 mol dm–3, 0.50 mol dm–3 and 1.0 mol dm–3. The onion tissue in S1 is in 1.00 mol dm–3 sodium chloride solution. You are required to: • observe and record the cells in S1 and the effect of adding water, W, to these cells • observe and record the onion cells to identify the concentration of the sodium chloride solutions, S2 and S3. You are advised to read steps 1 to 12 before proceeding. Proceed as follows: 1. Label one dry and clean microscope slide S1 and put the slide on a paper towel. 2. Put a few drops of the sodium chloride solution from S1 onto the slide. 3. Remove a piece of the onion tissue from solution S1 and, using forceps or fingers, peel off the inner concave epidermis as shown in Fig. 1.1. Fig. 1.1
Question paper, page 3
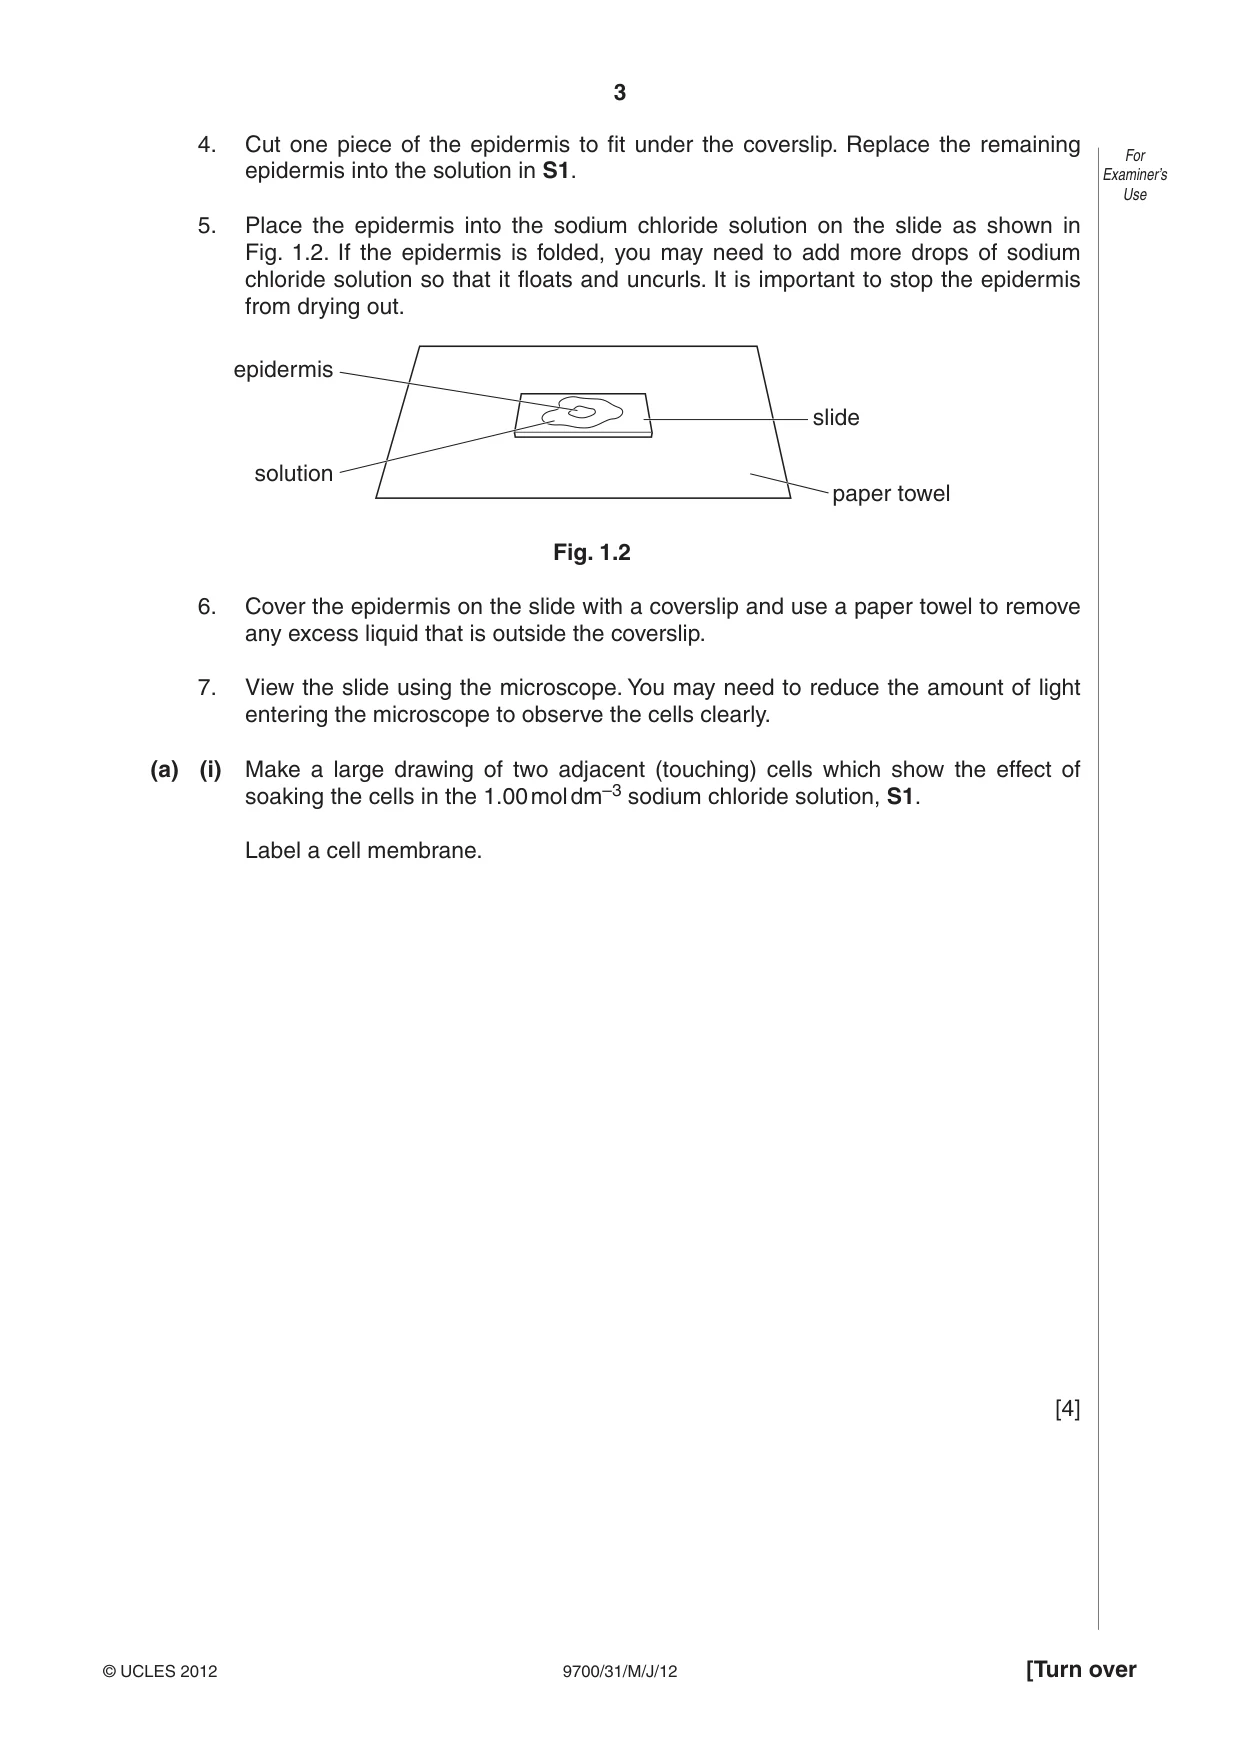
3 9700/31/M/J/12 © UCLES 2012 [Turn over For Examiner’s Use 4. Cut one piece of the epidermis to fit under the coverslip. Replace the remaining epidermis into the solution in S1. 5. Place the epidermis into the sodium chloride solution on the slide as shown in Fig. 1.2. If the epidermis is folded, you may need to add more drops of sodium chloride solution so that it floats and uncurls. It is important to stop the epidermis from drying out. epidermis solution slide paper towel Fig. 1.2 6. Cover the epidermis on the slide with a coverslip and use a paper towel to remove any excess liquid that is outside the coverslip. 7. View the slide using the microscope. You may need to reduce the amount of light entering the microscope to observe the cells clearly. (a) (i) Make a large drawing of two adjacent (touching) cells which show the effect of soaking the cells in the 1.00 mol dm–3 sodium chloride solution, S1. Label a cell membrane. [4]
Question paper, page 4
4 9700/31/M/J/12 © UCLES 2012 For Examiner’s Use (ii) Describe how you will obtain quantitative results to identify the concentration of the sodium chloride solutions, S2 and S3, compared with S1. … … … … … [2] (b) (i) Prepare the space below to record your quantitative results as you have described in (a)(ii). [5] 8. Record the result for S1. 9. Take the slide off the microscope and remove the coverslip. 10. Remove as much of the 1.00 mol dm–3 sodium chloride solution as you can and put a few drops of W onto the epidermis. Replace the coverslip and leave the slide until step 12. 11. Repeat steps 1 to 8 with S2 and S3 (note: you do not need to repeat (a)(i)).
Question paper, page 5
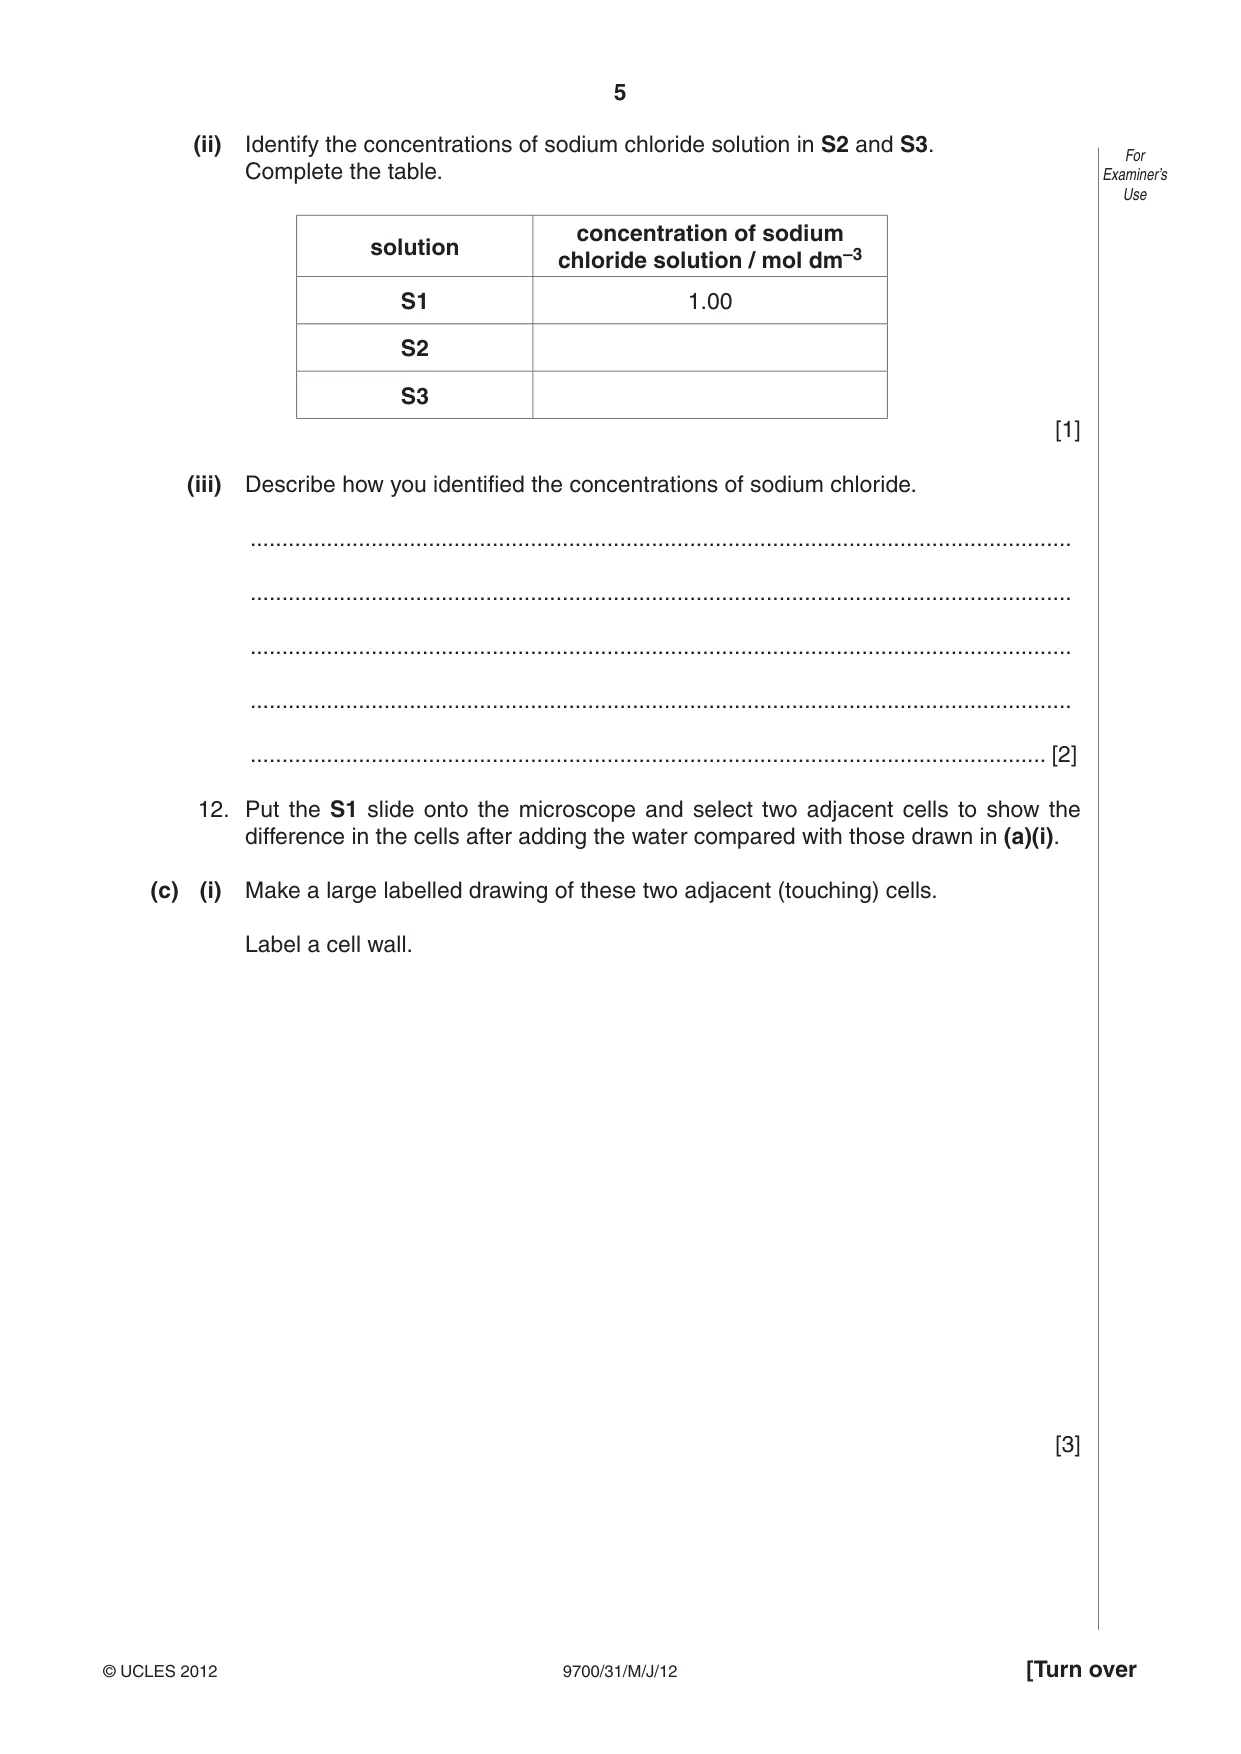
5 9700/31/M/J/12 © UCLES 2012 [Turn over For Examiner’s Use (ii) Identify the concentrations of sodium chloride solution in S2 and S3. Complete the table. solution concentration of sodium chloride solution / mol dm–3 S1 1.00 S2 S3 [1] (iii) Describe how you identified the concentrations of sodium chloride. … … … … … [2] 12. Put the S1 slide onto the microscope and select two adjacent cells to show the difference in the cells after adding the water compared with those drawn in (a)(i). (c) (i) Make a large labelled drawing of these two adjacent (touching) cells. Label a cell wall. [3]
Question paper, page 6
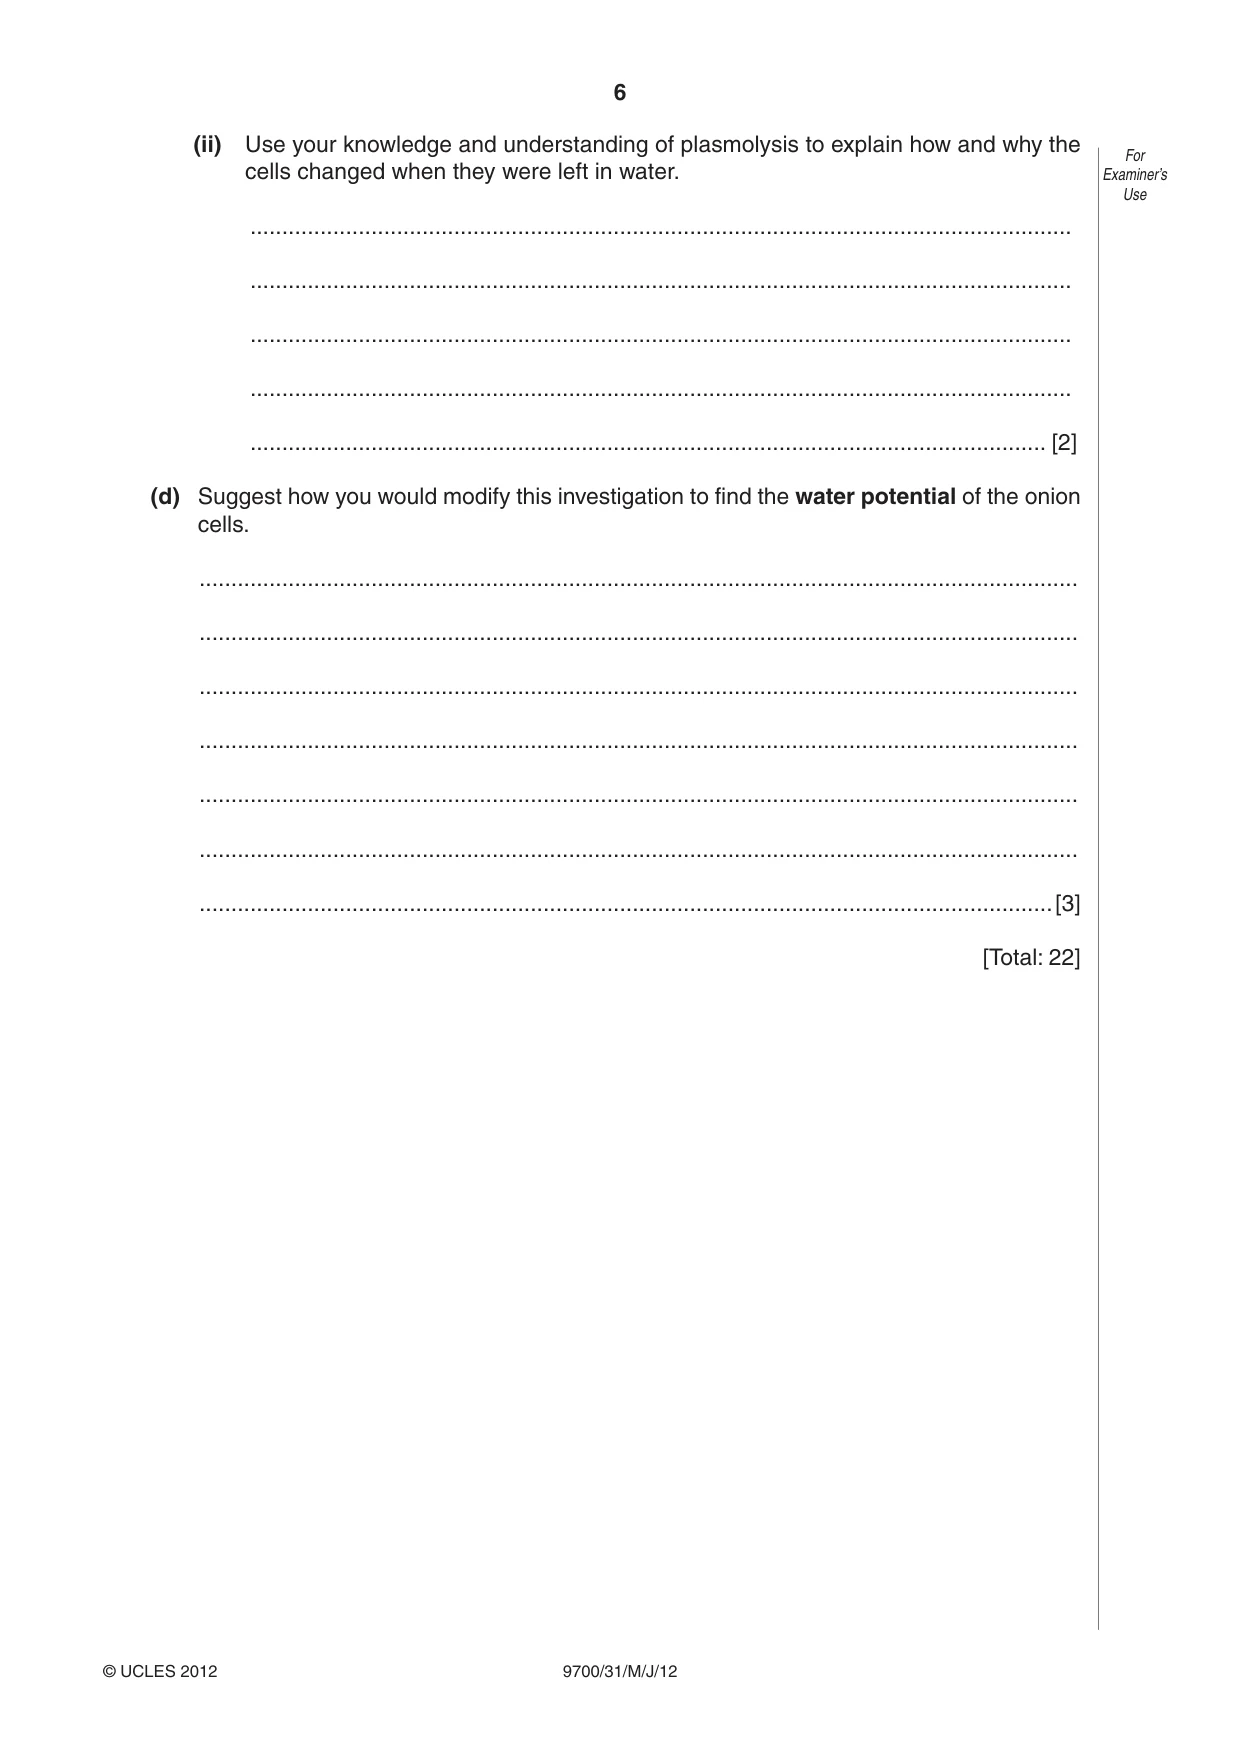
6 9700/31/M/J/12 © UCLES 2012 For Examiner’s Use (ii) Use your knowledge and understanding of plasmolysis to explain how and why the cells changed when they were left in water. … … … … … [2] (d) Suggest how you would modify this investigation to find the water potential of the onion cells. … … … … … … …[3] [Total: 22]
Question paper, page 7
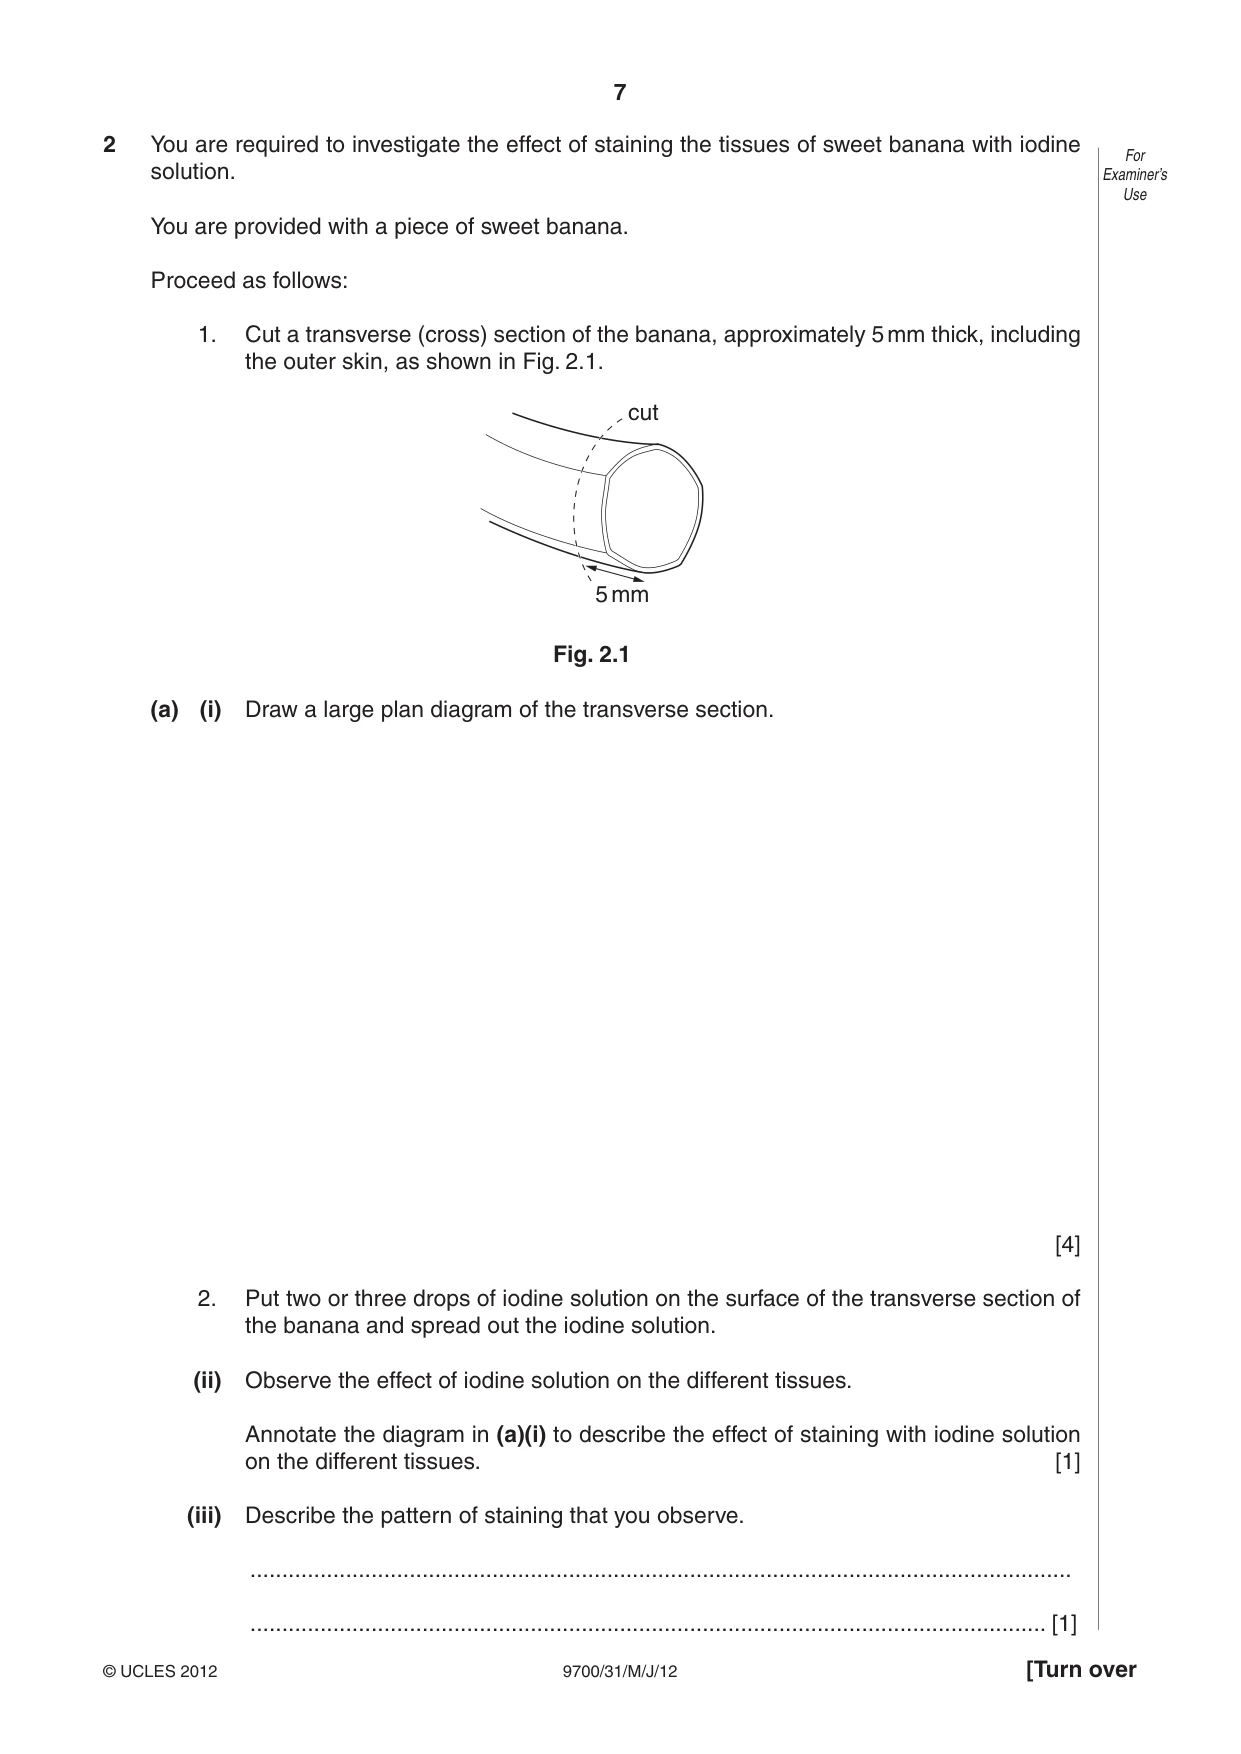
7 9700/31/M/J/12 © UCLES 2012 [Turn over For Examiner’s Use 2 You are required to investigate the effect of staining the tissues of sweet banana with iodine solution. You are provided with a piece of sweet banana. Proceed as follows: 1. Cut a transverse (cross) section of the banana, approximately 5 mm thick, including the outer skin, as shown in Fig. 2.1. cut 5 mm Fig. 2.1 (a) (i) Draw a large plan diagram of the transverse section. [4] 2. Put two or three drops of iodine solution on the surface of the transverse section of the banana and spread out the iodine solution. (ii) Observe the effect of iodine solution on the different tissues. Annotate the diagram in (a)(i) to describe the effect of staining with iodine solution on the different tissues. [1] (iii) Describe the pattern of staining that you observe. … … [1]
Question paper, page 8
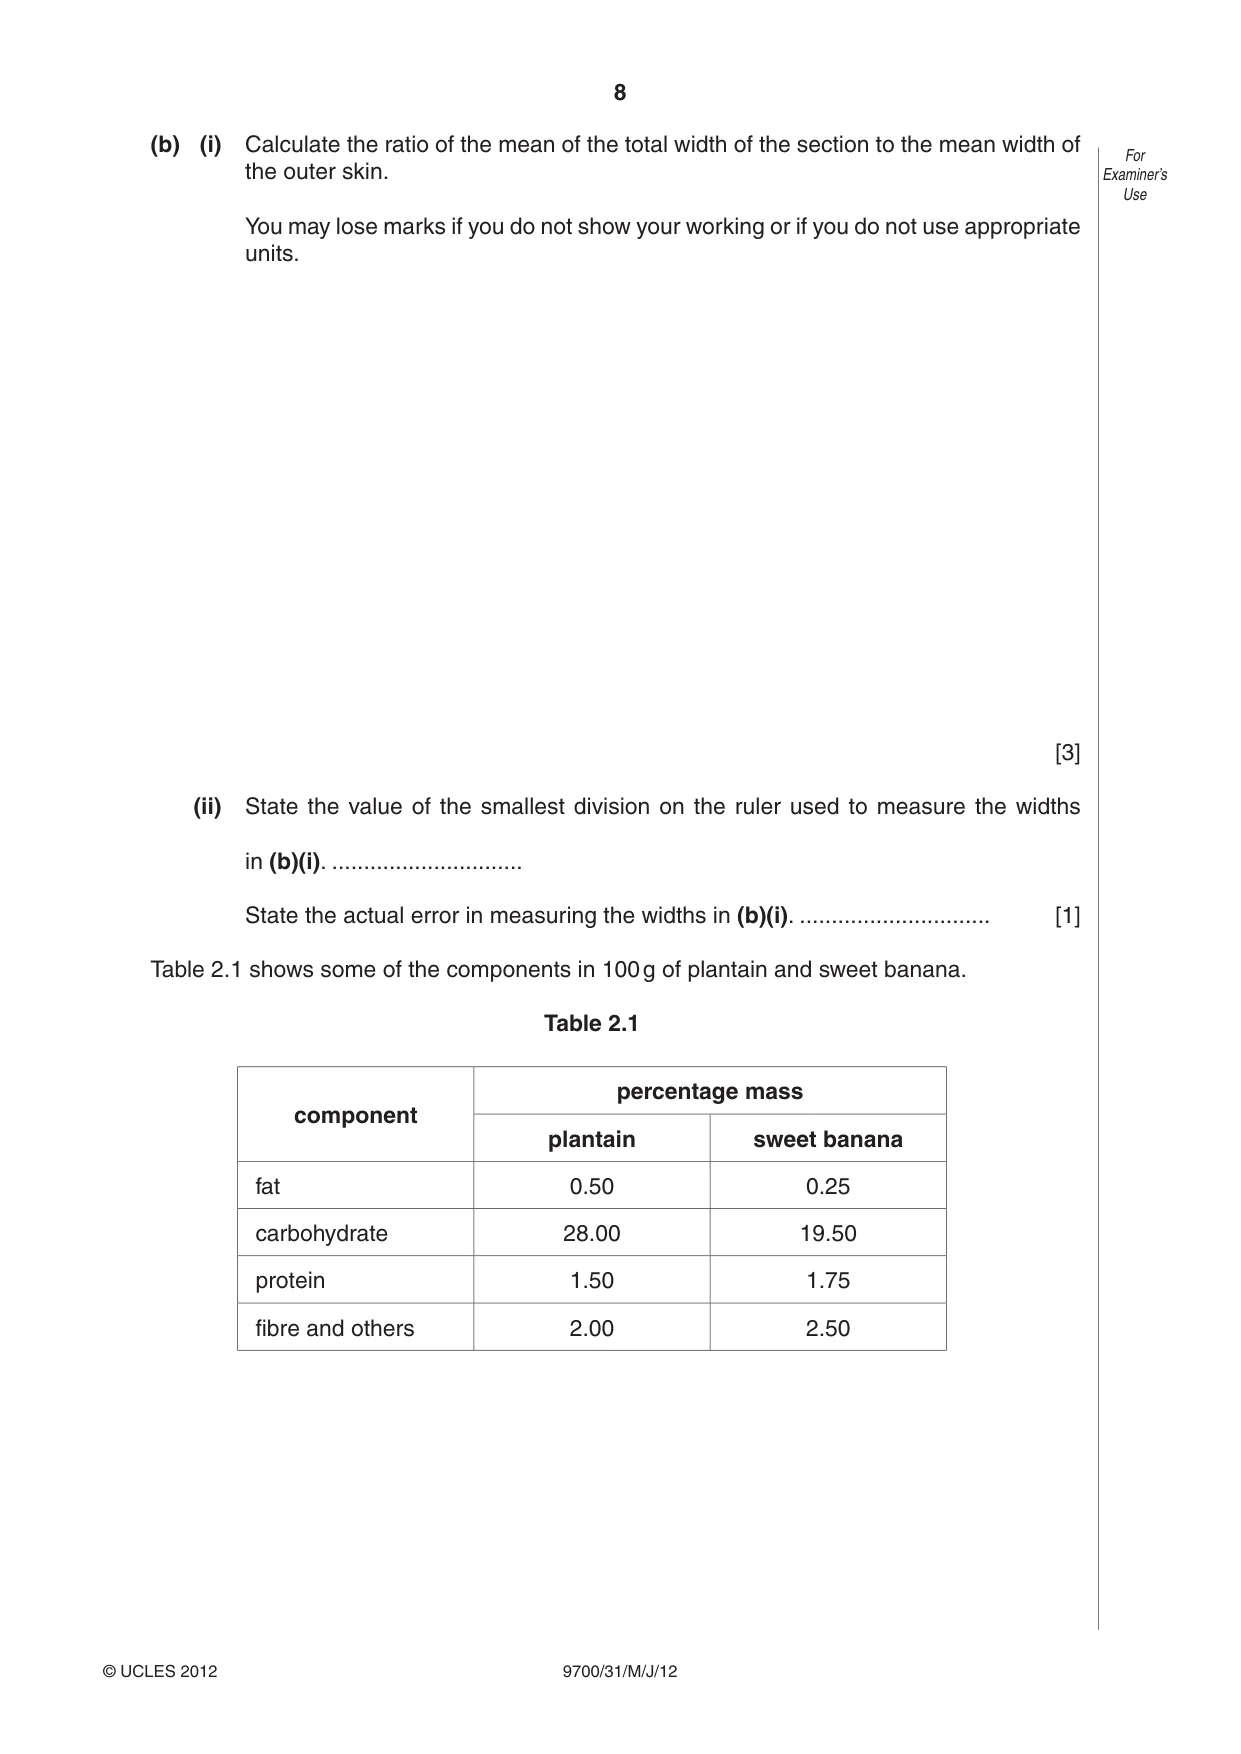
8 9700/31/M/J/12 © UCLES 2012 For Examiner’s Use (b) (i) Calculate the ratio of the mean of the total width of the section to the mean width of the outer skin. You may lose marks if you do not show your working or if you do not use appropriate units. [3] (ii) State the value of the smallest division on the ruler used to measure the widths in (b)(i). … State the actual error in measuring the widths in (b)(i). … [1] Table 2.1 shows some of the components in 100 g of plantain and sweet banana. Table 2.1 component percentage mass plantain sweet banana fat 0.50 0.25 carbohydrate 28.00 19.50 protein 1.50 1.75 fibre and others 2.00 2.50
Question paper, page 9
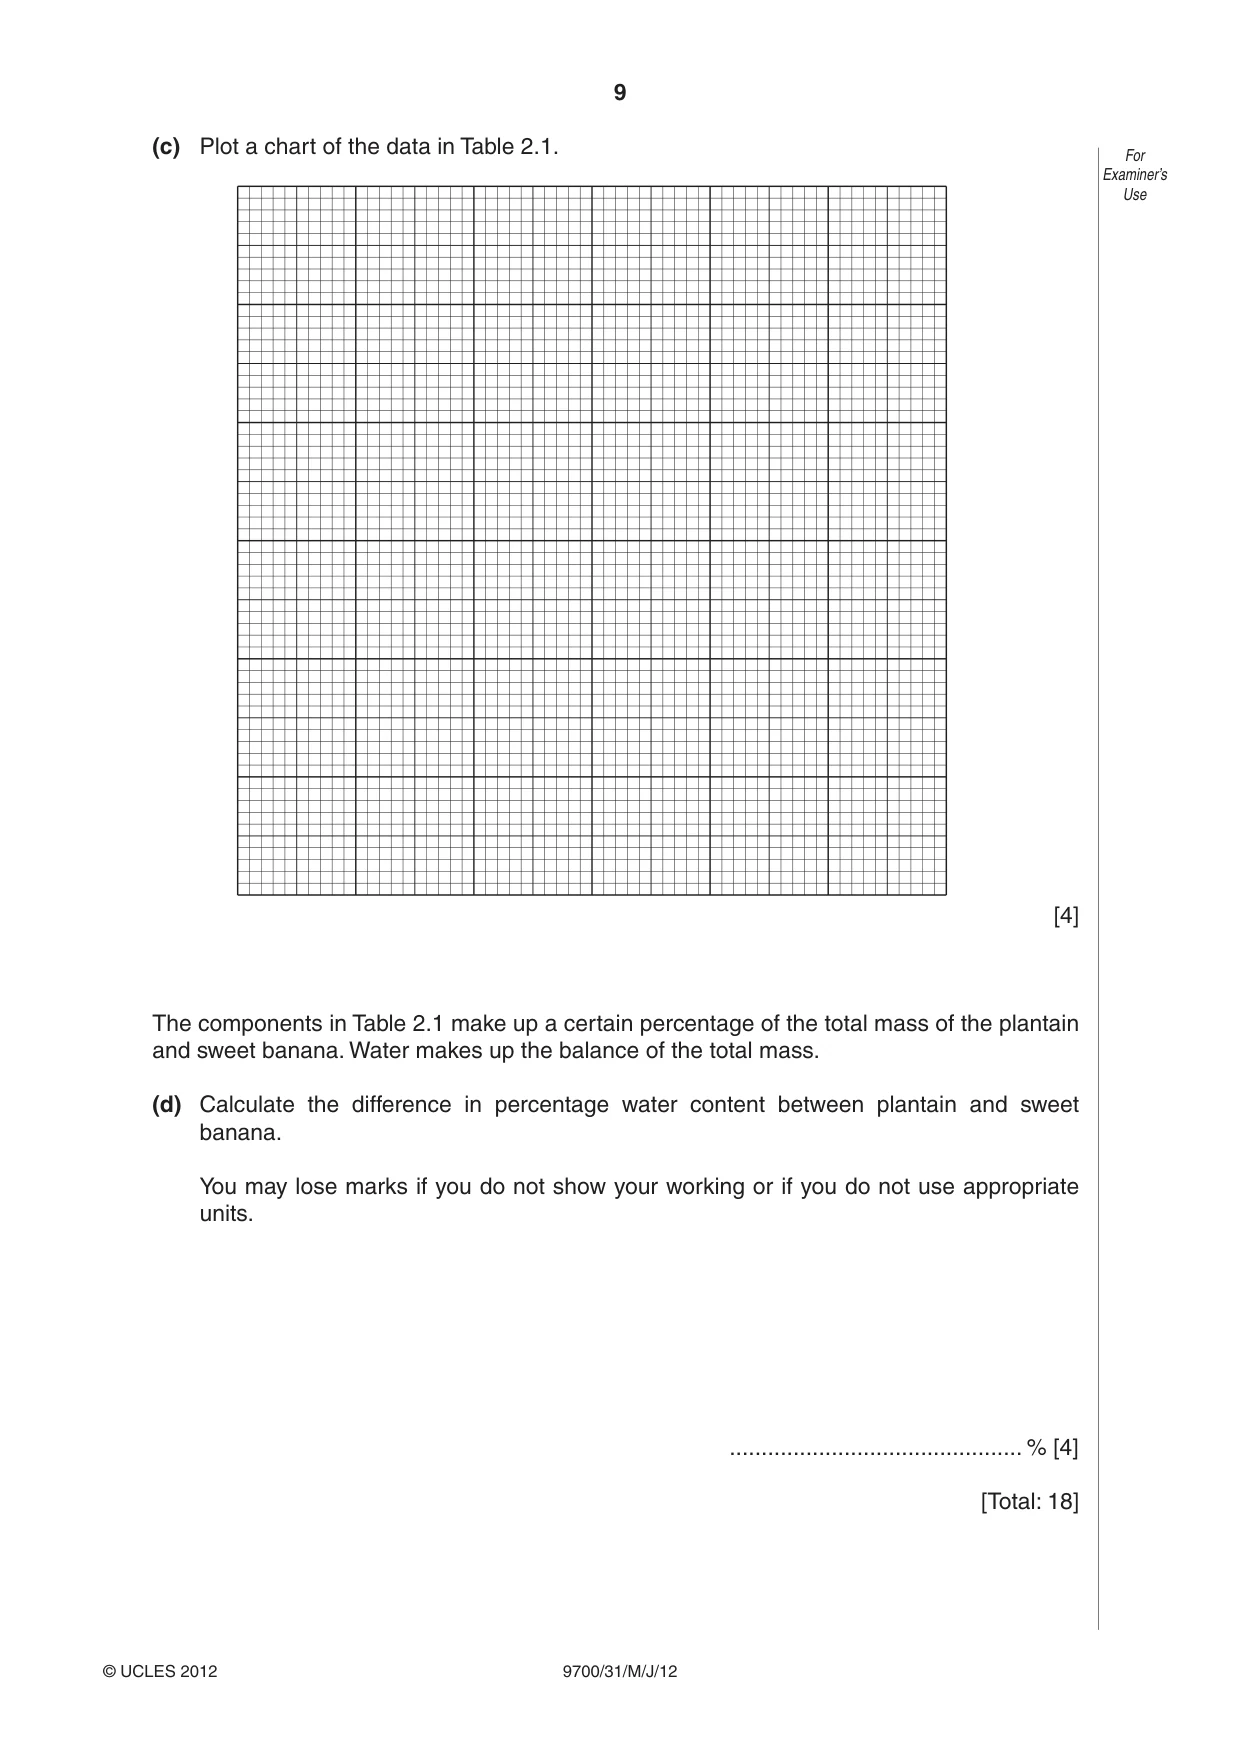
9 9700/31/M/J/12 © UCLES 2012 For Examiner’s Use (c) Plot a chart of the data in Table 2.1. [4] The components in Table 2.1 make up a certain percentage of the total mass of the plantain and sweet banana. Water makes up the balance of the total mass. (d) Calculate the difference in percentage water content between plantain and sweet banana. You may lose marks if you do not show your working or if you do not use appropriate units. … % [4] [Total: 18]
Question paper, page 10
10 9700/31/M/J/12 © UCLES 2012 BLANK PAGE
Question paper, page 11
11 9700/31/M/J/12 © UCLES 2012 BLANK PAGE
Question paper, page 12
12 9700/31/M/J/12 © UCLES 2012 BLANK PAGE Permission to reproduce items where third-party owned material protected by copyright is included has been sought and cleared where possible. Every reasonable effort has been made by the publisher (UCLES) to trace copyright holders, but if any items requiring clearance have unwittingly been included, the publisher will be pleased to make amends at the earliest possible opportunity. University of Cambridge International Examinations is part of the Cambridge Assessment Group. Cambridge Assessment is the brand name of University of Cambridge Local Examinations Syndicate (UCLES), which is itself a department of the University of Cambridge.
Mark scheme, page 1
UNIVERSITY OF CAMBRIDGE INTERNATIONAL EXAMINATIONS GCE Advanced Subsidiary Level and GCE Advanced Level MARK SCHEME for the May/June 2012 question paper for the guidance of teachers 9700 BIOLOGY 9700/31 Paper 31 (Advanced Practical Skills 1), maximum raw mark 40 This mark scheme is published as an aid to teachers and candidates, to indicate the requirements of the examination. It shows the basis on which Examiners were instructed to award marks. It does not indicate the details of the discussions that took place at an Examiners’ meeting before marking began, which would have considered the acceptability of alternative answers. Mark schemes must be read in conjunction with the question papers and the report on the examination. • Cambridge will not enter into discussions or correspondence in connection with these mark schemes. Cambridge is publishing the mark schemes for the May/June 2012 question papers for most IGCSE, GCE Advanced Level and Advanced Subsidiary Level syllabuses and some Ordinary Level syllabuses.
Mark scheme, page 2
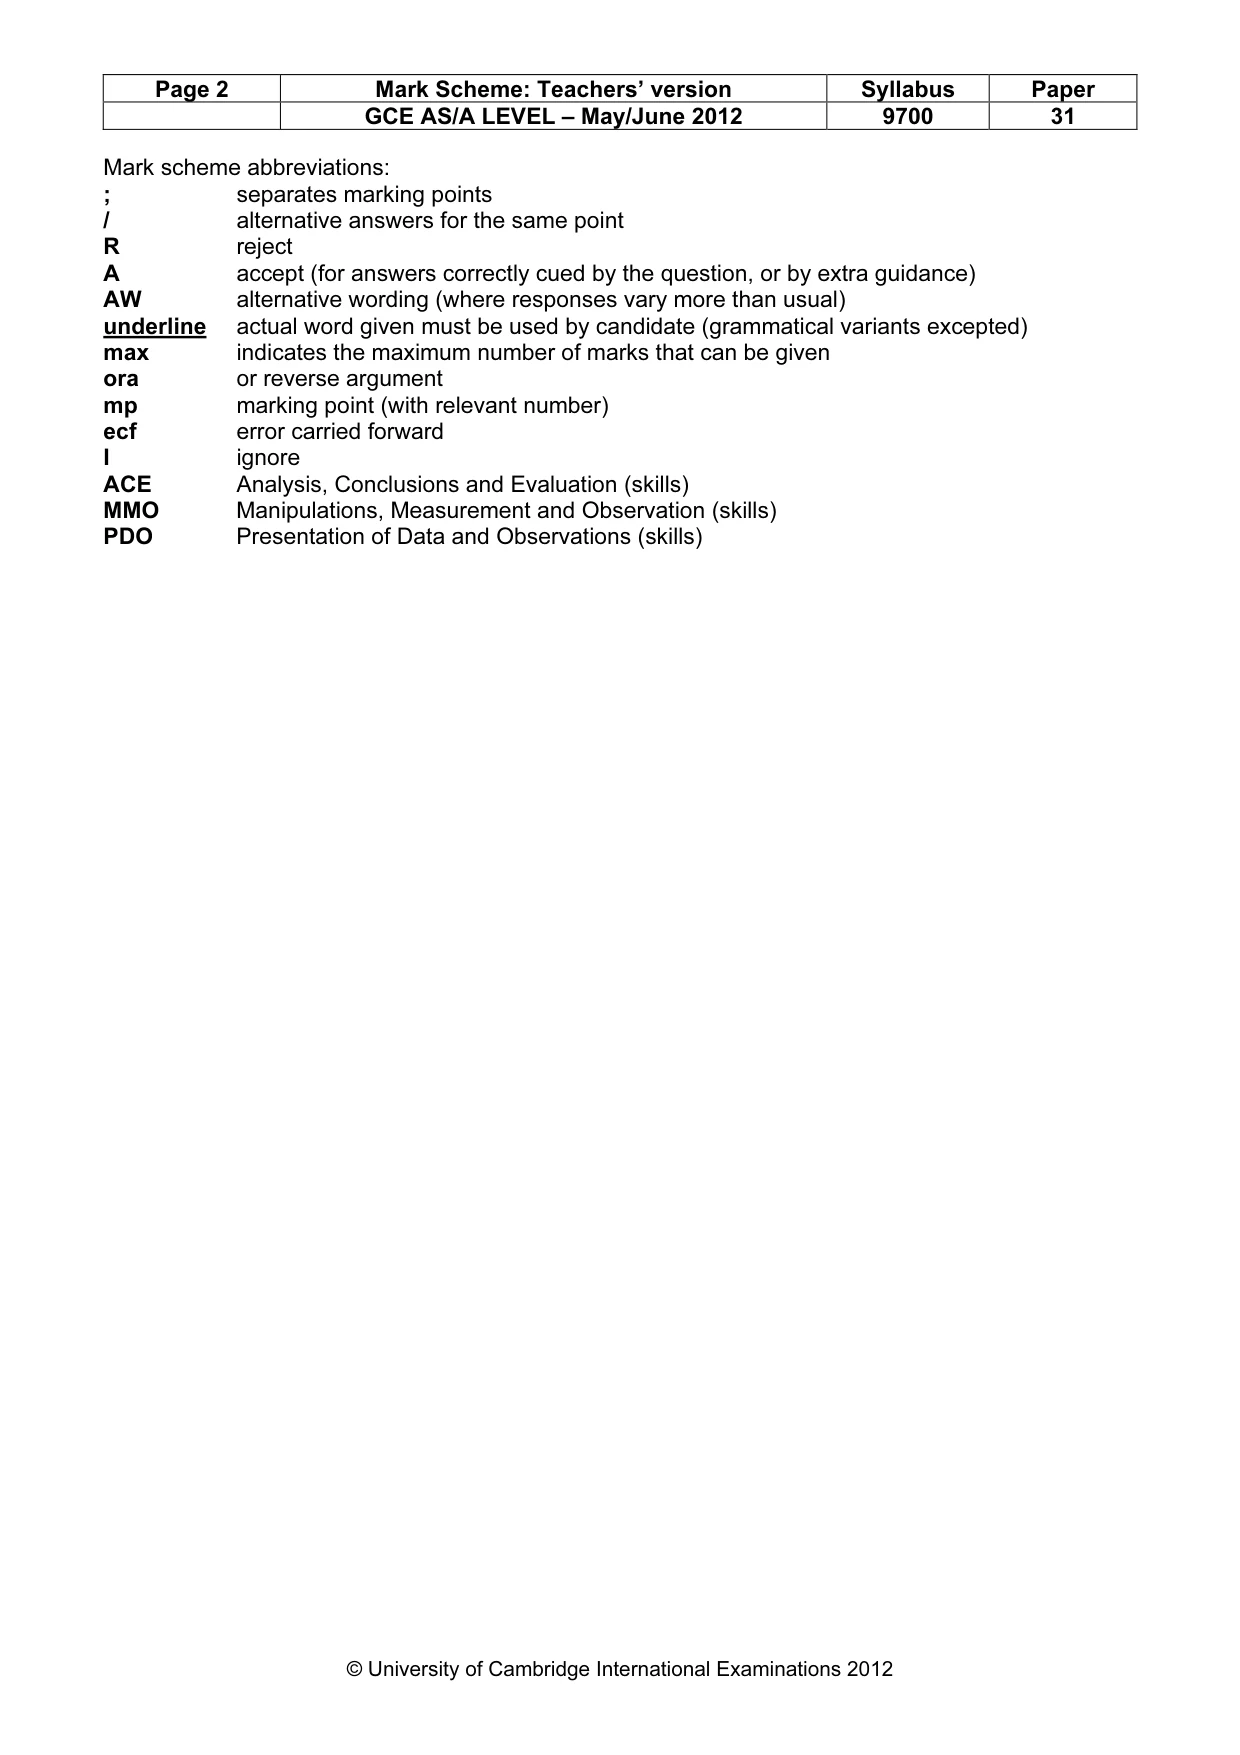
Page 2 Mark Scheme: Teachers’ version Syllabus Paper GCE AS/A LEVEL – May/June 2012 9700 31 © University of Cambridge International Examinations 2012 Mark scheme abbreviations: ; separates marking points / alternative answers for the same point R reject A accept (for answers correctly cued by the question, or by extra guidance) AW alternative wording (where responses vary more than usual) underline actual word given must be used by candidate (grammatical variants excepted) max indicates the maximum number of marks that can be given ora or reverse argument mp marking point (with relevant number) ecf error carried forward I ignore ACE Analysis, Conclusions and Evaluation (skills) MMO Manipulations, Measurement and Observation (skills) PDO Presentation of Data and Observations (skills)
Mark scheme, page 3
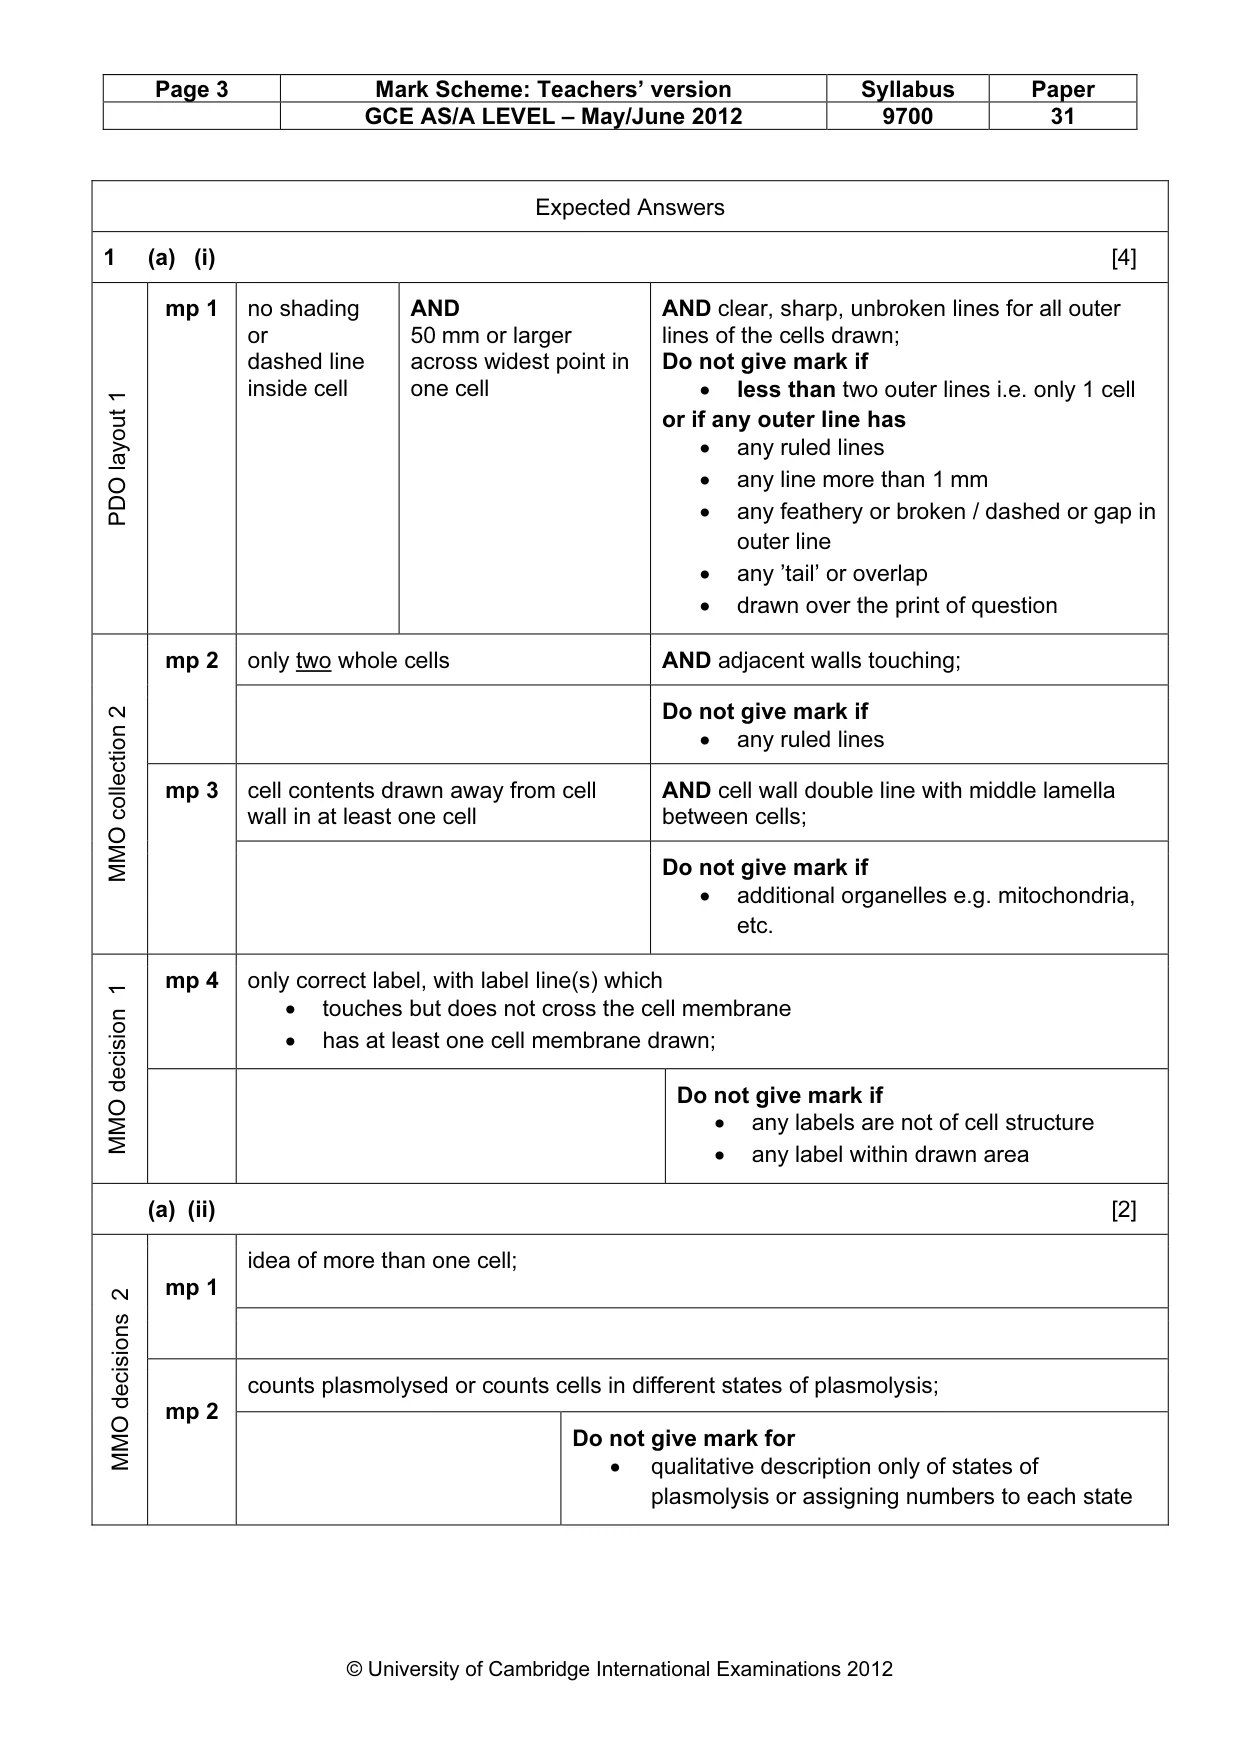
Page 3 Mark Scheme: Teachers’ version Syllabus Paper GCE AS/A LEVEL – May/June 2012 9700 31 © University of Cambridge International Examinations 2012 Expected Answers 1 (a) (i) [4] PDO layout 1 mp 1 no shading or dashed line inside cell AND 50 mm or larger across widest point in one cell AND clear, sharp, unbroken lines for all outer lines of the cells drawn; Do not give mark if • less than two outer lines i.e. only 1 cell or if any outer line has • any ruled lines • any line more than 1 mm • any feathery or broken / dashed or gap in outer line • any ’tail’ or overlap • drawn over the print of question only two whole cells AND adjacent walls touching; mp 2 Do not give mark if • any ruled lines cell contents drawn away from cell wall in at least one cell AND cell wall double line with middle lamella between cells; MMO collection 2 mp 3 Do not give mark if • additional organelles e.g. mitochondria, etc. mp 4 only correct label, with label line(s) which • touches but does not cross the cell membrane • has at least one cell membrane drawn; MMO decision 1 Do not give mark if • any labels are not of cell structure • any label within drawn area (a) (ii) [2] idea of more than one cell; mp 1 counts plasmolysed or counts cells in different states of plasmolysis; MMO decisions 2 mp 2 Do not give mark for • qualitative description only of states of plasmolysis or assigning numbers to each state
Mark scheme, page 4
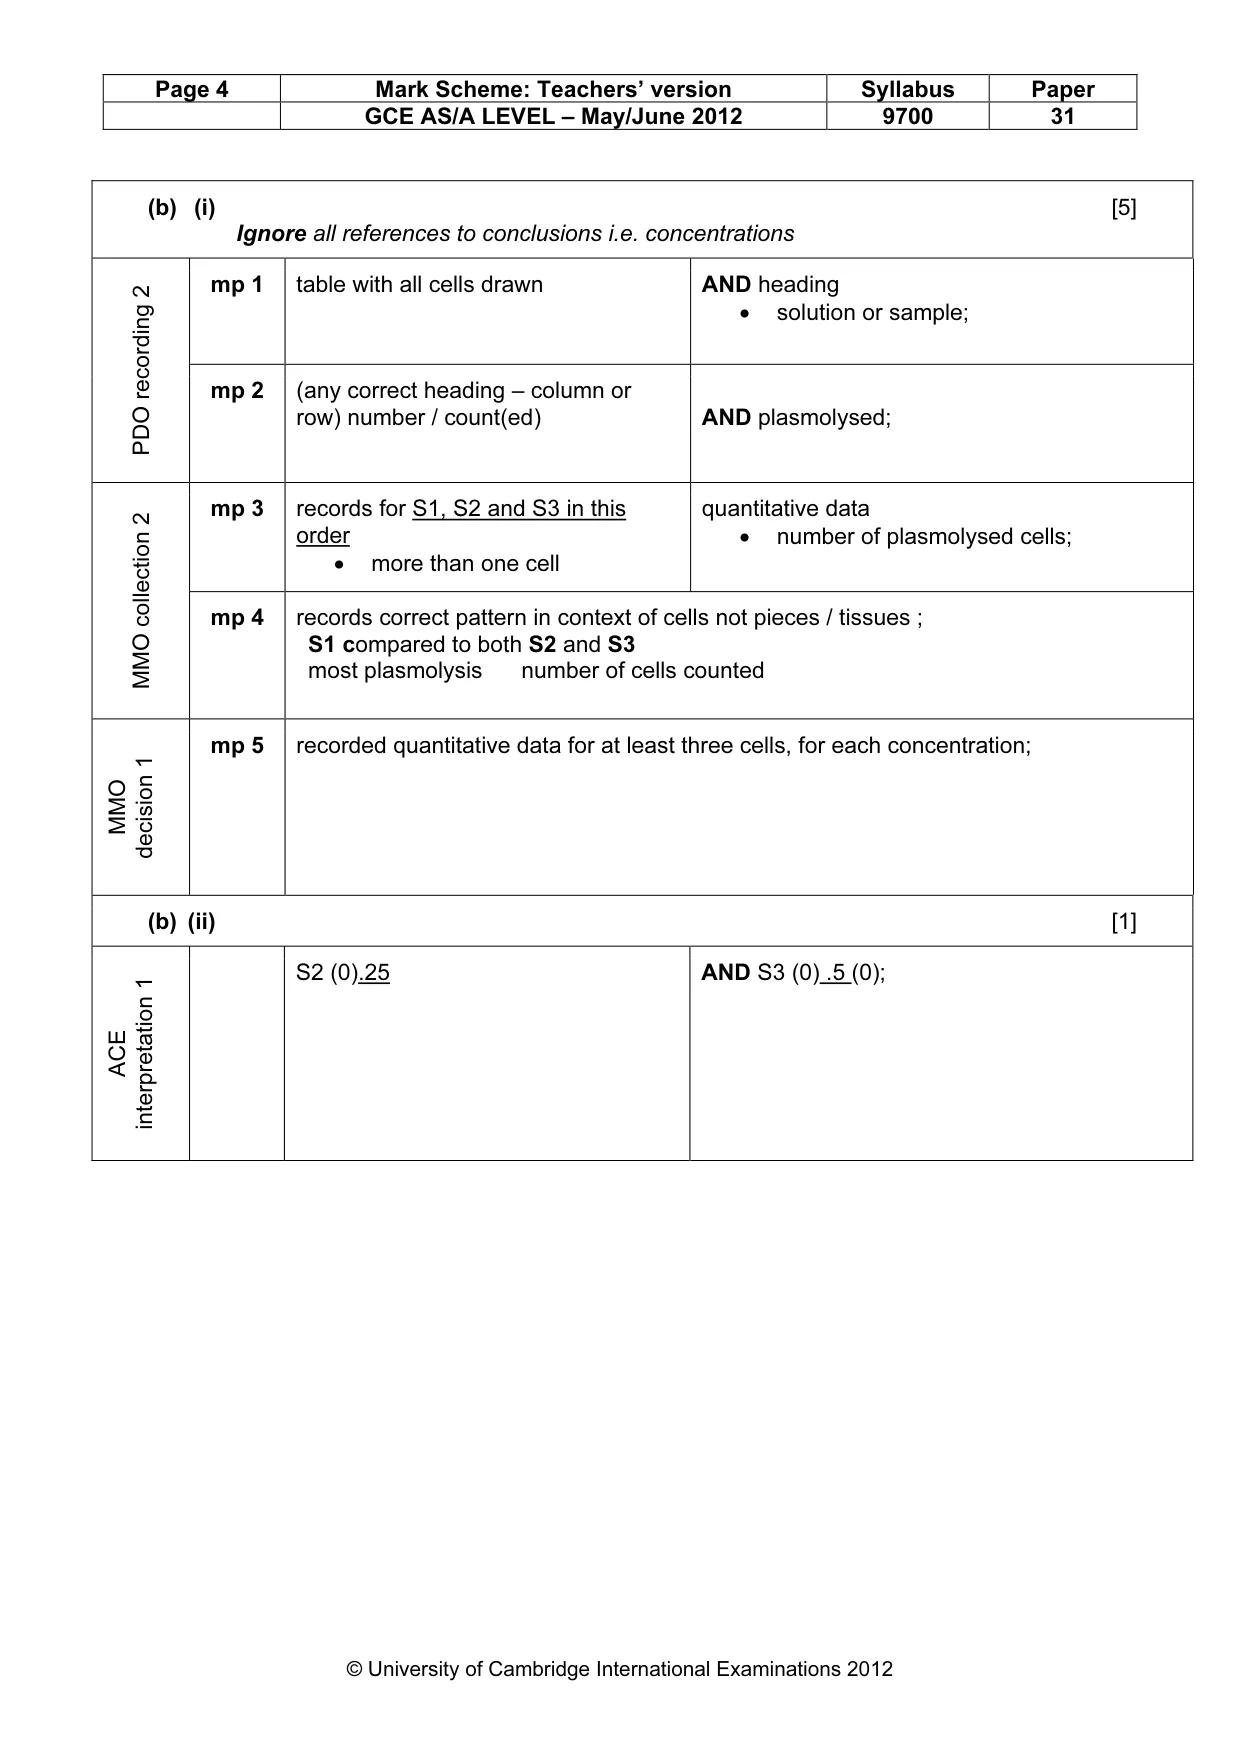
Page 4 Mark Scheme: Teachers’ version Syllabus Paper GCE AS/A LEVEL – May/June 2012 9700 31 © University of Cambridge International Examinations 2012 (b) (i) [5] Ignore all references to conclusions i.e. concentrations mp 1 table with all cells drawn AND heading • solution or sample; PDO recording 2 mp 2 (any correct heading – column or row) number / count(ed) AND plasmolysed; mp 3 records for S1, S2 and S3 in this order • more than one cell quantitative data • number of plasmolysed cells; MMO collection 2 mp 4 records correct pattern in context of cells not pieces / tissues ; S1 compared to both S2 and S3 most plasmolysis number of cells counted MMO decision 1 mp 5 recorded quantitative data for at least three cells, for each concentration; (b) (ii) [1] ACE interpretation 1 S2 (0).25 AND S3 (0) .5 (0);
Mark scheme, page 5
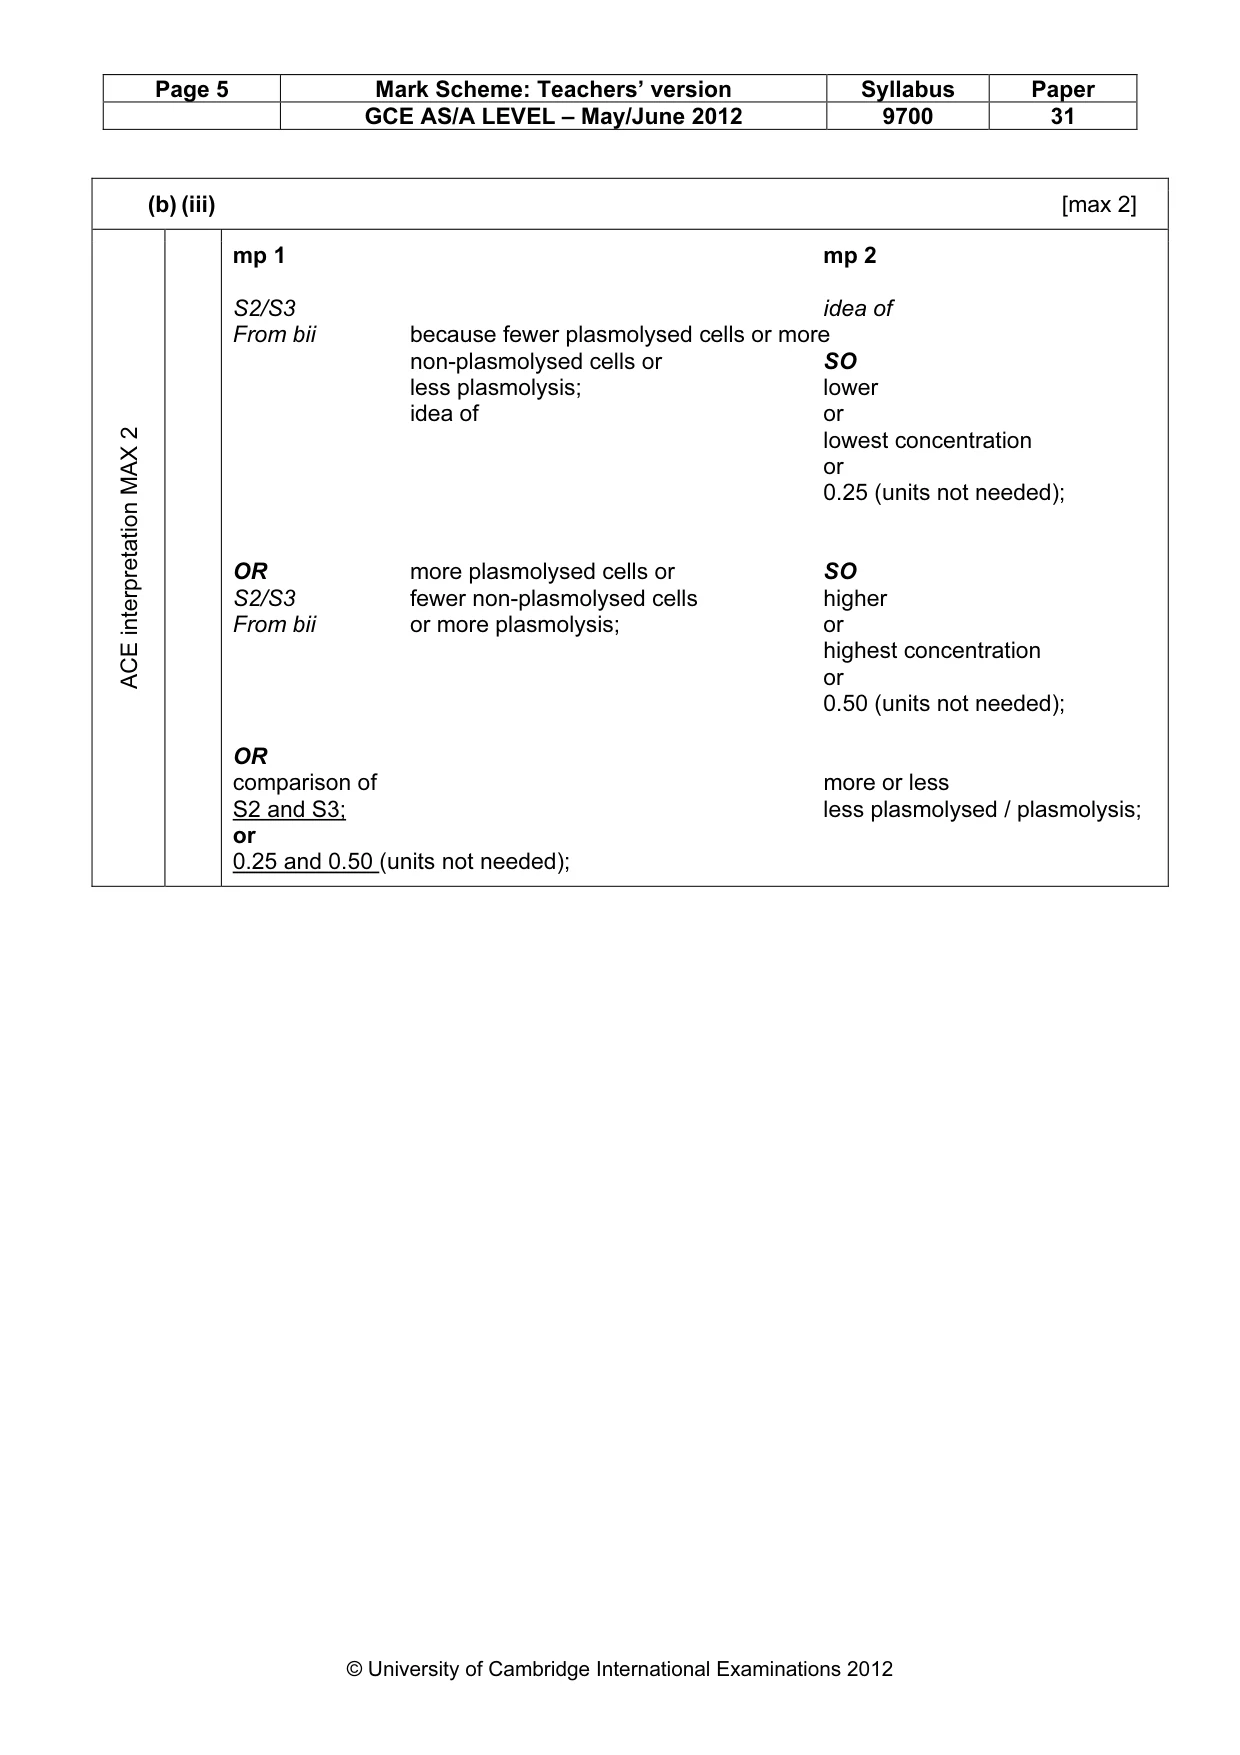
Page 5 Mark Scheme: Teachers’ version Syllabus Paper GCE AS/A LEVEL – May/June 2012 9700 31 © University of Cambridge International Examinations 2012 (b) (iii) [max 2] ACE interpretation MAX 2 mp 1 mp 2 S2/S3 idea of From bii because fewer plasmolysed cells or more non-plasmolysed cells or SO less plasmolysis; lower idea of or lowest concentration or 0.25 (units not needed); OR more plasmolysed cells or SO S2/S3 fewer non-plasmolysed cells higher From bii or more plasmolysis; or highest concentration or 0.50 (units not needed); OR comparison of more or less S2 and S3; less plasmolysed / plasmolysis; or 0.25 and 0.50 (units not needed);
Mark scheme, page 6
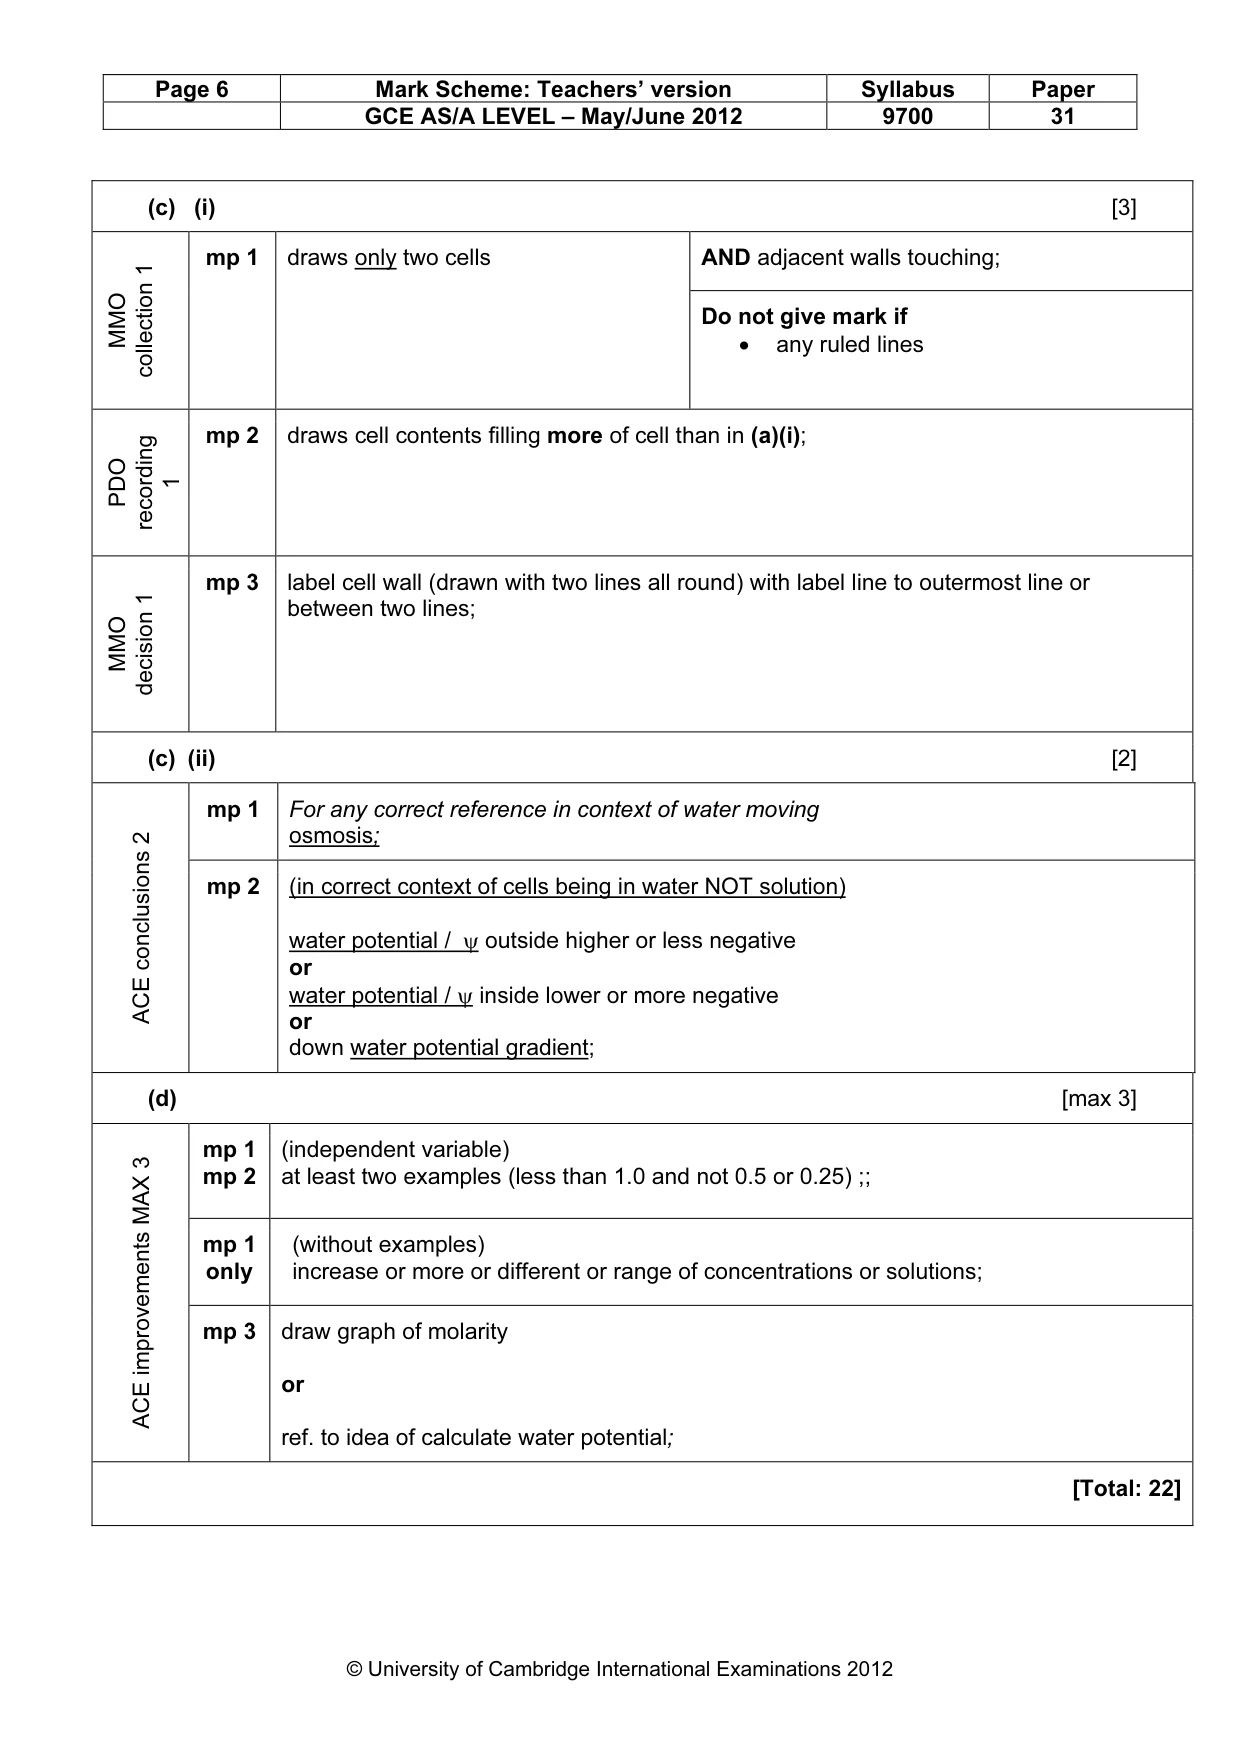
Page 6 Mark Scheme: Teachers’ version Syllabus Paper GCE AS/A LEVEL – May/June 2012 9700 31 © University of Cambridge International Examinations 2012 (c) (i) [3] AND adjacent walls touching; MMO collection 1 mp 1 draws only two cells Do not give mark if • any ruled lines PDO recording 1 mp 2 draws cell contents filling more of cell than in (a)(i); MMO decision 1 mp 3 label cell wall (drawn with two lines all round) with label line to outermost line or between two lines; (c) (ii) [2] mp 1 For any correct reference in context of water moving osmosis; ACE conclusions 2 mp 2 (in correct context of cells being in water NOT solution) water potential / ψ outside higher or less negative or water potential / ψ inside lower or more negative or down water potential gradient; (d) [max 3] mp 1 mp 2 (independent variable) at least two examples (less than 1.0 and not 0.5 or 0.25) ;; mp 1 only (without examples) increase or more or different or range of concentrations or solutions; ACE improvements MAX 3 mp 3 draw graph of molarity or ref. to idea of calculate water potential; [Total: 22]
Mark scheme, page 7
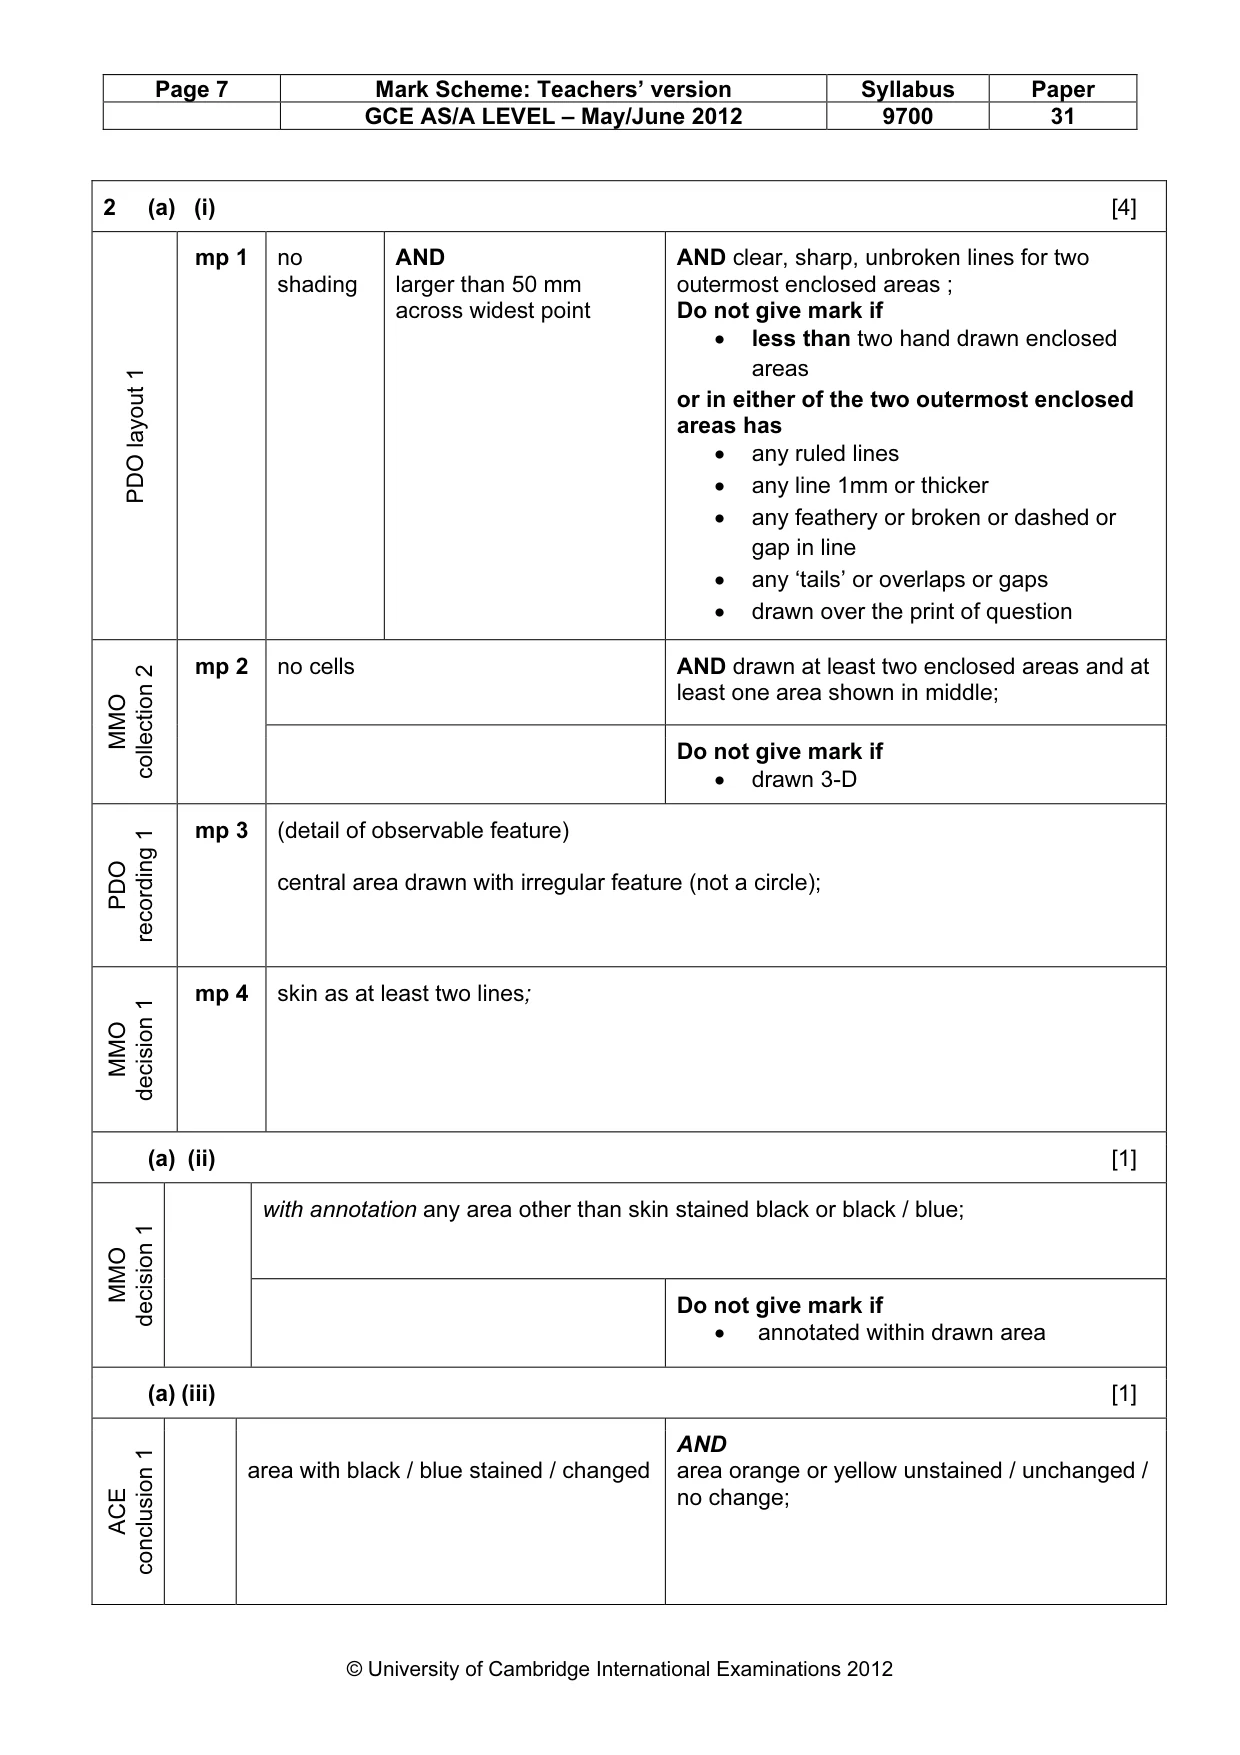
Page 7 Mark Scheme: Teachers’ version Syllabus Paper GCE AS/A LEVEL – May/June 2012 9700 31 © University of Cambridge International Examinations 2012 2 (a) (i) [4] PDO layout 1 mp 1 no shading AND larger than 50 mm across widest point AND clear, sharp, unbroken lines for two outermost enclosed areas ; Do not give mark if • less than two hand drawn enclosed areas or in either of the two outermost enclosed areas has • any ruled lines • any line 1mm or thicker • any feathery or broken or dashed or gap in line • any ‘tails’ or overlaps or gaps • drawn over the print of question no cells AND drawn at least two enclosed areas and at least one area shown in middle; MMO collection 2 mp 2 Do not give mark if • drawn 3-D PDO recording 1 mp 3 (detail of observable feature) central area drawn with irregular feature (not a circle); MMO decision 1 mp 4 skin as at least two lines; (a) (ii) [1] with annotation any area other than skin stained black or black / blue; MMO decision 1 Do not give mark if • annotated within drawn area (a) (iii) [1] ACE conclusion 1 area with black / blue stained / changed AND area orange or yellow unstained / unchanged / no change;
Mark scheme, page 8
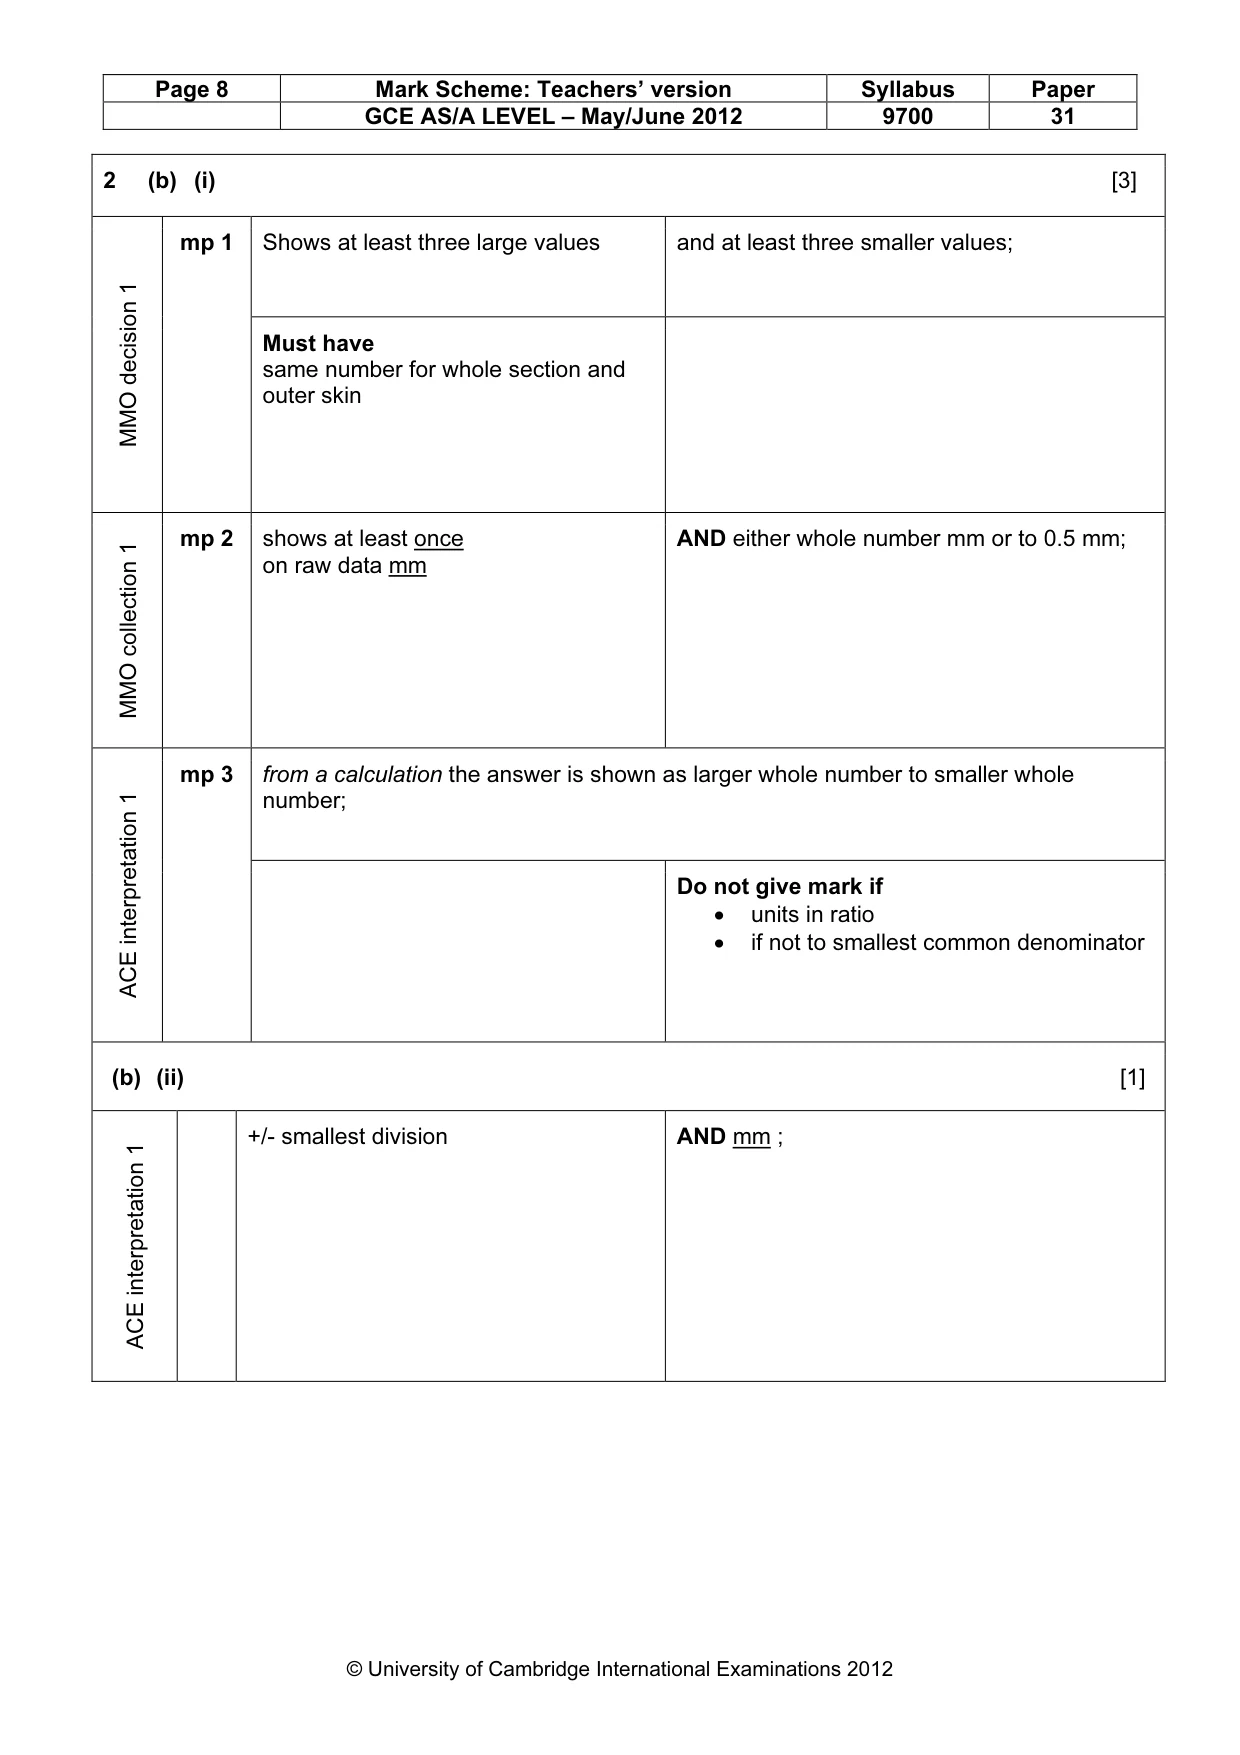
Page 8 Mark Scheme: Teachers’ version Syllabus Paper GCE AS/A LEVEL – May/June 2012 9700 31 © University of Cambridge International Examinations 2012 2 (b) (i) [3] Shows at least three large values and at least three smaller values; MMO decision 1 mp 1 Must have same number for whole section and outer skin MMO collection 1 mp 2 shows at least once on raw data mm AND either whole number mm or to 0.5 mm; from a calculation the answer is shown as larger whole number to smaller whole number; ACE interpretation 1 mp 3 Do not give mark if • units in ratio • if not to smallest common denominator (b) (ii) [1] ACE interpretation 1 +/- smallest division AND mm ;
Mark scheme, page 9
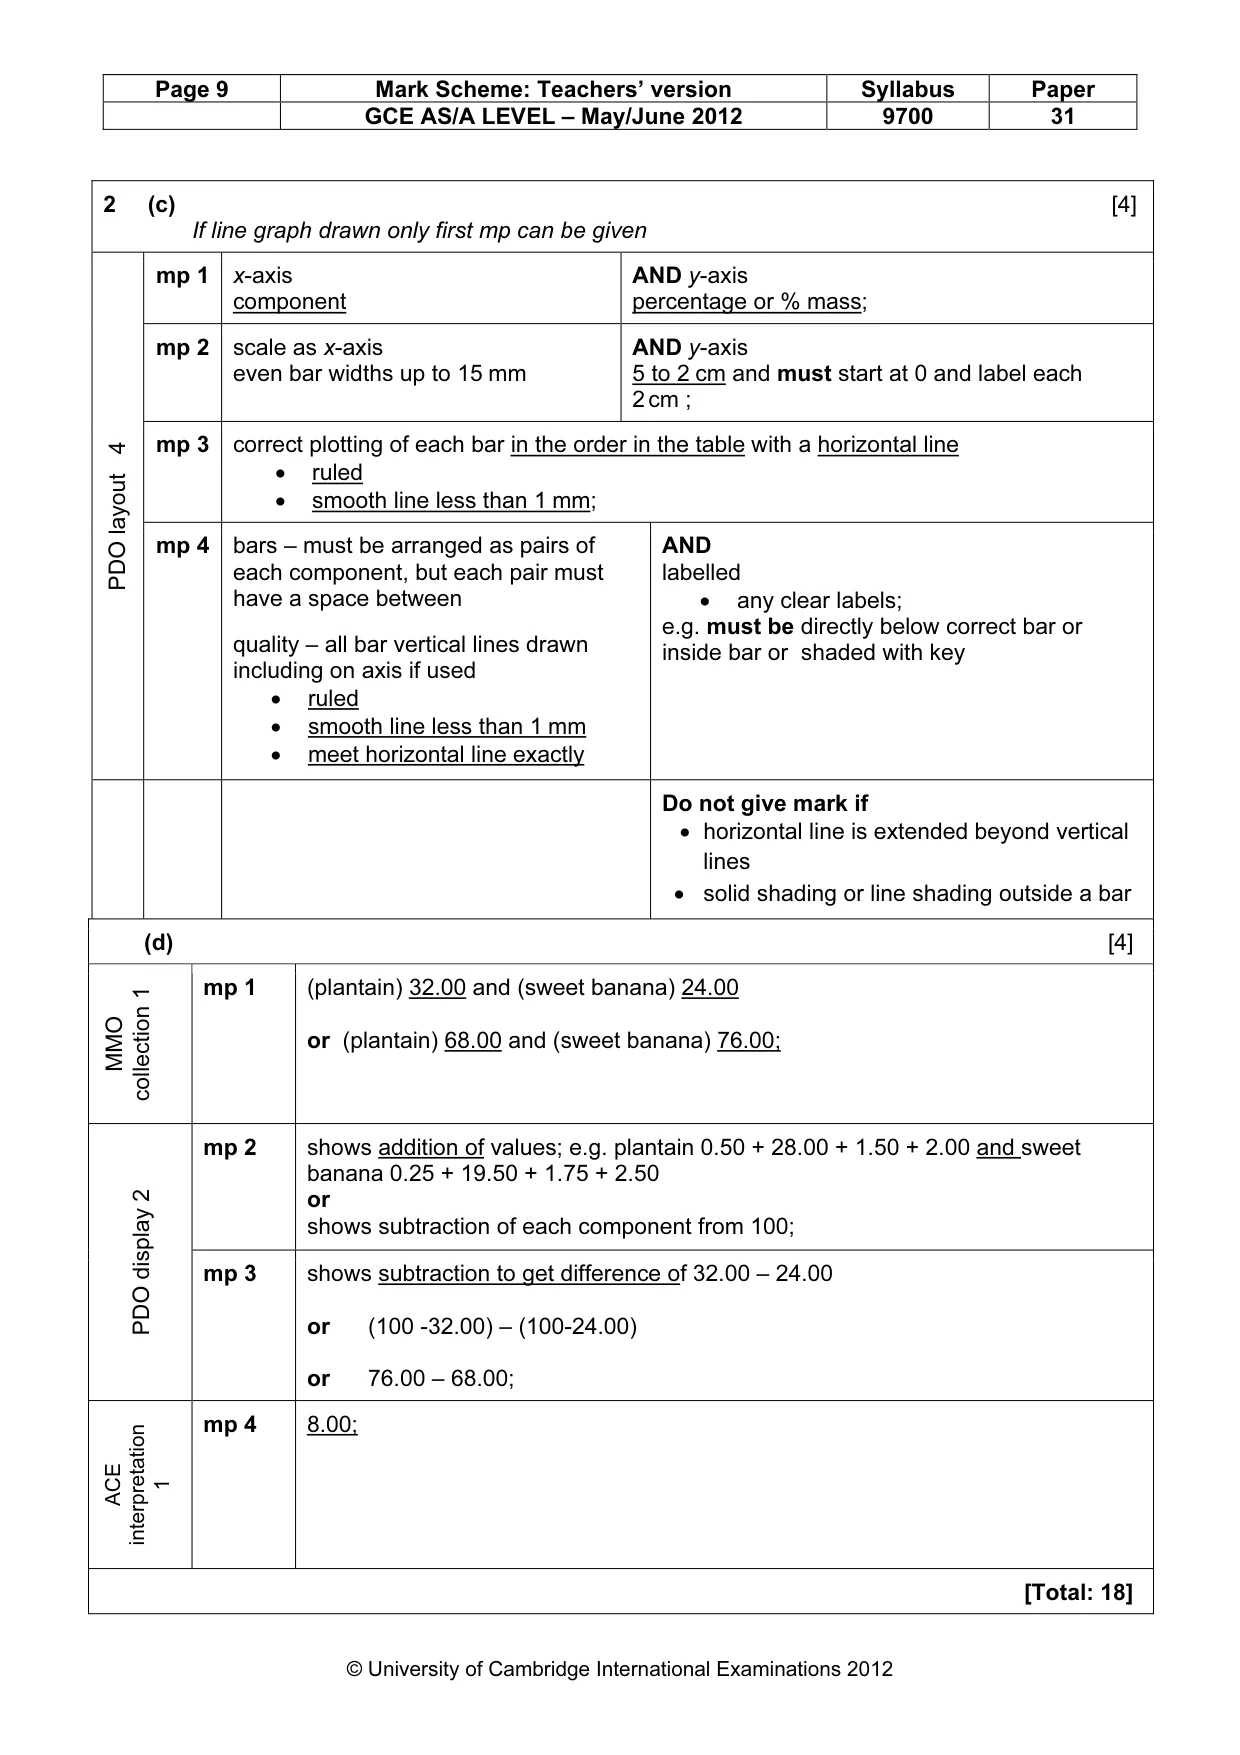
Page 9 Mark Scheme: Teachers’ version Syllabus Paper GCE AS/A LEVEL – May/June 2012 9700 31 © University of Cambridge International Examinations 2012 2 (c) [4] If line graph drawn only first mp can be given mp 1 x-axis component AND y-axis percentage or % mass; mp 2 scale as x-axis even bar widths up to 15 mm AND y-axis 5 to 2 cm and must start at 0 and label each 2 cm ; mp 3 correct plotting of each bar in the order in the table with a horizontal line • ruled • smooth line less than 1 mm; PDO layout 4 mp 4 bars – must be arranged as pairs of each component, but each pair must have a space between quality – all bar vertical lines drawn including on axis if used • ruled • smooth line less than 1 mm • meet horizontal line exactly AND labelled • any clear labels; e.g. must be directly below correct bar or inside bar or shaded with key Do not give mark if • horizontal line is extended beyond vertical lines • solid shading or line shading outside a bar (d) [4] MMO collection 1 mp 1 (plantain) 32.00 and (sweet banana) 24.00 or (plantain) 68.00 and (sweet banana) 76.00; mp 2 shows addition of values; e.g. plantain 0.50 + 28.00 + 1.50 + 2.00 and sweet banana 0.25 + 19.50 + 1.75 + 2.50 or shows subtraction of each component from 100; PDO display 2 mp 3 shows subtraction to get difference of 32.00 – 24.00 or (100 -32.00) – (100-24.00) or 76.00 – 68.00; ACE interpretation 1 mp 4 8.00; [Total: 18]
What you needed in this session
Cambridge’s own grade thresholds for 2012 May/June, Paper 3 · Variant 1. A higher threshold means an easier paper — the bar moves with how the cohort did.