Cambridge A Level Biology 9700 — 2012 May/June Paper 3 · Variant 5
9700/35/M/J/12 · 40 marks · ≈45 min
The question paper and its mark scheme, free to read here and free to download. This is Cambridge’s own paper, exactly as it was sat.
Question paper12 pages
Mark scheme9 pages
Answers below. Sit the paper first if you are practising.
Paper as text
Question paper, page 1
This document consists of 11 printed pages and 1 blank page. DC (LEO/CGW) 37145/6 © UCLES 2012 [Turn over UNIVERSITY OF CAMBRIDGE INTERNATIONAL EXAMINATIONS General Certificate of Education Advanced Subsidiary Level and Advanced Level READ THESE INSTRUCTIONS FIRST Write your Centre number, candidate number and name on all the work you hand in. Write in dark blue or black ink. You may use a pencil for any diagrams, graphs or rough working. Do not use red ink, staples, paper clips, highlighters, glue or correction fluid. DO NOT WRITE IN ANY BARCODES. Answer all questions. You may lose marks if you do not show your working or if you do not use appropriate units. At the end of the examination, fasten all your work securely together. The number of marks is given in brackets [ ] at the end of each question or part question. * 7 5 1 3 7 6 0 9 8 9 * BIOLOGY 9700/35 Advanced Practical Skills 1 May/June 2012 2 hours Candidates answer on the Question Paper. Additional Materials: As listed in the Confidential Instructions. For Examiner’s Use 1 2 Total
Question paper, page 2
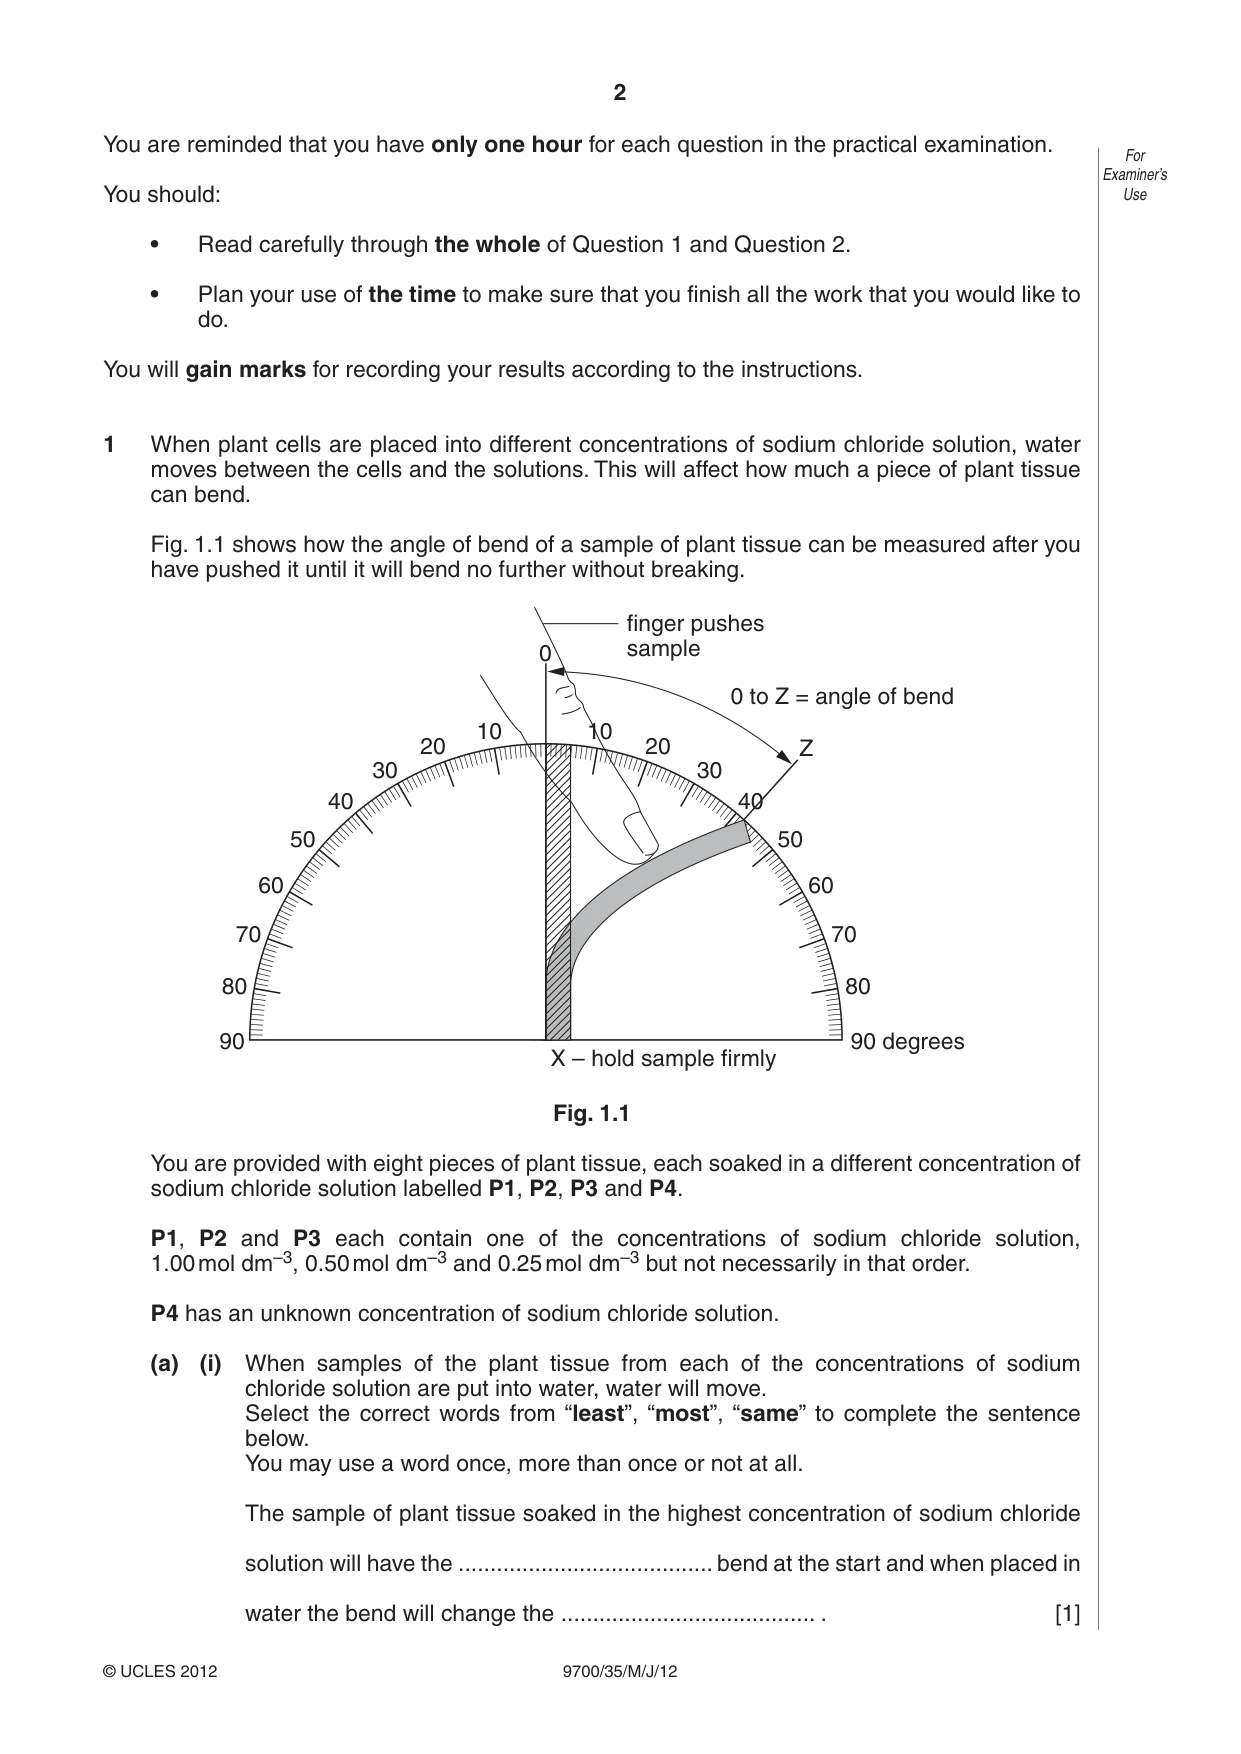
2 9700/35/M/J/12 © UCLES 2012 For Examiner’s Use You are reminded that you have only one hour for each question in the practical examination. You should: • Read carefully through the whole of Question 1 and Question 2. • Plan your use of the time to make sure that you finish all the work that you would like to do. You will gain marks for recording your results according to the instructions. 1 When plant cells are placed into different concentrations of sodium chloride solution, water moves between the cells and the solutions. This will affect how much a piece of plant tissue can bend. Fig. 1.1 shows how the angle of bend of a sample of plant tissue can be measured after you have pushed it until it will bend no further without breaking. 90 90 degrees finger pushes sample 80 80 70 70 60 60 X – hold sample firmly 50 50 40 40 30 30 Z 0 to Z = angle of bend 20 20 10 10 0 Fig. 1.1 You are provided with eight pieces of plant tissue, each soaked in a different concentration of sodium chloride solution labelled P1, P2, P3 and P4. P1, P2 and P3 each contain one of the concentrations of sodium chloride solution, 1.00 mol dm–3, 0.50 mol dm–3 and 0.25 mol dm–3 but not necessarily in that order. P4 has an unknown concentration of sodium chloride solution. (a) (i) When samples of the plant tissue from each of the concentrations of sodium chloride solution are put into water, water will move. Select the correct words from “least”, “most”, “same” to complete the sentence below. You may use a word once, more than once or not at all. The sample of plant tissue soaked in the highest concentration of sodium chloride solution will have the … bend at the start and when placed in water the bend will change the … . [1]
Question paper, page 3
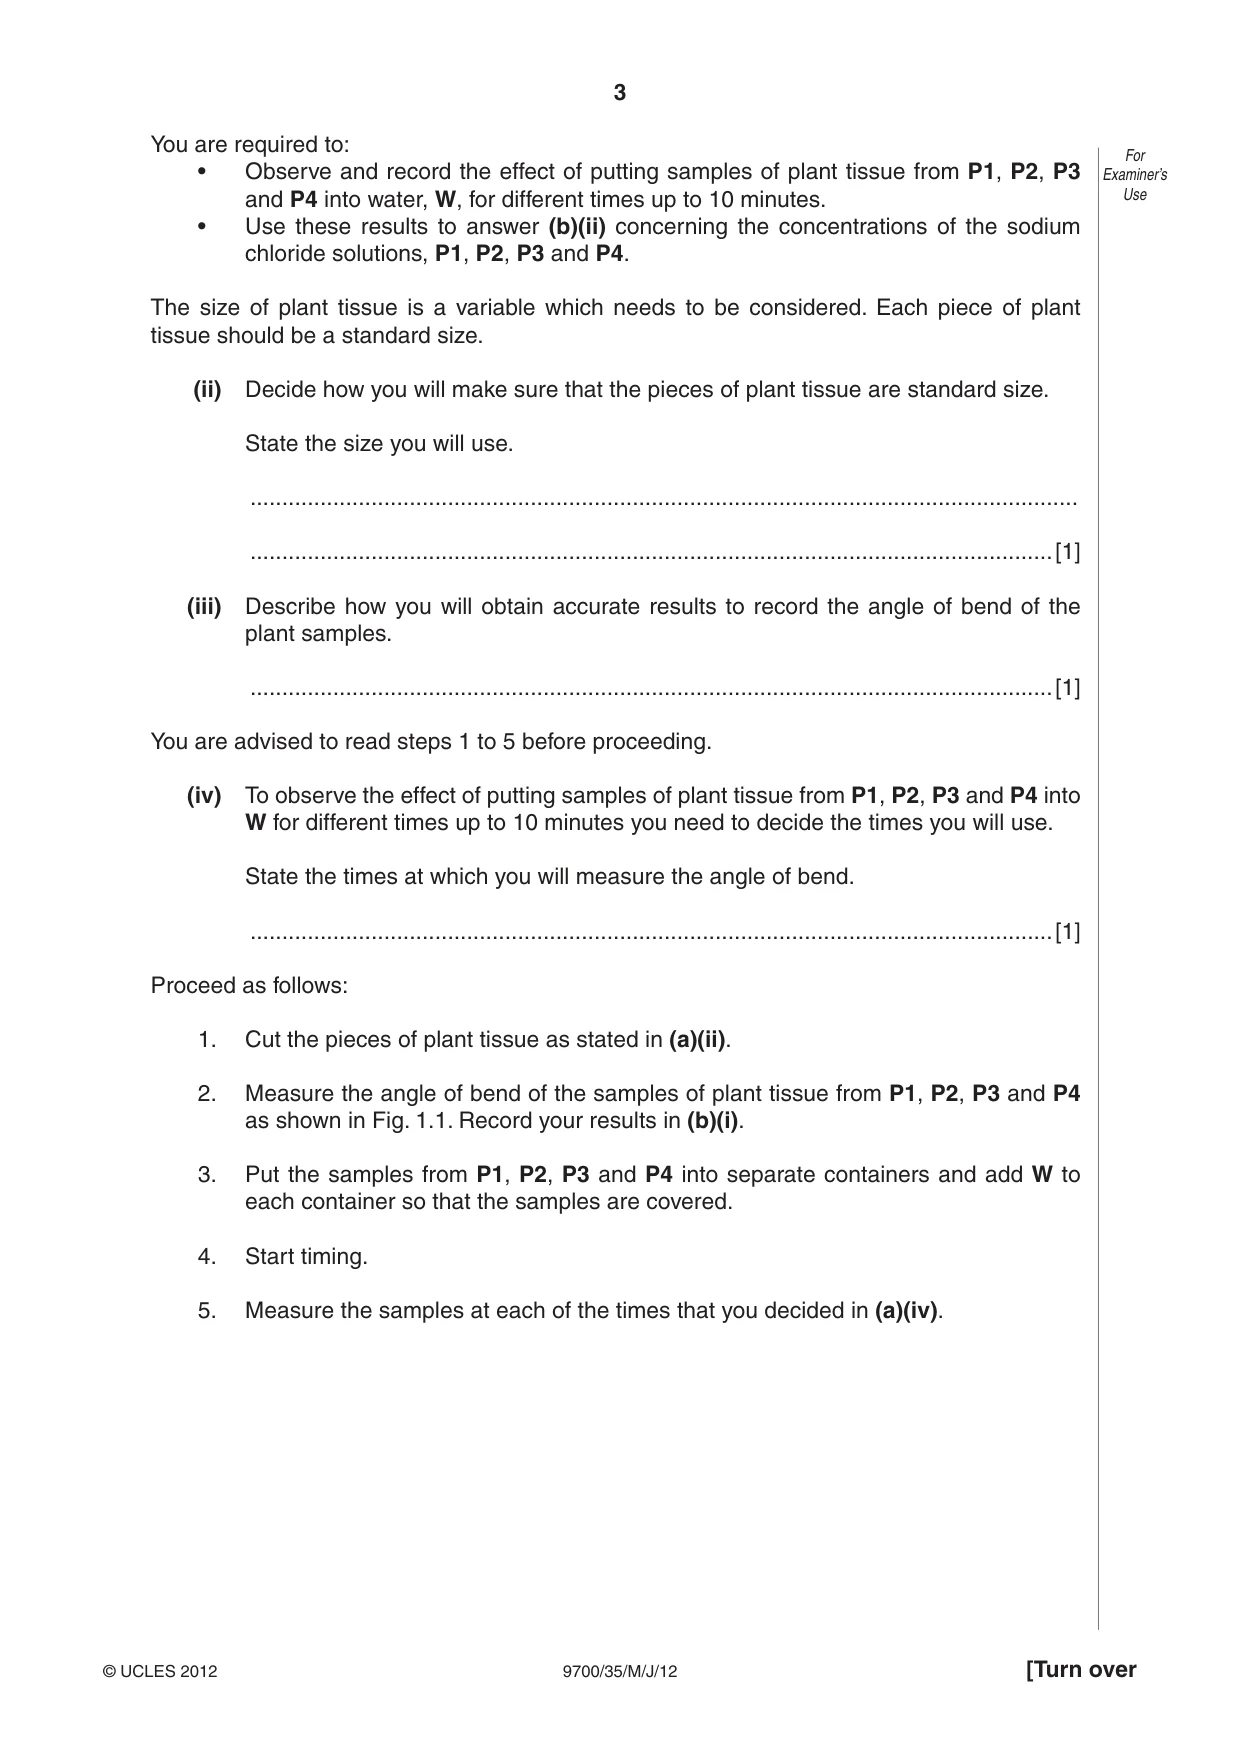
3 9700/35/M/J/12 © UCLES 2012 [Turn over For Examiner’s Use You are required to: • Observe and record the effect of putting samples of plant tissue from P1, P2, P3 and P4 into water, W, for different times up to 10 minutes. • Use these results to answer (b)(ii) concerning the concentrations of the sodium chloride solutions, P1, P2, P3 and P4. The size of plant tissue is a variable which needs to be considered. Each piece of plant tissue should be a standard size. (ii) Decide how you will make sure that the pieces of plant tissue are standard size. State the size you will use. … …[1] (iii) Describe how you will obtain accurate results to record the angle of bend of the plant samples. …[1] You are advised to read steps 1 to 5 before proceeding. (iv) To observe the effect of putting samples of plant tissue from P1, P2, P3 and P4 into W for different times up to 10 minutes you need to decide the times you will use. State the times at which you will measure the angle of bend. …[1] Proceed as follows: 1. Cut the pieces of plant tissue as stated in (a)(ii). 2. Measure the angle of bend of the samples of plant tissue from P1, P2, P3 and P4 as shown in Fig. 1.1. Record your results in (b)(i). 3. Put the samples from P1, P2, P3 and P4 into separate containers and add W to each container so that the samples are covered. 4. Start timing. 5. Measure the samples at each of the times that you decided in (a)(iv).
Question paper, page 4
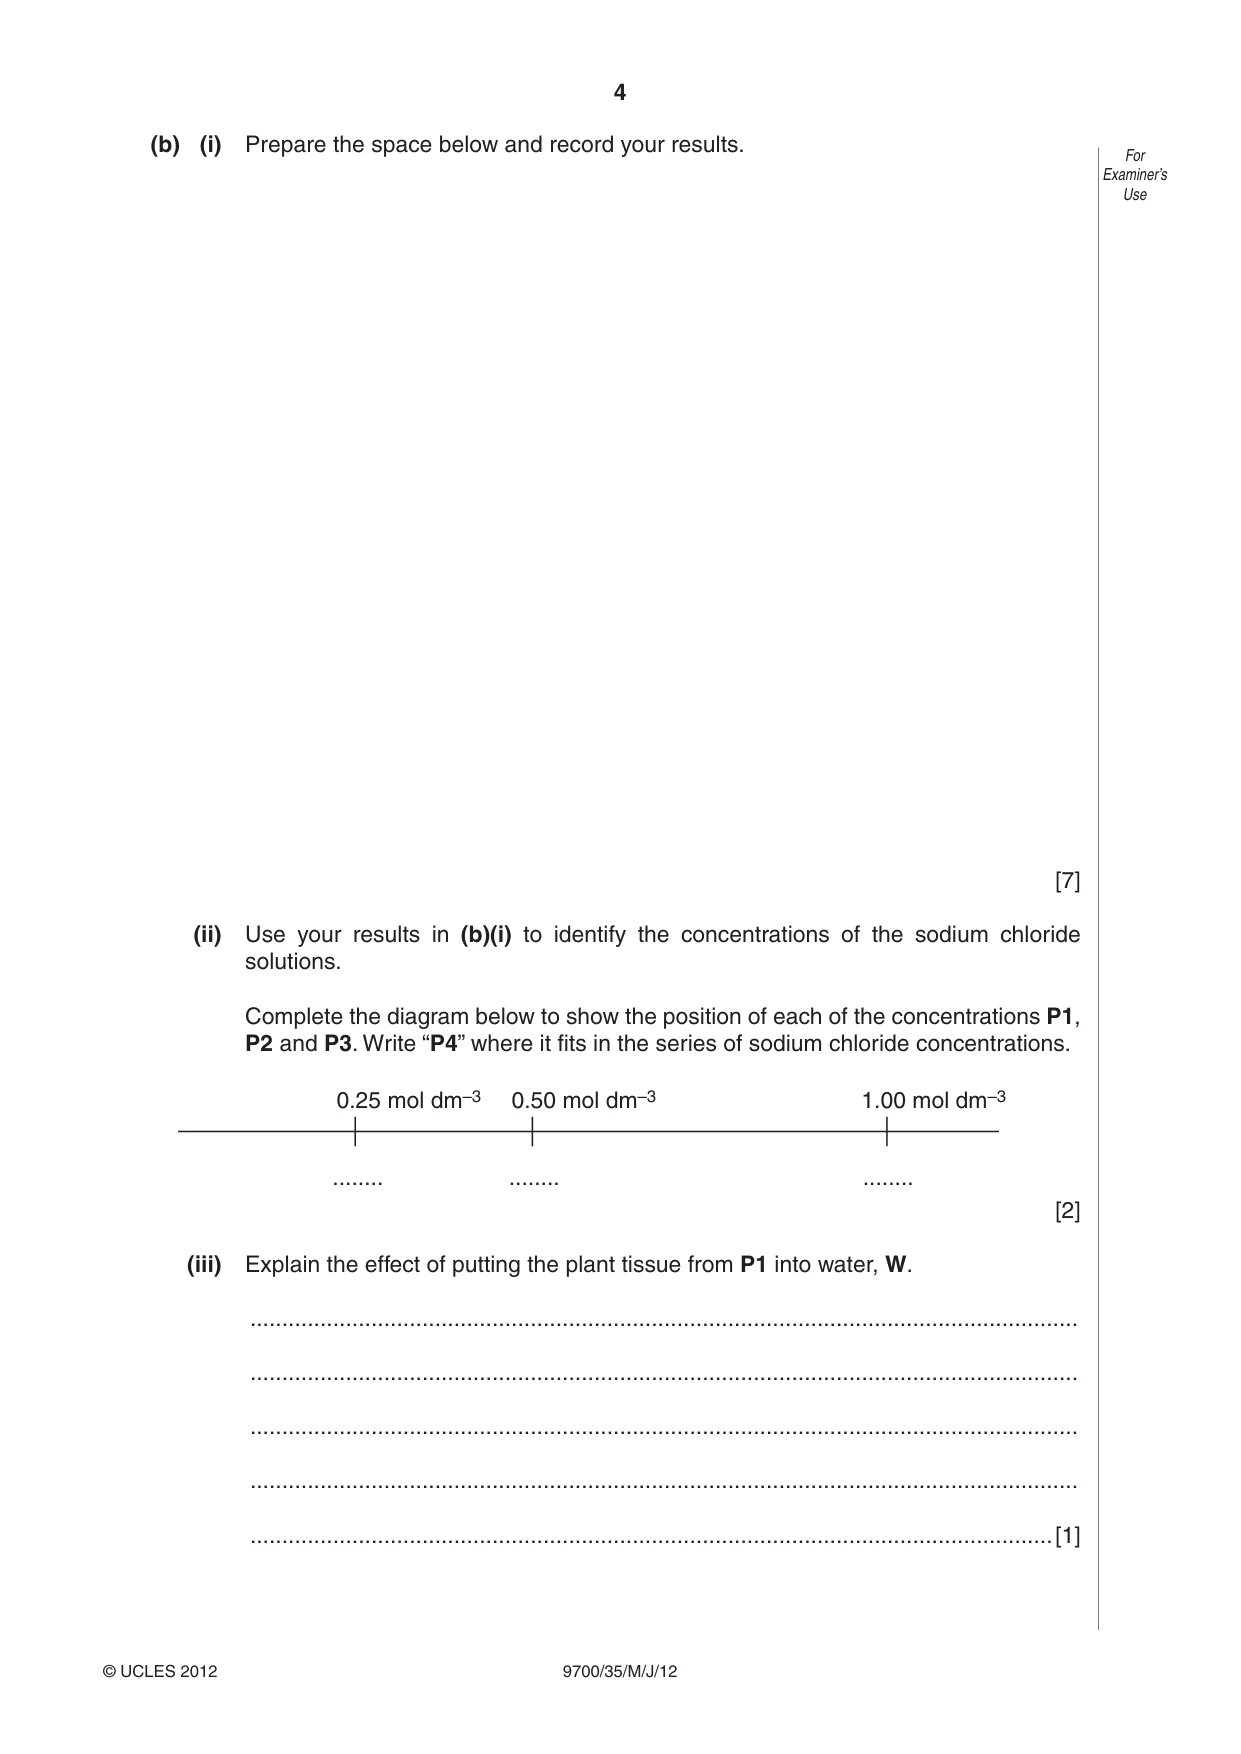
4 9700/35/M/J/12 © UCLES 2012 For Examiner’s Use (b) (i) Prepare the space below and record your results. [7] (ii) Use your results in (b)(i) to identify the concentrations of the sodium chloride solutions. Complete the diagram below to show the position of each of the concentrations P1, P2 and P3. Write “P4” where it fits in the series of sodium chloride concentrations. 0.25 mol dm–3 0.50 mol dm–3 1.00 mol dm–3 … … … [2] (iii) Explain the effect of putting the plant tissue from P1 into water, W. … … … … …[1]
Question paper, page 5
5 9700/35/M/J/12 © UCLES 2012 [Turn over For Examiner’s Use (iv) Identify two significant errors in this investigation. … … … … …[2] (v) A protractor was used to measure the angle of bend. State the value of the smallest division on the protractor. … State the actual error in using the protractor to measure the angle of bend. …[1] (vi) Suggest how you would make this investigation as reliable as possible. … … … … … … …[3] [Total: 20]
Question paper, page 6
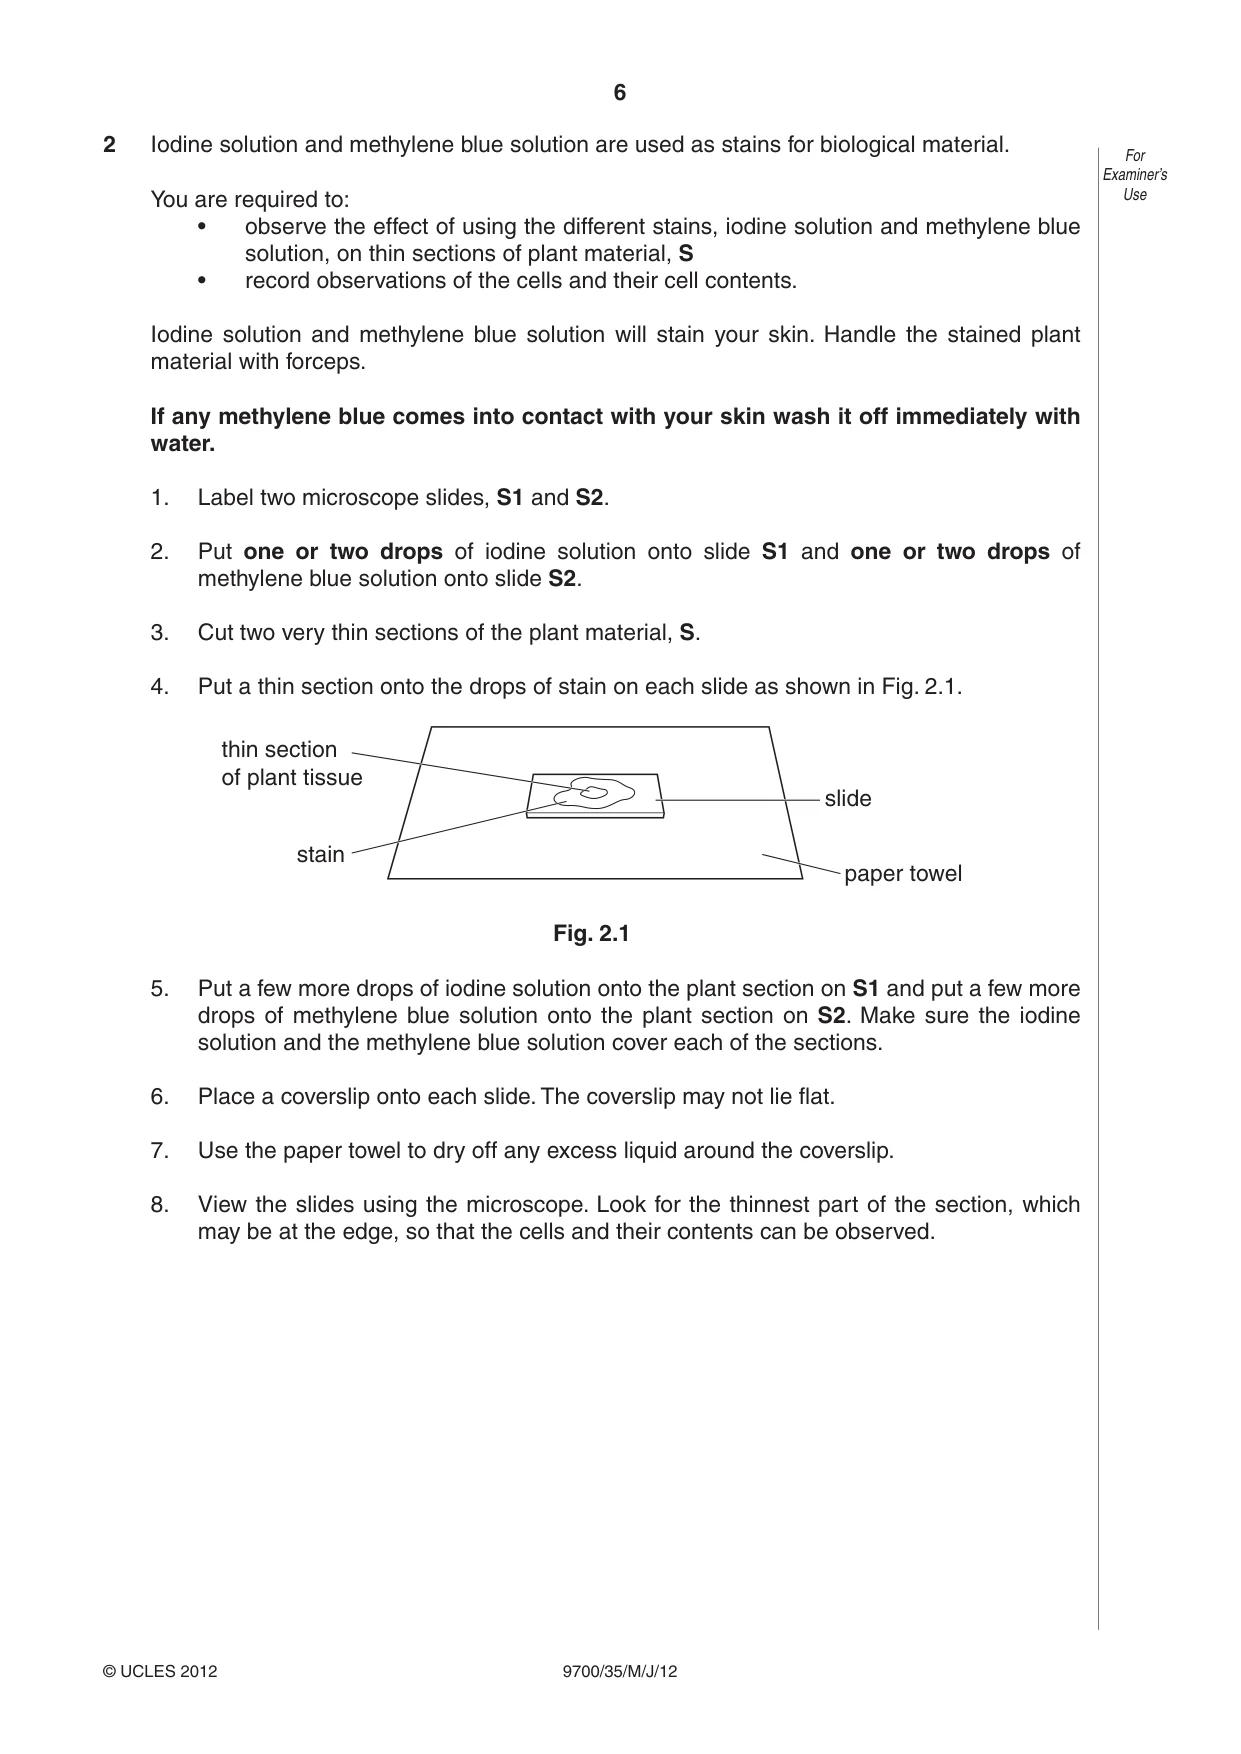
6 9700/35/M/J/12 © UCLES 2012 For Examiner’s Use 2 Iodine solution and methylene blue solution are used as stains for biological material. You are required to: • observe the effect of using the different stains, iodine solution and methylene blue solution, on thin sections of plant material, S • record observations of the cells and their cell contents. Iodine solution and methylene blue solution will stain your skin. Handle the stained plant material with forceps. If any methylene blue comes into contact with your skin wash it off immediately with water. 1. Label two microscope slides, S1 and S2. 2. Put one or two drops of iodine solution onto slide S1 and one or two drops of methylene blue solution onto slide S2. 3. Cut two very thin sections of the plant material, S. 4. Put a thin section onto the drops of stain on each slide as shown in Fig. 2.1. thin section of plant tissue stain slide paper towel Fig. 2.1 5. Put a few more drops of iodine solution onto the plant section on S1 and put a few more drops of methylene blue solution onto the plant section on S2. Make sure the iodine solution and the methylene blue solution cover each of the sections. 6. Place a coverslip onto each slide. The coverslip may not lie flat. 7. Use the paper towel to dry off any excess liquid around the coverslip. 8. View the slides using the microscope. Look for the thinnest part of the section, which may be at the edge, so that the cells and their contents can be observed.
Question paper, page 7
7 9700/35/M/J/12 © UCLES 2012 [Turn over For Examiner’s Use (a) From each slide S1 and S2, make large labelled drawings of two adjacent (touching) cells and their cell contents. Label one starch grain. Annotate your drawings to describe one observable difference between S1 and S2. [6]
Question paper, page 8
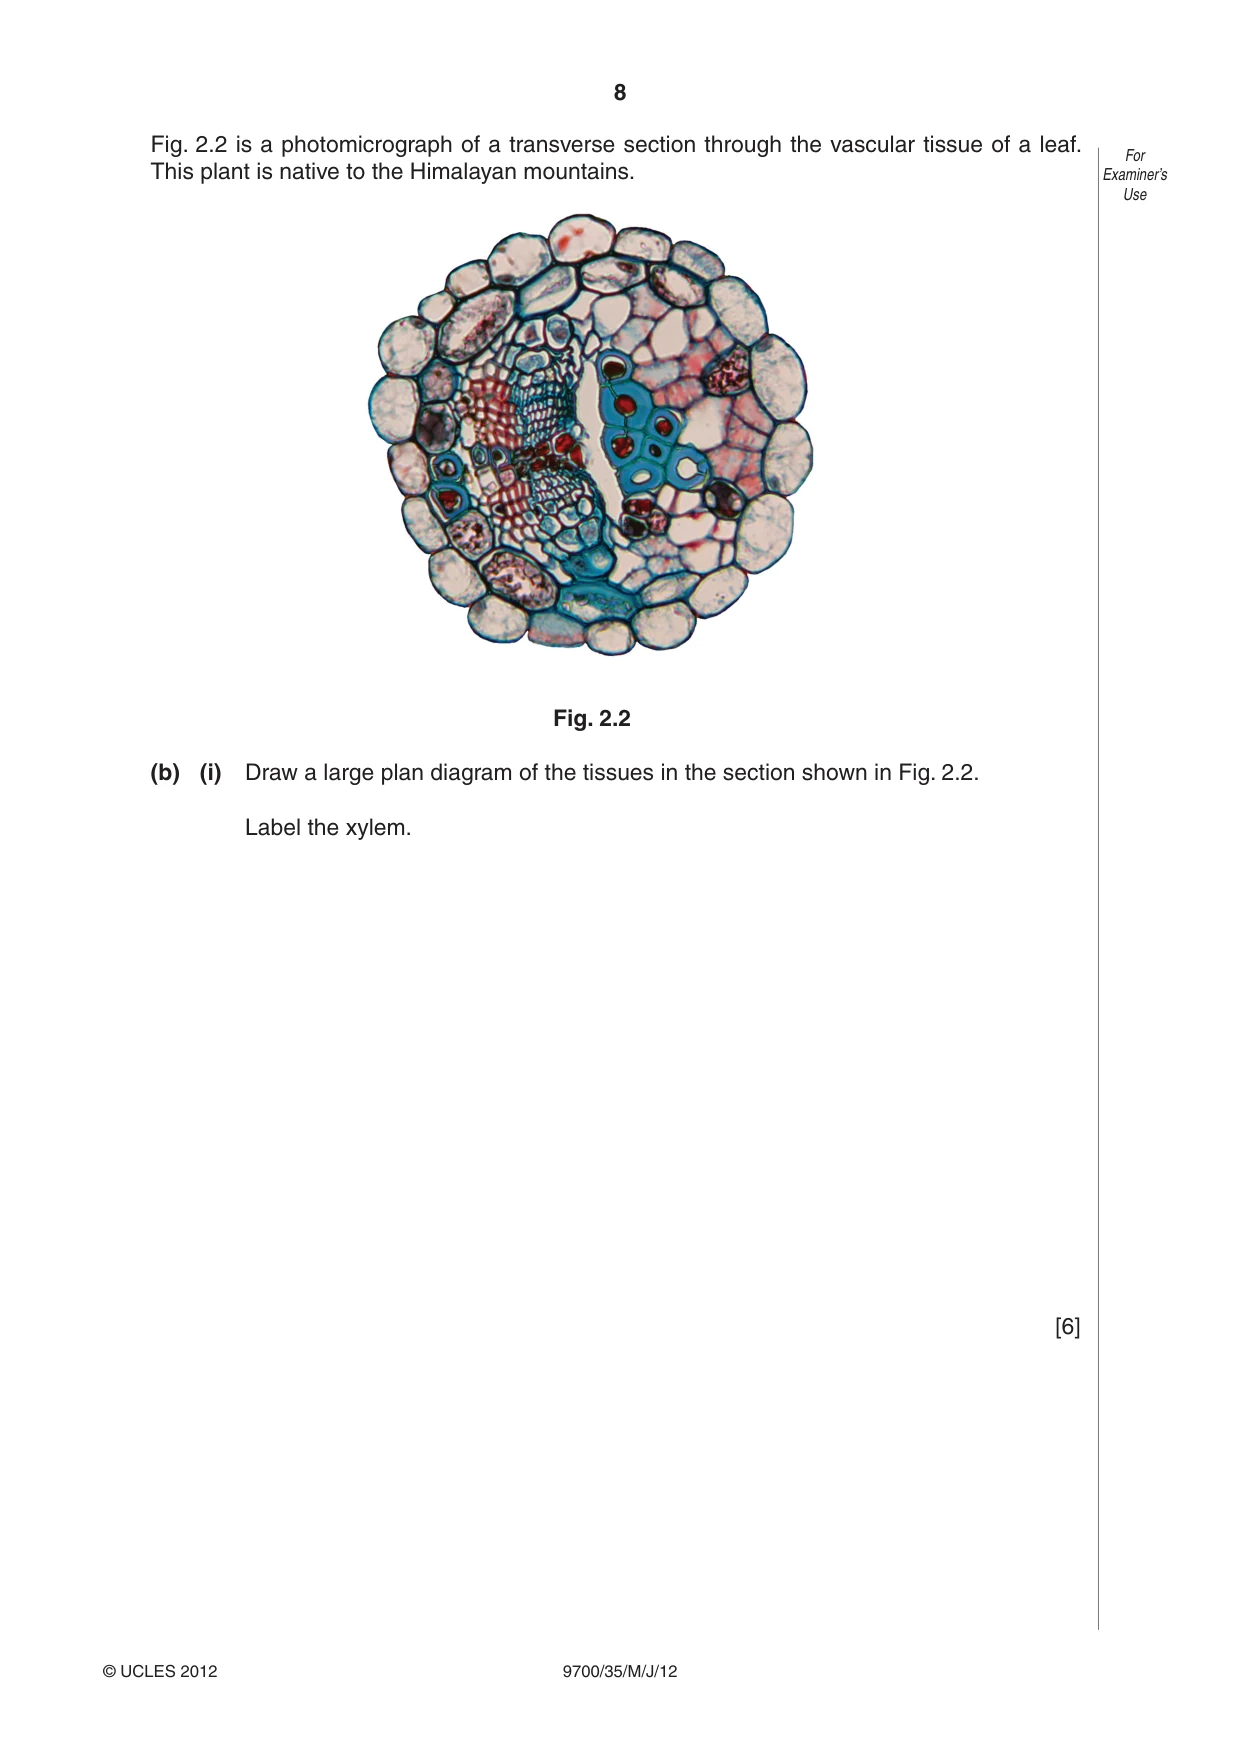
8 9700/35/M/J/12 © UCLES 2012 For Examiner’s Use Fig. 2.2 is a photomicrograph of a transverse section through the vascular tissue of a leaf. This plant is native to the Himalayan mountains. Fig. 2.2 (b) (i) Draw a large plan diagram of the tissues in the section shown in Fig. 2.2. Label the xylem. [6]
Question paper, page 9
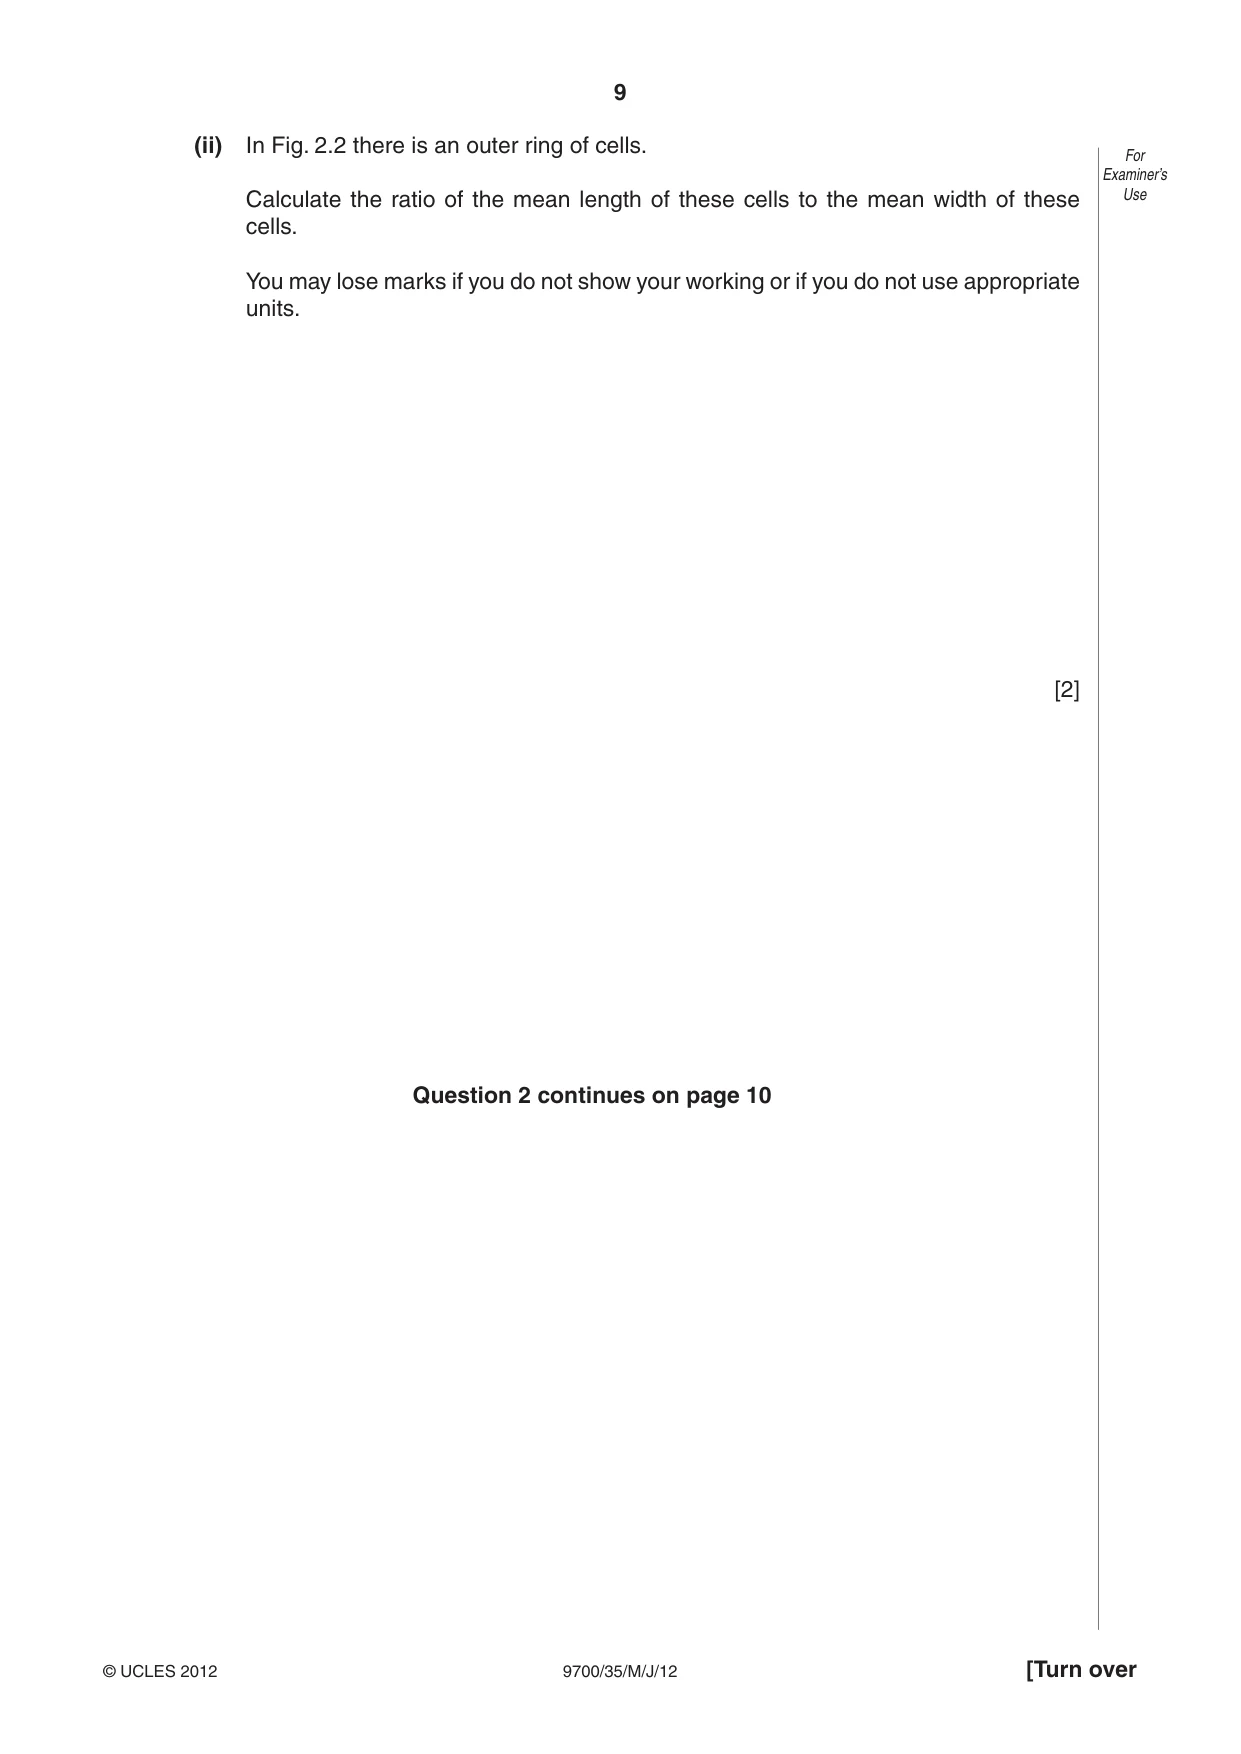
9 9700/35/M/J/12 © UCLES 2012 [Turn over For Examiner’s Use (ii) In Fig. 2.2 there is an outer ring of cells. Calculate the ratio of the mean length of these cells to the mean width of these cells. You may lose marks if you do not show your working or if you do not use appropriate units. [2] Question 2 continues on page 10
Question paper, page 10
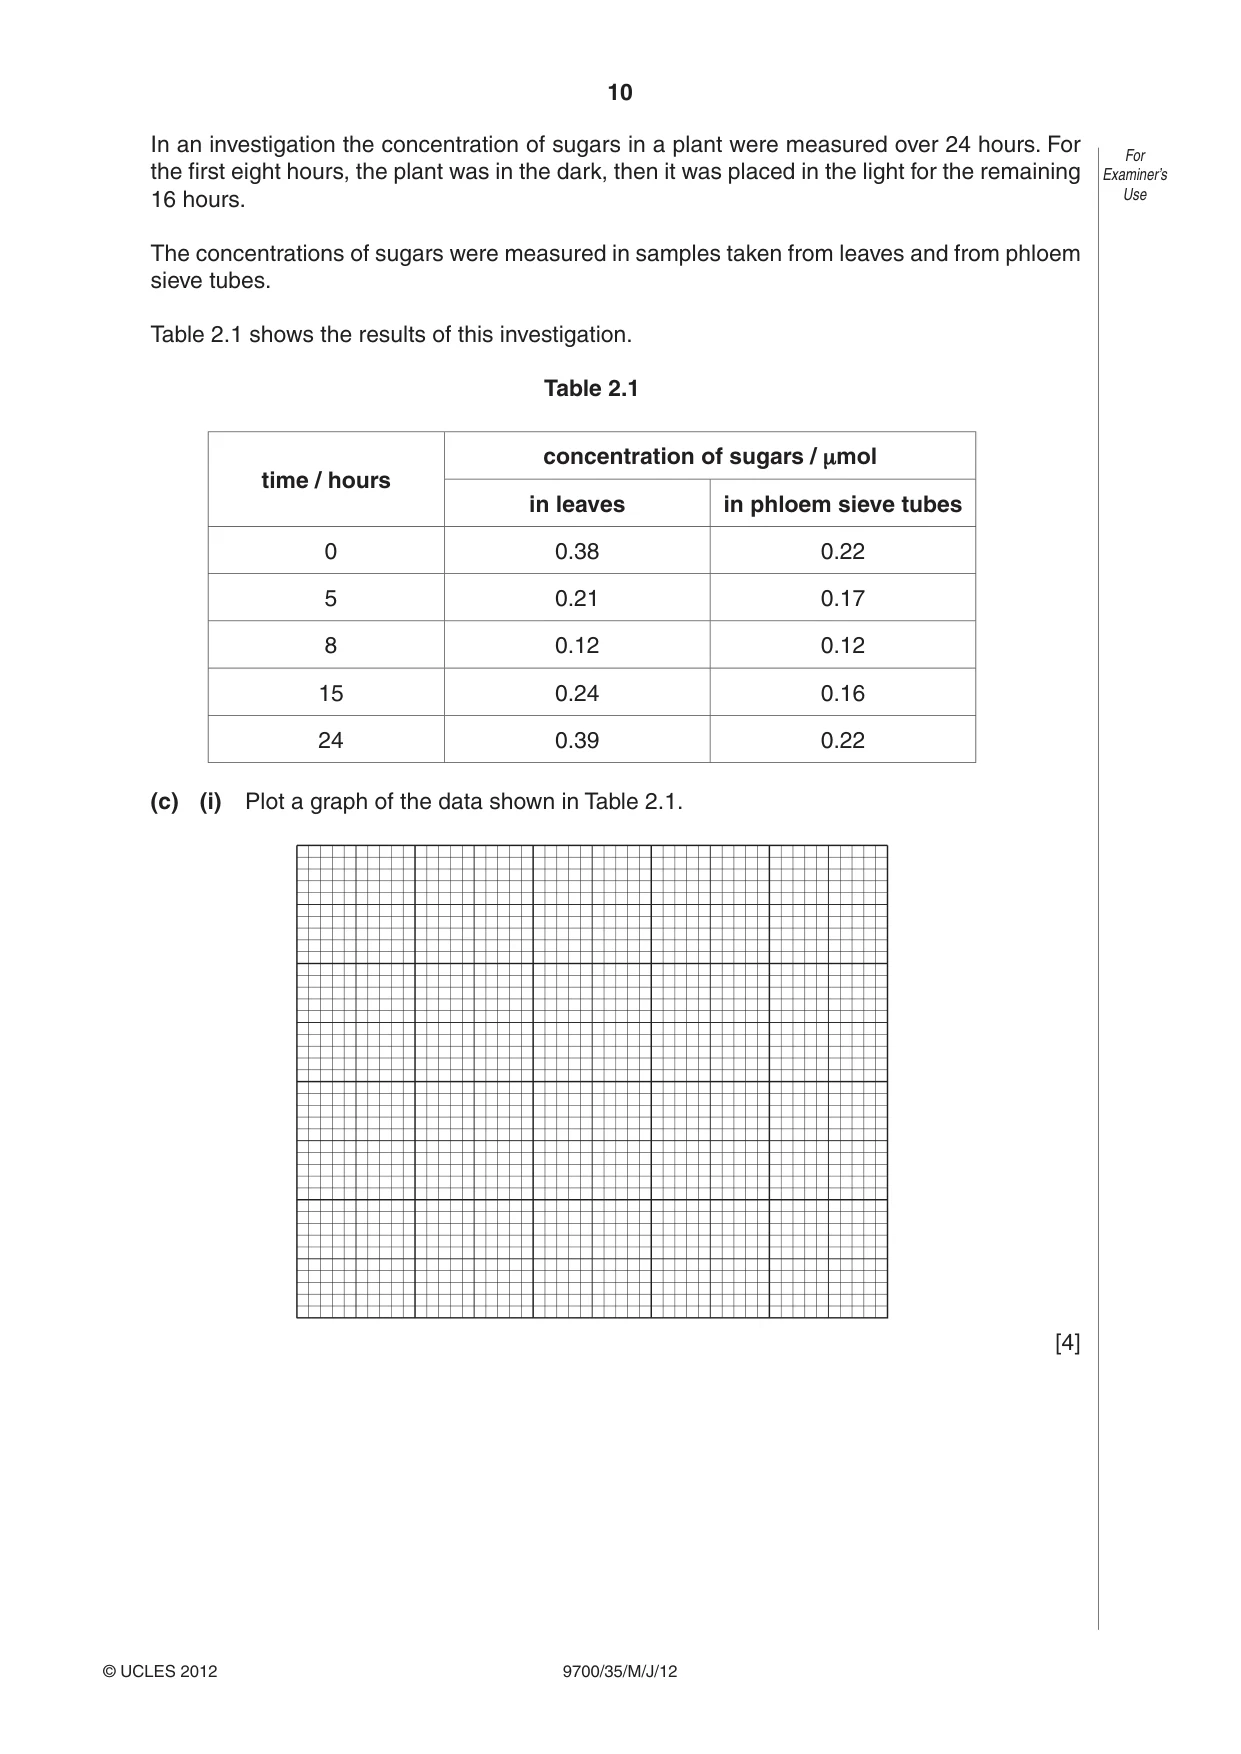
10 9700/35/M/J/12 © UCLES 2012 For Examiner’s Use In an investigation the concentration of sugars in a plant were measured over 24 hours. For the first eight hours, the plant was in the dark, then it was placed in the light for the remaining 16 hours. The concentrations of sugars were measured in samples taken from leaves and from phloem sieve tubes. Table 2.1 shows the results of this investigation. Table 2.1 time / hours concentration of sugars / μmol in leaves in phloem sieve tubes 0 0.38 0.22 5 0.21 0.17 8 0.12 0.12 15 0.24 0.16 24 0.39 0.22 (c) (i) Plot a graph of the data shown in Table 2.1. [4]
Question paper, page 11
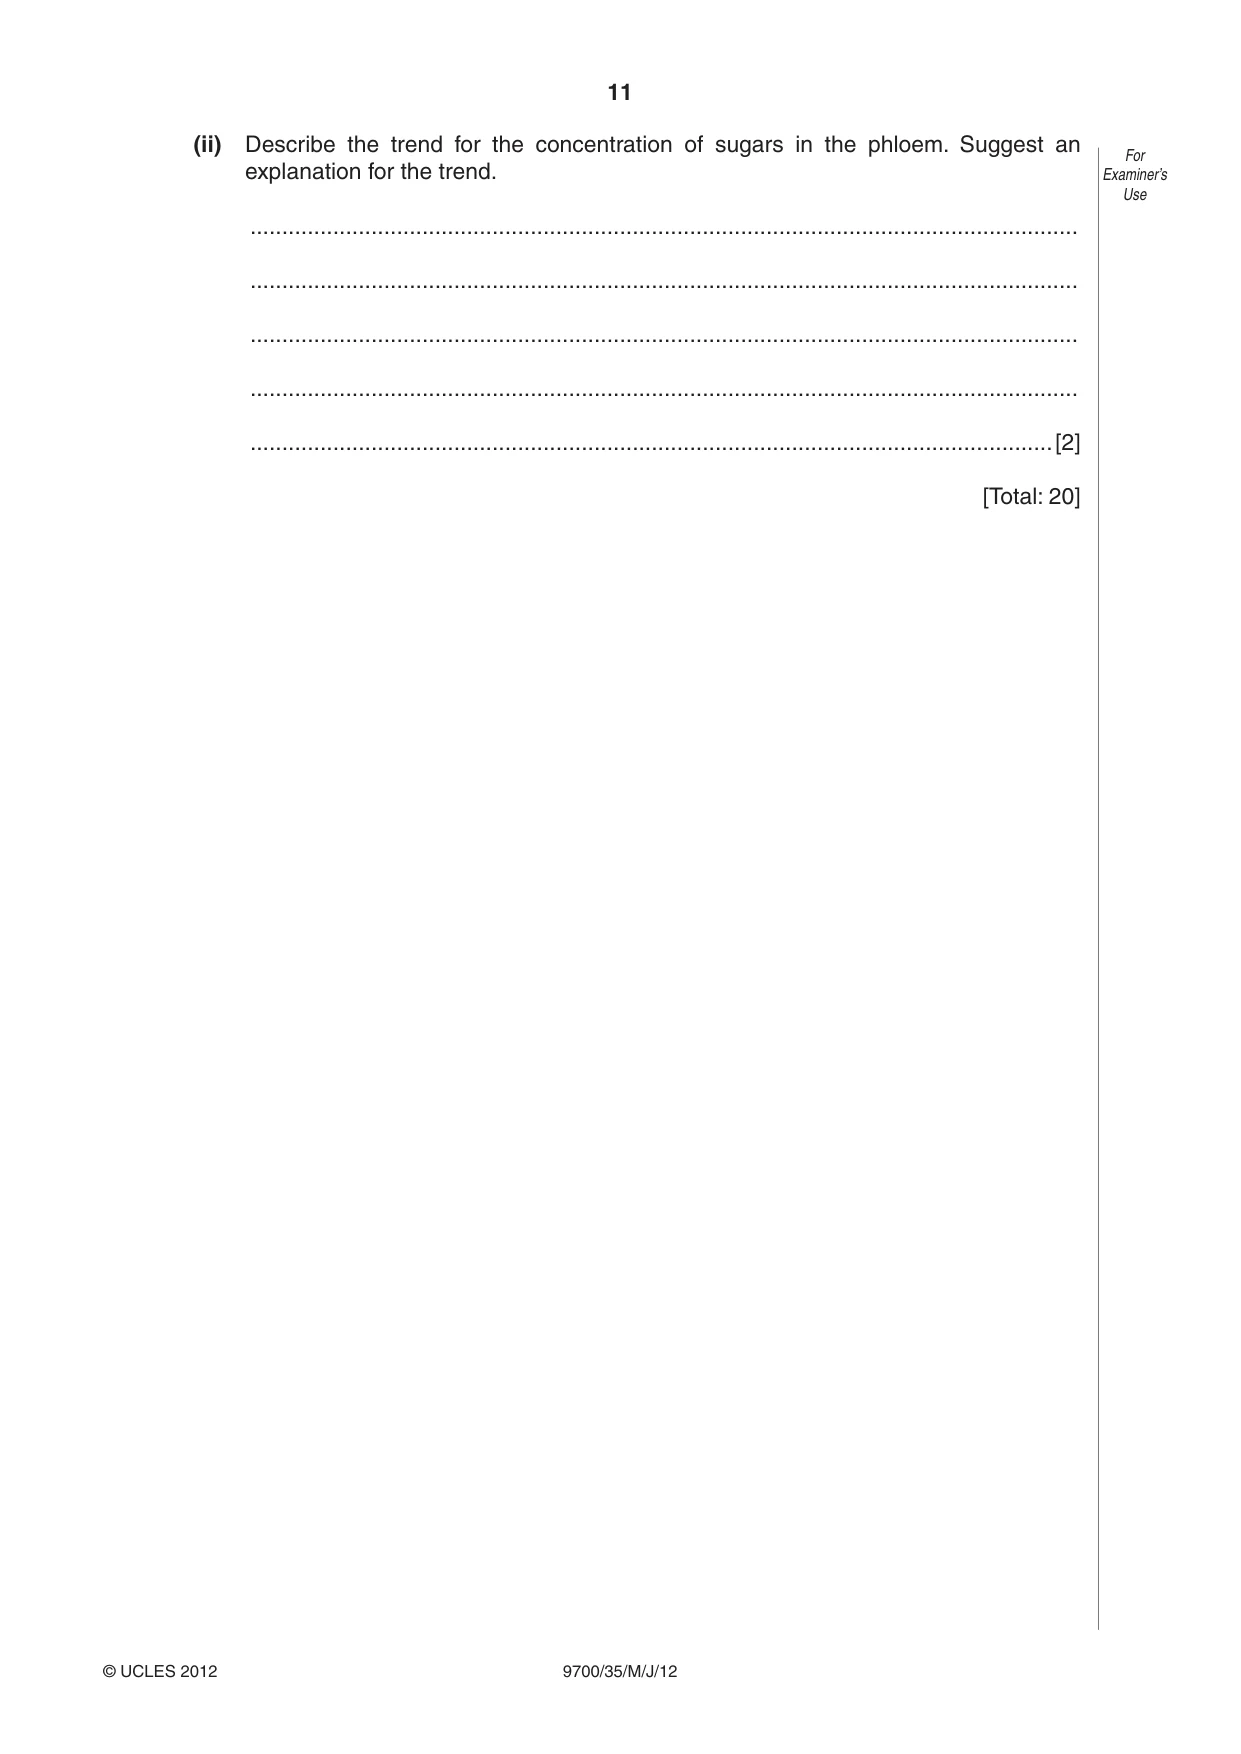
11 9700/35/M/J/12 © UCLES 2012 For Examiner’s Use (ii) Describe the trend for the concentration of sugars in the phloem. Suggest an explanation for the trend. … … … … …[2] [Total: 20]
Question paper, page 12
12 9700/35/M/J/12 © UCLES 2012 BLANK PAGE Permission to reproduce items where third-party owned material protected by copyright is included has been sought and cleared where possible. Every reasonable effort has been made by the publisher (UCLES) to trace copyright holders, but if any items requiring clearance have unwittingly been included, the publisher will be pleased to make amends at the earliest possible opportunity. University of Cambridge International Examinations is part of the Cambridge Assessment Group. Cambridge Assessment is the brand name of University of Cambridge Local Examinations Syndicate (UCLES), which is itself a department of the University of Cambridge.
Mark scheme, page 1
UNIVERSITY OF CAMBRIDGE INTERNATIONAL EXAMINATIONS GCE Advanced Subsidiary Level and GCE Advanced Level MARK SCHEME for the May/June 2012 question paper for the guidance of teachers 9700 BIOLOGY 9700/35 Paper 31 (Advanced Practical Skills 1), maximum raw mark 40 This mark scheme is published as an aid to teachers and candidates, to indicate the requirements of the examination. It shows the basis on which Examiners were instructed to award marks. It does not indicate the details of the discussions that took place at an Examiners’ meeting before marking began, which would have considered the acceptability of alternative answers. Mark schemes must be read in conjunction with the question papers and the report on the examination. • Cambridge will not enter into discussions or correspondence in connection with these mark schemes. Cambridge is publishing the mark schemes for the May/June 2012 question papers for most IGCSE, GCE Advanced Level and Advanced Subsidiary Level syllabuses and some Ordinary Level syllabuses.
Mark scheme, page 2
Page 2 Mark Scheme: Teachers’ version Syllabus Paper GCE AS/A LEVEL – May/June 2012 9700 35 © University of Cambridge International Examinations 2012 Mark scheme abbreviations: ; separates marking points / alternative answers for the same point R reject A accept (for answers correctly cued by the question, or by extra guidance) AW alternative wording (where responses vary more than usual) underline actual word given must be used by candidate (grammatical variants excepted) max indicates the maximum number of marks that can be given ora or reverse argument mp marking point (with relevant number) ecf error carried forward I ignore AVP Alternative valid point (examples given as guidance)
Mark scheme, page 3
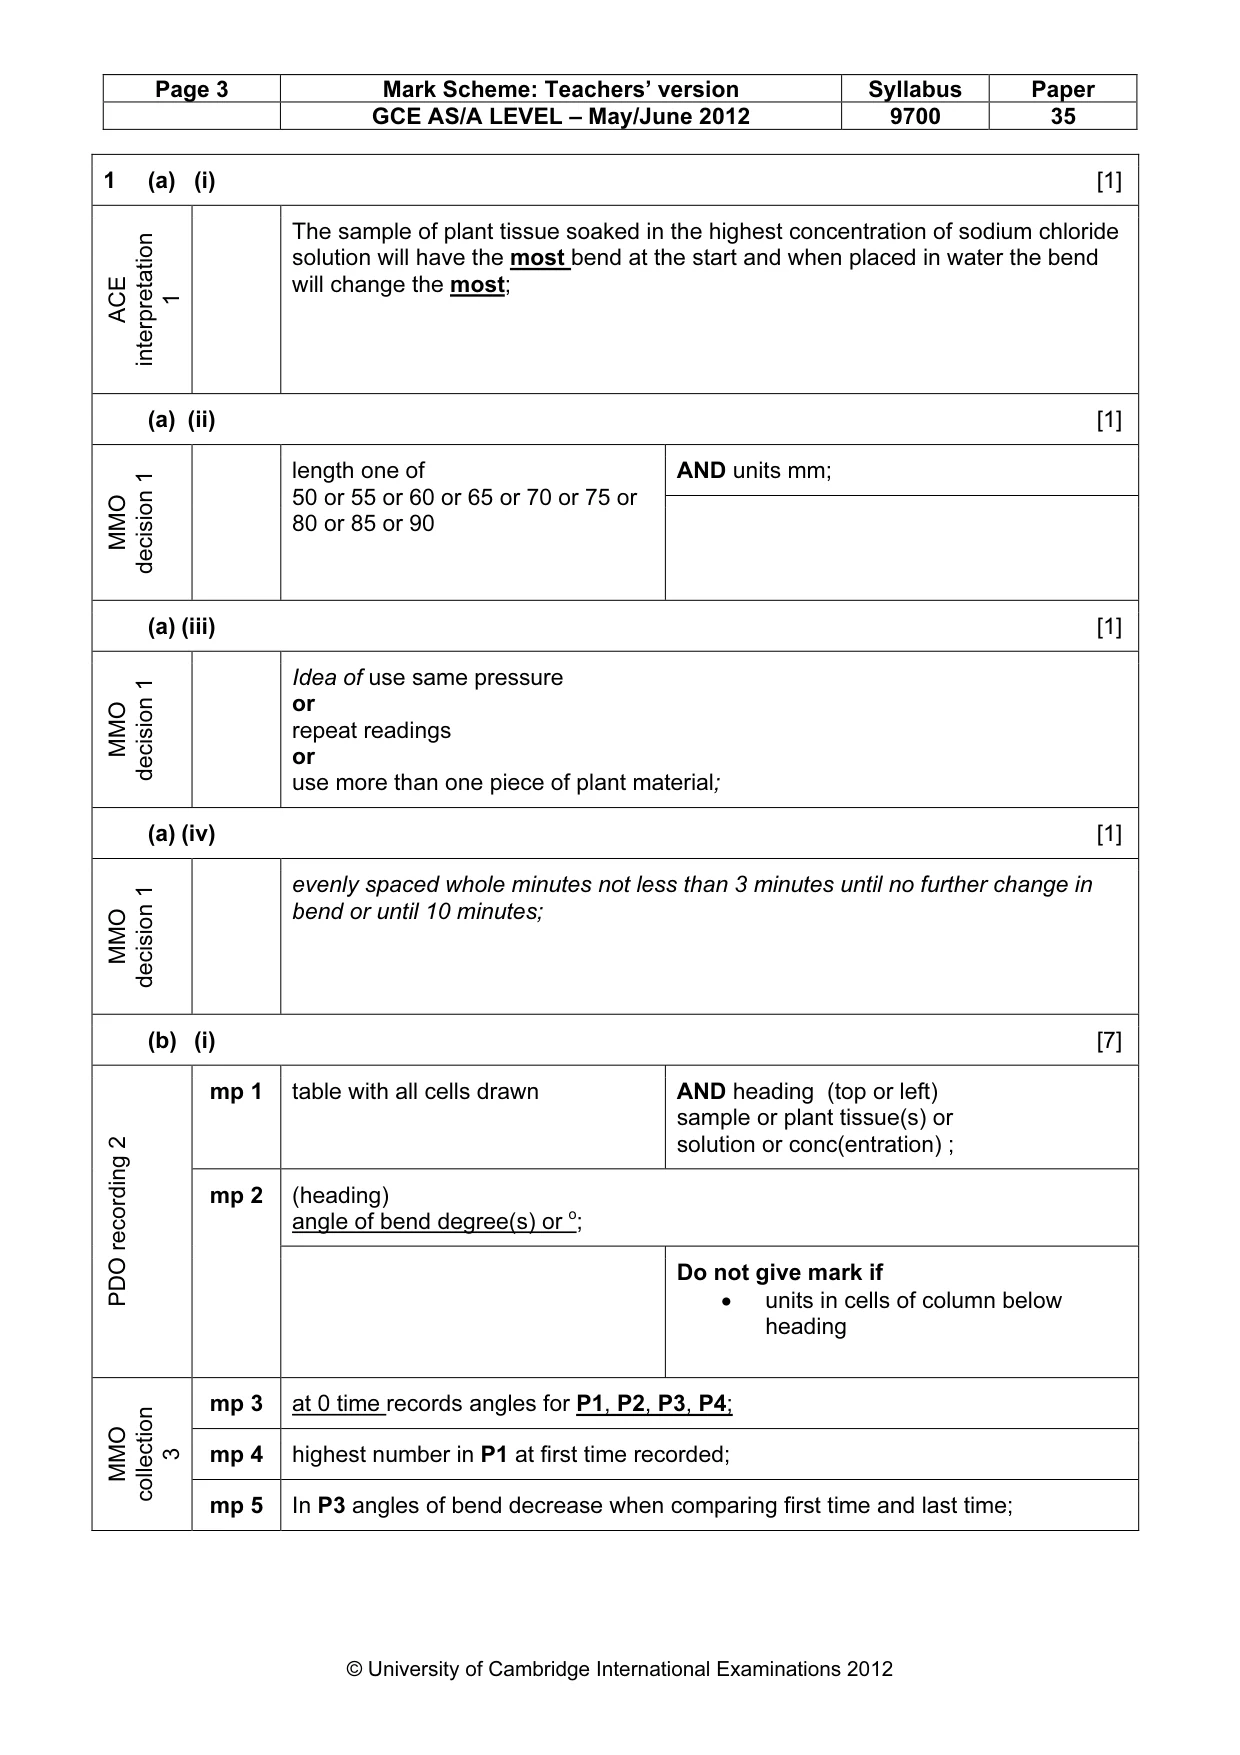
Page 3 Mark Scheme: Teachers’ version Syllabus Paper GCE AS/A LEVEL – May/June 2012 9700 35 © University of Cambridge International Examinations 2012 1 (a) (i) [1] ACE interpretation 1 The sample of plant tissue soaked in the highest concentration of sodium chloride solution will have the most bend at the start and when placed in water the bend will change the most; (a) (ii) [1] AND units mm; MMO decision 1 length one of 50 or 55 or 60 or 65 or 70 or 75 or 80 or 85 or 90 (a) (iii) [1] MMO decision 1 Idea of use same pressure or repeat readings or use more than one piece of plant material; (a) (iv) [1] MMO decision 1 evenly spaced whole minutes not less than 3 minutes until no further change in bend or until 10 minutes; (b) (i) [7] mp 1 table with all cells drawn AND heading (top or left) sample or plant tissue(s) or solution or conc(entration) ; (heading) angle of bend degree(s) or o; PDO recording 2 mp 2 Do not give mark if • units in cells of column below heading mp 3 at 0 time records angles for P1, P2, P3, P4; mp 4 highest number in P1 at first time recorded; MMO collection 3 mp 5 In P3 angles of bend decrease when comparing first time and last time;
Mark scheme, page 4
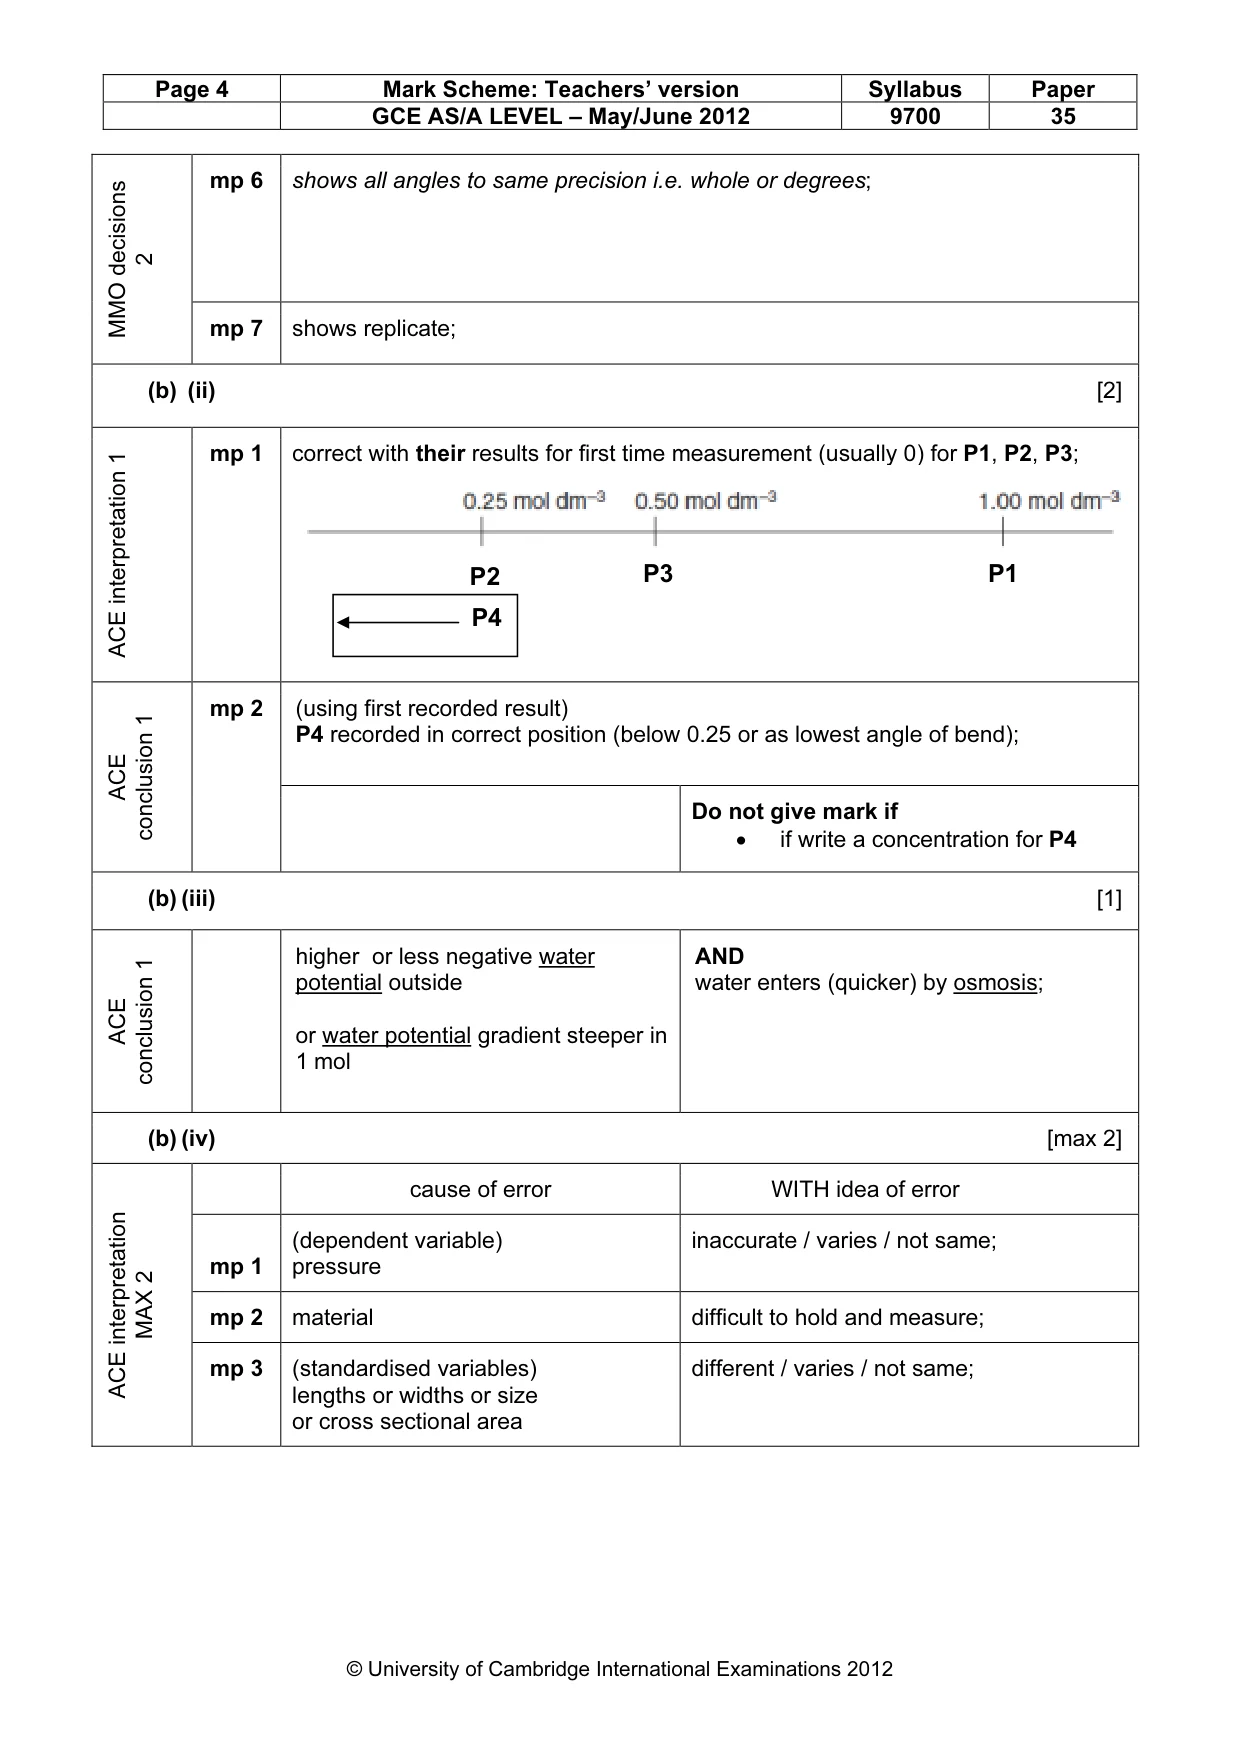
Page 4 Mark Scheme: Teachers’ version Syllabus Paper GCE AS/A LEVEL – May/June 2012 9700 35 © University of Cambridge International Examinations 2012 mp 6 shows all angles to same precision i.e. whole or degrees; MMO decisions 2 mp 7 shows replicate; (b) (ii) [2] ACE interpretation 1 mp 1 correct with their results for first time measurement (usually 0) for P1, P2, P3; (using first recorded result) P4 recorded in correct position (below 0.25 or as lowest angle of bend); ACE conclusion 1 mp 2 Do not give mark if • if write a concentration for P4 (b) (iii) [1] ACE conclusion 1 higher or less negative water potential outside or water potential gradient steeper in 1 mol AND water enters (quicker) by osmosis; (b) (iv) [max 2] cause of error WITH idea of error mp 1 (dependent variable) pressure inaccurate / varies / not same; mp 2 material difficult to hold and measure; ACE interpretation MAX 2 mp 3 (standardised variables) lengths or widths or size or cross sectional area different / varies / not same; P2 P3 P1 P4
Mark scheme, page 5
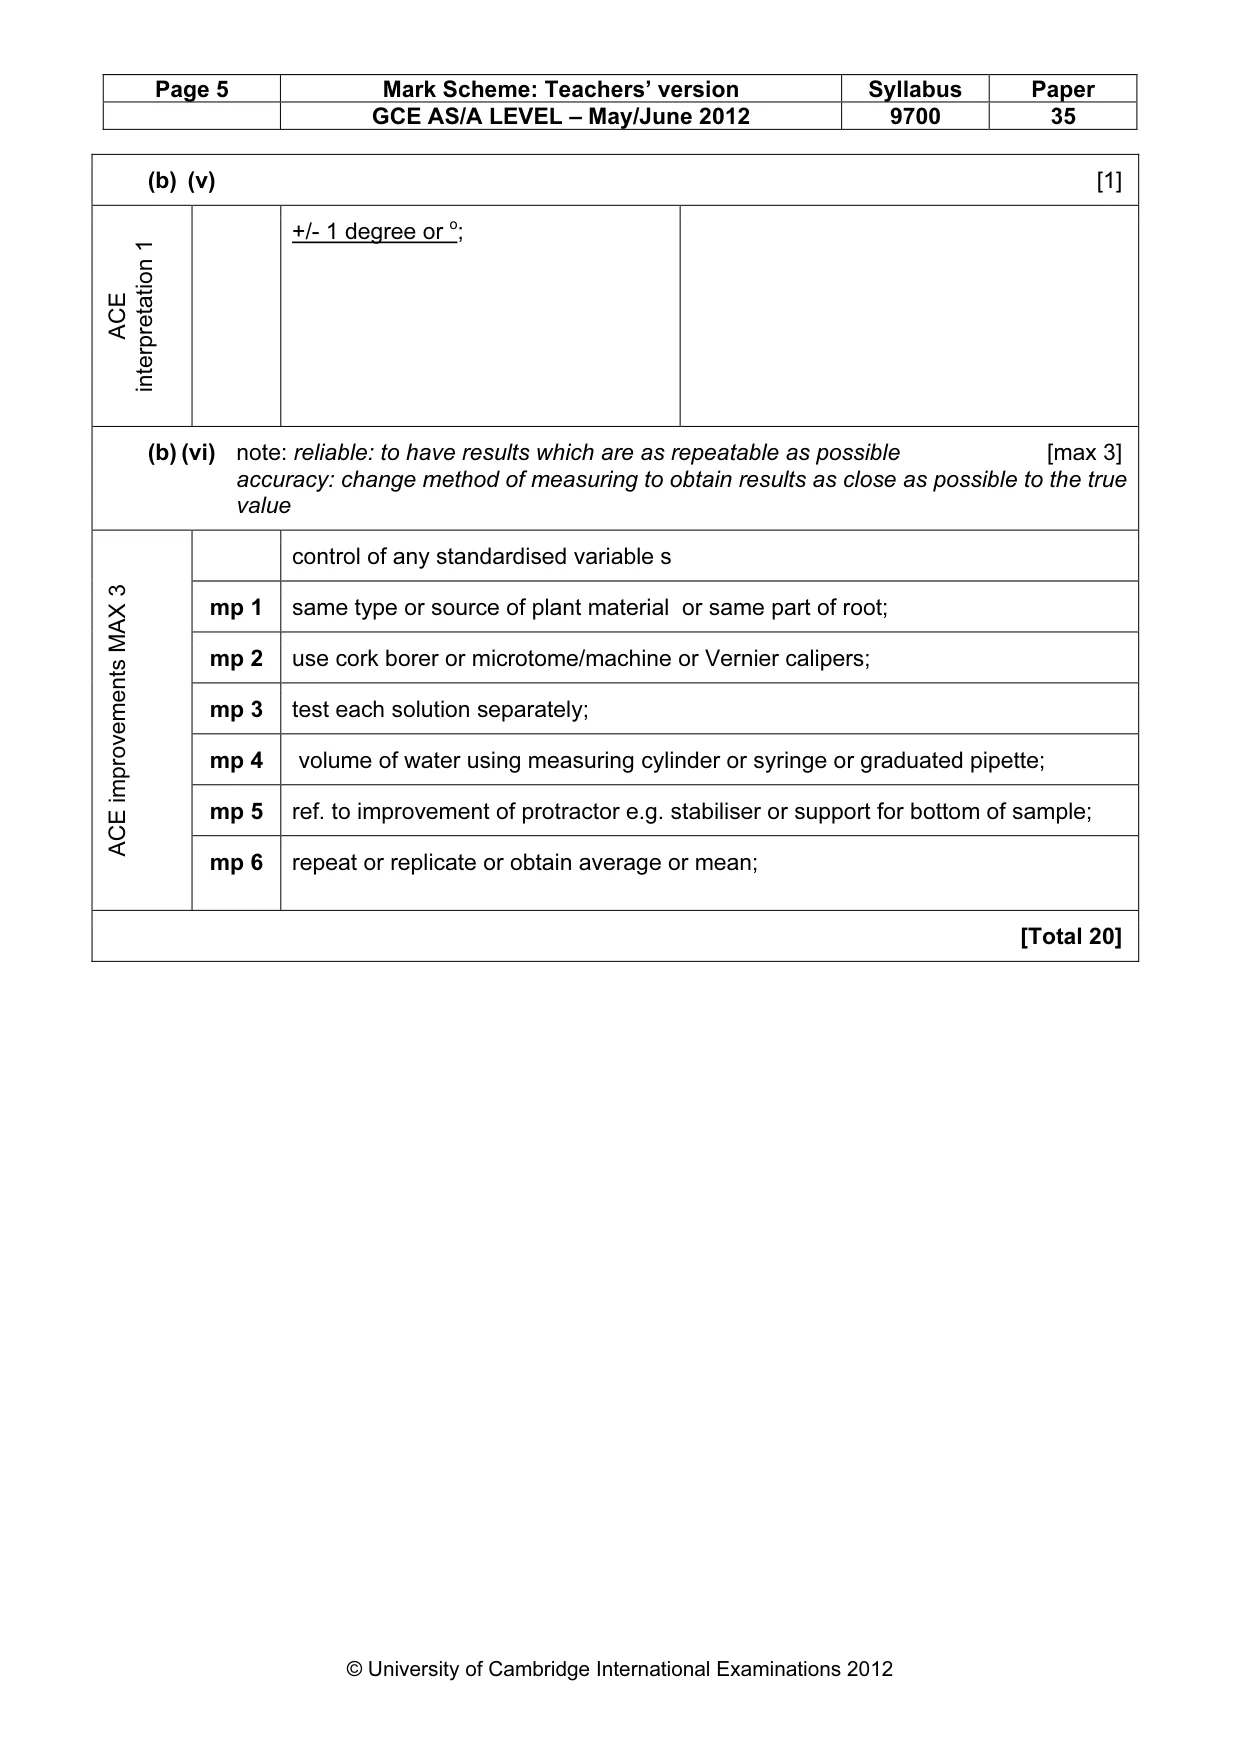
Page 5 Mark Scheme: Teachers’ version Syllabus Paper GCE AS/A LEVEL – May/June 2012 9700 35 © University of Cambridge International Examinations 2012 (b) (v) [1] ACE interpretation 1 +/- 1 degree or o; (b) (vi) note: reliable: to have results which are as repeatable as possible [max 3] accuracy: change method of measuring to obtain results as close as possible to the true value control of any standardised variable s mp 1 same type or source of plant material or same part of root; mp 2 use cork borer or microtome/machine or Vernier calipers; mp 3 test each solution separately; mp 4 volume of water using measuring cylinder or syringe or graduated pipette; mp 5 ref. to improvement of protractor e.g. stabiliser or support for bottom of sample; ACE improvements MAX 3 mp 6 repeat or replicate or obtain average or mean; [Total 20]
Mark scheme, page 6
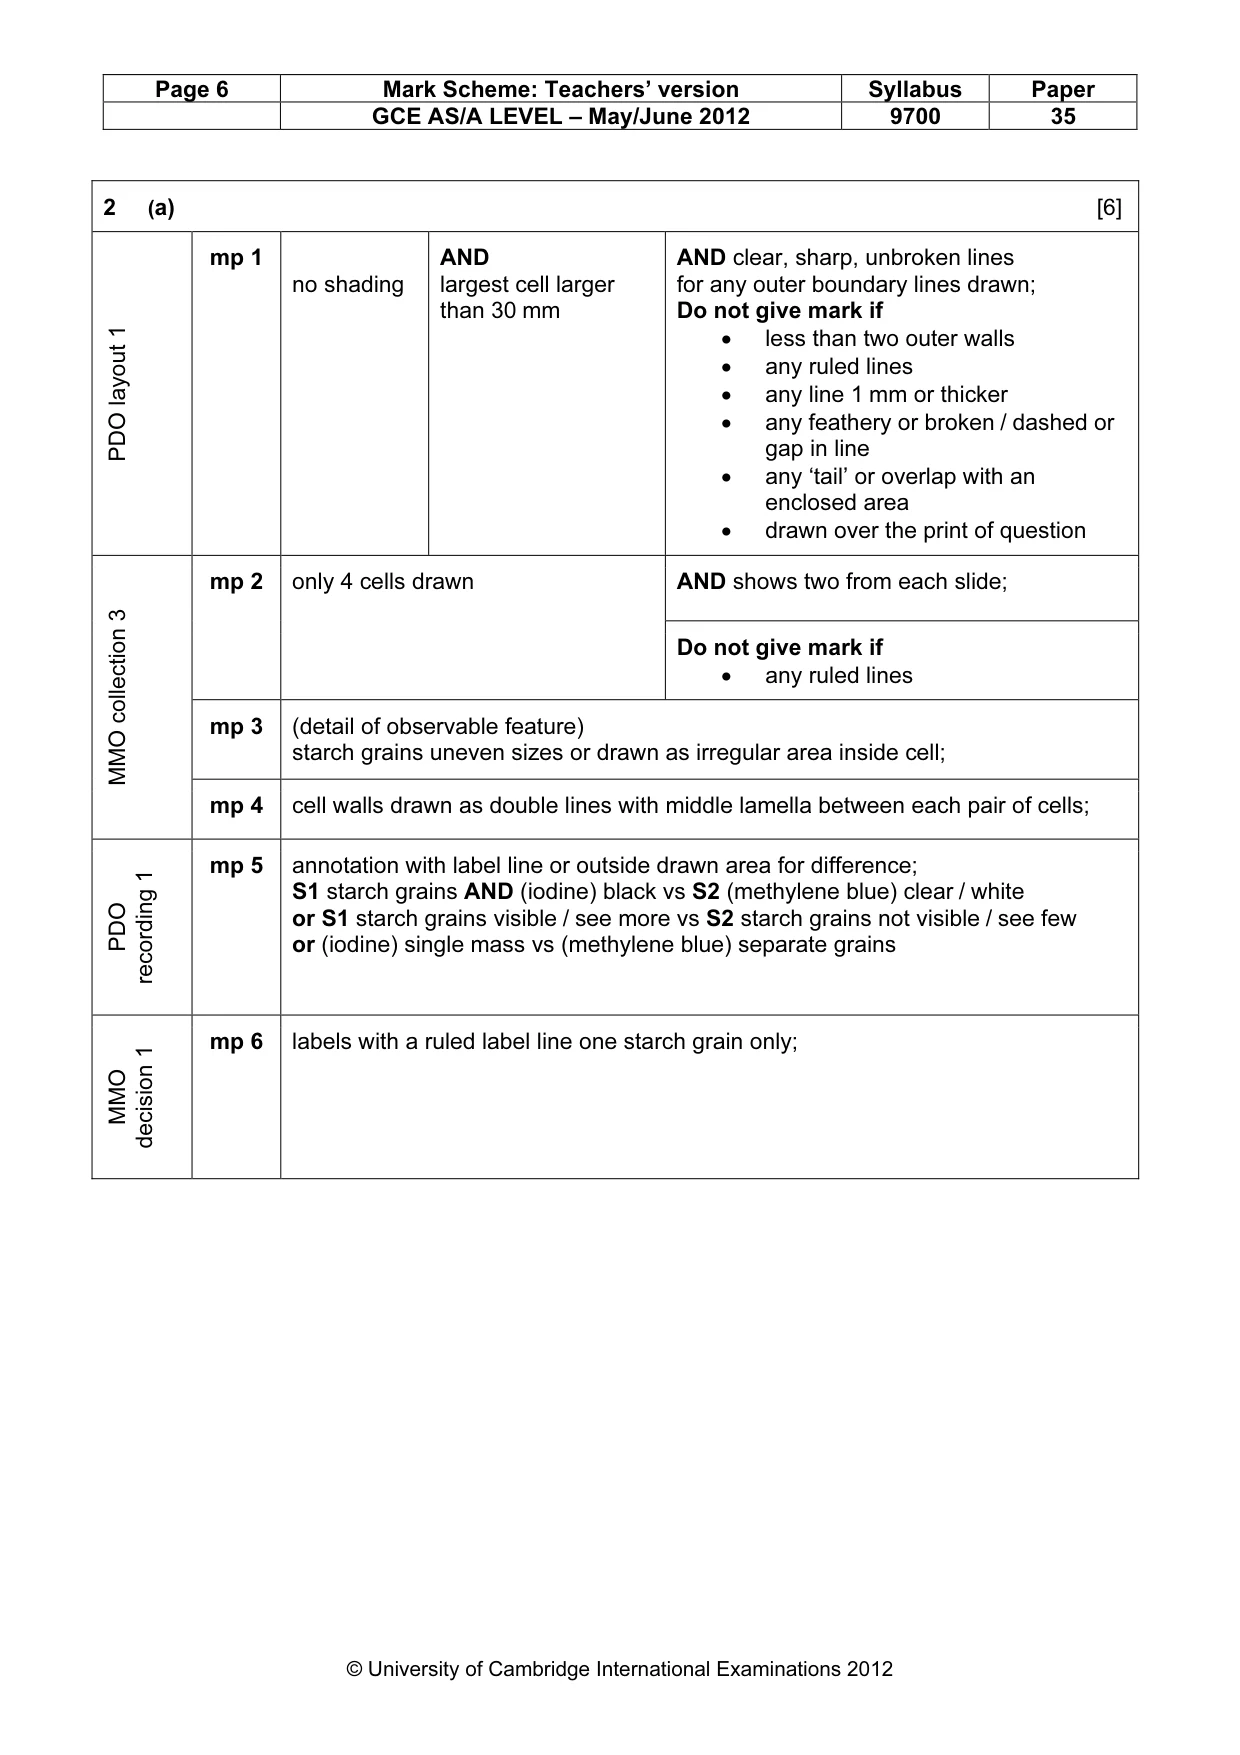
Page 6 Mark Scheme: Teachers’ version Syllabus Paper GCE AS/A LEVEL – May/June 2012 9700 35 © University of Cambridge International Examinations 2012 2 (a) [6] PDO layout 1 mp 1 no shading AND largest cell larger than 30 mm AND clear, sharp, unbroken lines for any outer boundary lines drawn; Do not give mark if • less than two outer walls • any ruled lines • any line 1 mm or thicker • any feathery or broken / dashed or gap in line • any ‘tail’ or overlap with an enclosed area • drawn over the print of question AND shows two from each slide; mp 2 only 4 cells drawn Do not give mark if • any ruled lines mp 3 (detail of observable feature) starch grains uneven sizes or drawn as irregular area inside cell; MMO collection 3 mp 4 cell walls drawn as double lines with middle lamella between each pair of cells; PDO recording 1 mp 5 annotation with label line or outside drawn area for difference; S1 starch grains AND (iodine) black vs S2 (methylene blue) clear / white or S1 starch grains visible / see more vs S2 starch grains not visible / see few or (iodine) single mass vs (methylene blue) separate grains MMO decision 1 mp 6 labels with a ruled label line one starch grain only;
Mark scheme, page 7
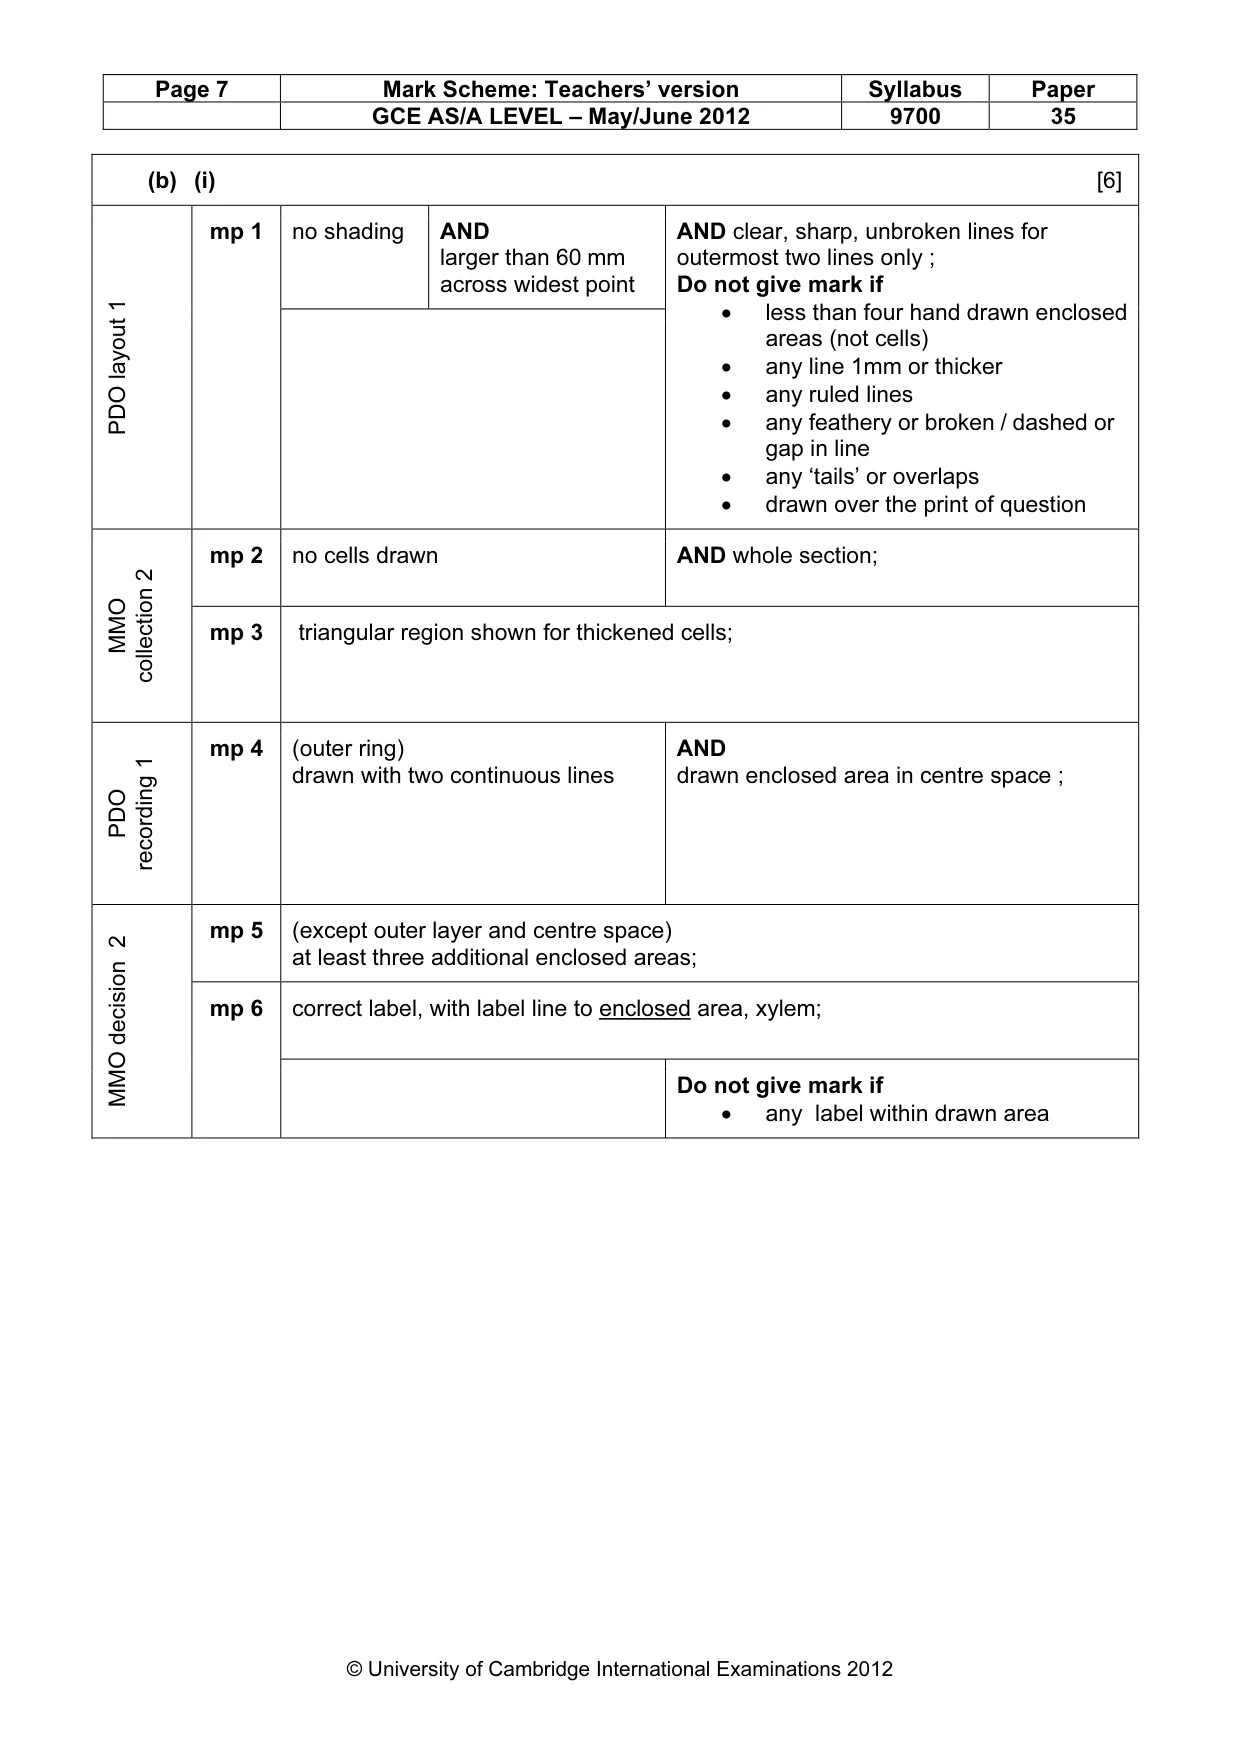
Page 7 Mark Scheme: Teachers’ version Syllabus Paper GCE AS/A LEVEL – May/June 2012 9700 35 © University of Cambridge International Examinations 2012 (b) (i) [6] no shading AND larger than 60 mm across widest point PDO layout 1 mp 1 AND clear, sharp, unbroken lines for outermost two lines only ; Do not give mark if • less than four hand drawn enclosed areas (not cells) • any line 1mm or thicker • any ruled lines • any feathery or broken / dashed or gap in line • any ‘tails’ or overlaps • drawn over the print of question mp 2 no cells drawn AND whole section; MMO collection 2 mp 3 triangular region shown for thickened cells; PDO recording 1 mp 4 (outer ring) drawn with two continuous lines AND drawn enclosed area in centre space ; mp 5 (except outer layer and centre space) at least three additional enclosed areas; correct label, with label line to enclosed area, xylem; MMO decision 2 mp 6 Do not give mark if • any label within drawn area
Mark scheme, page 8
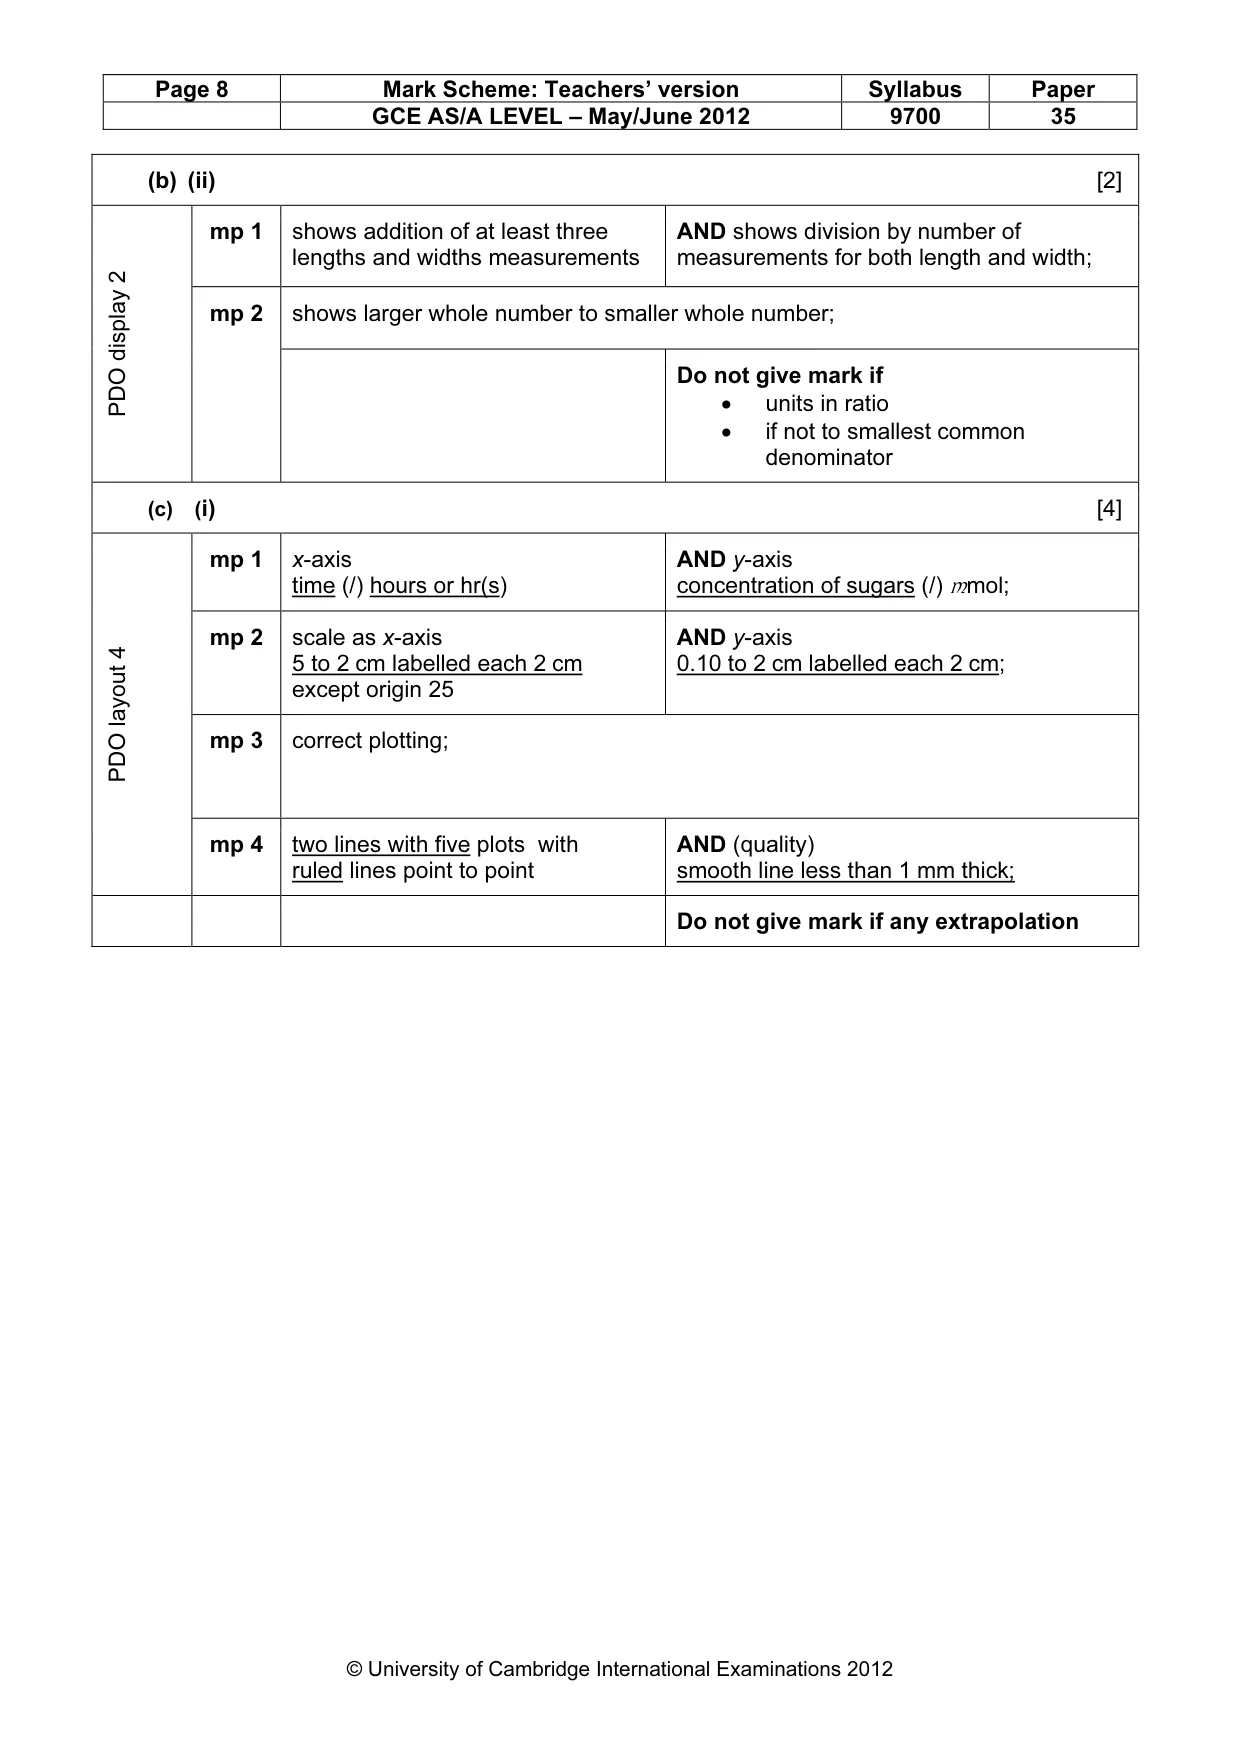
Page 8 Mark Scheme: Teachers’ version Syllabus Paper GCE AS/A LEVEL – May/June 2012 9700 35 © University of Cambridge International Examinations 2012 (b) (ii) [2] mp 1 shows addition of at least three lengths and widths measurements AND shows division by number of measurements for both length and width; shows larger whole number to smaller whole number; PDO display 2 mp 2 Do not give mark if • units in ratio • if not to smallest common denominator (c) (i) [4] mp 1 x-axis time (/) hours or hr(s) AND y-axis concentration of sugars (/) mmol; mp 2 scale as x-axis 5 to 2 cm labelled each 2 cm except origin 25 AND y-axis 0.10 to 2 cm labelled each 2 cm; mp 3 correct plotting; PDO layout 4 mp 4 two lines with five plots with ruled lines point to point AND (quality) smooth line less than 1 mm thick; Do not give mark if any extrapolation
Mark scheme, page 9
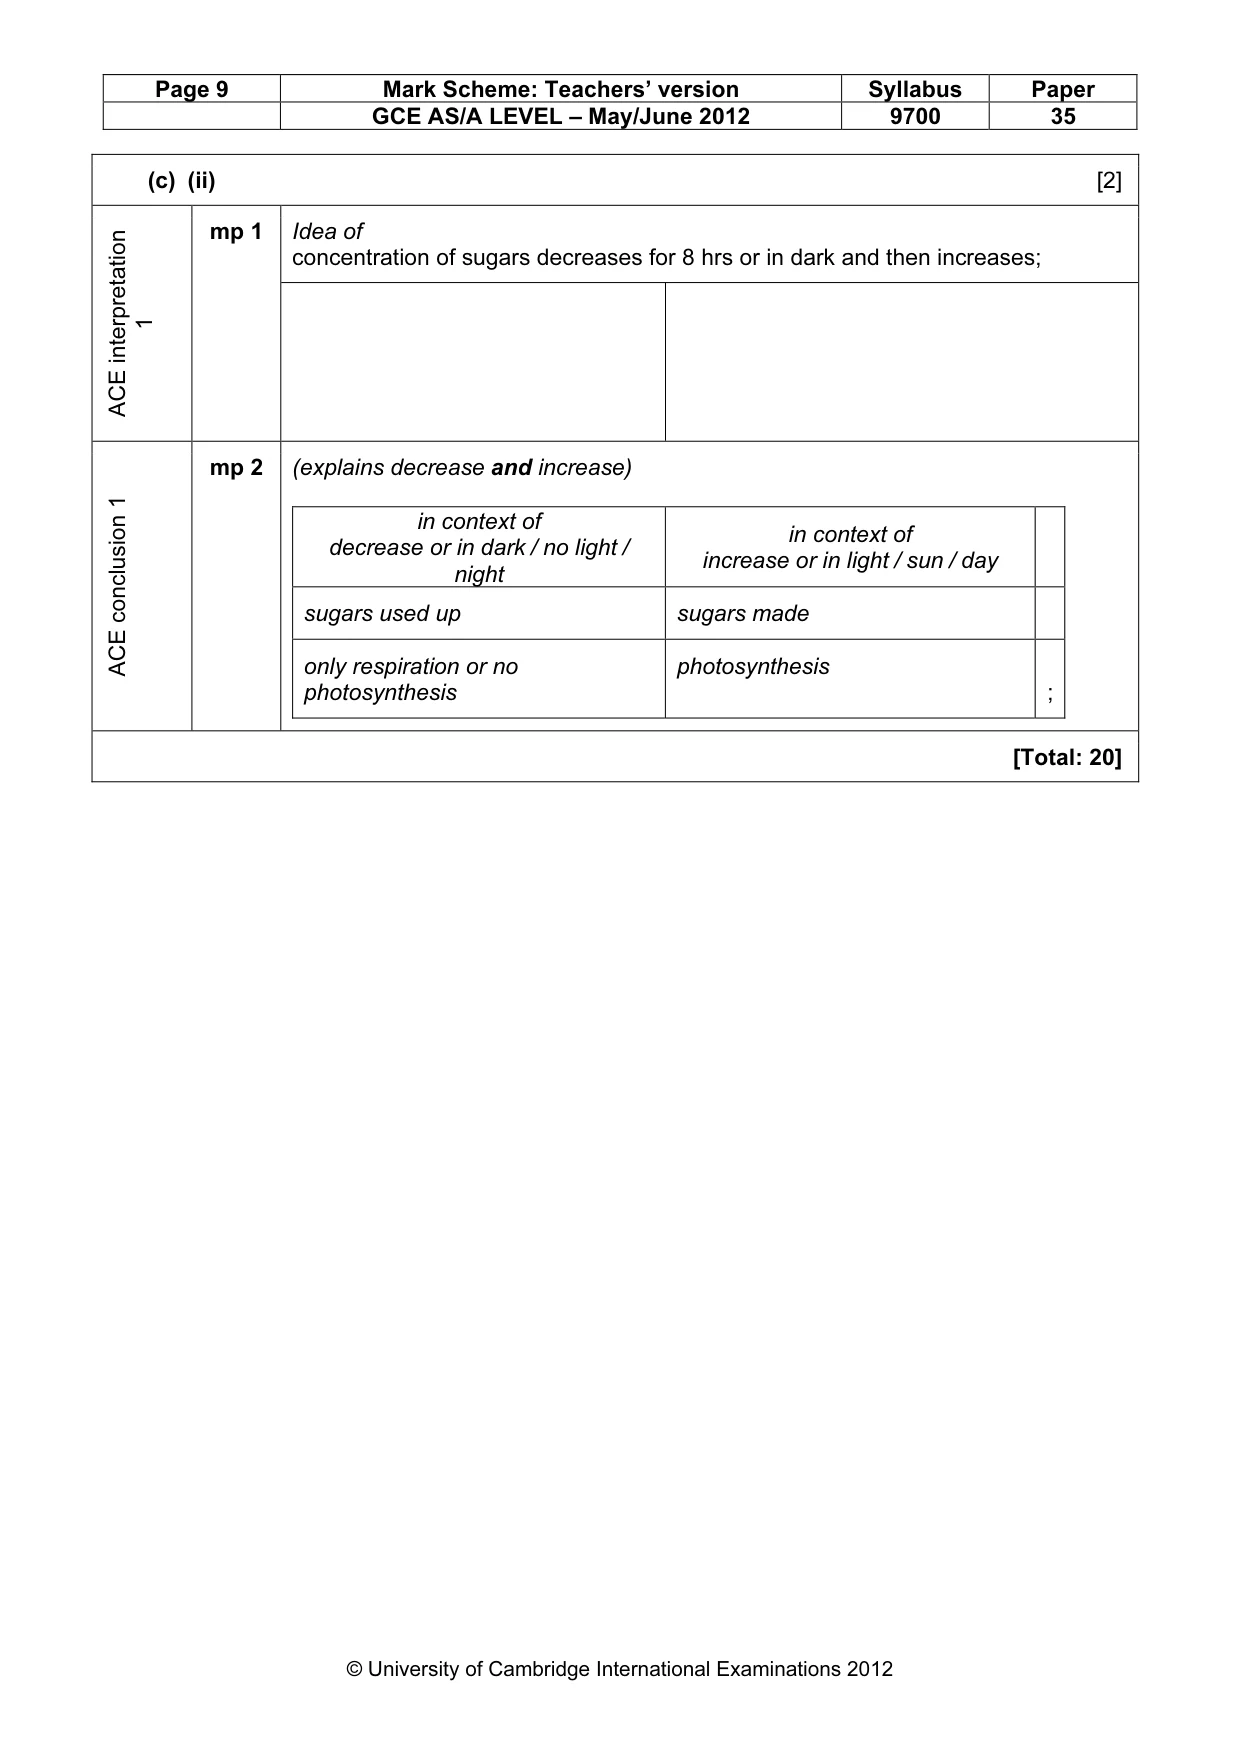
Page 9 Mark Scheme: Teachers’ version Syllabus Paper GCE AS/A LEVEL – May/June 2012 9700 35 © University of Cambridge International Examinations 2012 (c) (ii) [2] Idea of concentration of sugars decreases for 8 hrs or in dark and then increases; ACE interpretation 1 mp 1 ACE conclusion 1 mp 2 (explains decrease and increase) in context of decrease or in dark / no light / night in context of increase or in light / sun / day sugars used up sugars made only respiration or no photosynthesis photosynthesis ; [Total: 20]
What you needed in this session
Cambridge’s own grade thresholds for 2012 May/June, Paper 3 · Variant 5. A higher threshold means an easier paper — the bar moves with how the cohort did.