Cambridge A Level Biology 9700 — 2008 Oct/Nov Paper 5 · Variant 1
9700/51/O/N/08 · 30 marks · ≈34 min
The question paper and its mark scheme, free to read here and free to download. This is Cambridge’s own paper, exactly as it was sat.
Question paper12 pages



Mark scheme6 pages
Answers below. Sit the paper first if you are practising.
Paper as text
Question paper, page 1
For Examiner’s Use 1 2 3 Total This document consists of 8 printed pages and 4 blank pages. SPA (FF/CG) T52857/4 © UCLES 2008 [Turn over UNIVERSITY OF CAMBRIDGE INTERNATIONAL EXAMINATIONS General Certificate of Education Advanced Level READ THESE INSTRUCTIONS FIRST Write your Centre number, candidate number and name on all the work you hand in. Write in dark blue or black pen. You may use a pencil for any diagrams, graphs or rough working. Do not use staples, paper clips, highlighters, glue or correction fluid. DO NOT WRITE IN ANY BARCODES. Answer all questions. At the end of the examination, fasten all your work securely together. The number of marks is given in brackets [ ] at the end of each question or part question. * 9 9 3 0 0 2 9 8 4 0 * BIOLOGY 9700/05 Paper 5 Planning, Analysis and Evaluation October/November 2008 1 hour 15 minutes Candidates answer on the Question Paper. No Additional Materials are required.
Question paper, page 2
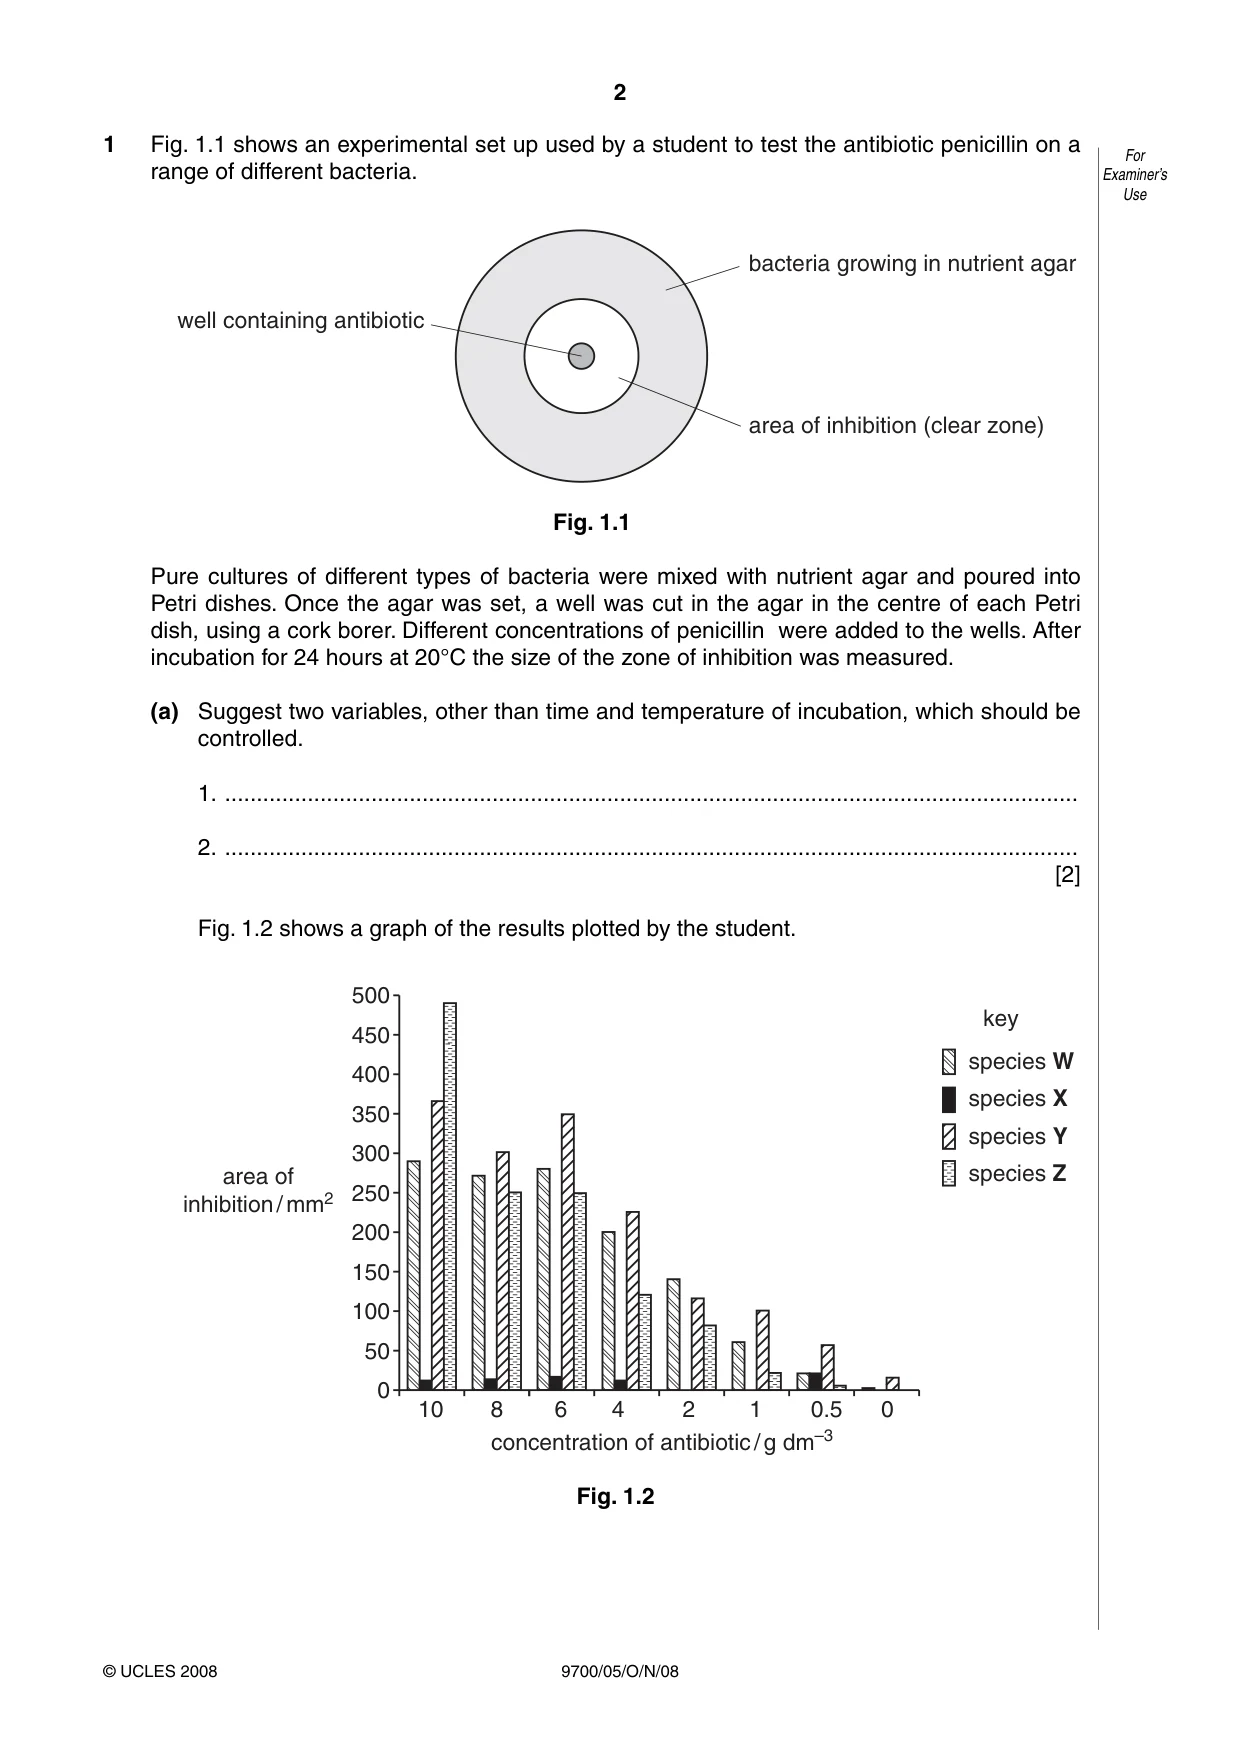
2 9700/05/O/N/08 © UCLES 2008 For Examiner’s Use 1 Fig. 1.1 shows an experimental set up used by a student to test the antibiotic penicillin on a range of different bacteria. well containing antibiotic bacteria growing in nutrient agar area of inhibition (clear zone) Fig. 1.1 Pure cultures of different types of bacteria were mixed with nutrient agar and poured into Petri dishes. Once the agar was set, a well was cut in the agar in the centre of each Petri dish, using a cork borer. Different concentrations of penicillin were added to the wells. After incubation for 24 hours at 20°C the size of the zone of inhibition was measured. (a) Suggest two variables, other than time and temperature of incubation, which should be controlled. 1. … 2. … [2] Fig. 1.2 shows a graph of the results plotted by the student. 10 0 50 100 150 200 250 300 350 400 450 500 8 6 4 concentration of antibiotic / g dm–3 area of inhibition / mm2 2 1 0.5 0 species W key species X species Y species Z Fig. 1.2
Question paper, page 3
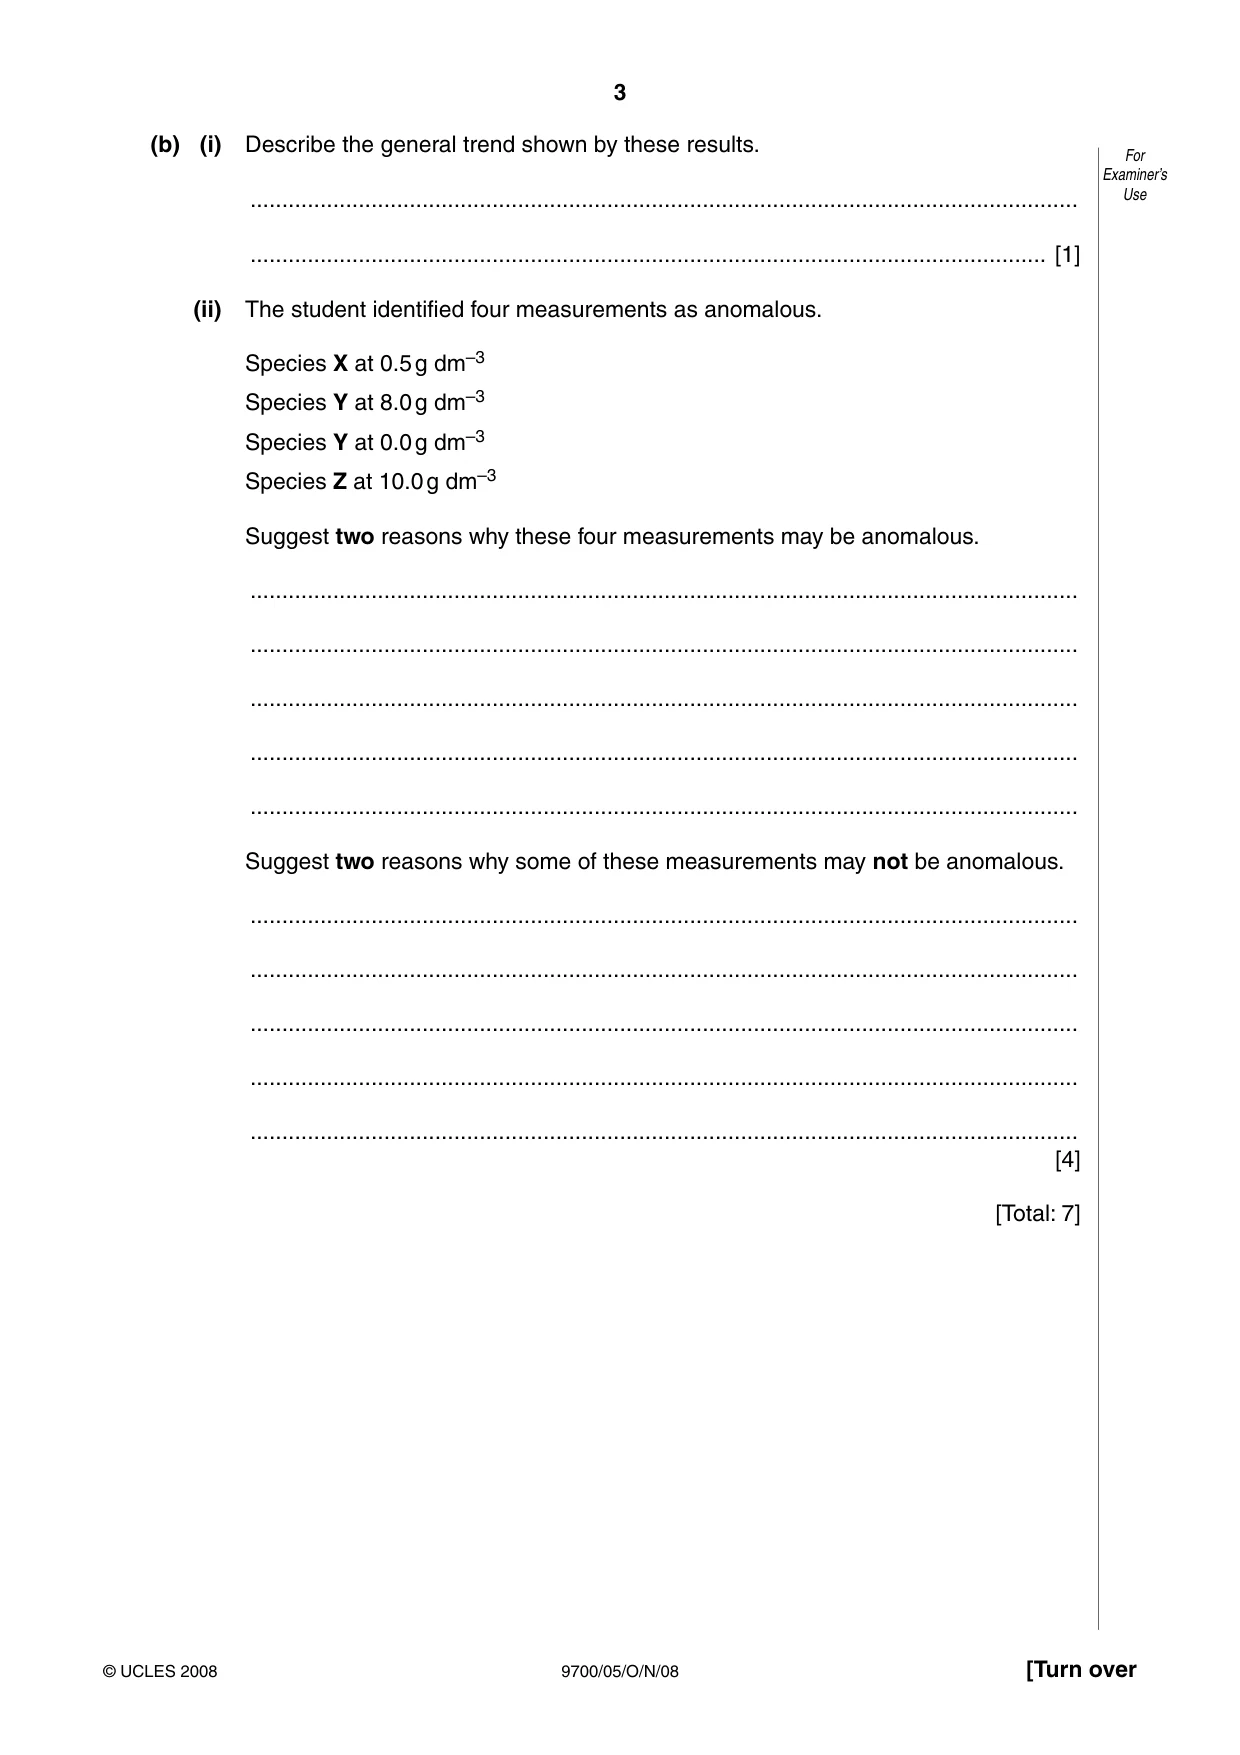
3 9700/05/O/N/08 © UCLES 2008 [Turn over For Examiner’s Use (b) (i) Describe the general trend shown by these results. … … [1] (ii) The student identified four measurements as anomalous. Species X at 0.5 g dm–3 Species Y at 8.0 g dm–3 Species Y at 0.0 g dm–3 Species Z at 10.0 g dm–3 Suggest two reasons why these four measurements may be anomalous. … … … … … Suggest two reasons why some of these measurements may not be anomalous. … … … … … [4] [Total: 7]
Question paper, page 4
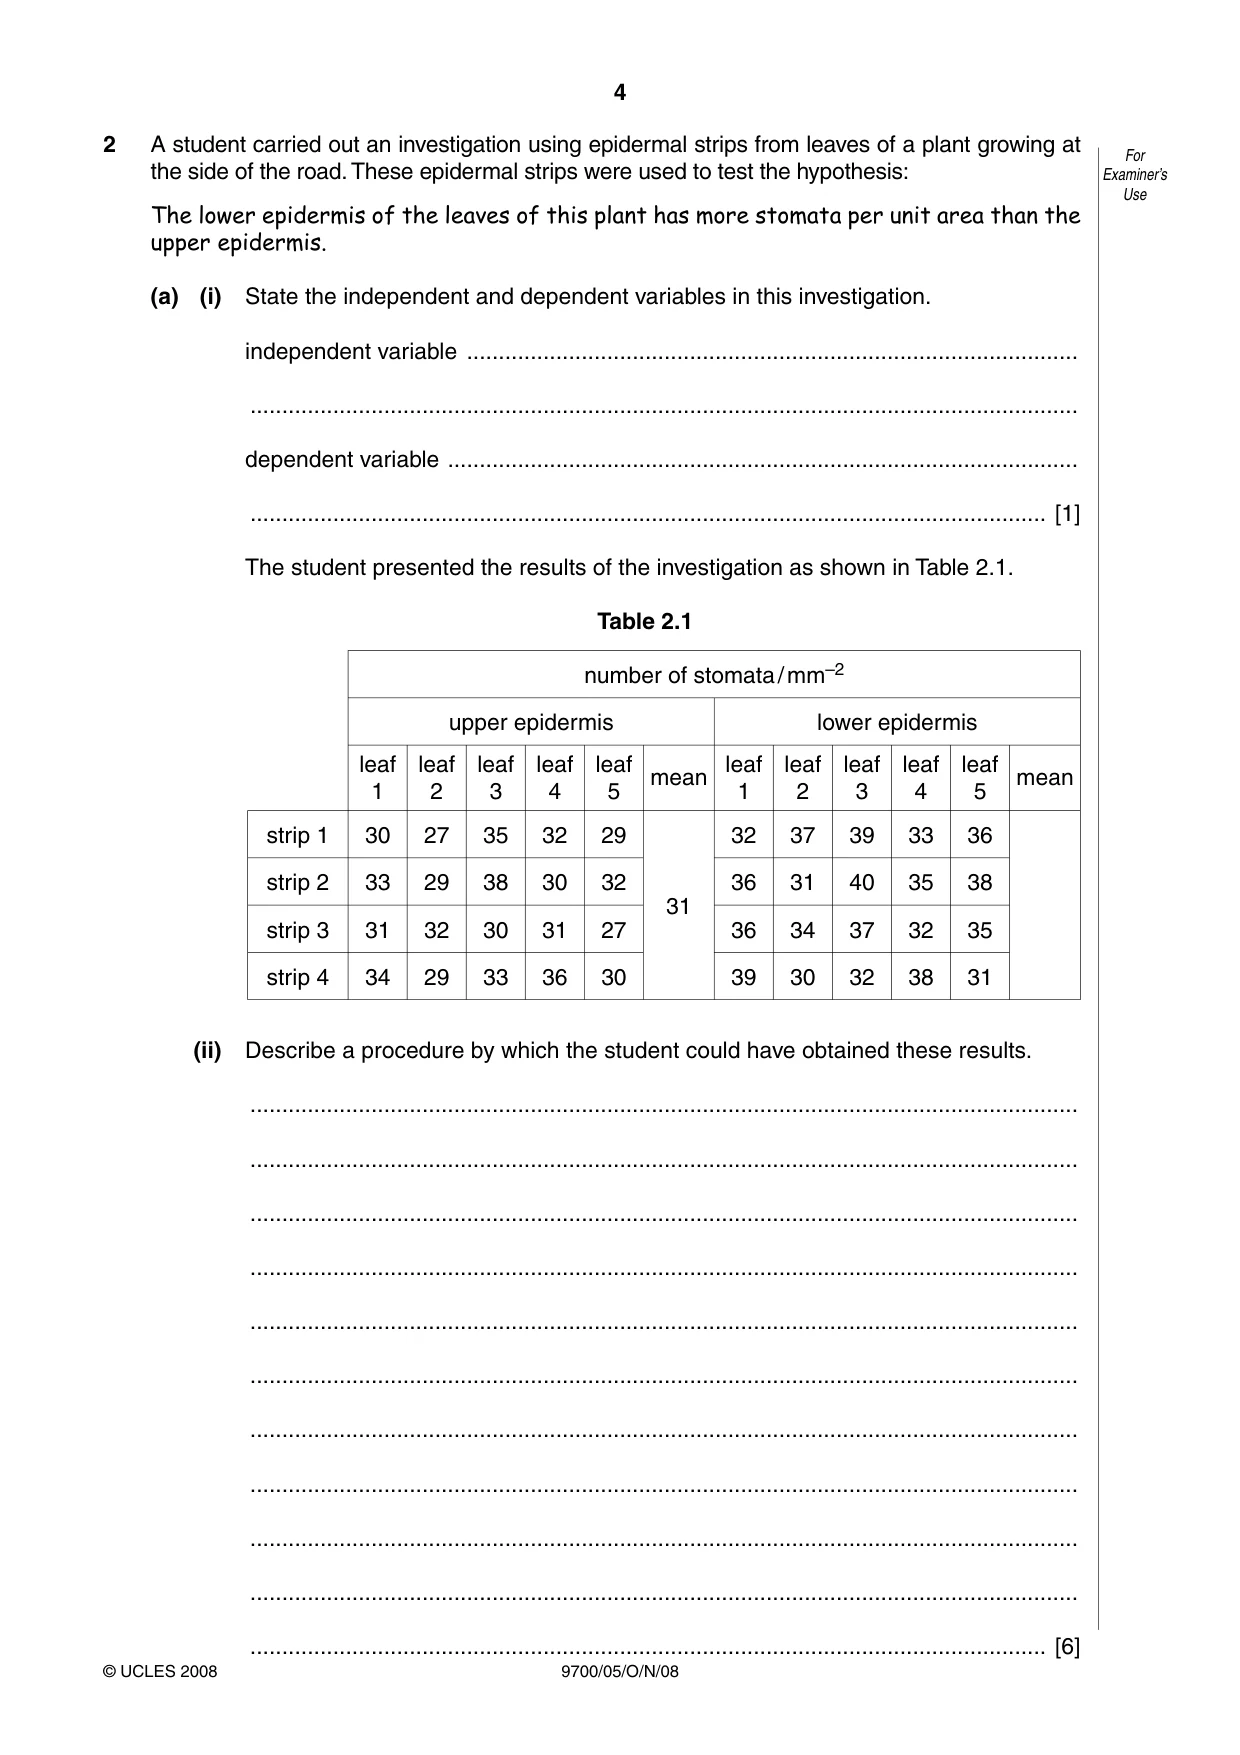
4 9700/05/O/N/08 © UCLES 2008 For Examiner’s Use 2 A student carried out an investigation using epidermal strips from leaves of a plant growing at the side of the road. These epidermal strips were used to test the hypothesis: The lower epidermis of the leaves of this plant has more stomata per unit area than the upper epidermis. (a) (i) State the independent and dependent variables in this investigation. independent variable … … dependent variable … … [1] The student presented the results of the investigation as shown in Table 2.1. Table 2.1 number of stomata / mm–2 upper epidermis lower epidermis leaf 1 leaf 2 leaf 3 leaf 4 leaf 5 mean leaf 1 leaf 2 leaf 3 leaf 4 leaf 5 mean strip 1 30 27 35 32 29 31 32 37 39 33 36 strip 2 33 29 38 30 32 36 31 40 35 38 strip 3 31 32 30 31 27 36 34 37 32 35 strip 4 34 29 33 36 30 39 30 32 38 31 (ii) Describe a procedure by which the student could have obtained these results. … … … … … … … … … … … [6]
Question paper, page 5
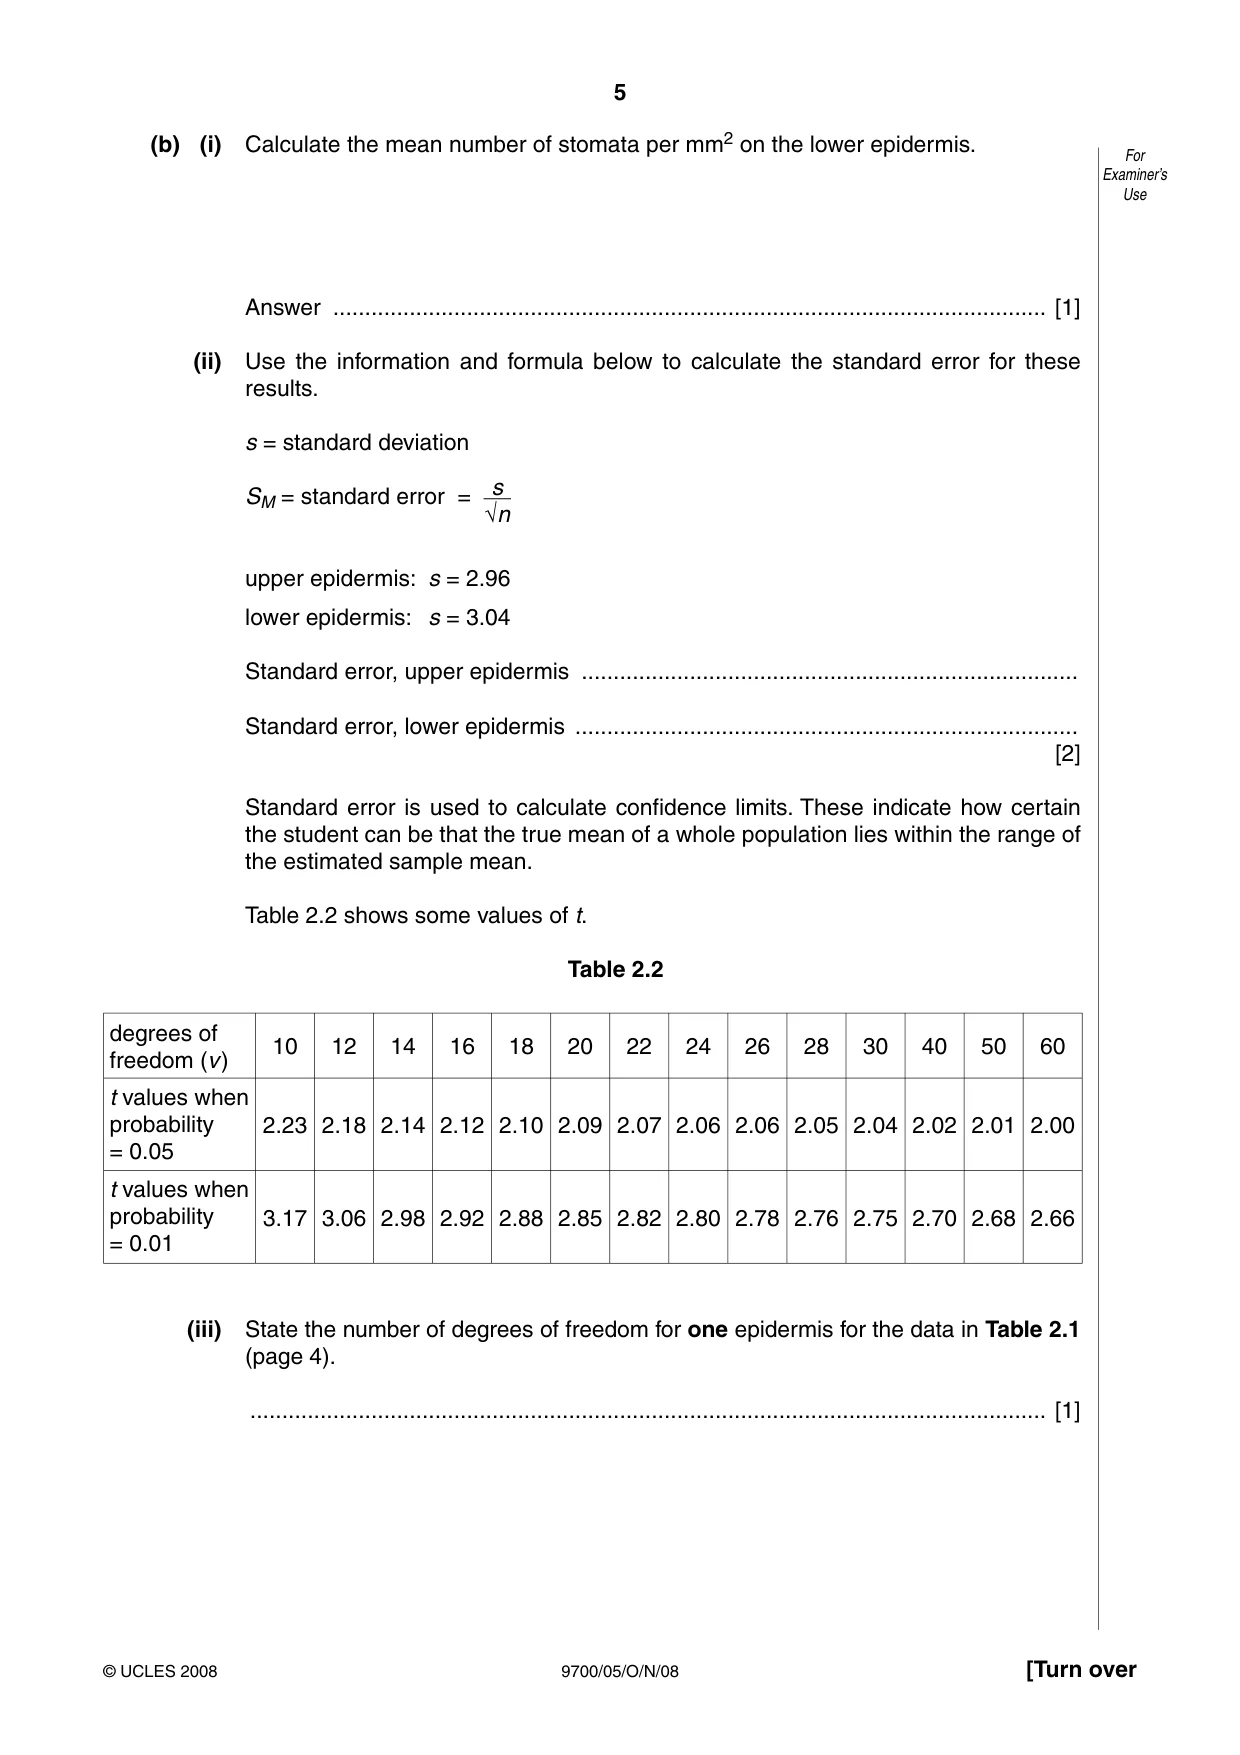
5 9700/05/O/N/08 © UCLES 2008 [Turn over For Examiner’s Use (b) (i) Calculate the mean number of stomata per mm2 on the lower epidermis. Answer … [1] (ii) Use the information and formula below to calculate the standard error for these results. s = standard deviation SM = standard error = s √n upper epidermis: s = 2.96 lower epidermis: s = 3.04 Standard error, upper epidermis … Standard error, lower epidermis … [2] Standard error is used to calculate confidence limits. These indicate how certain the student can be that the true mean of a whole population lies within the range of the estimated sample mean. Table 2.2 shows some values of t. Table 2.2 degrees of freedom (v ) 10 12 14 16 18 20 22 24 26 28 30 40 50 60 t values when probability = 0.05 2.23 2.18 2.14 2.12 2.10 2.09 2.07 2.06 2.06 2.05 2.04 2.02 2.01 2.00 t values when probability = 0.01 3.17 3.06 2.98 2.92 2.88 2.85 2.82 2.80 2.78 2.76 2.75 2.70 2.68 2.66 (iii) State the number of degrees of freedom for one epidermis for the data in Table 2.1 (page 4). … [1]
Question paper, page 6
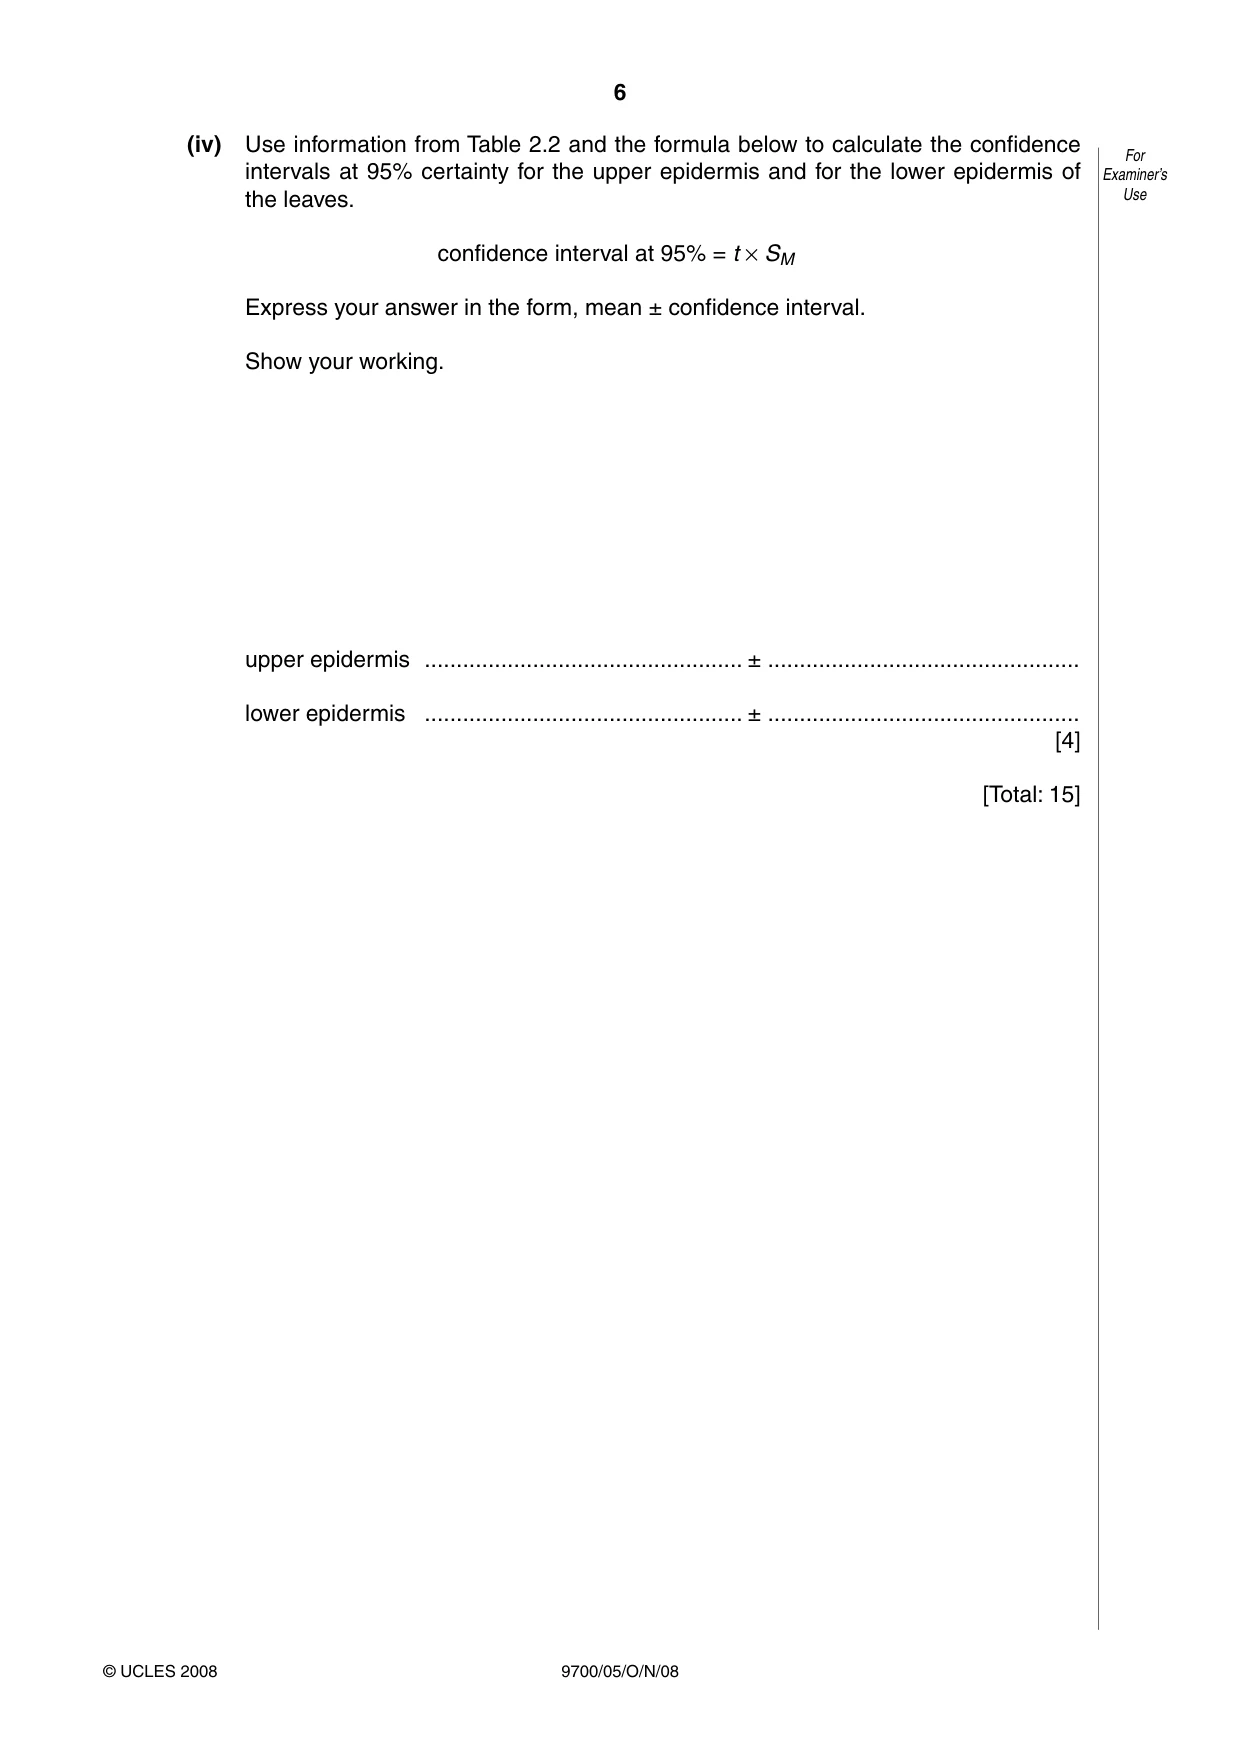
6 9700/05/O/N/08 © UCLES 2008 For Examiner’s Use (iv) Use information from Table 2.2 and the formula below to calculate the confidence intervals at 95% certainty for the upper epidermis and for the lower epidermis of the leaves. confidence interval at 95% = t × SM Express your answer in the form, mean ± confidence interval. Show your working. upper epidermis … ± … lower epidermis … ± … [4] [Total: 15]
Question paper, page 7
7 9700/05/O/N/08 [Turn over BLANK PAGE Question 3 starts on Page 8.
Question paper, page 8
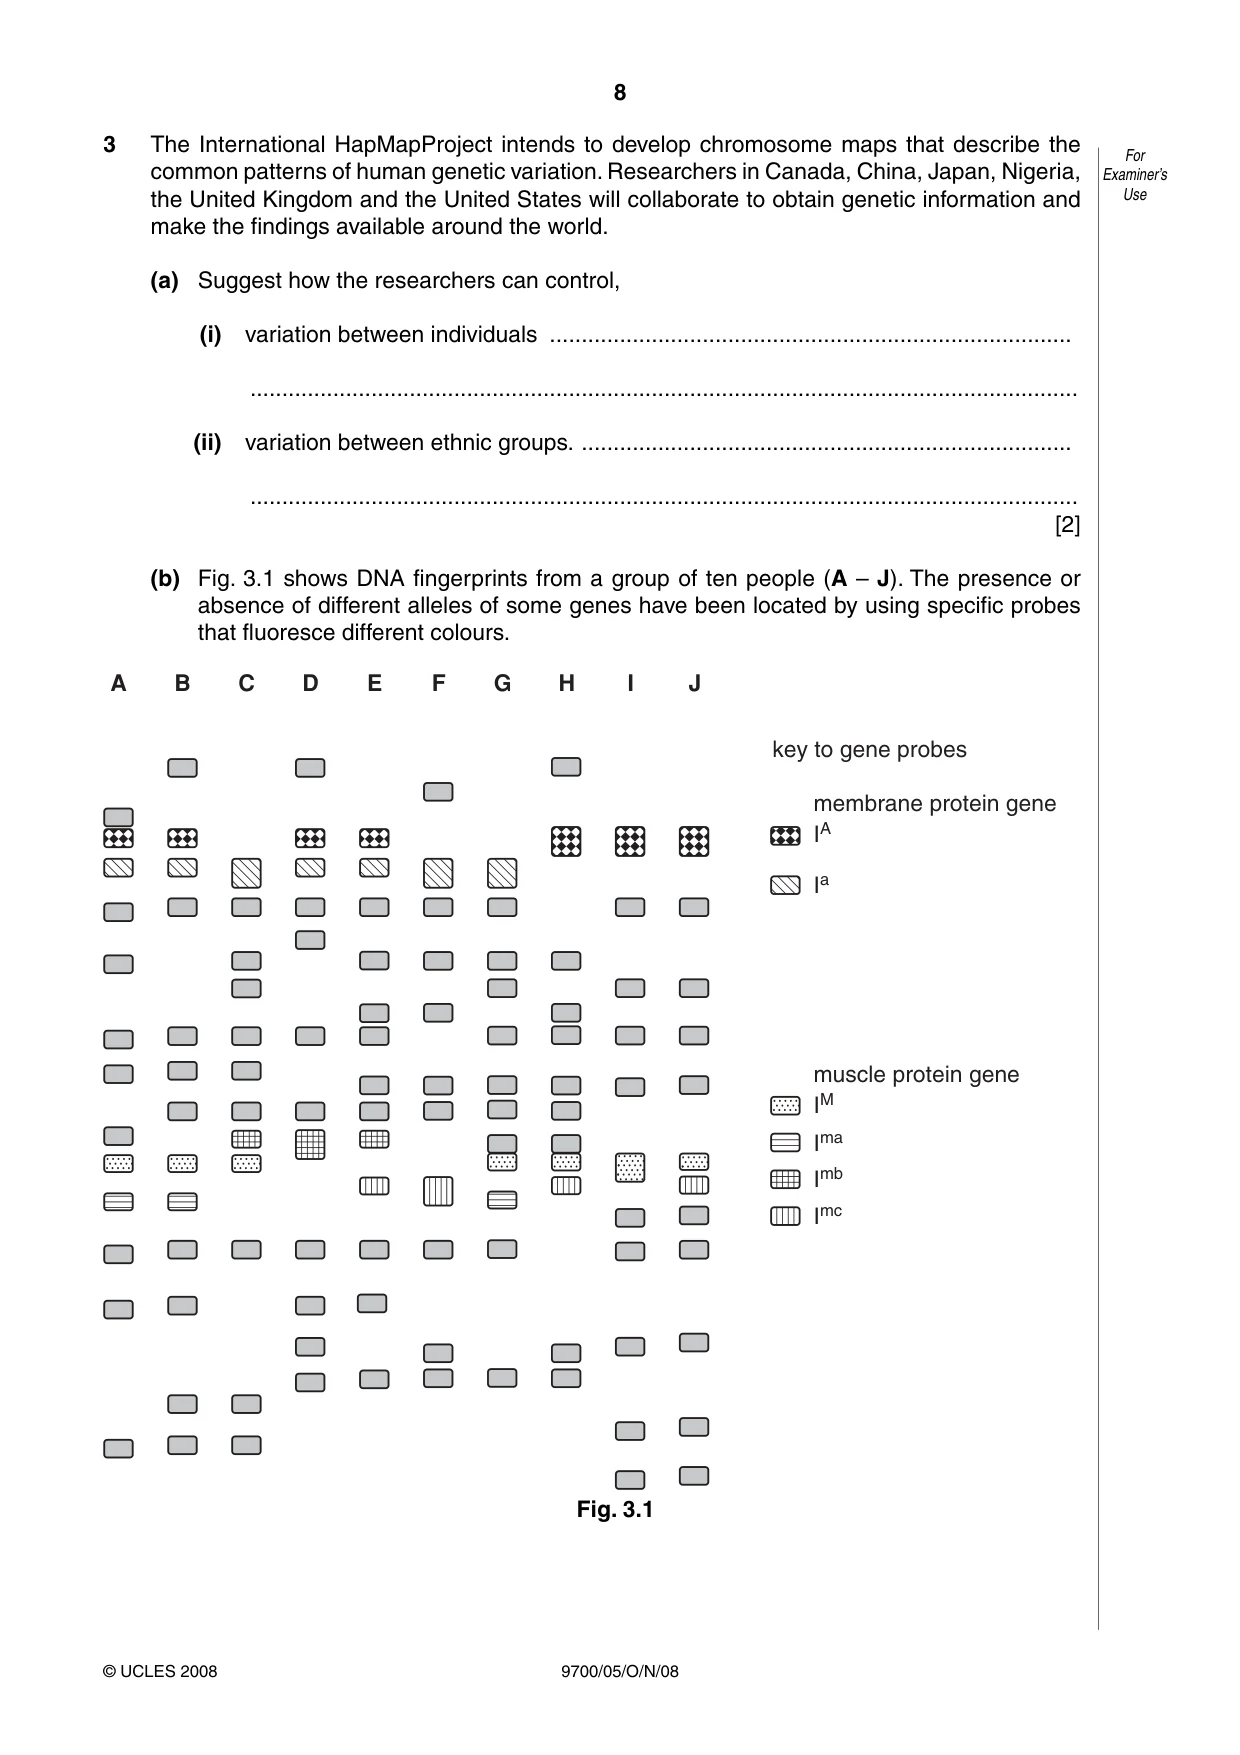
8 9700/05/O/N/08 © UCLES 2008 For Examiner’s Use 3 The International HapMapProject intends to develop chromosome maps that describe the common patterns of human genetic variation. Researchers in Canada, China, Japan, Nigeria, the United Kingdom and the United States will collaborate to obtain genetic information and make the findings available around the world. (a) Suggest how the researchers can control, (i) variation between individuals … … (ii) variation between ethnic groups. … … [2] (b) Fig. 3.1 shows DNA fingerprints from a group of ten people (A – J). The presence or absence of different alleles of some genes have been located by using specific probes that fluoresce different colours. A B C D E F G H I J key to gene probes membrane protein gene IA Ia muscle protein gene IM Ima Imb Imc Fig. 3.1
Question paper, page 9
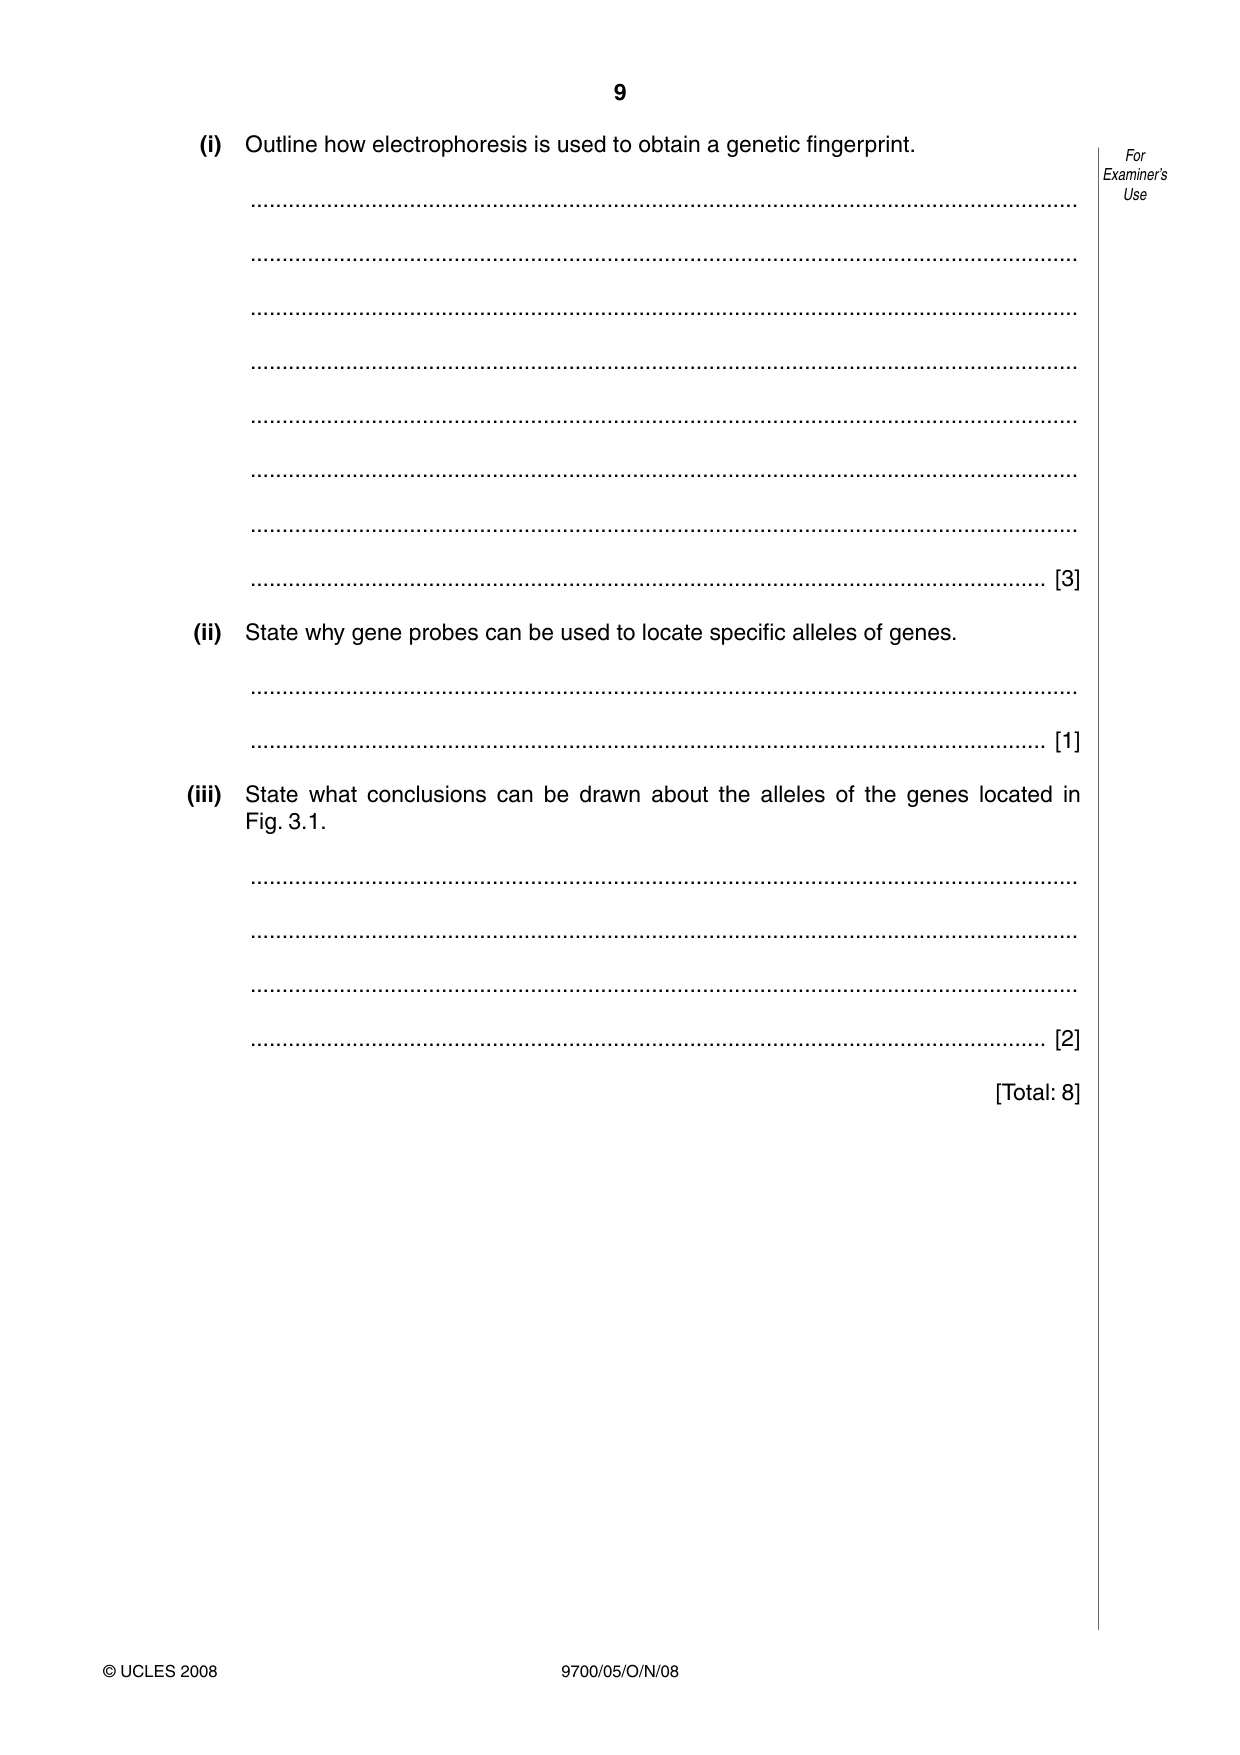
9 9700/05/O/N/08 © UCLES 2008 (i) Outline how electrophoresis is used to obtain a genetic fingerprint. … … … … … … … … [3] (ii) State why gene probes can be used to locate specific alleles of genes. … … [1] (iii) State what conclusions can be drawn about the alleles of the genes located in Fig. 3.1. … … … … [2] [Total: 8] For Examiner’s Use
Question paper, page 12
12 9700/05/O/N/08 Permission to reproduce items where third-party owned material protected by copyright is included has been sought and cleared where possible. Every reasonable effort has been made by the publisher (UCLES) to trace copyright holders, but if any items requiring clearance have unwittingly been included, the publisher will be pleased to make amends at the earliest possible opportunity. University of Cambridge International Examinations is part of the Cambridge Assessment Group. Cambridge Assessment is the brand name of University of Cambridge Local Examinations Syndicate (UCLES), which is itself a department of the University of Cambridge. BLANK PAGE
Mark scheme, page 1
UNIVERSITY OF CAMBRIDGE INTERNATIONAL EXAMINATIONS GCE Advanced Subsidiary Level and GCE Advanced Level MARK SCHEME for the October/November 2008 question paper 9700 BIOLOGY 9700/05 Paper 5 (Practical 2), maximum raw mark 30 This mark scheme is published as an aid to teachers and candidates, to indicate the requirements of the examination. It shows the basis on which Examiners were instructed to award marks. It does not indicate the details of the discussions that took place at an Examiners’ meeting before marking began. All Examiners are instructed that alternative correct answers and unexpected approaches in candidates’ scripts must be given marks that fairly reflect the relevant knowledge and skills demonstrated. Mark schemes must be read in conjunction with the question papers and the report on the examination. • CIE will not enter into discussions or correspondence in connection with these mark schemes. CIE is publishing the mark schemes for the October/November 2008 question papers for most IGCSE, GCE Advanced Level and Advanced Subsidiary Level syllabuses and some Ordinary Level syllabuses.
Mark scheme, page 2
Page 2 Mark Scheme Syllabus Paper GCE A/AS LEVEL – October/November 2008 9700 05 © UCLES 2007 Abbreviations, annotations and conventions used in the Mark Scheme / = alternative and acceptable answers for the same marking point ; = separates marking points NOT = answers which are not worthy of credit ( ) = words which are not essential to gain credit = (underlining) key words which must be used to gain credit ecf = error carried forward AW = alternative wording ora = or reverse argument A comma in a mark point indicates that information on both sides of the comma is needed for the mark to be awarded
Mark scheme, page 3
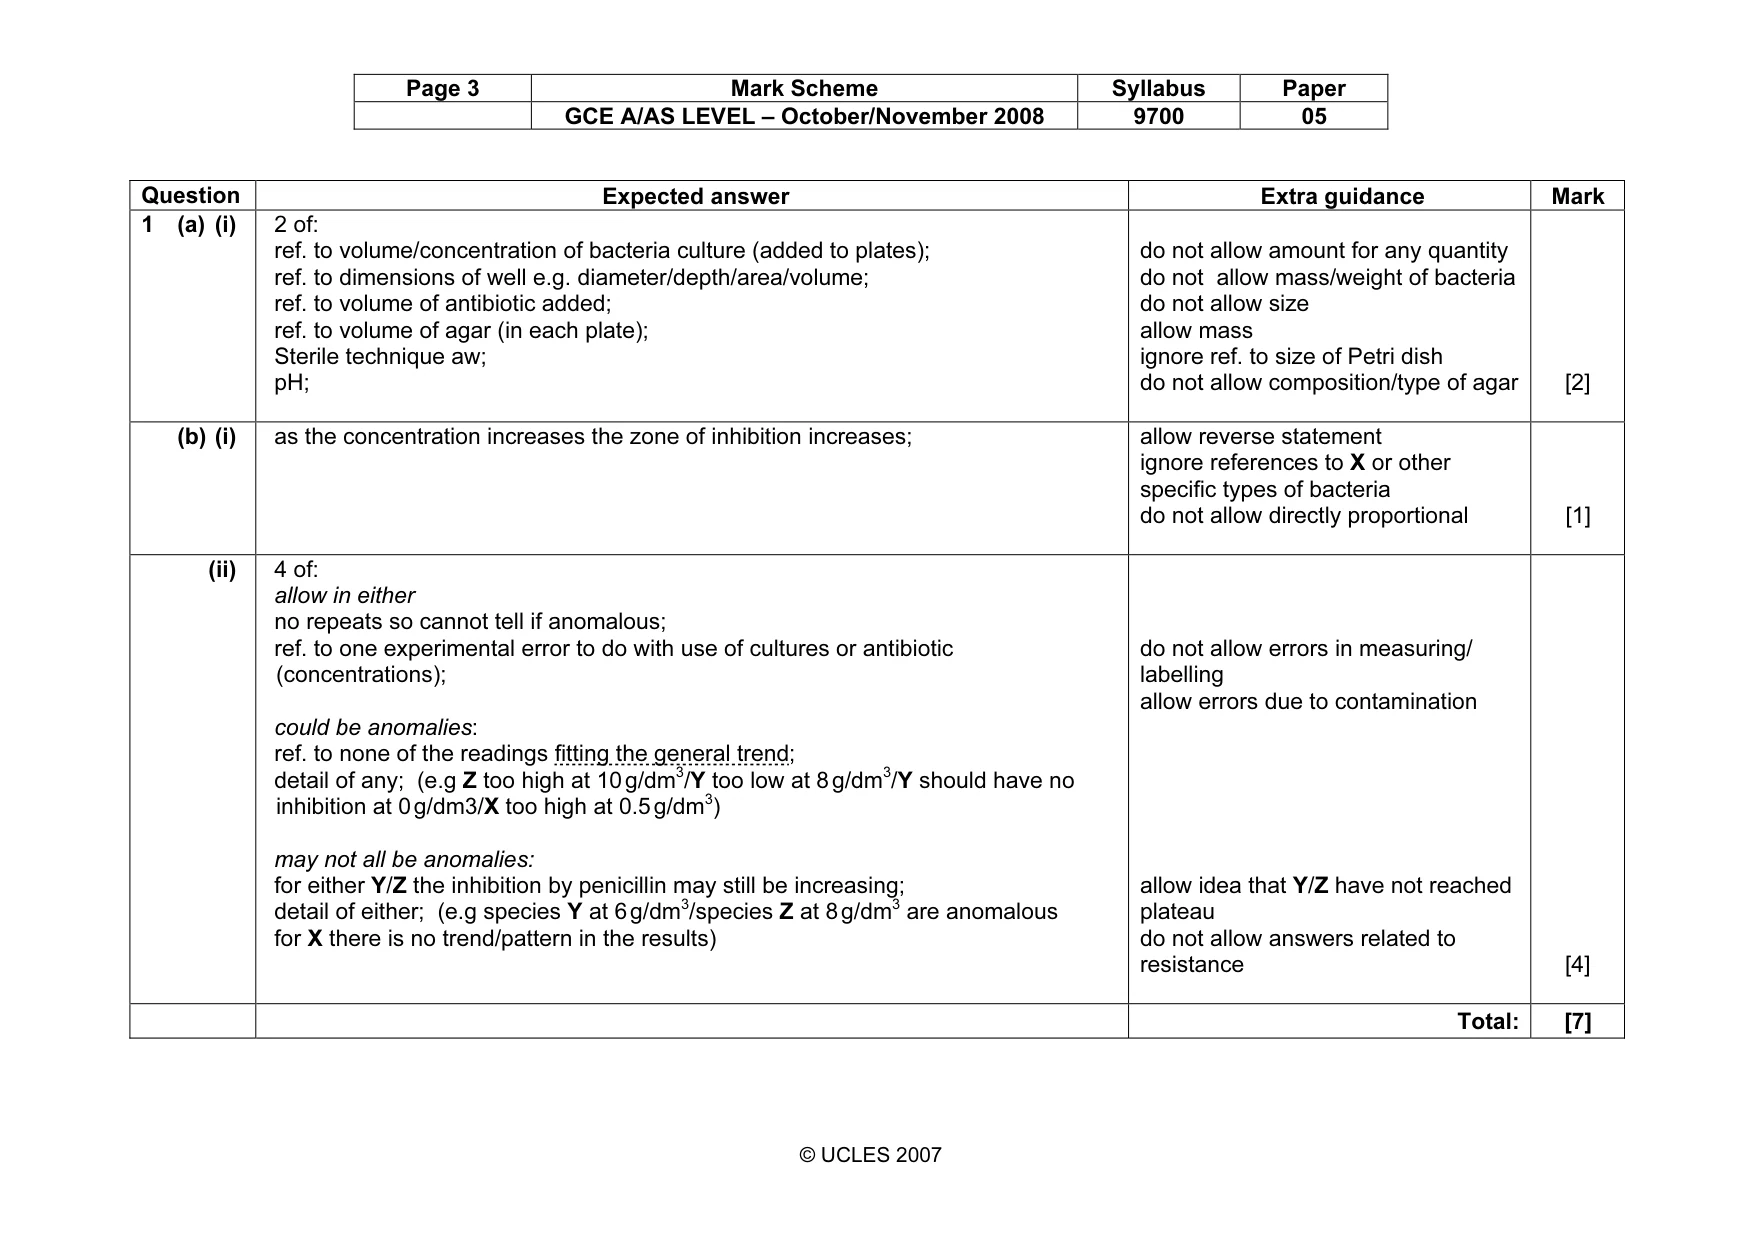
Page 3 Mark Scheme Syllabus Paper GCE A/AS LEVEL – October/November 2008 9700 05 © UCLES 2007 Question Expected answer Extra guidance Mark 1 (a) (i) 2 of: ref. to volume/concentration of bacteria culture (added to plates); ref. to dimensions of well e.g. diameter/depth/area/volume; ref. to volume of antibiotic added; ref. to volume of agar (in each plate); Sterile technique aw; pH; do not allow amount for any quantity do not allow mass/weight of bacteria do not allow size allow mass ignore ref. to size of Petri dish do not allow composition/type of agar [2] (b) (i) as the concentration increases the zone of inhibition increases; allow reverse statement ignore references to X or other specific types of bacteria do not allow directly proportional [1] (ii) 4 of: allow in either no repeats so cannot tell if anomalous; ref. to one experimental error to do with use of cultures or antibiotic (concentrations); could be anomalies: ref. to none of the readings fitting the general trend; detail of any; (e.g Z too high at 10 g/dm3/Y too low at 8 g/dm3/Y should have no inhibition at 0 g/dm3/X too high at 0.5 g/dm3) may not all be anomalies: for either Y/Z the inhibition by penicillin may still be increasing; detail of either; (e.g species Y at 6 g/dm3/species Z at 8 g/dm3 are anomalous for X there is no trend/pattern in the results) do not allow errors in measuring/ labelling allow errors due to contamination allow idea that Y/Z have not reached plateau do not allow answers related to resistance [4] Total: [7]
Mark scheme, page 4
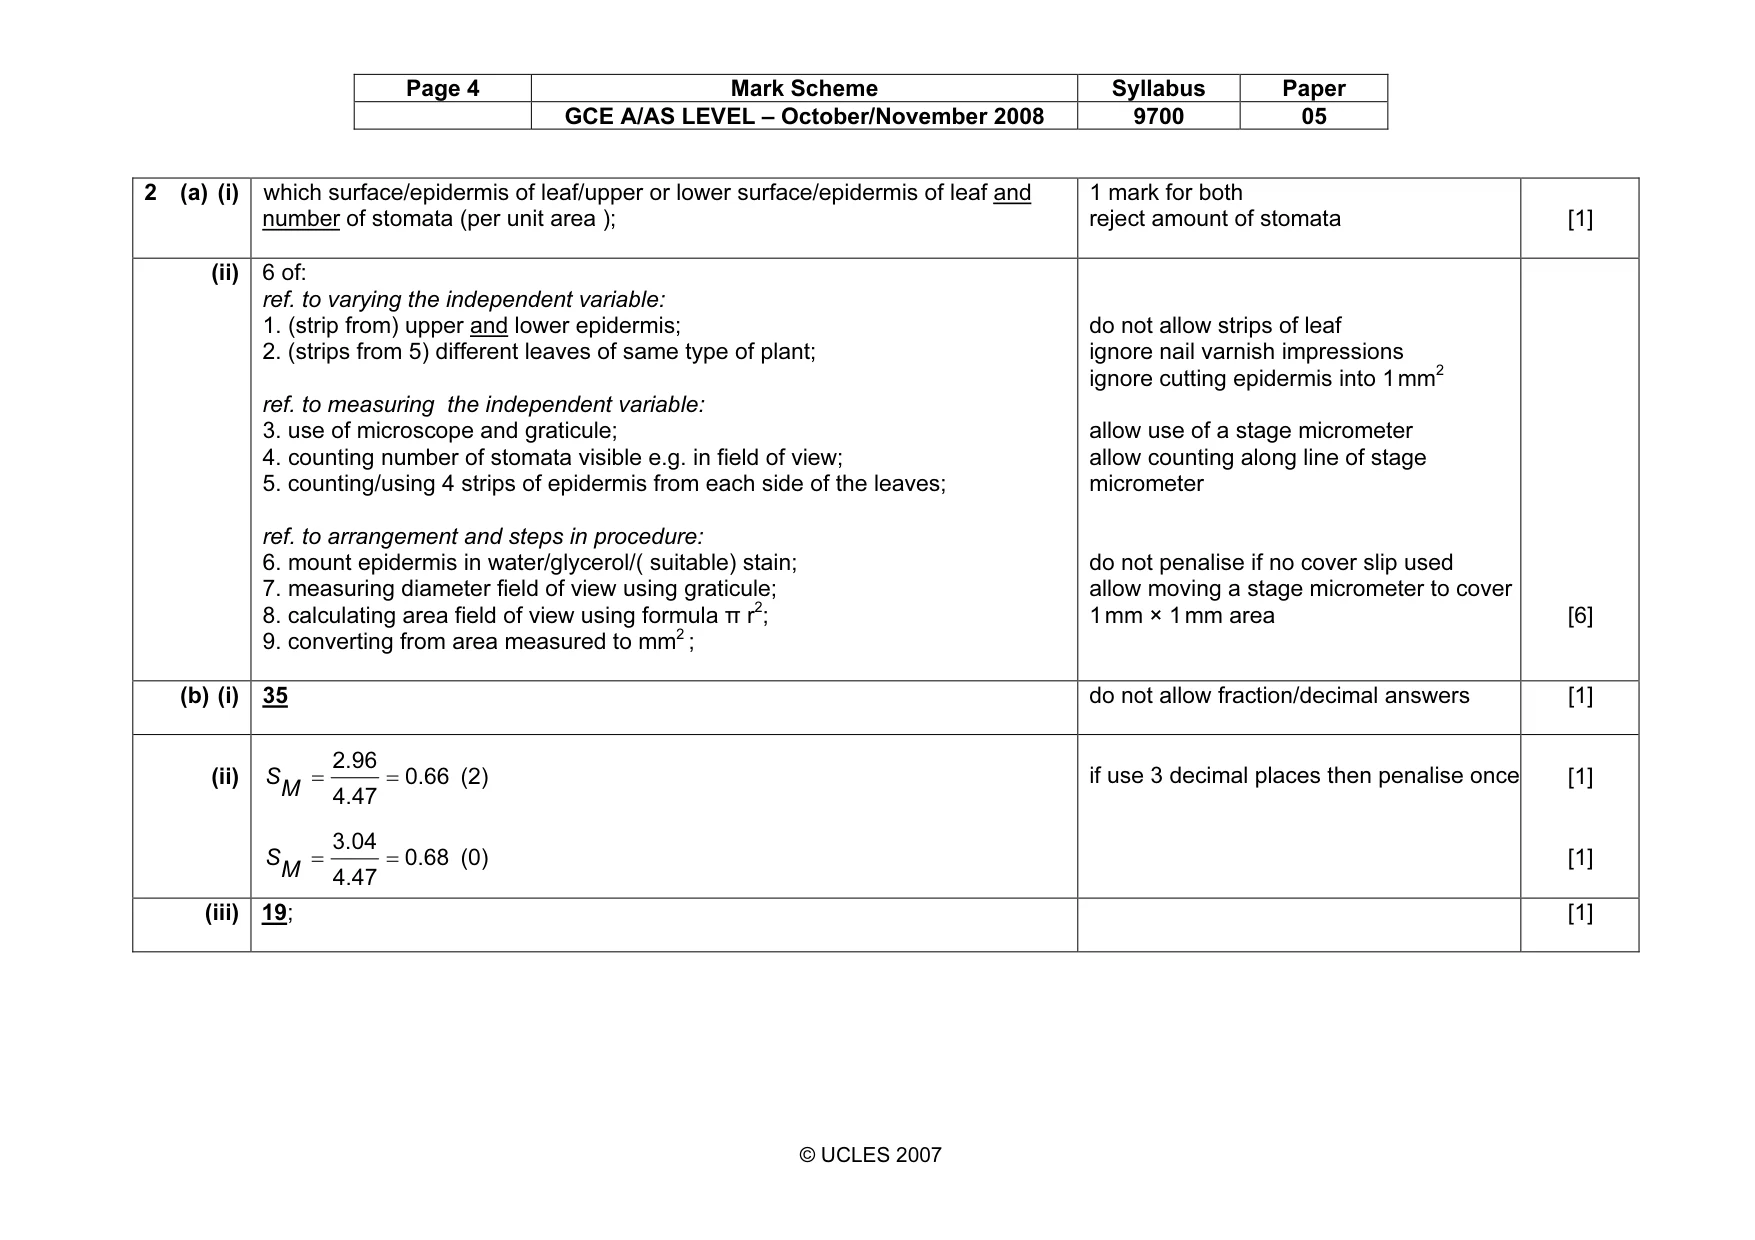
Page 4 Mark Scheme Syllabus Paper GCE A/AS LEVEL – October/November 2008 9700 05 © UCLES 2007 2 (a) (i) which surface/epidermis of leaf/upper or lower surface/epidermis of leaf and number of stomata (per unit area ); 1 mark for both reject amount of stomata [1] (ii) 6 of: ref. to varying the independent variable: 1. (strip from) upper and lower epidermis; 2. (strips from 5) different leaves of same type of plant; ref. to measuring the independent variable: 3. use of microscope and graticule; 4. counting number of stomata visible e.g. in field of view; 5. counting/using 4 strips of epidermis from each side of the leaves; ref. to arrangement and steps in procedure: 6. mount epidermis in water/glycerol/( suitable) stain; 7. measuring diameter field of view using graticule; 8. calculating area field of view using formula π r2; 9. converting from area measured to mm2 ; do not allow strips of leaf ignore nail varnish impressions ignore cutting epidermis into 1 mm2 allow use of a stage micrometer allow counting along line of stage micrometer do not penalise if no cover slip used allow moving a stage micrometer to cover 1 mm × 1 mm area [6] (b) (i) 35 do not allow fraction/decimal answers [1] (ii) 0.66 4.47 2.96 = = M S (2) 0.68 4.47 3.04 = = M S (0) if use 3 decimal places then penalise once [1] [1] (iii) 19; [1]
Mark scheme, page 5
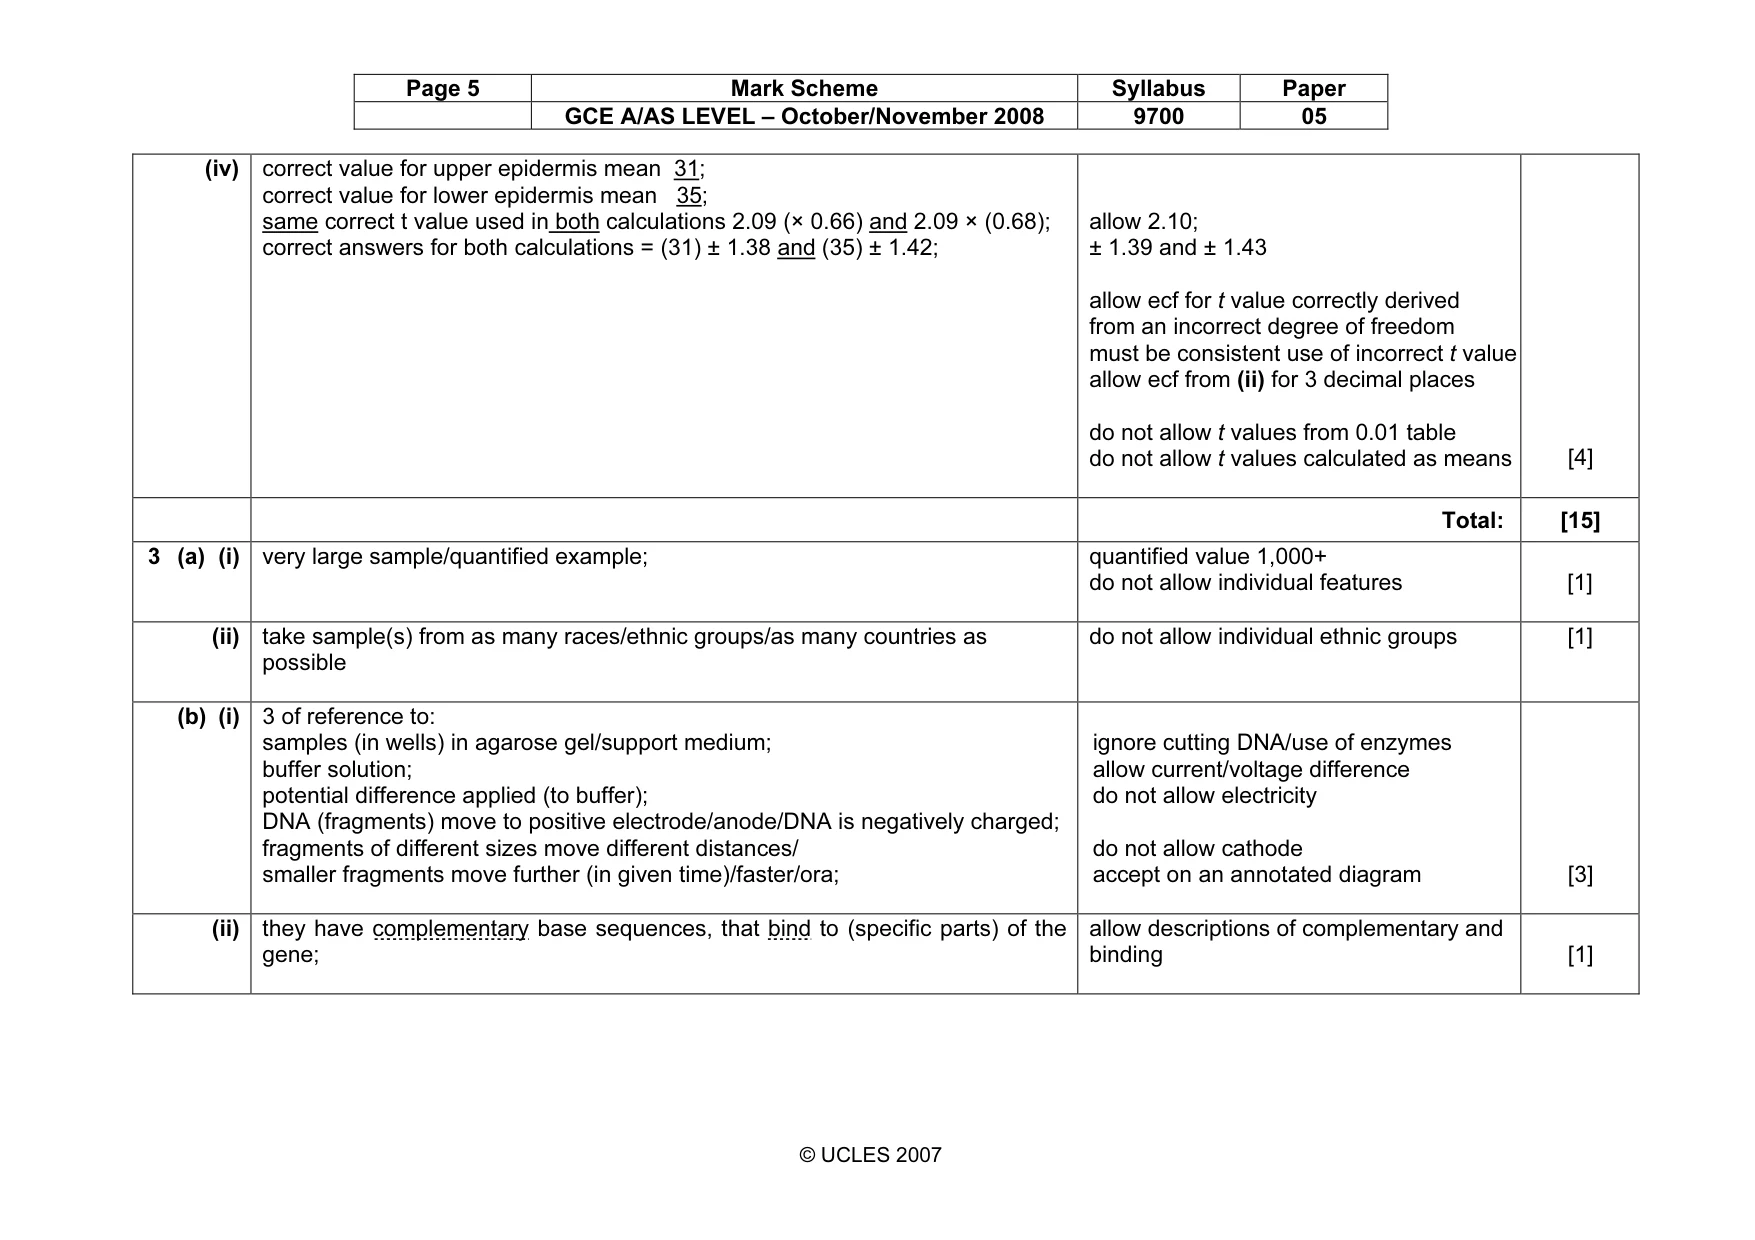
Page 5 Mark Scheme Syllabus Paper GCE A/AS LEVEL – October/November 2008 9700 05 © UCLES 2007 (iv) correct value for upper epidermis mean 31; correct value for lower epidermis mean 35; same correct t value used in both calculations 2.09 (× 0.66) and 2.09 × (0.68); correct answers for both calculations = (31) ± 1.38 and (35) ± 1.42; allow 2.10; ± 1.39 and ± 1.43 allow ecf for t value correctly derived from an incorrect degree of freedom must be consistent use of incorrect t value allow ecf from (ii) for 3 decimal places do not allow t values from 0.01 table do not allow t values calculated as means [4] Total: [15] 3 (a) (i) very large sample/quantified example; quantified value 1,000+ do not allow individual features [1] (ii) take sample(s) from as many races/ethnic groups/as many countries as possible do not allow individual ethnic groups [1] (b) (i) 3 of reference to: samples (in wells) in agarose gel/support medium; buffer solution; potential difference applied (to buffer); DNA (fragments) move to positive electrode/anode/DNA is negatively charged; fragments of different sizes move different distances/ smaller fragments move further (in given time)/faster/ora; ignore cutting DNA/use of enzymes allow current/voltage difference do not allow electricity do not allow cathode accept on an annotated diagram [3] (ii) they have complementary base sequences, that bind to (specific parts) of the gene; allow descriptions of complementary and binding [1]
Mark scheme, page 6
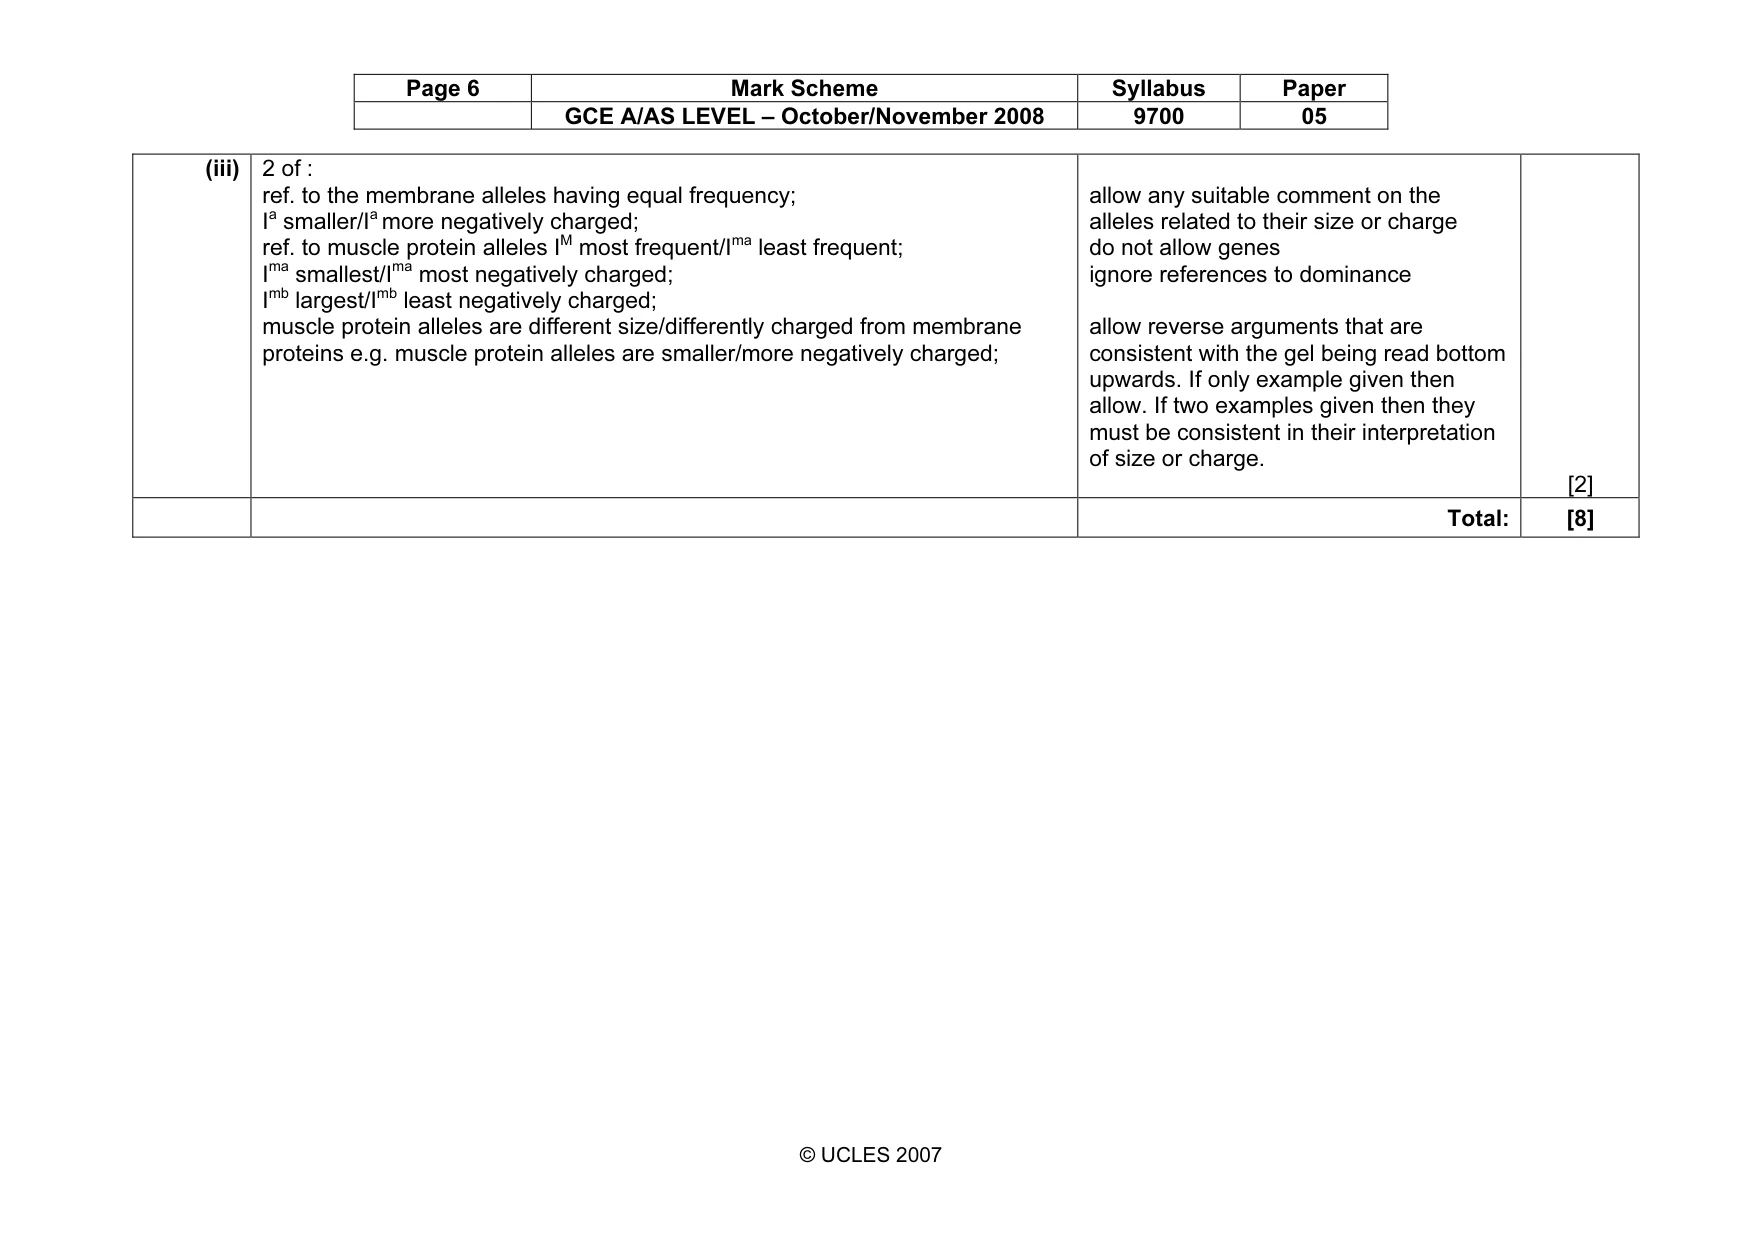
Page 6 Mark Scheme Syllabus Paper GCE A/AS LEVEL – October/November 2008 9700 05 © UCLES 2007 (iii) 2 of : ref. to the membrane alleles having equal frequency; Ia smaller/Ia more negatively charged; ref. to muscle protein alleles IM most frequent/Ima least frequent; Ima smallest/Ima most negatively charged; Imb largest/Imb least negatively charged; muscle protein alleles are different size/differently charged from membrane proteins e.g. muscle protein alleles are smaller/more negatively charged; allow any suitable comment on the alleles related to their size or charge do not allow genes ignore references to dominance allow reverse arguments that are consistent with the gel being read bottom upwards. If only example given then allow. If two examples given then they must be consistent in their interpretation of size or charge. [2] Total: [8]
What you needed in this session
Cambridge’s own grade thresholds for 2008 Oct/Nov, Paper 5 · Variant 1. A higher threshold means an easier paper — the bar moves with how the cohort did.