Cambridge A Level Biology 9700 — 2004 Oct/Nov Paper 6 · Variant 1
9700/61/O/N/04
The question paper and its mark scheme, free to read here and free to download. This is Cambridge’s own paper, exactly as it was sat.
Question paper36 pages



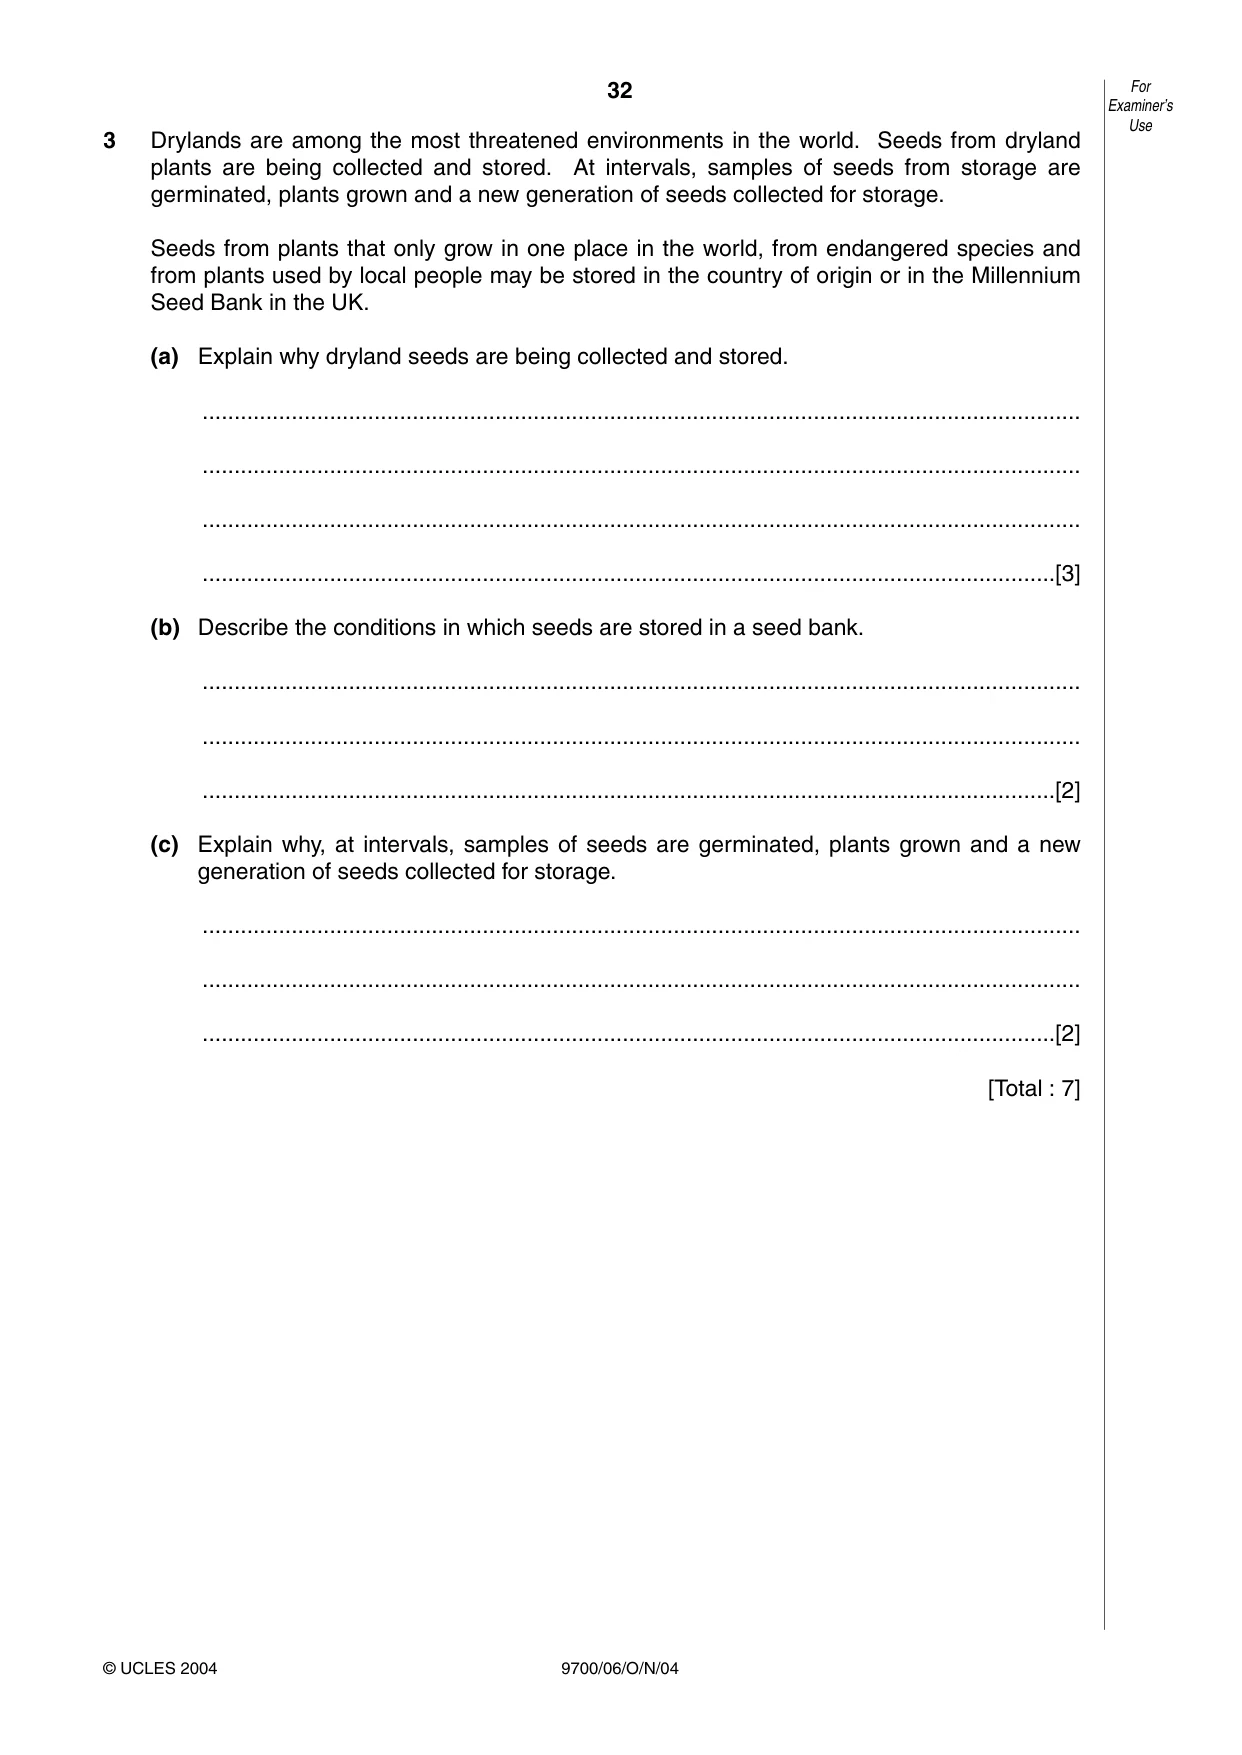

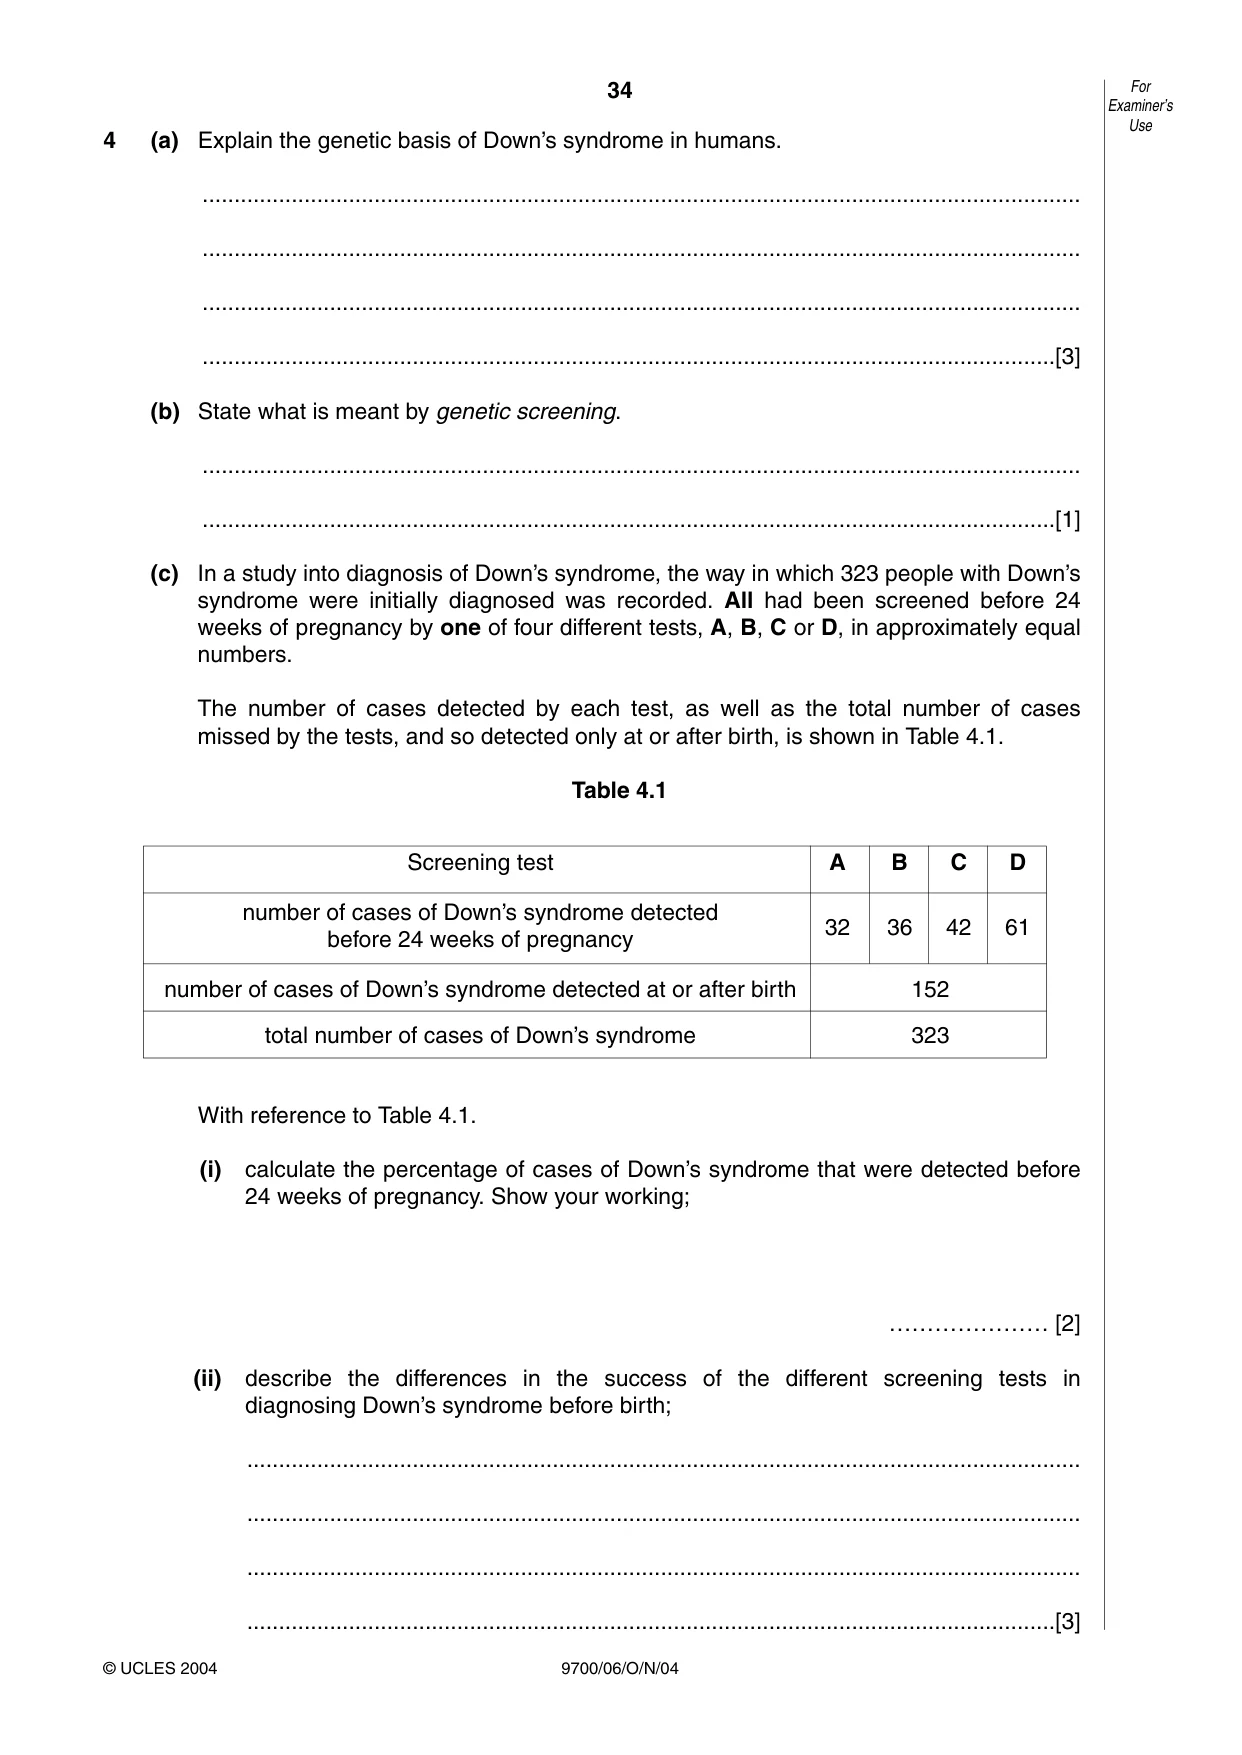


Mark scheme16 pages
Answers below. Sit the paper first if you are practising.
Paper as text
Question paper, page 1
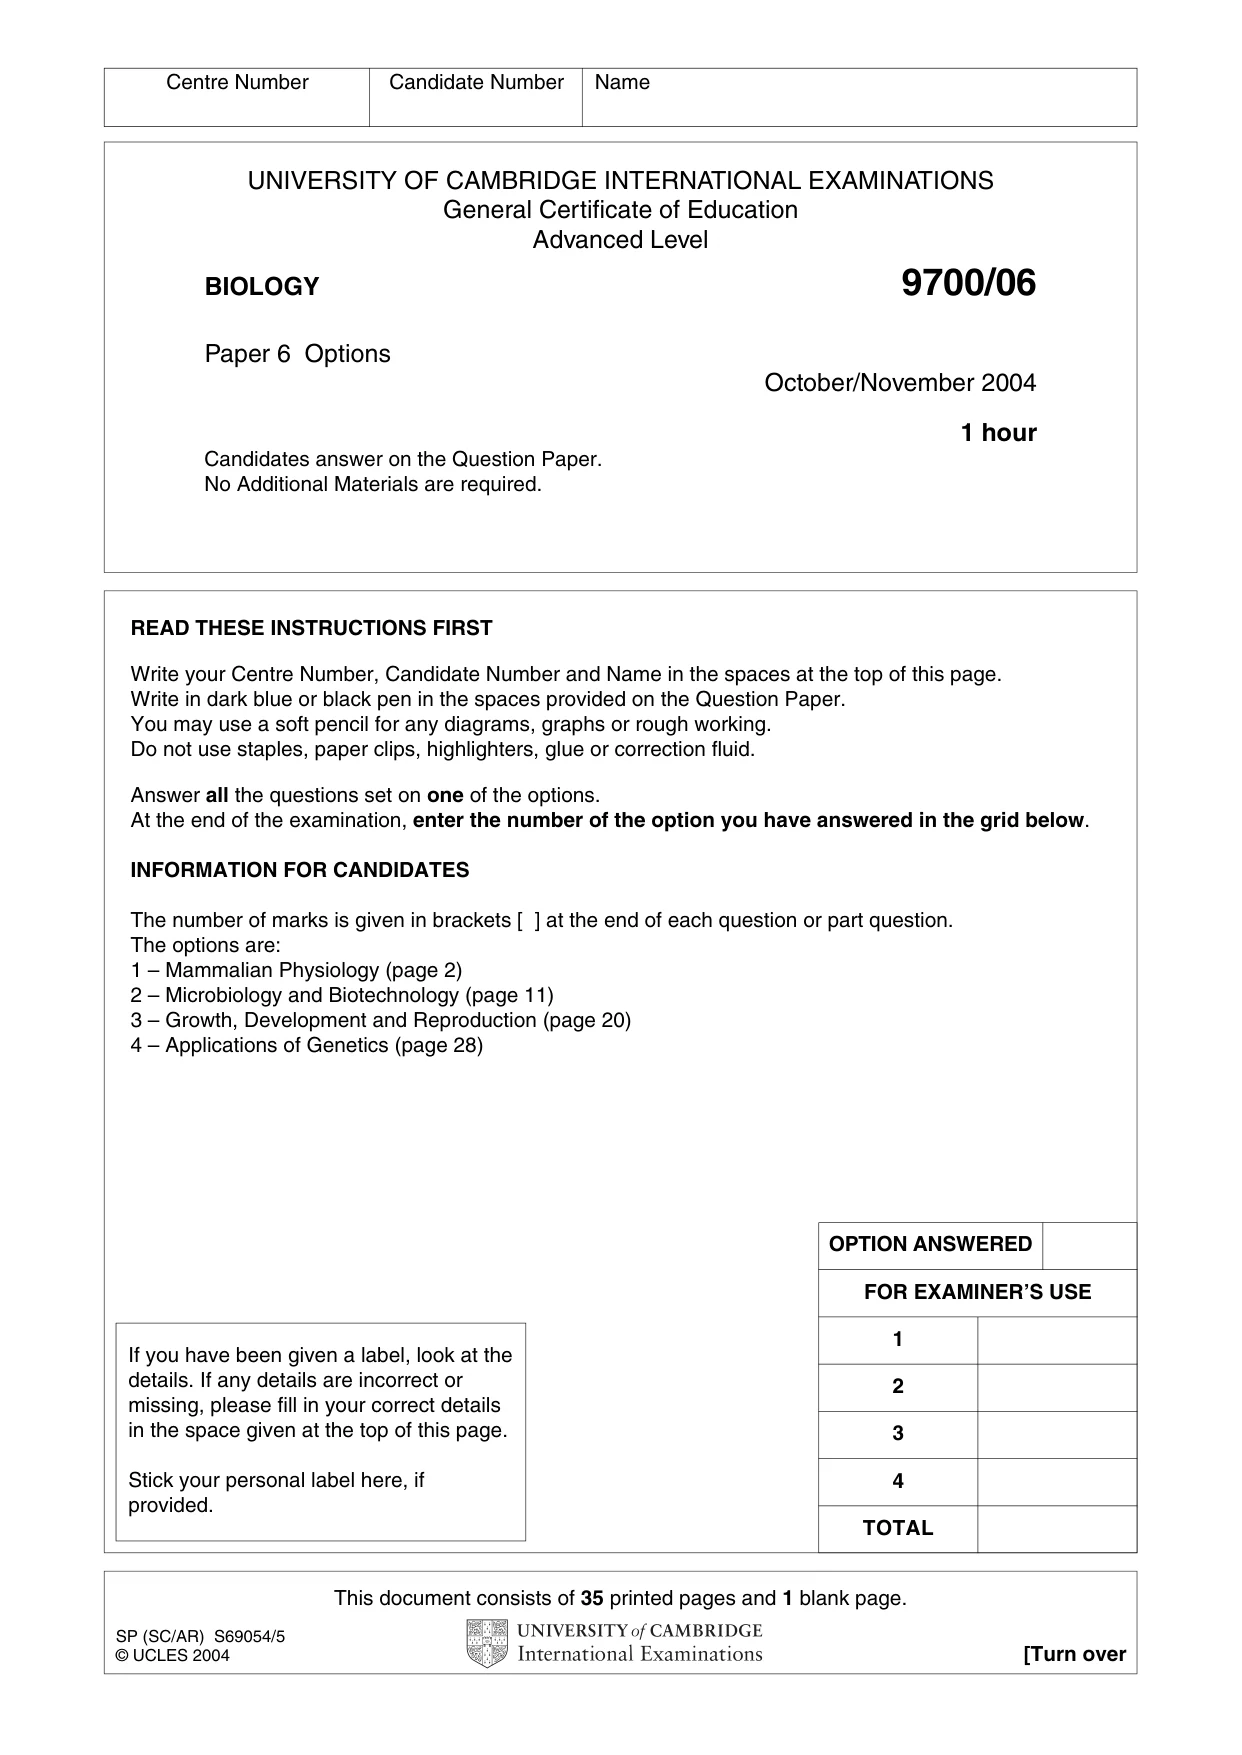
This document consists of 35 printed pages and 1 blank page. SP (SC/AR) S69054/5 © UCLES 2004 [Turn over UNIVERSITY OF CAMBRIDGE INTERNATIONAL EXAMINATIONS General Certificate of Education Advanced Level BIOLOGY 9700/06 Paper 6 Options October/November 2004 1 hour Candidates answer on the Question Paper. No Additional Materials are required. READ THESE INSTRUCTIONS FIRST Write your Centre Number, Candidate Number and Name in the spaces at the top of this page. Write in dark blue or black pen in the spaces provided on the Question Paper. You may use a soft pencil for any diagrams, graphs or rough working. Do not use staples, paper clips, highlighters, glue or correction fluid. Answer all the questions set on one of the options. At the end of the examination, enter the number of the option you have answered in the grid below. INFORMATION FOR CANDIDATES The number of marks is given in brackets [ ] at the end of each question or part question. The options are: 1 – Mammalian Physiology (page 2) 2 – Microbiology and Biotechnology (page 11) 3 – Growth, Development and Reproduction (page 20) 4 – Applications of Genetics (page 28) Centre Number Candidate Number Name If you have been given a label, look at the details. If any details are incorrect or missing, please fill in your correct details in the space given at the top of this page. Stick your personal label here, if provided. FOR EXAMINER’S USE 1 2 3 4 OPTION ANSWERED TOTAL
Question paper, page 2
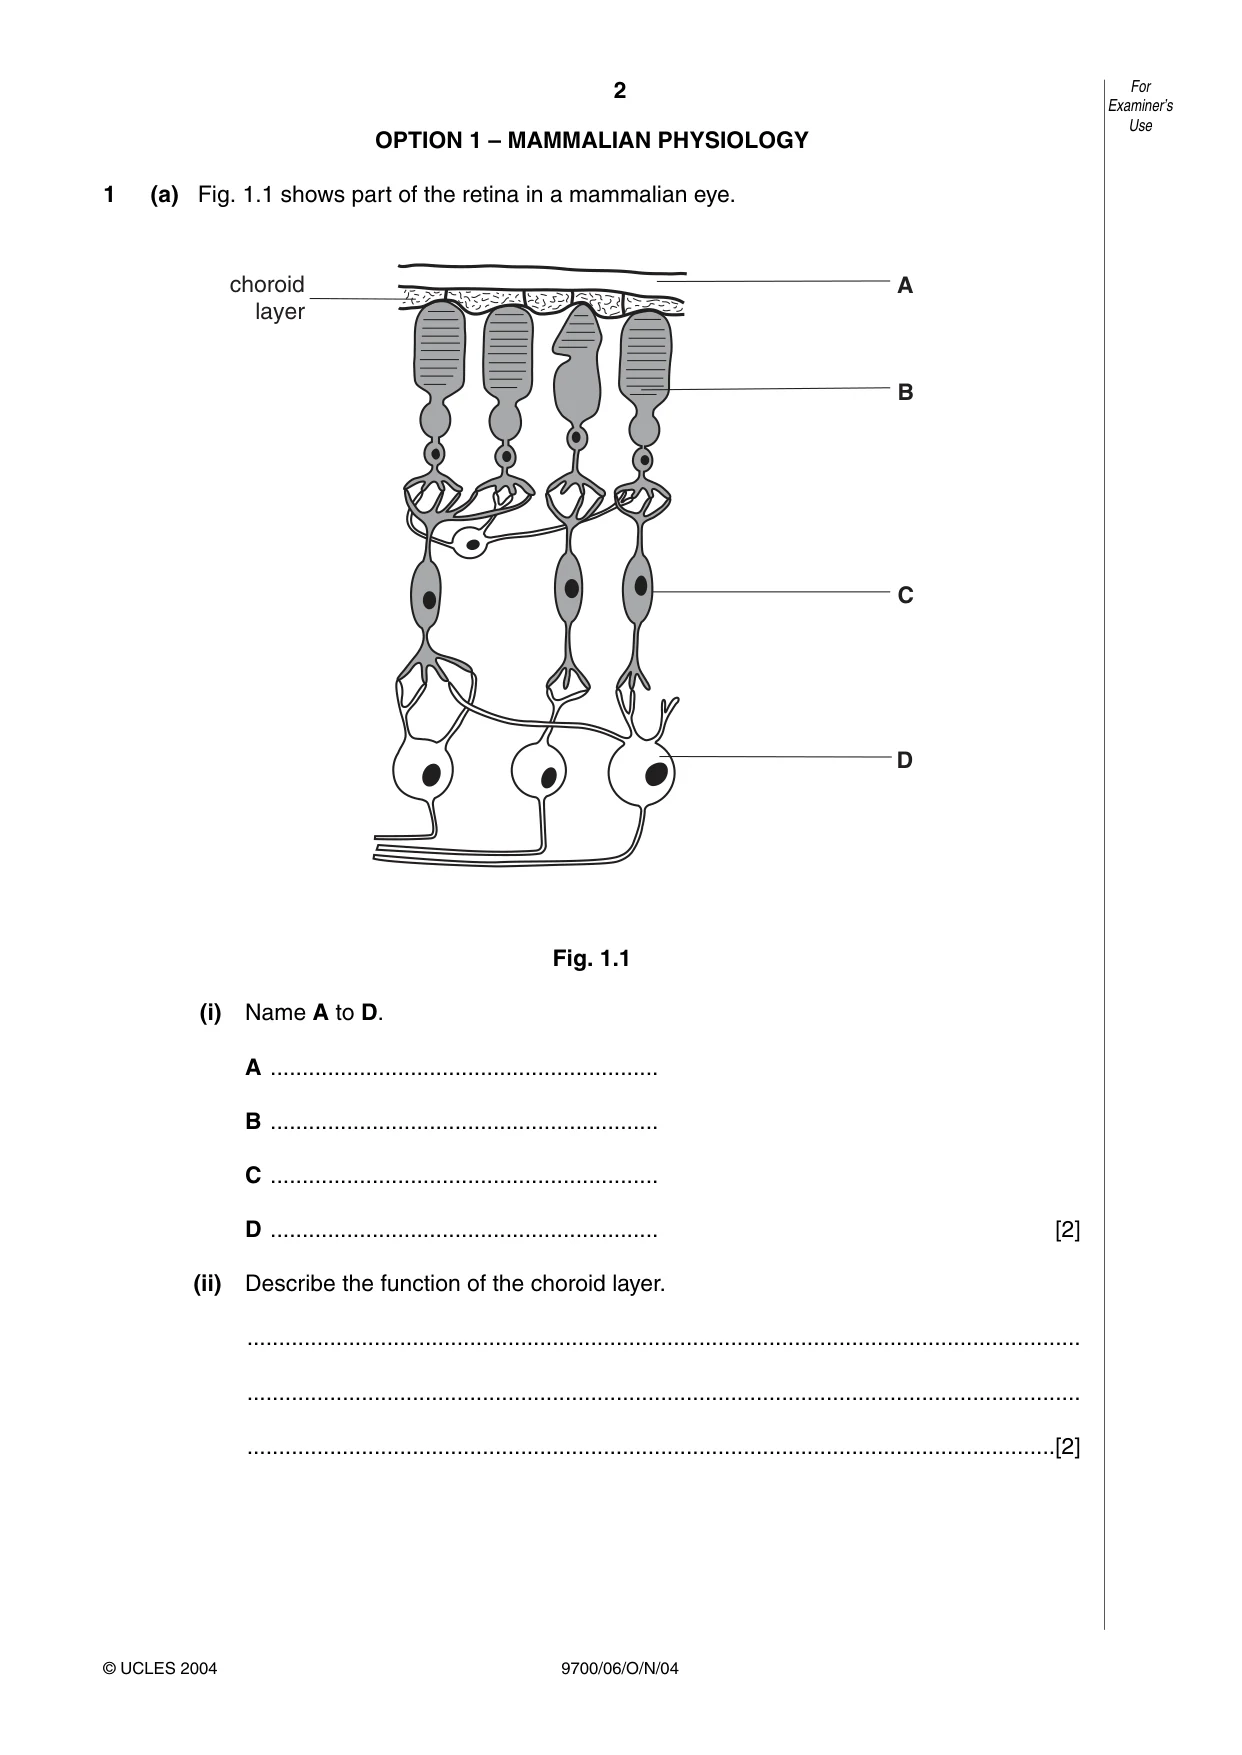
2 9700/06/O/N/04 OPTION 1 – MAMMALIAN PHYSIOLOGY 1 (a) Fig. 1.1 shows part of the retina in a mammalian eye. Fig. 1.1 (i) Name A to D. A … B … C … D … [2] (ii) Describe the function of the choroid layer. … … …[2] A B C D choroid layer For Examiner’s Use © UCLES 2004
Question paper, page 3
3 9700/06/O/N/04 [Turn over (iii) With reference to Fig. 1.1, explain why visual acuity is greater when light is detected by cone cells than when it is detected by rod cells. … … … …[3] © UCLES 2004 For Examiner’s Use
Question paper, page 4
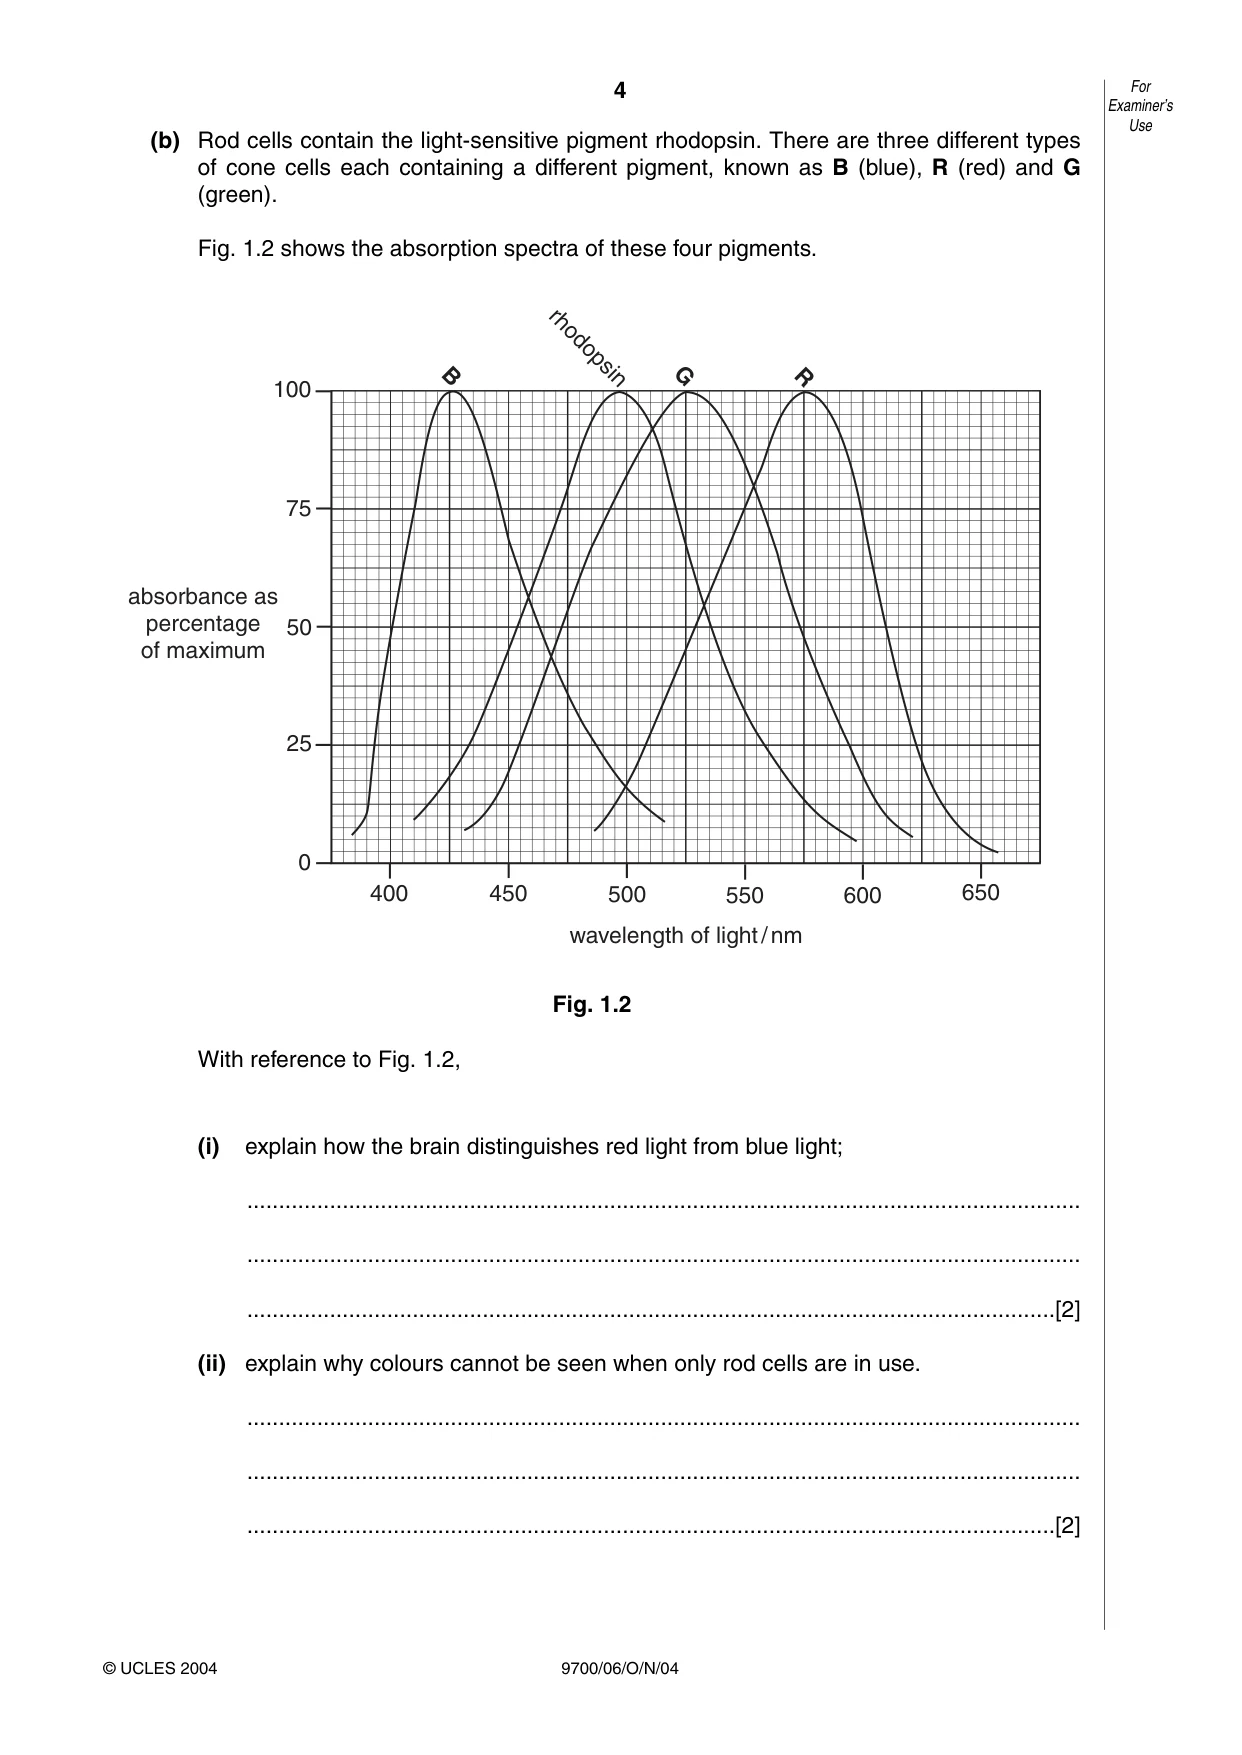
4 9700/06/O/N/04 (b) Rod cells contain the light-sensitive pigment rhodopsin. There are three different types of cone cells each containing a different pigment, known as B (blue), R (red) and G (green). Fig. 1.2 shows the absorption spectra of these four pigments. Fig. 1.2 With reference to Fig. 1.2, (i) explain how the brain distinguishes red light from blue light; … … …[2] (ii) explain why colours cannot be seen when only rod cells are in use. … … …[2] 0 25 50 75 100 650 600 550 500 450 400 B G R rhodopsin absorbance as percentage of maximum wavelength of light / nm For Examiner’s Use © UCLES 2004
Question paper, page 5
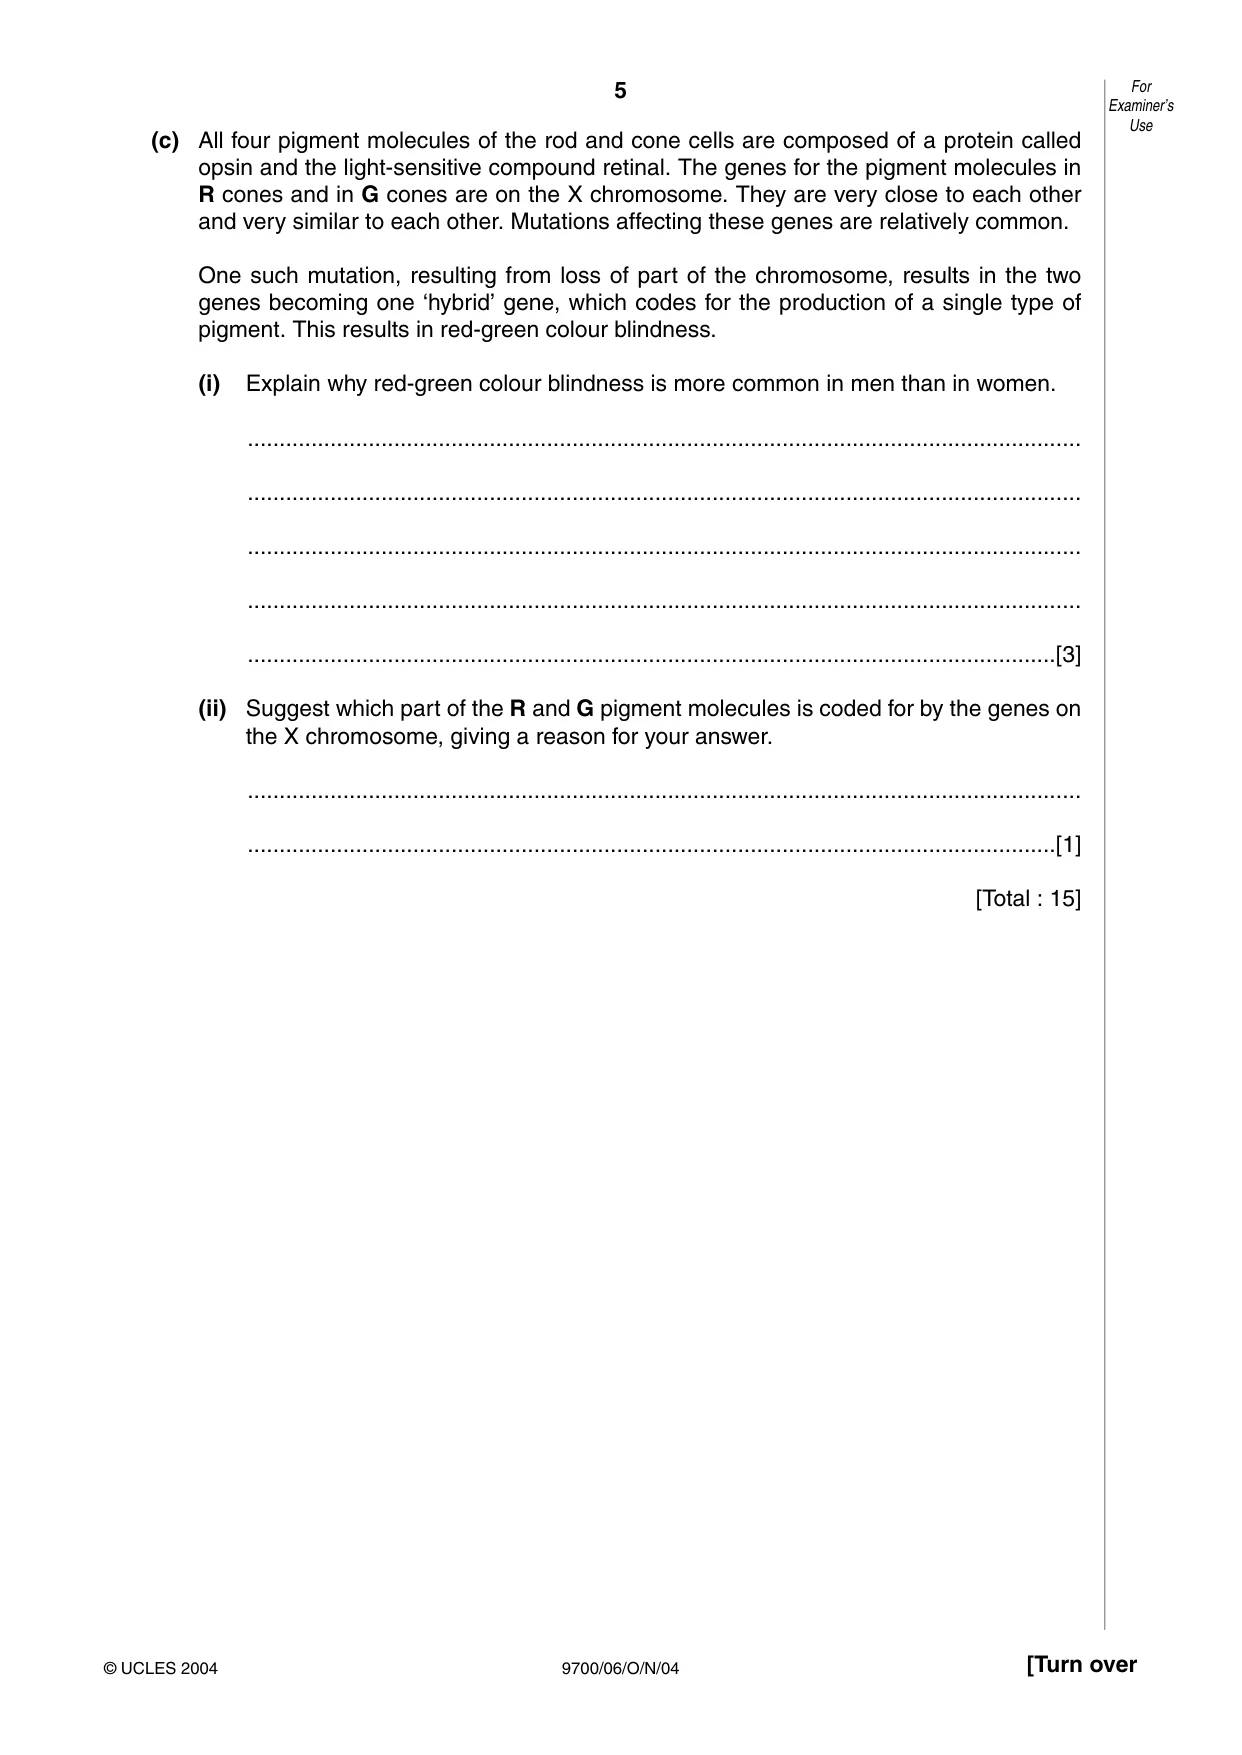
5 9700/06/O/N/04 [Turn over (c) All four pigment molecules of the rod and cone cells are composed of a protein called opsin and the light-sensitive compound retinal. The genes for the pigment molecules in R cones and in G cones are on the X chromosome. They are very close to each other and very similar to each other. Mutations affecting these genes are relatively common. One such mutation, resulting from loss of part of the chromosome, results in the two genes becoming one ‘hybrid’ gene, which codes for the production of a single type of pigment. This results in red-green colour blindness. (i) Explain why red-green colour blindness is more common in men than in women. … … … … …[3] (ii) Suggest which part of the R and G pigment molecules is coded for by the genes on the X chromosome, giving a reason for your answer. … …[1] [Total : 15] For Examiner’s Use © UCLES 2004
Question paper, page 6
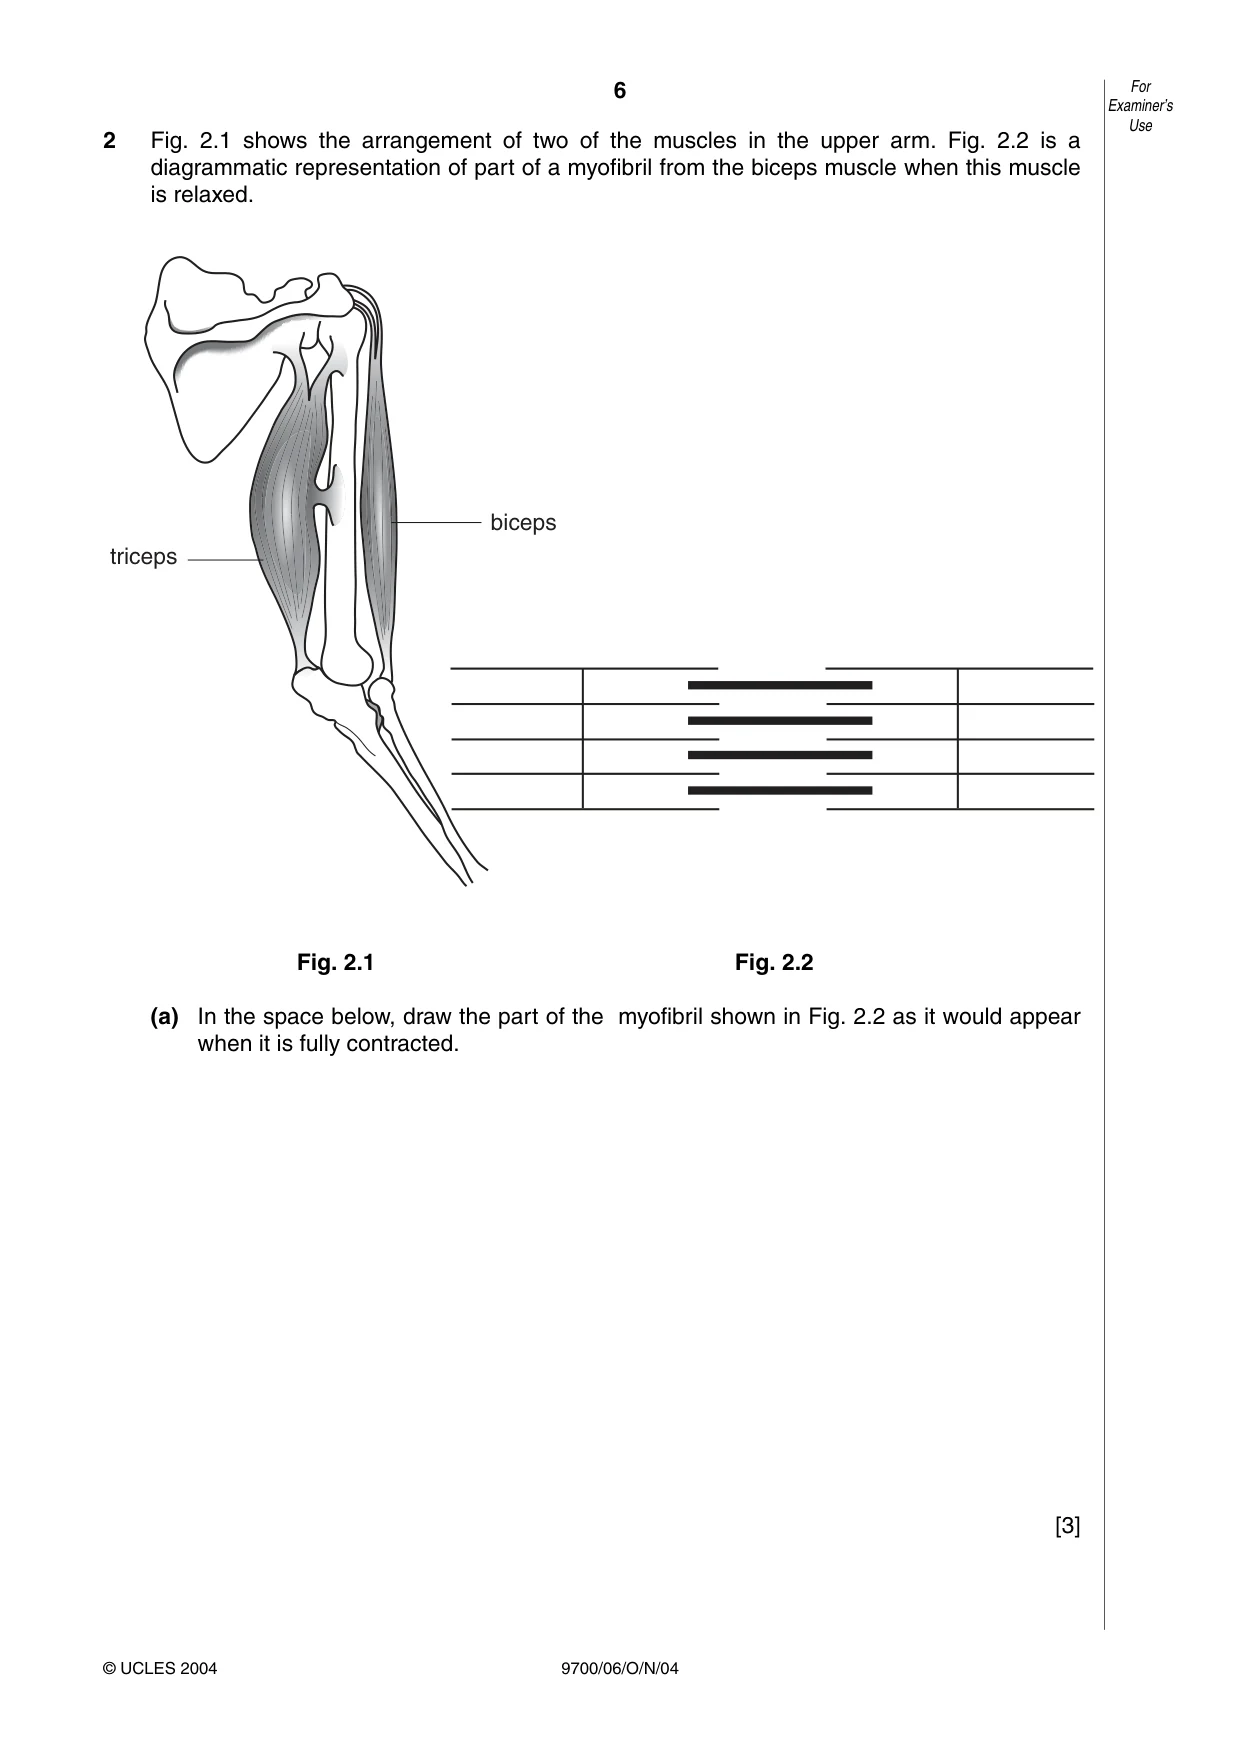
6 9700/06/O/N/04 2 Fig. 2.1 shows the arrangement of two of the muscles in the upper arm. Fig. 2.2 is a diagrammatic representation of part of a myofibril from the biceps muscle when this muscle is relaxed. Fig. 2.1 Fig. 2.2 (a) In the space below, draw the part of the myofibril shown in Fig. 2.2 as it would appear when it is fully contracted. [3] biceps triceps For Examiner’s Use © UCLES 2004
Question paper, page 7
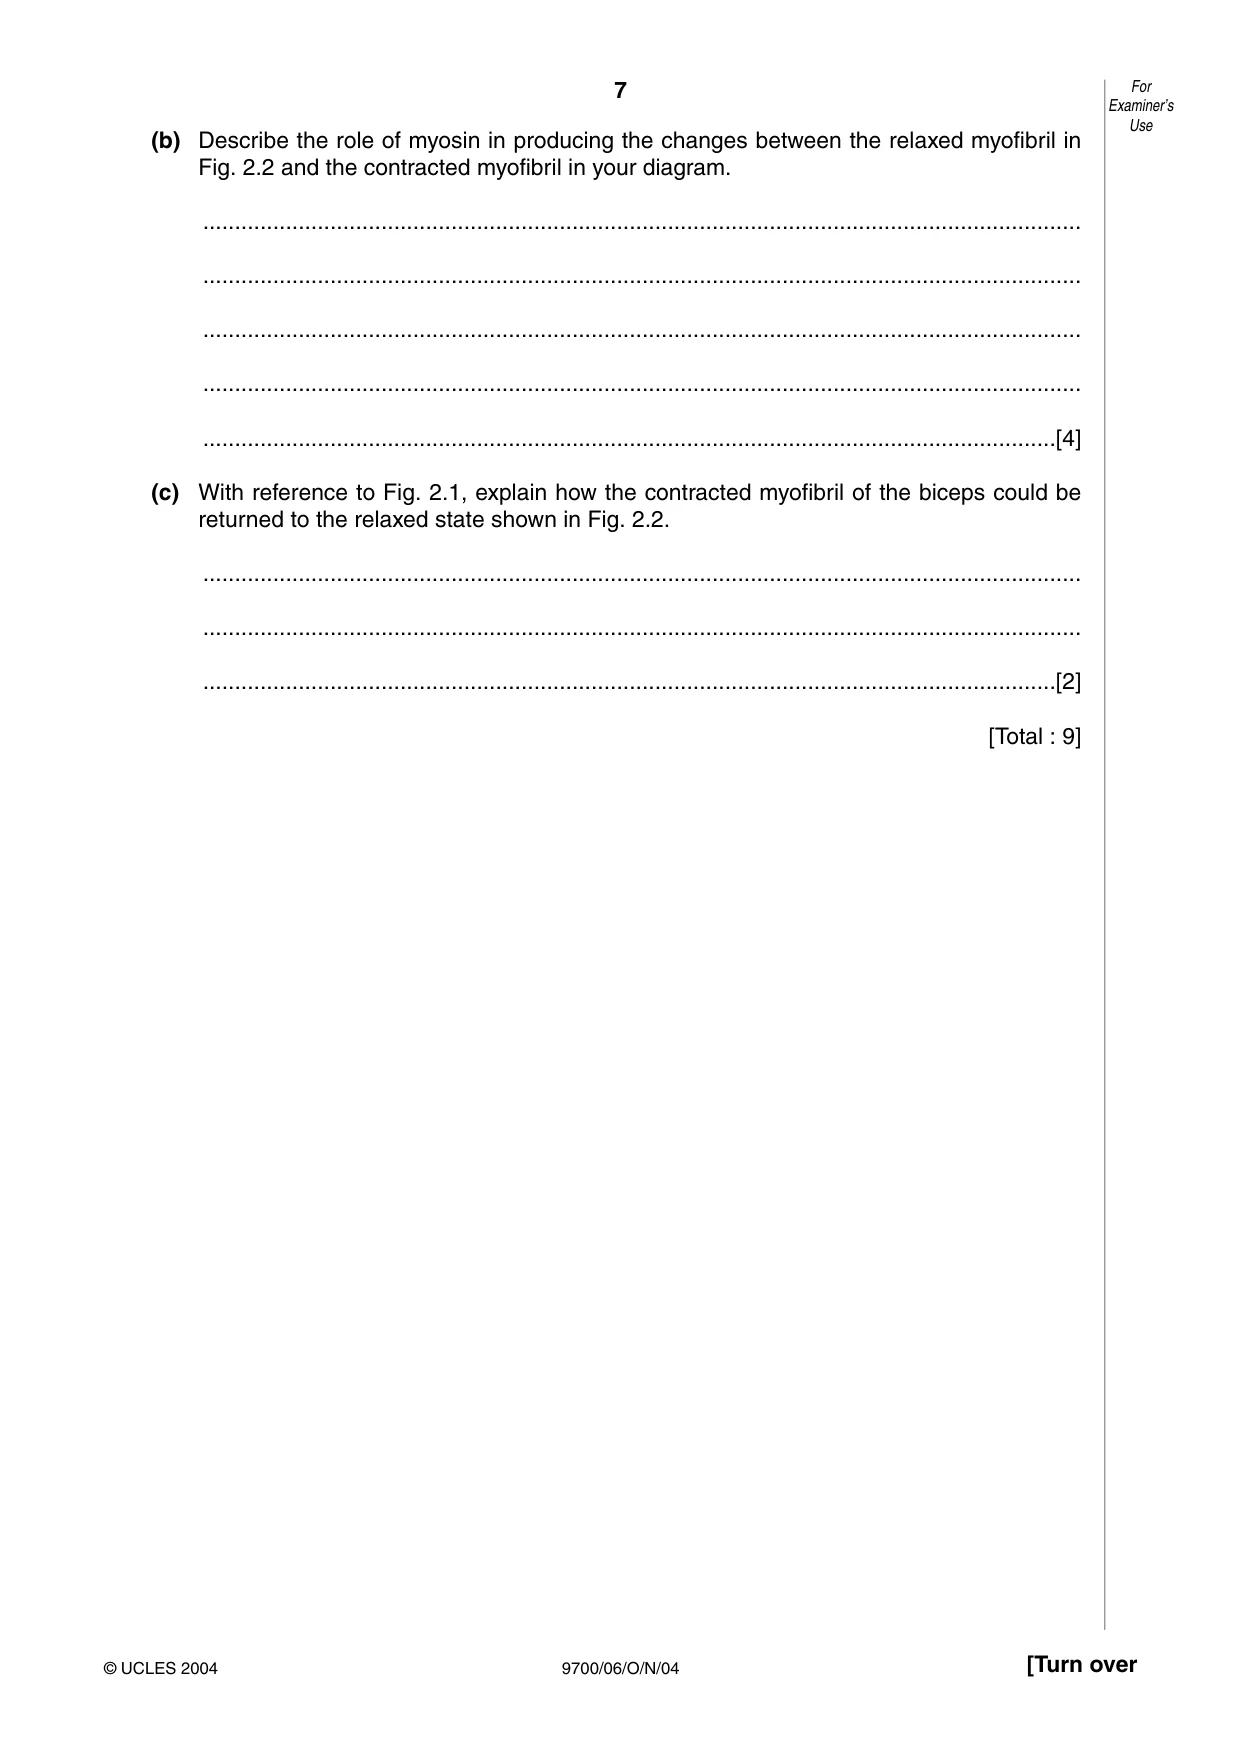
7 9700/06/O/N/04 [Turn over (b) Describe the role of myosin in producing the changes between the relaxed myofibril in Fig. 2.2 and the contracted myofibril in your diagram. … … … … …[4] (c) With reference to Fig. 2.1, explain how the contracted myofibril of the biceps could be returned to the relaxed state shown in Fig. 2.2. … … …[2] [Total : 9] For Examiner’s Use © UCLES 2004
Question paper, page 8
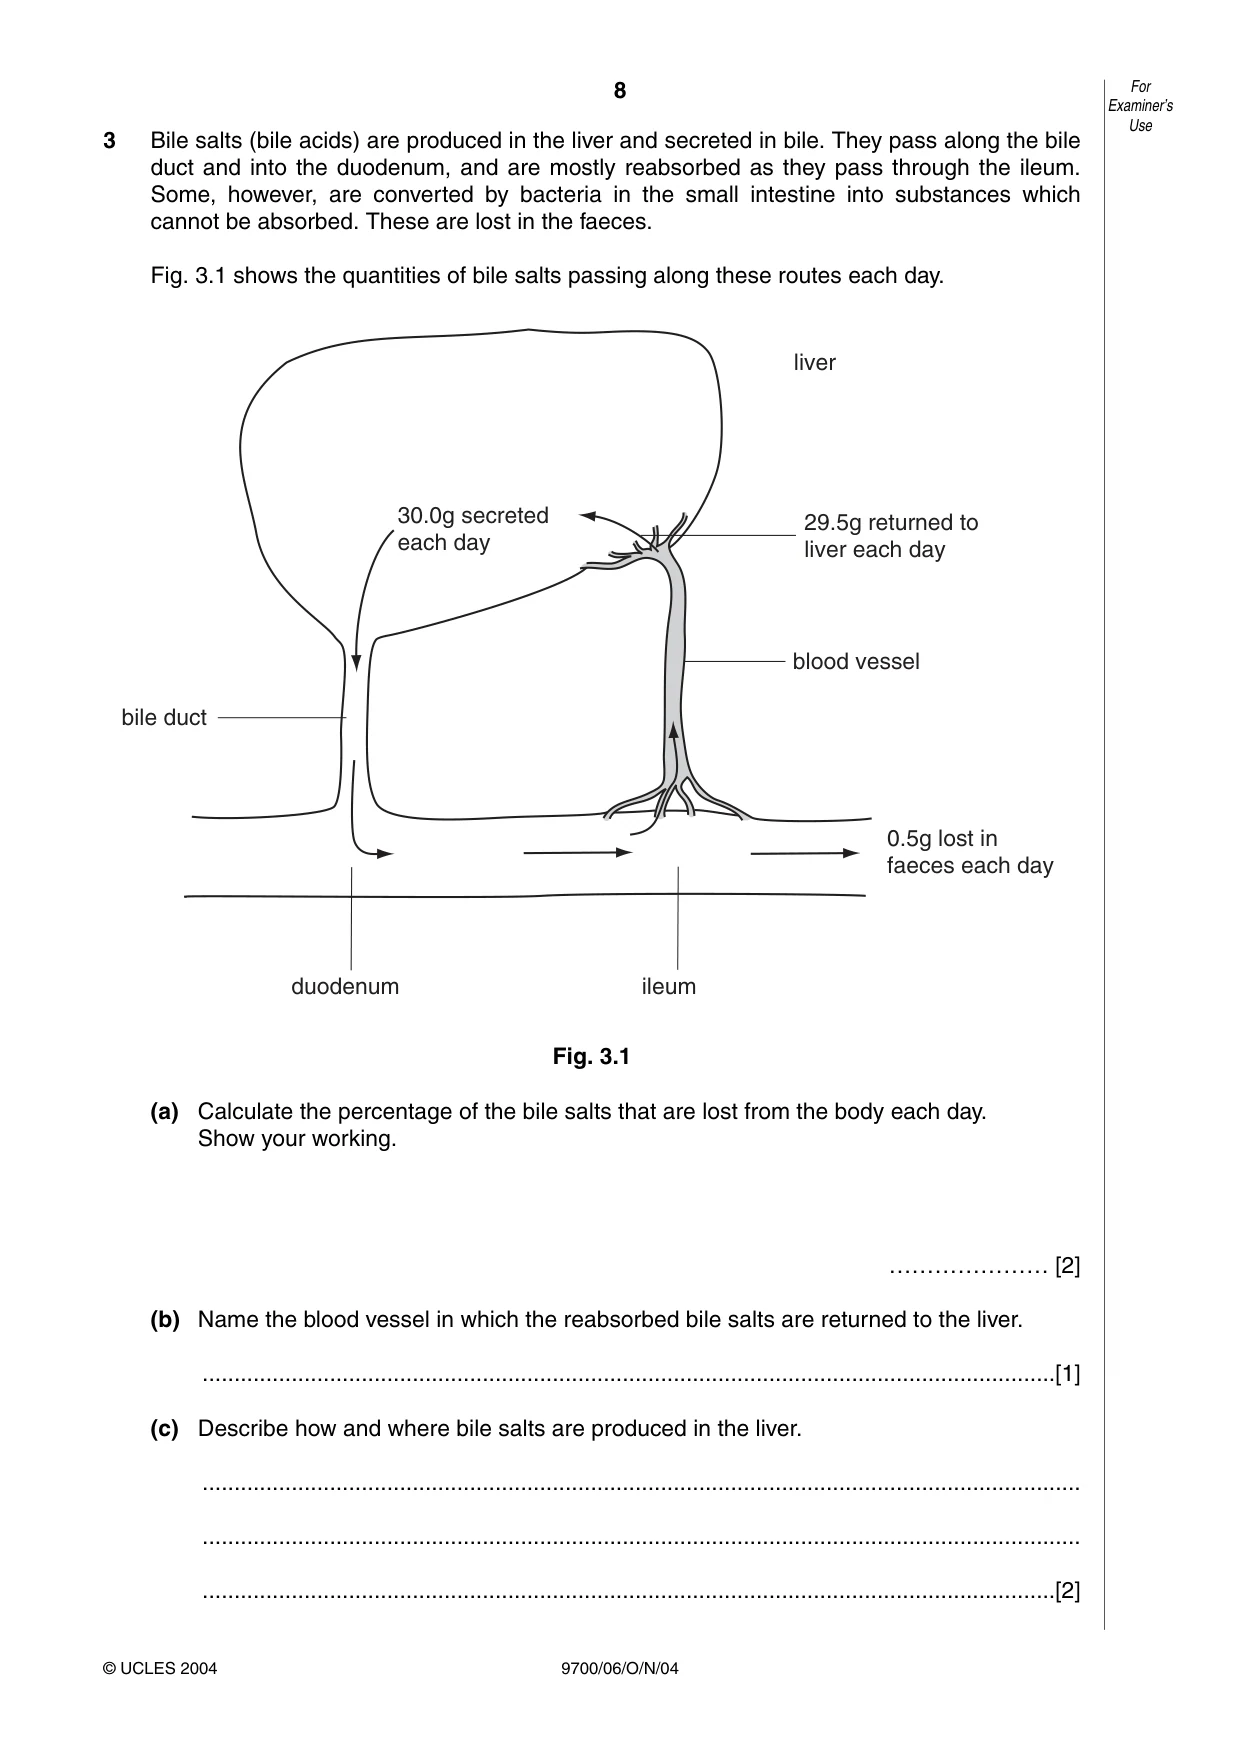
8 9700/06/O/N/04 3 Bile salts (bile acids) are produced in the liver and secreted in bile. They pass along the bile duct and into the duodenum, and are mostly reabsorbed as they pass through the ileum. Some, however, are converted by bacteria in the small intestine into substances which cannot be absorbed. These are lost in the faeces. Fig. 3.1 shows the quantities of bile salts passing along these routes each day. Fig. 3.1 (a) Calculate the percentage of the bile salts that are lost from the body each day. Show your working. ………………… [2] (b) Name the blood vessel in which the reabsorbed bile salts are returned to the liver. …[1] (c) Describe how and where bile salts are produced in the liver. … … …[2] bile duct duodenum ileum 0.5g lost in faeces each day blood vessel 29.5g returned to liver each day liver 30.0g secreted each day For Examiner’s Use © UCLES 2004
Question paper, page 9
9 9700/06/O/N/04 [Turn over (d) Describe the role of bile salts in fat digestion. … … … … …[3] [Total : 8] © UCLES 2004 For Examiner’s Use
Question paper, page 10
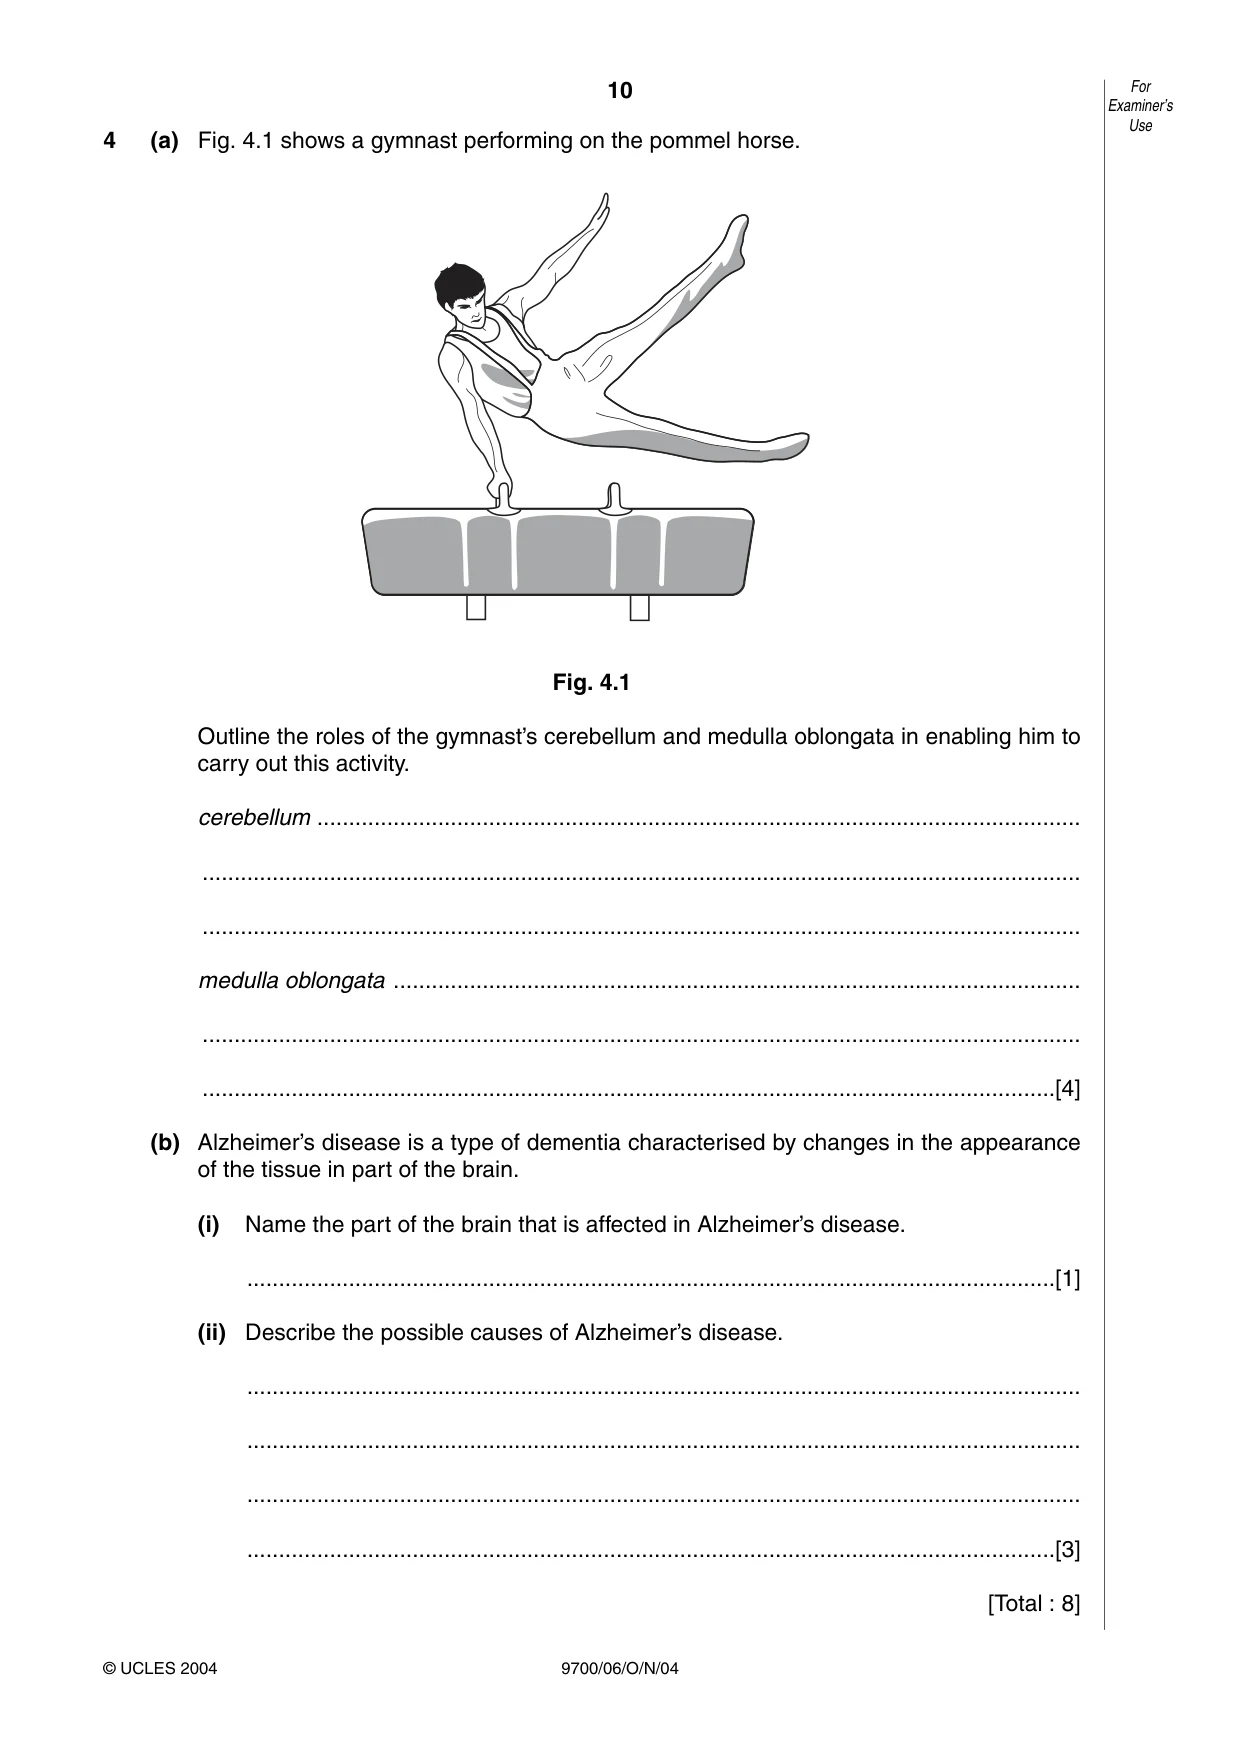
10 9700/06/O/N/04 4 (a) Fig. 4.1 shows a gymnast performing on the pommel horse. Fig. 4.1 Outline the roles of the gymnast’s cerebellum and medulla oblongata in enabling him to carry out this activity. cerebellum … … … medulla oblongata … … …[4] (b) Alzheimer’s disease is a type of dementia characterised by changes in the appearance of the tissue in part of the brain. (i) Name the part of the brain that is affected in Alzheimer’s disease. …[1] (ii) Describe the possible causes of Alzheimer’s disease. … … … …[3] [Total : 8] For Examiner’s Use © UCLES 2004
Question paper, page 11
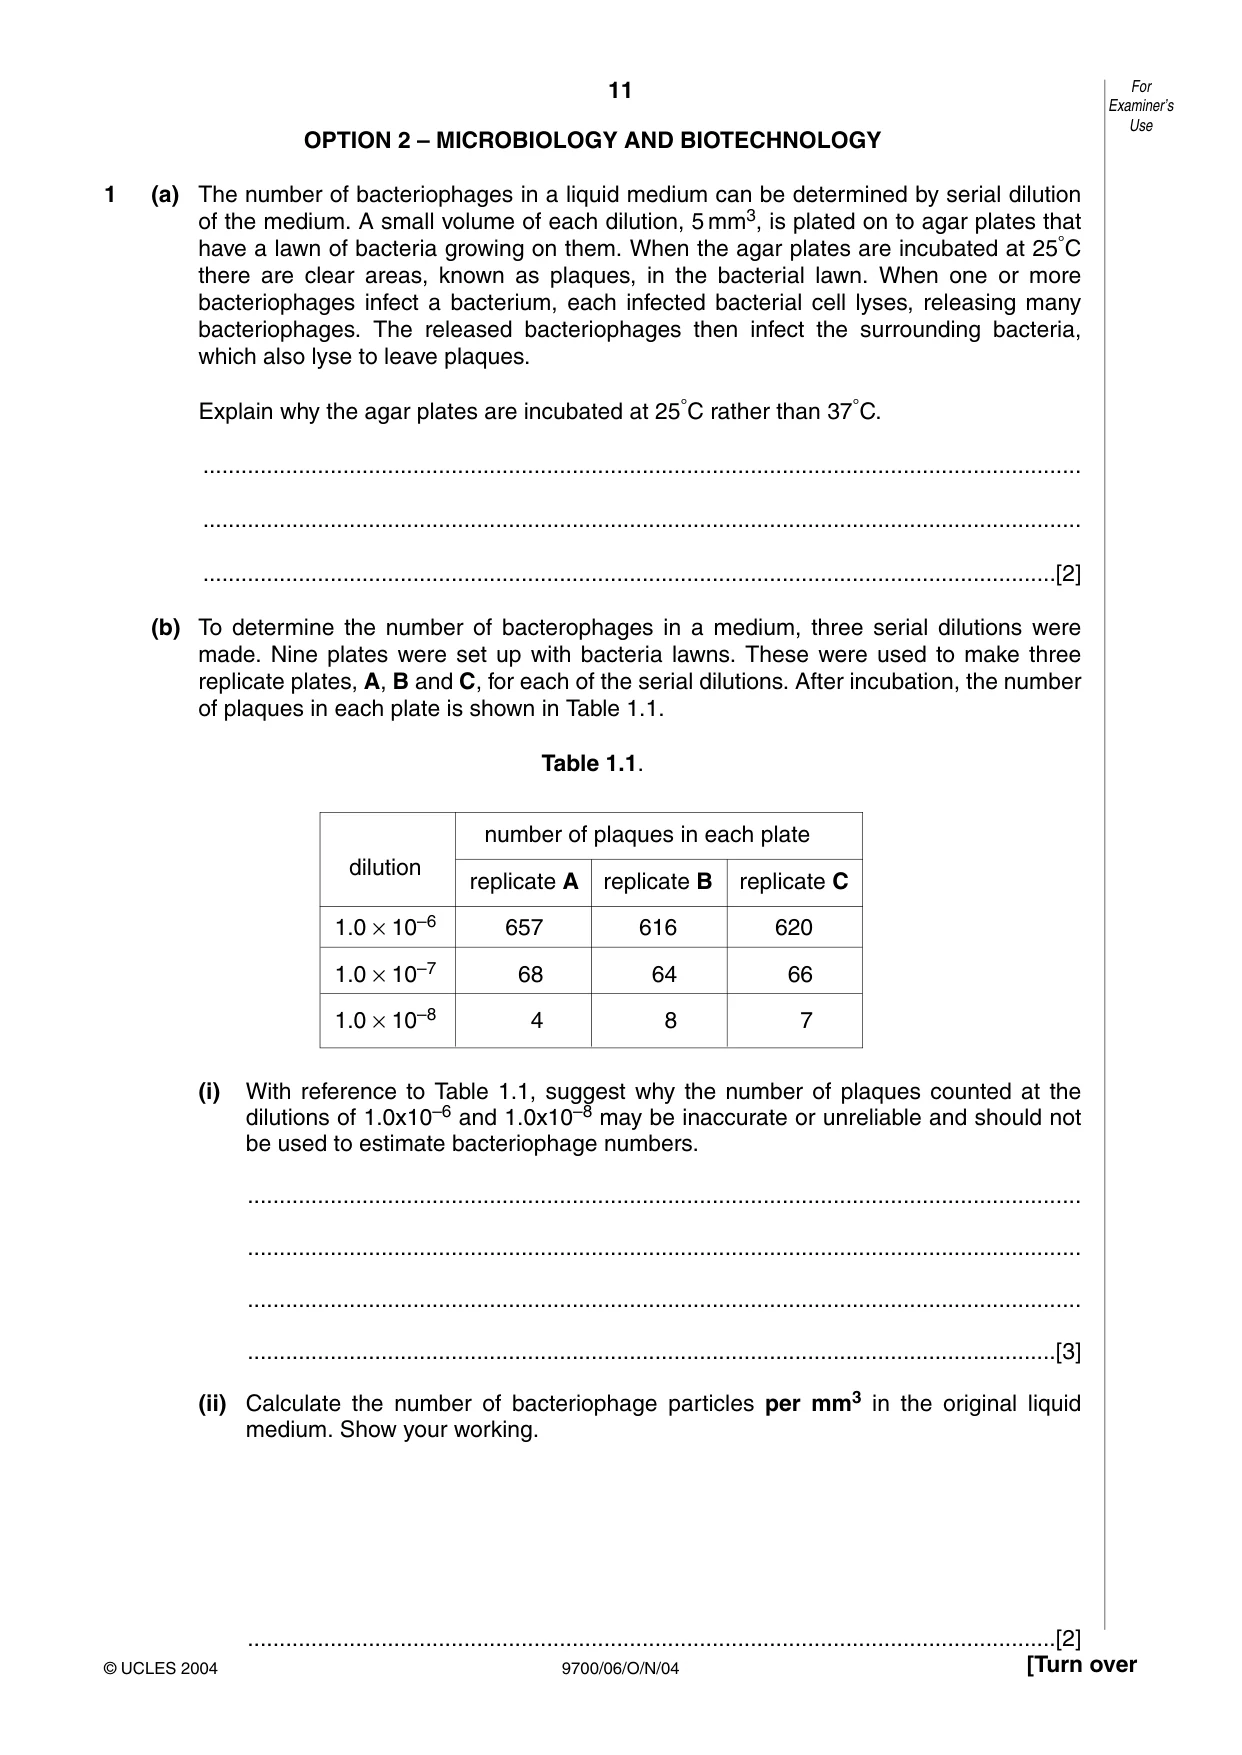
11 9700/06/O/N/04 [Turn over OPTION 2 – MICROBIOLOGY AND BIOTECHNOLOGY 1 (a) The number of bacteriophages in a liquid medium can be determined by serial dilution of the medium. A small volume of each dilution, 5 mm3, is plated on to agar plates that have a lawn of bacteria growing on them. When the agar plates are incubated at 25°C there are clear areas, known as plaques, in the bacterial lawn. When one or more bacteriophages infect a bacterium, each infected bacterial cell lyses, releasing many bacteriophages. The released bacteriophages then infect the surrounding bacteria, which also lyse to leave plaques. Explain why the agar plates are incubated at 25°C rather than 37°C. … … …[2] (b) To determine the number of bacterophages in a medium, three serial dilutions were made. Nine plates were set up with bacteria lawns. These were used to make three replicate plates, A, B and C, for each of the serial dilutions. After incubation, the number of plaques in each plate is shown in Table 1.1. Table 1.1. (i) With reference to Table 1.1, suggest why the number of plaques counted at the dilutions of 1.0x10⁻⁶ and 1.0x10⁻⁸ may be inaccurate or unreliable and should not be used to estimate bacteriophage numbers. … … … …[3] (ii) Calculate the number of bacteriophage particles per mm3 in the original liquid medium. Show your working. …[2] For Examiner’s Use © UCLES 2004 number of plaques in each plate dilution replicate A replicate B replicate C 1.0 × 10⁻⁶ 657 616 620 1.0 × 10⁻⁷ 68 64 66 1.0 × 10⁻⁸ 4 8 7
Question paper, page 12
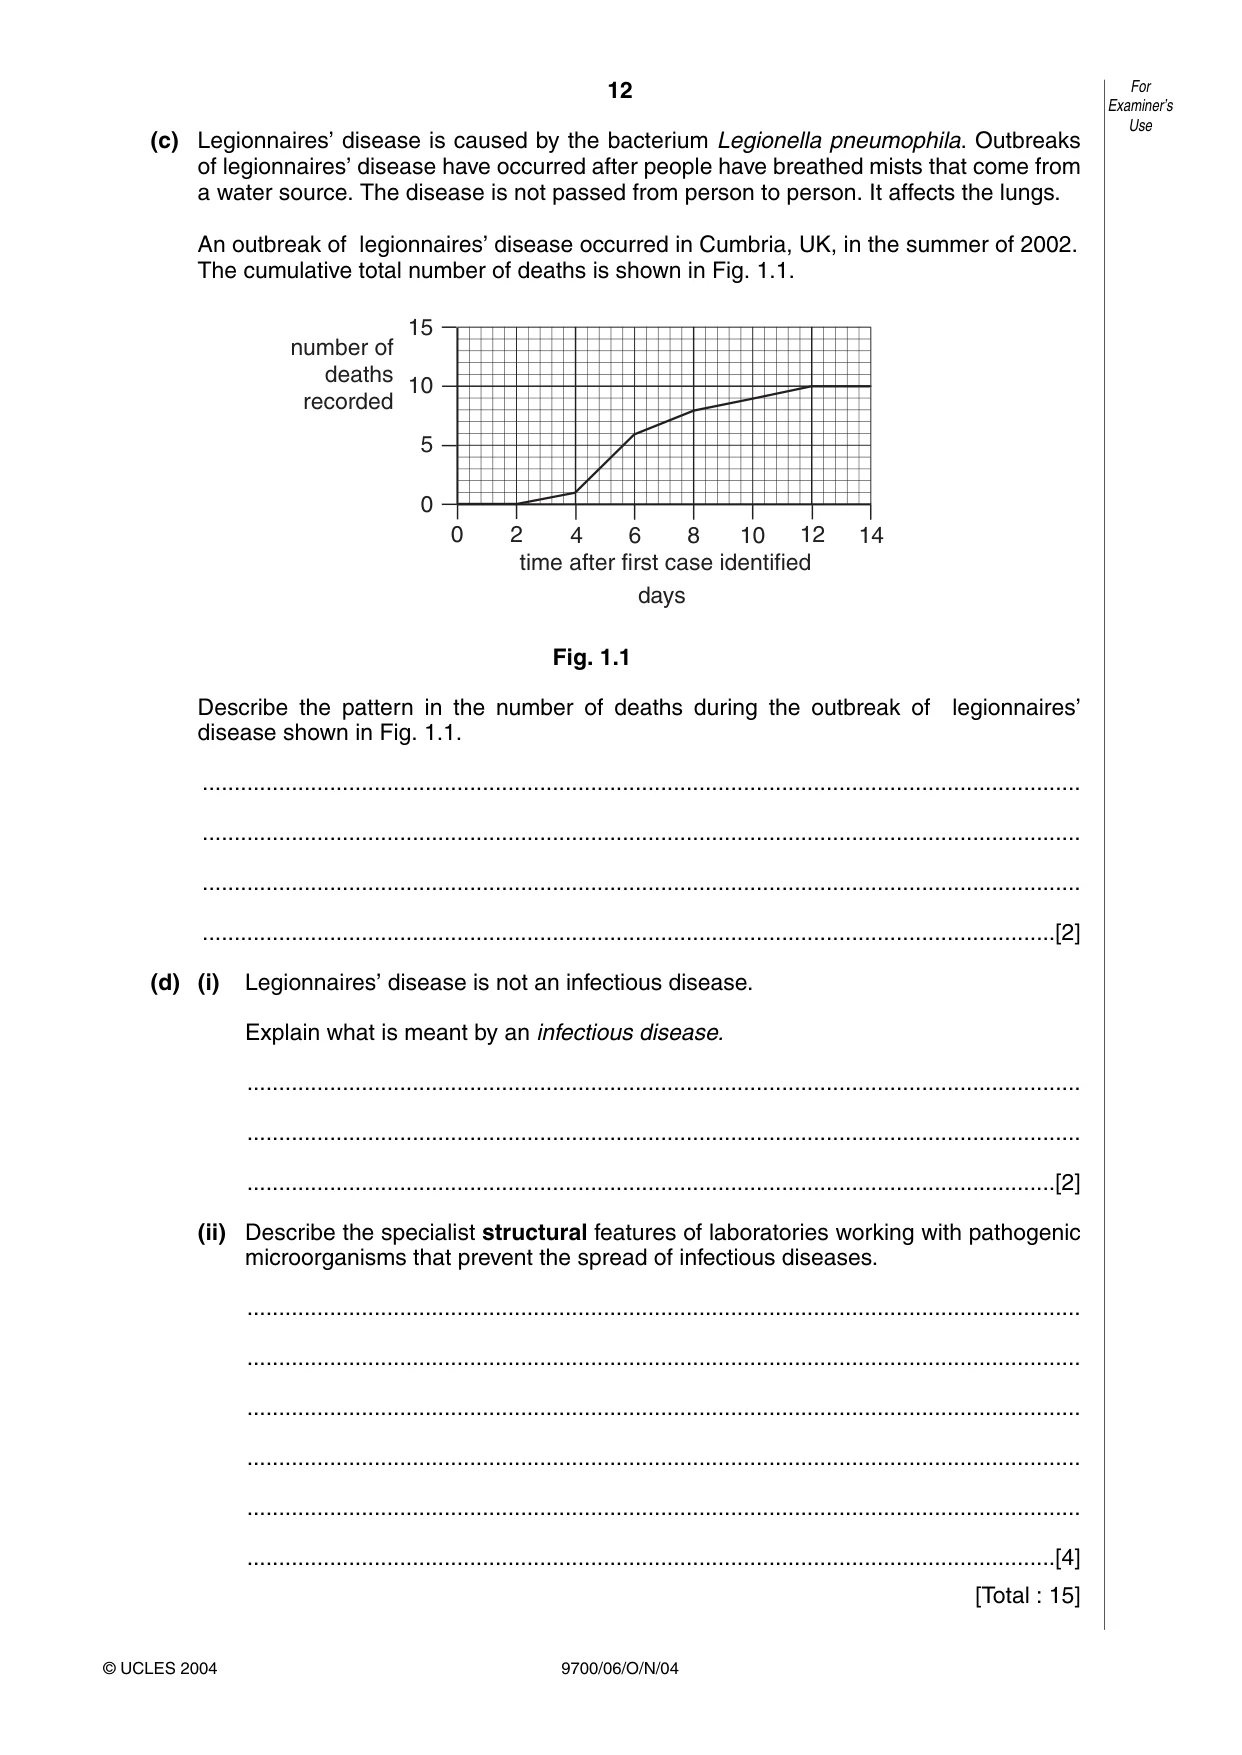
12 9700/06/O/N/04 (c) Legionnaires’ disease is caused by the bacterium Legionella pneumophila. Outbreaks of legionnaires’ disease have occurred after people have breathed mists that come from a water source. The disease is not passed from person to person. It affects the lungs. An outbreak of legionnaires’ disease occurred in Cumbria, UK, in the summer of 2002. The cumulative total number of deaths is shown in Fig. 1.1. Fig. 1.1 Describe the pattern in the number of deaths during the outbreak of legionnaires’ disease shown in Fig. 1.1. … … … …[2] (d) (i) Legionnaires’ disease is not an infectious disease. Explain what is meant by an infectious disease. … … …[2] (ii) Describe the specialist structural features of laboratories working with pathogenic microorganisms that prevent the spread of infectious diseases. … … … … … …[4] [Total : 15] 14 12 10 8 6 4 2 0 0 5 10 15 number of deaths recorded days time after first case identified For Examiner’s Use © UCLES 2004
Question paper, page 13
13 9700/06/O/N/04 [Turn over Question 2 begins on the next page. © UCLES 2004
Question paper, page 14
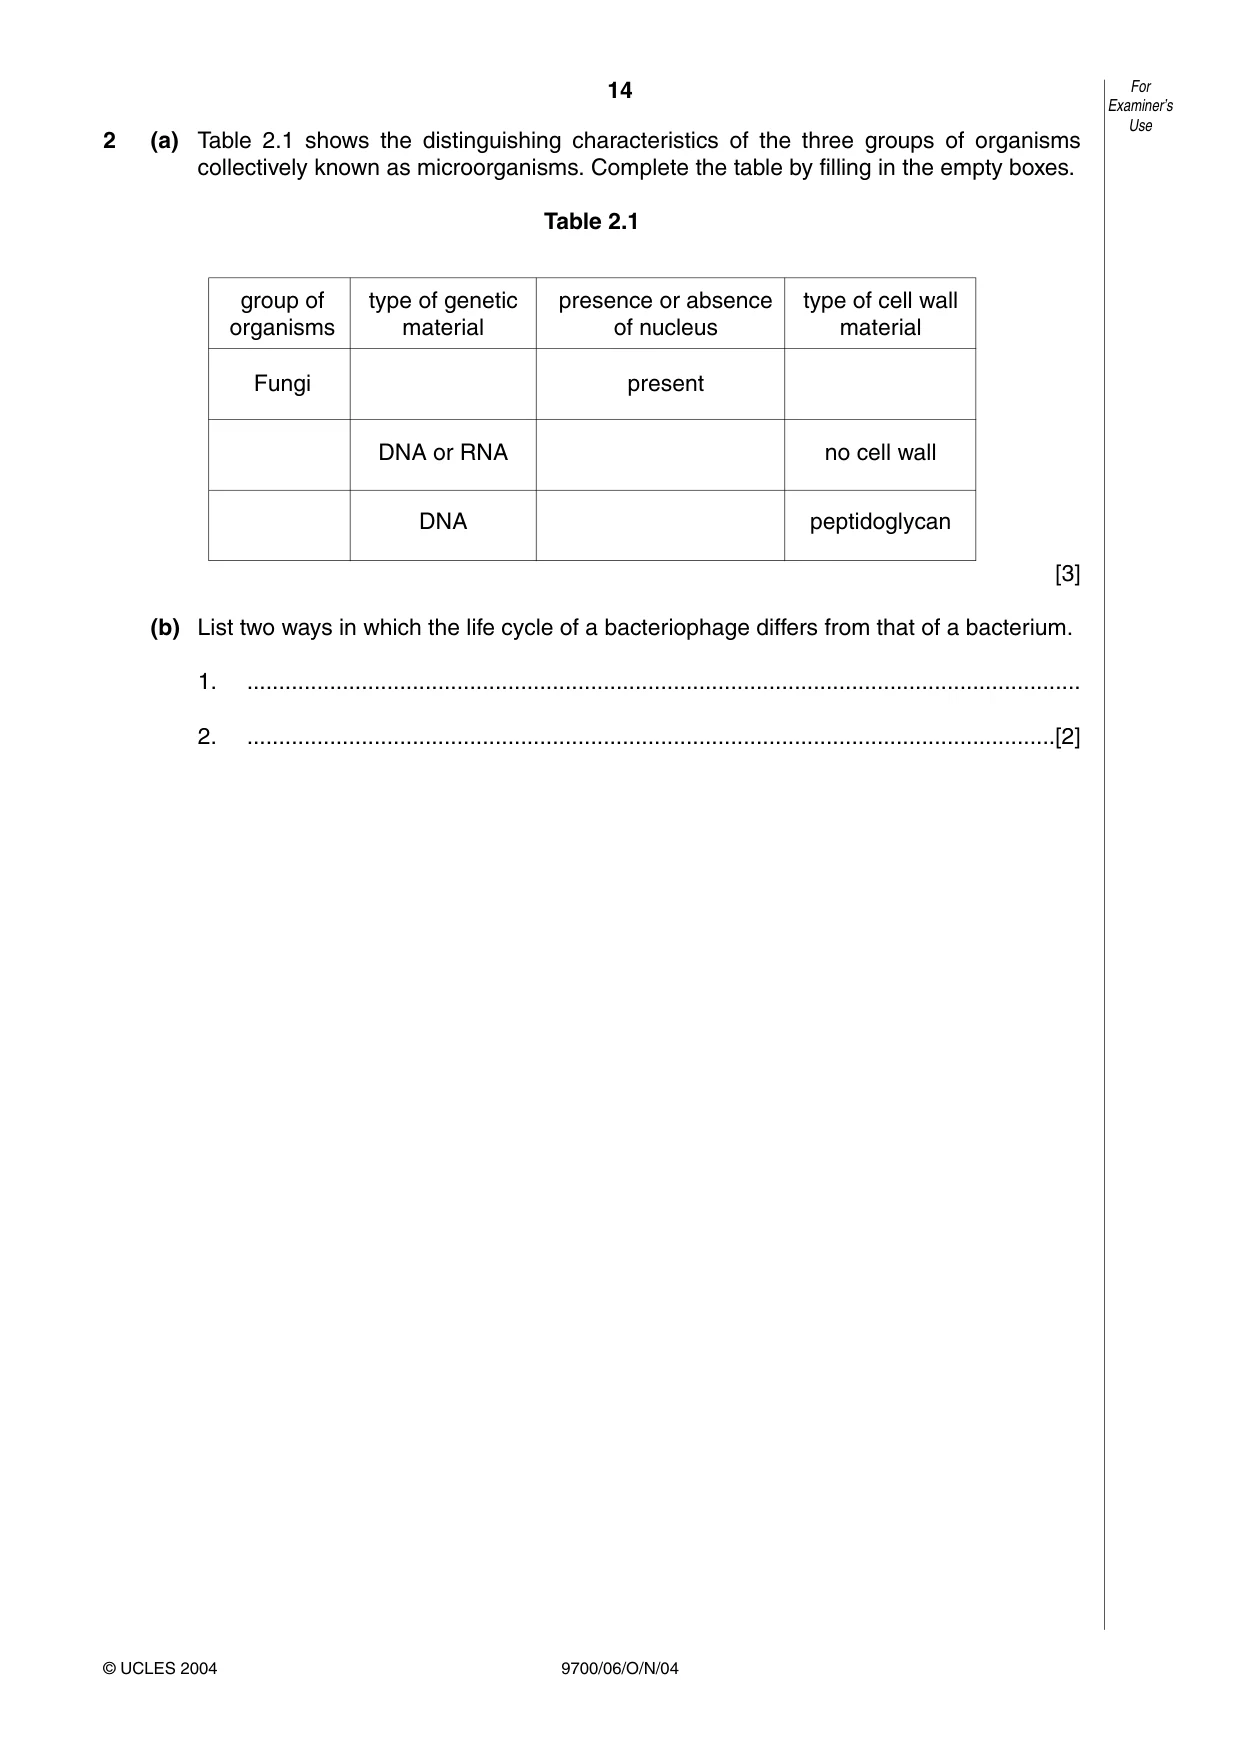
14 9700/06/O/N/04 2 (a) Table 2.1 shows the distinguishing characteristics of the three groups of organisms collectively known as microorganisms. Complete the table by filling in the empty boxes. Table 2.1 [3] (b) List two ways in which the life cycle of a bacteriophage differs from that of a bacterium. 1. … 2. …[2] For Examiner’s Use © UCLES 2004 group of type of genetic presence or absence type of cell wall organisms material of nucleus material Fungi present DNA or RNA no cell wall DNA peptidoglycan
Question paper, page 15
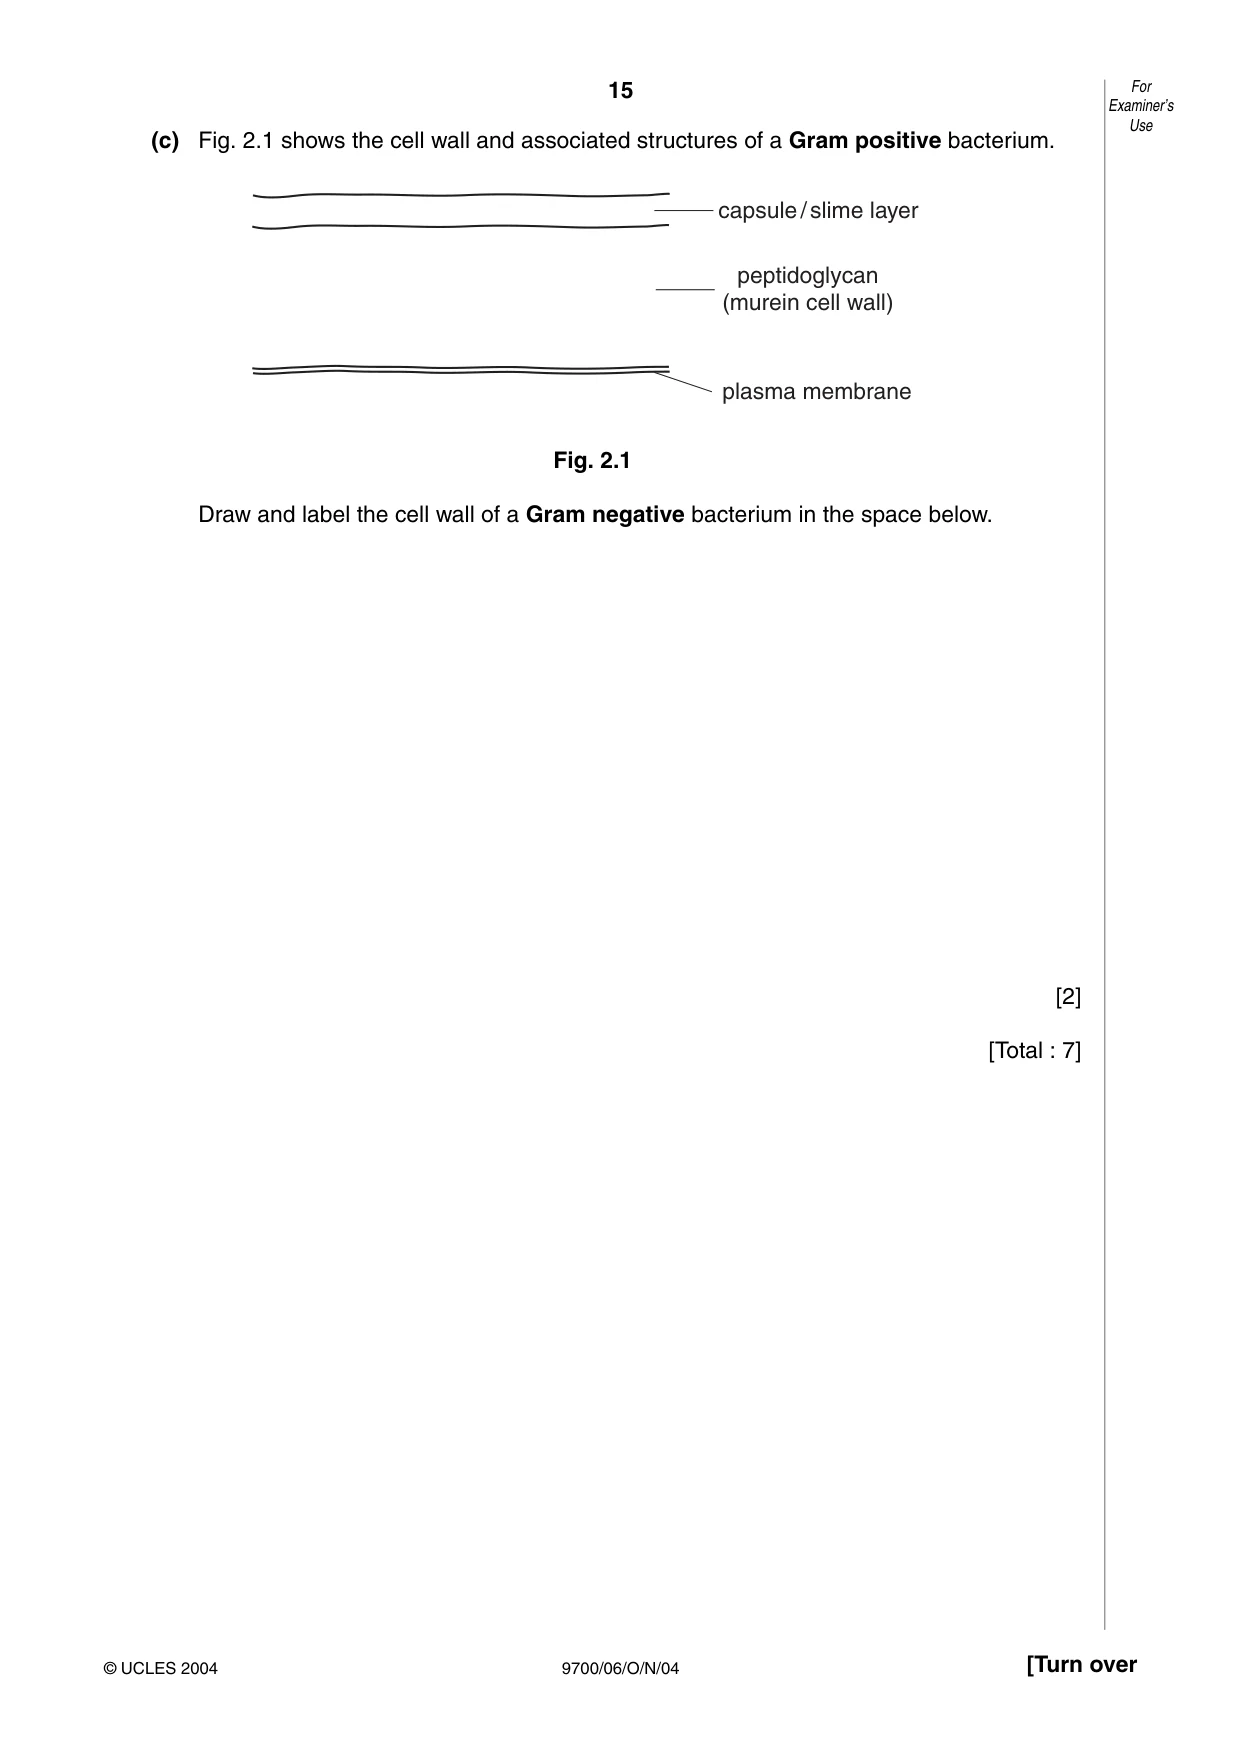
15 9700/06/O/N/04 [Turn over (c) Fig. 2.1 shows the cell wall and associated structures of a Gram positive bacterium. Fig. 2.1 Draw and label the cell wall of a Gram negative bacterium in the space below. [2] [Total : 7] capsule / slime layer peptidoglycan (murein cell wall) plasma membrane For Examiner’s Use © UCLES 2004
Question paper, page 16
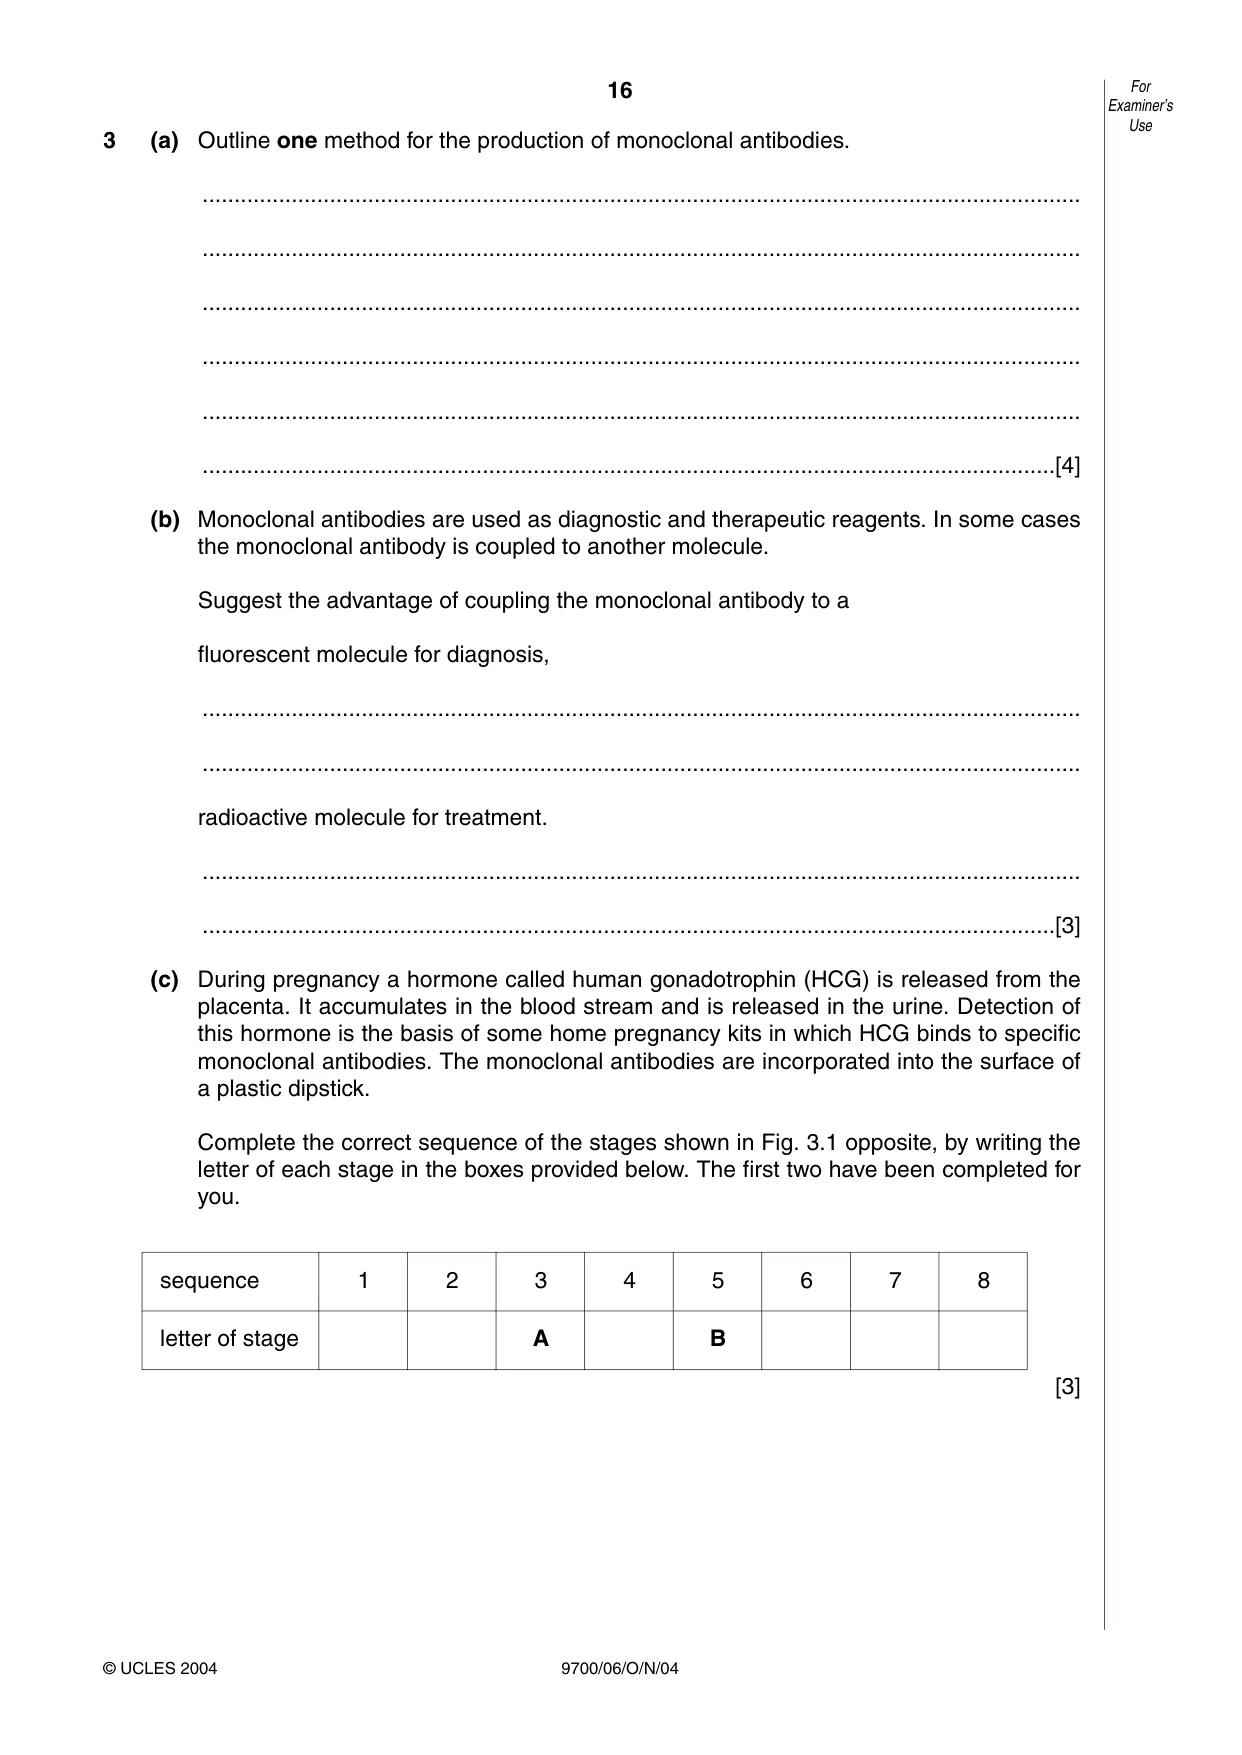
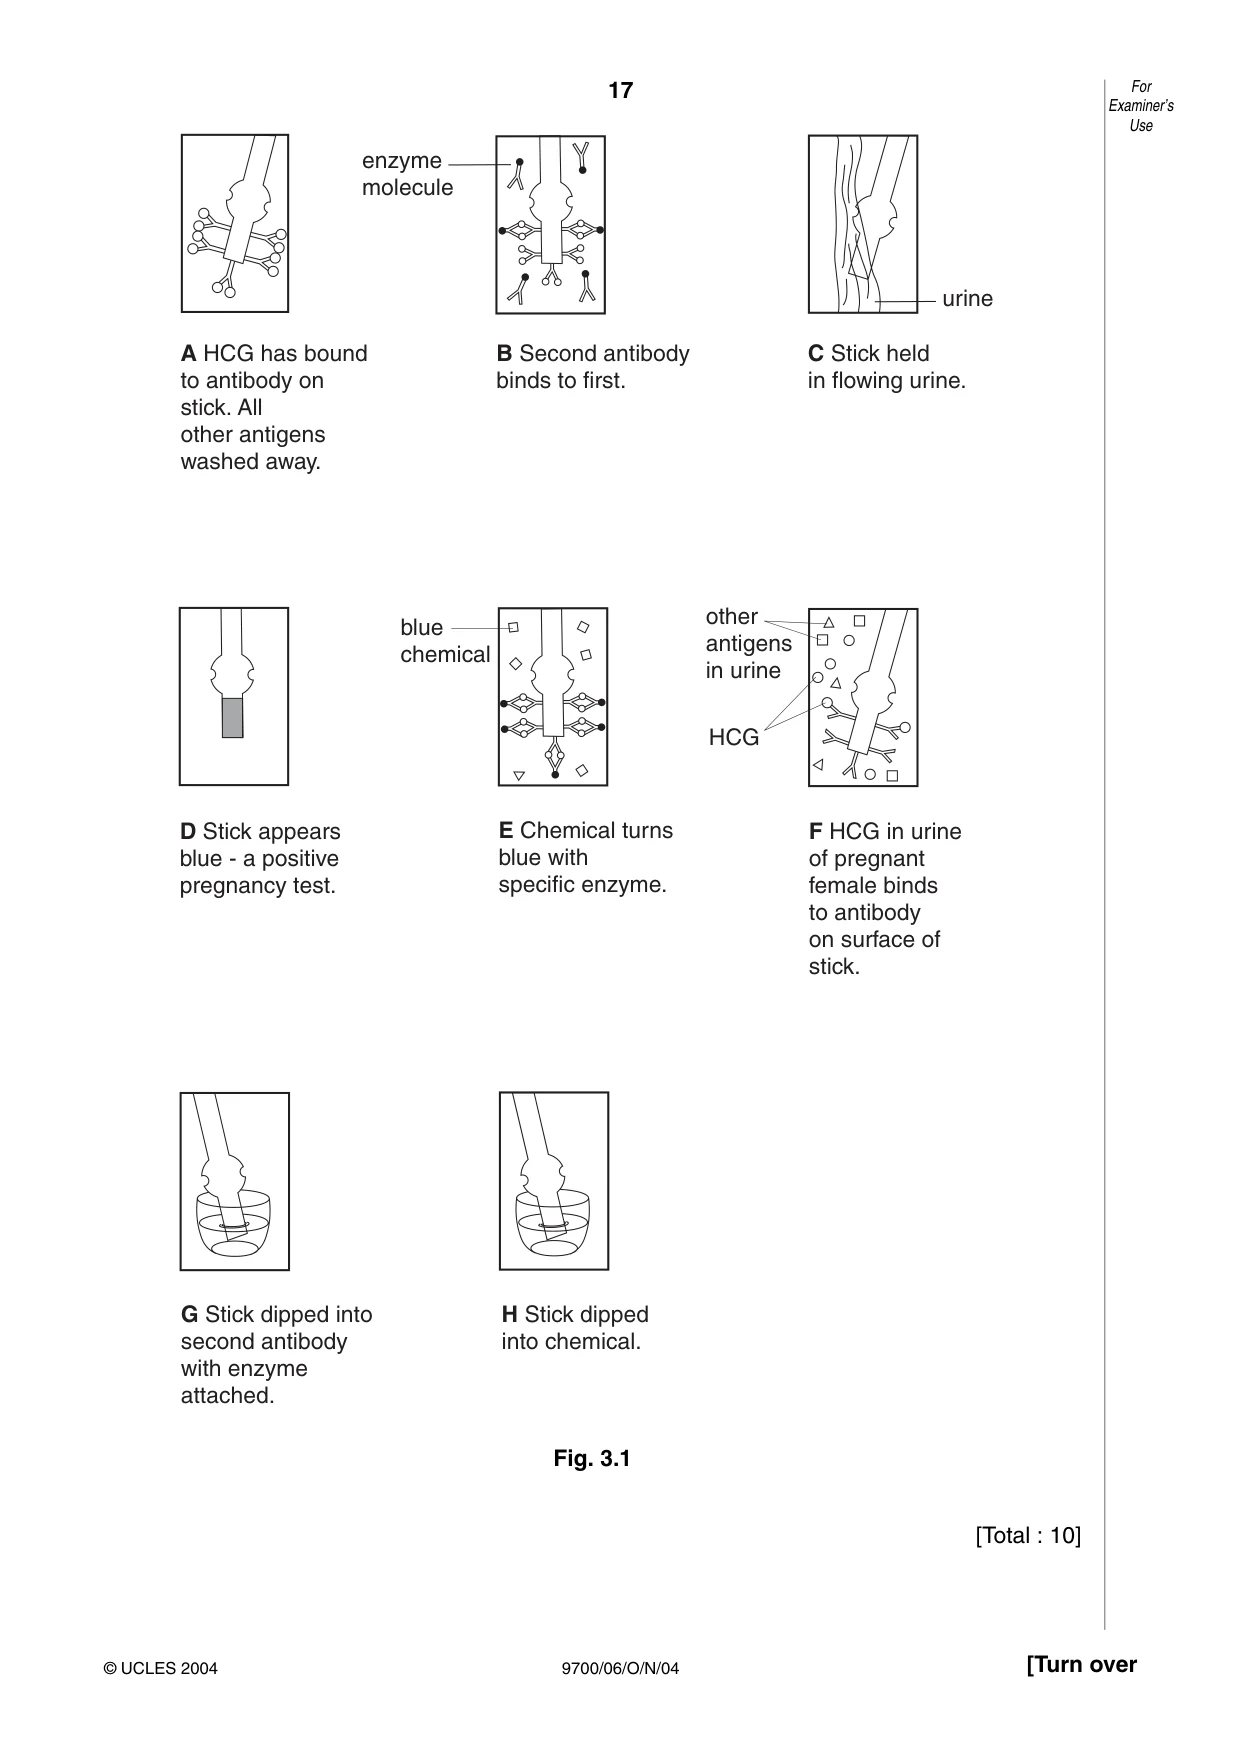
16 9700/06/O/N/04 3 (a) Outline one method for the production of monoclonal antibodies. … … … … … …[4] (b) Monoclonal antibodies are used as diagnostic and therapeutic reagents. In some cases the monoclonal antibody is coupled to another molecule. Suggest the advantage of coupling the monoclonal antibody to a fluorescent molecule for diagnosis, … … radioactive molecule for treatment. … …[3] (c) During pregnancy a hormone called human gonadotrophin (HCG) is released from the placenta. It accumulates in the blood stream and is released in the urine. Detection of this hormone is the basis of some home pregnancy kits in which HCG binds to specific monoclonal antibodies. The monoclonal antibodies are incorporated into the surface of a plastic dipstick. Complete the correct sequence of the stages shown in Fig. 3.1 opposite, by writing the letter of each stage in the boxes provided below. The first two have been completed for you. [3] For Examiner’s Use © UCLES 2004 sequence 1 2 3 4 5 6 7 8 letter of stage A B
Question paper, page 17
17 9700/06/O/N/04 [Turn over Fig. 3.1 [Total : 10] A HCG has bound to antibody on stick. All other antigens washed away. B Second antibody binds to first. enzyme molecule urine C Stick held in flowing urine. D Stick appears blue - a positive pregnancy test. E Chemical turns blue with specific enzyme. F HCG in urine of pregnant female binds to antibody on surface of stick. HCG other antigens in urine blue chemical G Stick dipped into second antibody with enzyme attached. H Stick dipped into chemical. For Examiner’s Use © UCLES 2004
Question paper, page 18
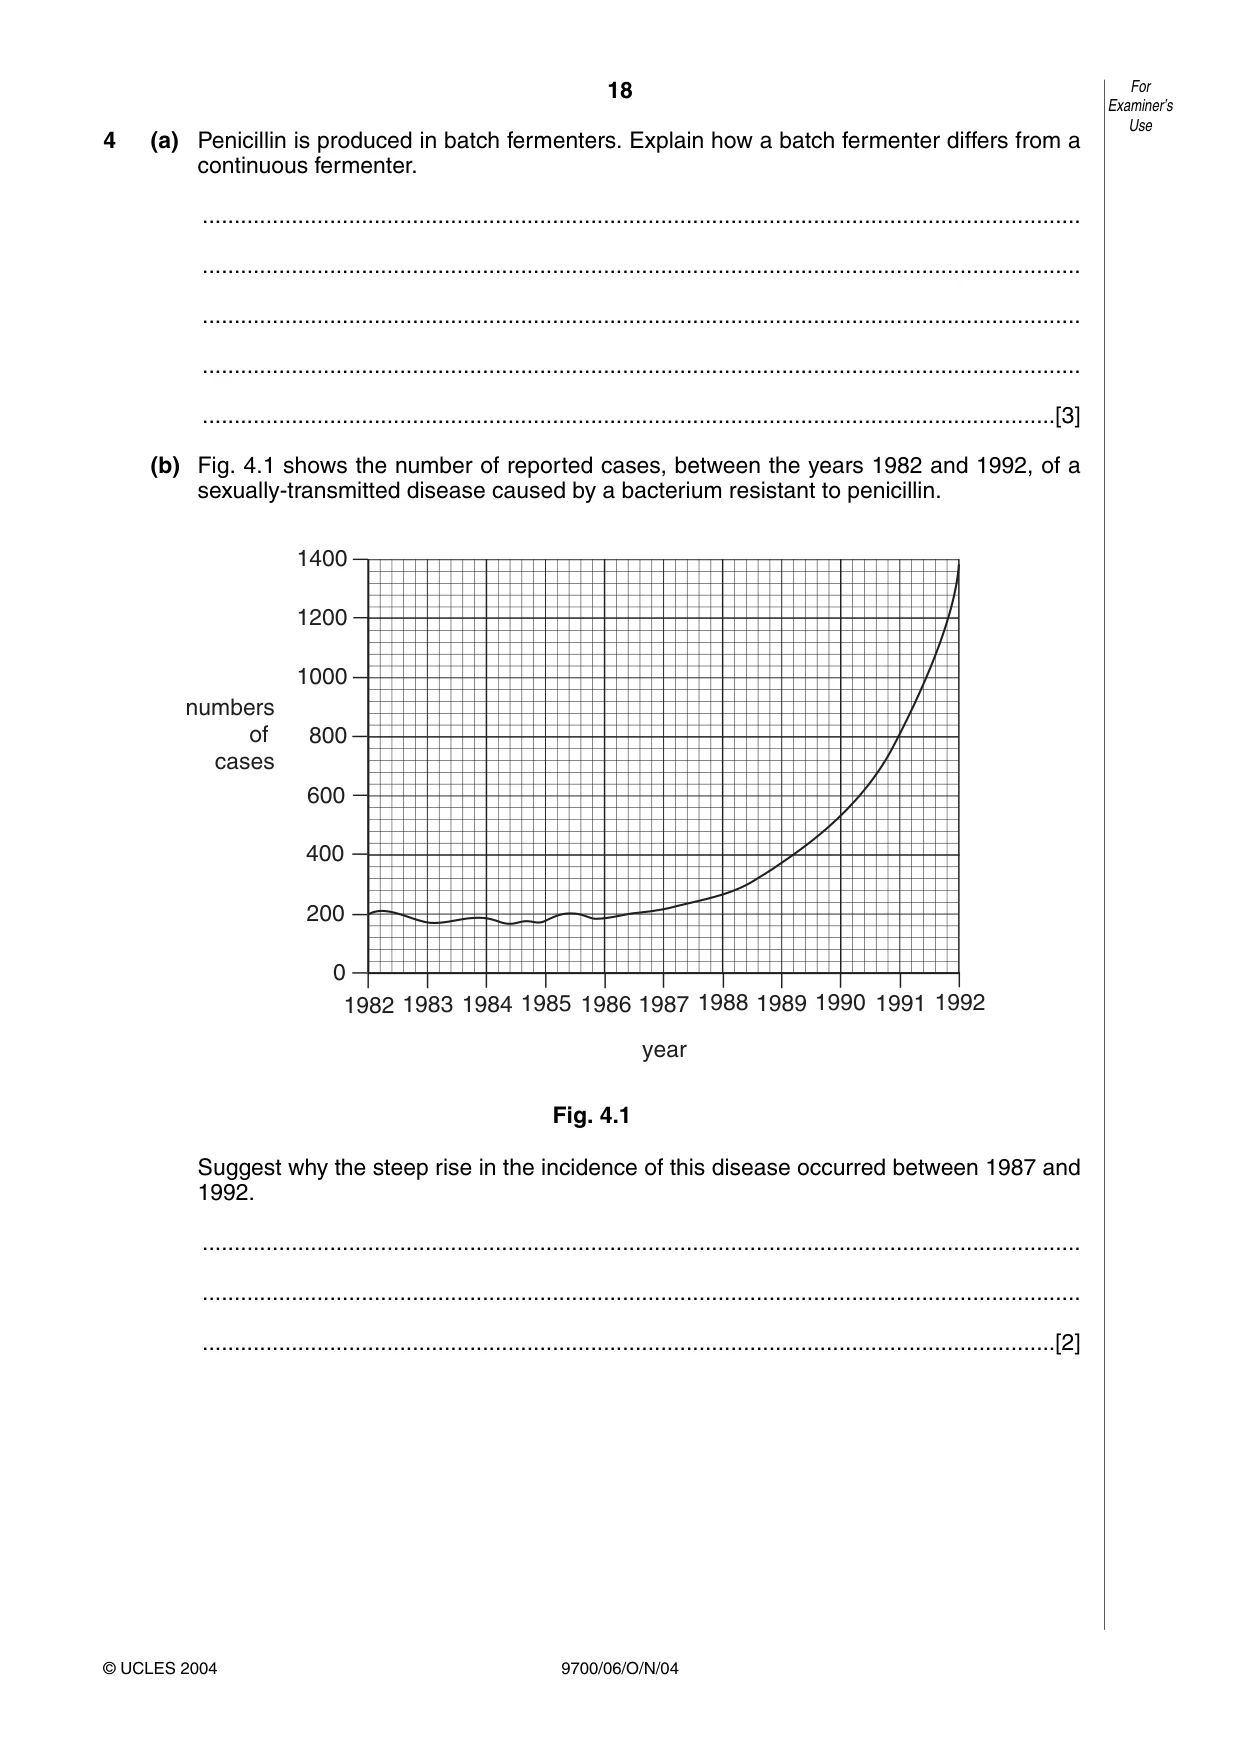
18 9700/06/O/N/04 4 (a) Penicillin is produced in batch fermenters. Explain how a batch fermenter differs from a continuous fermenter. … … … … …[3] (b) Fig. 4.1 shows the number of reported cases, between the years 1982 and 1992, of a sexually-transmitted disease caused by a bacterium resistant to penicillin. Fig. 4.1 Suggest why the steep rise in the incidence of this disease occurred between 1987 and 1992. … … …[2] 1992 1991 1990 1989 1988 1987 1986 1985 1984 1983 1982 0 200 400 600 800 1000 1200 1400 numbers of cases year © UCLES 2004 For Examiner’s Use
Question paper, page 19
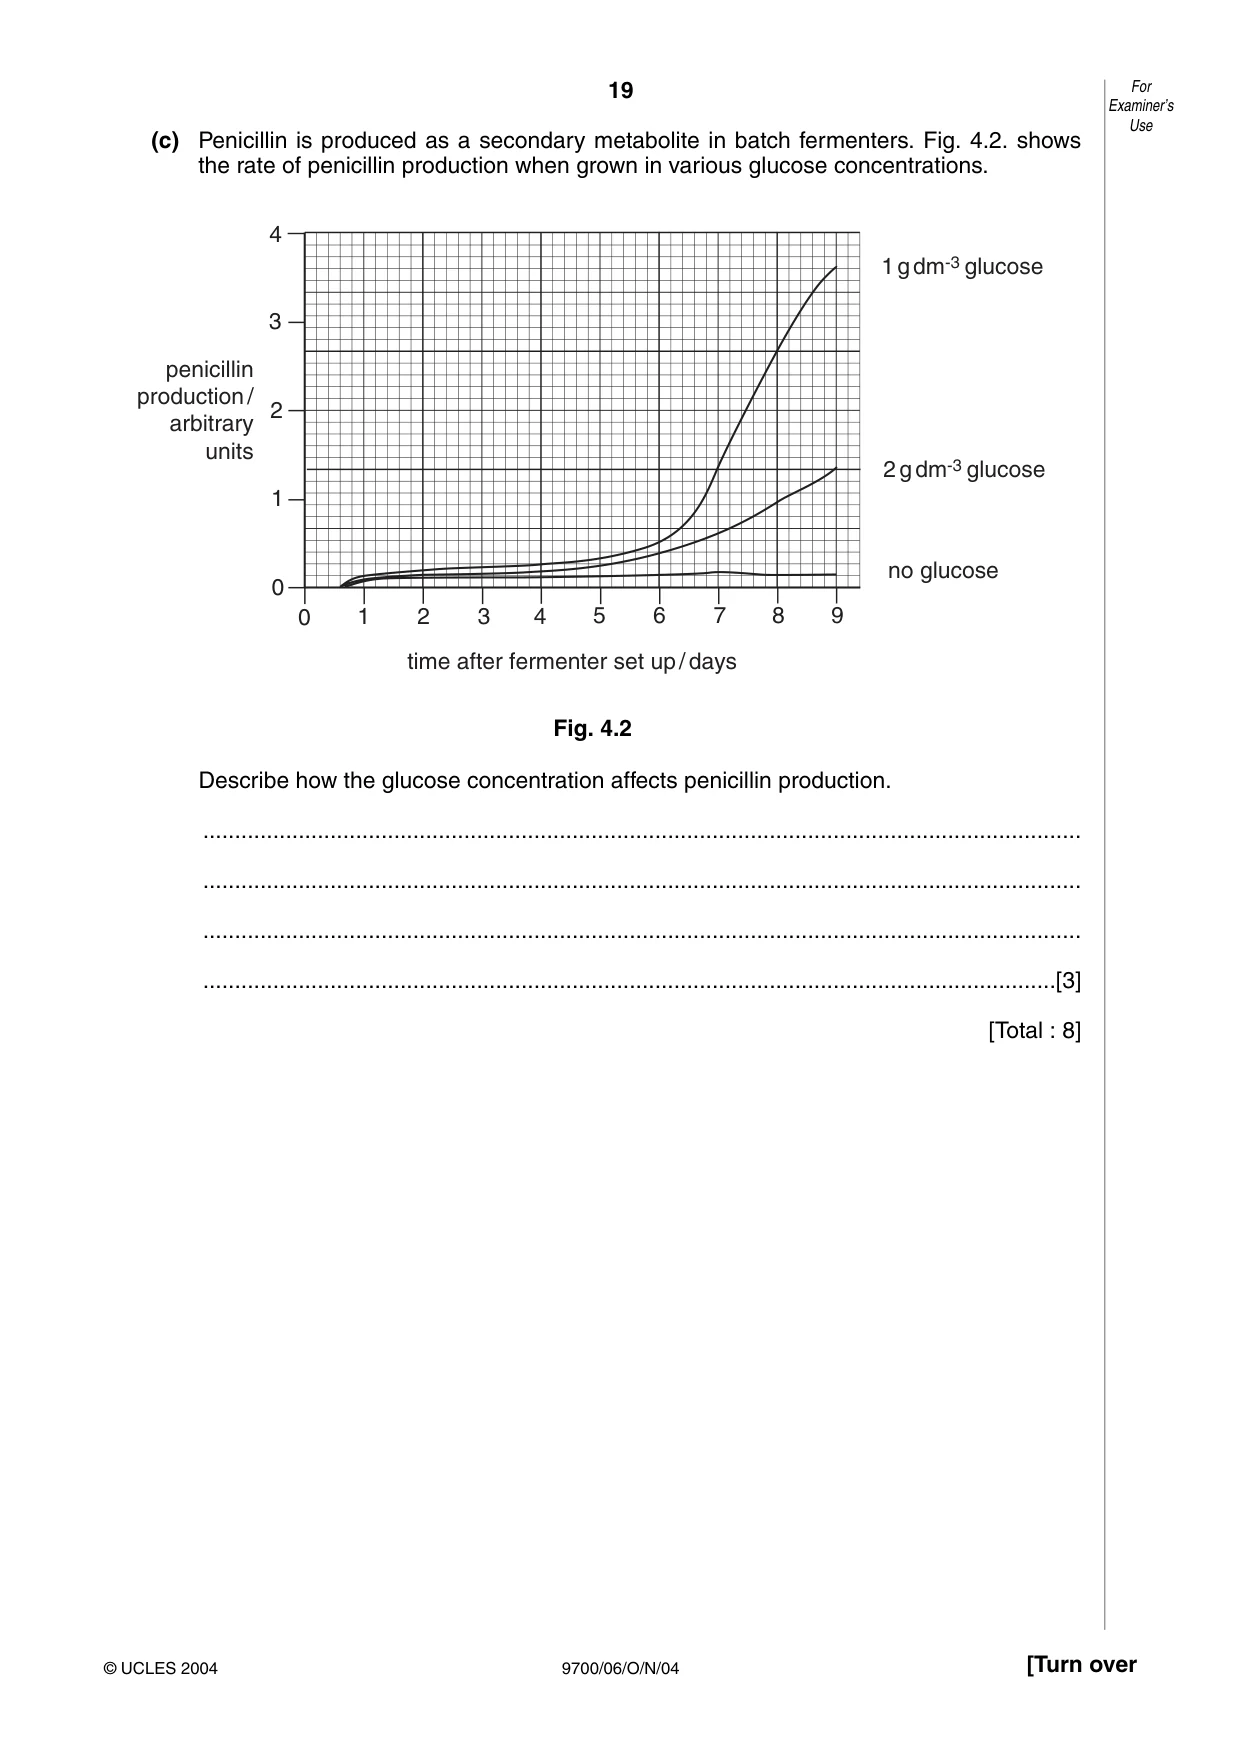
19 9700/06/O/N/04 [Turn over (c) Penicillin is produced as a secondary metabolite in batch fermenters. Fig. 4.2. shows the rate of penicillin production when grown in various glucose concentrations. Fig. 4.2 Describe how the glucose concentration affects penicillin production. … … … …[3] [Total : 8] 0 1 2 3 4 5 6 7 8 9 time after fermenter set up / days penicillin production / arbitrary units 4 3 2 1 0 no glucose 2 g dm-3 glucose 1 g dm-3 glucose © UCLES 2004 For Examiner’s Use
Question paper, page 20
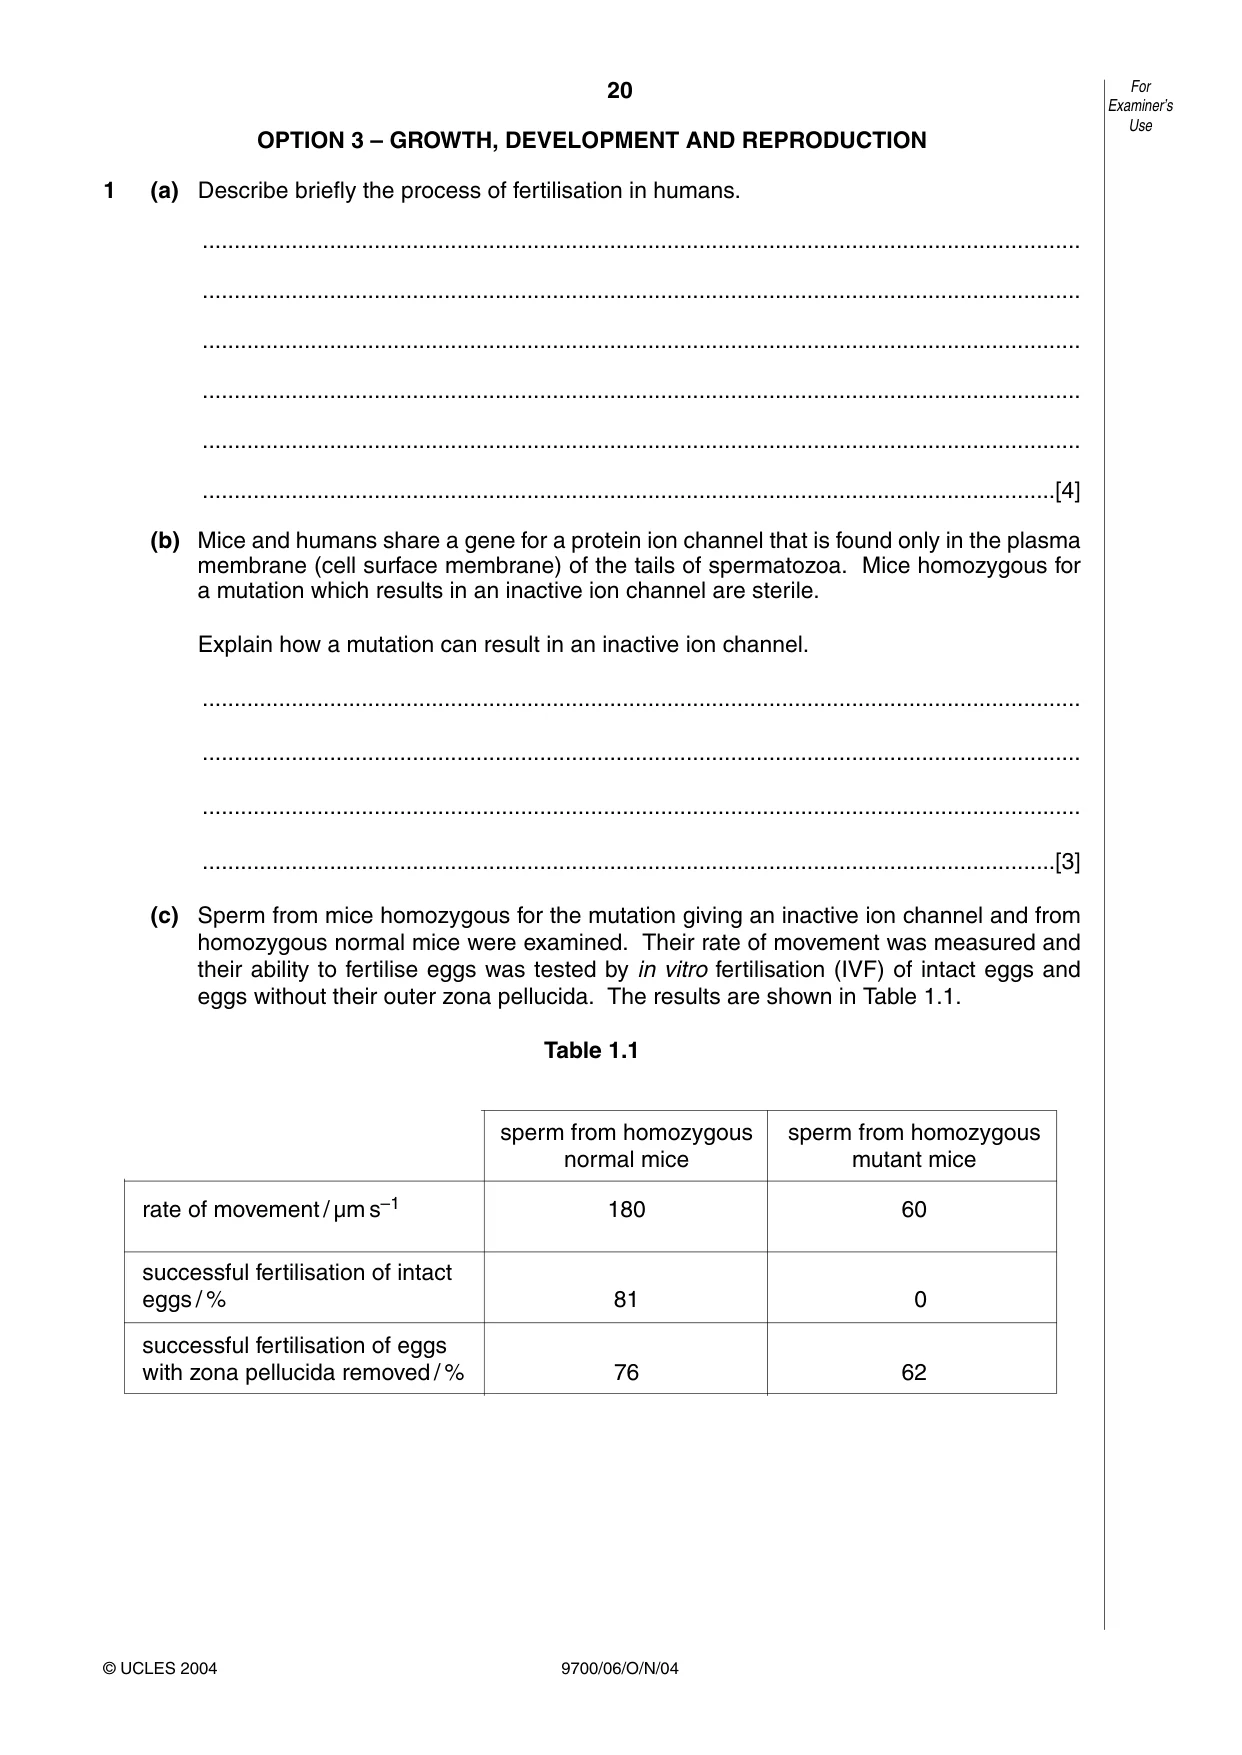
20 9700/06/O/N/04 OPTION 3 – GROWTH, DEVELOPMENT AND REPRODUCTION 1 (a) Describe briefly the process of fertilisation in humans. … … … … … …[4] (b) Mice and humans share a gene for a protein ion channel that is found only in the plasma membrane (cell surface membrane) of the tails of spermatozoa. Mice homozygous for a mutation which results in an inactive ion channel are sterile. Explain how a mutation can result in an inactive ion channel. … … … …[3] (c) Sperm from mice homozygous for the mutation giving an inactive ion channel and from homozygous normal mice were examined. Their rate of movement was measured and their ability to fertilise eggs was tested by in vitro fertilisation (IVF) of intact eggs and eggs without their outer zona pellucida. The results are shown in Table 1.1. Table 1.1 For Examiner’s Use © UCLES 2004 sperm from homozygous sperm from homozygous normal mice mutant mice rate of movement / µm s–1 180 60 successful fertilisation of intact eggs / % 81 0 successful fertilisation of eggs with zona pellucida removed / % 76 62
Question paper, page 21
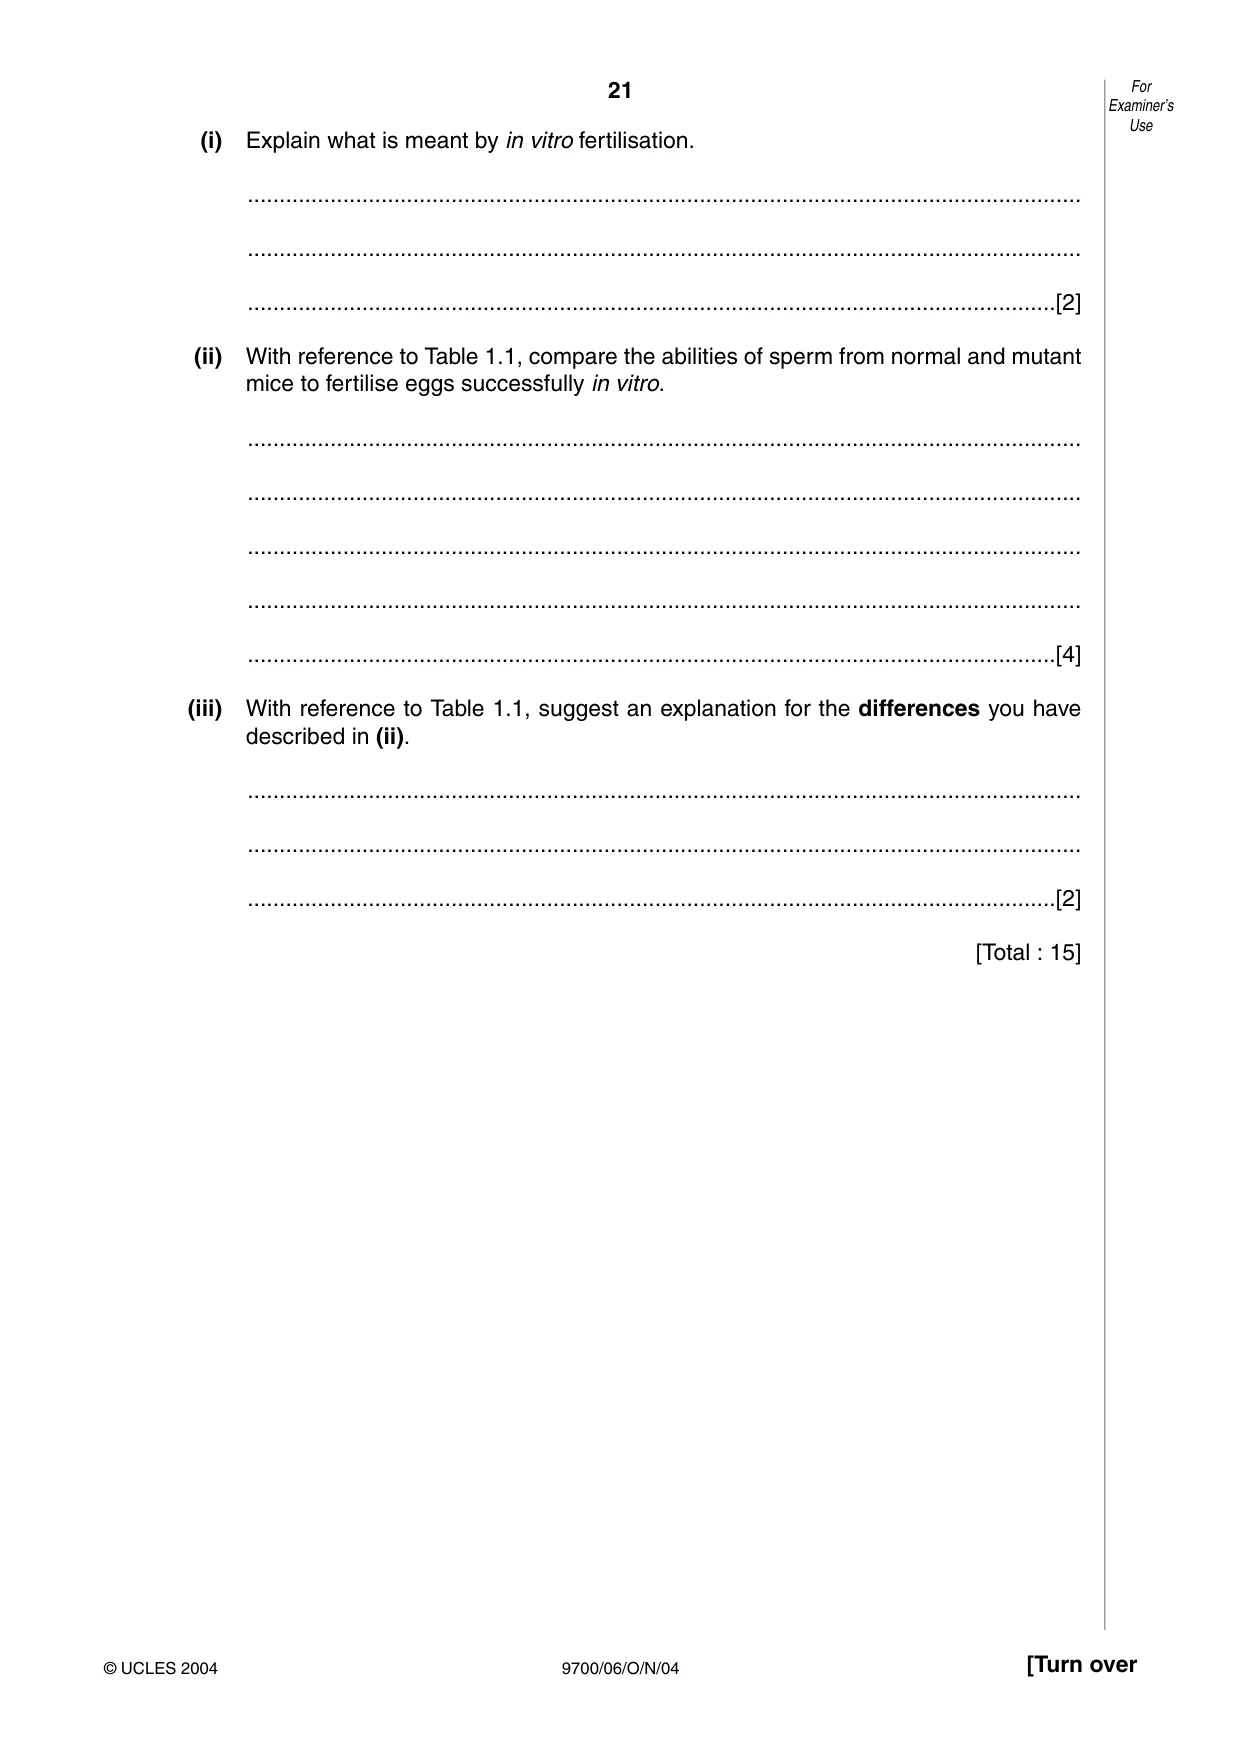
21 9700/06/O/N/04 [Turn over (i) Explain what is meant by in vitro fertilisation. … … …[2] (ii) With reference to Table 1.1, compare the abilities of sperm from normal and mutant mice to fertilise eggs successfully in vitro. … … … … …[4] (iii) With reference to Table 1.1, suggest an explanation for the differences you have described in (ii). … … …[2] [Total : 15] For Examiner’s Use © UCLES 2004
Question paper, page 22
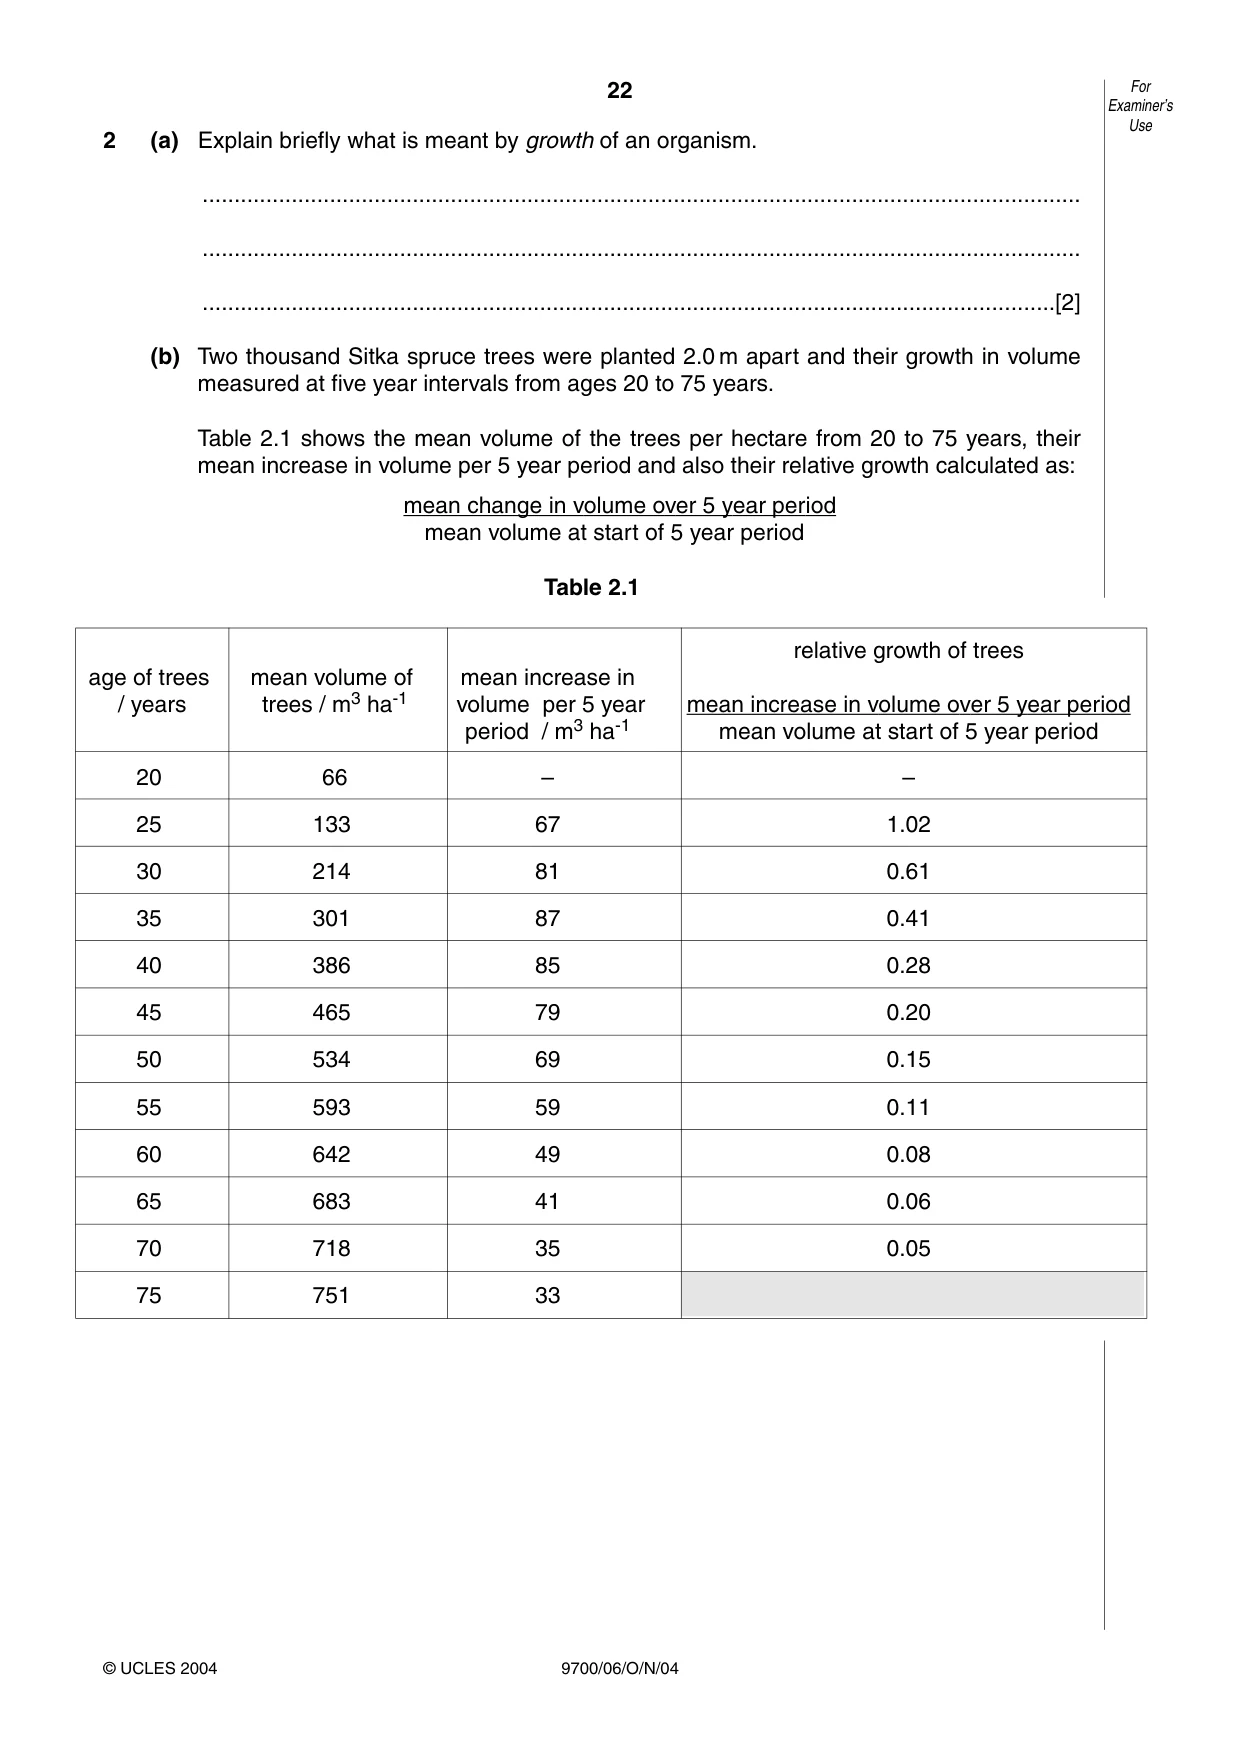
relative growth of trees age of trees mean volume of mean increase in / years trees / m3 ha-1 volume per 5 year mean increase in volume over 5 year period period / m3 ha-1 mean volume at start of 5 year period 20 66 – – 25 133 67 1.02 30 214 81 0.61 35 301 87 0.41 40 386 85 0.28 45 465 79 0.20 50 534 69 0.15 55 593 59 0.11 60 642 49 0.08 65 683 41 0.06 70 718 35 0.05 75 751 33 22 9700/06/O/N/04 2 (a) Explain briefly what is meant by growth of an organism. … … …[2] (b) Two thousand Sitka spruce trees were planted 2.0 m apart and their growth in volume measured at five year intervals from ages 20 to 75 years. Table 2.1 shows the mean volume of the trees per hectare from 20 to 75 years, their mean increase in volume per 5 year period and also their relative growth calculated as: mean change in volume over 5 year period mean volume at start of 5 year period Table 2.1 For Examiner’s Use © UCLES 2004
Question paper, page 23
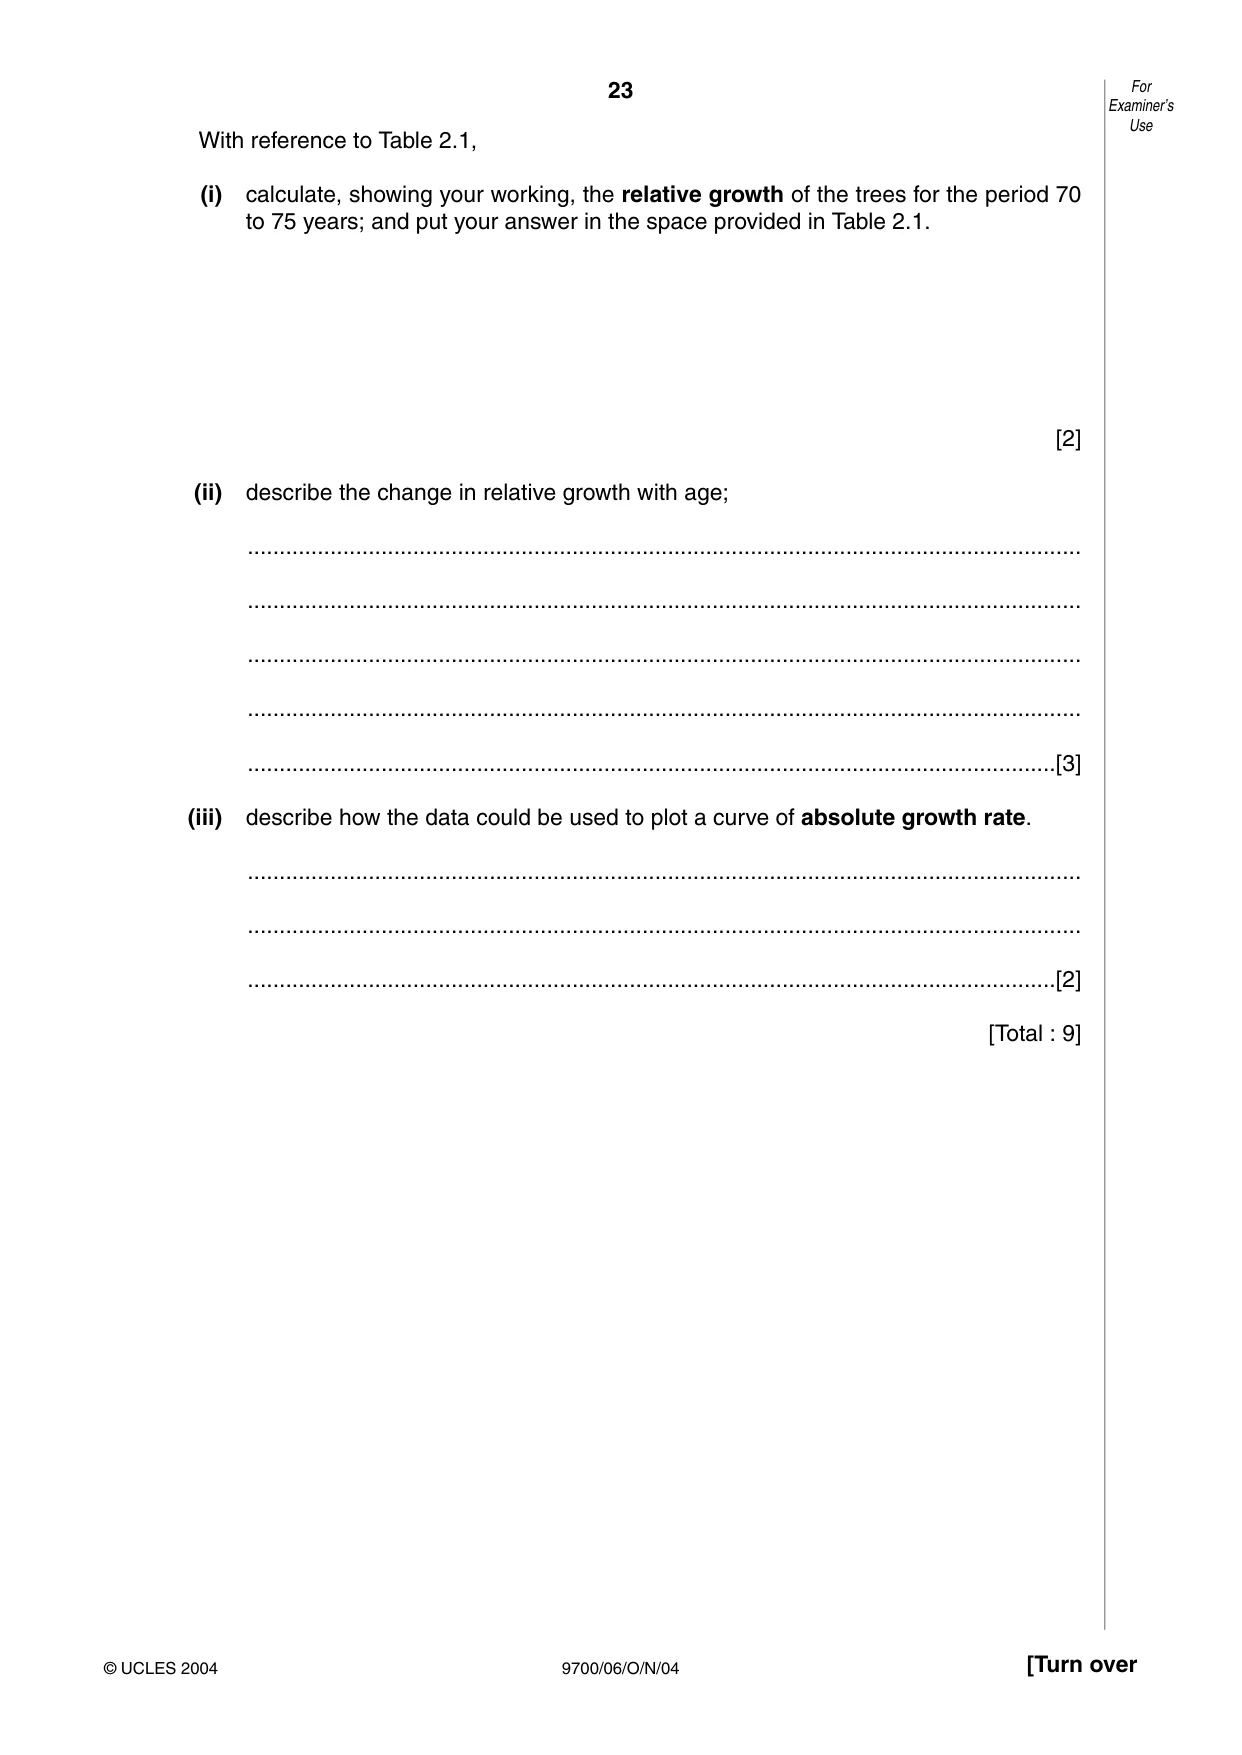
23 9700/06/O/N/04 [Turn over With reference to Table 2.1, (i) calculate, showing your working, the relative growth of the trees for the period 70 to 75 years; and put your answer in the space provided in Table 2.1. [2] (ii) describe the change in relative growth with age; … … … … …[3] (iii) describe how the data could be used to plot a curve of absolute growth rate. … … …[2] [Total : 9] For Examiner’s Use © UCLES 2004
Question paper, page 24
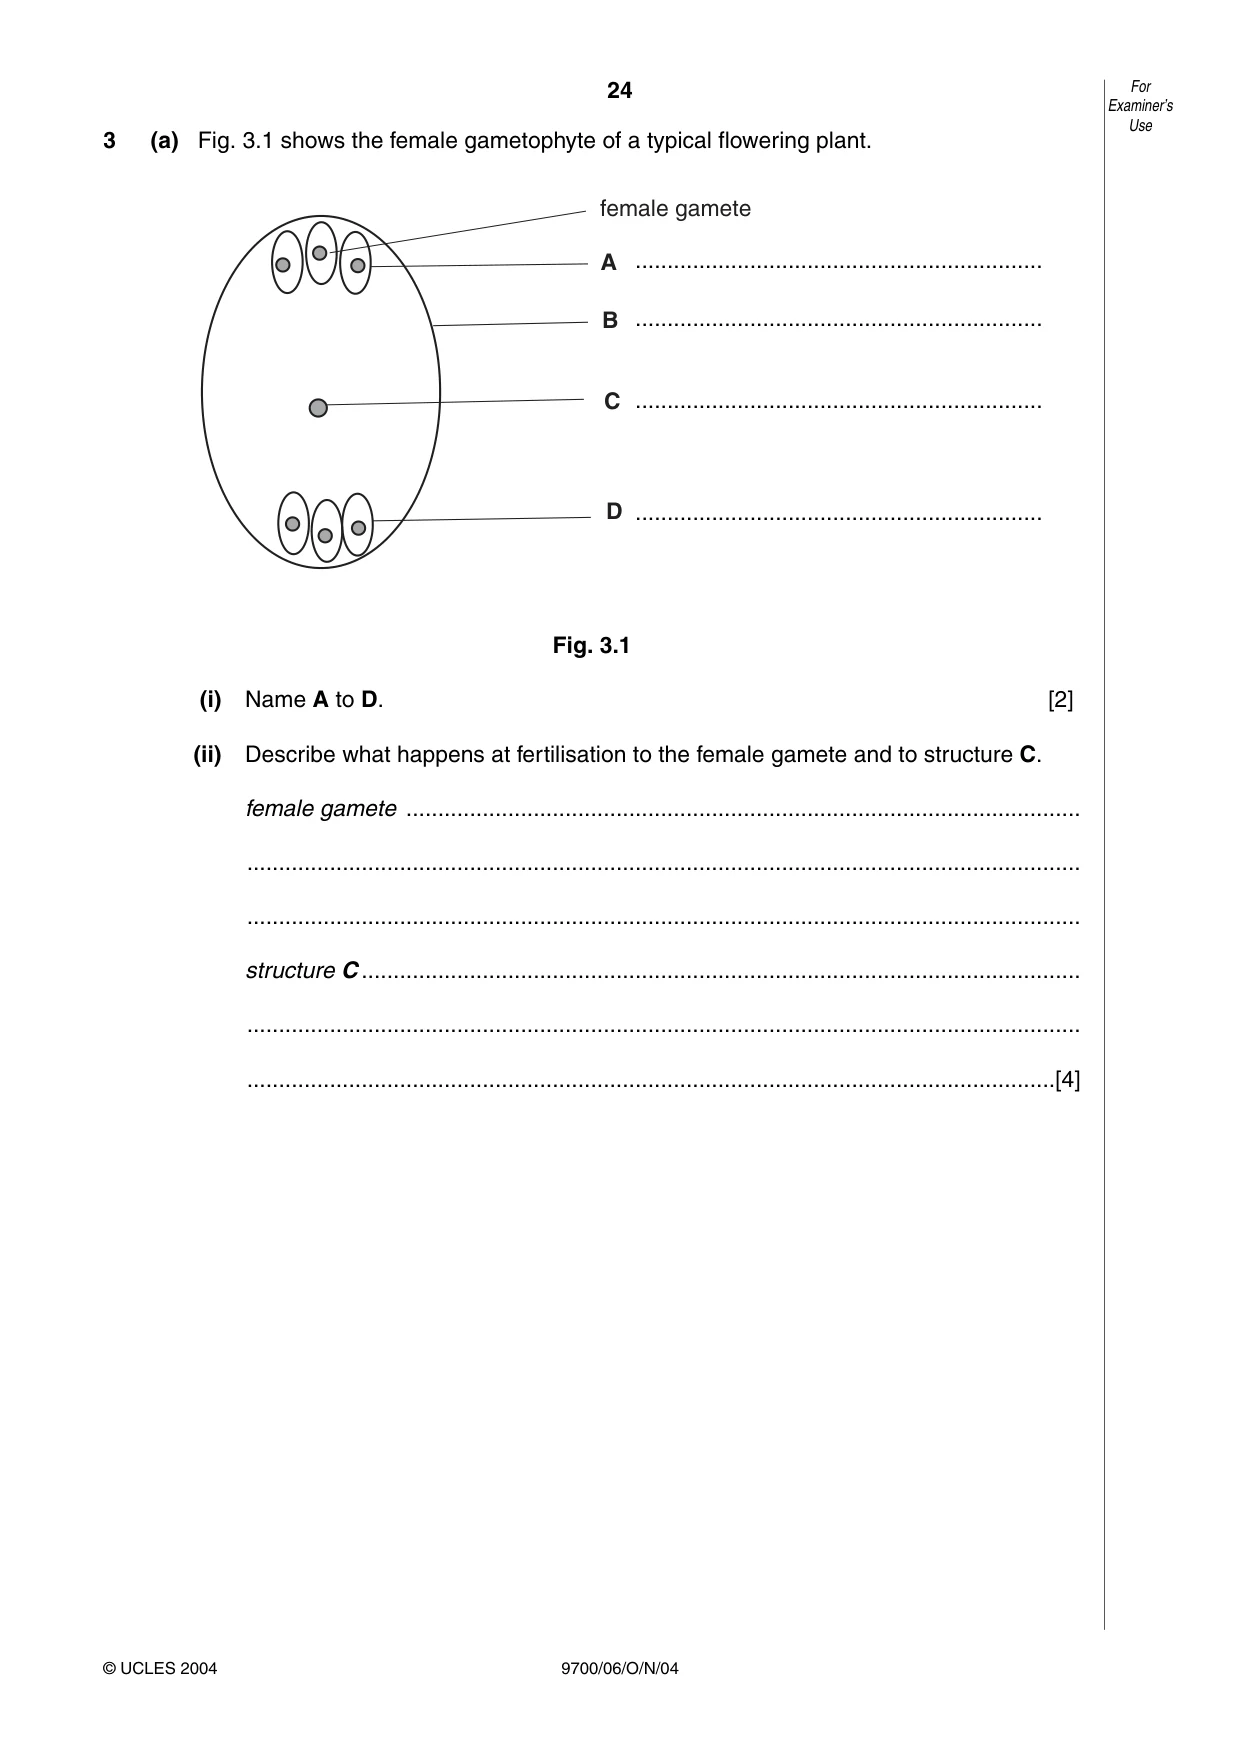
24 9700/06/O/N/04 3 (a) Fig. 3.1 shows the female gametophyte of a typical flowering plant. Fig. 3.1 (i) Name A to D. [2] (ii) Describe what happens at fertilisation to the female gamete and to structure C. female gamete … … … structure C … … …[4] female gamete A B C D For Examiner’s Use © UCLES 2004 … … … …
Question paper, page 25
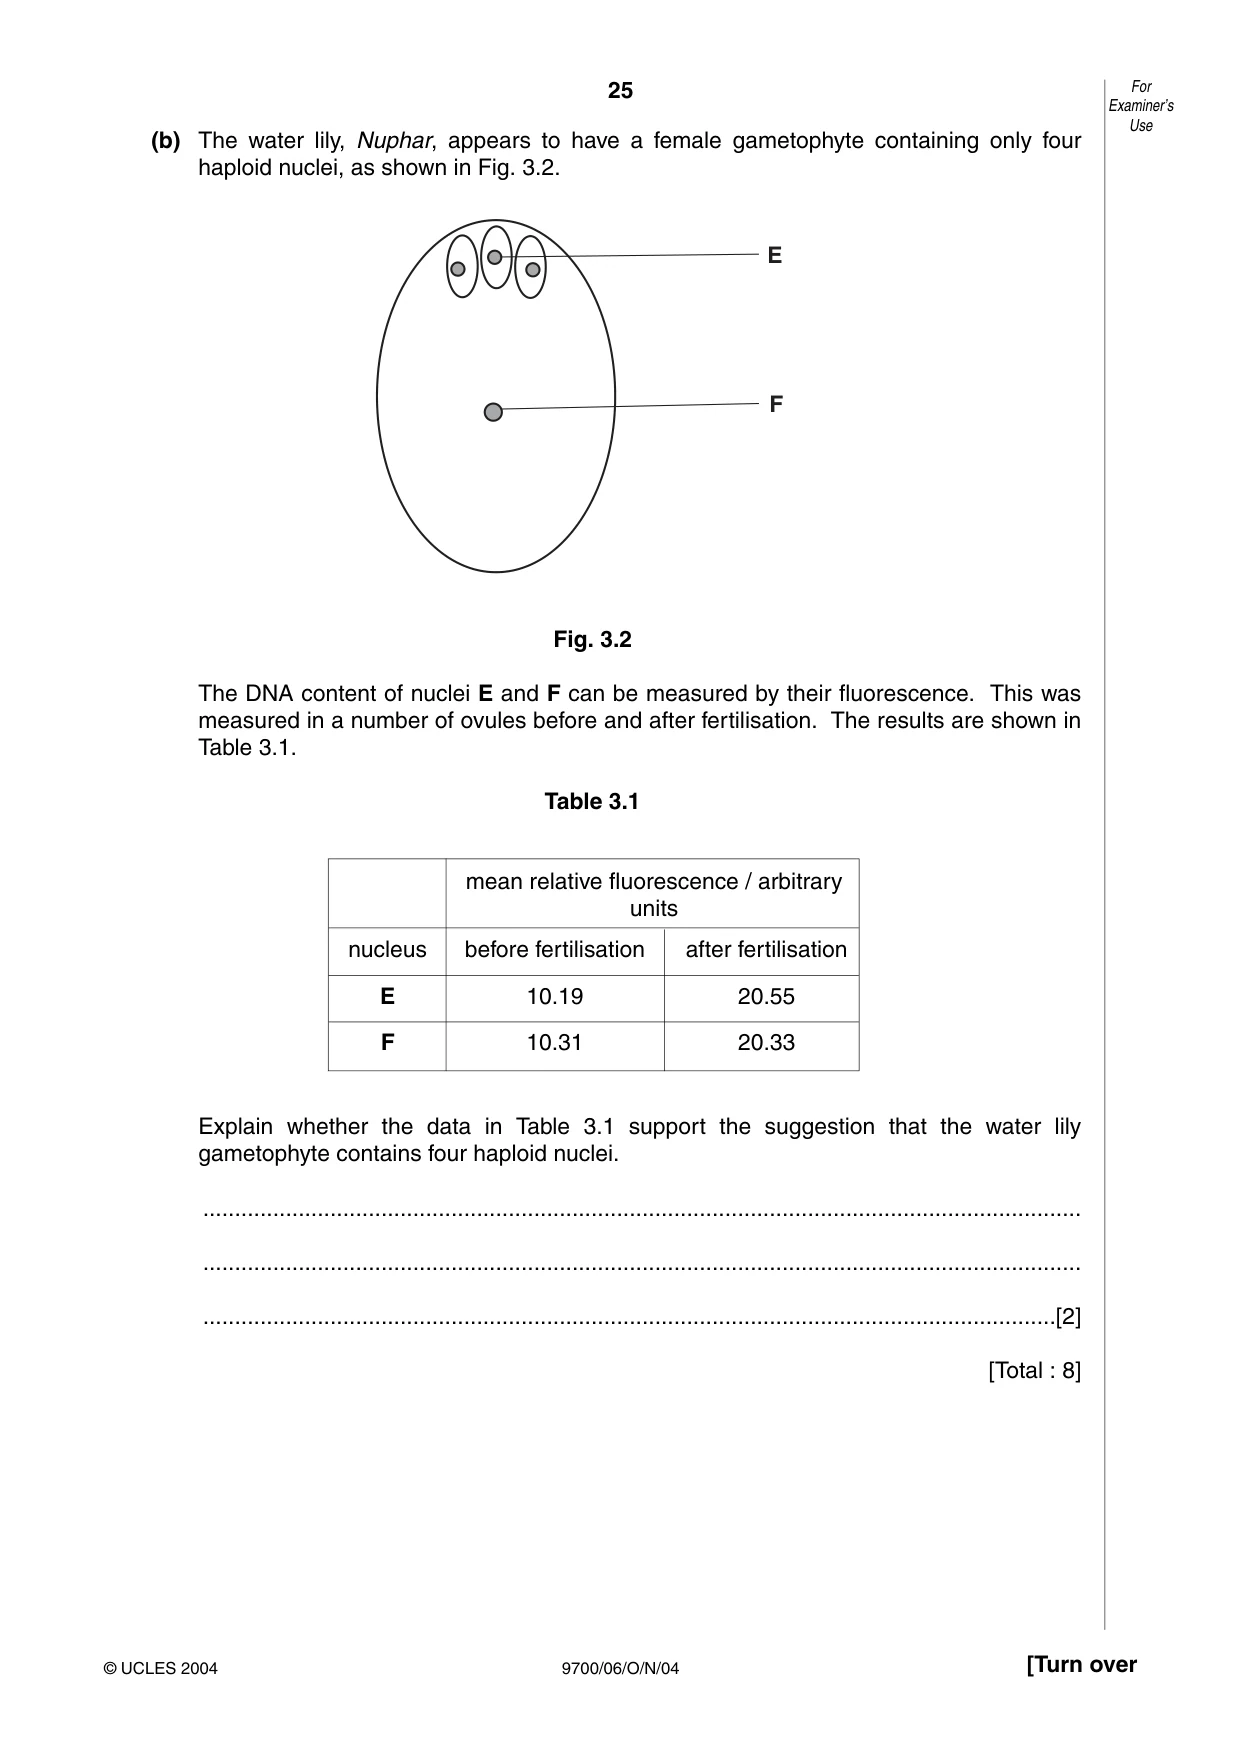
25 9700/06/O/N/04 [Turn over (b) The water lily, Nuphar, appears to have a female gametophyte containing only four haploid nuclei, as shown in Fig. 3.2. Fig. 3.2 The DNA content of nuclei E and F can be measured by their fluorescence. This was measured in a number of ovules before and after fertilisation. The results are shown in Table 3.1. Table 3.1 Explain whether the data in Table 3.1 support the suggestion that the water lily gametophyte contains four haploid nuclei. … … …[2] [Total : 8] E F For Examiner’s Use © UCLES 2004 mean relative fluorescence / arbitrary units nucleus before fertilisation after fertilisation E 10.19 20.55 F 10.31 20.33
Question paper, page 26
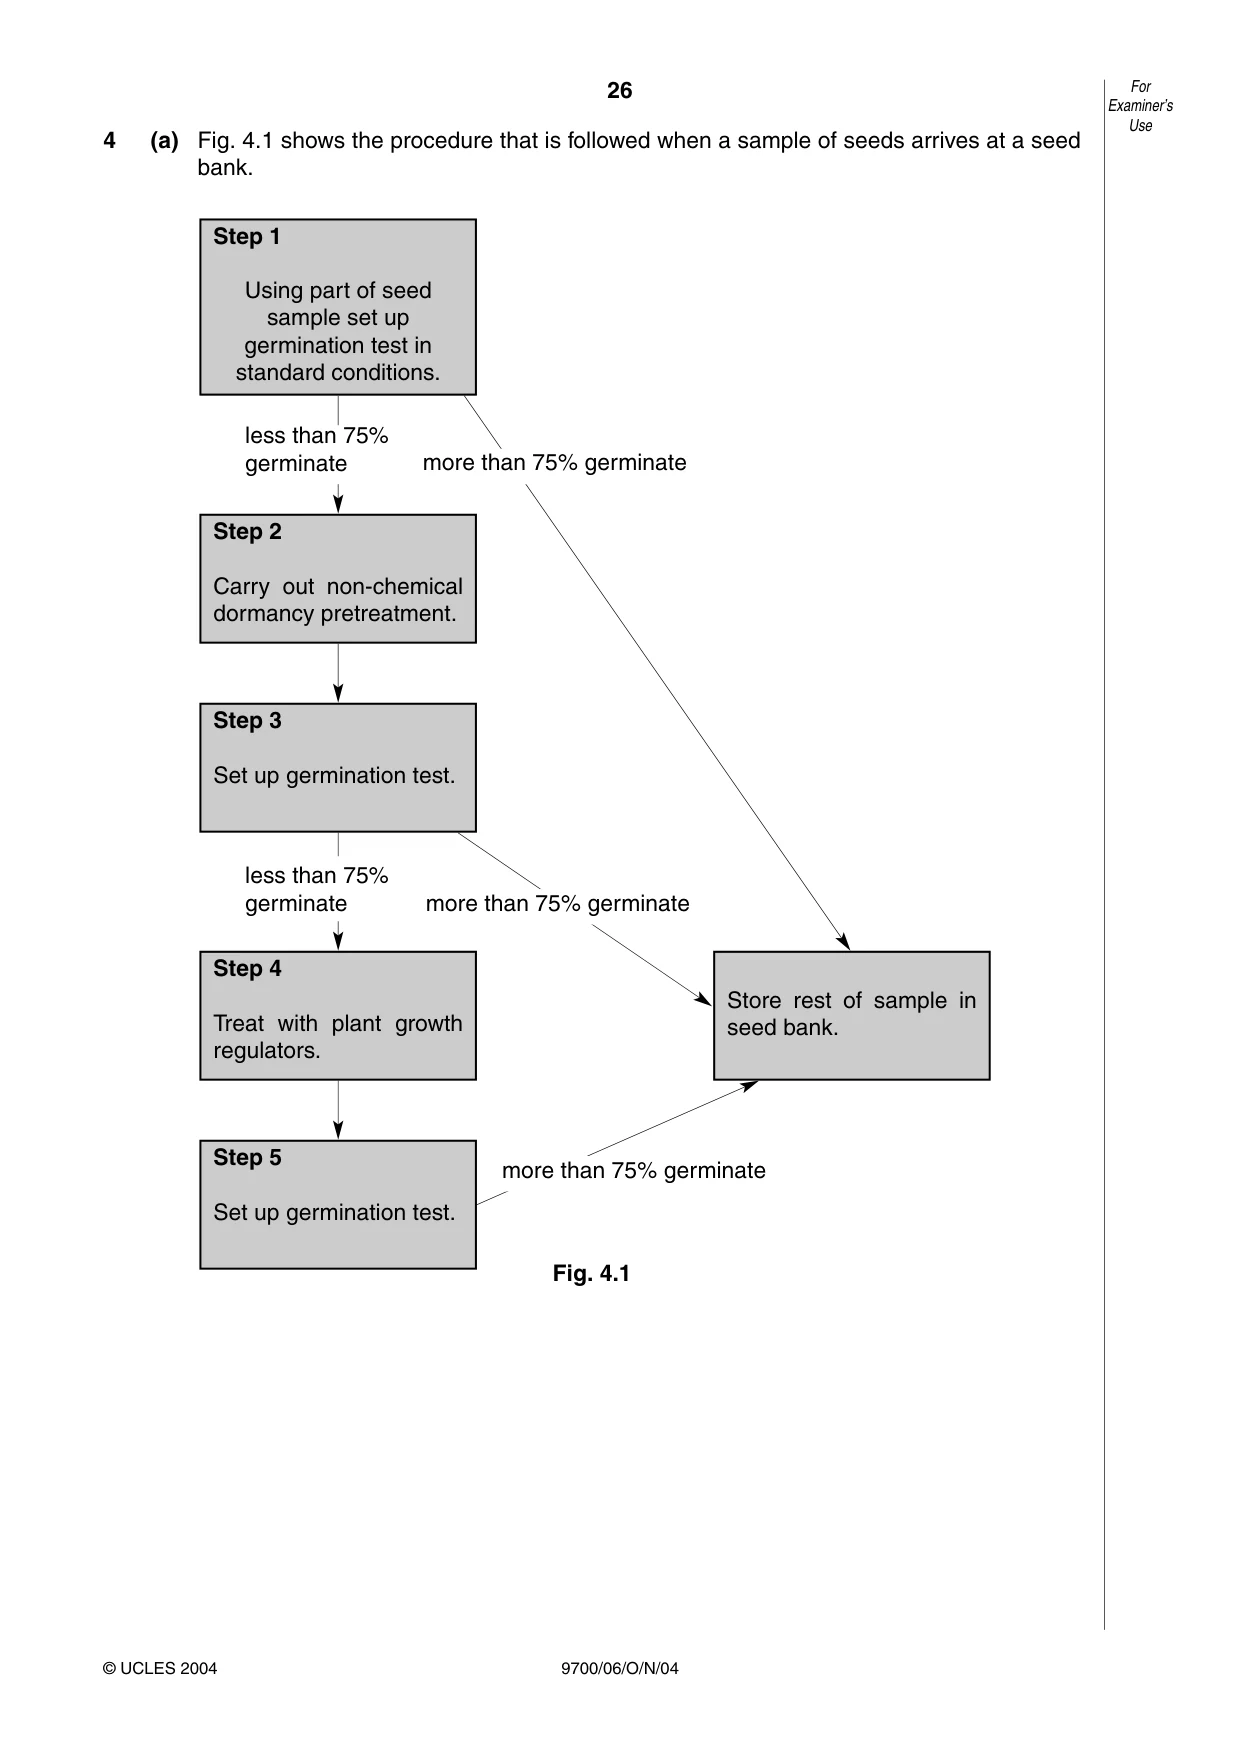
26 9700/06/O/N/04 4 (a) Fig. 4.1 shows the procedure that is followed when a sample of seeds arrives at a seed bank. less than 75% germinate less than 75% germinate Fig. 4.1 For Examiner’s Use © UCLES 2004 Step 1 Using part of seed sample set up germination test in standard conditions. Step 2 Carry out non-chemical dormancy pretreatment. Step 3 Set up germination test. Step 4 Treat with plant growth regulators. Store rest of sample in seed bank. Step 5 Set up germination test. more than 75% germinate more than 75% germinate more than 75% germinate
Question paper, page 27
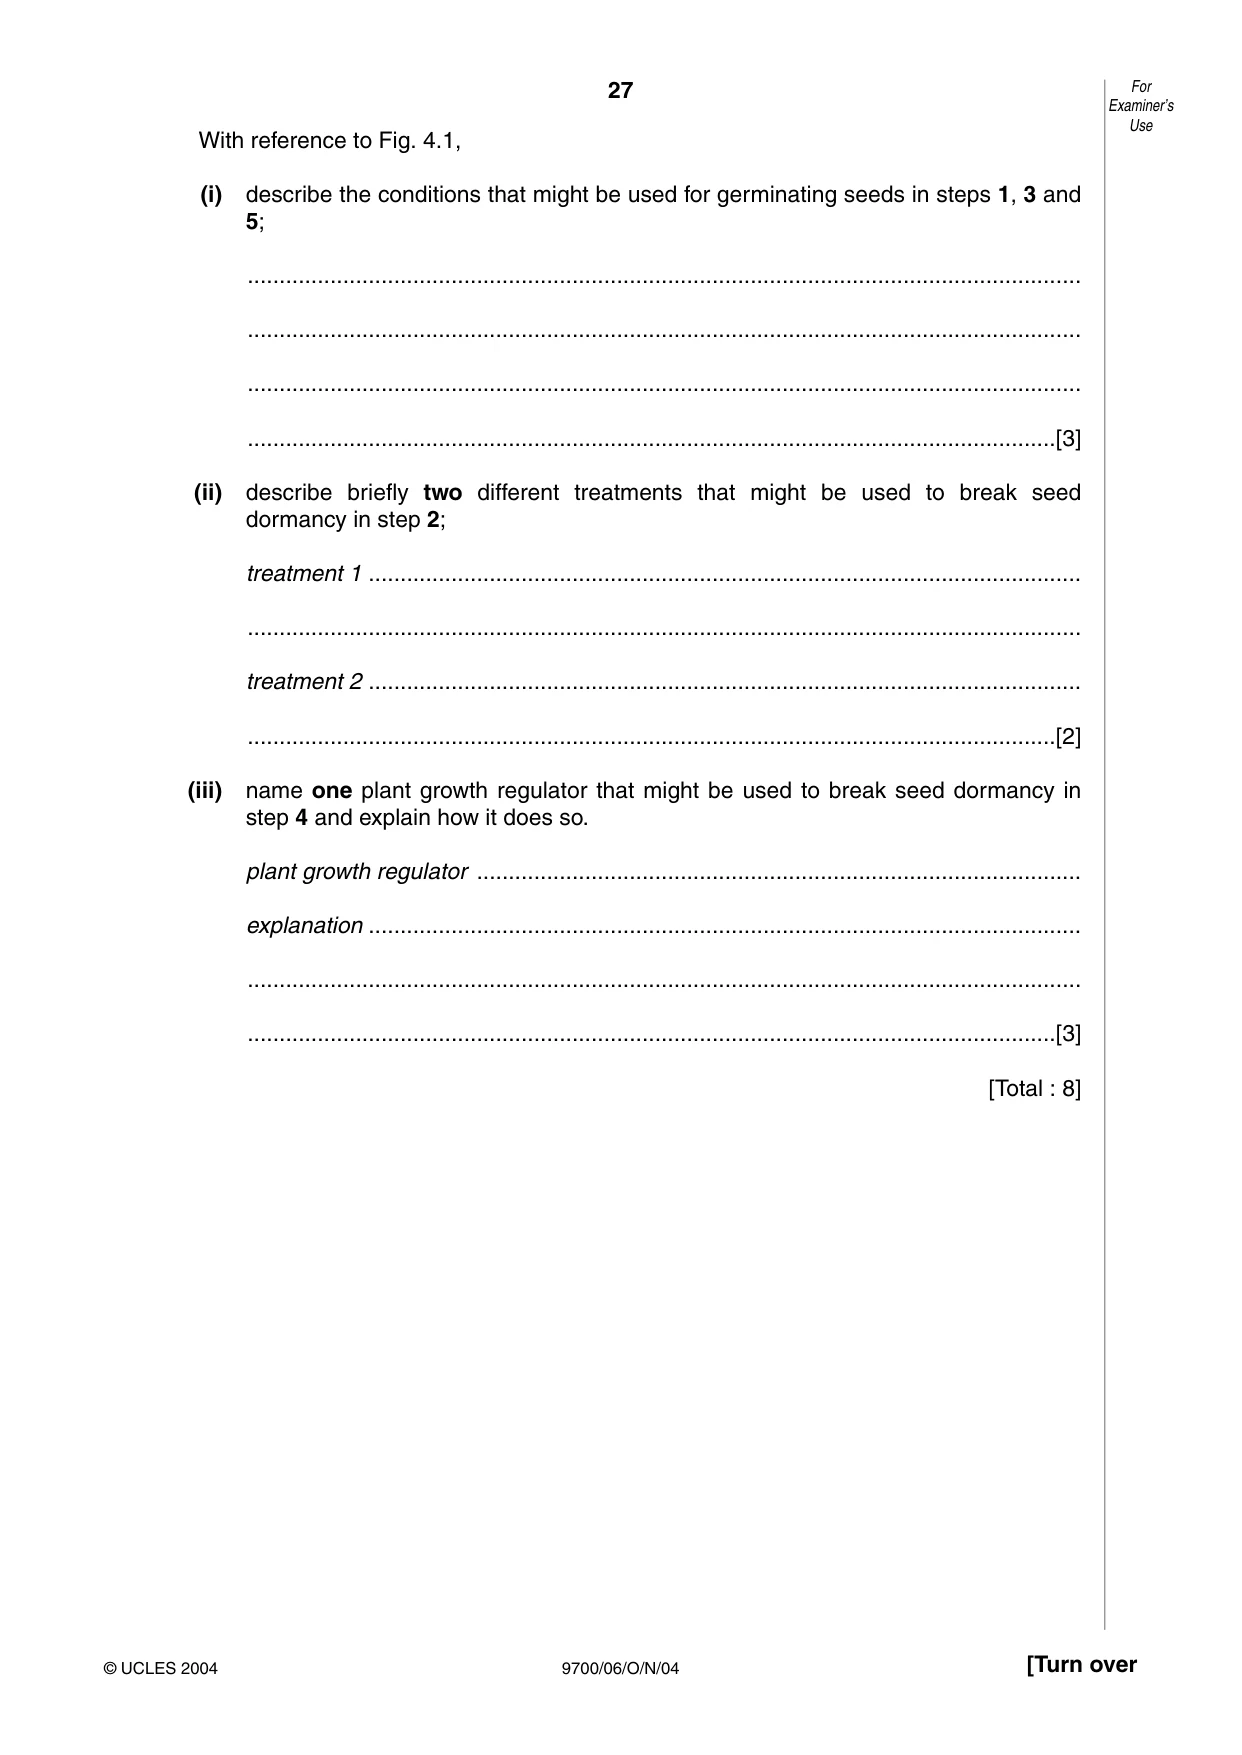
27 9700/06/O/N/04 [Turn over With reference to Fig. 4.1, (i) describe the conditions that might be used for germinating seeds in steps 1, 3 and 5; … … … …[3] (ii) describe briefly two different treatments that might be used to break seed dormancy in step 2; treatment 1 … … treatment 2 … …[2] (iii) name one plant growth regulator that might be used to break seed dormancy in step 4 and explain how it does so. plant growth regulator … explanation … … …[3] [Total : 8] For Examiner’s Use © UCLES 2004
Question paper, page 28
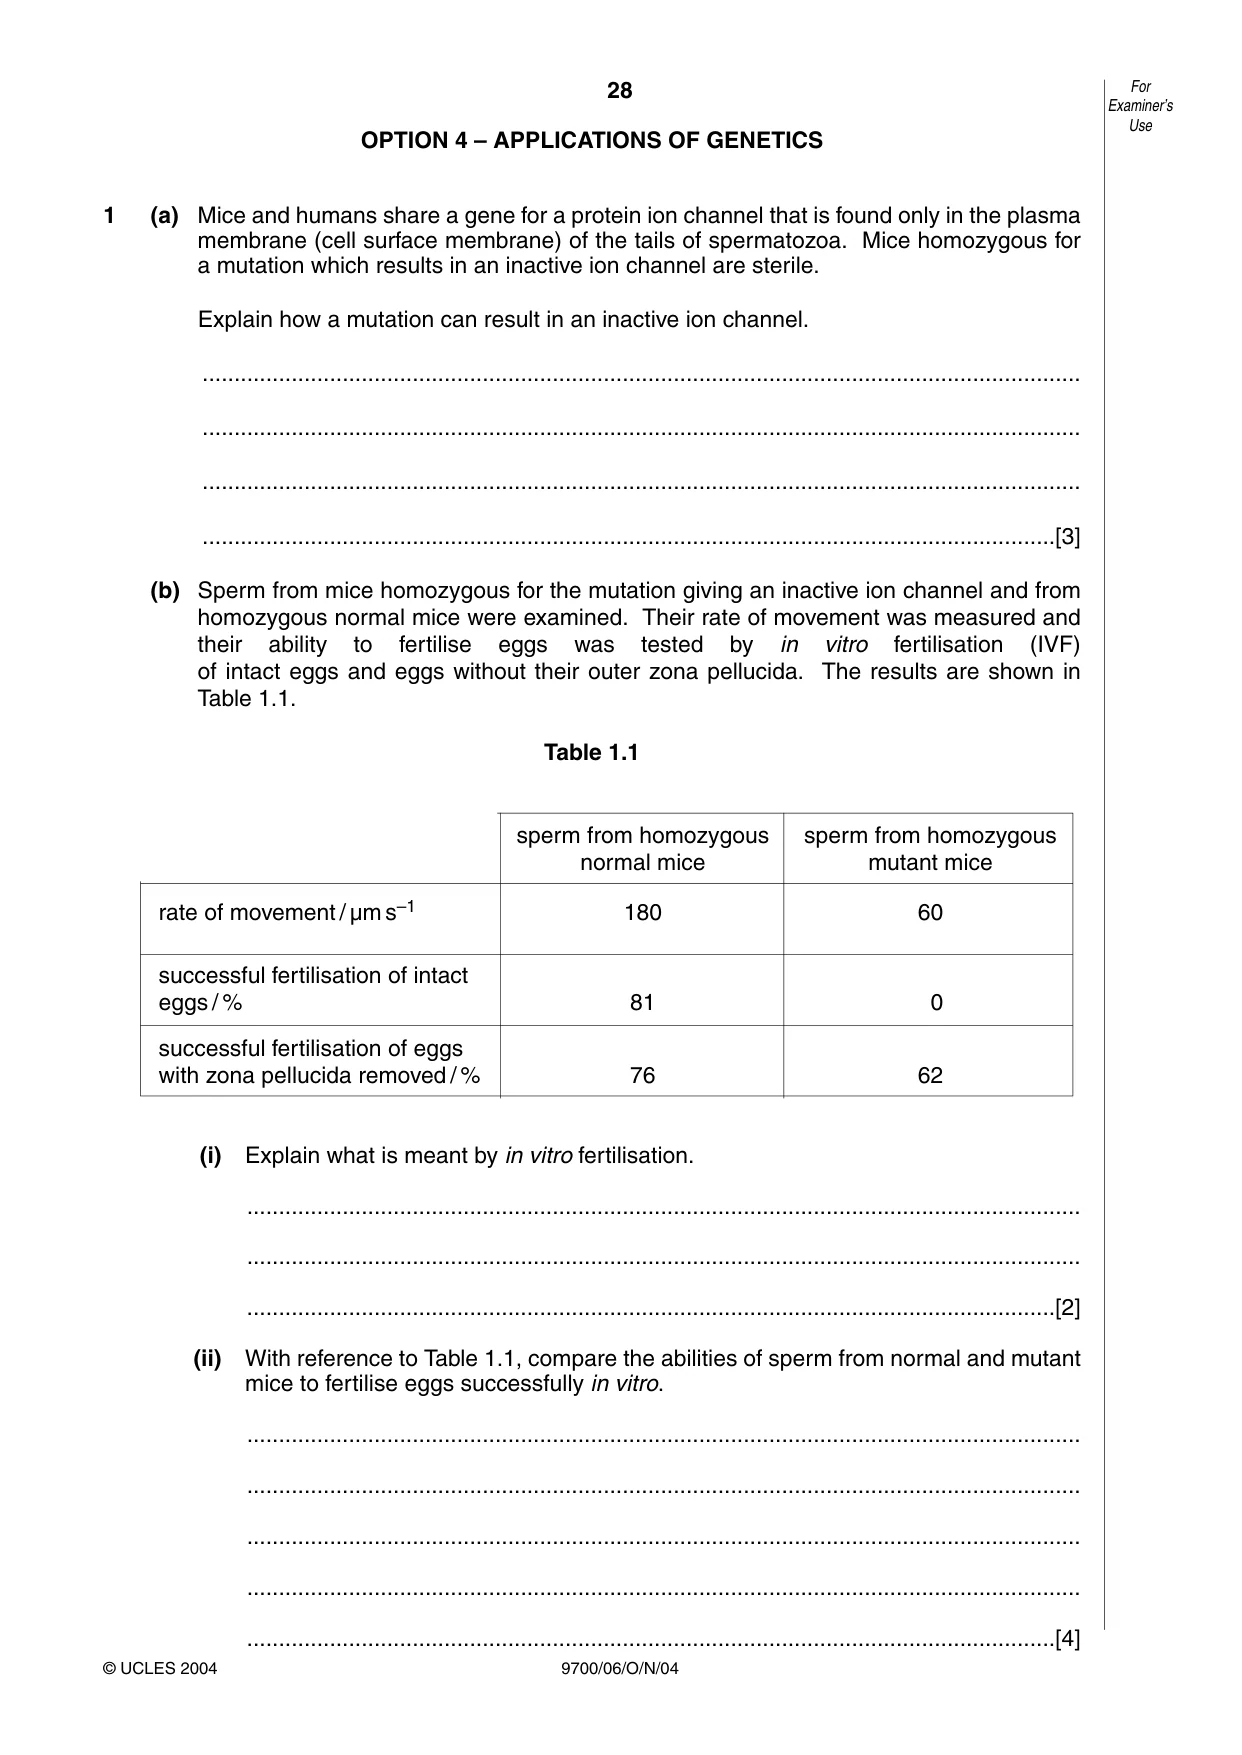
28 9700/06/O/N/04 OPTION 4 – APPLICATIONS OF GENETICS 1 (a) Mice and humans share a gene for a protein ion channel that is found only in the plasma membrane (cell surface membrane) of the tails of spermatozoa. Mice homozygous for a mutation which results in an inactive ion channel are sterile. Explain how a mutation can result in an inactive ion channel. … … … …[3] (b) Sperm from mice homozygous for the mutation giving an inactive ion channel and from homozygous normal mice were examined. Their rate of movement was measured and their ability to fertilise eggs was tested by in vitro fertilisation (IVF) of intact eggs and eggs without their outer zona pellucida. The results are shown in Table 1.1. Table 1.1 (i) Explain what is meant by in vitro fertilisation. … … …[2] (ii) With reference to Table 1.1, compare the abilities of sperm from normal and mutant mice to fertilise eggs successfully in vitro. … … … … …[4] For Examiner’s Use © UCLES 2004 sperm from homozygous sperm from homozygous normal mice mutant mice rate of movement / µm s–1 180 60 successful fertilisation of intact eggs / % 81 0 successful fertilisation of eggs with zona pellucida removed / % 76 62
Question paper, page 29
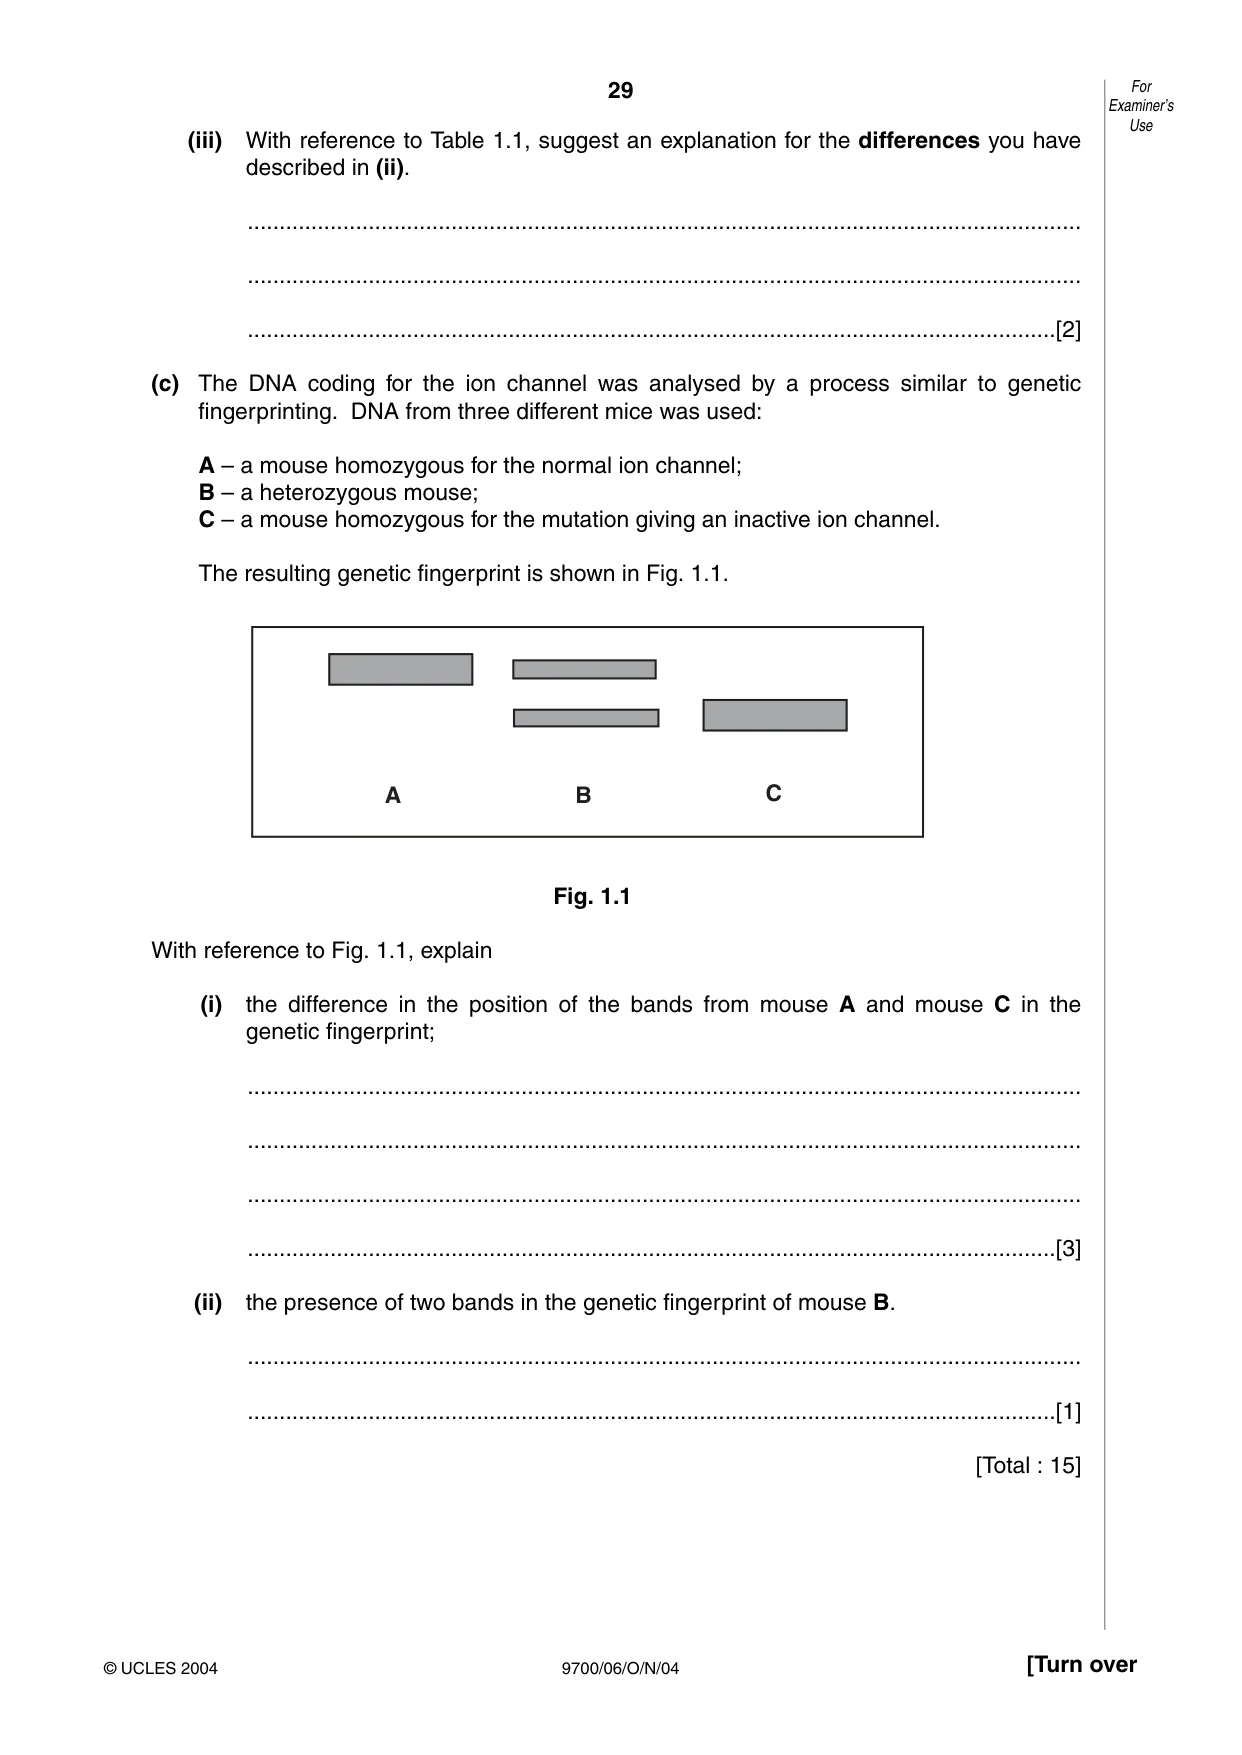
29 9700/06/O/N/04 [Turn over (iii) With reference to Table 1.1, suggest an explanation for the differences you have described in (ii). … … …[2] (c) The DNA coding for the ion channel was analysed by a process similar to genetic fingerprinting. DNA from three different mice was used: A – a mouse homozygous for the normal ion channel; B – a heterozygous mouse; C – a mouse homozygous for the mutation giving an inactive ion channel. The resulting genetic fingerprint is shown in Fig. 1.1. Fig. 1.1 With reference to Fig. 1.1, explain (i) the difference in the position of the bands from mouse A and mouse C in the genetic fingerprint; … … … …[3] (ii) the presence of two bands in the genetic fingerprint of mouse B. … …[1] [Total : 15] A B C For Examiner’s Use © UCLES 2004
Question paper, page 30
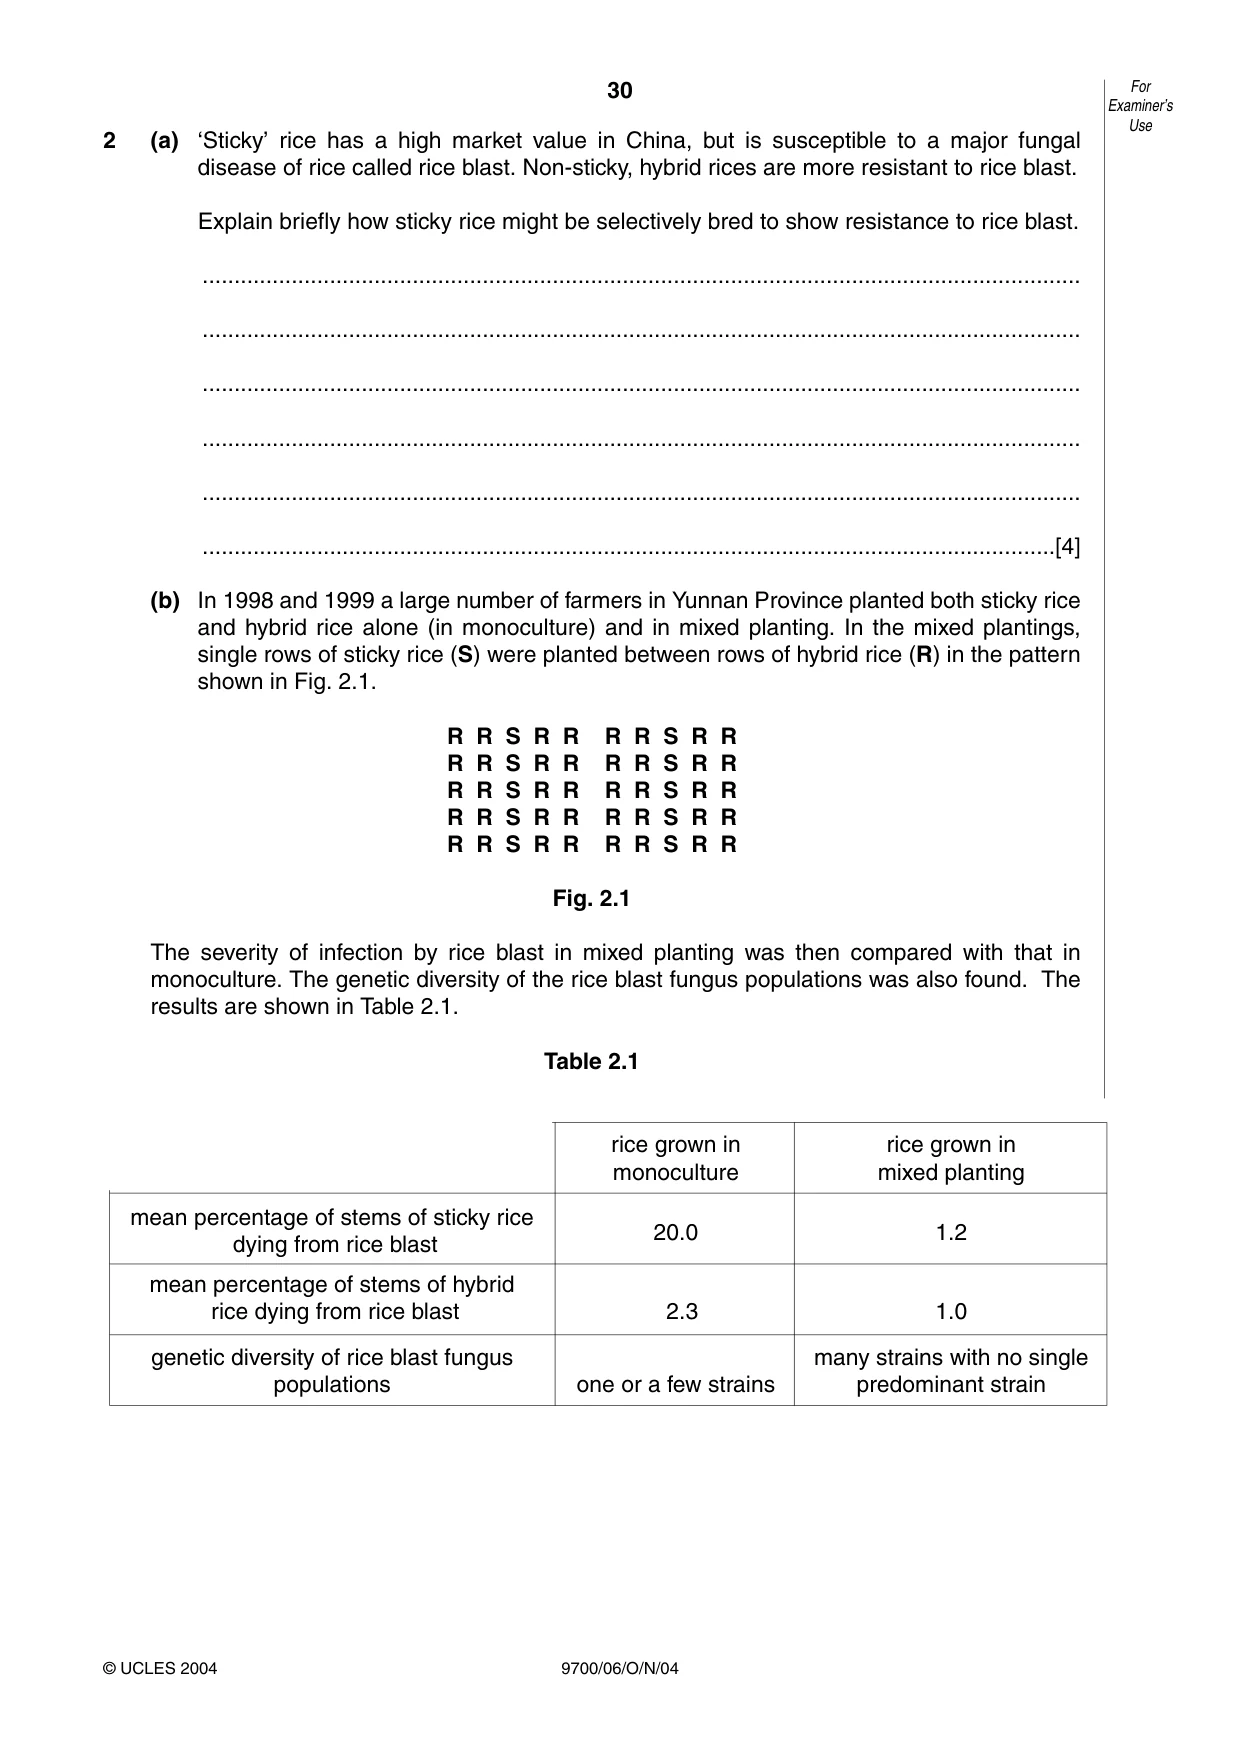
30 9700/06/O/N/04 2 (a) ‘Sticky’ rice has a high market value in China, but is susceptible to a major fungal disease of rice called rice blast. Non-sticky, hybrid rices are more resistant to rice blast. Explain briefly how sticky rice might be selectively bred to show resistance to rice blast. … … … … … …[4] (b) In 1998 and 1999 a large number of farmers in Yunnan Province planted both sticky rice and hybrid rice alone (in monoculture) and in mixed planting. In the mixed plantings, single rows of sticky rice (S) were planted between rows of hybrid rice (R) in the pattern shown in Fig. 2.1. R R S R R R R S R R R R S R R R R S R R R R S R R R R S R R R R S R R R R S R R R R S R R R R S R R Fig. 2.1 The severity of infection by rice blast in mixed planting was then compared with that in monoculture. The genetic diversity of the rice blast fungus populations was also found. The results are shown in Table 2.1. Table 2.1 For Examiner’s Use © UCLES 2004 rice grown in rice grown in monoculture mixed planting mean percentage of stems of sticky rice dying from rice blast 20.0 1.2 mean percentage of stems of hybrid rice dying from rice blast 2.3 1.0 genetic diversity of rice blast fungus many strains with no single populations one or a few strains predominant strain
Question paper, page 31
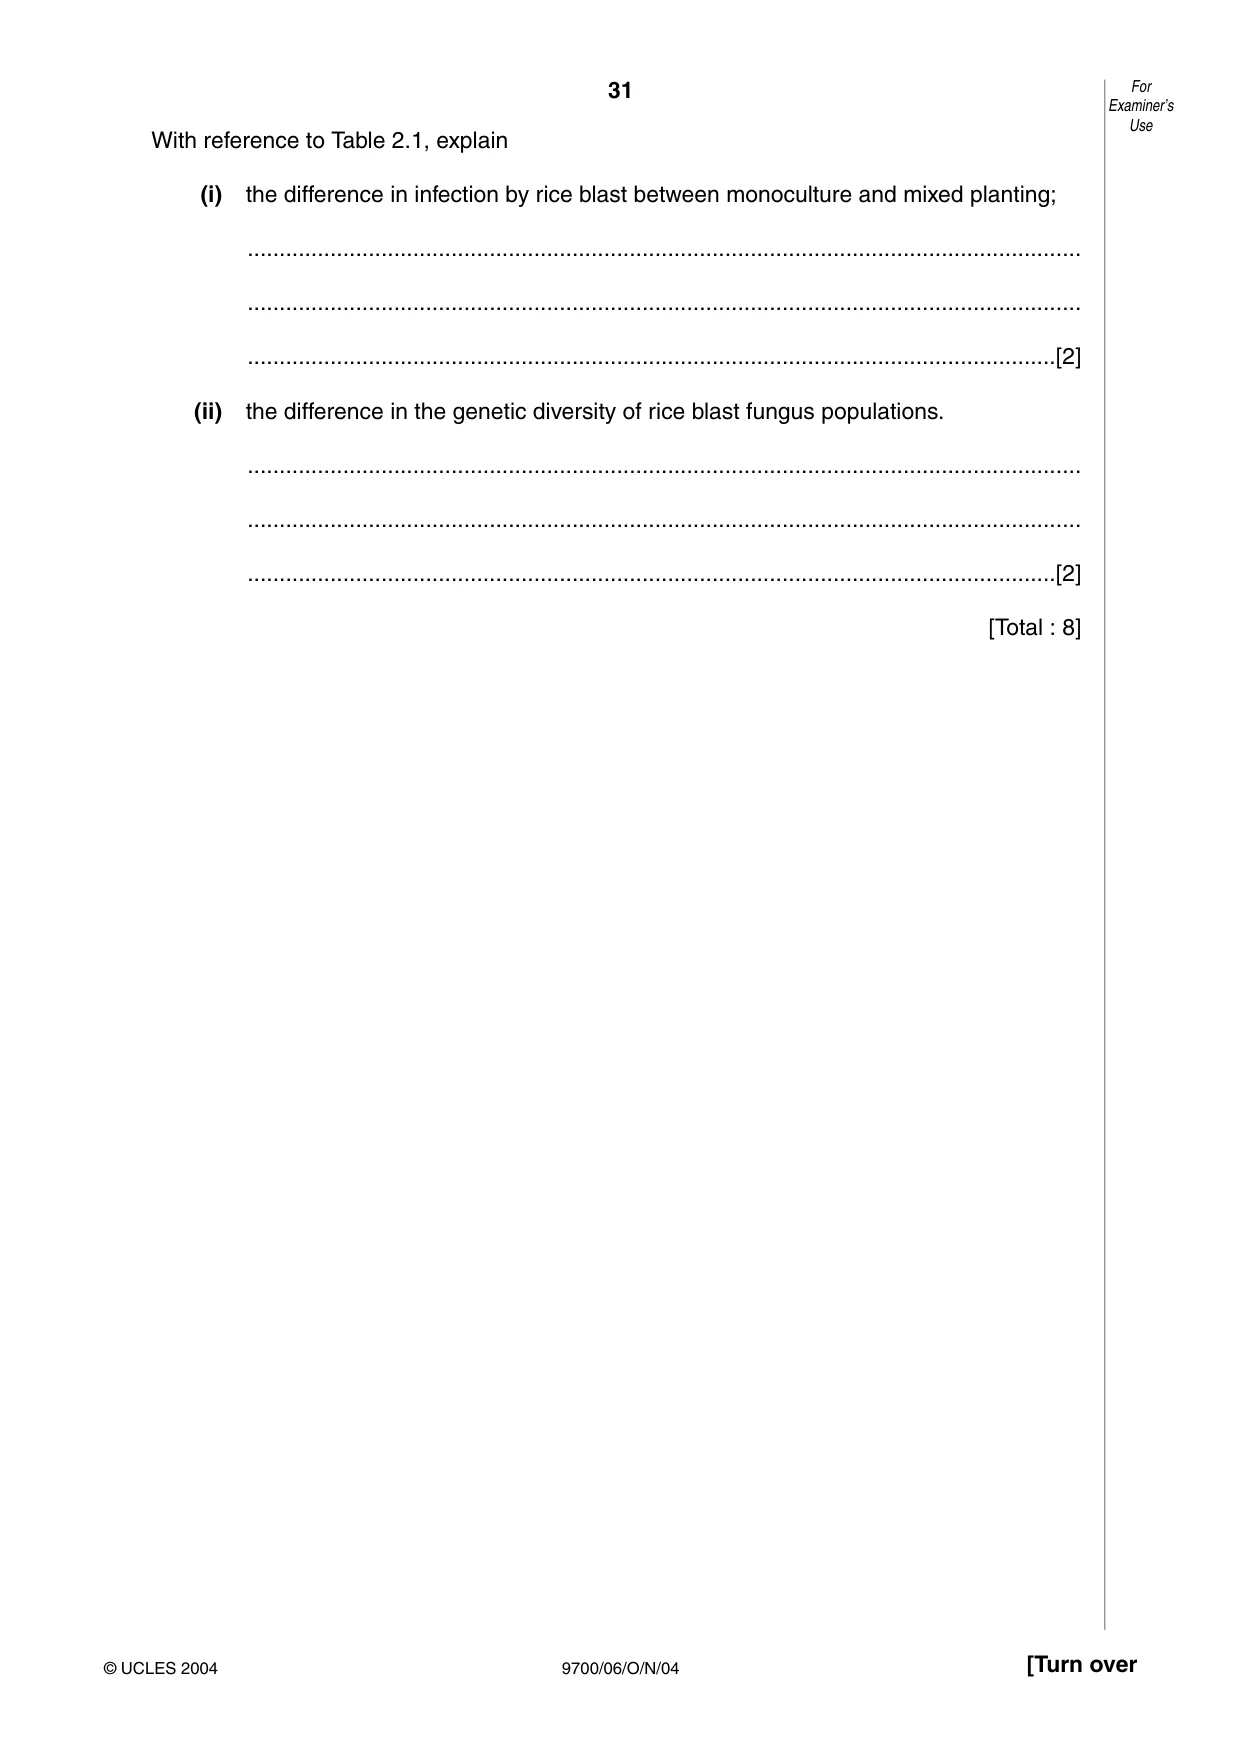
31 9700/06/O/N/04 [Turn over With reference to Table 2.1, explain (i) the difference in infection by rice blast between monoculture and mixed planting; … … …[2] (ii) the difference in the genetic diversity of rice blast fungus populations. … … …[2] [Total : 8] For Examiner’s Use © UCLES 2004
Question paper, page 32
32 9700/06/O/N/04 3 Drylands are among the most threatened environments in the world. Seeds from dryland plants are being collected and stored. At intervals, samples of seeds from storage are germinated, plants grown and a new generation of seeds collected for storage. Seeds from plants that only grow in one place in the world, from endangered species and from plants used by local people may be stored in the country of origin or in the Millennium Seed Bank in the UK. (a) Explain why dryland seeds are being collected and stored. … … … …[3] (b) Describe the conditions in which seeds are stored in a seed bank. … … …[2] (c) Explain why, at intervals, samples of seeds are germinated, plants grown and a new generation of seeds collected for storage. … … …[2] [Total : 7] For Examiner’s Use © UCLES 2004
Question paper, page 33
33 9700/06/O/N/04 [Turn over Question 4 begins on the next page. © UCLES 2004
Question paper, page 34
34 9700/06/O/N/04 4 (a) Explain the genetic basis of Down’s syndrome in humans. … … … …[3] (b) State what is meant by genetic screening. … …[1] (c) In a study into diagnosis of Down’s syndrome, the way in which 323 people with Down’s syndrome were initially diagnosed was recorded. All had been screened before 24 weeks of pregnancy by one of four different tests, A, B, C or D, in approximately equal numbers. The number of cases detected by each test, as well as the total number of cases missed by the tests, and so detected only at or after birth, is shown in Table 4.1. Table 4.1 With reference to Table 4.1. (i) calculate the percentage of cases of Down’s syndrome that were detected before 24 weeks of pregnancy. Show your working; ………………… [2] (ii) describe the differences in the success of the different screening tests in diagnosing Down’s syndrome before birth; … … … …[3] For Examiner’s Use © UCLES 2004 Screening test A B C D number of cases of Down’s syndrome detected before 24 weeks of pregnancy 32 36 42 61 number of cases of Down’s syndrome detected at or after birth 152 total number of cases of Down’s syndrome 323
Question paper, page 35
35 9700/06/O/N/04 (iii) suggest one way of making use of tests A, B, C and D that would increase the percentage of cases of Down’s syndrome detected before birth. … …[1] [Total : 10] © UCLES 2004 For Examiner’s Use
Question paper, page 36
36 9700/06/O/N/04 BLANK PAGE Every reasonable effort has been made to trace all copyright holders where the publishers (i.e UCLES) are aware that third-party material has been reproduced. The publishers would be pleased to hear from anyone whose rights we have unwittingly infringed. University of Cambridge International Examinations is part of the University of Cambridge Local Examinations Syndicate (UCLES), which is itself a department of the University of Cambridge.
Mark scheme, page 1
UNIVERSITY OF CAMBRIDGE INTERNATIONAL EXAMINATIONS GCE Advanced Level MARK SCHEME for the November 2004 question paper 9700 BIOLOGY 9700/06 Paper 6 (Options), maximum raw mark 40 This mark scheme is published as an aid to teachers and students, to indicate the requirements of the examination. This shows the basis on which Examiners were initially instructed to award marks. It does not indicate the details of the discussions that took place at an Examiners’ meeting before marking began. Any substantial changes to the mark scheme that arose from these discussions will be recorded in the published Report on the Examination. All Examiners are instructed that alternative correct answers and unexpected approaches in candidates’ scripts must be given marks that fairly reflect the relevant knowledge and skills demonstrated. Mark schemes must be read in conjunction with the question papers and the Report on the Examination. • CIE will not enter into discussion or correspondence in connection with these mark schemes. CIE is publishing the mark schemes for the November 2004 question papers for most IGCSE and GCE Advanced Level syllabuses.
Mark scheme, page 2
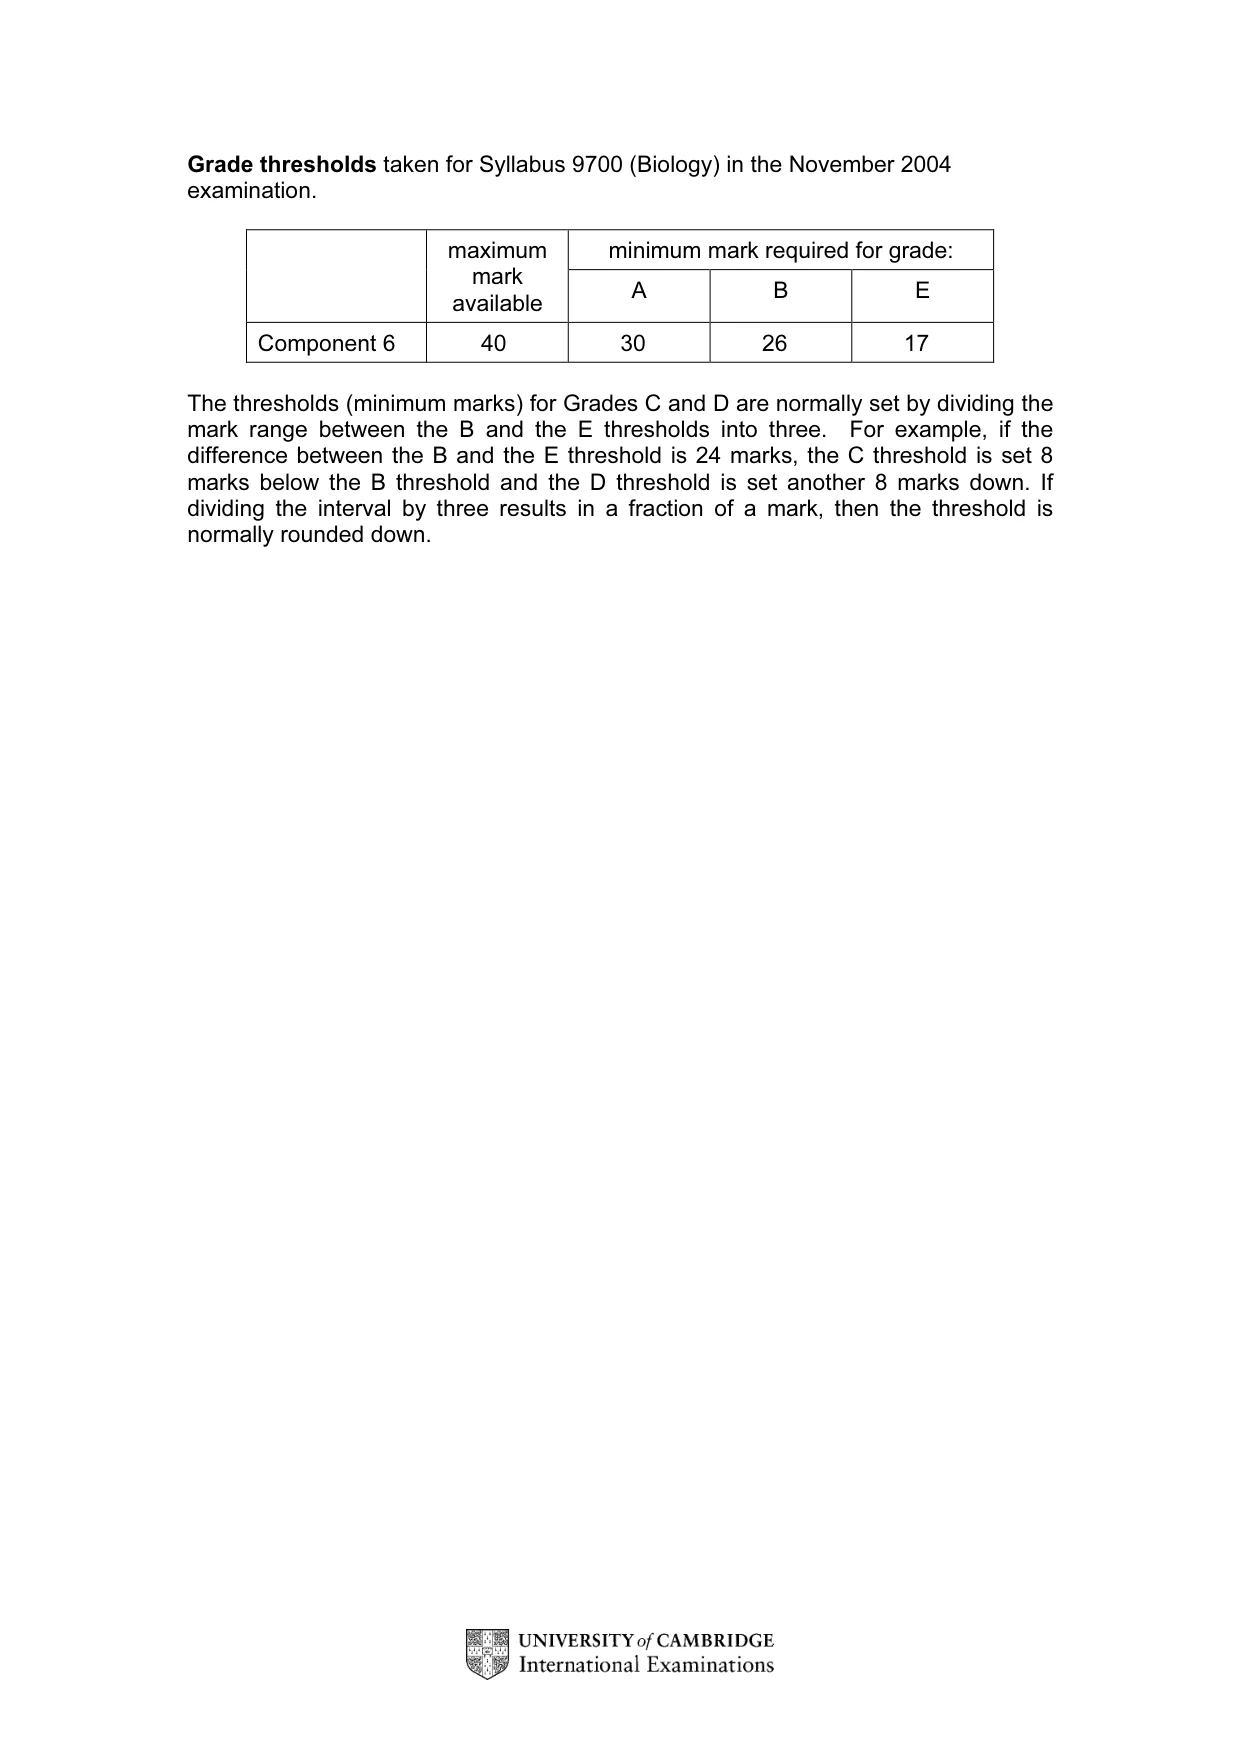
Grade thresholds taken for Syllabus 9700 (Biology) in the November 2004 examination. minimum mark required for grade: maximum mark available A B E Component 6 40 30 26 17 The thresholds (minimum marks) for Grades C and D are normally set by dividing the mark range between the B and the E thresholds into three. For example, if the difference between the B and the E threshold is 24 marks, the C threshold is set 8 marks below the B threshold and the D threshold is set another 8 marks down. If dividing the interval by three results in a fraction of a mark, then the threshold is normally rounded down.
Mark scheme, page 3
November 2004 GCE A LEVEL MARK SCHEME MAXIMUM MARK: 40 SYLLABUS/COMPONENT: 9700/06 BIOLOGY Paper 6 (Options)
Mark scheme, page 4
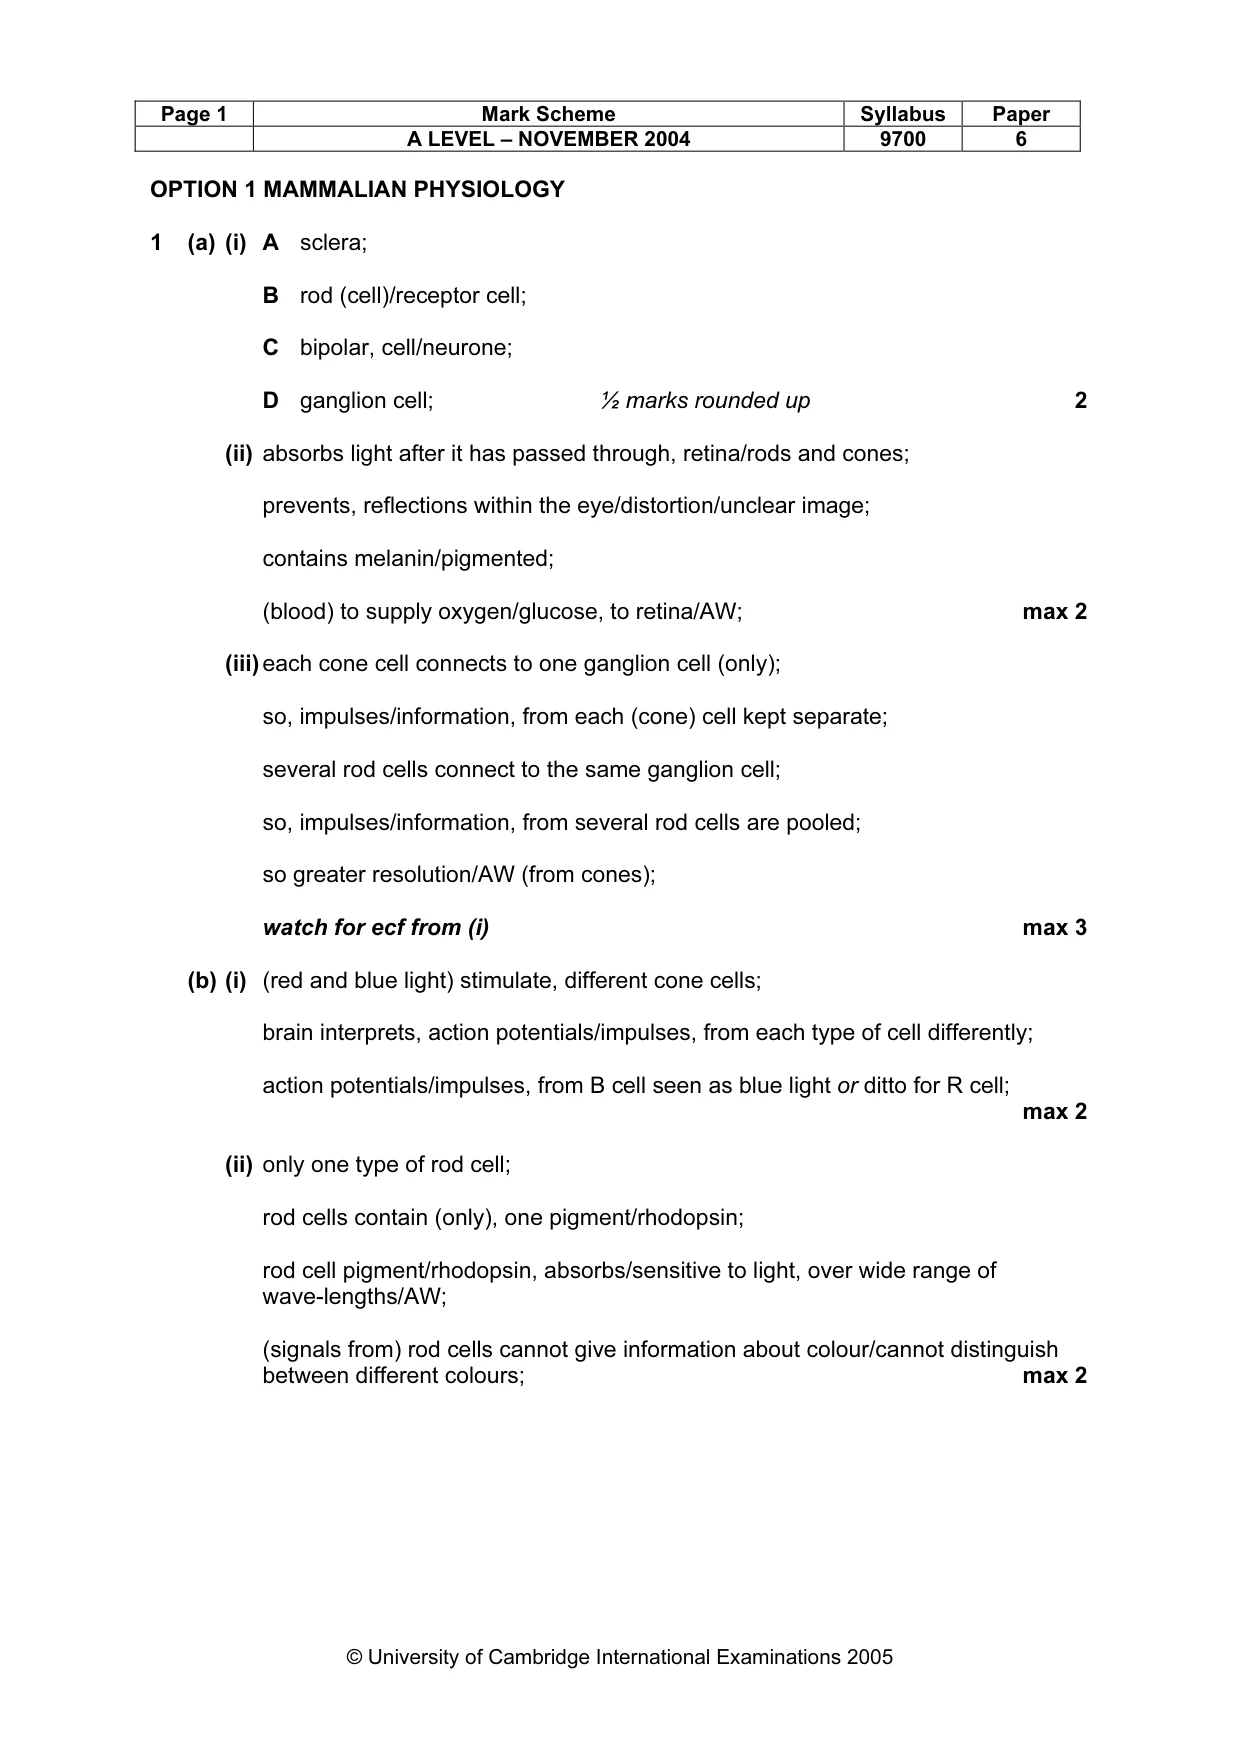
Page 1 Mark Scheme Syllabus Paper A LEVEL – NOVEMBER 2004 9700 6 © University of Cambridge International Examinations 2005 OPTION 1 MAMMALIAN PHYSIOLOGY 1 (a) (i) A sclera; B rod (cell)/receptor cell; C bipolar, cell/neurone; D ganglion cell; ½ marks rounded up 2 (ii) absorbs light after it has passed through, retina/rods and cones; prevents, reflections within the eye/distortion/unclear image; contains melanin/pigmented; (blood) to supply oxygen/glucose, to retina/AW; max 2 (iii) each cone cell connects to one ganglion cell (only); so, impulses/information, from each (cone) cell kept separate; several rod cells connect to the same ganglion cell; so, impulses/information, from several rod cells are pooled; so greater resolution/AW (from cones); watch for ecf from (i) max 3 (b) (i) (red and blue light) stimulate, different cone cells; brain interprets, action potentials/impulses, from each type of cell differently; action potentials/impulses, from B cell seen as blue light or ditto for R cell; max 2 (ii) only one type of rod cell; rod cells contain (only), one pigment/rhodopsin; rod cell pigment/rhodopsin, absorbs/sensitive to light, over wide range of wave-lengths/AW; (signals from) rod cells cannot give information about colour/cannot distinguish between different colours; max 2
Mark scheme, page 5
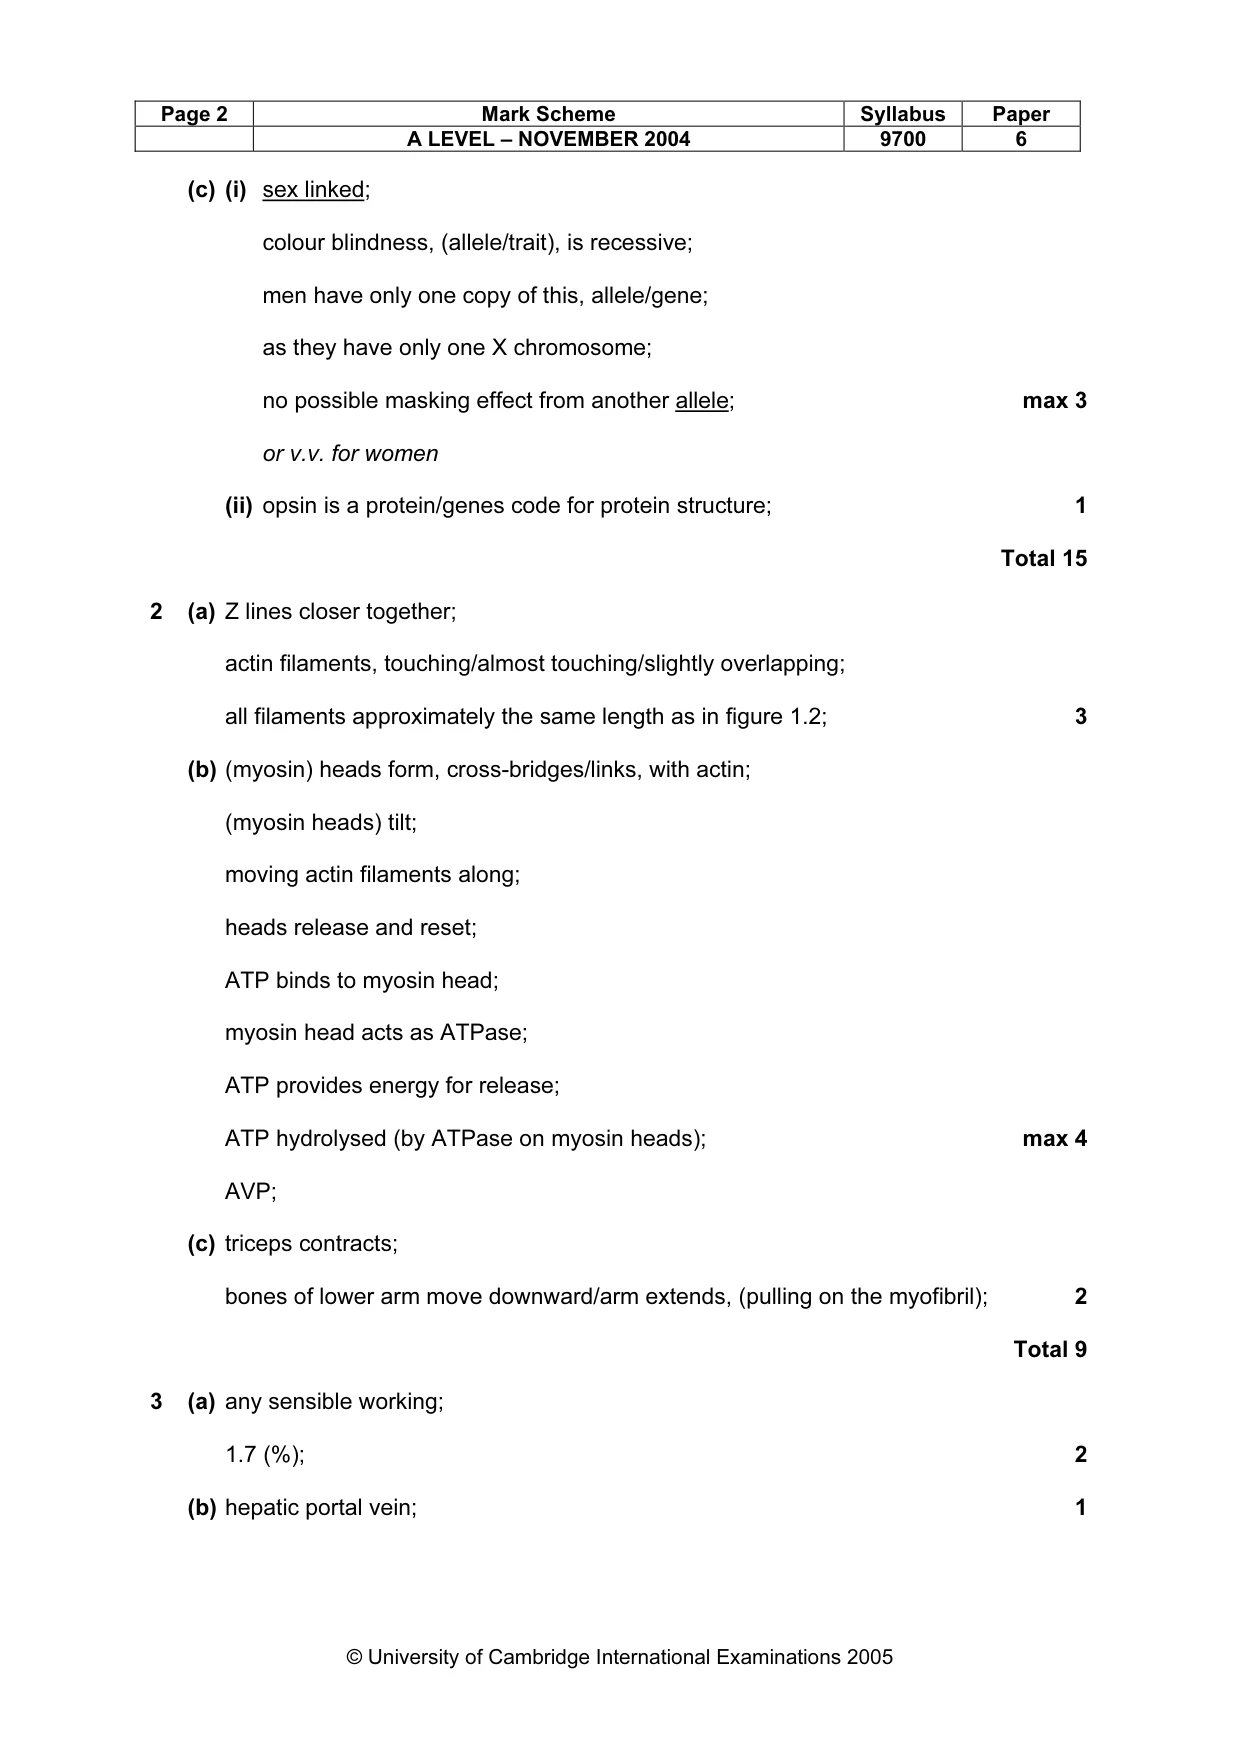
Page 2 Mark Scheme Syllabus Paper A LEVEL – NOVEMBER 2004 9700 6 © University of Cambridge International Examinations 2005 (c) (i) sex linked; colour blindness, (allele/trait), is recessive; men have only one copy of this, allele/gene; as they have only one X chromosome; no possible masking effect from another allele; max 3 or v.v. for women (ii) opsin is a protein/genes code for protein structure; 1 Total 15 2 (a) Z lines closer together; actin filaments, touching/almost touching/slightly overlapping; all filaments approximately the same length as in figure 1.2; 3 (b) (myosin) heads form, cross-bridges/links, with actin; (myosin heads) tilt; moving actin filaments along; heads release and reset; ATP binds to myosin head; myosin head acts as ATPase; ATP provides energy for release; ATP hydrolysed (by ATPase on myosin heads); max 4 AVP; (c) triceps contracts; bones of lower arm move downward/arm extends, (pulling on the myofibril); 2 Total 9 3 (a) any sensible working; 1.7 (%); 2 (b) hepatic portal vein; 1
Mark scheme, page 6
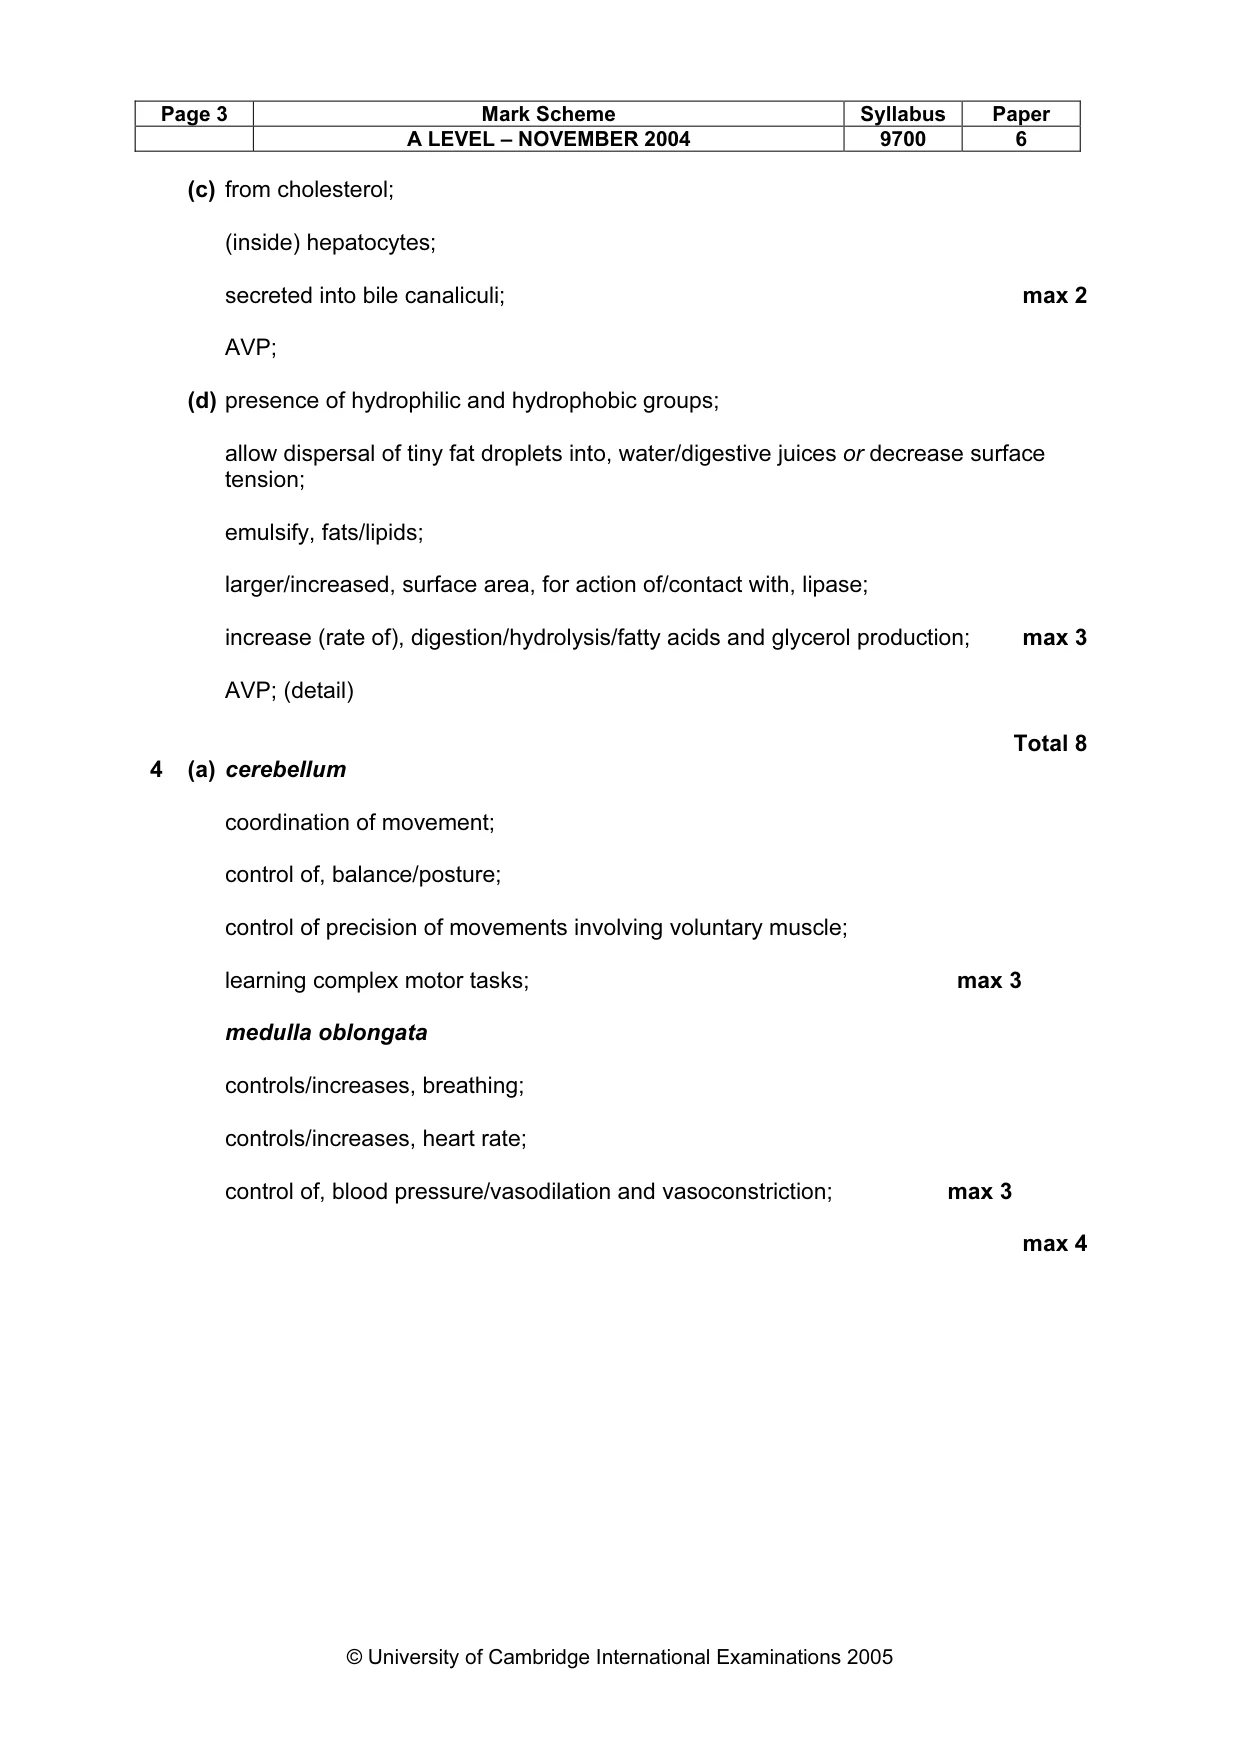
Page 3 Mark Scheme Syllabus Paper A LEVEL – NOVEMBER 2004 9700 6 © University of Cambridge International Examinations 2005 (c) from cholesterol; (inside) hepatocytes; secreted into bile canaliculi; max 2 AVP; (d) presence of hydrophilic and hydrophobic groups; allow dispersal of tiny fat droplets into, water/digestive juices or decrease surface tension; emulsify, fats/lipids; larger/increased, surface area, for action of/contact with, lipase; increase (rate of), digestion/hydrolysis/fatty acids and glycerol production; max 3 AVP; (detail) Total 8 4 (a) cerebellum coordination of movement; control of, balance/posture; control of precision of movements involving voluntary muscle; learning complex motor tasks; max 3 medulla oblongata controls/increases, breathing; controls/increases, heart rate; control of, blood pressure/vasodilation and vasoconstriction; max 3 max 4
Mark scheme, page 7
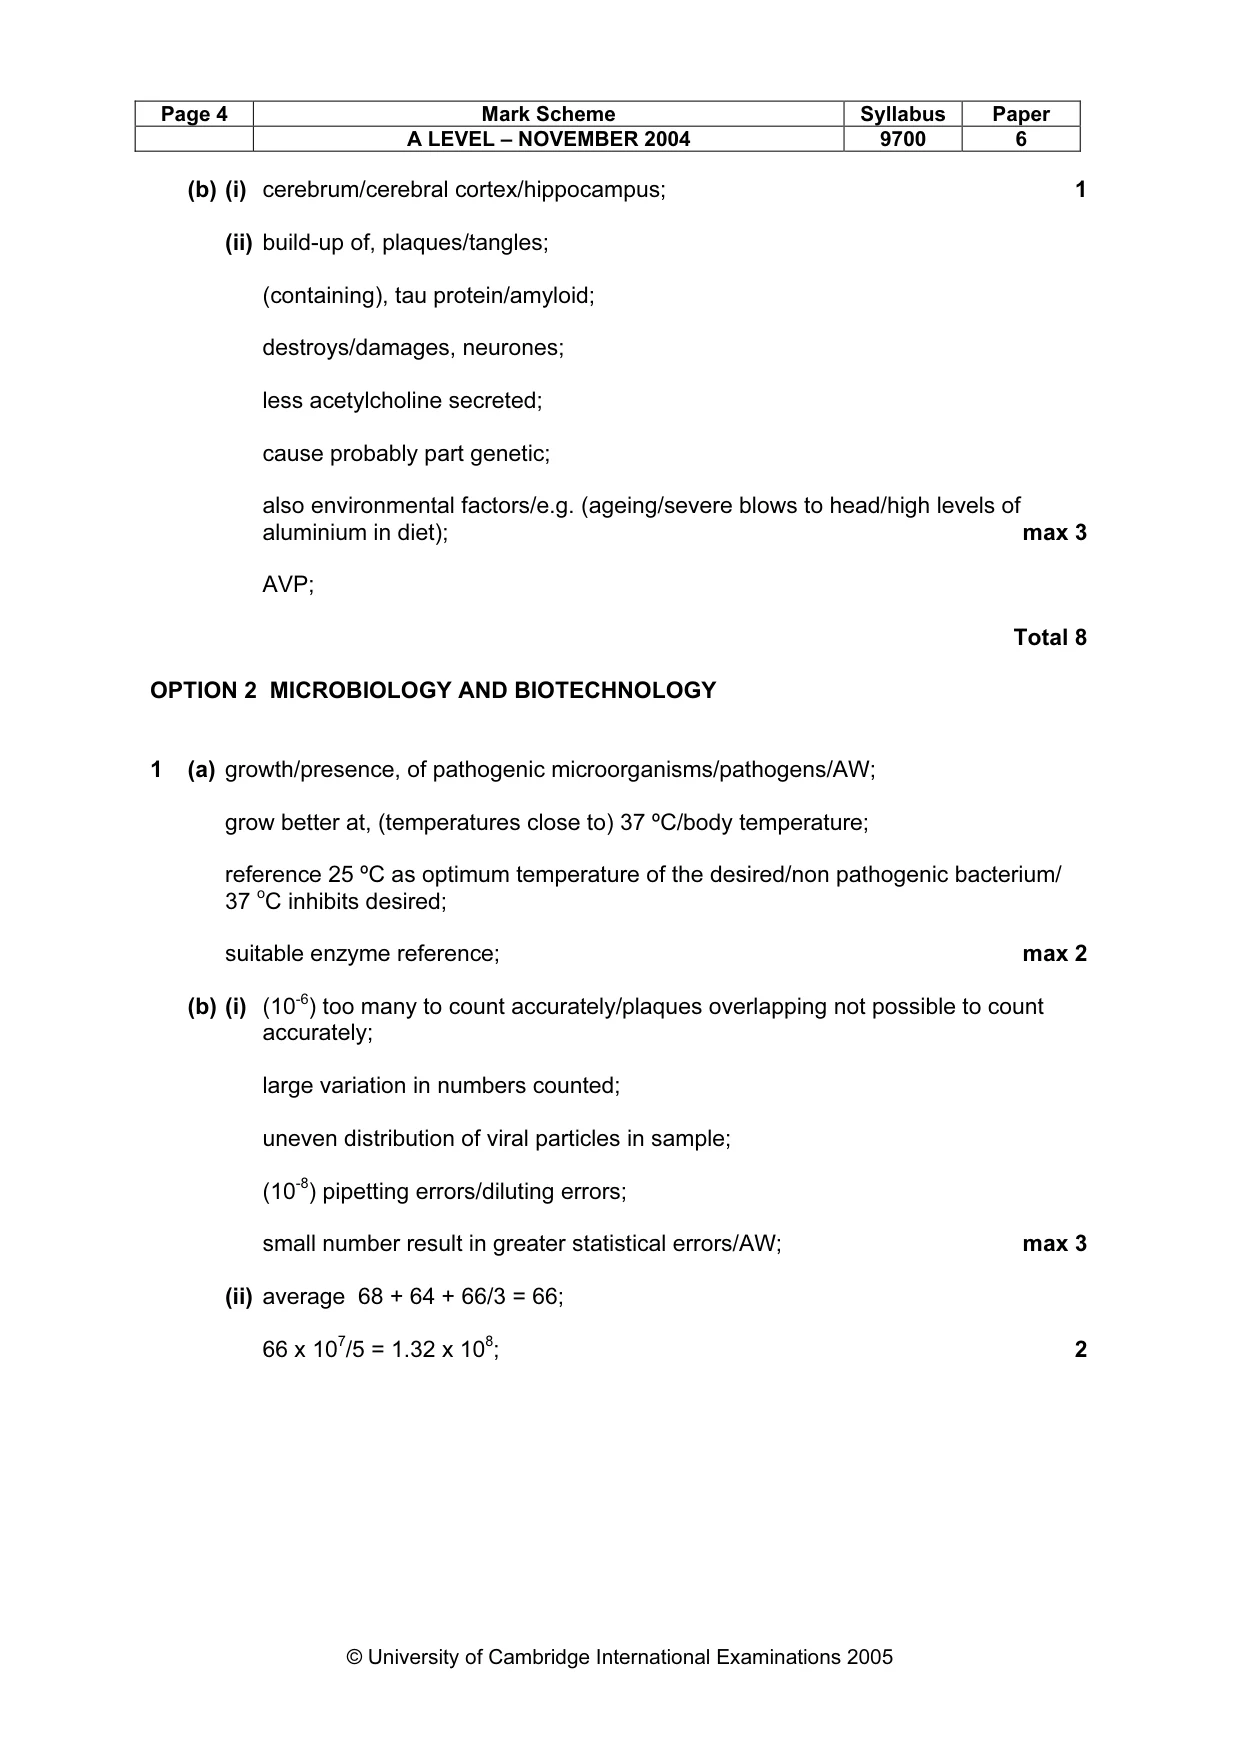
Page 4 Mark Scheme Syllabus Paper A LEVEL – NOVEMBER 2004 9700 6 © University of Cambridge International Examinations 2005 (b) (i) cerebrum/cerebral cortex/hippocampus; 1 (ii) build-up of, plaques/tangles; (containing), tau protein/amyloid; destroys/damages, neurones; less acetylcholine secreted; cause probably part genetic; also environmental factors/e.g. (ageing/severe blows to head/high levels of aluminium in diet); max 3 AVP; Total 8 OPTION 2 MICROBIOLOGY AND BIOTECHNOLOGY 1 (a) growth/presence, of pathogenic microorganisms/pathogens/AW; grow better at, (temperatures close to) 37 ºC/body temperature; reference 25 ºC as optimum temperature of the desired/non pathogenic bacterium/ 37 oC inhibits desired; suitable enzyme reference; max 2 (b) (i) (10-6) too many to count accurately/plaques overlapping not possible to count accurately; large variation in numbers counted; uneven distribution of viral particles in sample; (10-8) pipetting errors/diluting errors; small number result in greater statistical errors/AW; max 3 (ii) average 68 + 64 + 66/3 = 66; 66 x 107/5 = 1.32 x 10⁸; 2
Mark scheme, page 8
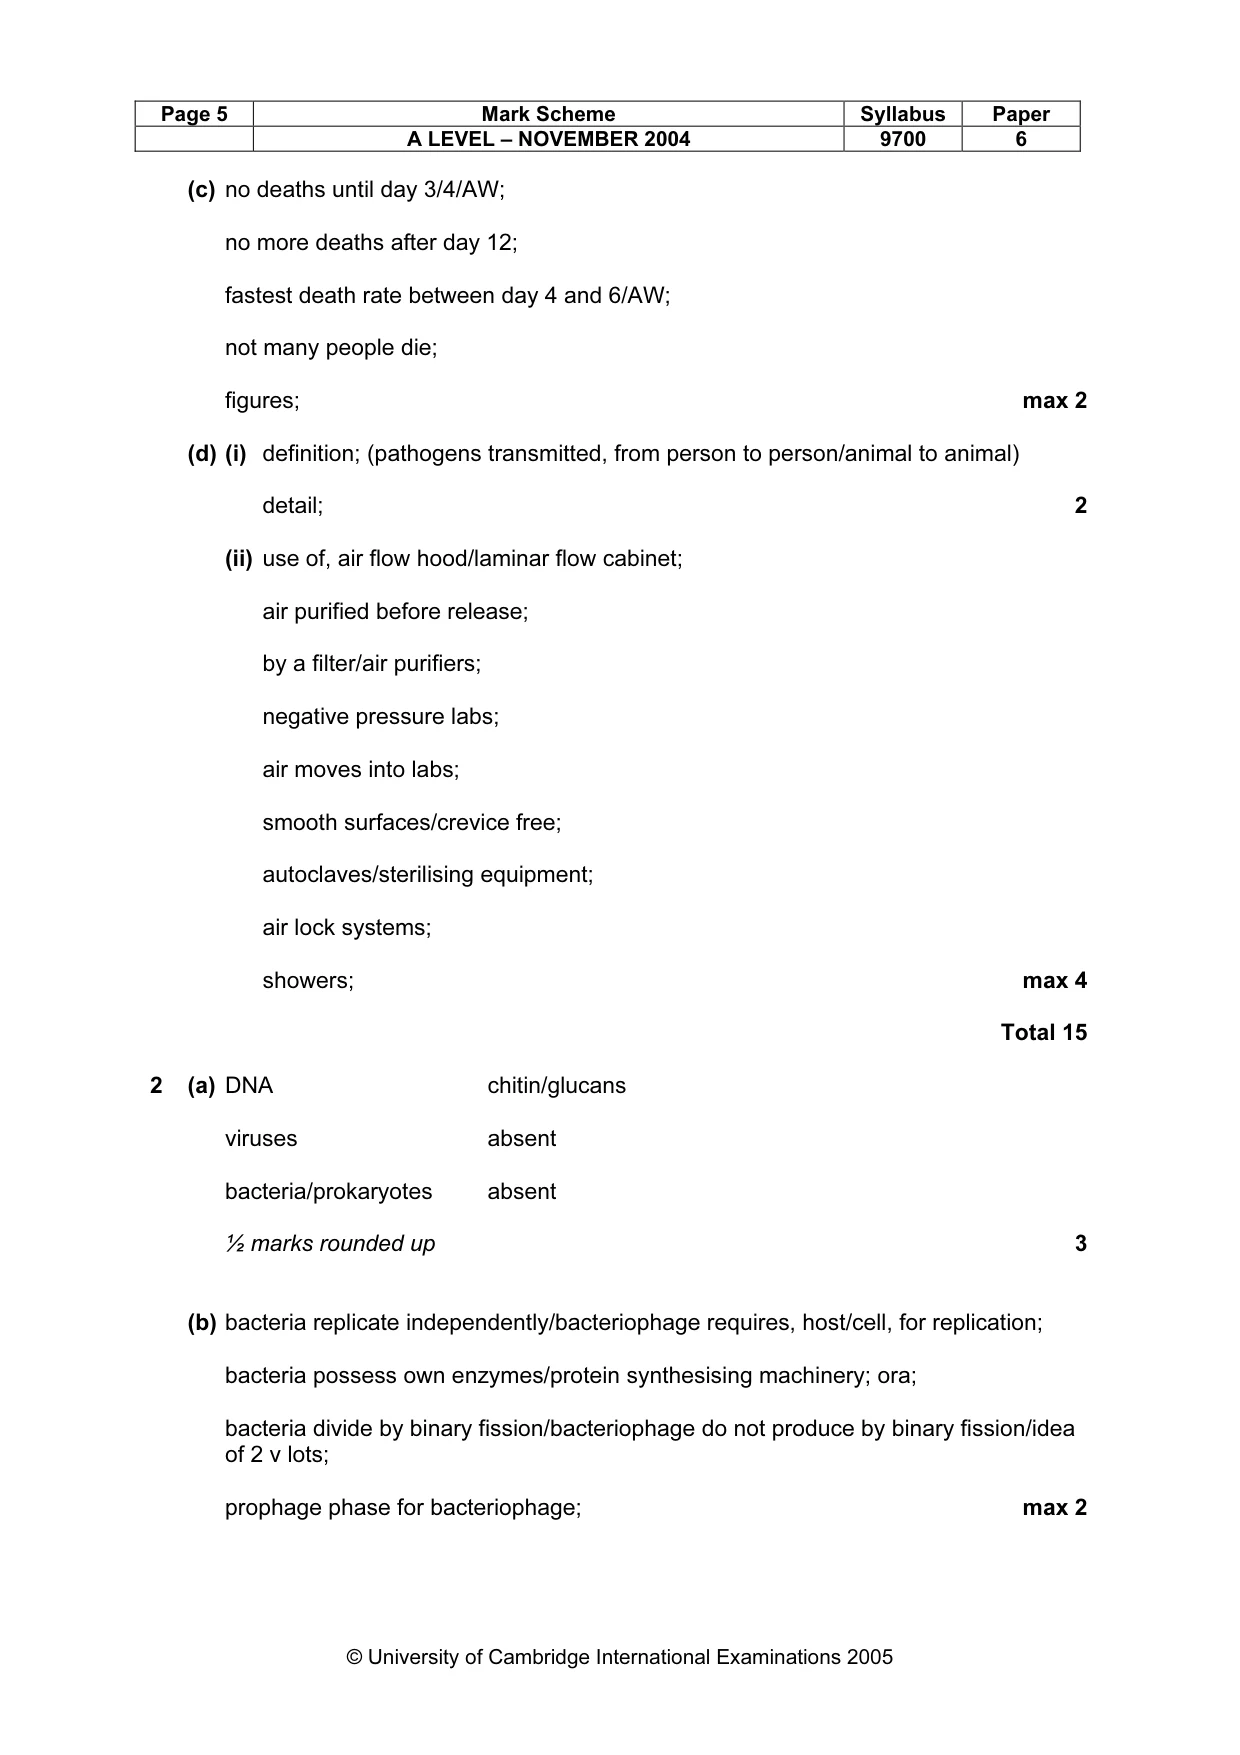
Page 5 Mark Scheme Syllabus Paper A LEVEL – NOVEMBER 2004 9700 6 © University of Cambridge International Examinations 2005 (c) no deaths until day 3/4/AW; no more deaths after day 12; fastest death rate between day 4 and 6/AW; not many people die; figures; max 2 (d) (i) definition; (pathogens transmitted, from person to person/animal to animal) detail; 2 (ii) use of, air flow hood/laminar flow cabinet; air purified before release; by a filter/air purifiers; negative pressure labs; air moves into labs; smooth surfaces/crevice free; autoclaves/sterilising equipment; air lock systems; showers; max 4 Total 15 2 (a) DNA chitin/glucans viruses absent bacteria/prokaryotes absent ½ marks rounded up 3 (b) bacteria replicate independently/bacteriophage requires, host/cell, for replication; bacteria possess own enzymes/protein synthesising machinery; ora; bacteria divide by binary fission/bacteriophage do not produce by binary fission/idea of 2 v lots; prophage phase for bacteriophage; max 2
Mark scheme, page 9
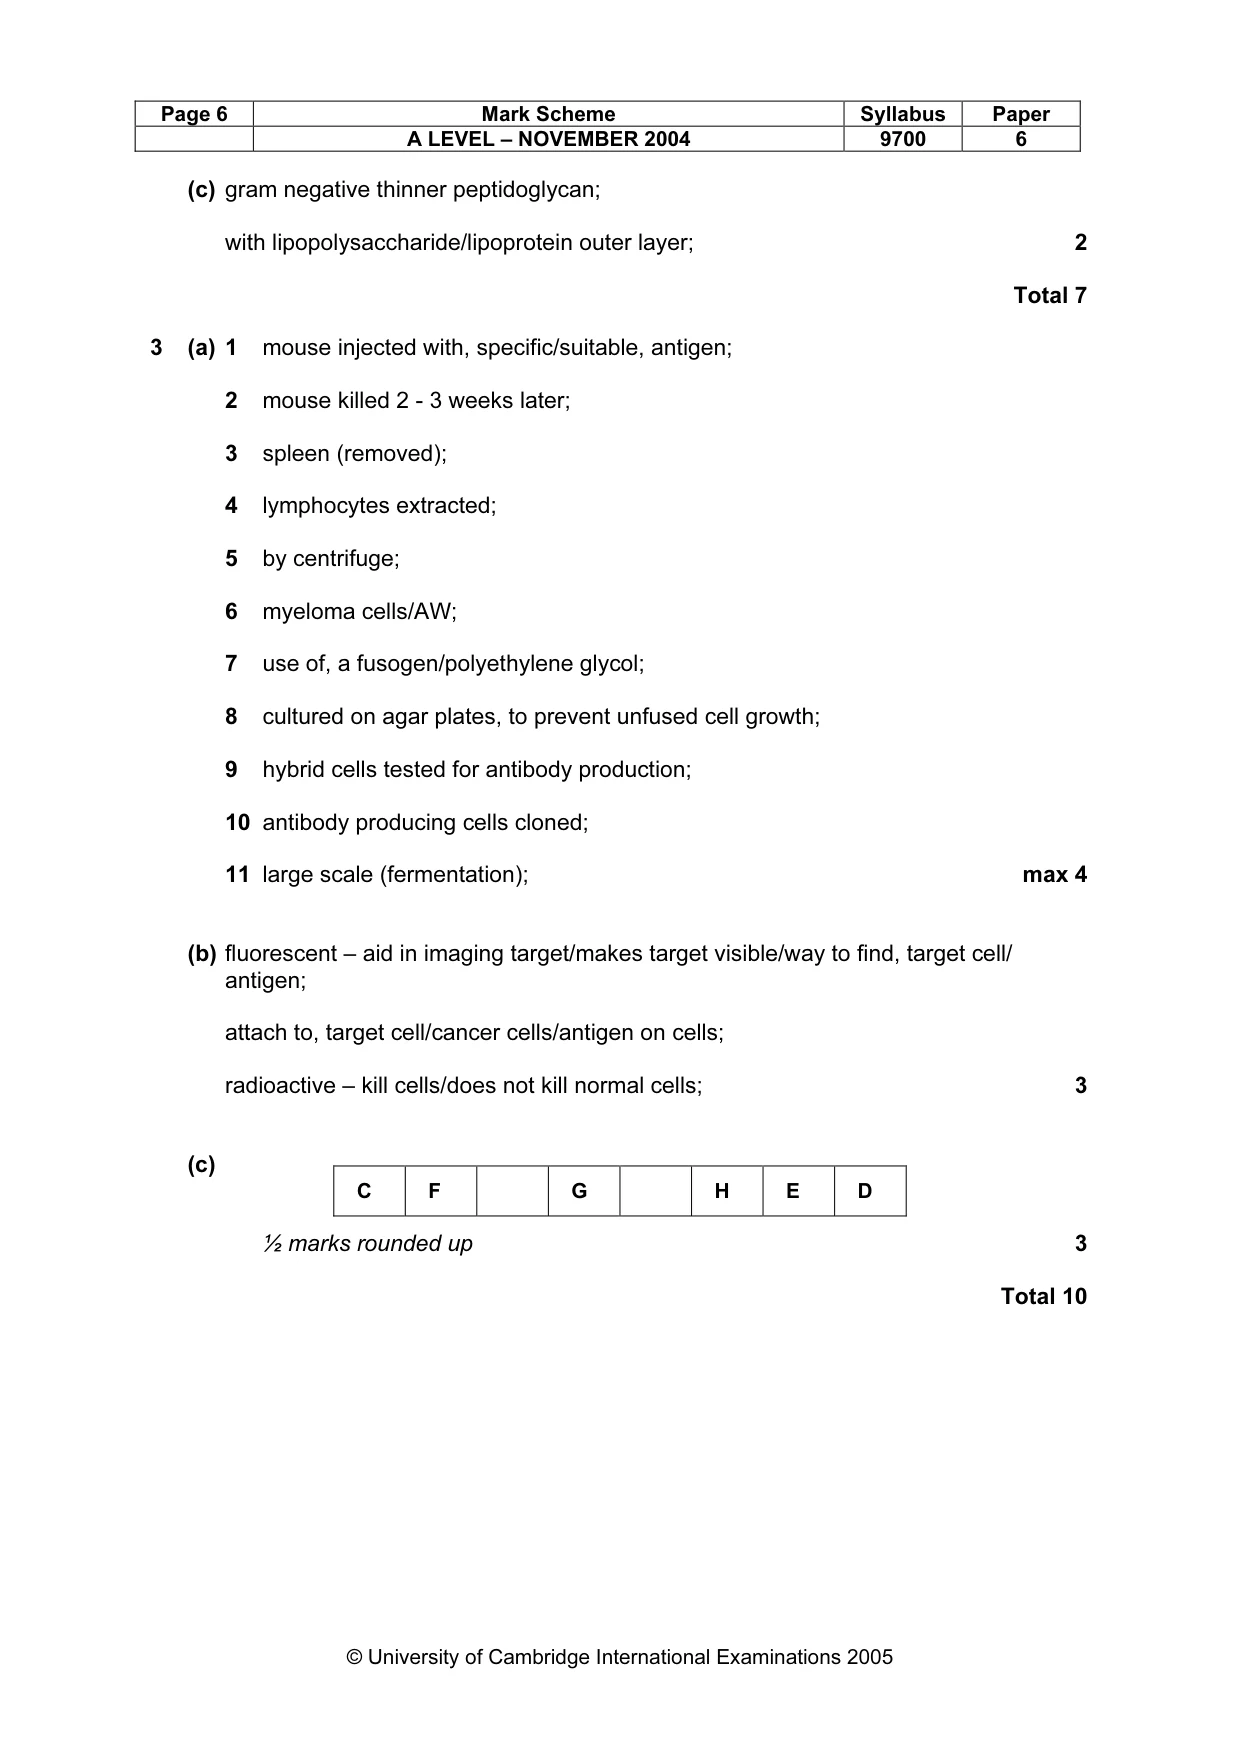
Page 6 Mark Scheme Syllabus Paper A LEVEL – NOVEMBER 2004 9700 6 © University of Cambridge International Examinations 2005 (c) gram negative thinner peptidoglycan; with lipopolysaccharide/lipoprotein outer layer; 2 Total 7 3 (a) 1 mouse injected with, specific/suitable, antigen; 2 mouse killed 2 - 3 weeks later; 3 spleen (removed); 4 lymphocytes extracted; 5 by centrifuge; 6 myeloma cells/AW; 7 use of, a fusogen/polyethylene glycol; 8 cultured on agar plates, to prevent unfused cell growth; 9 hybrid cells tested for antibody production; 10 antibody producing cells cloned; 11 large scale (fermentation); max 4 (b) fluorescent – aid in imaging target/makes target visible/way to find, target cell/ antigen; attach to, target cell/cancer cells/antigen on cells; radioactive – kill cells/does not kill normal cells; 3 (c) ½ marks rounded up 3 Total 10 C F G H E D
Mark scheme, page 10
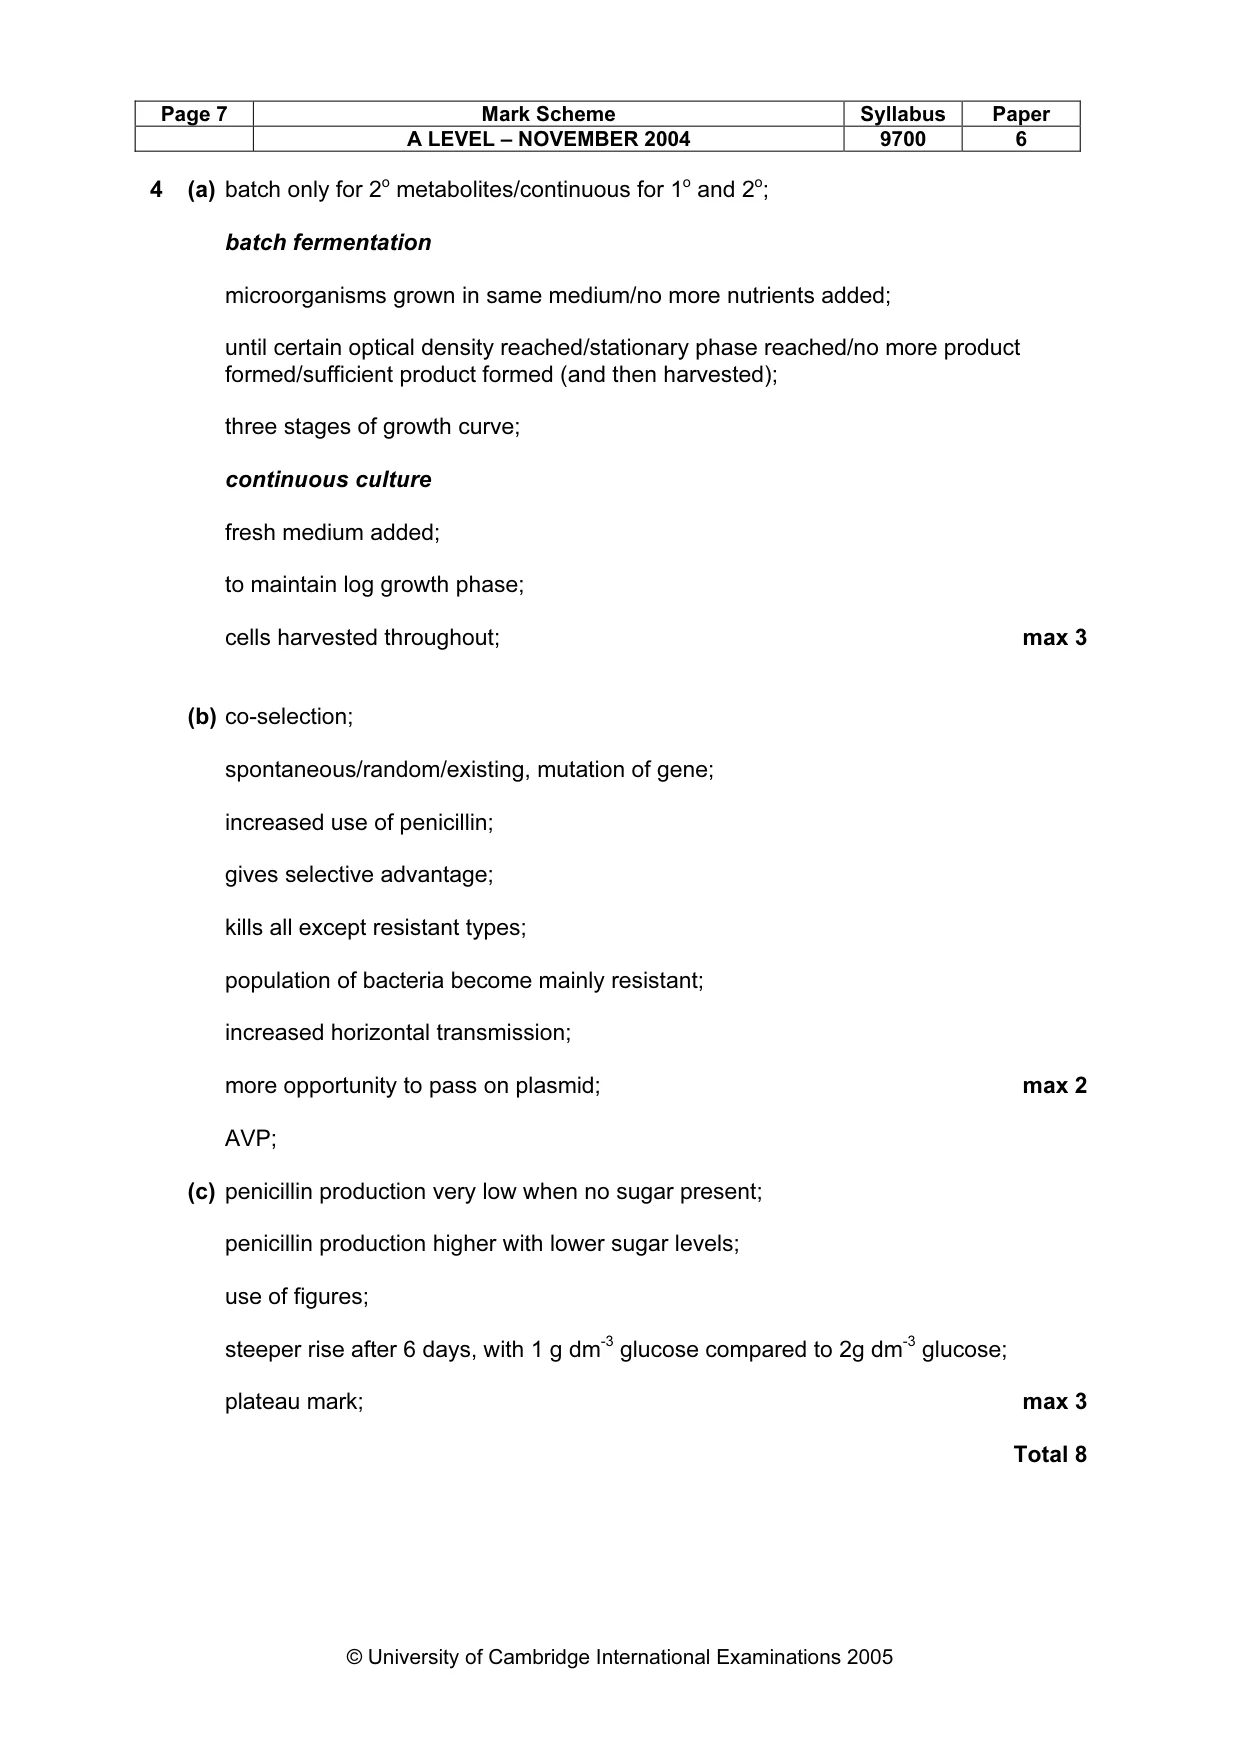
Page 7 Mark Scheme Syllabus Paper A LEVEL – NOVEMBER 2004 9700 6 © University of Cambridge International Examinations 2005 4 (a) batch only for 2o metabolites/continuous for 1o and 2o; batch fermentation microorganisms grown in same medium/no more nutrients added; until certain optical density reached/stationary phase reached/no more product formed/sufficient product formed (and then harvested); three stages of growth curve; continuous culture fresh medium added; to maintain log growth phase; cells harvested throughout; max 3 (b) co-selection; spontaneous/random/existing, mutation of gene; increased use of penicillin; gives selective advantage; kills all except resistant types; population of bacteria become mainly resistant; increased horizontal transmission; more opportunity to pass on plasmid; max 2 AVP; (c) penicillin production very low when no sugar present; penicillin production higher with lower sugar levels; use of figures; steeper rise after 6 days, with 1 g dm-3 glucose compared to 2g dm-3 glucose; plateau mark; max 3 Total 8
Mark scheme, page 11
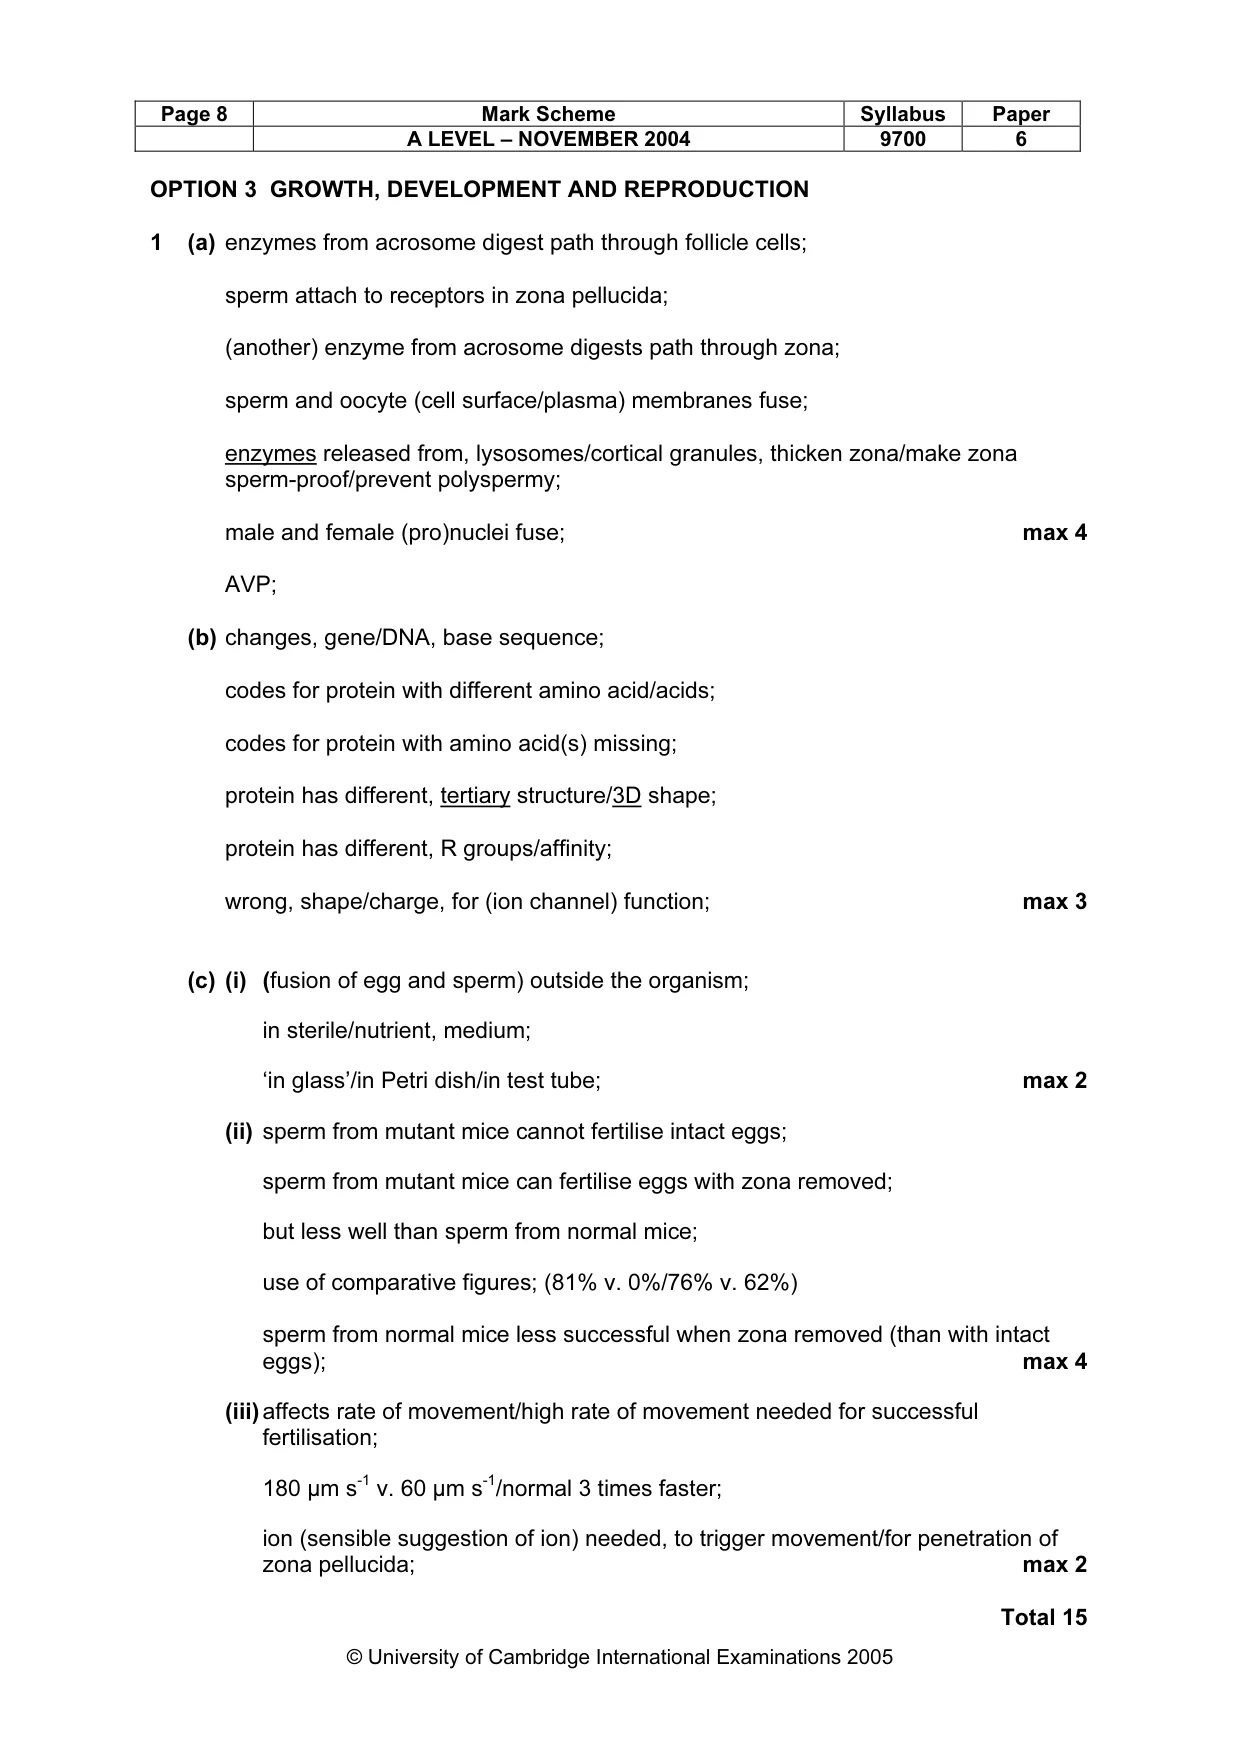
Page 8 Mark Scheme Syllabus Paper A LEVEL – NOVEMBER 2004 9700 6 © University of Cambridge International Examinations 2005 OPTION 3 GROWTH, DEVELOPMENT AND REPRODUCTION 1 (a) enzymes from acrosome digest path through follicle cells; sperm attach to receptors in zona pellucida; (another) enzyme from acrosome digests path through zona; sperm and oocyte (cell surface/plasma) membranes fuse; enzymes released from, lysosomes/cortical granules, thicken zona/make zona sperm-proof/prevent polyspermy; male and female (pro)nuclei fuse; max 4 AVP; (b) changes, gene/DNA, base sequence; codes for protein with different amino acid/acids; codes for protein with amino acid(s) missing; protein has different, tertiary structure/3D shape; protein has different, R groups/affinity; wrong, shape/charge, for (ion channel) function; max 3 (c) (i) (fusion of egg and sperm) outside the organism; in sterile/nutrient, medium; ‘in glass’/in Petri dish/in test tube; max 2 (ii) sperm from mutant mice cannot fertilise intact eggs; sperm from mutant mice can fertilise eggs with zona removed; but less well than sperm from normal mice; use of comparative figures; (81% v. 0%/76% v. 62%) sperm from normal mice less successful when zona removed (than with intact eggs); max 4 (iii) affects rate of movement/high rate of movement needed for successful fertilisation; 180 µm s-1 v. 60 µm s-1/normal 3 times faster; ion (sensible suggestion of ion) needed, to trigger movement/for penetration of zona pellucida; max 2 Total 15
Mark scheme, page 12
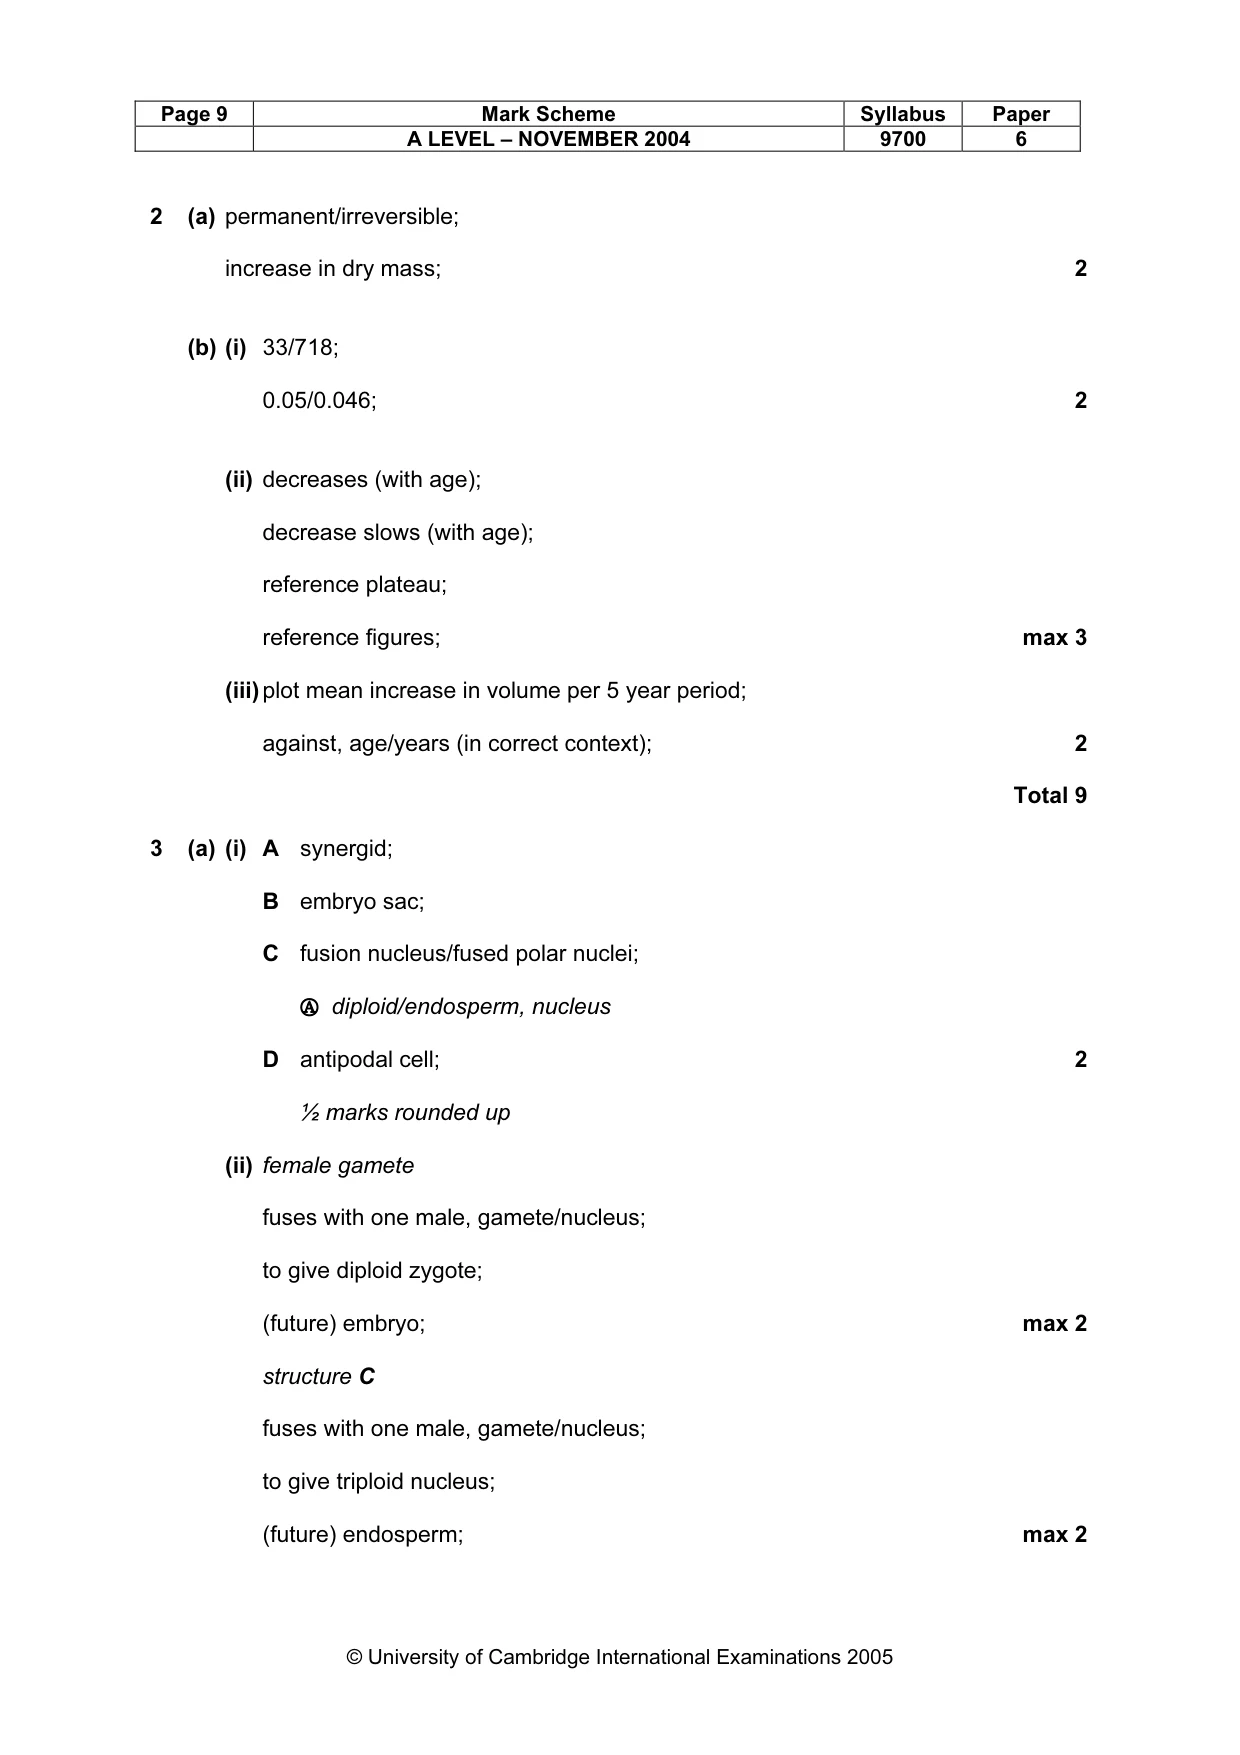
Page 9 Mark Scheme Syllabus Paper A LEVEL – NOVEMBER 2004 9700 6 © University of Cambridge International Examinations 2005 2 (a) permanent/irreversible; increase in dry mass; 2 (b) (i) 33/718; 0.05/0.046; 2 (ii) decreases (with age); decrease slows (with age); reference plateau; reference figures; max 3 (iii) plot mean increase in volume per 5 year period; against, age/years (in correct context); 2 Total 9 3 (a) (i) A synergid; B embryo sac; C fusion nucleus/fused polar nuclei; Ⓐ diploid/endosperm, nucleus D antipodal cell; 2 ½ marks rounded up (ii) female gamete fuses with one male, gamete/nucleus; to give diploid zygote; (future) embryo; max 2 structure C fuses with one male, gamete/nucleus; to give triploid nucleus; (future) endosperm; max 2
Mark scheme, page 13
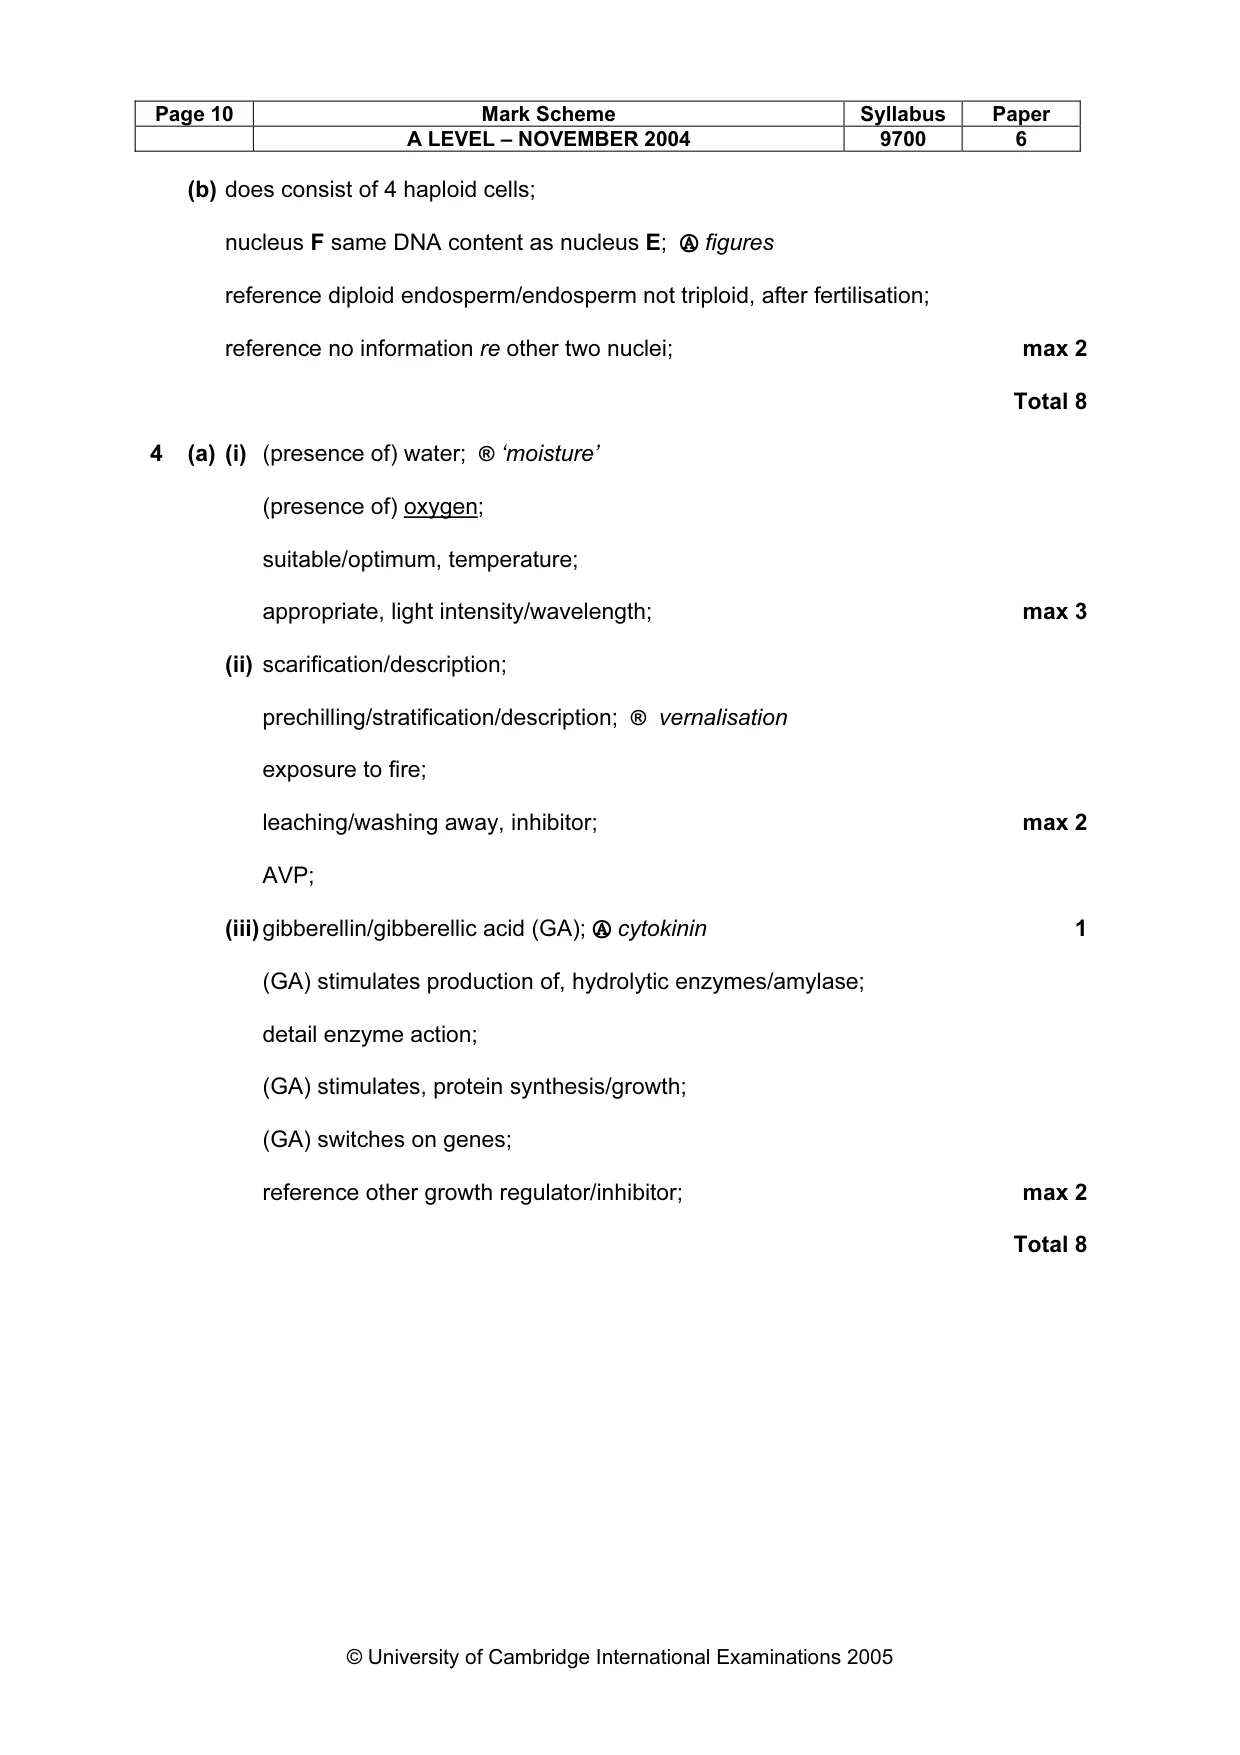
Page 10 Mark Scheme Syllabus Paper A LEVEL – NOVEMBER 2004 9700 6 © University of Cambridge International Examinations 2005 (b) does consist of 4 haploid cells; nucleus F same DNA content as nucleus E; Ⓐ figures reference diploid endosperm/endosperm not triploid, after fertilisation; reference no information re other two nuclei; max 2 Total 8 4 (a) (i) (presence of) water; ® ‘moisture’ (presence of) oxygen; suitable/optimum, temperature; appropriate, light intensity/wavelength; max 3 (ii) scarification/description; prechilling/stratification/description; ® vernalisation exposure to fire; leaching/washing away, inhibitor; max 2 AVP; (iii) gibberellin/gibberellic acid (GA); Ⓐ cytokinin 1 (GA) stimulates production of, hydrolytic enzymes/amylase; detail enzyme action; (GA) stimulates, protein synthesis/growth; (GA) switches on genes; reference other growth regulator/inhibitor; max 2 Total 8
Mark scheme, page 14
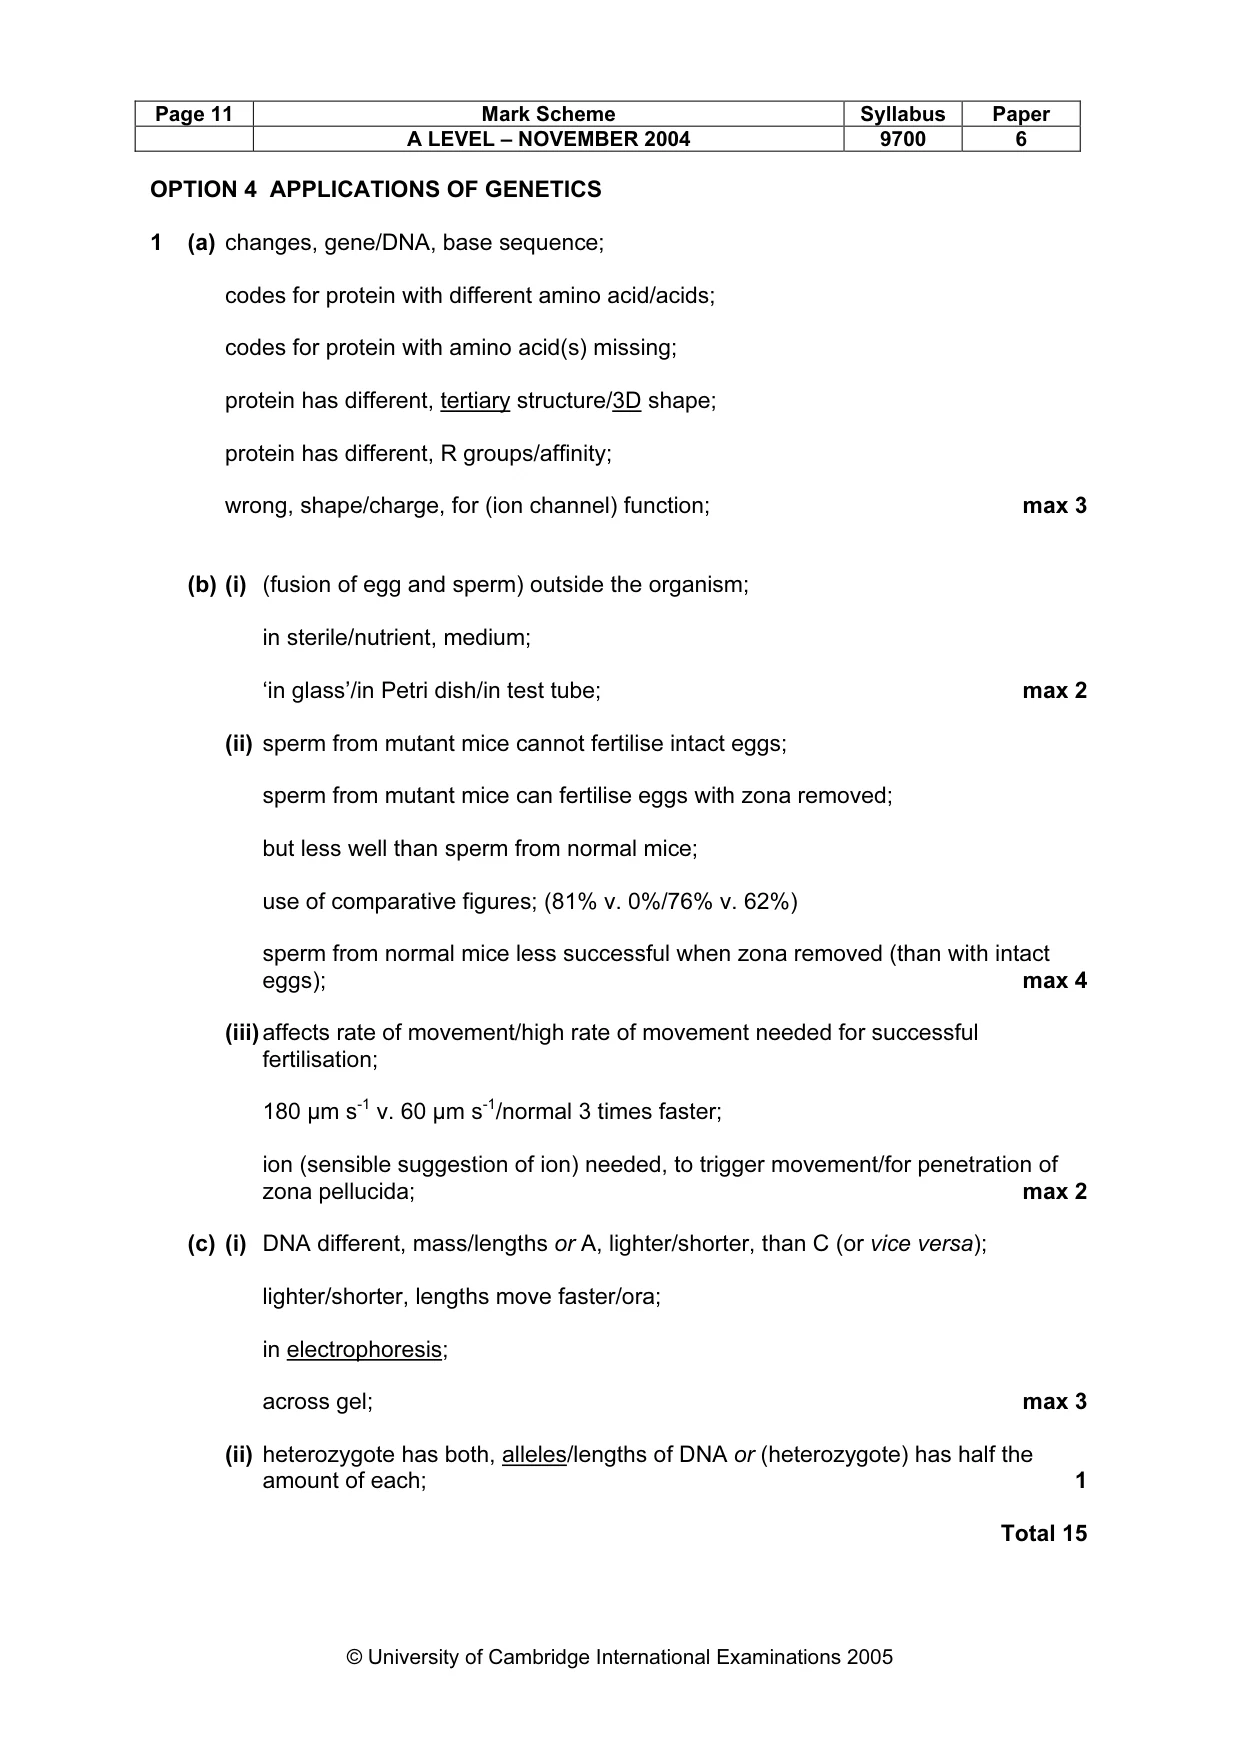
Page 11 Mark Scheme Syllabus Paper A LEVEL – NOVEMBER 2004 9700 6 © University of Cambridge International Examinations 2005 OPTION 4 APPLICATIONS OF GENETICS 1 (a) changes, gene/DNA, base sequence; codes for protein with different amino acid/acids; codes for protein with amino acid(s) missing; protein has different, tertiary structure/3D shape; protein has different, R groups/affinity; wrong, shape/charge, for (ion channel) function; max 3 (b) (i) (fusion of egg and sperm) outside the organism; in sterile/nutrient, medium; ‘in glass’/in Petri dish/in test tube; max 2 (ii) sperm from mutant mice cannot fertilise intact eggs; sperm from mutant mice can fertilise eggs with zona removed; but less well than sperm from normal mice; use of comparative figures; (81% v. 0%/76% v. 62%) sperm from normal mice less successful when zona removed (than with intact eggs); max 4 (iii) affects rate of movement/high rate of movement needed for successful fertilisation; 180 µm s-1 v. 60 µm s-1/normal 3 times faster; ion (sensible suggestion of ion) needed, to trigger movement/for penetration of zona pellucida; max 2 (c) (i) DNA different, mass/lengths or A, lighter/shorter, than C (or vice versa); lighter/shorter, lengths move faster/ora; in electrophoresis; across gel; max 3 (ii) heterozygote has both, alleles/lengths of DNA or (heterozygote) has half the amount of each; 1 Total 15
Mark scheme, page 15
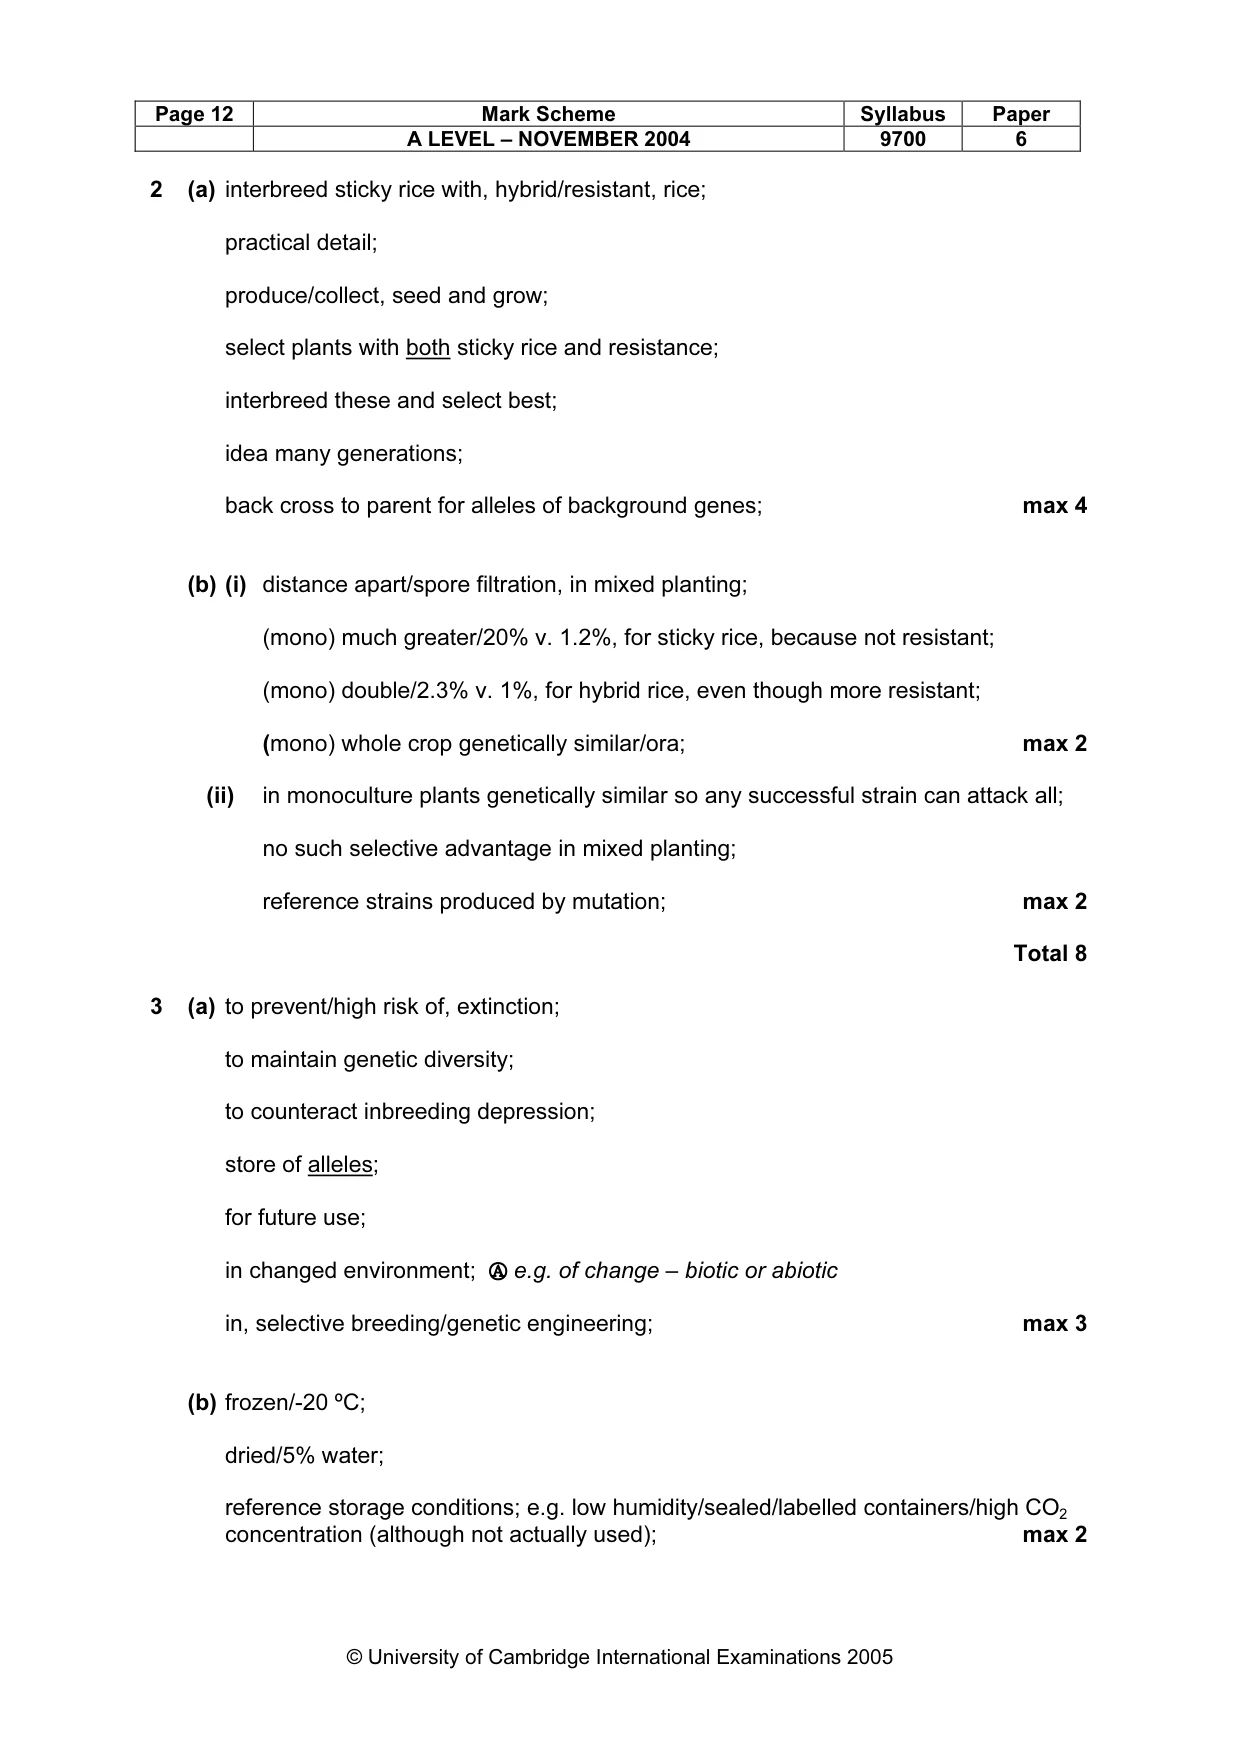
Page 12 Mark Scheme Syllabus Paper A LEVEL – NOVEMBER 2004 9700 6 © University of Cambridge International Examinations 2005 2 (a) interbreed sticky rice with, hybrid/resistant, rice; practical detail; produce/collect, seed and grow; select plants with both sticky rice and resistance; interbreed these and select best; idea many generations; back cross to parent for alleles of background genes; max 4 (b) (i) distance apart/spore filtration, in mixed planting; (mono) much greater/20% v. 1.2%, for sticky rice, because not resistant; (mono) double/2.3% v. 1%, for hybrid rice, even though more resistant; (mono) whole crop genetically similar/ora; max 2 (ii) in monoculture plants genetically similar so any successful strain can attack all; no such selective advantage in mixed planting; reference strains produced by mutation; max 2 Total 8 3 (a) to prevent/high risk of, extinction; to maintain genetic diversity; to counteract inbreeding depression; store of alleles; for future use; in changed environment; Ⓐ e.g. of change – biotic or abiotic in, selective breeding/genetic engineering; max 3 (b) frozen/-20 ºC; dried/5% water; reference storage conditions; e.g. low humidity/sealed/labelled containers/high CO2 concentration (although not actually used); max 2
Mark scheme, page 16
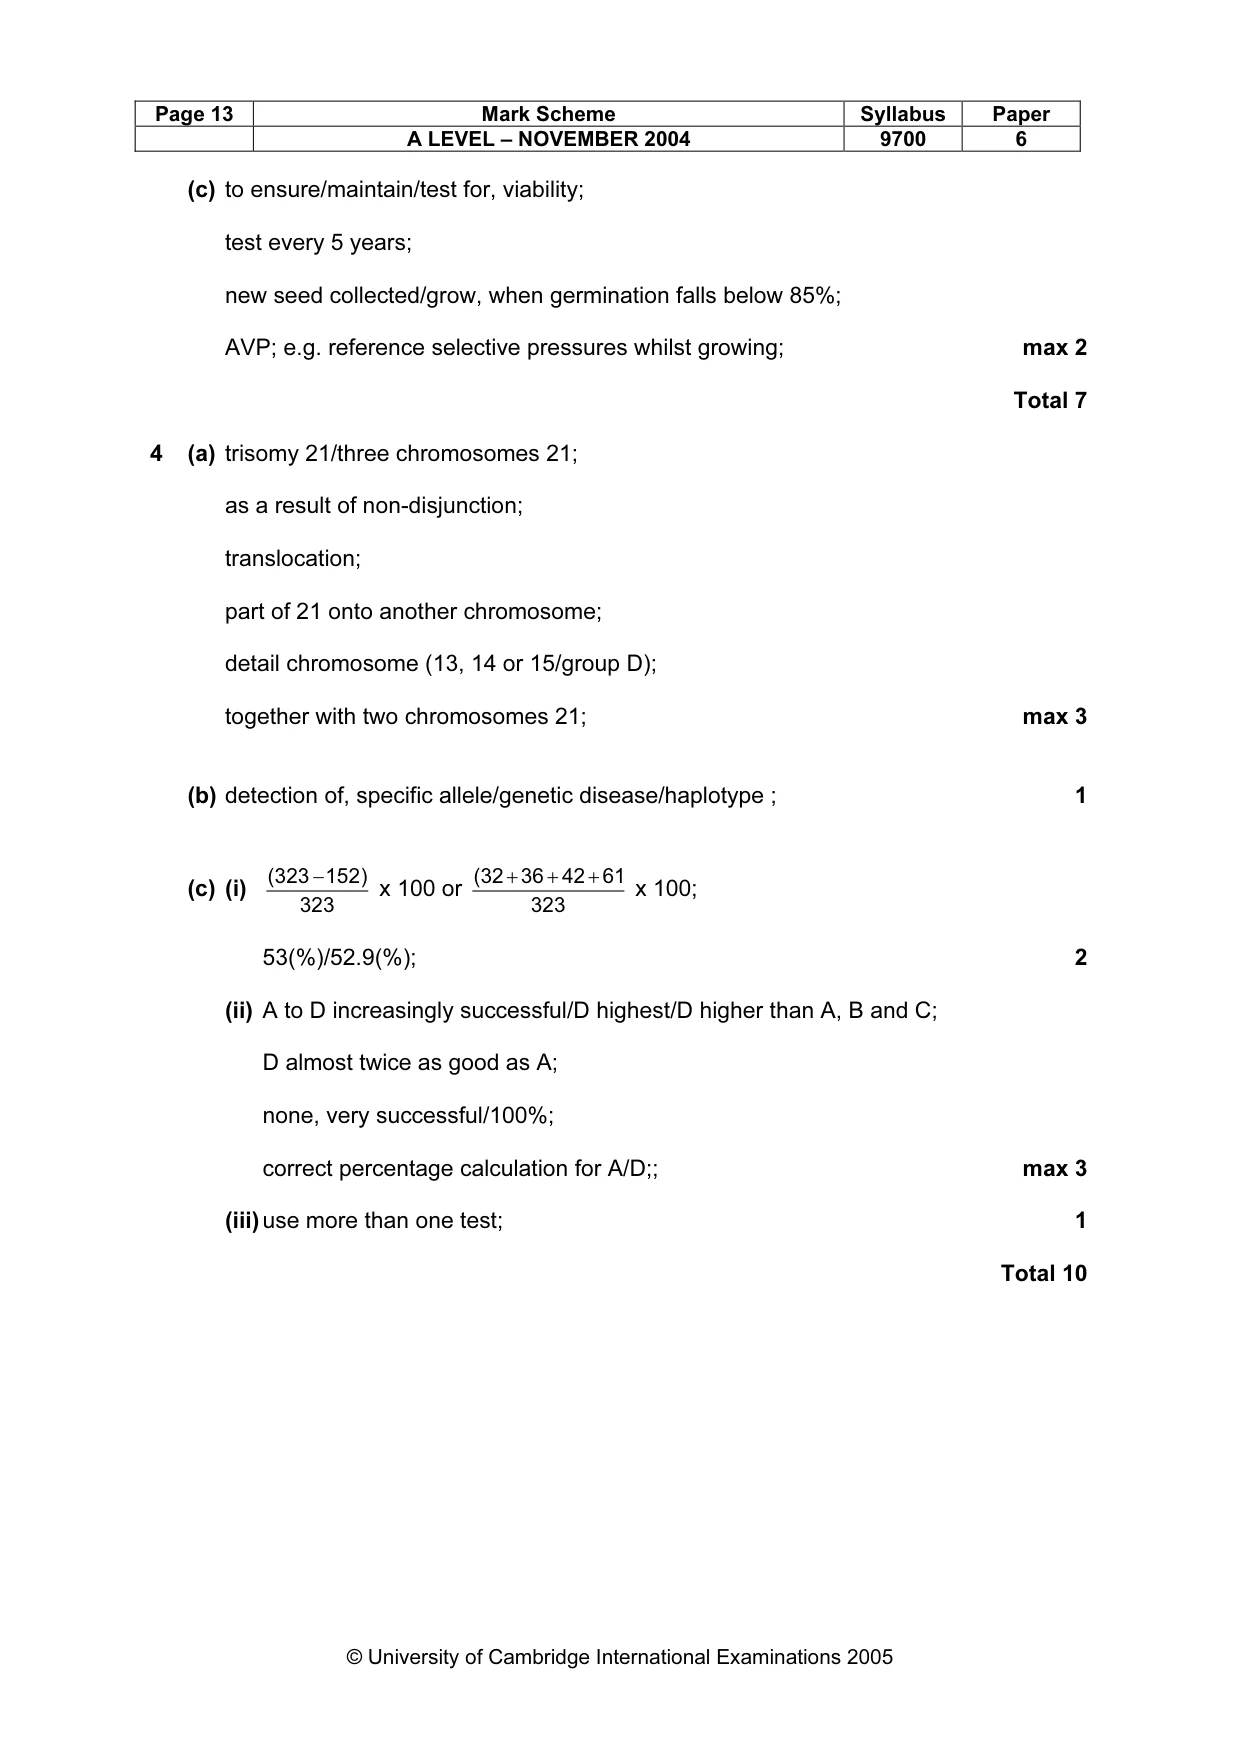
Page 13 Mark Scheme Syllabus Paper A LEVEL – NOVEMBER 2004 9700 6 © University of Cambridge International Examinations 2005 (c) to ensure/maintain/test for, viability; test every 5 years; new seed collected/grow, when germination falls below 85%; AVP; e.g. reference selective pressures whilst growing; max 2 Total 7 4 (a) trisomy 21/three chromosomes 21; as a result of non-disjunction; translocation; part of 21 onto another chromosome; detail chromosome (13, 14 or 15/group D); together with two chromosomes 21; max 3 (b) detection of, specific allele/genetic disease/haplotype ; 1 (c) (i) 323 ) 152 323 ( − x 100 or 323 61 42 36 32 ( + + + x 100; 53(%)/52.9(%); 2 (ii) A to D increasingly successful/D highest/D higher than A, B and C; D almost twice as good as A; none, very successful/100%; correct percentage calculation for A/D;; max 3 (iii) use more than one test; 1 Total 10