Cambridge A Level Accounting 9706 — 2008 Oct/Nov Paper 2 · Variant 1
9706/21/O/N/08 · 90 marks · ≈101 min
The question paper and its mark scheme, free to read here and free to download. This is Cambridge’s own paper, exactly as it was sat.
Question paper16 pages


Mark scheme7 pages
Answers below. Sit the paper first if you are practising.
Paper as text
Question paper, page 1
This document consists of 13 printed pages and 3 blank pages. IB08 11_9706_02/3RP © UCLES 2008 [Turn over *0480602393* For Examiner's Use 1 2 3 Total UNIVERSITY OF CAMBRIDGE INTERNATIONAL EXAMINATIONS General Certificate of Education Advanced Subsidiary Level and Advanced Level ACCOUNTING 9706/02 Paper 2 Structured Questions October/November 2008 1 hour 30 minutes Candidates answer on the Question Paper No Additional Materials are required. READ THESE INSTRUCTIONS FIRST Write your Centre number, candidate number and name on all the work you hand in. Write in dark blue or black pen. You may use a soft pencil for rough working. Do not use staples, paper clips, highlighters, glue or correction fluid. DO NOT WRITE IN ANY BARCODES. Answer all questions. You may use a calculator. At the end of the examination, fasten all your work securely together. The number of marks is given in brackets [ ] at the end of each question or part question.
Question paper, page 2
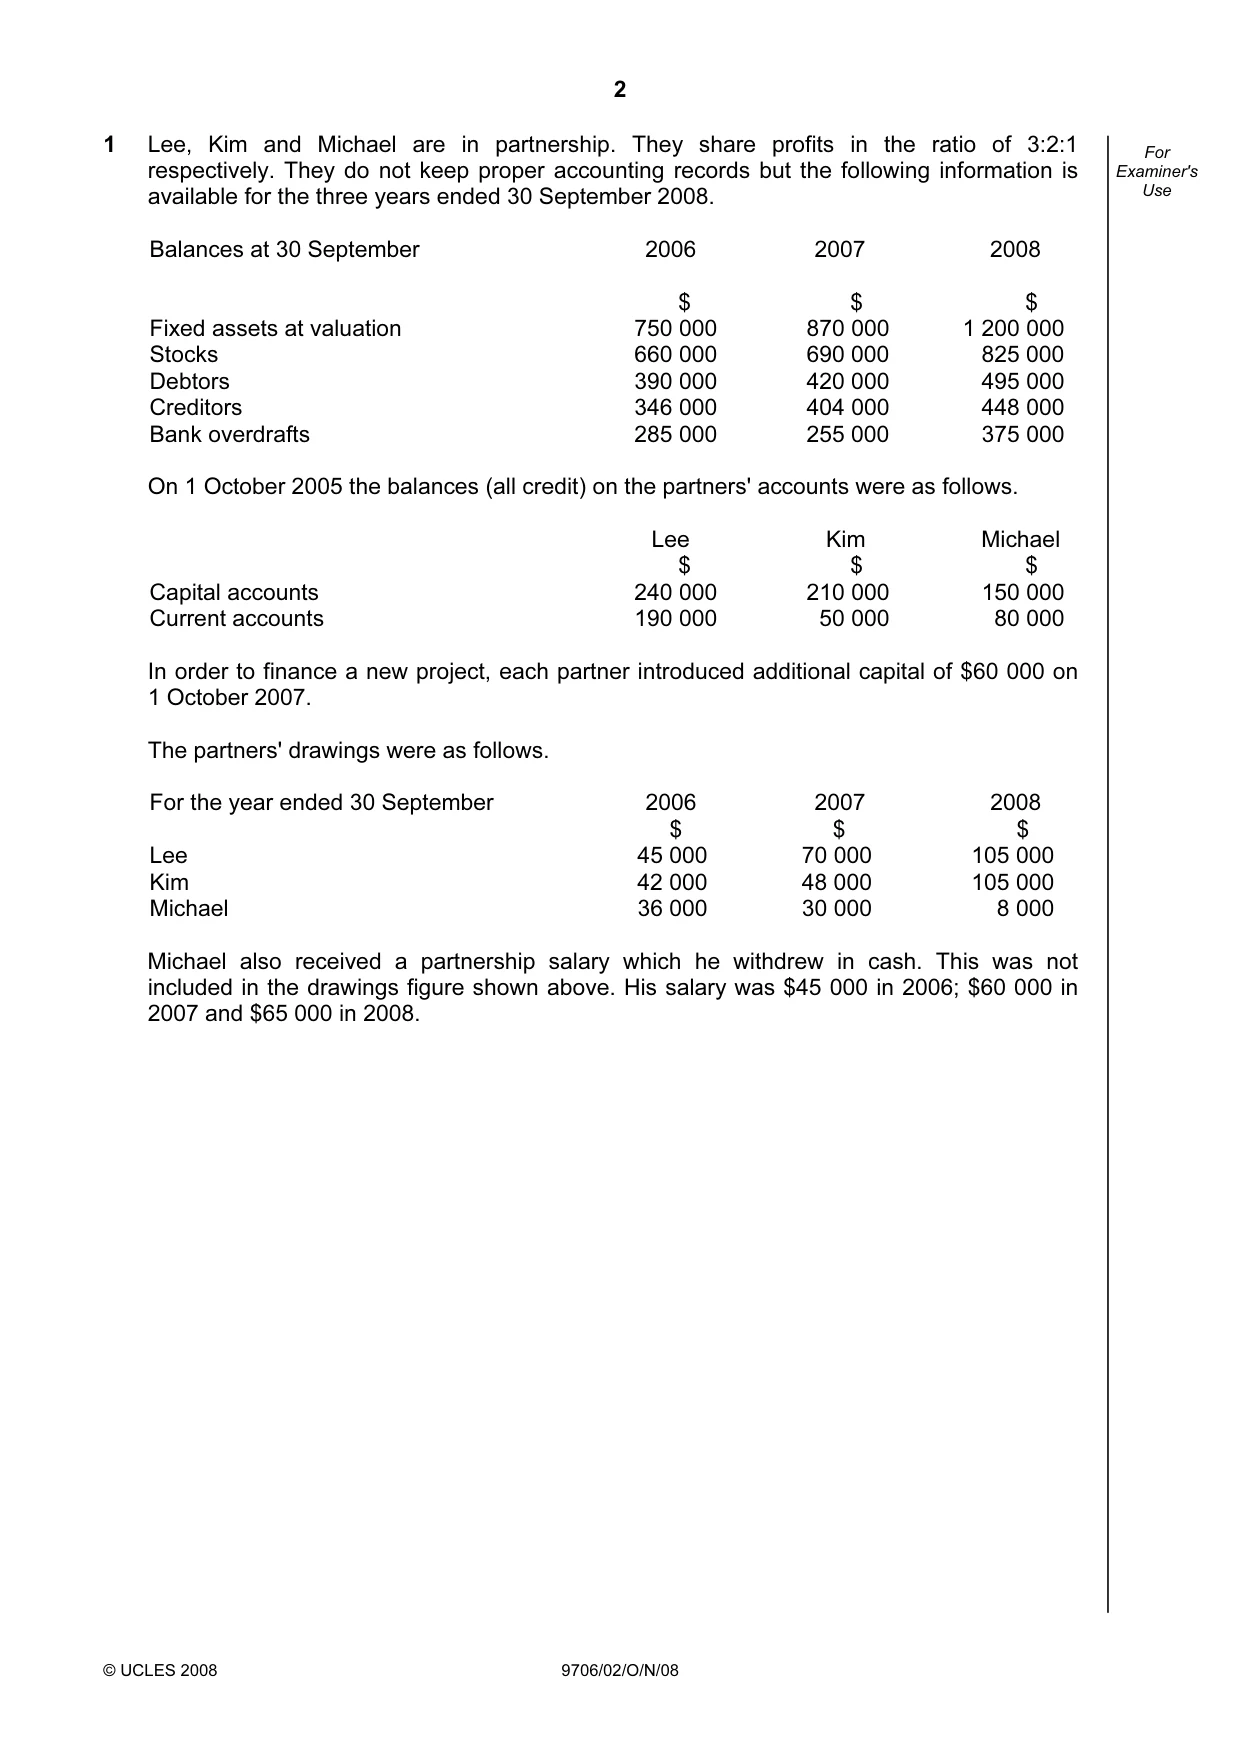
2 © UCLES 2008 9706/02/O/N/08 For Examiner's Use 1 Lee, Kim and Michael are in partnership. They share profits in the ratio of 3:2:1 respectively. They do not keep proper accounting records but the following information is available for the three years ended 30 September 2008. Balances at 30 September 2006 2007 2008 $ $ $ Fixed assets at valuation 750 000 870 000 1 200 000 Stocks 660 000 690 000 825 000 Debtors 390 000 420 000 495 000 Creditors 346 000 404 000 448 000 Bank overdrafts 285 000 255 000 375 000 On 1 October 2005 the balances (all credit) on the partners' accounts were as follows. Lee Kim Michael $ $ $ Capital accounts 240 000 210 000 150 000 Current accounts 190 000 50 000 80 000 In order to finance a new project, each partner introduced additional capital of $60 000 on 1 October 2007. The partners' drawings were as follows. For the year ended 30 September 2006 2007 2008 $ $ $ Lee 45 000 70 000 105 000 Kim 42 000 48 000 105 000 Michael 36 000 30 000 8 000 Michael also received a partnership salary which he withdrew in cash. This was not included in the drawings figure shown above. His salary was $45 000 in 2006; $60 000 in 2007 and $65 000 in 2008.
Question paper, page 3
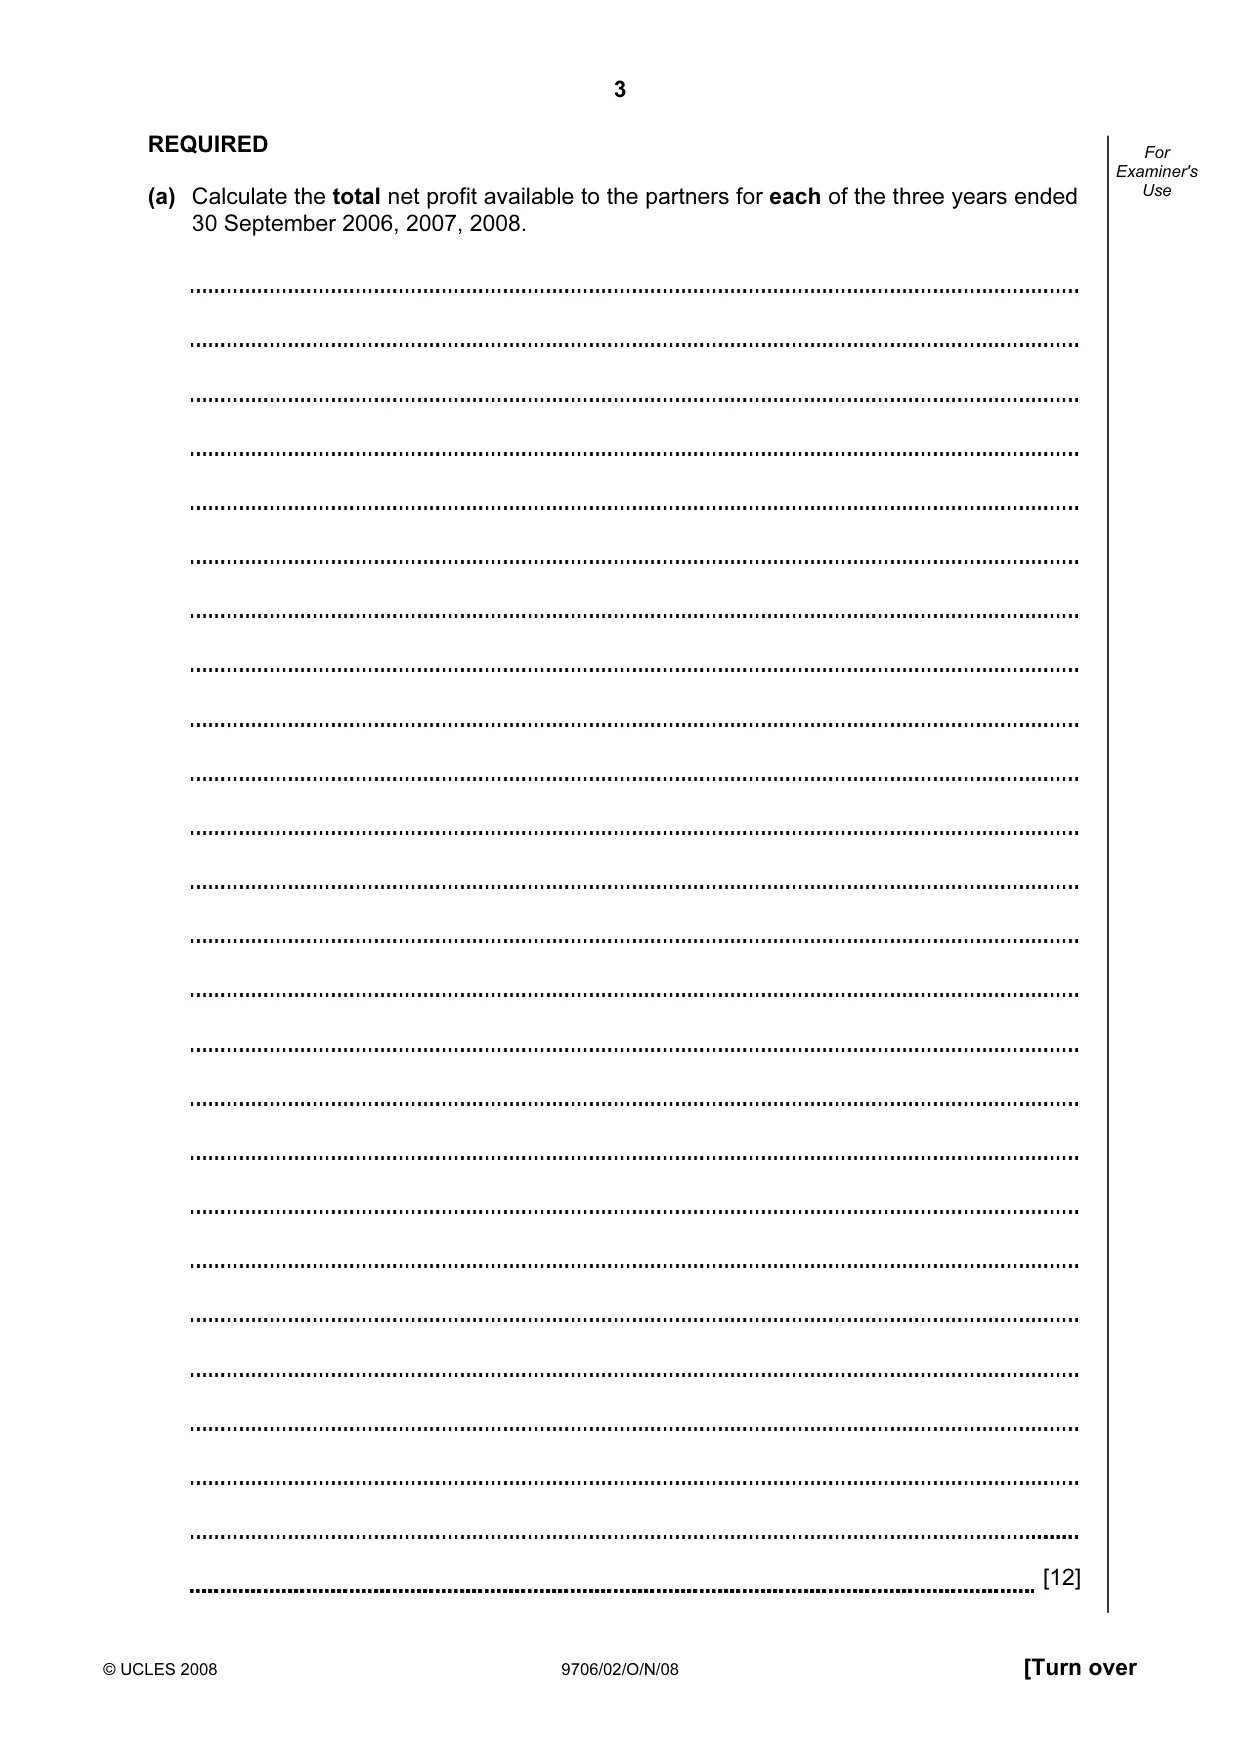
3 © UCLES 2008 9706/02/O/N/08 [Turn over For Examiner's Use REQUIRED (a) Calculate the total net profit available to the partners for each of the three years ended 30 September 2006, 2007, 2008. [12]
Question paper, page 4
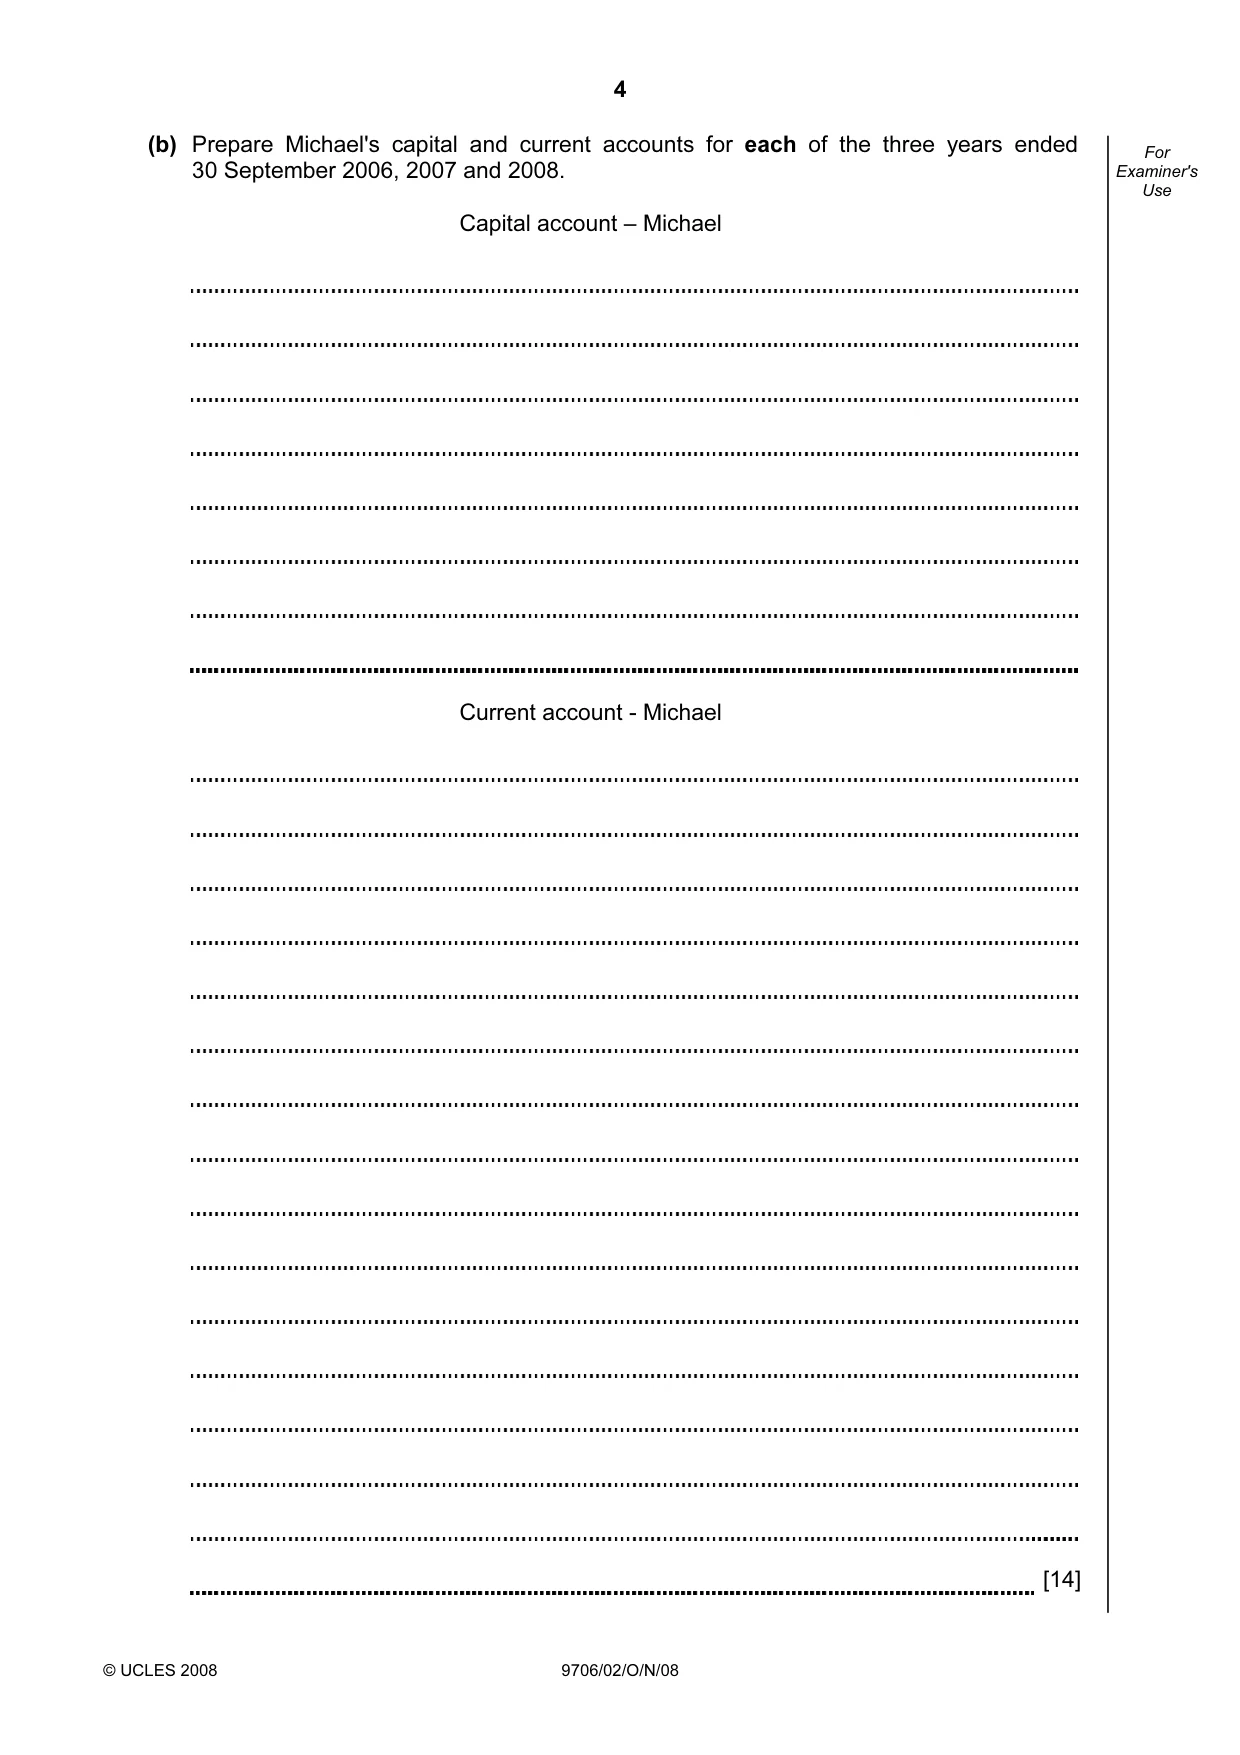
4 © UCLES 2008 9706/02/O/N/08 For Examiner's Use (b) Prepare Michael's capital and current accounts for each of the three years ended 30 September 2006, 2007 and 2008. Capital account – Michael Current account - Michael [14]
Question paper, page 5
5 © UCLES 2008 9706/02/O/N/08 [Turn over For Examiner's Use (c) Explain, briefly, why partnerships may keep both capital accounts and current accounts. [4] [Total: 30]
Question paper, page 6
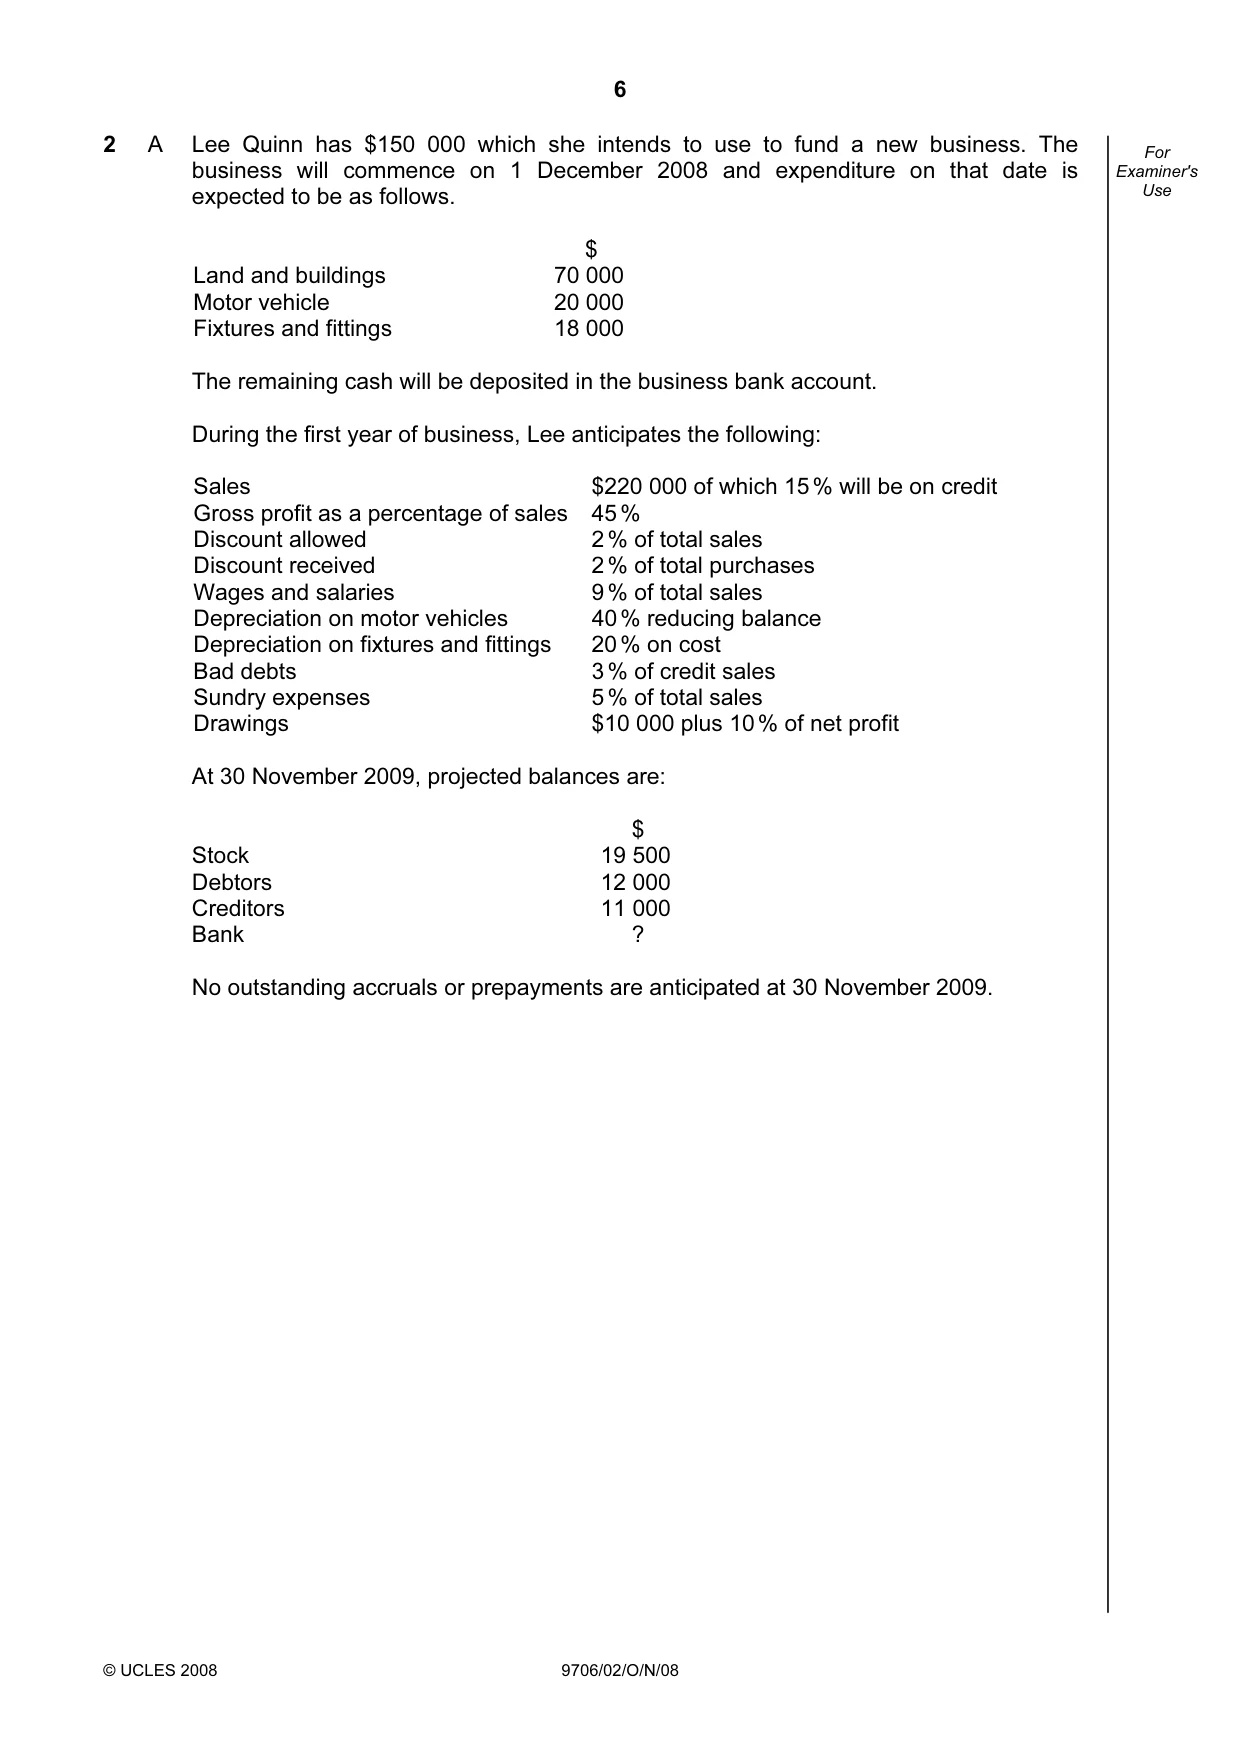
6 © UCLES 2008 9706/02/O/N/08 For Examiner's Use 2 A Lee Quinn has $150 000 which she intends to use to fund a new business. The business will commence on 1 December 2008 and expenditure on that date is expected to be as follows. $ Land and buildings 70 000 Motor vehicle 20 000 Fixtures and fittings 18 000 The remaining cash will be deposited in the business bank account. During the first year of business, Lee anticipates the following: Sales $220 000 of which 15 % will be on credit Gross profit as a percentage of sales 45 % Discount allowed 2 % of total sales Discount received 2 % of total purchases Wages and salaries 9 % of total sales Depreciation on motor vehicles 40 % reducing balance Depreciation on fixtures and fittings 20 % on cost Bad debts 3 % of credit sales Sundry expenses 5 % of total sales Drawings $10 000 plus 10 % of net profit At 30 November 2009, projected balances are: $ Stock 19 500 Debtors 12 000 Creditors 11 000 Bank ? No outstanding accruals or prepayments are anticipated at 30 November 2009.
Question paper, page 7
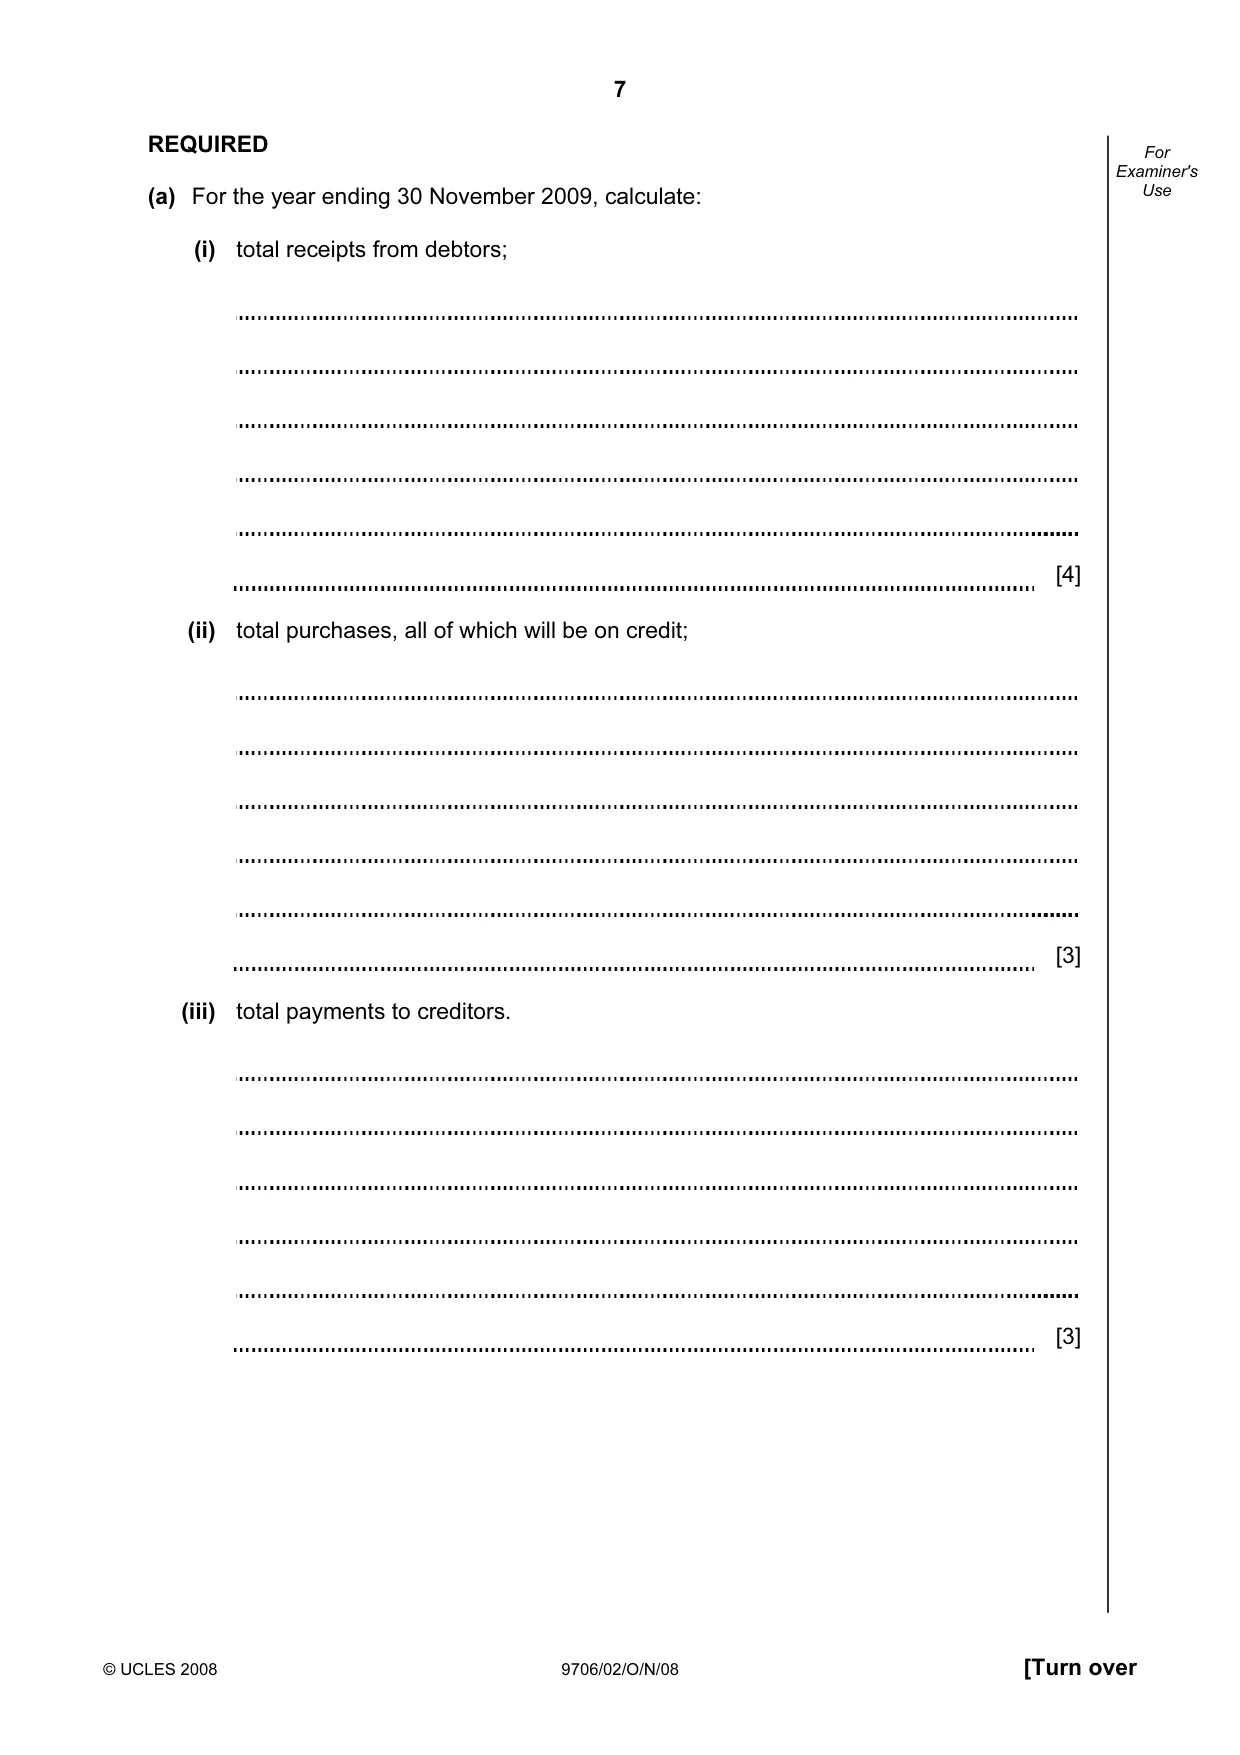
7 © UCLES 2008 9706/02/O/N/08 [Turn over For Examiner's Use REQUIRED (a) For the year ending 30 November 2009, calculate: (i) total receipts from debtors; [4] (ii) total purchases, all of which will be on credit; [3] (iii) total payments to creditors. [3]
Question paper, page 8
8 © UCLES 2008 9706/02/O/N/08 For Examiner's Use (b) (i) Prepare a projected trading and profit and loss account for the year ending 30 November 2009. [8]
Question paper, page 9
9 © UCLES 2008 9706/02/O/N/08 [Turn over For Examiner's Use (ii) Prepare a projected balance sheet at 30 November 2009. [6]
Question paper, page 10
10 © UCLES 2008 9706/02/O/N/08 For Examiner's Use B Ahmed Khan is a sole trader. During the year ended 30 September 2007, his percentage of net profit to sales was 22 %. The following year, this dropped to 18 %, despite the year's net profit having increased from $60 000 to $70 000. REQUIRED State six possible reasons for the decrease in the ratio of net profit to sales. [6] [Total: 30]
Question paper, page 11
11 BLANK PAGE 9706/02/O/N/08 [Turn over Question 3 is on the next page
Question paper, page 12
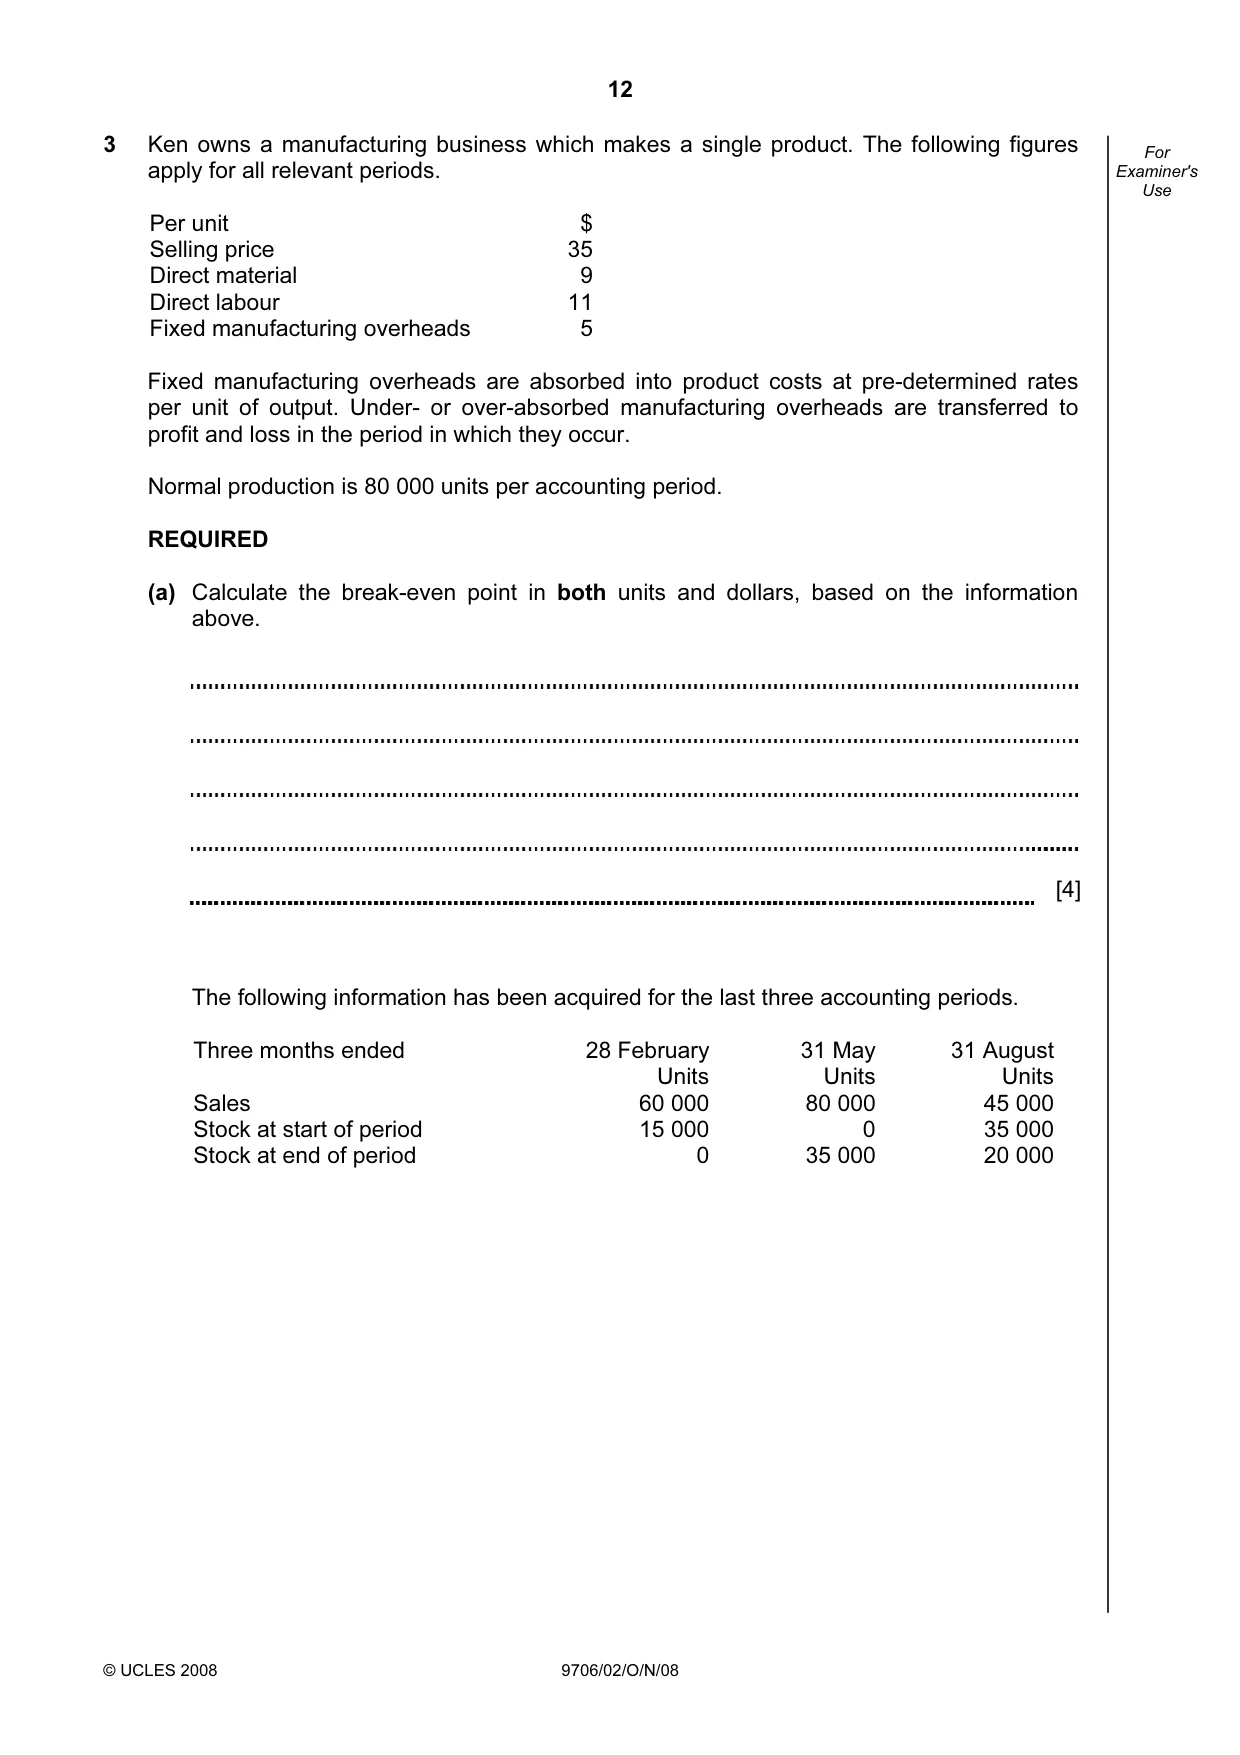
12 © UCLES 2008 9706/02/O/N/08 For Examiner's Use 3 Ken owns a manufacturing business which makes a single product. The following figures apply for all relevant periods. Per unit $ Selling price 35 Direct material 9 Direct labour 11 Fixed manufacturing overheads 5 Fixed manufacturing overheads are absorbed into product costs at pre-determined rates per unit of output. Under- or over-absorbed manufacturing overheads are transferred to profit and loss in the period in which they occur. Normal production is 80 000 units per accounting period. REQUIRED (a) Calculate the break-even point in both units and dollars, based on the information above. [4] The following information has been acquired for the last three accounting periods. Three months ended 28 February 31 May 31 August Units Units Units Sales 60 000 80 000 45 000 Stock at start of period 15 000 0 35 000 Stock at end of period 0 35 000 20 000
Question paper, page 13
13 © UCLES 2008 9706/02/O/N/08 [Turn over For Examiner's Use (b) Calculate the profit or loss in each period using marginal costing. [13]
Question paper, page 14
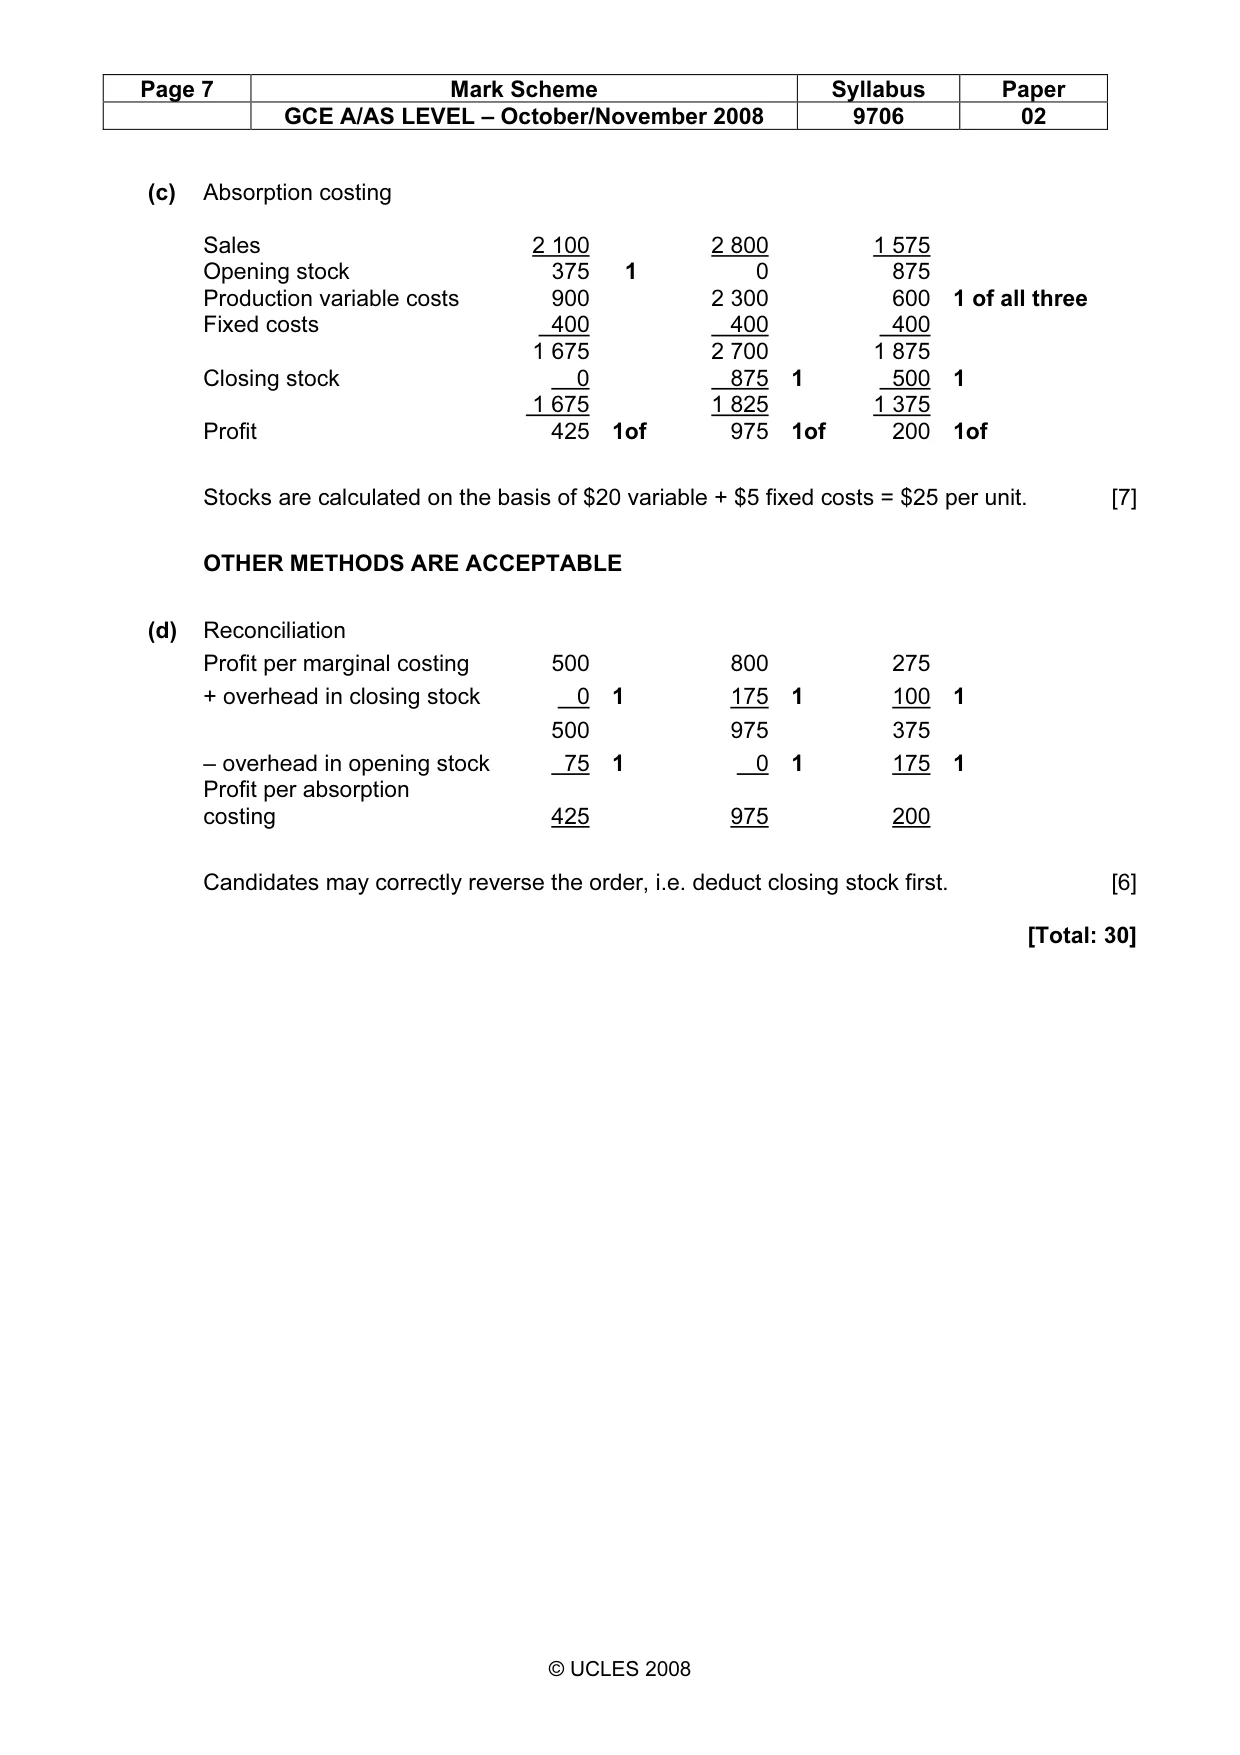
14 © UCLES 2008 9706/02/O/N/08 For Examiner's Use (c) Calculate the profit or loss in each period using absorption costing. [7] (d) Prepare a financial statement that reconciles your profit using marginal costing with your profit using absorption costing. For three months ended 28 February 31 May 31 August $ $ $ Profit using marginal costing Profit using absorption costing [6] [Total: 30]
Question paper, page 16
16 BLANK PAGE Permission to reproduce items where third-party owned material protected by copyright is included has been sought and cleared where possible. Every reasonable effort has been made by the publisher (UCLES) to trace copyright holders, but if any items requiring clearance have unwittingly been included, the publisher will be pleased to make amends at the earliest possible opportunity. University of Cambridge International Examinations is part of the Cambridge Assessment Group. Cambridge Assessment is the brand name of University of Cambridge Local Examinations Syndicate (UCLES), which is itself a department of the University of Cambridge. 9706/02/O/N/08
Mark scheme, page 1
UNIVERSITY OF CAMBRIDGE INTERNATIONAL EXAMINATIONS GCE Advanced Subsidiary Level and GCE Advanced Level MARK SCHEME for the October/November 2008 question paper 9706 ACCOUNTING 9706/02 Paper 2 (Structured Questions), maximum raw mark 90 This mark scheme is published as an aid to teachers and candidates, to indicate the requirements of the examination. It shows the basis on which Examiners were instructed to award marks. It does not indicate the details of the discussions that took place at an Examiners’ meeting before marking began. All Examiners are instructed that alternative correct answers and unexpected approaches in candidates’ scripts must be given marks that fairly reflect the relevant knowledge and skills demonstrated. Mark schemes must be read in conjunction with the question papers and the report on the examination. • CIE will not enter into discussions or correspondence in connection with these mark schemes. CIE is publishing the mark schemes for the October/November 2008 question papers for most IGCSE, GCE Advanced Level and Advanced Subsidiary Level syllabuses and some Ordinary Level syllabuses.
Mark scheme, page 2
Page 2 Mark Scheme Syllabus Paper GCE A/AS LEVEL – October/November 2008 9706 02 © UCLES 2008 1 (a) 2006 2007 2008 $ $ $ Fixed assets 750 000 870 000 1 200 000 1 Stocks 660 000 690 000 825 000 1 Debtors 390 000 420 000 495 000 1 1 800 000 1 980 000 2 520 000 Less Creditors –346 000 –404 000 –448 000 1 Bank overdrafts –285 000 –255 000 –375 000 1 1 169 000 1 321 000 1 697 000 Capital accounts –600 000 –600 000 –780 000 1 569 000 721 000 917 000 Current accounts –320 000 –569 000 –721 000 Add back Drawings 123 000 148 000 218 000 3 Salary 45 000 60 000 65 000 3 Profit for year 417 000 360 000 479 000 [12] (b) (i) Capital account – Michael $ $ 30/9/06 Bal c/d 150 000 1/10/05 Bal b/d 150 000 1 30/9/07 Bal c/d 150 000 1/10/06 Bal b/d 150 000 1/10/07 Bal b/d 150 000 30/9/08 Bal c/d 210 000 1 Bank 60 000 1 210 000 210 000 1/10/08 Bal b/d 210 000 (ii) Current account – Michael $ $ 30/9/06 Drawings 36 000 1 1/10/05 Bal b/d 80 000 1 Bal c/d 106 000 1of 30/9/06 S of Res 62 000 1 of 142 000 142 000 30/9/07 Drawings 30 000 1 1/10/06 Bal b/d 106 000 Bal c/d 126 000 1of 30/9/07 S of Res 50 000 1 of 156 000 156 000 30/9/08 Drawings 8 000 1 1/10/07 Bal b/d 126 000 Bal c/d 187 000 1of 30/9/08 S of Res 69 000 1 of 195 000 195 000 1/10/08 Bal b/d 187 000 1
Mark scheme, page 3
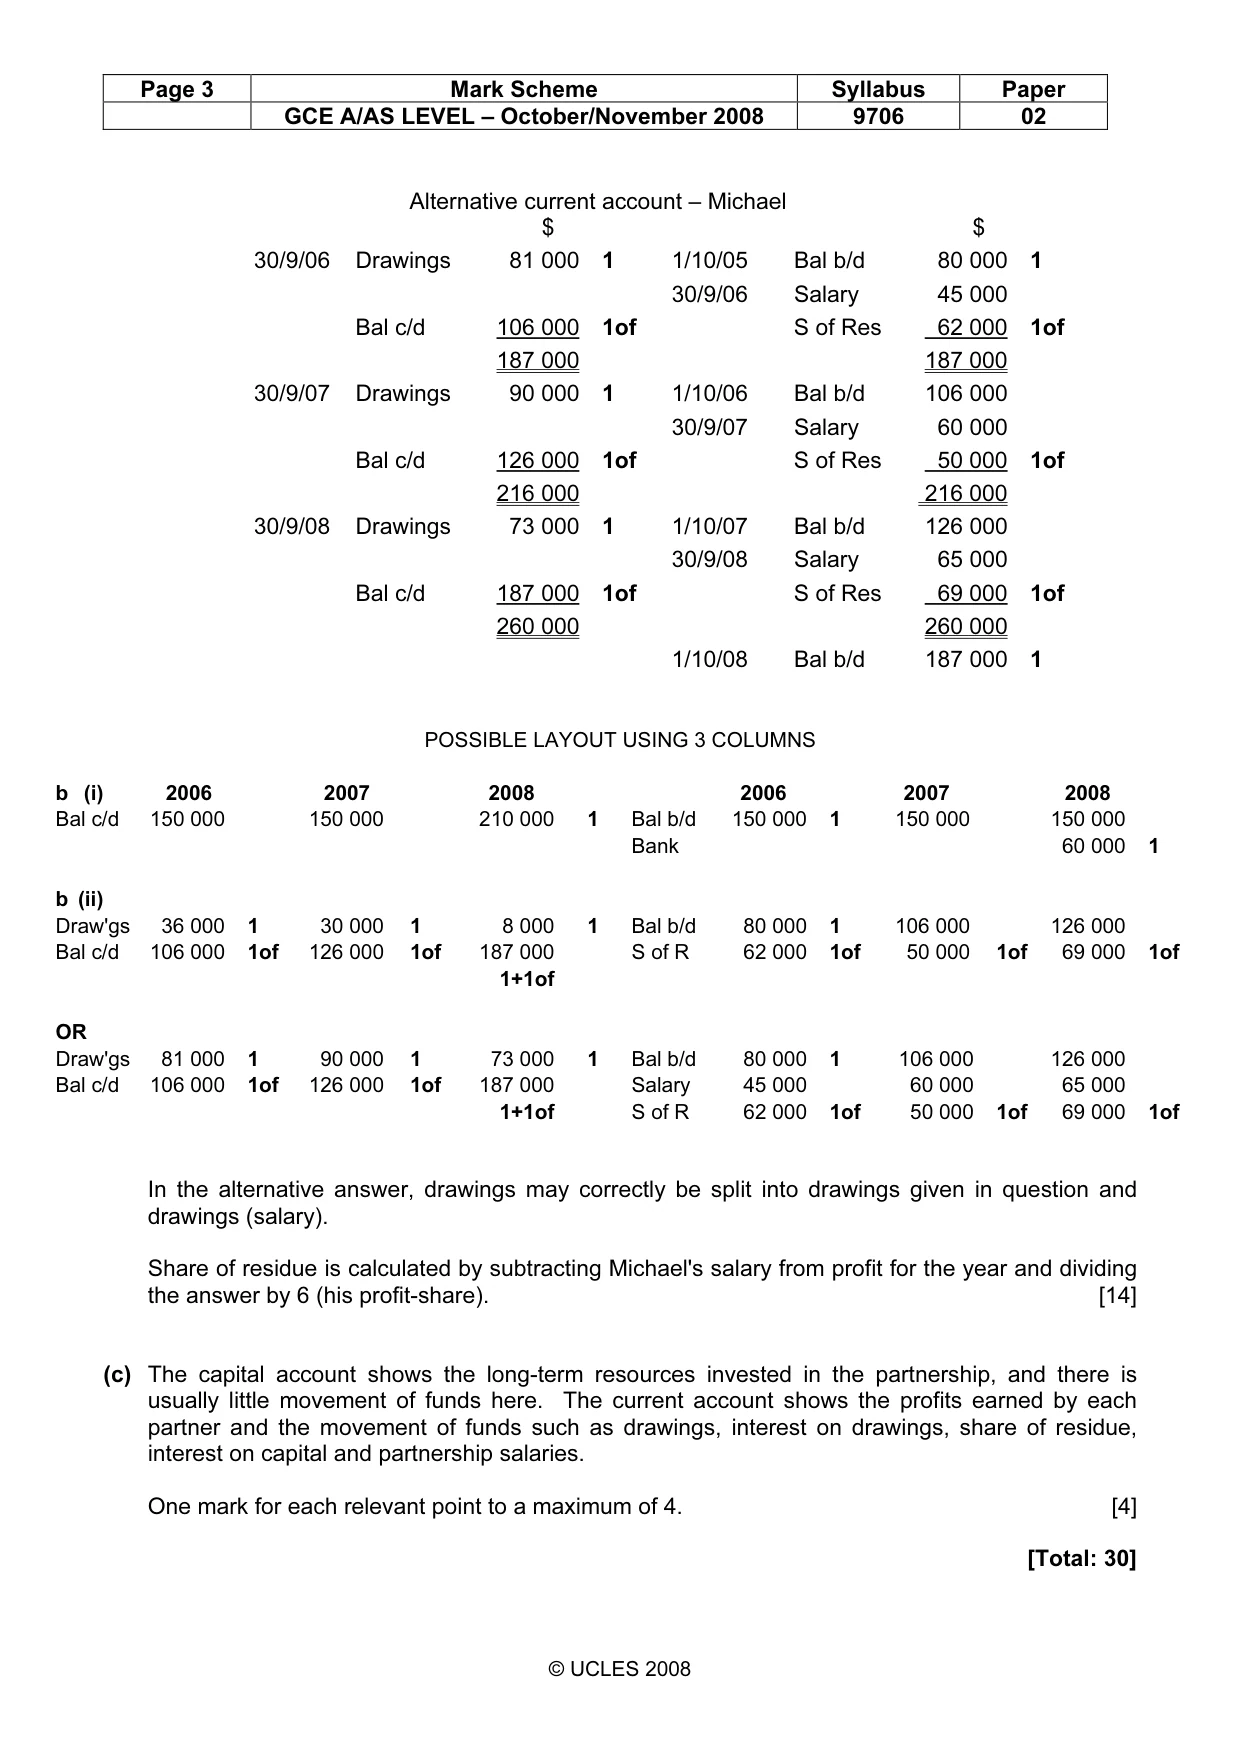
Page 3 Mark Scheme Syllabus Paper GCE A/AS LEVEL – October/November 2008 9706 02 © UCLES 2008 Alternative current account – Michael $ $ 30/9/06 Drawings 81 000 1 1/10/05 Bal b/d 80 000 1 30/9/06 Salary 45 000 Bal c/d 106 000 1of S of Res 62 000 1of 187 000 187 000 30/9/07 Drawings 90 000 1 1/10/06 Bal b/d 106 000 30/9/07 Salary 60 000 Bal c/d 126 000 1of S of Res 50 000 1of 216 000 216 000 30/9/08 Drawings 73 000 1 1/10/07 Bal b/d 126 000 30/9/08 Salary 65 000 Bal c/d 187 000 1of S of Res 69 000 1of 260 000 260 000 1/10/08 Bal b/d 187 000 1 POSSIBLE LAYOUT USING 3 COLUMNS b (i) 2006 2007 2008 2006 2007 2008 Bal c/d 150 000 150 000 210 000 1 Bal b/d 150 000 1 150 000 150 000 Bank 60 000 1 b (ii) Draw'gs 36 000 1 30 000 1 8 000 1 Bal b/d 80 000 1 106 000 126 000 Bal c/d 106 000 1of 126 000 1of 187 000 S of R 62 000 1of 50 000 1of 69 000 1of 1+1of OR Draw'gs 81 000 1 90 000 1 73 000 1 Bal b/d 80 000 1 106 000 126 000 Bal c/d 106 000 1of 126 000 1of 187 000 Salary 45 000 60 000 65 000 1+1of S of R 62 000 1of 50 000 1of 69 000 1of In the alternative answer, drawings may correctly be split into drawings given in question and drawings (salary). Share of residue is calculated by subtracting Michael's salary from profit for the year and dividing the answer by 6 (his profit-share). [14] (c) The capital account shows the long-term resources invested in the partnership, and there is usually little movement of funds here. The current account shows the profits earned by each partner and the movement of funds such as drawings, interest on drawings, share of residue, interest on capital and partnership salaries. One mark for each relevant point to a maximum of 4. [4] [Total: 30]
Mark scheme, page 4
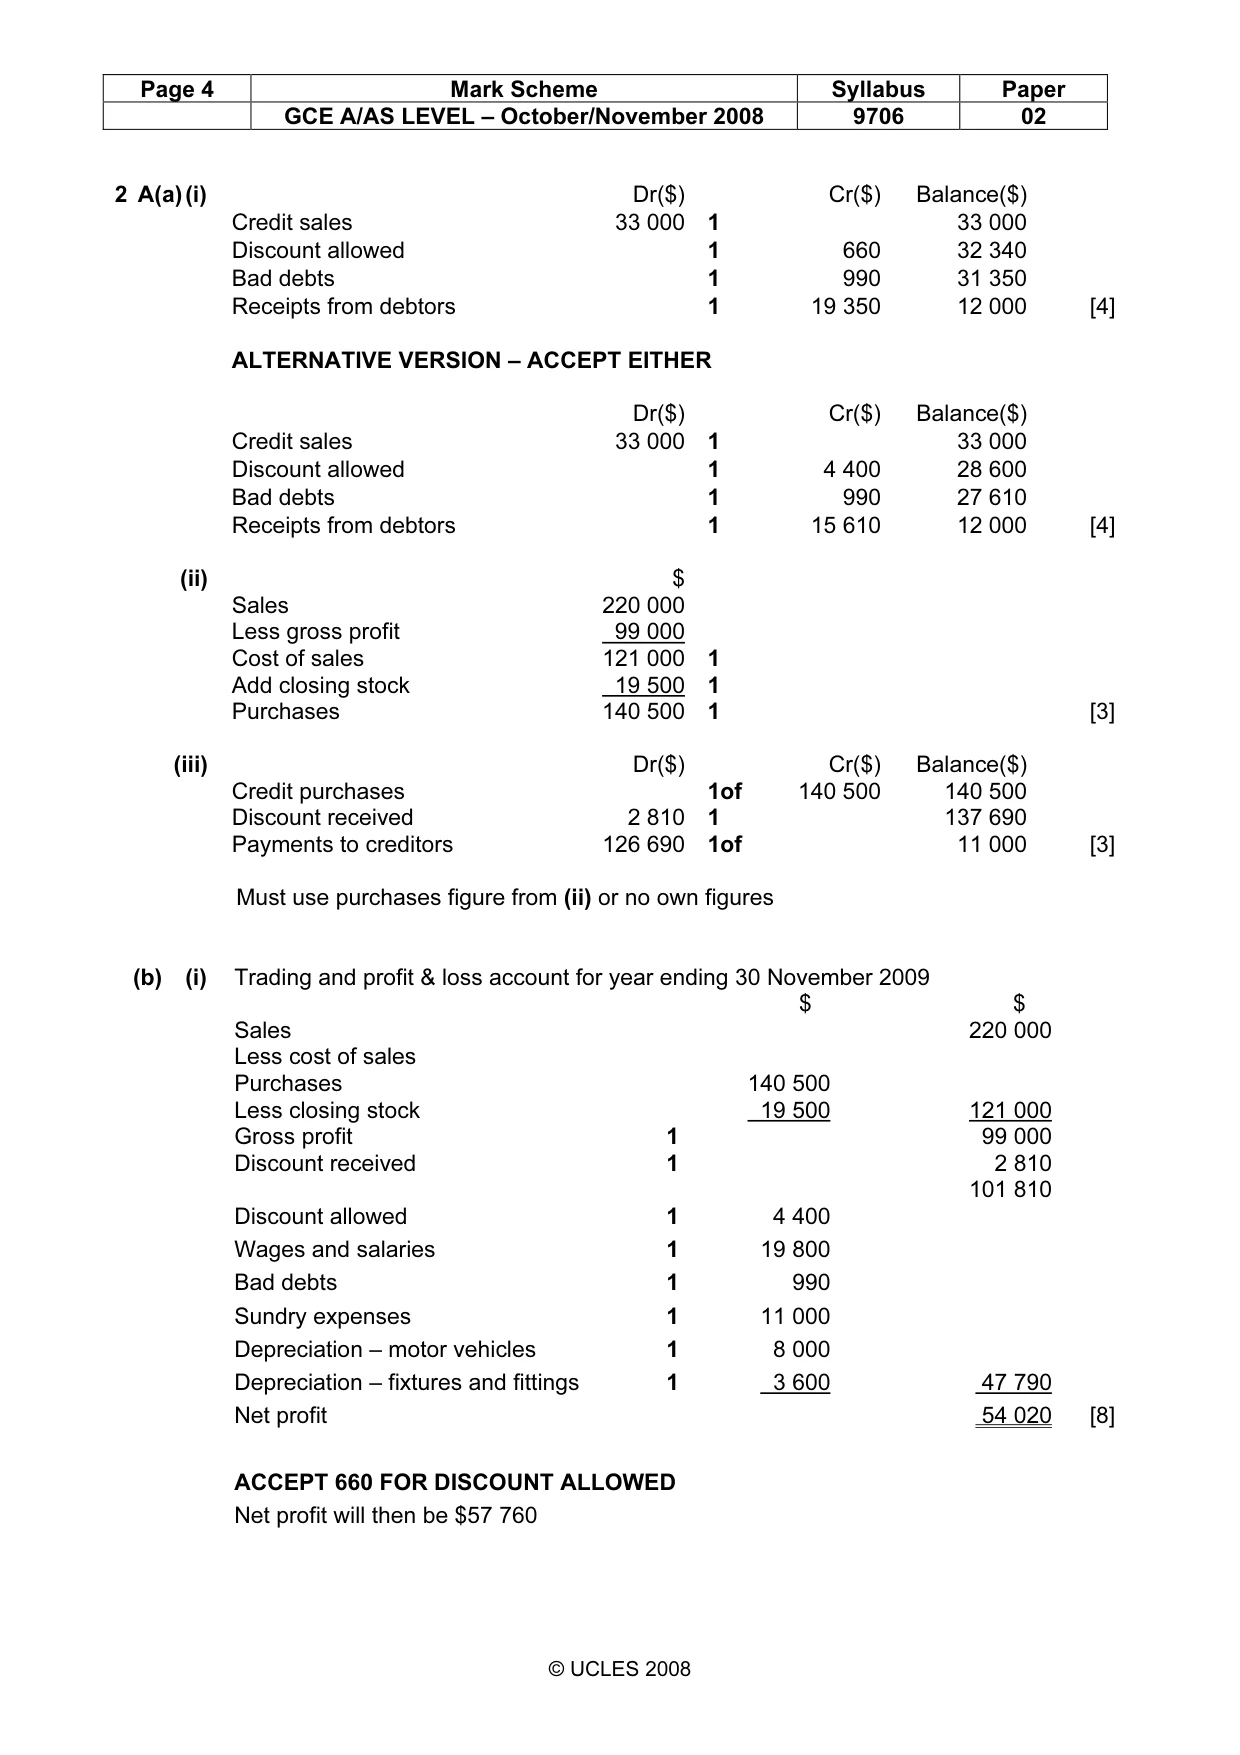
Page 4 Mark Scheme Syllabus Paper GCE A/AS LEVEL – October/November 2008 9706 02 © UCLES 2008 2 A(a) (i) Dr($) Cr($) Balance($) Credit sales 33 000 1 33 000 Discount allowed 1 660 32 340 Bad debts 1 990 31 350 Receipts from debtors 1 19 350 12 000 [4] ALTERNATIVE VERSION – ACCEPT EITHER Dr($) Cr($) Balance($) Credit sales 33 000 1 33 000 Discount allowed 1 4 400 28 600 Bad debts 1 990 27 610 Receipts from debtors 1 15 610 12 000 [4] (ii) $ Sales 220 000 Less gross profit 99 000 Cost of sales 121 000 1 Add closing stock 19 500 1 Purchases 140 500 1 [3] (iii) Dr($) Cr($) Balance($) Credit purchases 1of 140 500 140 500 Discount received 2 810 1 137 690 Payments to creditors 126 690 1of 11 000 [3] Must use purchases figure from (ii) or no own figures (b) (i) Trading and profit & loss account for year ending 30 November 2009 $ $ Sales 220 000 Less cost of sales Purchases 140 500 Less closing stock 19 500 121 000 Gross profit 1 99 000 Discount received 1 2 810 101 810 Discount allowed 1 4 400 Wages and salaries 1 19 800 Bad debts 1 990 Sundry expenses 1 11 000 Depreciation – motor vehicles 1 8 000 Depreciation – fixtures and fittings 1 3 600 47 790 Net profit 54 020 [8] ACCEPT 660 FOR DISCOUNT ALLOWED Net profit will then be $57 760
Mark scheme, page 5
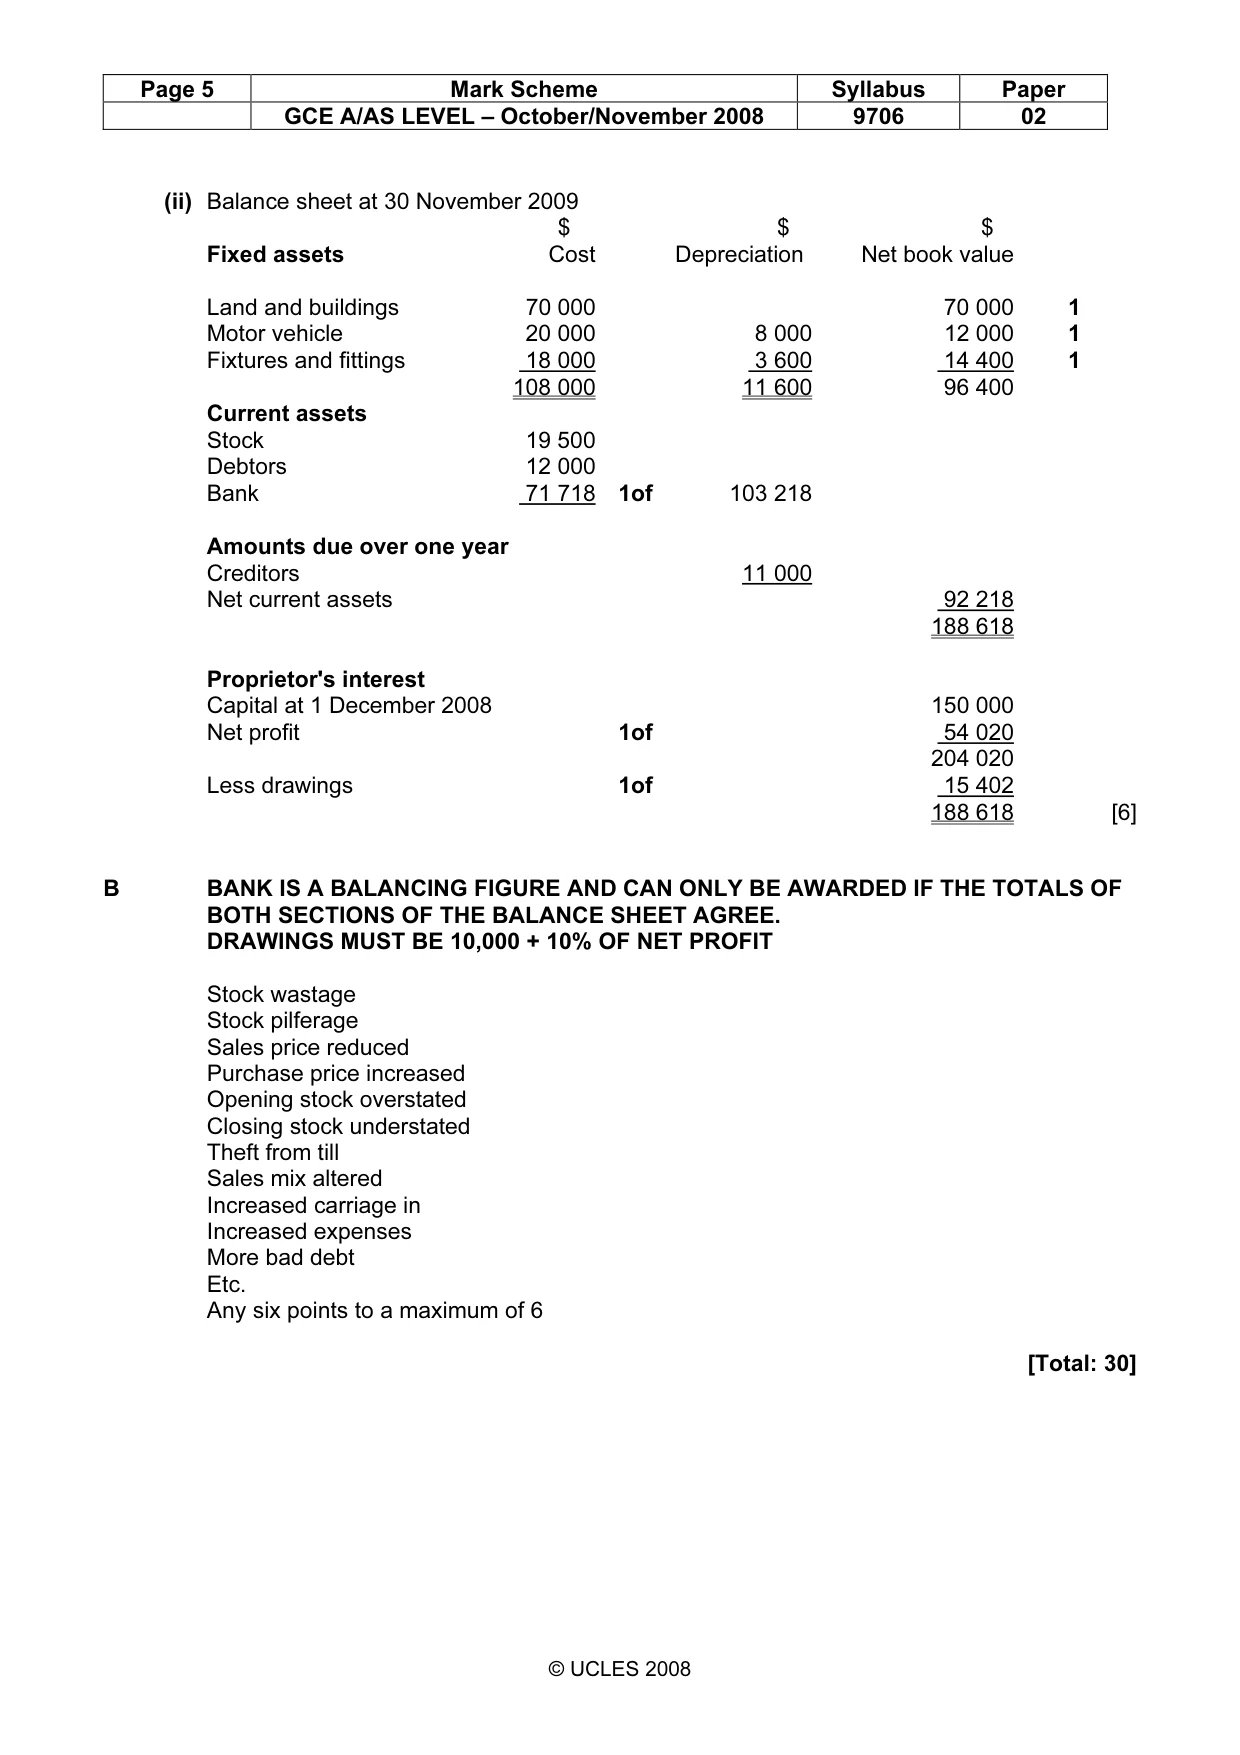
Page 5 Mark Scheme Syllabus Paper GCE A/AS LEVEL – October/November 2008 9706 02 © UCLES 2008 (ii) Balance sheet at 30 November 2009 $ $ $ Fixed assets Cost Depreciation Net book value Land and buildings 70 000 70 000 1 Motor vehicle 20 000 8 000 12 000 1 Fixtures and fittings 18 000 3 600 14 400 1 108 000 11 600 96 400 Current assets Stock 19 500 Debtors 12 000 Bank 71 718 1of 103 218 Amounts due over one year Creditors 11 000 Net current assets 92 218 188 618 Proprietor's interest Capital at 1 December 2008 150 000 Net profit 1of 54 020 204 020 Less drawings 1of 15 402 188 618 [6] B BANK IS A BALANCING FIGURE AND CAN ONLY BE AWARDED IF THE TOTALS OF BOTH SECTIONS OF THE BALANCE SHEET AGREE. DRAWINGS MUST BE 10,000 + 10% OF NET PROFIT Stock wastage Stock pilferage Sales price reduced Purchase price increased Opening stock overstated Closing stock understated Theft from till Sales mix altered Increased carriage in Increased expenses More bad debt Etc. Any six points to a maximum of 6 [Total: 30]
Mark scheme, page 6
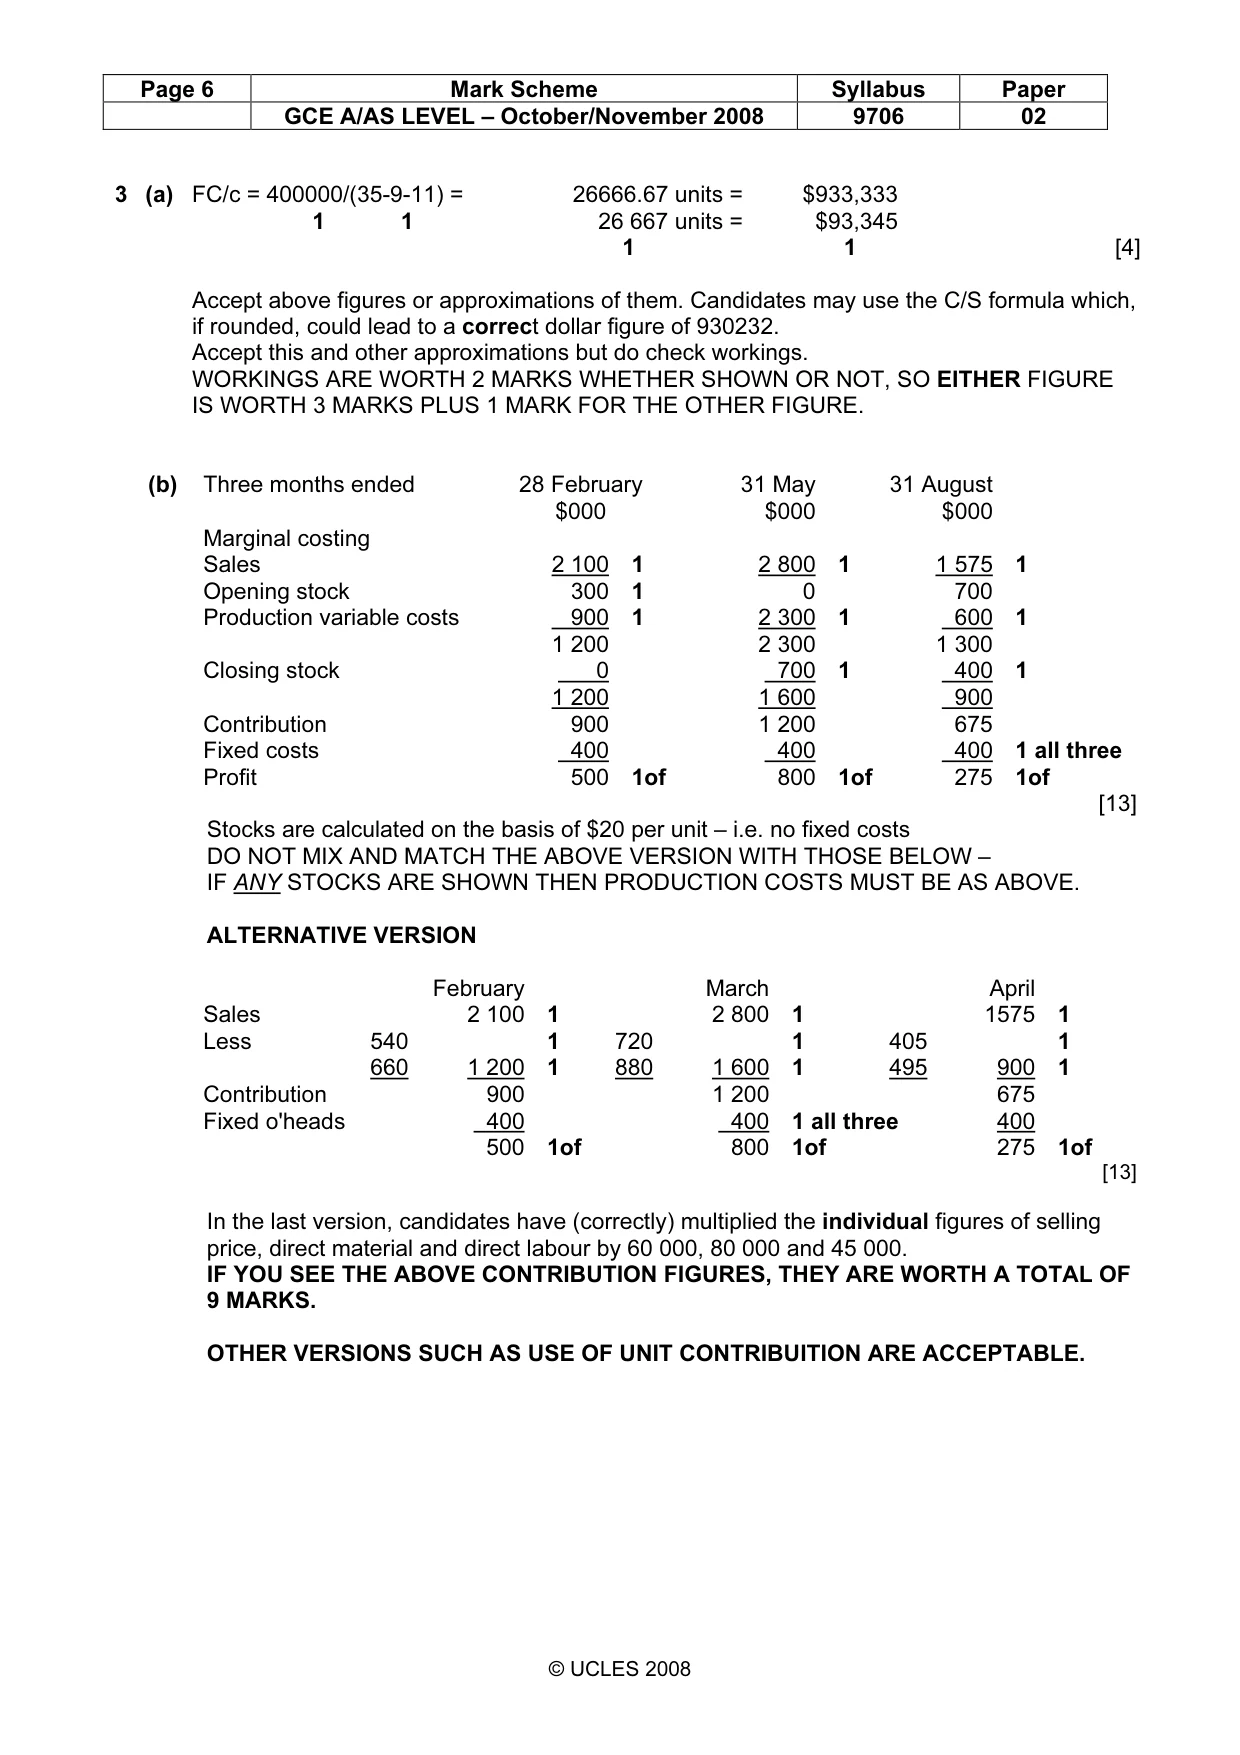
Page 6 Mark Scheme Syllabus Paper GCE A/AS LEVEL – October/November 2008 9706 02 © UCLES 2008 3 (a) FC/c = 400000/(35-9-11) = 26666.67 units = $933,333 1 1 26 667 units = $93,345 1 1 [4] Accept above figures or approximations of them. Candidates may use the C/S formula which, if rounded, could lead to a correct dollar figure of 930232. Accept this and other approximations but do check workings. WORKINGS ARE WORTH 2 MARKS WHETHER SHOWN OR NOT, SO EITHER FIGURE IS WORTH 3 MARKS PLUS 1 MARK FOR THE OTHER FIGURE. (b) Three months ended 28 February 31 May 31 August $000 $000 $000 Marginal costing Sales 2 100 1 2 800 1 1 575 1 Opening stock 300 1 0 700 Production variable costs 900 1 2 300 1 600 1 1 200 2 300 1 300 Closing stock 0 700 1 400 1 1 200 1 600 900 Contribution 900 1 200 675 Fixed costs 400 400 400 1 all three Profit 500 1of 800 1of 275 1of [13] Stocks are calculated on the basis of $20 per unit – i.e. no fixed costs DO NOT MIX AND MATCH THE ABOVE VERSION WITH THOSE BELOW – IF ANY STOCKS ARE SHOWN THEN PRODUCTION COSTS MUST BE AS ABOVE. ALTERNATIVE VERSION February March April Sales 2 100 1 2 800 1 1575 1 Less 540 1 720 1 405 1 660 1 200 1 880 1 600 1 495 900 1 Contribution 900 1 200 675 Fixed o'heads 400 400 1 all three 400 500 1of 800 1of 275 1of [13] In the last version, candidates have (correctly) multiplied the individual figures of selling price, direct material and direct labour by 60 000, 80 000 and 45 000. IF YOU SEE THE ABOVE CONTRIBUTION FIGURES, THEY ARE WORTH A TOTAL OF 9 MARKS. OTHER VERSIONS SUCH AS USE OF UNIT CONTRIBUITION ARE ACCEPTABLE.
Mark scheme, page 7
Page 7 Mark Scheme Syllabus Paper GCE A/AS LEVEL – October/November 2008 9706 02 © UCLES 2008 (c) Absorption costing Sales 2 100 2 800 1 575 Opening stock 375 1 0 875 Production variable costs 900 2 300 600 1 of all three Fixed costs 400 400 400 1 675 2 700 1 875 Closing stock 0 875 1 500 1 1 675 1 825 1 375 Profit 425 1of 975 1of 200 1of Stocks are calculated on the basis of $20 variable + $5 fixed costs = $25 per unit. [7] OTHER METHODS ARE ACCEPTABLE (d) Reconciliation Profit per marginal costing 500 800 275 + overhead in closing stock 0 1 175 1 100 1 500 975 375 – overhead in opening stock 75 1 0 1 175 1 Profit per absorption costing 425 975 200 Candidates may correctly reverse the order, i.e. deduct closing stock first. [6] [Total: 30]
What you needed in this session
Cambridge’s own grade thresholds for 2008 Oct/Nov, Paper 2 · Variant 1. A higher threshold means an easier paper — the bar moves with how the cohort did.