Cambridge A Level Accounting 9706 — 2002 Oct/Nov Paper 2 · Variant 1
9706/21/O/N/02
The question paper and its mark scheme, free to read here and free to download. This is Cambridge’s own paper, exactly as it was sat.
Question paper12 pages
Mark scheme5 pages
Answers below. Sit the paper first if you are practising.
Paper as text
Question paper, page 1
This question paper consists of 11 printed pages and 1 lined page. SPA (SC/KS) S18227/4 © CIE 2002 [Turn over CAMBRIDGE INTERNATIONAL EXAMINATIONS General Certificate of Education Advanced Subsidiary Level and Advanced Level ACCOUNTING 9706/2 PAPER 2 Structured Questions (Core) OCTOBER/NOVEMBER SESSION 2002 1 hour 30 minutes Candidates answer on the question paper. No additional materials are required. TIME 1 hour 30 minutes INSTRUCTIONS TO CANDIDATES Write your name, Centre number and candidate number in the spaces at the top of this page. Answer all questions. Write your answers in the spaces provided on the question paper. If you require extra space for your answers or workings, use page 9. INFORMATION FOR CANDIDATES The number of marks is given in brackets [ ] at the end of each question or part question. You may use a calculator. Candidate Centre Number Number Candidate Name FOR EXAMINER’S USE 1 2 3 TOTAL
Question paper, page 2
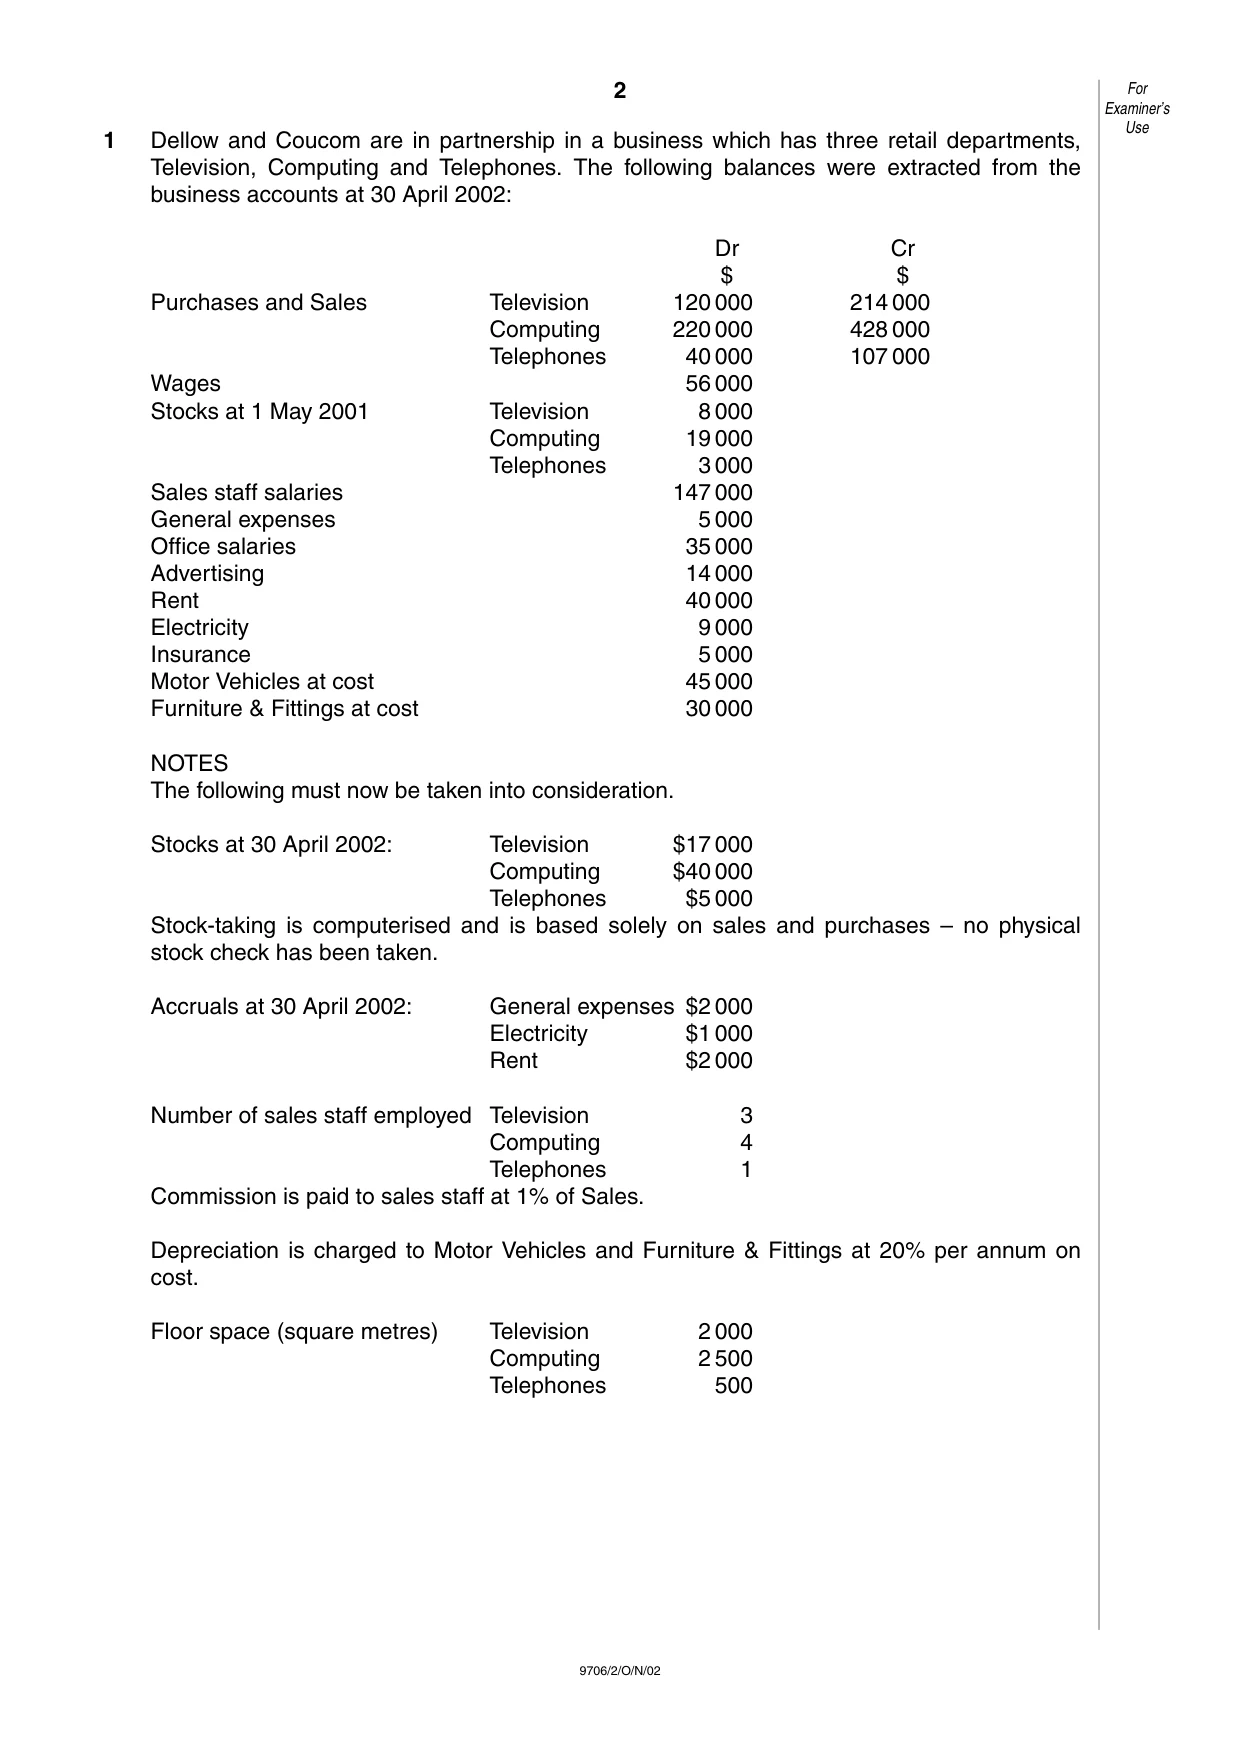
2 9706/2/O/N/02 1 Dellow and Coucom are in partnership in a business which has three retail departments, Television, Computing and Telephones. The following balances were extracted from the business accounts at 30 April 2002: Dr Cr $ $ Purchases and Sales Television 120 000 214 000 Computing 220 000 428 000 Telephones 40 000 107 000 Wages 56 000 Stocks at 1 May 2001 Television 8 000 Computing 19 000 Telephones 3 000 Sales staff salaries 147 000 General expenses 5 000 Office salaries 35 000 Advertising 14 000 Rent 40 000 Electricity 9 000 Insurance 5 000 Motor Vehicles at cost 45 000 Furniture & Fittings at cost 30 000 NOTES The following must now be taken into consideration. Stocks at 30 April 2002: Television $17 000 Computing $40 000 Telephones $5 000 Stock-taking is computerised and is based solely on sales and purchases – no physical stock check has been taken. Accruals at 30 April 2002: General expenses $2 000 Electricity $1 000 Rent $2 000 Number of sales staff employed Television 3 Computing 4 Telephones 1 Commission is paid to sales staff at 1% of Sales. Depreciation is charged to Motor Vehicles and Furniture & Fittings at 20% per annum on cost. Floor space (square metres) Television 2 000 Computing 2 500 Telephones 500 For Examiner’s Use
Question paper, page 3
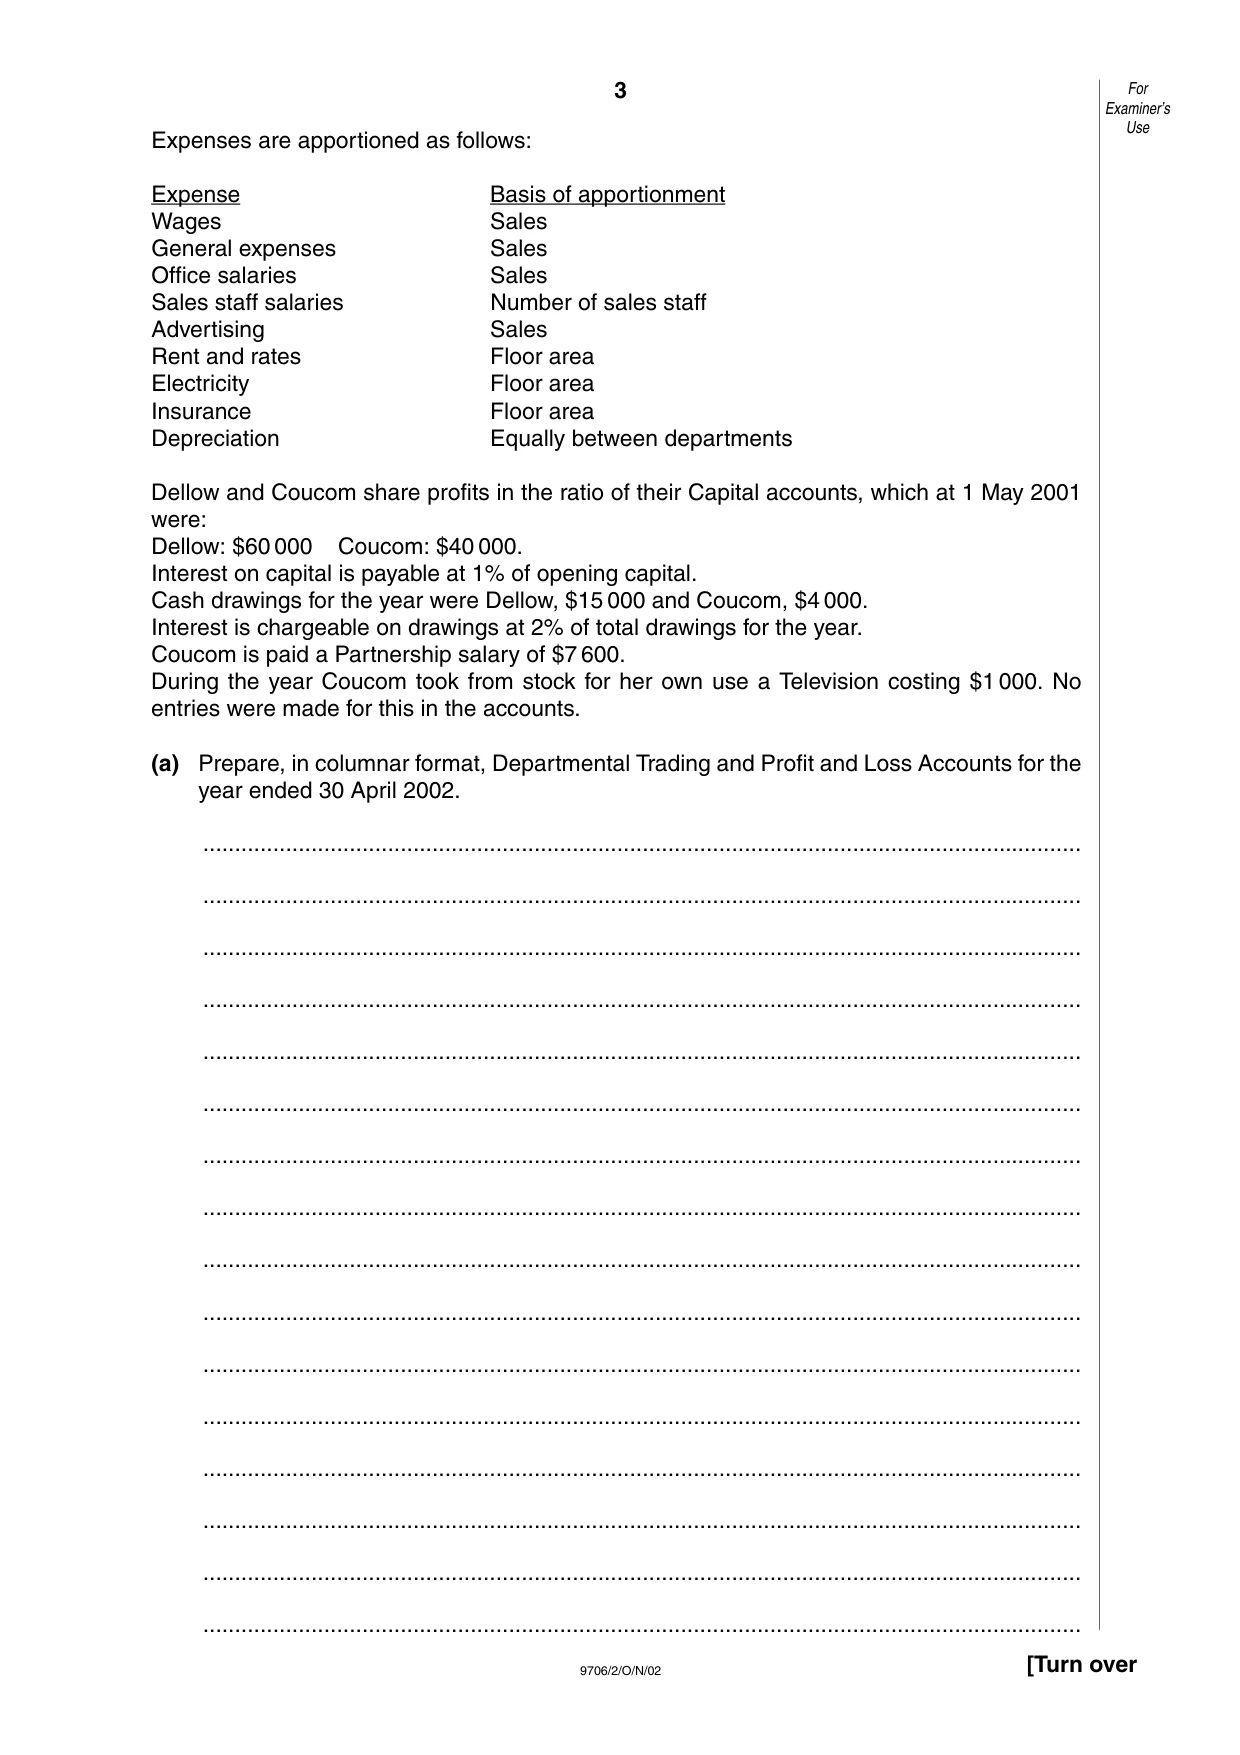
3 9706/2/O/N/02 [Turn over Expenses are apportioned as follows: Expense Basis of apportionment Wages Sales General expenses Sales Office salaries Sales Sales staff salaries Number of sales staff Advertising Sales Rent and rates Floor area Electricity Floor area Insurance Floor area Depreciation Equally between departments Dellow and Coucom share profits in the ratio of their Capital accounts, which at 1 May 2001 were: Dellow: $60 000 Coucom: $40 000. Interest on capital is payable at 1% of opening capital. Cash drawings for the year were Dellow, $15 000 and Coucom, $4 000. Interest is chargeable on drawings at 2% of total drawings for the year. Coucom is paid a Partnership salary of $7 600. During the year Coucom took from stock for her own use a Television costing $1 000. No entries were made for this in the accounts. (a) Prepare, in columnar format, Departmental Trading and Profit and Loss Accounts for the year ended 30 April 2002. … … … … … … … … … … … … … … … … For Examiner’s Use
Question paper, page 4
4 9706/2/O/N/02 … … … … … … … … … … … … … … …[21] (b) Prepare the Partnership Appropriation Account for the year ended 30 April 2002. … … … … … … … … … … … …[7] For Examiner’s Use
Question paper, page 5
5 9706/2/O/N/02 [Turn over (c) It has been suggested that any department that is making a loss should be closed. Comment on this suggestion. … … … … … …[2] For Examiner’s Use
Question paper, page 6
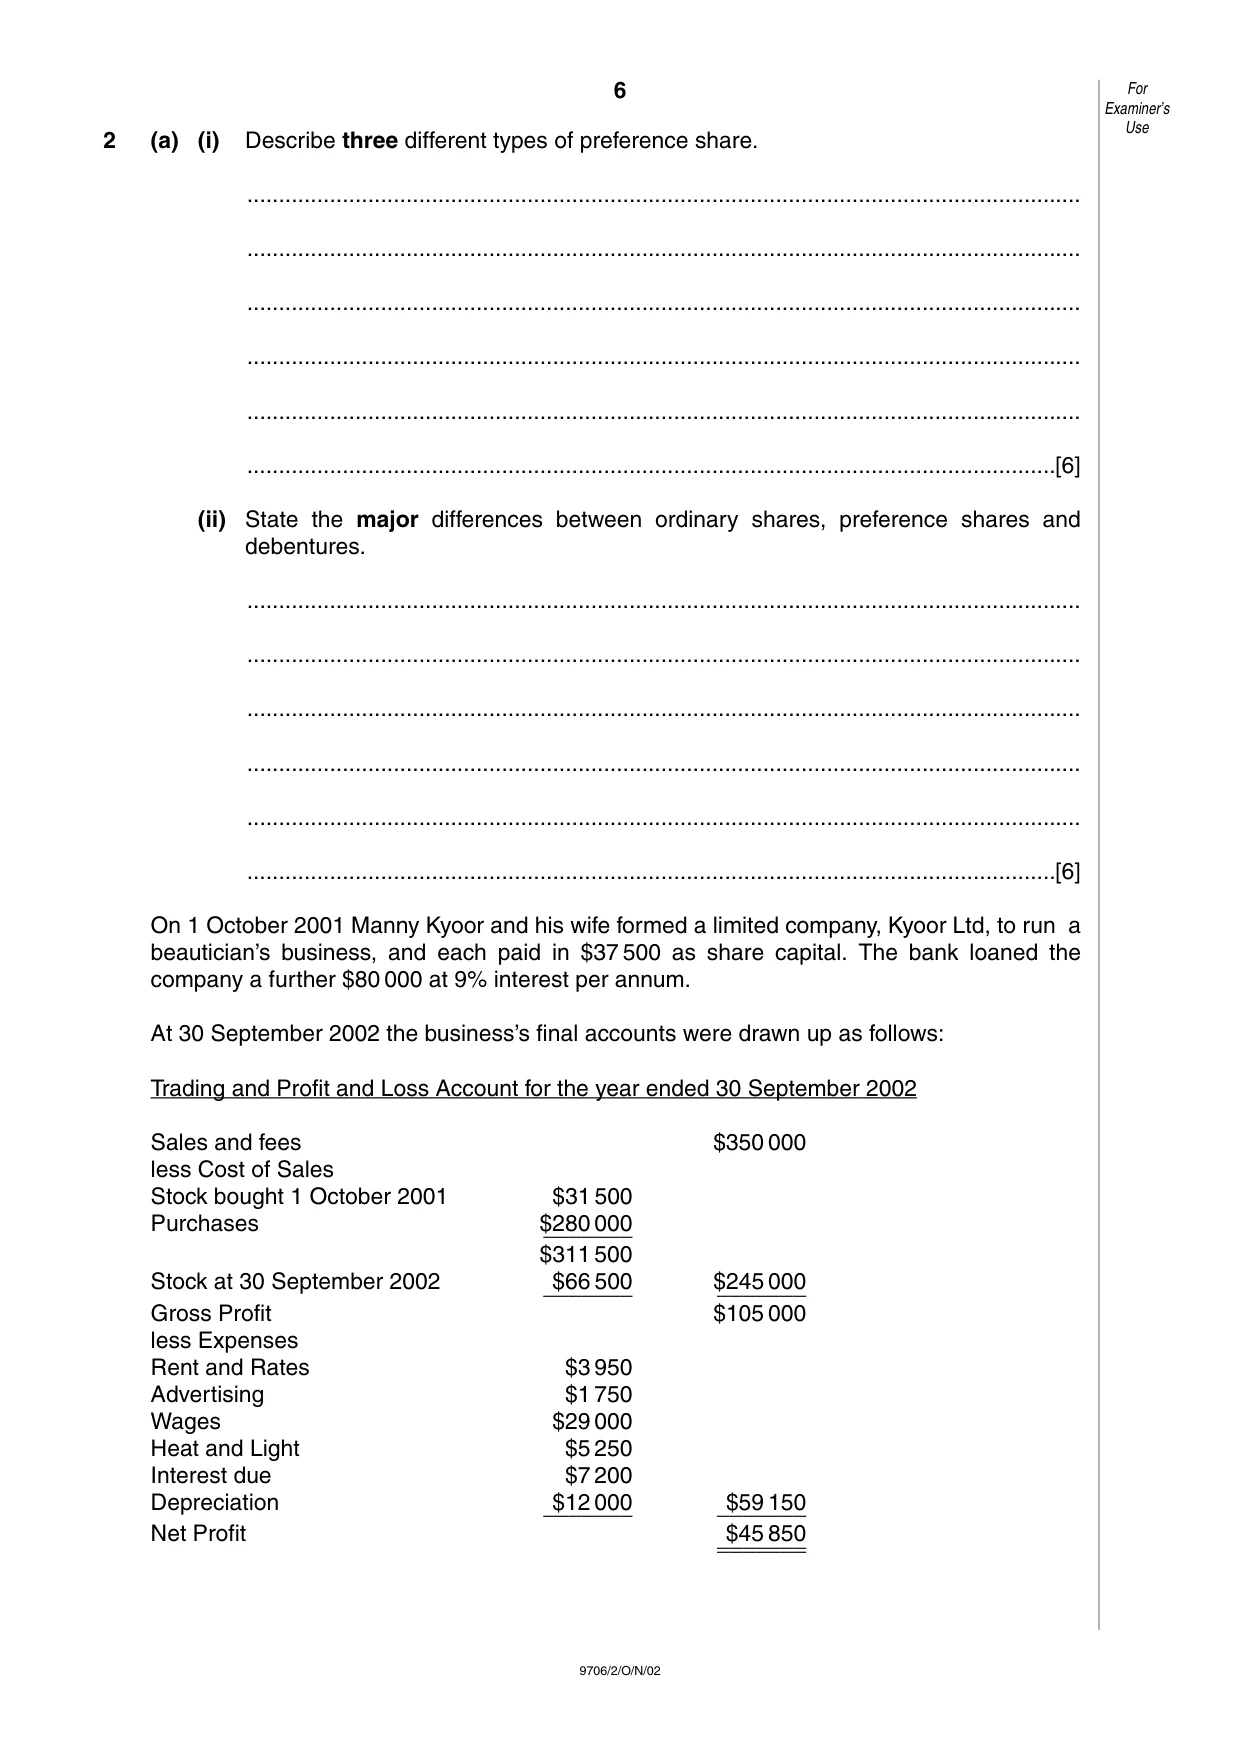
6 9706/2/O/N/02 2 (a) (i) Describe three different types of preference share. … … … … … …[6] (ii) State the major differences between ordinary shares, preference shares and debentures. … … … … … …[6] On 1 October 2001 Manny Kyoor and his wife formed a limited company, Kyoor Ltd, to run a beautician’s business, and each paid in $37 500 as share capital. The bank loaned the company a further $80 000 at 9% interest per annum. At 30 September 2002 the business’s final accounts were drawn up as follows: Trading and Profit and Loss Account for the year ended 30 September 2002 Sales and fees $350 000 less Cost of Sales Stock bought 1 October 2001 $31 500 Purchases $280 000 _______ $311 500 Stock at 30 September 2002 $66 500 $245 000 _______ _______ Gross Profit $105 000 less Expenses Rent and Rates $3 950 Advertising $1 750 Wages $29 000 Heat and Light $5 250 Interest due $7 200 Depreciation $12 000 $59 150 _______ _______ Net Profit $45 850 _______ _______ For Examiner’s Use
Question paper, page 7
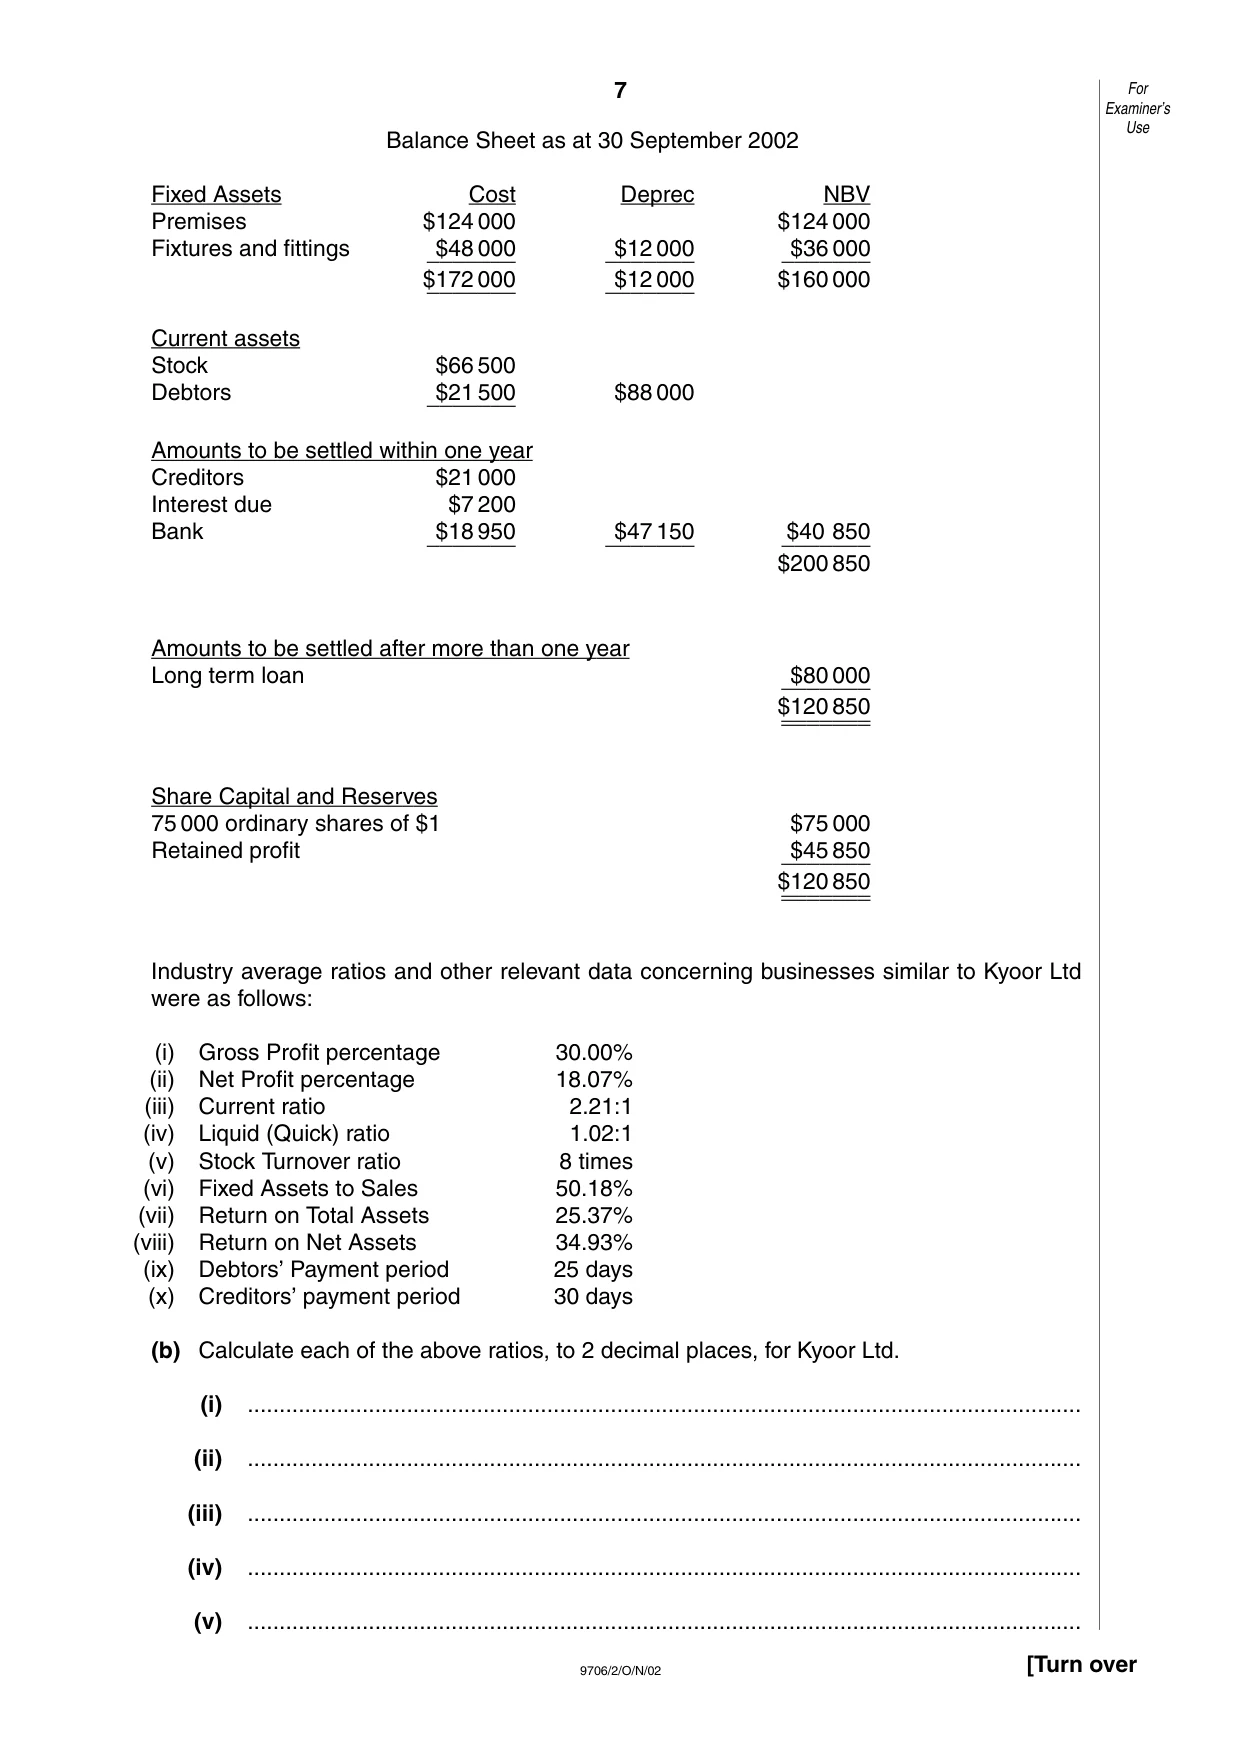
7 9706/2/O/N/02 [Turn over Balance Sheet as at 30 September 2002 Fixed Assets Cost Deprec NBV Premises $124 000 $124 000 Fixtures and fittings $48 000 $12 000 $36 000 _______ _______ _______ $172 000 $12 000 $160 000 _______ _______ Current assets Stock $66 500 Debtors $21 500 $88 000 _______ Amounts to be settled within one year Creditors $21 000 Interest due $7 200 Bank $18 950 $47 150 $40 850 _______ _______ _______ $200 850 Amounts to be settled after more than one year Long term loan $80 000 _______ $120 850 _______ _______ Share Capital and Reserves 75 000 ordinary shares of $1 $75 000 Retained profit $45 850 _______ $120 850 _______ _______ Industry average ratios and other relevant data concerning businesses similar to Kyoor Ltd were as follows: (i) Gross Profit percentage 30.00% (ii) Net Profit percentage 18.07% (iii) Current ratio 2.21:1 (iv) Liquid (Quick) ratio 1.02:1 (v) Stock Turnover ratio 8 times (vi) Fixed Assets to Sales 50.18% (vii) Return on Total Assets 25.37% (viii) Return on Net Assets 34.93% (ix) Debtors’ Payment period 25 days (x) Creditors’ payment period 30 days (b) Calculate each of the above ratios, to 2 decimal places, for Kyoor Ltd. (i) … (ii) … (iii) … (iv) … (v) … For Examiner’s Use
Question paper, page 8
8 9706/2/O/N/02 (vi) … (vii) … (viii) … (ix) … (x) … [10] (c) Comment on the business’s performance in the light of the data for the industry. NOTE: It is not sufficient to say that a ratio is ‘higher’ or ‘lower’ than the industry average – it must be made clear whether you think it is better or worse than the industry average and you must give reasons for your comments. … … … … … … … … … … …[8] For Examiner’s Use
Question paper, page 9
9 9706/2/O/N/02 [Turn over You may use this page for your workings. … … … … … … … … … … … … … … … … … … … … … … … … … … … For Examiner’s Use
Question paper, page 10
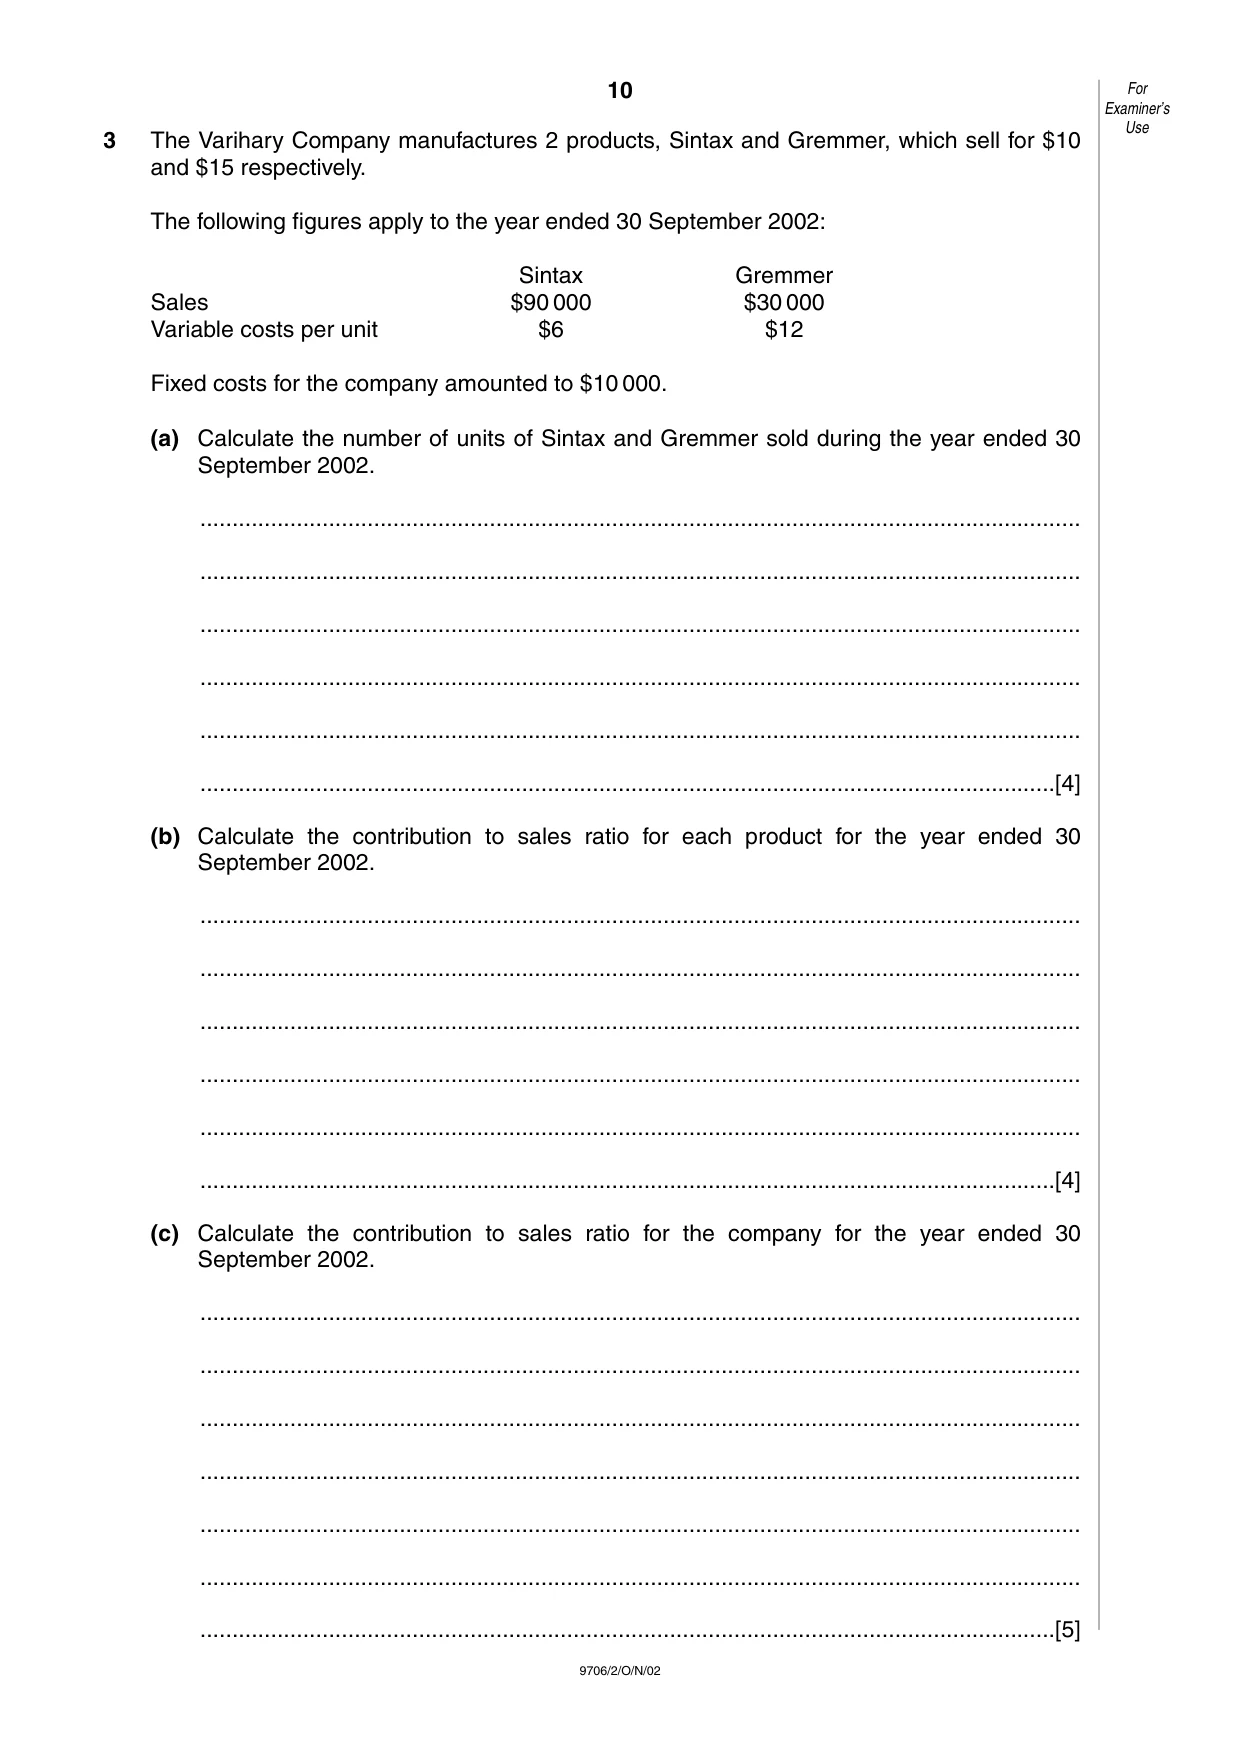
10 9706/2/O/N/02 3 The Varihary Company manufactures 2 products, Sintax and Gremmer, which sell for $10 and $15 respectively. The following figures apply to the year ended 30 September 2002: Sintax Gremmer Sales $90 000 $30 000 Variable costs per unit $6 $12 Fixed costs for the company amounted to $10 000. (a) Calculate the number of units of Sintax and Gremmer sold during the year ended 30 September 2002. … … … … … …[4] (b) Calculate the contribution to sales ratio for each product for the year ended 30 September 2002. … … … … … …[4] (c) Calculate the contribution to sales ratio for the company for the year ended 30 September 2002. … … … … … … …[5] For Examiner’s Use
Question paper, page 11
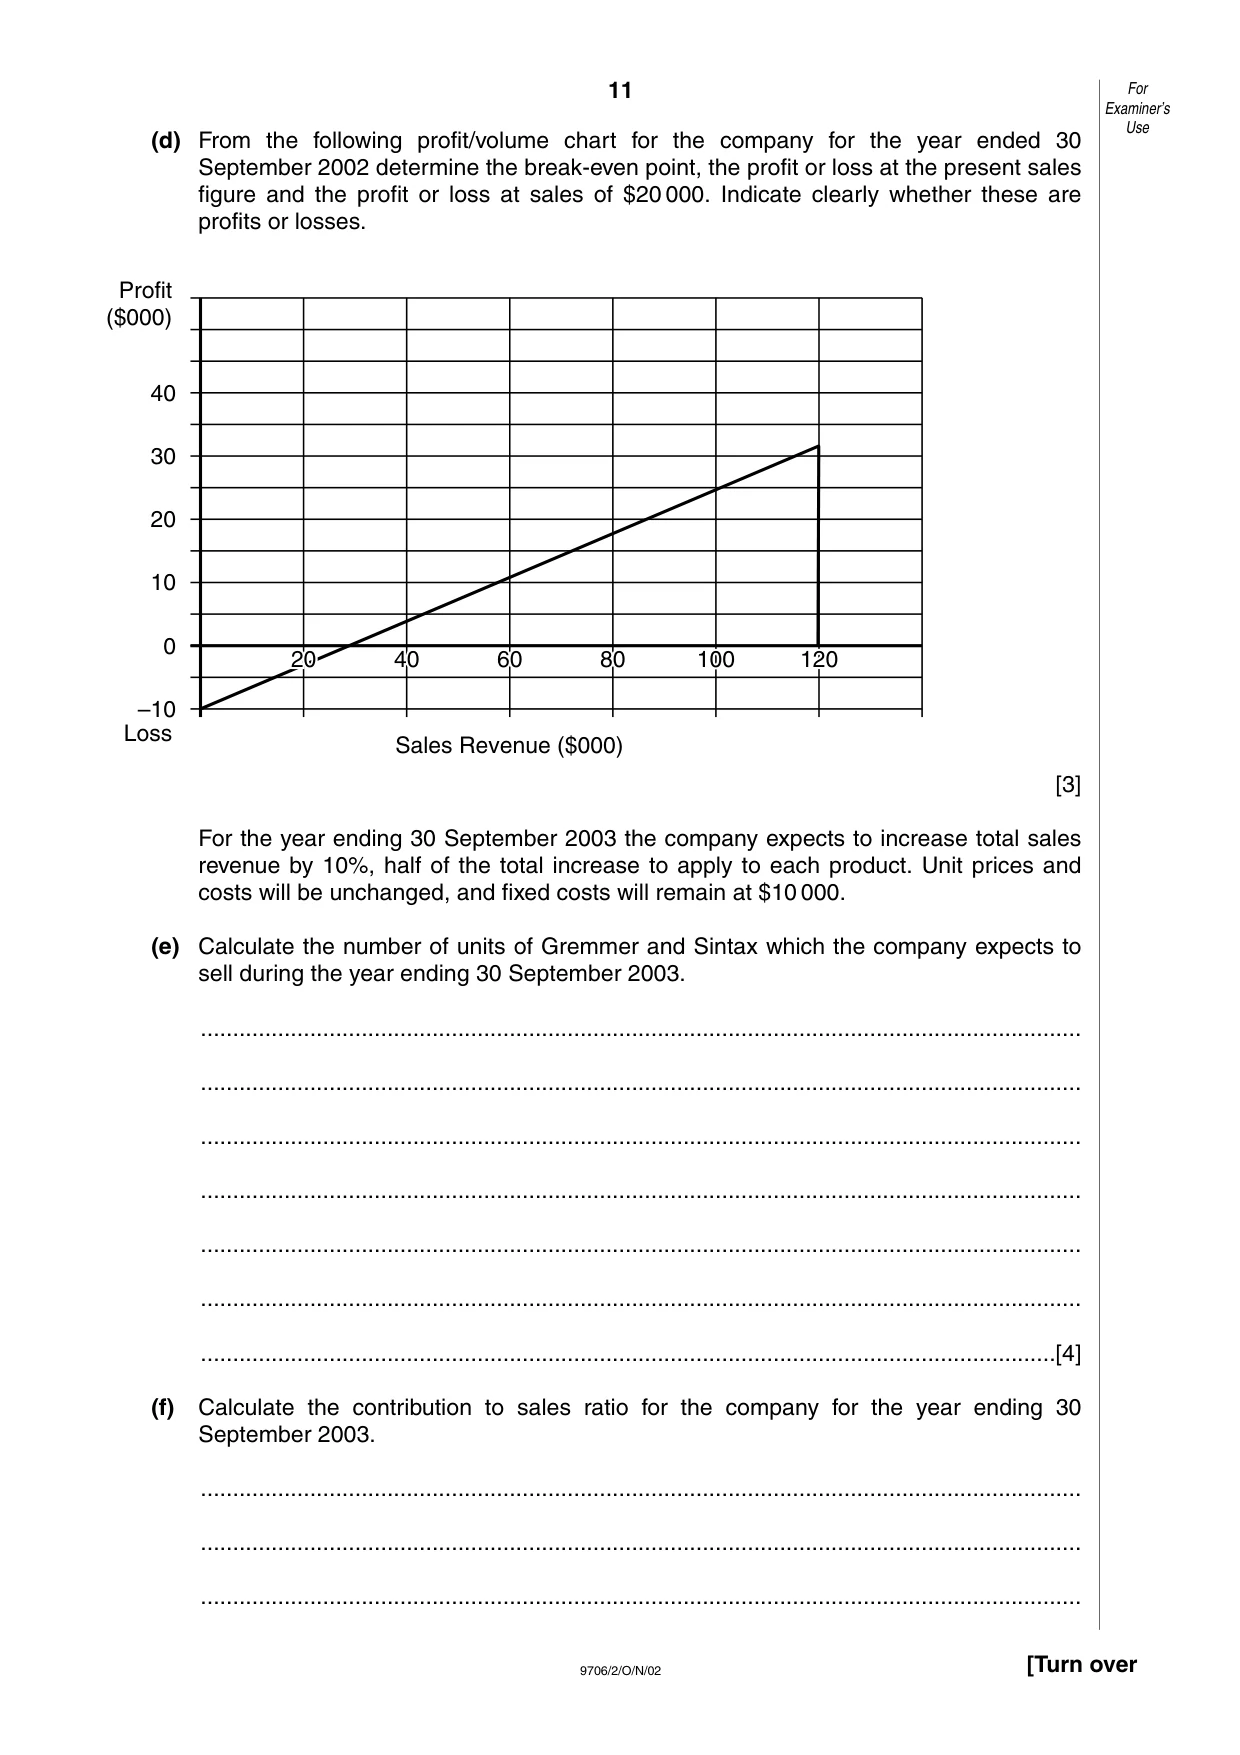
11 9706/2/O/N/02 [Turn over (d) From the following profit/volume chart for the company for the year ended 30 September 2002 determine the break-even point, the profit or loss at the present sales figure and the profit or loss at sales of $20 000. Indicate clearly whether these are profits or losses. [3] For the year ending 30 September 2003 the company expects to increase total sales revenue by 10%, half of the total increase to apply to each product. Unit prices and costs will be unchanged, and fixed costs will remain at $10 000. (e) Calculate the number of units of Gremmer and Sintax which the company expects to sell during the year ending 30 September 2003. … … … … … … …[4] (f) Calculate the contribution to sales ratio for the company for the year ending 30 September 2003. … … … –10 0 10 20 30 40 Profit ($000) Loss Sales Revenue ($000) 120 120 100 80 80 60 60 40 40 20 20 120 100 80 60 40 20 For Examiner’s Use
Question paper, page 12
12 9706/2/O/N/02 … … … …[7] (g) Draw a profit/volume chart for the company for year ended 30 September 2003, showing break-even point, and profit or loss at the expected sales figure and at sales of $60 000. [3] For Examiner’s Use
Mark scheme, page 1
CAMBRIDGE INTERNATIONAL EXAMINATIONS CAMBRIDGE INTERNATIONAL EXAMINATIONS General Certificate of Education Advanced Subsidiary and Advanced Level MARK SCHEME FOR the November 2002 question papers 9706 ACCOUNTING 9706/02 Paper 2 (Structured Questions), maximum raw mark 90 9706/04 Paper 4 (Problem Solving), maximum raw mark 120 These mark schemes are published as an aid to teachers and students, to indicate the requirements of the examination. They show the basis on which Examiners were initially instructed to award marks. They do not indicate the details of the discussions that took place at an Examiners’ meeting before marking began. Any substantial changes to the mark scheme that arose from these discussions will be recorded in the published Report on the Examination. All Examiners are instructed that alternative correct answers and unexpected approaches in candidates’ scripts must be given marks that fairly reflect the relevant knowledge and skills demonstrated. Mark schemes must be read in conjunction with the question papers and the Report on the Examination. e CIE will not enter into discussions or correspondence in connection with these mark schemes. CIE is publishing the mark schemes for the October/November 2002 question papers for most IGCSE, GCE Advanced Subsidiary (AS) and GCE Advanced (A) Level syllabuses. UNIversiry of CAMBRIDGE Local Examinations Syndicate
Mark scheme, page 2
CAMBRIDGE INTERNATIONAL EXAMINATIONS NOVEMBER 2002 GCE ADVANCED SUBSIDIARY AND ADVANCED LEVEL UNIVERSITY of CAMBRIDGE
Mark scheme, page 3
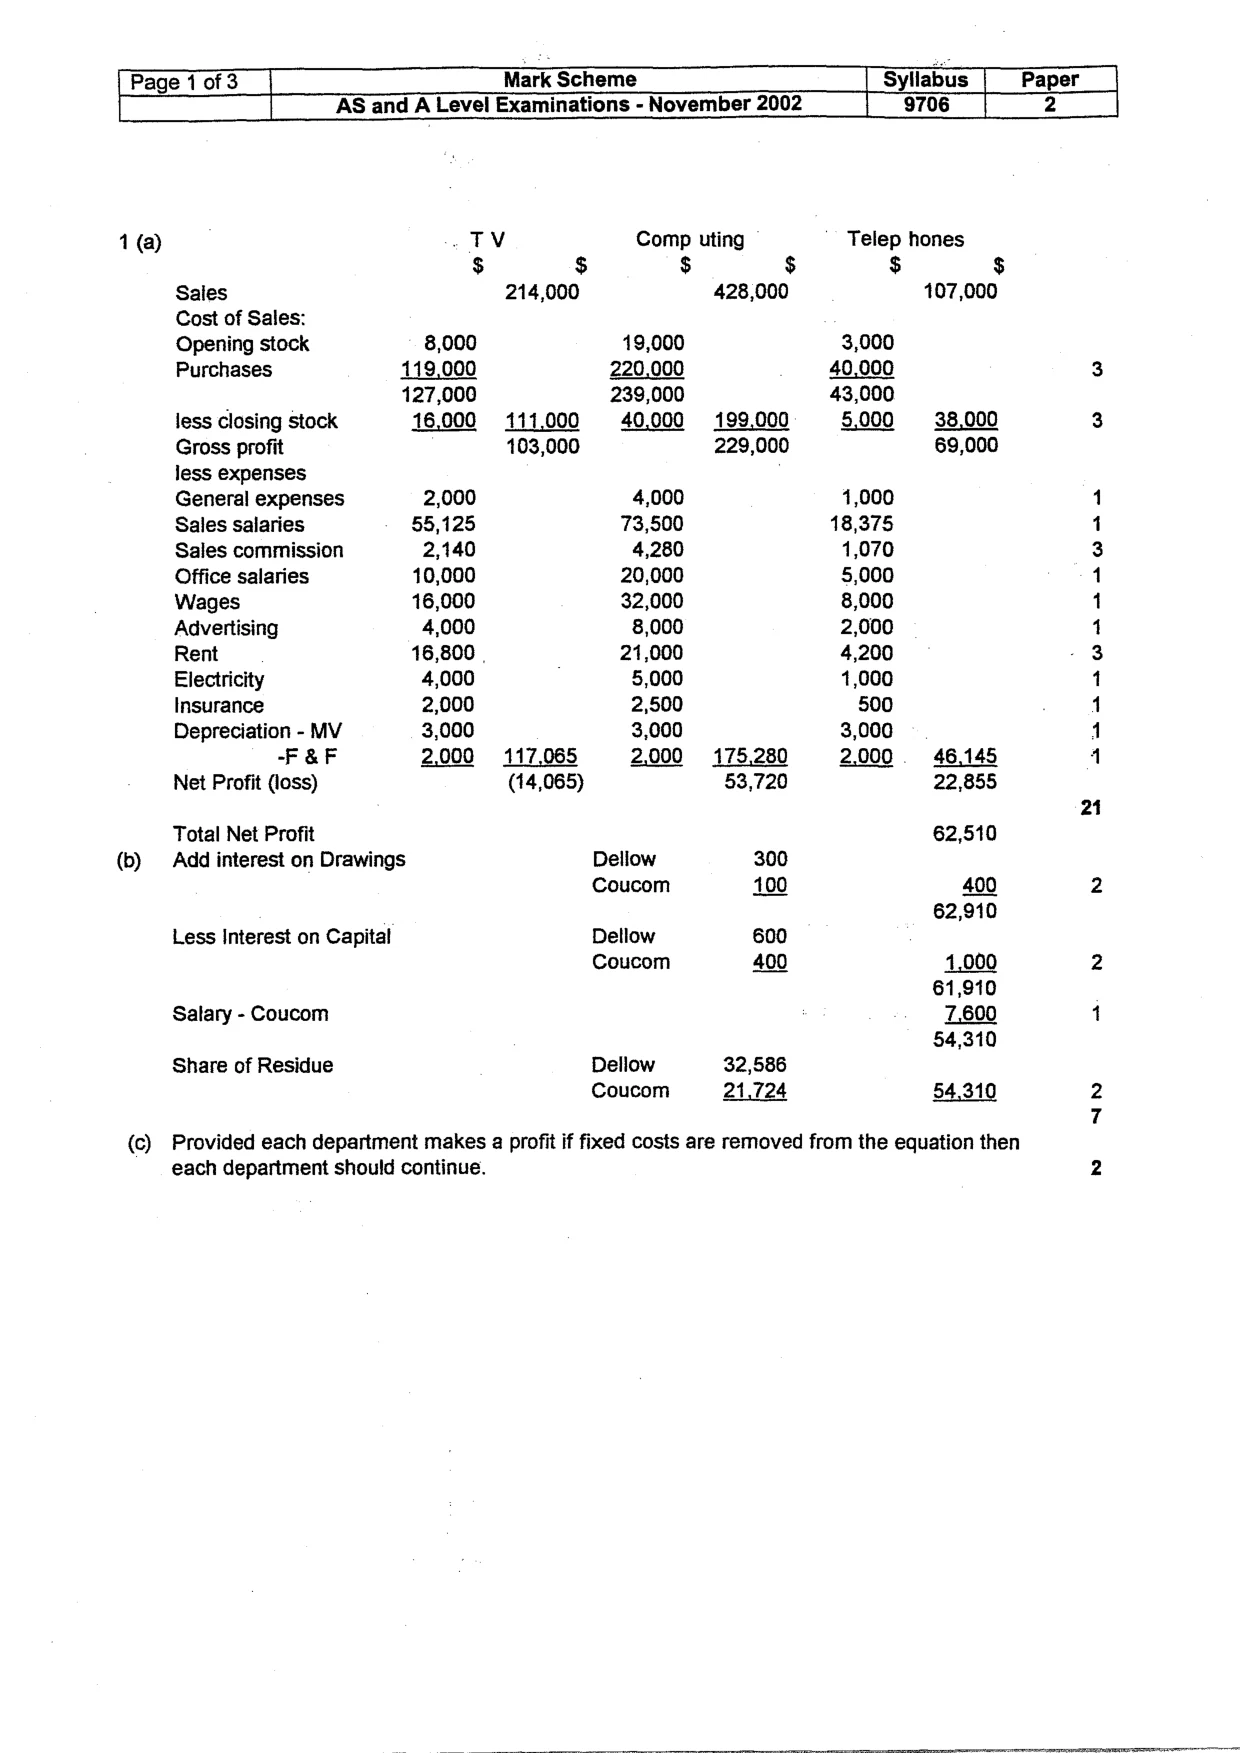
{ Page 1 of 3 Mark Scheme Syllabus Paper AS and A Level Examinations - November 2002 9706 2 1 (a) TV Comp uting Telep hones $ $ $ $ $ $ Sales 214,000 428,000 107,000 Cost of Sales: Opening stock 8,000 19,000 3,000 Purchases 119,000 220,000 40,000 3 127,000 239,000 43,000 Jess closing stock 16,000 111,000 40,000 199,000 5,000 38,000 3 Gross profit 103,000 229,000 69,000 less expenses General expenses 2,000 4,000 4,000 1 Sales salaries 55,125 73,500 18,375 1 Sales commission 2,140 4,280 1,070 3 Office salaries 10,000 20,000 5,000 1 Wages 16,000 32,000 8,000 1 Advertising 4,000 8,000 2,000 1 Rent 16,800 | 21,000 4,200 3 Electricity 4,000 5,000 1,000 1 Insurance 2,000 2,500 500 1 Depreciation - MV 3,000 3,000 3,000 4 F&F 2,000 117,065 2,000 175,280 2,000 46,145 4 Net Profit (loss) (14,065) 53,720 22,855 21 Total Net Profit 62,510 (b) Add interest on Drawings Dellow 300 Coucom 100 400 2 62,910 Less Interest on Capital Dellow 600 Coucom 400 1,000 2 61,910 Salary - Coucom 7.600 1 $4,310 Share of Residue Dellow 32,586 Coucom 21,724 54,310 2 7 © Provided each department makes a profit if fixed costs are removed from the equation then each department should continue.
Mark scheme, page 4
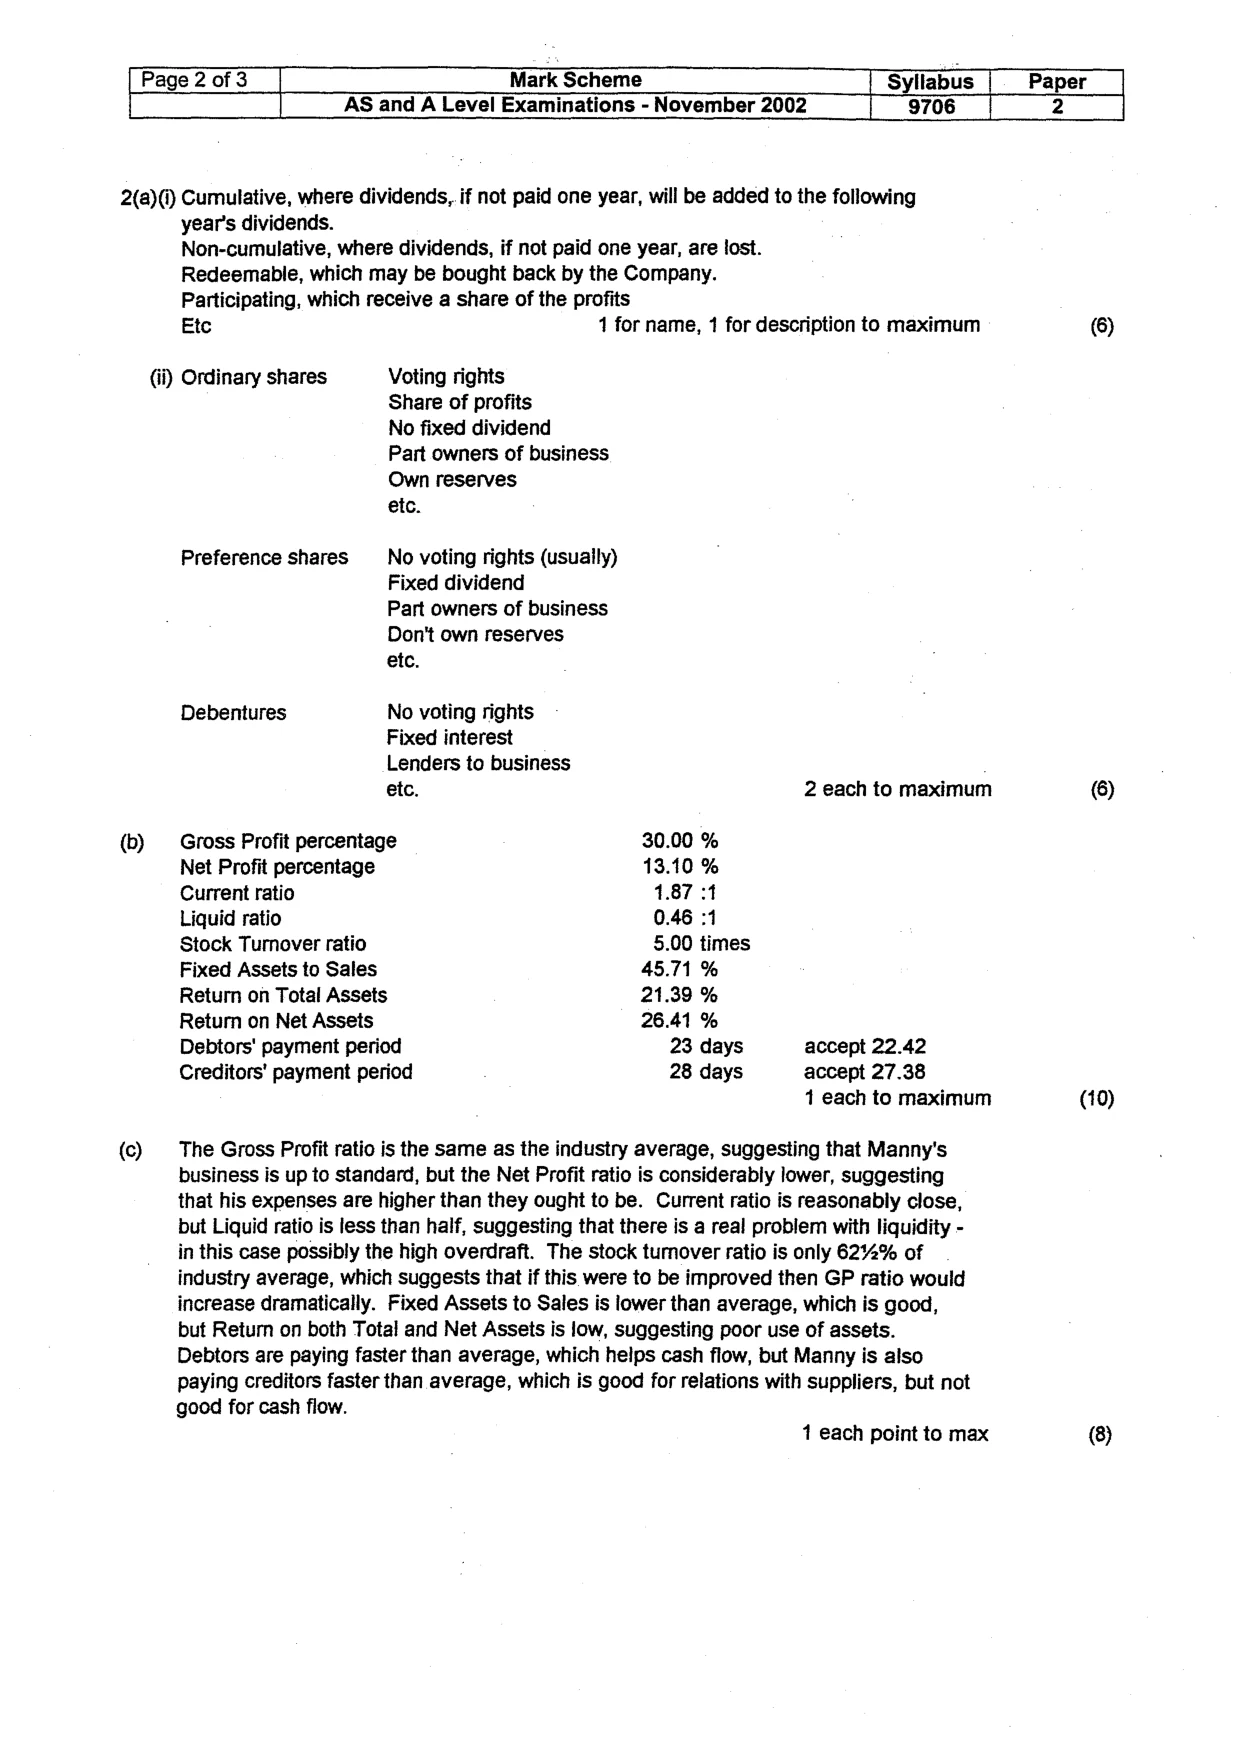
Page2of3 | Mark Scheme | Syllabus Paper AS and A Level Examinations - November 2002 9706 2 2(a)() Cumulative, where dividends, if not paid one year, will be added to the following year’s dividends. Non-cumulative, where dividends, if not paid one year, are lost. Redeemable, which may be bought back by the Company. Participating, which receive a share of the profits Etc 1 for name, 1 for description to maximum (6) (ii) Ordinary shares Voting rights Share of profits No fixed dividend Part owners of business Own reserves etc. Preference shares _No voting rights (usually) Fixed dividend Part owners of business Don't own reserves etc. Debentures No voting rights Fixed interest Lenders to business etc. 2 each to maximum 6) (b) Gross Profit percentage 30.00 % Net Profit percentage 13.10 % Current ratio 1.87 31 Liquid ratio 0.46 31 Stock Turnover ratio 5.00 times Fixed Assets to Sales 45.71% Return on Total Assets 21.39 % Return on Net Assets 26.41 % Debtors' payment period 23 days accept 22.42 Creditors’ payment period 28 days accept 27.38 1 each to maximum (10) (c) The Gross Profit ratio is the same as the industry average, suggesting that Manny's business is up to standard, but the Net Profit ratio is considerably lower, suggesting that his expenses are higher than they ought to be. Current ratio is reasonably close, but Liquid ratio is less than half, suggesting that there is a real problem with liquidity - in this case possibly the high overdraft. The stock tumover ratio is only 6212% of industry average, which suggests that if this were to be improved then GP ratio would increase dramatically. Fixed Assets to Sales is lower than average, which is good, but Retum on both Total and Net Assets is low, suggesting poor use of assets. Debtors are paying faster than average, which helps cash flow, but Manny is also paying creditors faster than average, which is good for relations with suppliers, but not good for cash flow. 1 each point to max (8)
Mark scheme, page 5
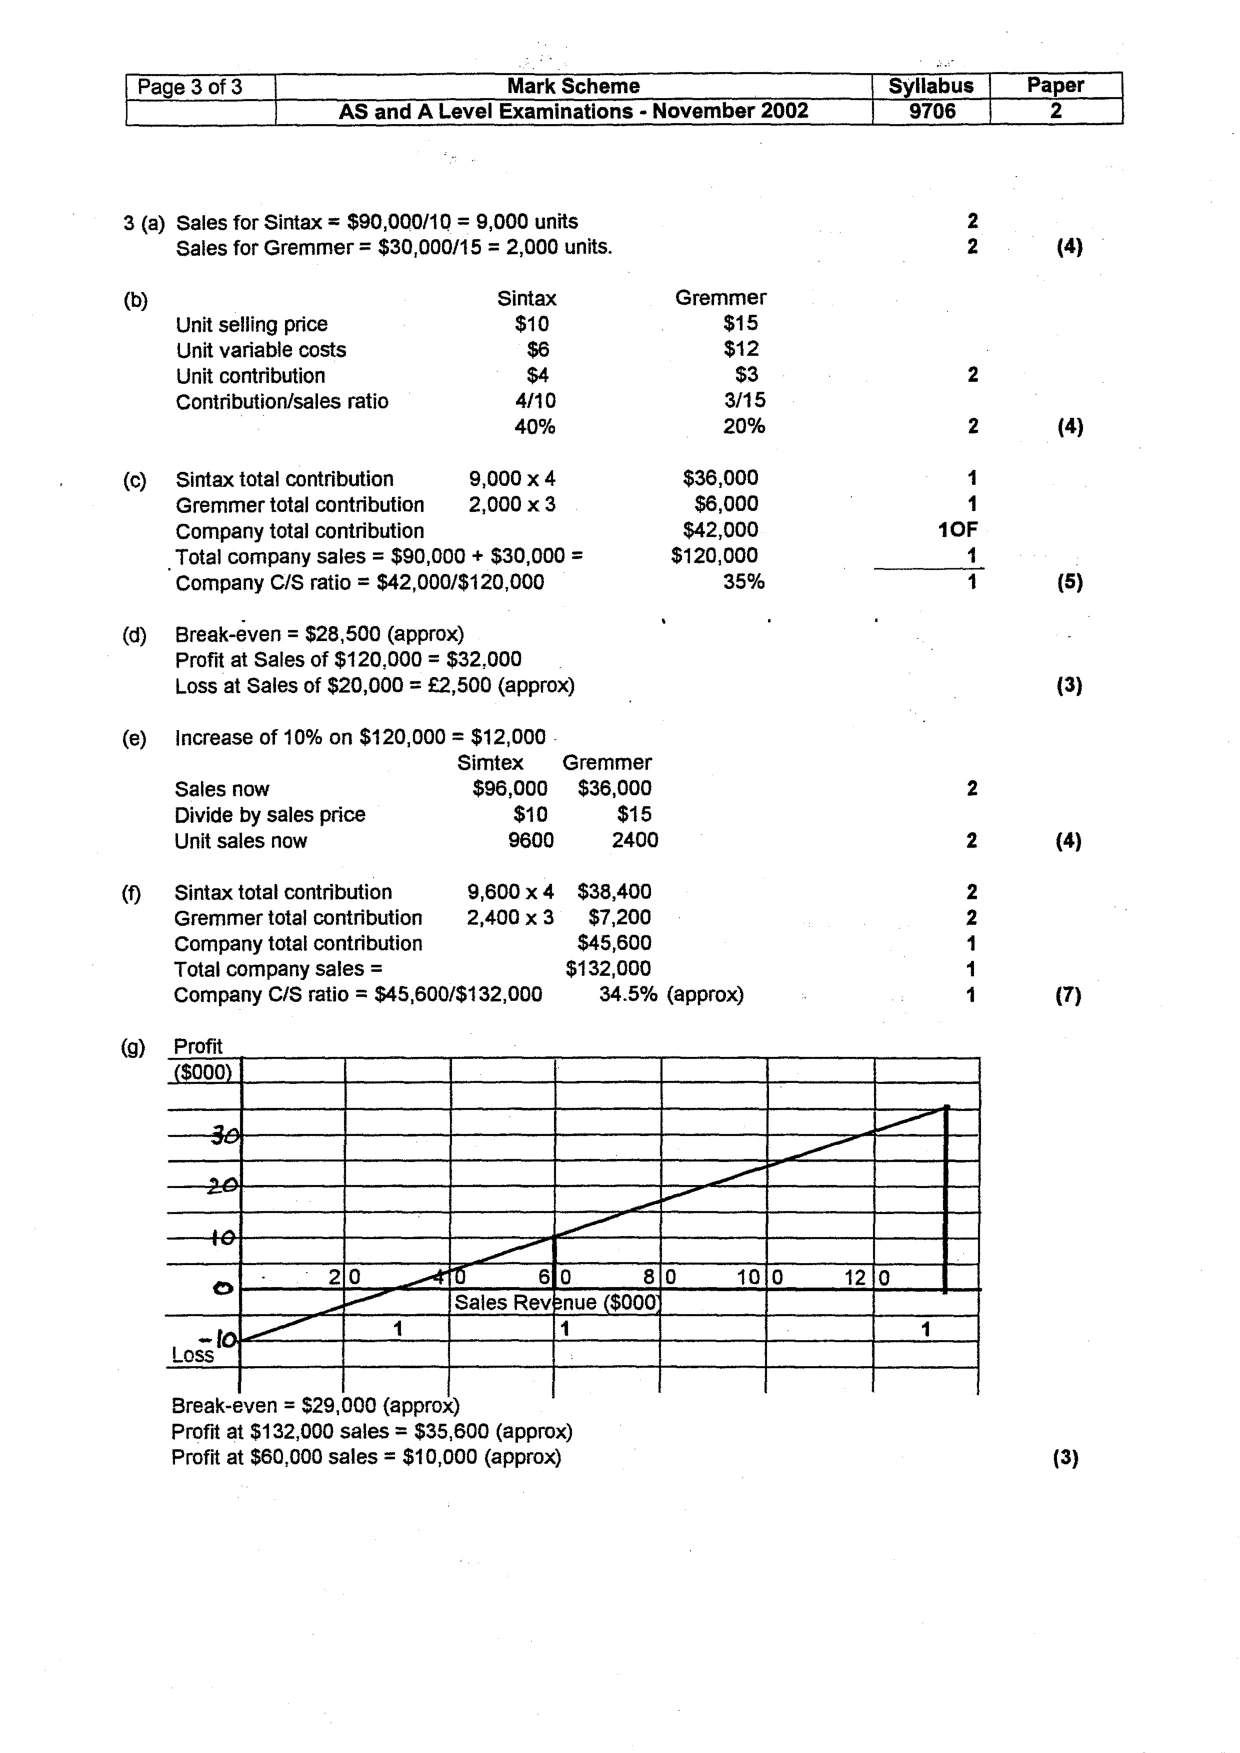
Syllabus [Page3of3 | Mark Scheme Peper AS and A Level Examinations - November 2002 9706 : 2 3 (a) Sales for Sintax = $90,000/10 = 9,000 units 2 Sales for Gremmer = $30,000/15 = 2,000 units. 2 (4) (b) Sintax Gremmer Unit selling price $10 $15 Unit variable costs $6 $12 Unit contribution $4 $3 2 Contribution/sales ratio 410 3/15 40% 20% 2 (4) (c) Sintax total contribution 9,000 x 4 $36,000 1 Gremmer total contribution 2,000 x 3 $6,000 1 Company total contribution $42,000 10F _Total company sales = $90,000 + $30,000 = $120,000 1 Company C/S ratio = $42,000/$120,000 35% 41 (5) (@) Break-even = $28,500 (approx) Profit at Sales of $120,000 = $32,000 Loss at Sales of $20,000 = £2,500 (approx) (3) (e) Increase of 10% on $120,000 = $12,000 Simtex Gremmer Sales now $96,000 $36,000 2 Divide by sales price $10 $15 Unit sales now 9600 2400 2 (4) (f) Sintax total contribution 9,600x4 $38,400 2 Gremmer total contribution 2,400x3 $7,200 2 Company total contribution $45,600 1 Total company sales = $132,000 1 Company C/S ratio = $45,600/$132,000 34.5% (approx) 1 (7) (g) _Profit ‘$000 T == ol 2/0 i) (} 8|0 10}0 12}0 Sales Revenue ($000 7 1 1 1 Loss Break-even = $29,000 (approx) Profit at $132,000 sales = $35,600 (approx) Profit at $60,000 sales = $10,000 (approx) (3)