Cambridge IGCSE Sciences - Co-ordinated (Double) 0654 — 2021 May/June Paper 6 · Variant 1
0654/61/M/J/21 · 7 questions · 60 marks · ≈68 min
The question paper and its mark scheme, free to read here and free to download. This is Cambridge’s own paper, exactly as it was sat.
Question paper20 pages


Mark scheme12 pages
Answers below. Sit the paper first if you are practising.
Questions as text
Q1 · A student investigates the movement of coloured water in a celery stem
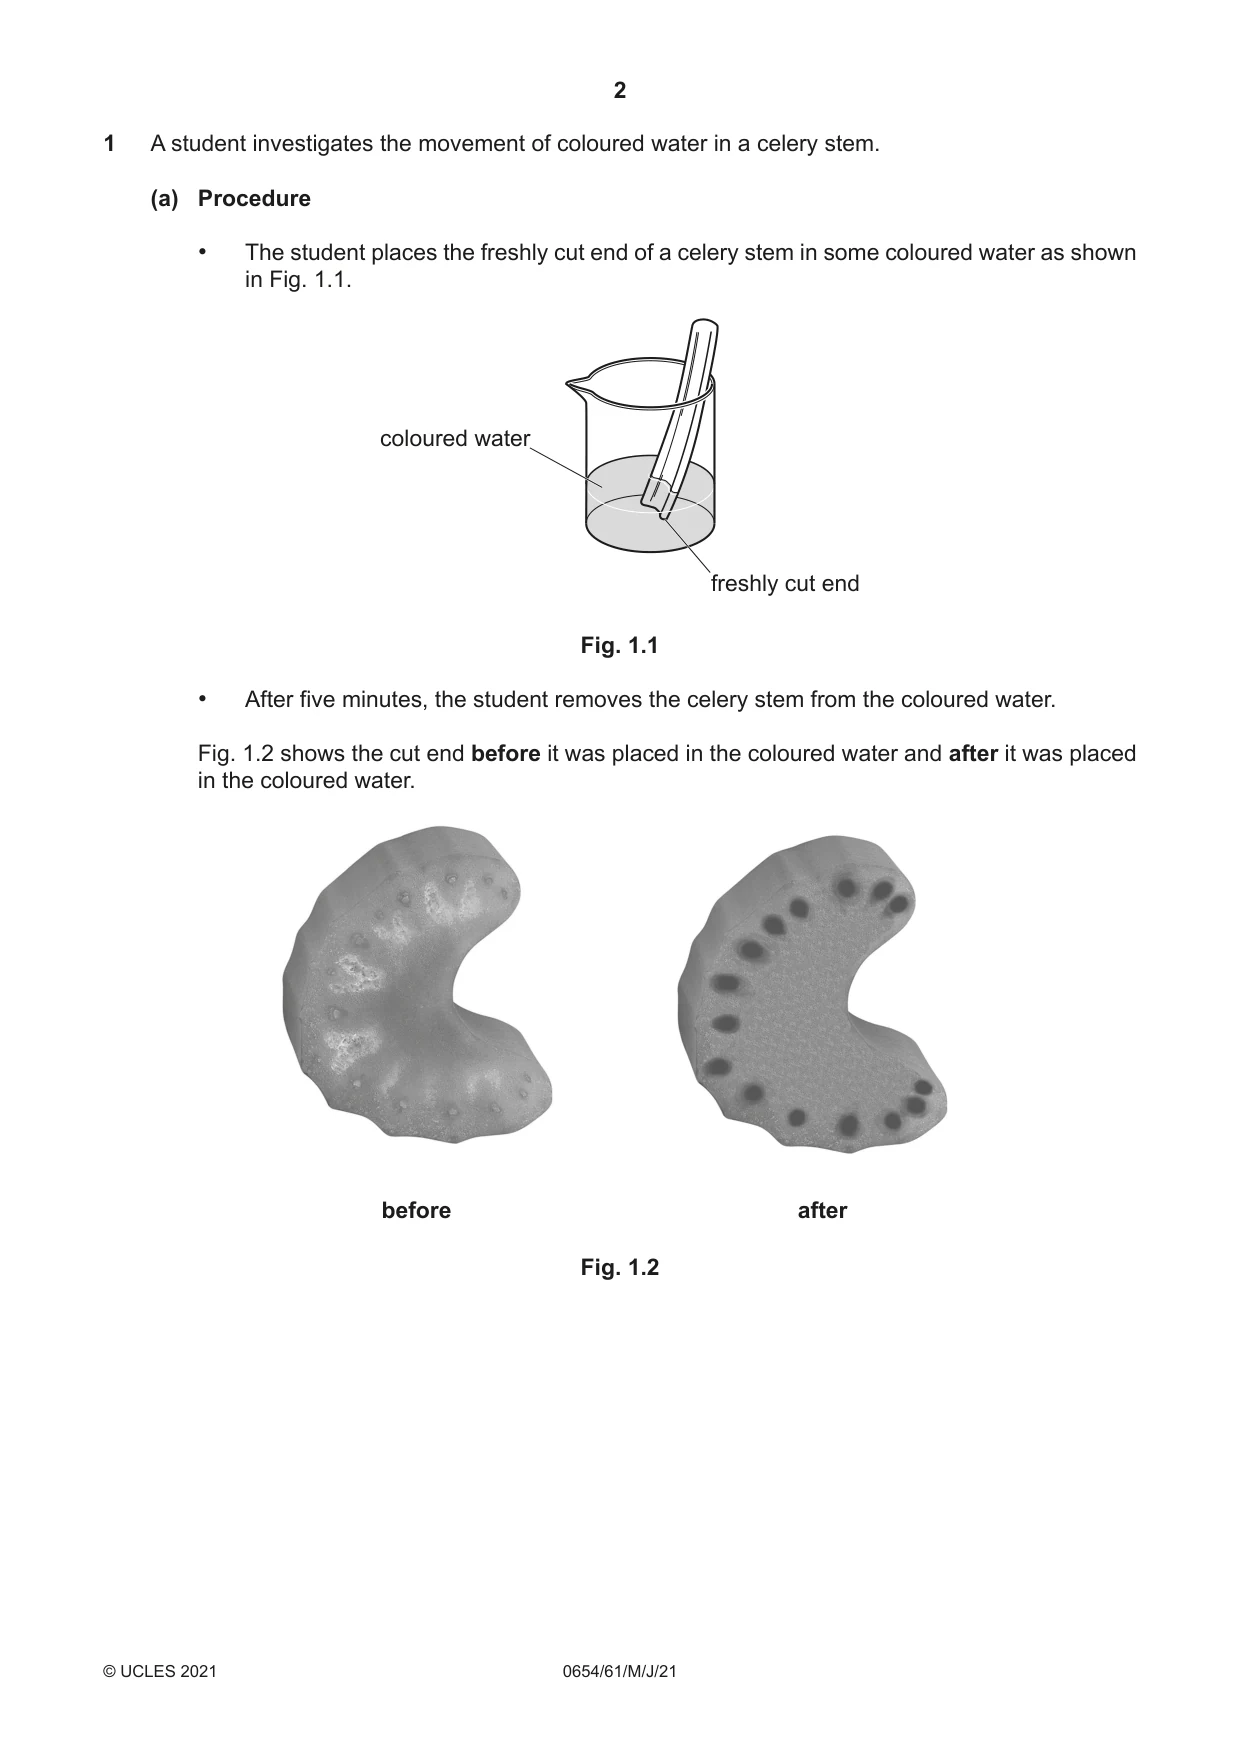
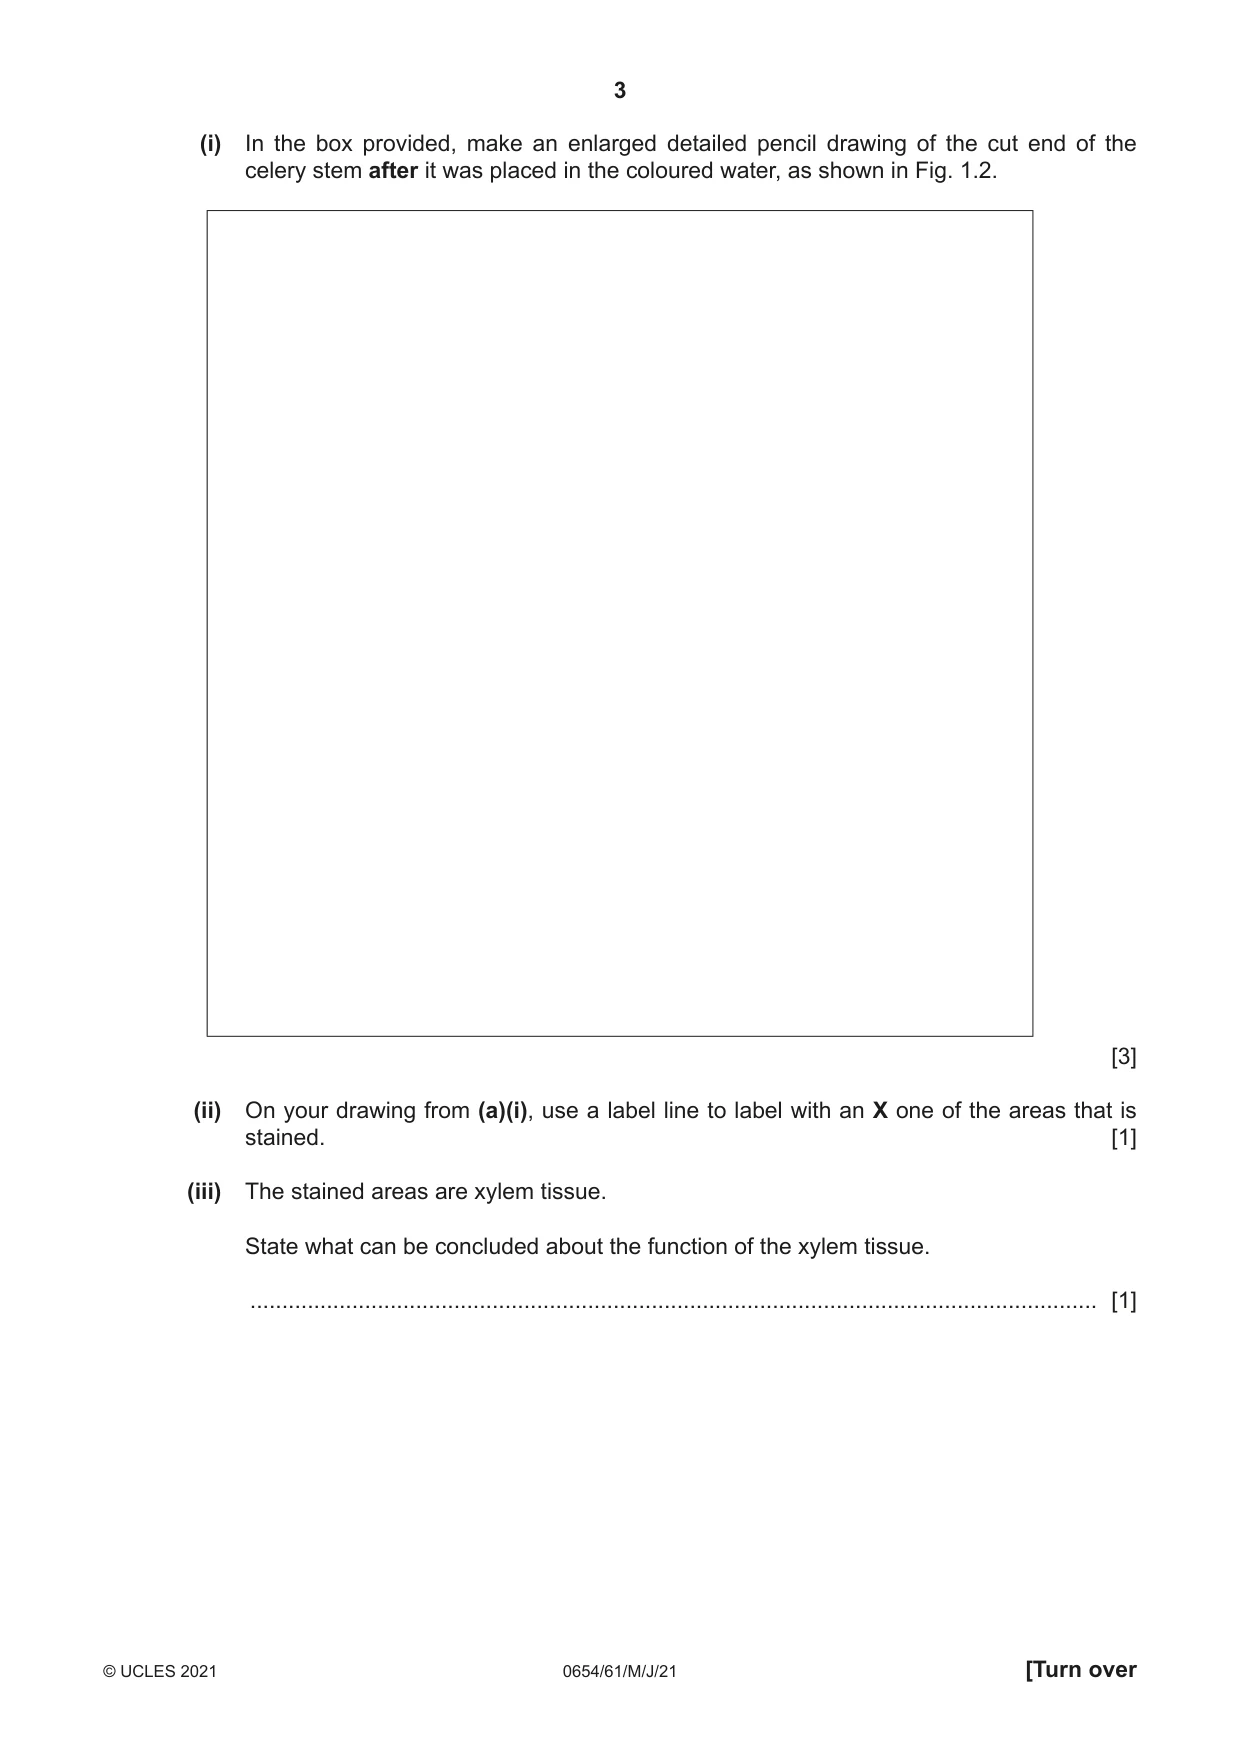
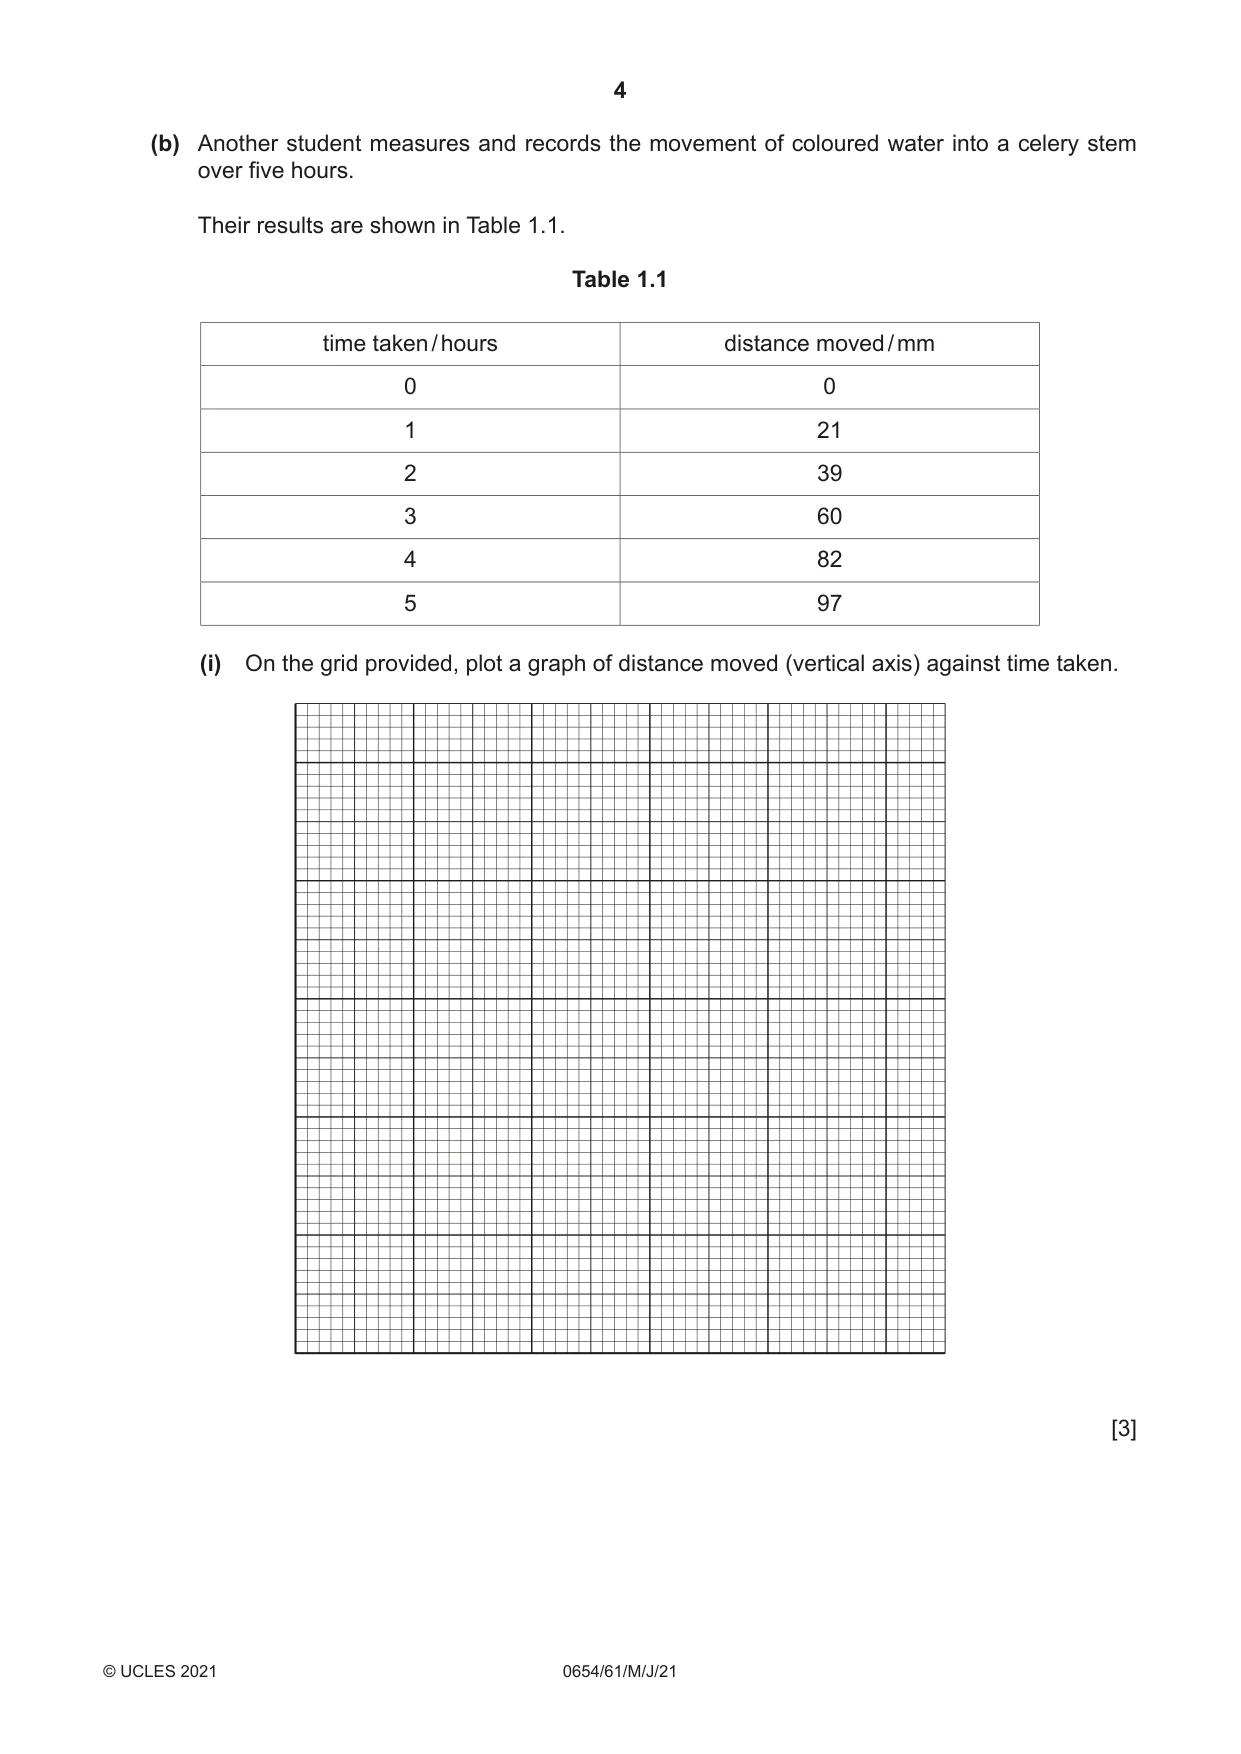
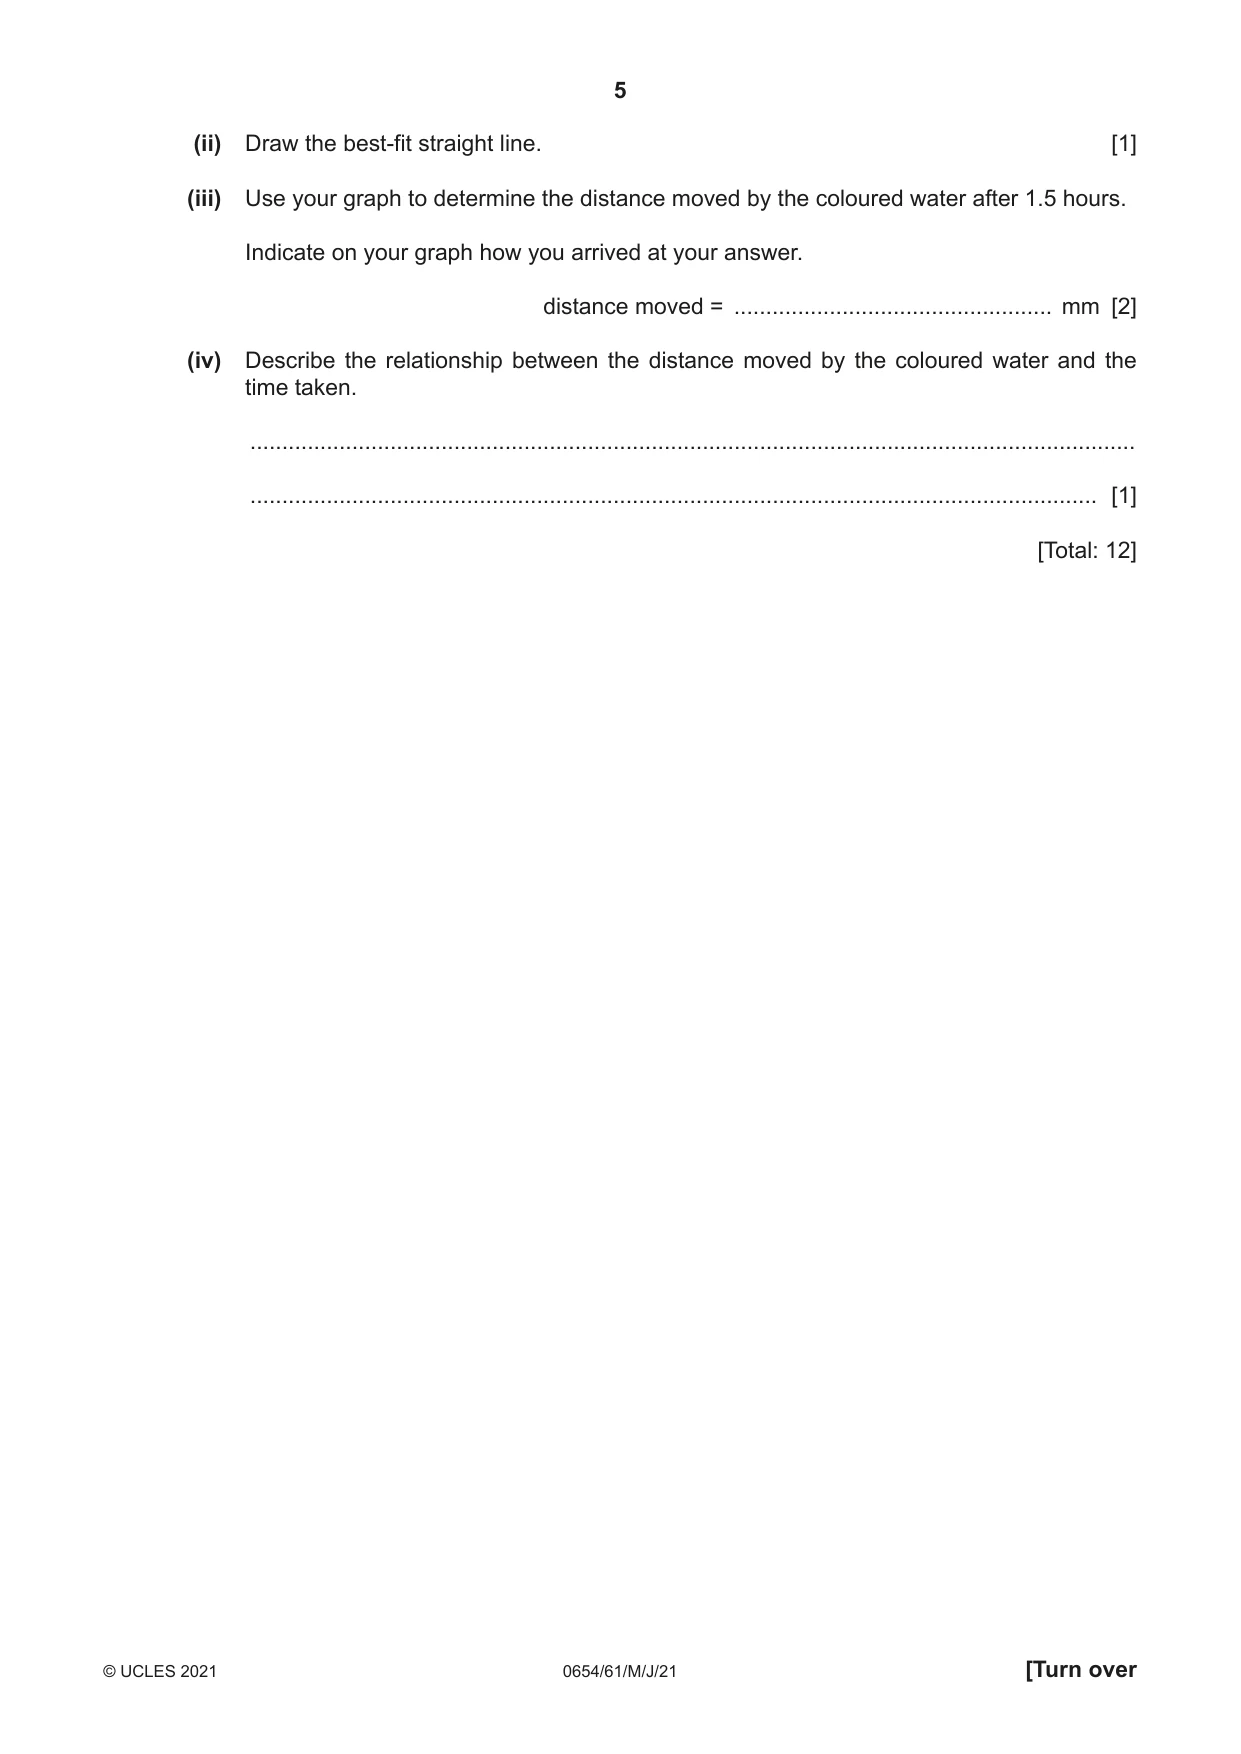
1 A student investigates the movement of coloured water in a celery stem. (a) Procedure • The student places the freshly cut end of a celery stem in some coloured water as shown in Fig. 1.1. coloured water freshly cut end Fig. 1.1 • After five minutes, the student removes the celery stem from the coloured water. Fig. 1.2 shows the cut end before it was placed in the coloured water and after it was placed in the coloured water. before after Fig. 1.2 (i) In the box provided, make an enlarged detailed pencil drawing of the cut end of the celery stem after it was placed in the coloured water, as shown in Fig. 1.2. [3] (ii) On your drawing from (a)(i), use a label line to label with an X one of the areas that is stained. [1] (iii) The stained areas are xylem tissue. State what can be concluded about the function of the xylem tissue. ..................................................................................................................................... [1] (b) Another student measures and records the movement of coloured water into a celery stem over five hours. Their results are shown in Table 1.1. Table 1.1 time taken / hours distance moved / mm 0 0 1 21 2 39 3 60 4 82 5 97 (i) On the grid provided, plot a graph of distance moved (vertical axis) against time taken. [3] (ii) Draw the best-fit straight line. [1] (iii) Use your graph to determine the distance moved by the coloured water after 1.5 hours. Indicate on your graph how you arrived at your answer. distance moved = .................................................. mm [2] (iv) Describe the relationship between the distance moved by the coloured water and the time taken. ........................................................................................................................................... ..................................................................................................................................... [1] [Total: 12]
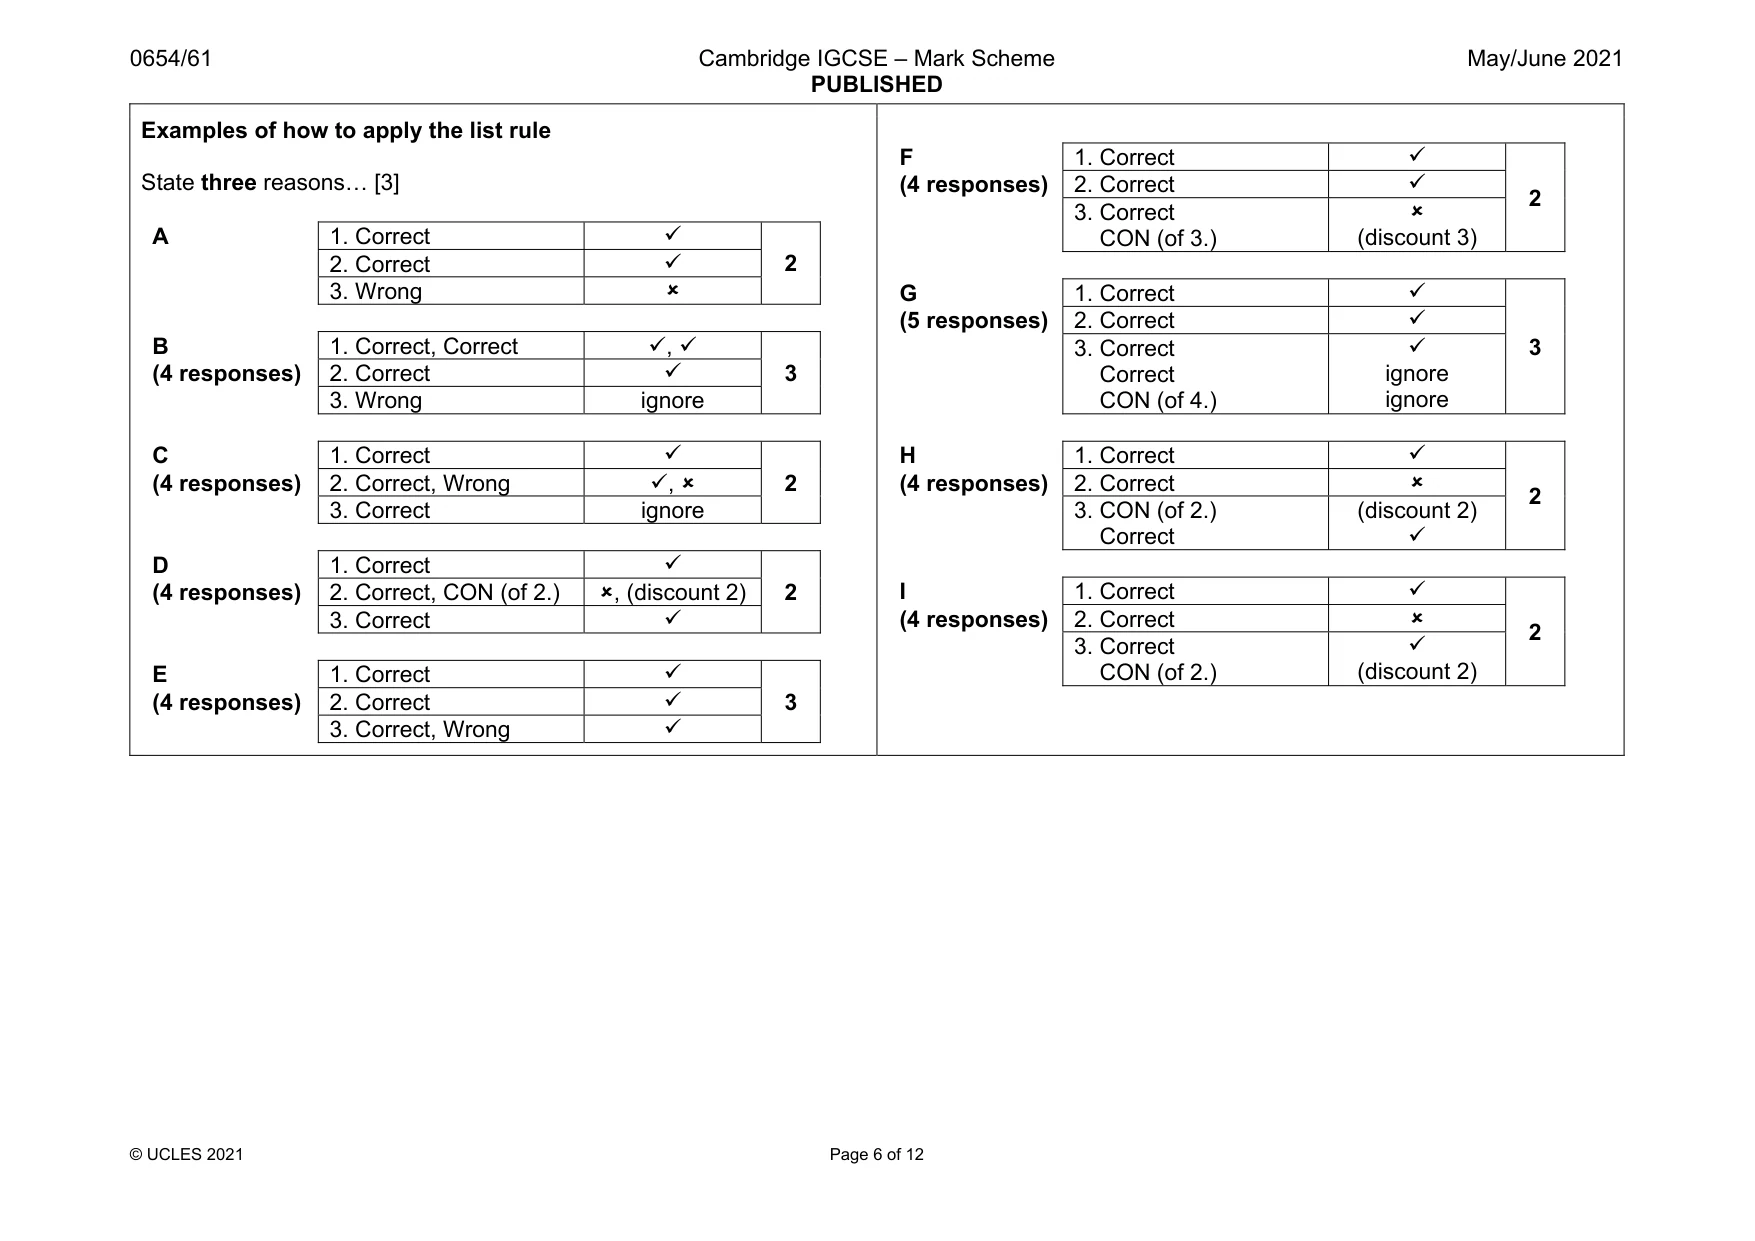
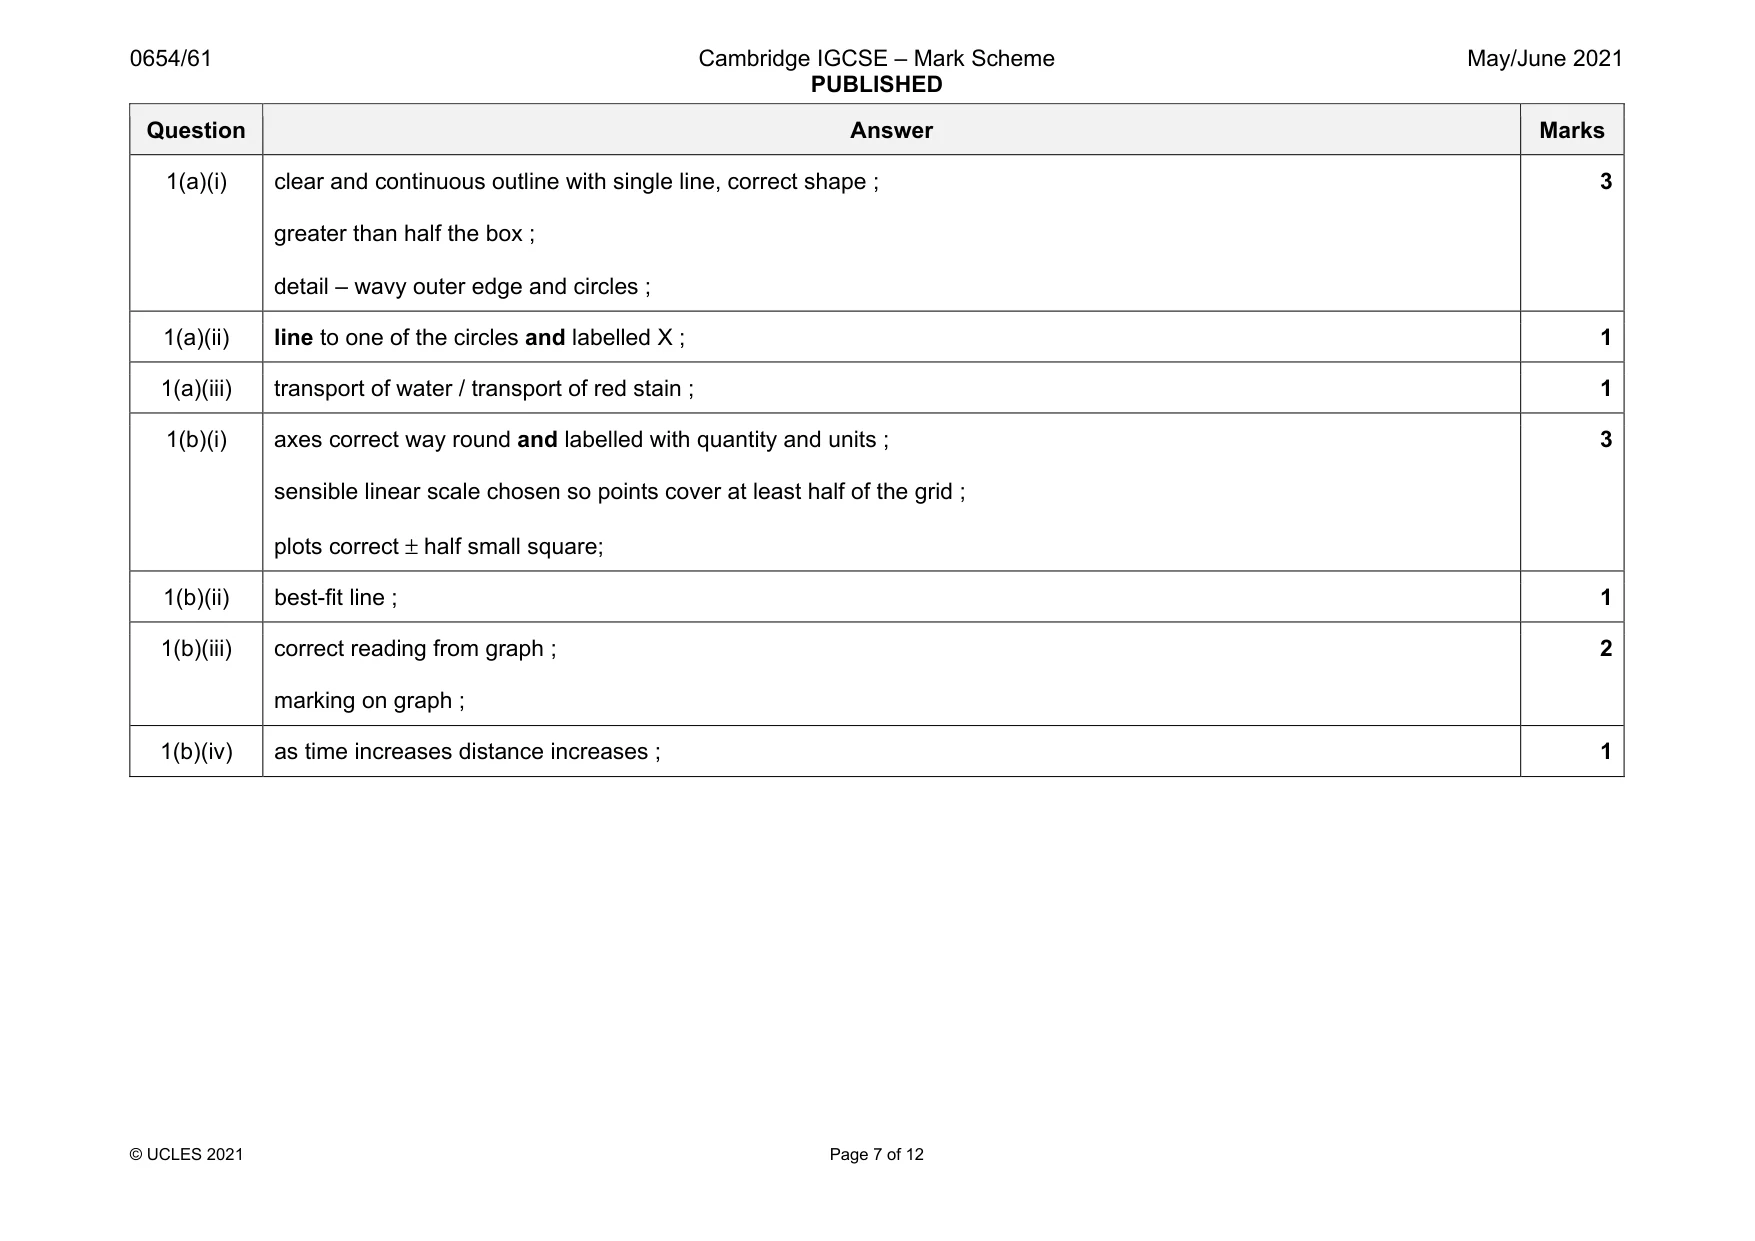
Mark scheme: 1(a)(i) clear and continuous outline with single line, correct shape ; greater than half the box ; detail – wavy outer edge and circles ; 3 1(a)(ii) line to one of the circles and labelled X ; 1 1(a)(iii) transport of water / transport of red stain ; 1 1(b)(i) axes correct way round and labelled with quantity and units ; sensible linear scale chosen so points cover at least half of the grid ; plots correct ± half small square; 3 1(b)(ii) best-fit line ; 1 1(b)(iii) correct reading from graph ; marking on graph ; 2 1(b)(iv) as time increases distance increases ; 1
Q2 · A student tests some celery for its nutrient content
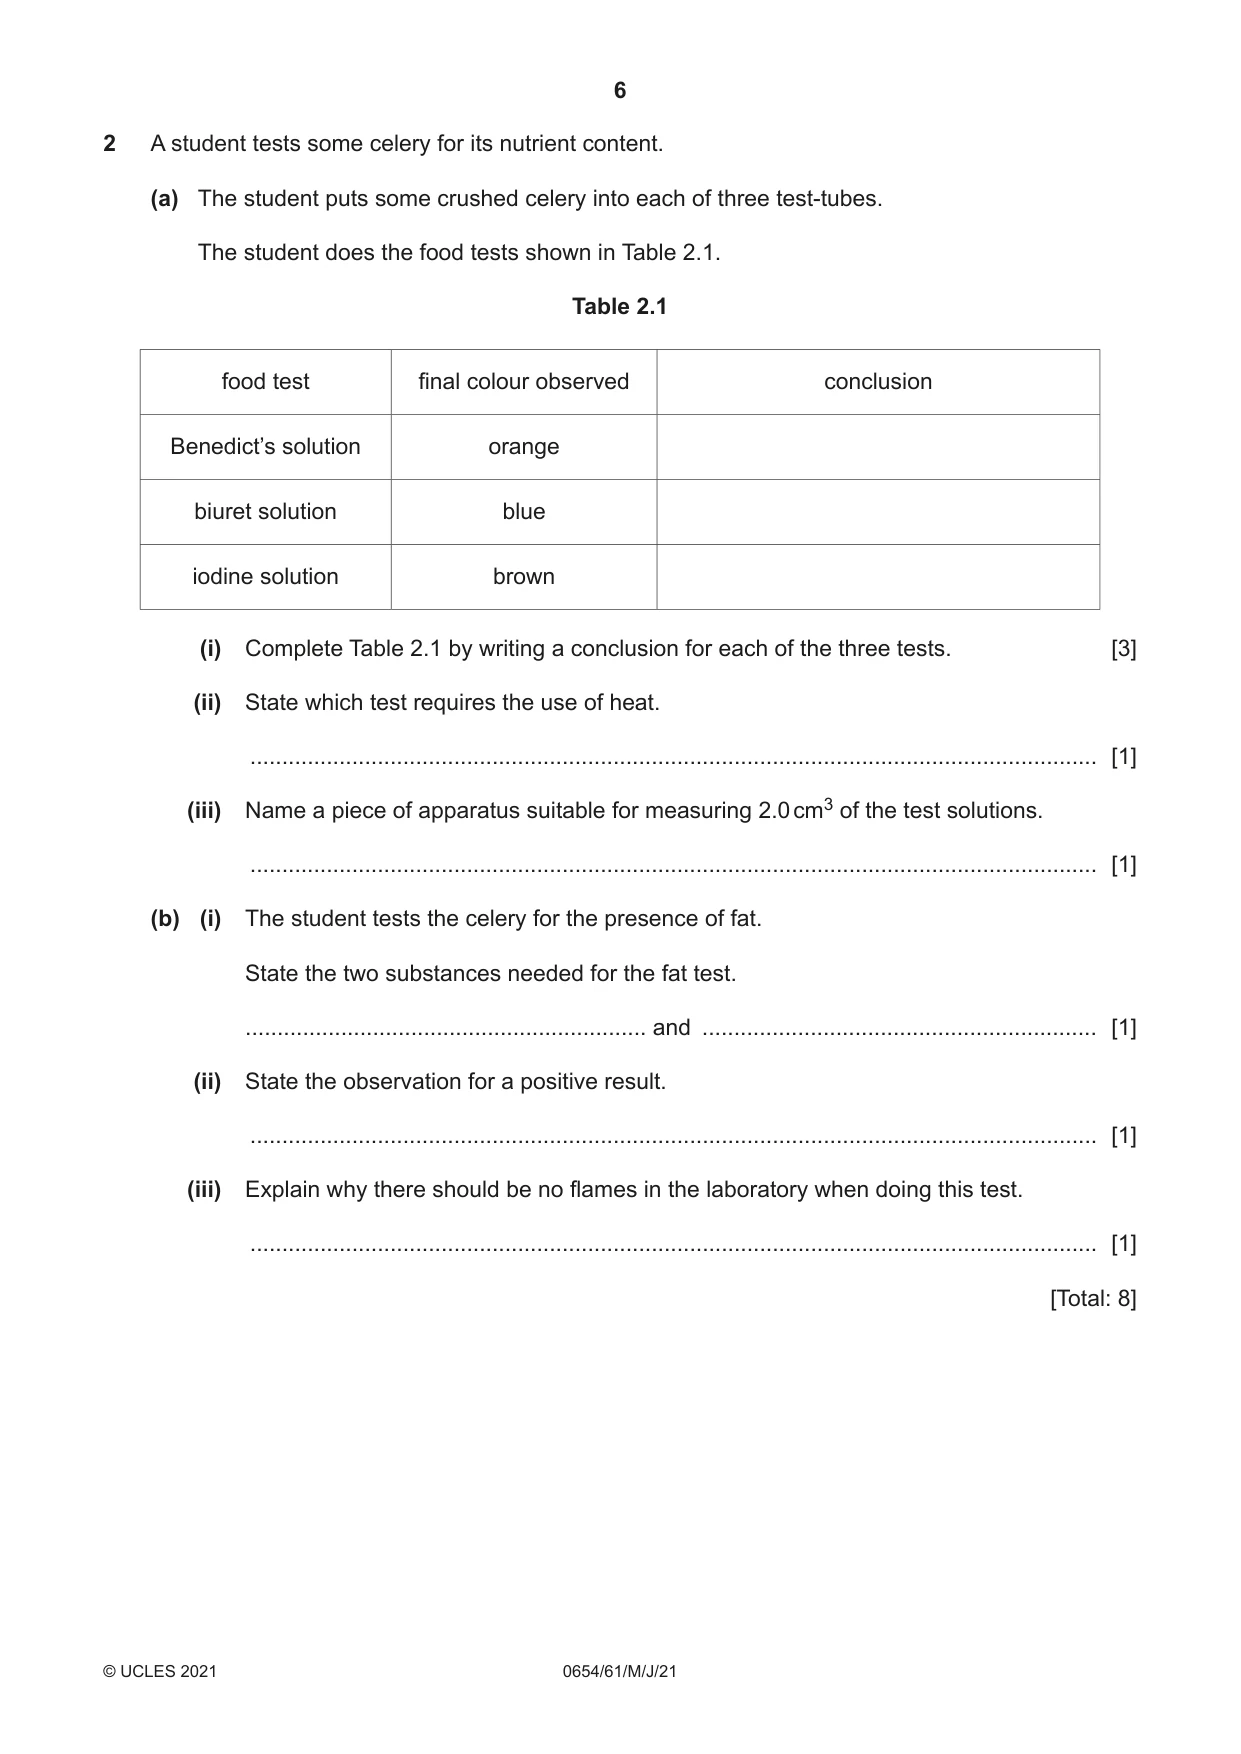
2 A student tests some celery for its nutrient content. (a) The student puts some crushed celery into each of three test-tubes. The student does the food tests shown in Table 2.1. Table 2.1 food test final colour observed conclusion Benedict’s solution orange biuret solution blue iodine solution brown (i) Complete Table 2.1 by writing a conclusion for each of the three tests. [3] (ii) State which test requires the use of heat. ..................................................................................................................................... [1] (iii) Name a piece of apparatus suitable for measuring 2.0 cm3 of the test solutions. ..................................................................................................................................... [1] (b) (i) The student tests the celery for the presence of fat. State the two substances needed for the fat test. ............................................................... and .............................................................. [1] (ii) State the observation for a positive result. ..................................................................................................................................... [1] (iii) Explain why there should be no flames in the laboratory when doing this test. ..................................................................................................................................... [1] [Total: 8]
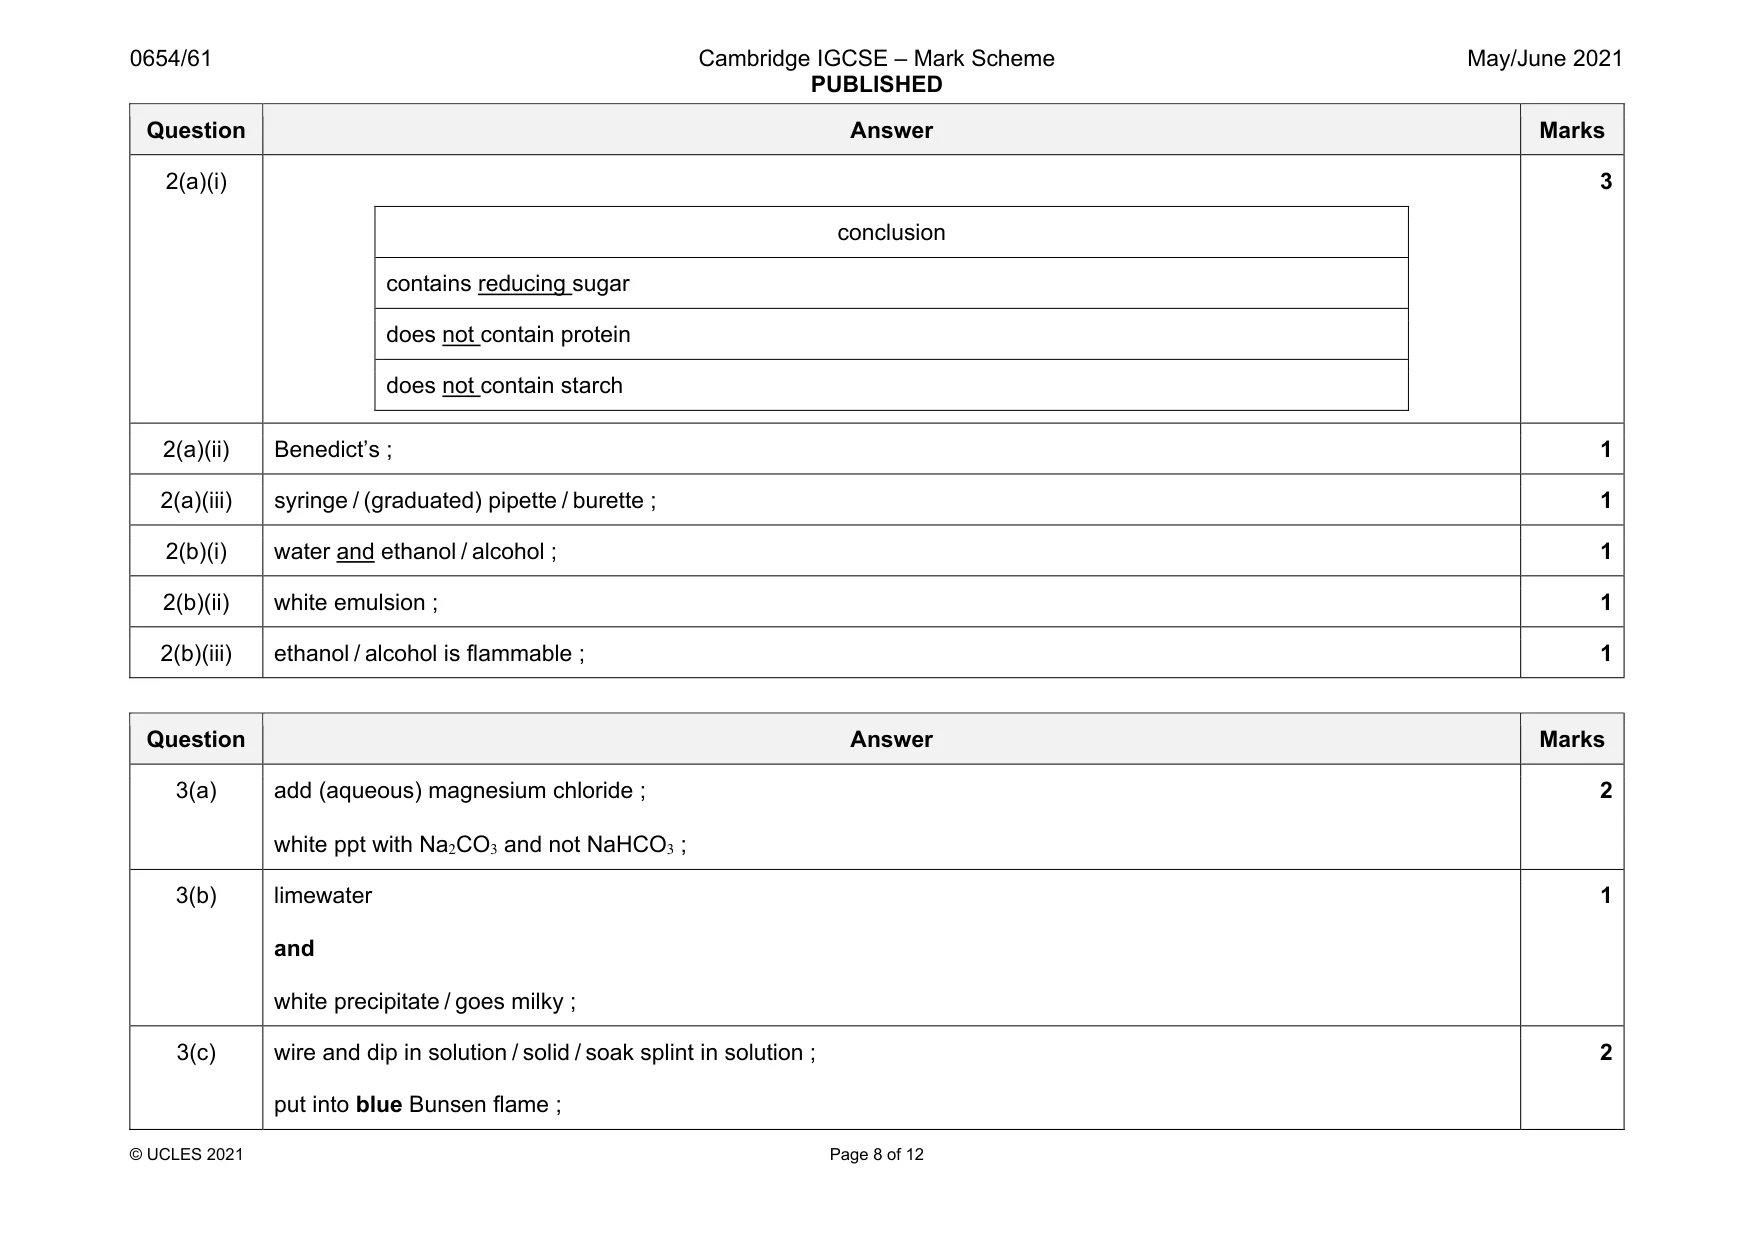
Mark scheme: 2(a)(i) conclusion contains reducing sugar does not contain protein does not contain starch 3 2(a)(ii) Benedict’s ; 1 2(a)(iii) syringe / (graduated) pipette / burette ; 1 2(b)(i) water and ethanol / alcohol ; 1 2(b)(ii) white emulsion ; 1 2(b)(iii) ethanol / alcohol is flammable ; 1
Q3 · In this investigation a student designs a test to distinguish between sodium…
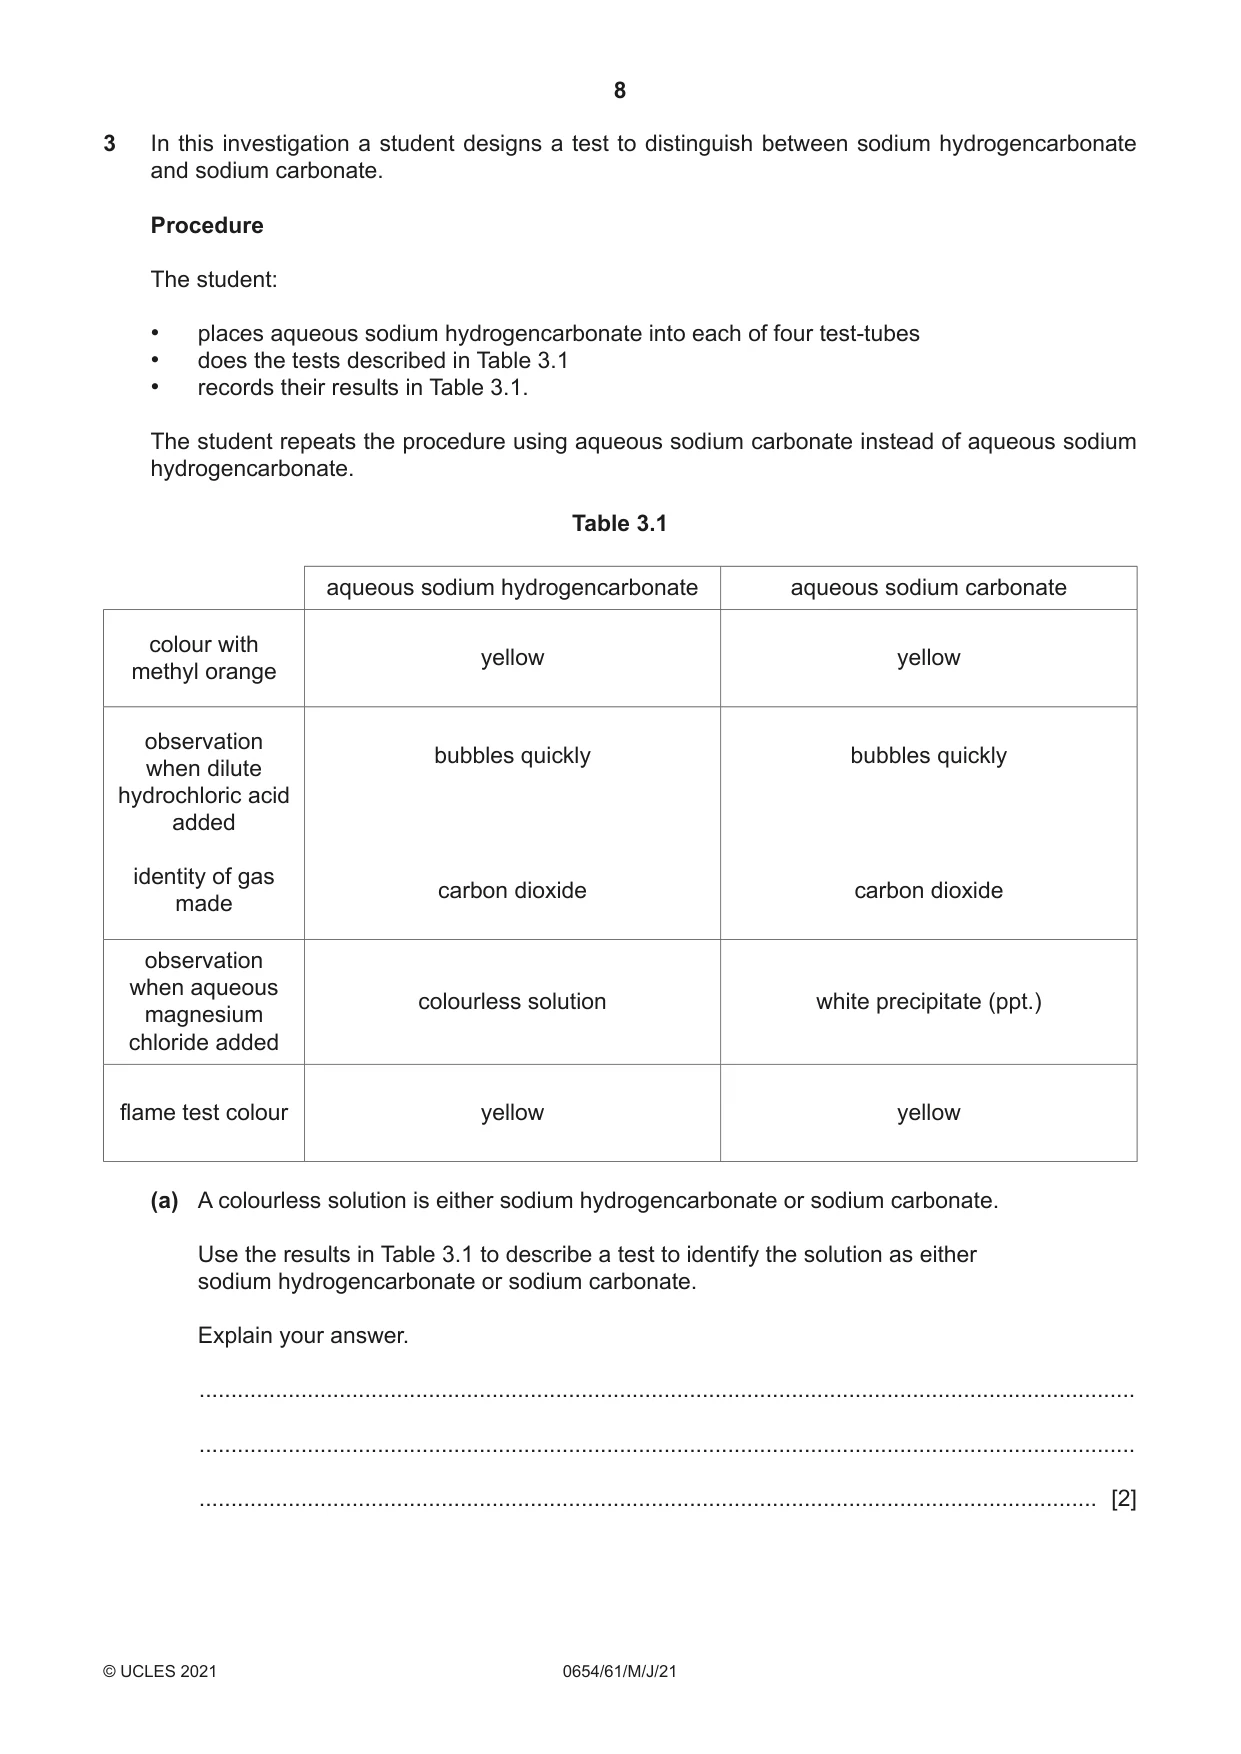
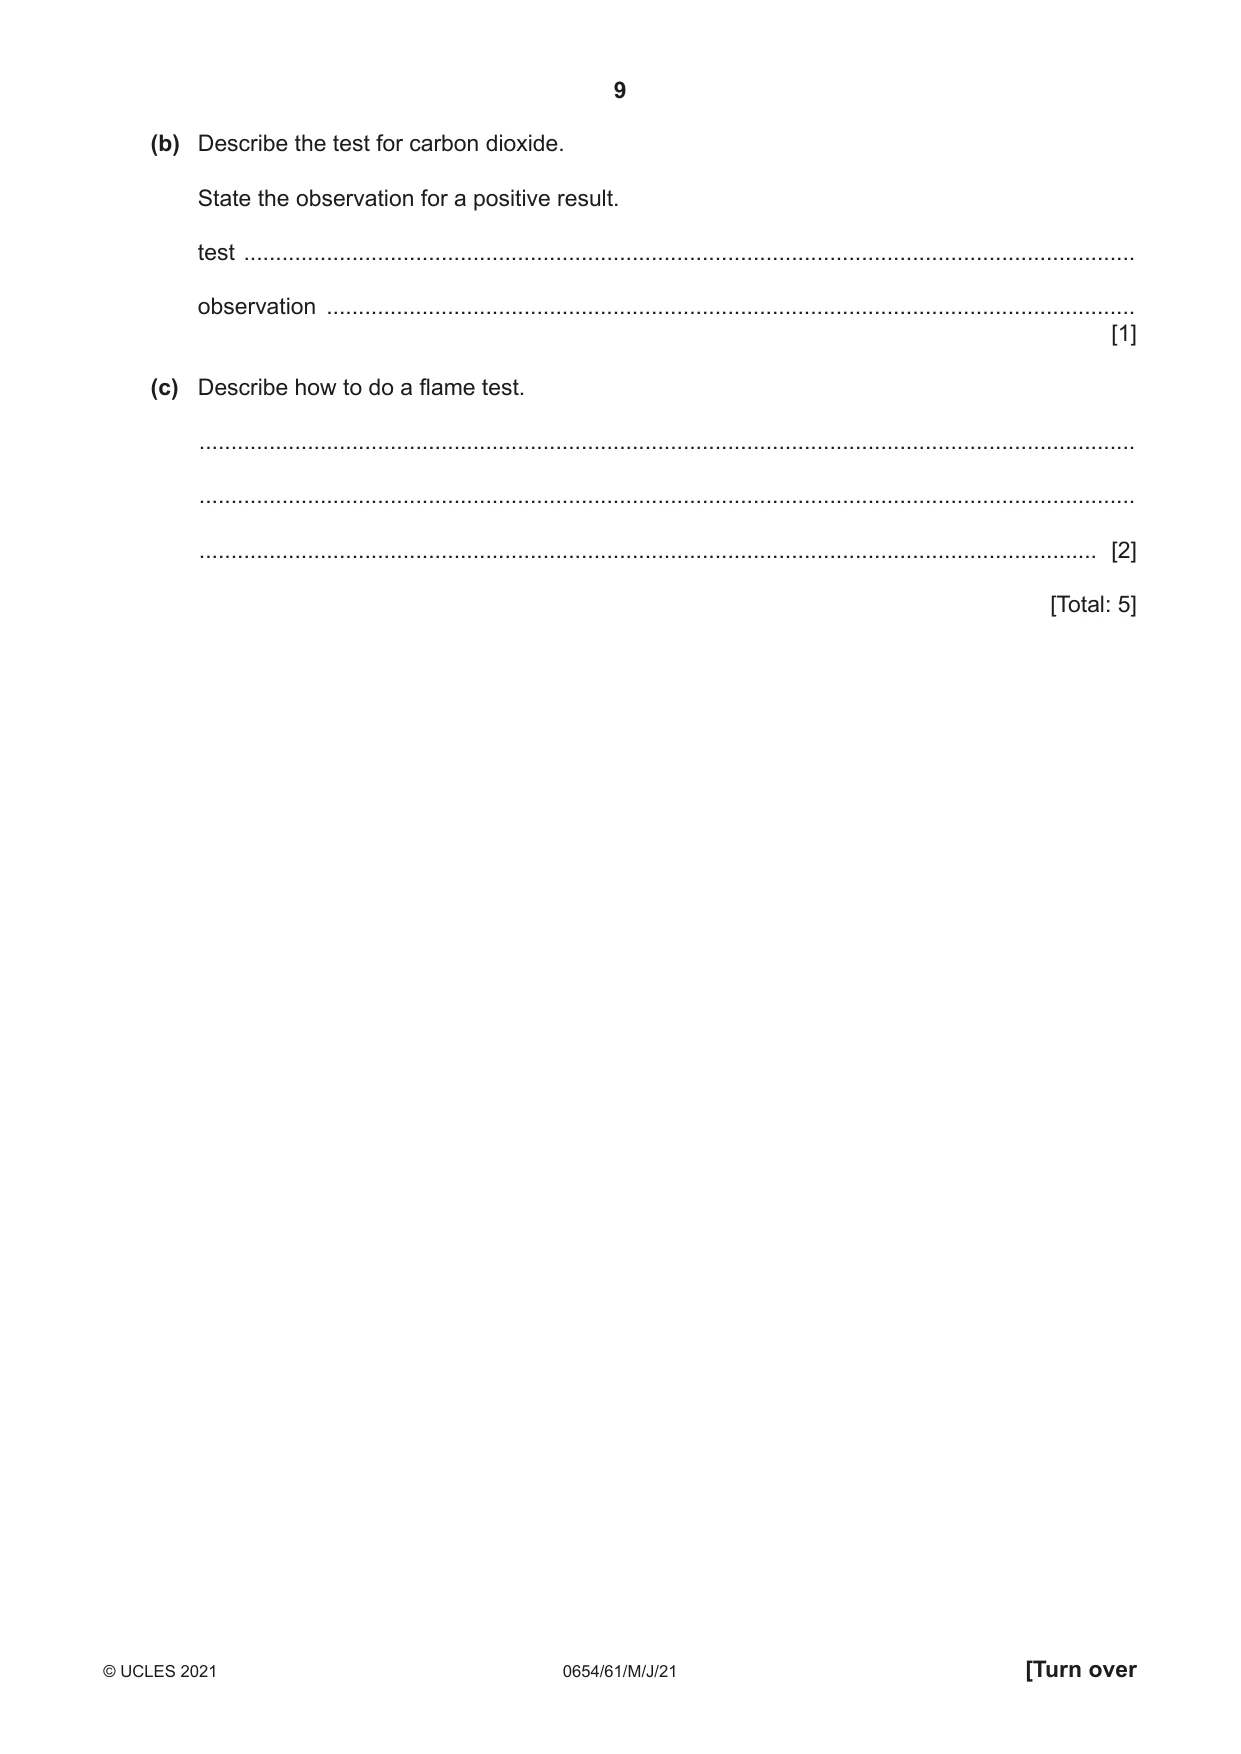
3 In this investigation a student designs a test to distinguish between sodium hydrogencarbonate and sodium carbonate. Procedure The student: • places aqueous sodium hydrogencarbonate into each of four test-tubes • does the tests described in Table 3.1 • records their results in Table 3.1. The student repeats the procedure using aqueous sodium carbonate instead of aqueous sodium hydrogencarbonate. Table 3.1 aqueous sodium hydrogencarbonate aqueous sodium carbonate colour with yellow yellow methyl orange observation bubbles quickly bubbles quickly when dilute hydrochloric acid added identity of gas carbon dioxide carbon dioxide made observation when aqueous colourless solution white precipitate (ppt.) magnesium chloride added flame test colour yellow yellow (a) A colourless solution is either sodium hydrogencarbonate or sodium carbonate. Use the results in Table 3.1 to describe a test to identify the solution as either sodium hydrogencarbonate or sodium carbonate. Explain your answer. ................................................................................................................................................... ................................................................................................................................................... ............................................................................................................................................. [2] (b) Describe the test for carbon dioxide. State the observation for a positive result. test ............................................................................................................................................ observation ............................................................................................................................... [1] (c) Describe how to do a flame test. ................................................................................................................................................... ................................................................................................................................................... ............................................................................................................................................. [2] [Total: 5]
Mark scheme: 3(a) add (aqueous) magnesium chloride ; white ppt with Na2CO3 and not NaHCO3 ; 2 3(b) limewater and white precipitate / goes milky ; 1 3(c) wire and dip in solution / solid / soak splint in solution ; put into blue Bunsen flame ; 2
Q4 · A student investigates the effect of surface area on the rate of reaction between marble…
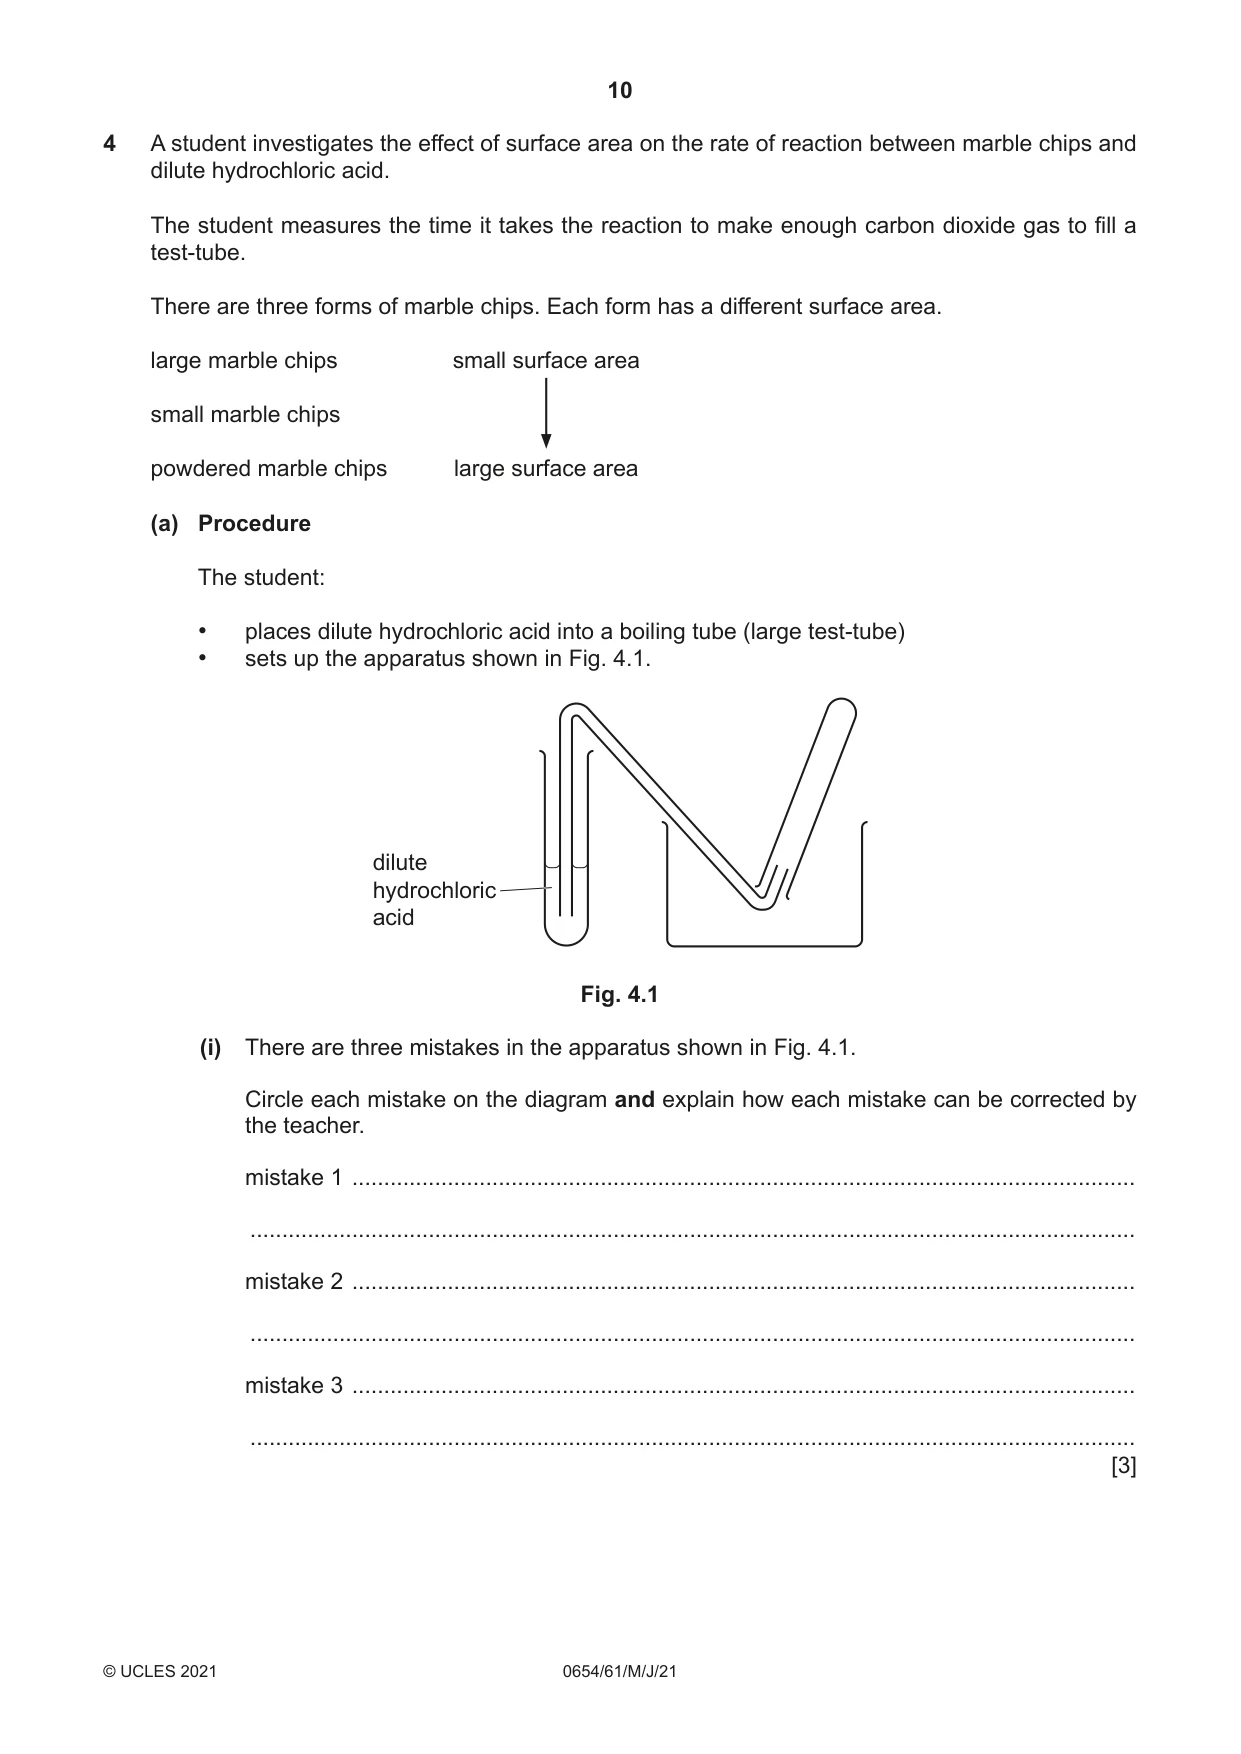
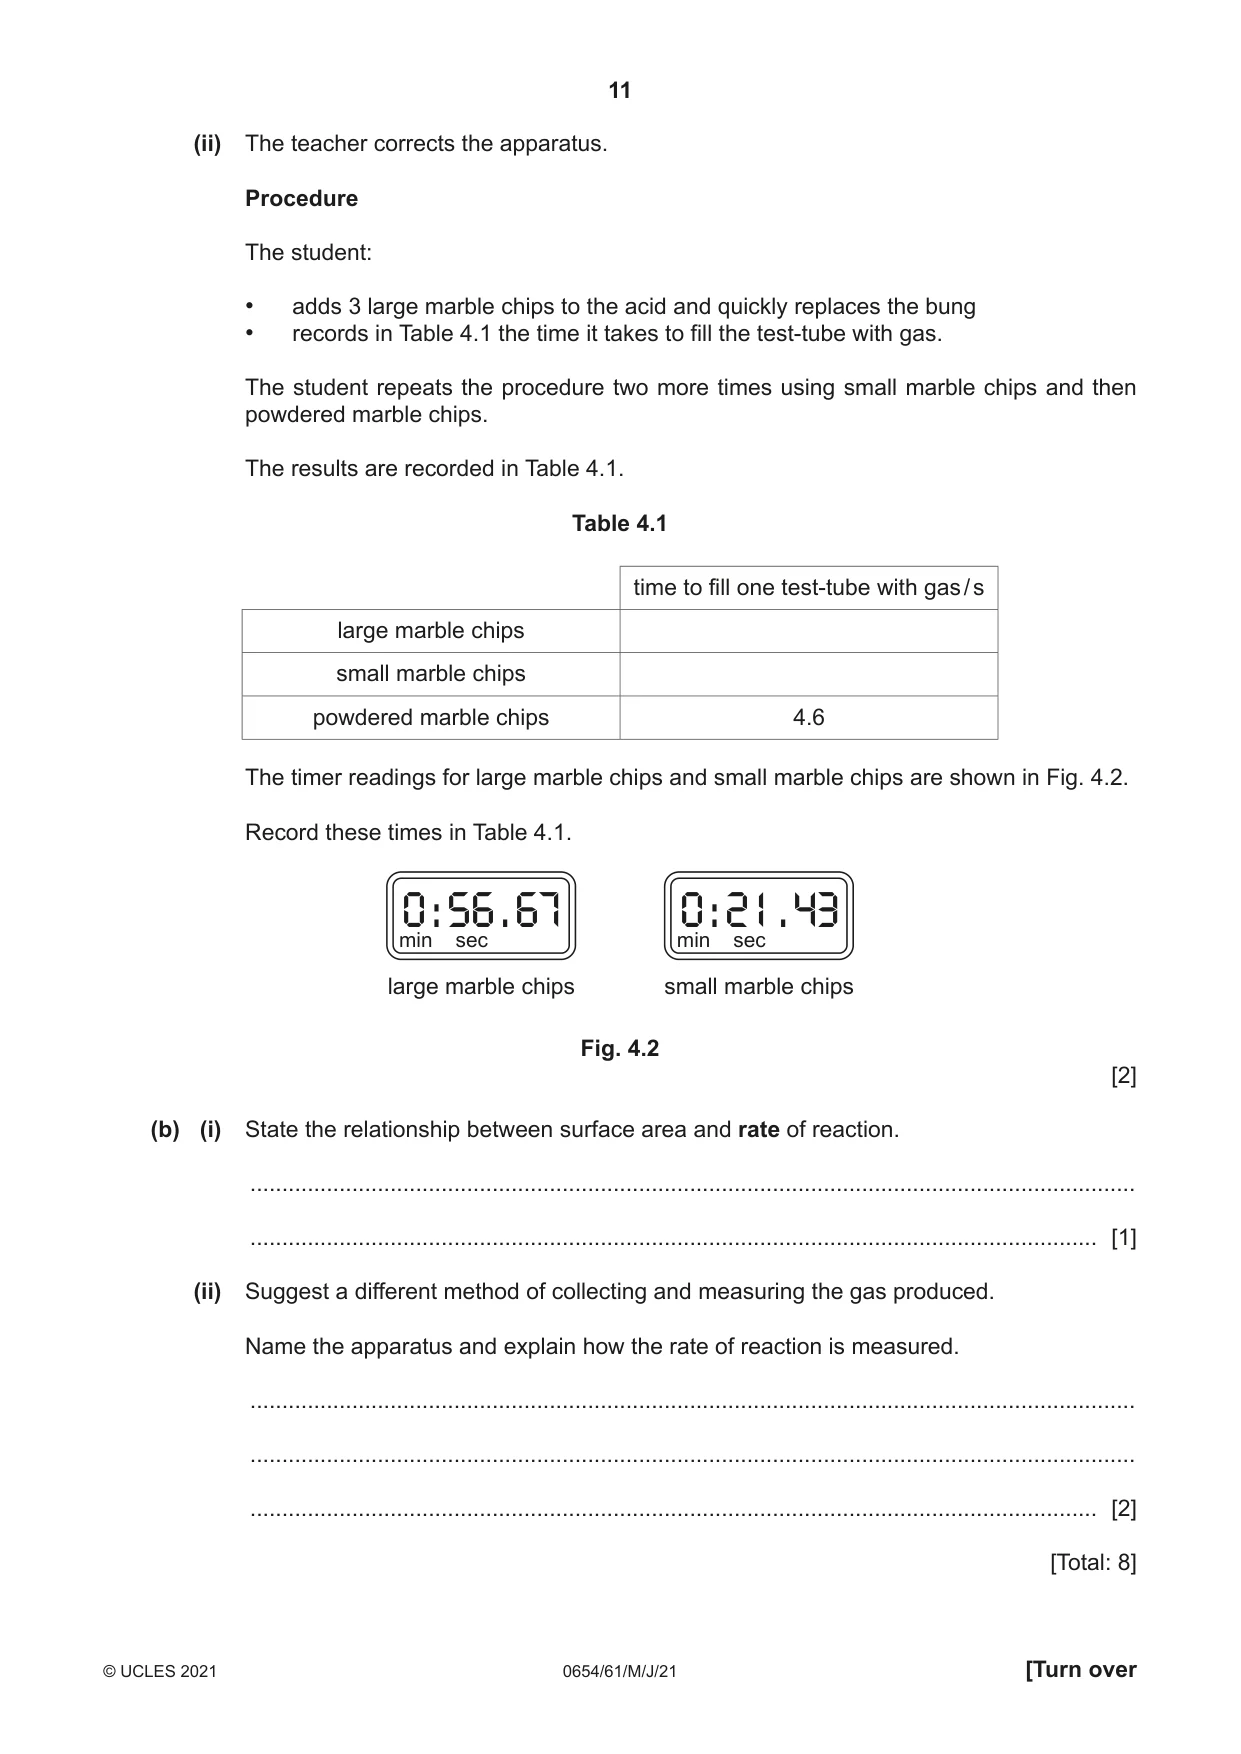
4 A student investigates the effect of surface area on the rate of reaction between marble chips and dilute hydrochloric acid. The student measures the time it takes the reaction to make enough carbon dioxide gas to fill a test-tube. There are three forms of marble chips. Each form has a different surface area. large marble chips small surface area small marble chips powdered marble chips large surface area (a) Procedure The student: • places dilute hydrochloric acid into a boiling tube (large test-tube) • sets up the apparatus shown in Fig. 4.1. dilute hydrochloric acid Fig. 4.1 (i) There are three mistakes in the apparatus shown in Fig. 4.1. Circle each mistake on the diagram and explain how each mistake can be corrected by the teacher. mistake 1 ........................................................................................................................... ........................................................................................................................................... mistake 2 ........................................................................................................................... ........................................................................................................................................... mistake 3 ........................................................................................................................... ........................................................................................................................................... [3] (ii) The teacher corrects the apparatus. Procedure The student: • adds 3 large marble chips to the acid and quickly replaces the bung • records in Table 4.1 the time it takes to fill the test-tube with gas. The student repeats the procedure two more times using small marble chips and then powdered marble chips. The results are recorded in Table 4.1. Table 4.1 time to fill one test-tube with gas / s large marble chips small marble chips powdered marble chips 4.6 The timer readings for large marble chips and small marble chips are shown in Fig. 4.2. Record these times in Table 4.1. 0 : 56 . 67 0 : 21 . 43 min sec min sec large marble chips small marble chips Fig. 4.2 [2] (b) (i) State the relationship between surface area and rate of reaction. ........................................................................................................................................... ..................................................................................................................................... [1] (ii) Suggest a different method of collecting and measuring the gas produced. Name the apparatus and explain how the rate of reaction is measured. ........................................................................................................................................... ........................................................................................................................................... ..................................................................................................................................... [2] [Total: 8]
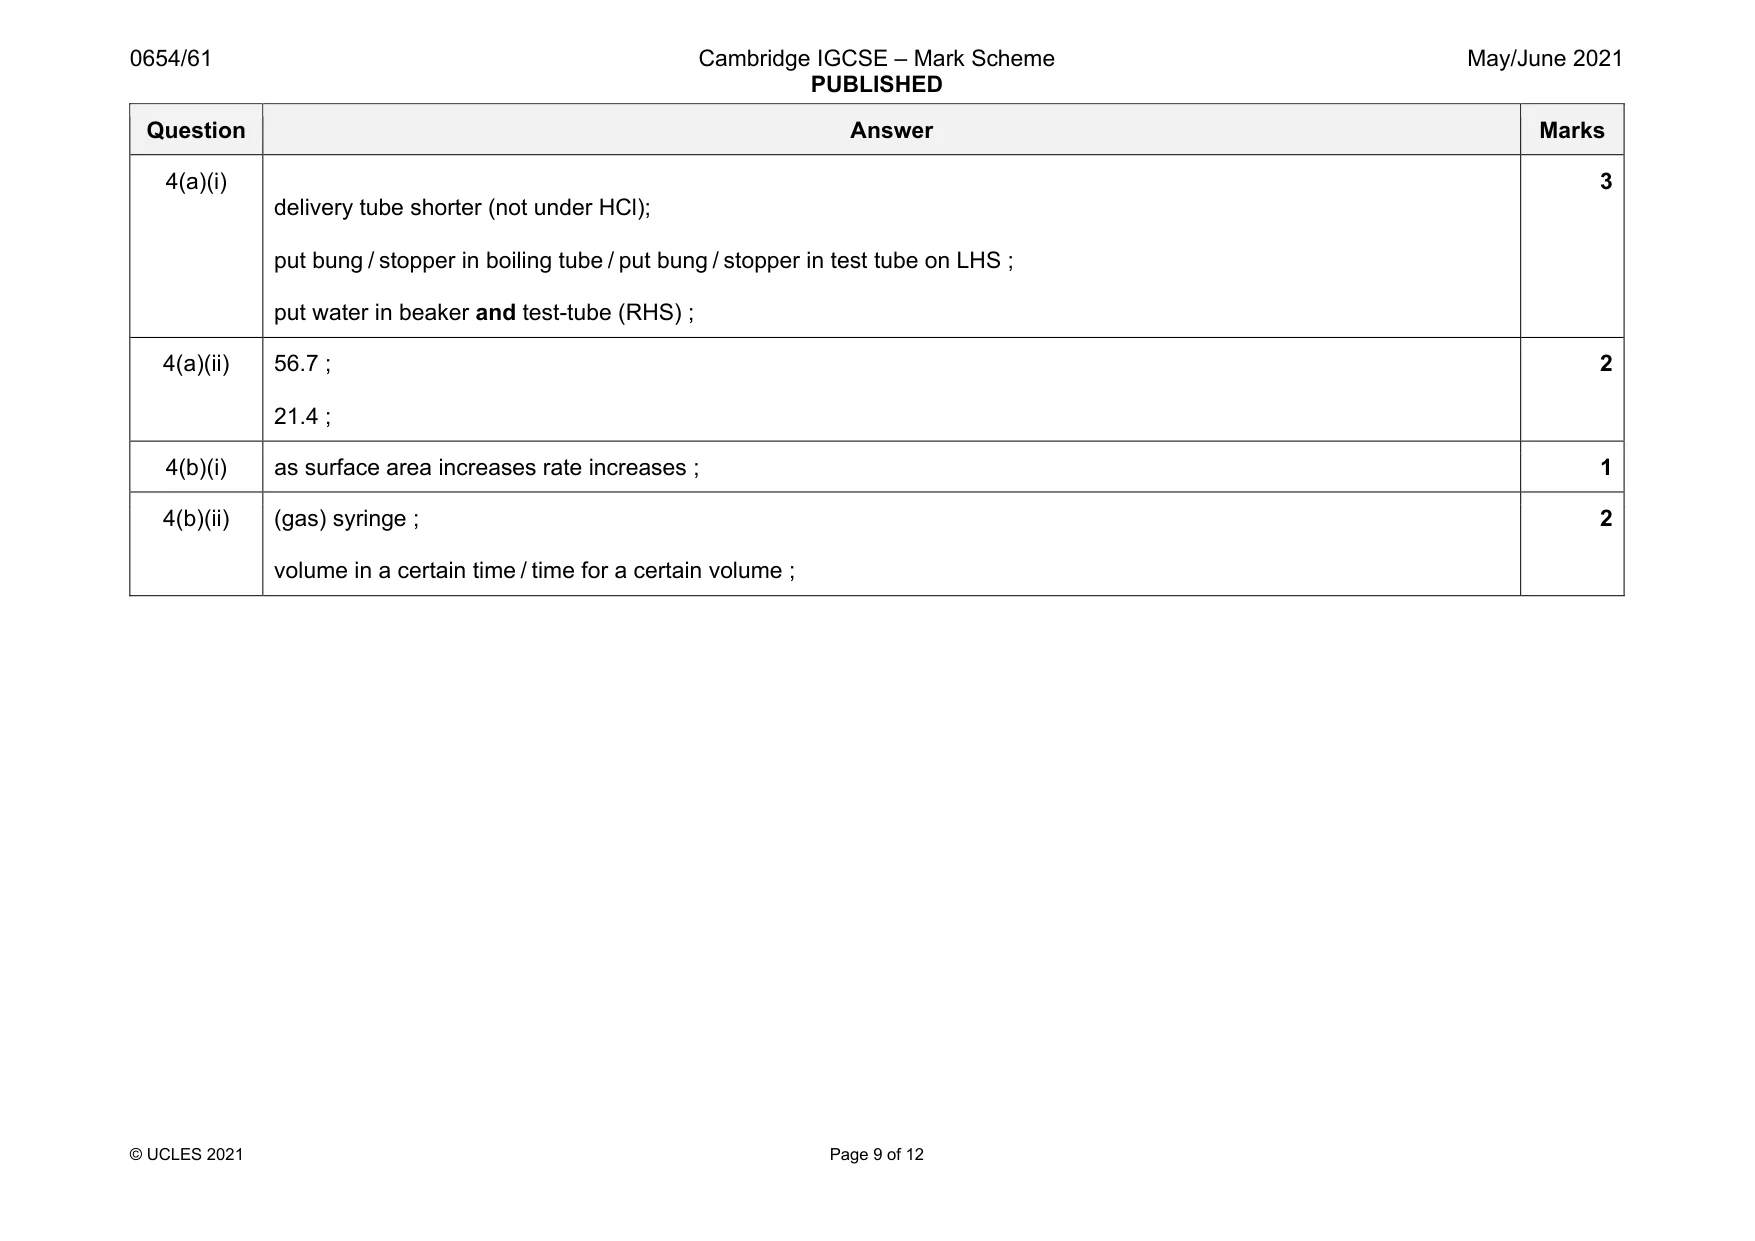
Mark scheme: 4(a)(i) delivery tube shorter (not under HCl); put bung / stopper in boiling tube / put bung / stopper in test tube on LHS ; put water in beaker and test-tube (RHS) ; 3 4(a)(ii) 56.7 ; 21.4 ; 2 4(b)(i) as surface area increases rate increases ; 1 4(b)(ii) (gas) syringe ; volume in a certain time / time for a certain volume ; 2
Q5 · Pure water has a fixed boiling temperature of 100 °C
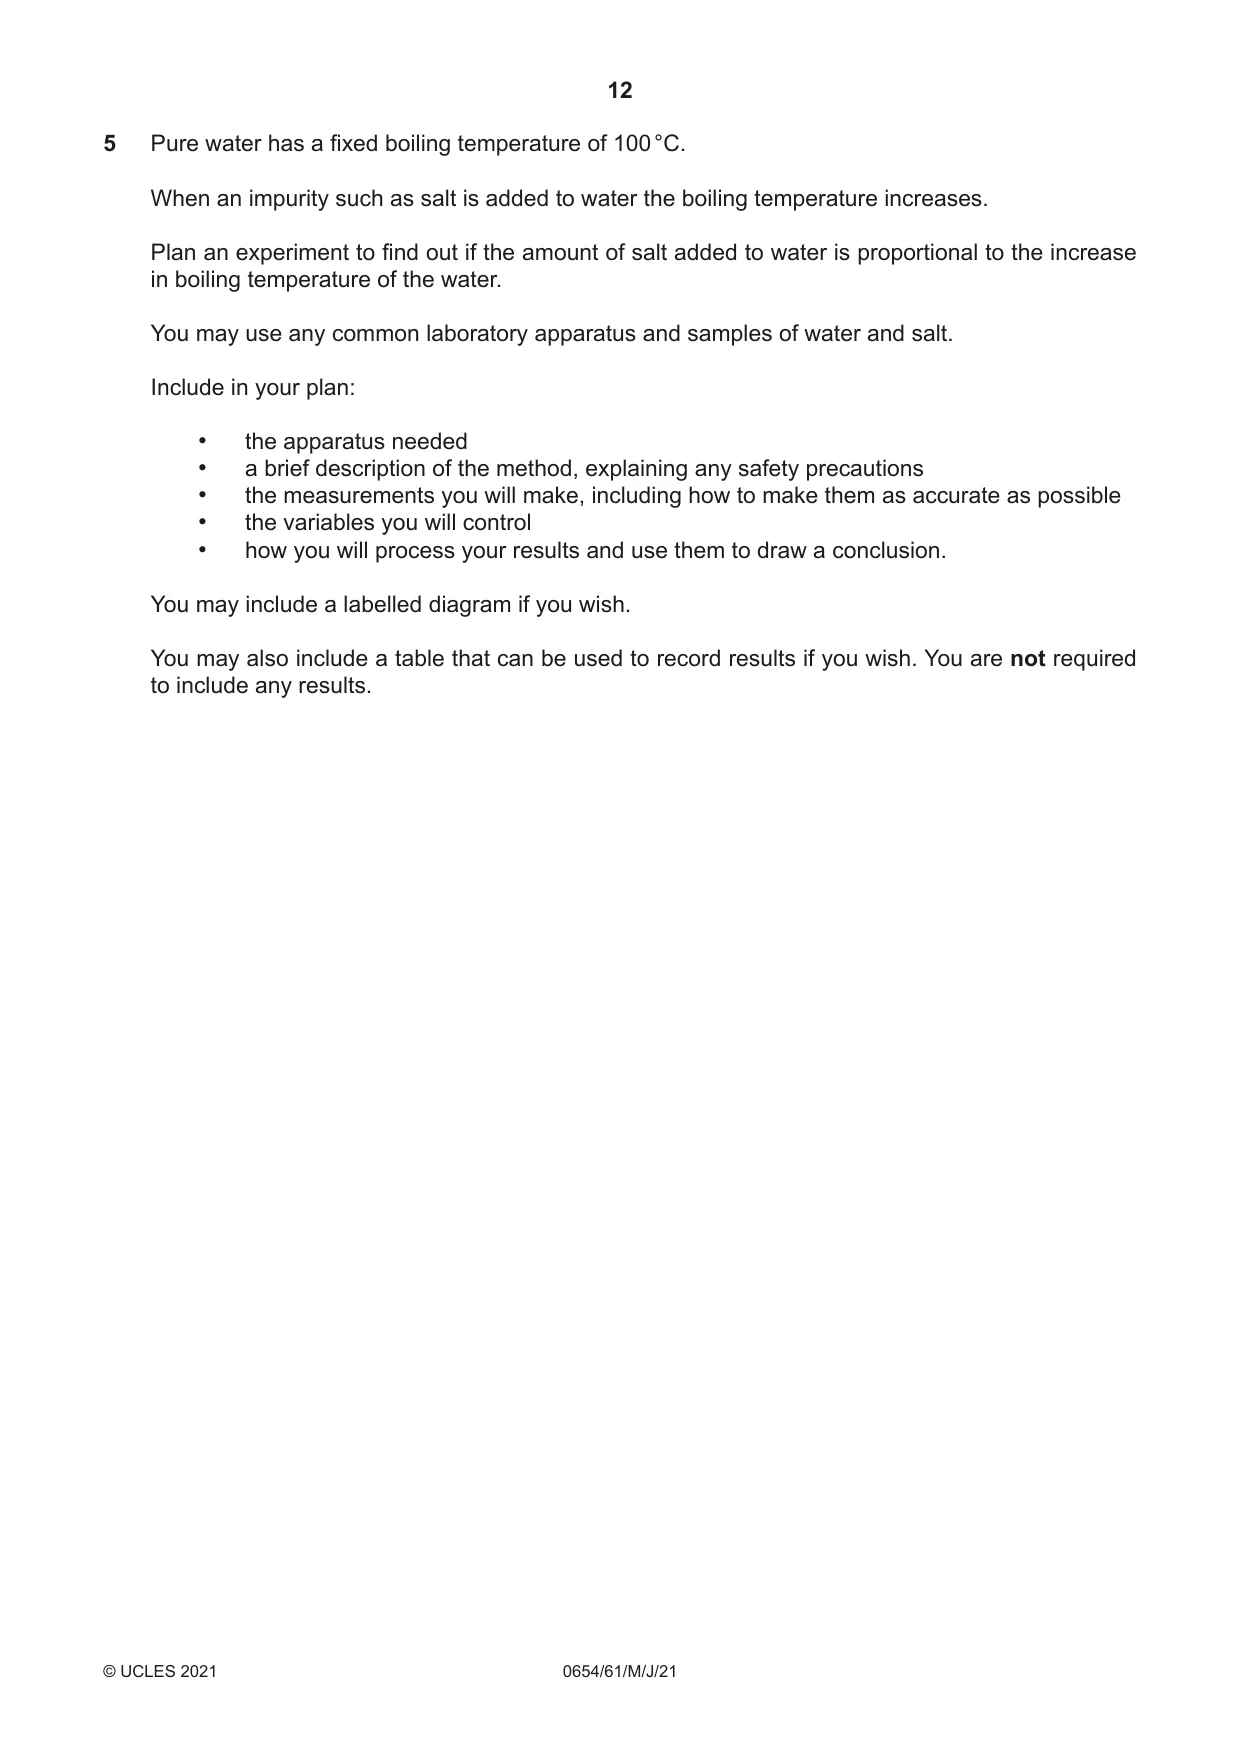
5 Pure water has a fixed boiling temperature of 100 °C. When an impurity such as salt is added to water the boiling temperature increases. Plan an experiment to find out if the amount of salt added to water is proportional to the increase in boiling temperature of the water. You may use any common laboratory apparatus and samples of water and salt. Include in your plan: • the apparatus needed • a brief description of the method, explaining any safety precautions • the measurements you will make, including how to make them as accurate as possible • the variables you will control • how you will process your results and use them to draw a conclusion. You may include a labelled diagram if you wish. You may also include a table that can be used to record results if you wish. You are not required to include any results. .......................................................................................................................................................... .......................................................................................................................................................... .......................................................................................................................................................... .......................................................................................................................................................... .......................................................................................................................................................... .......................................................................................................................................................... .......................................................................................................................................................... .......................................................................................................................................................... .......................................................................................................................................................... .......................................................................................................................................................... .......................................................................................................................................................... .......................................................................................................................................................... .......................................................................................................................................................... .......................................................................................................................................................... .......................................................................................................................................................... .......................................................................................................................................................... .......................................................................................................................................................... .......................................................................................................................................................... .......................................................................................................................................................... .................................................................................................................................................... [7]
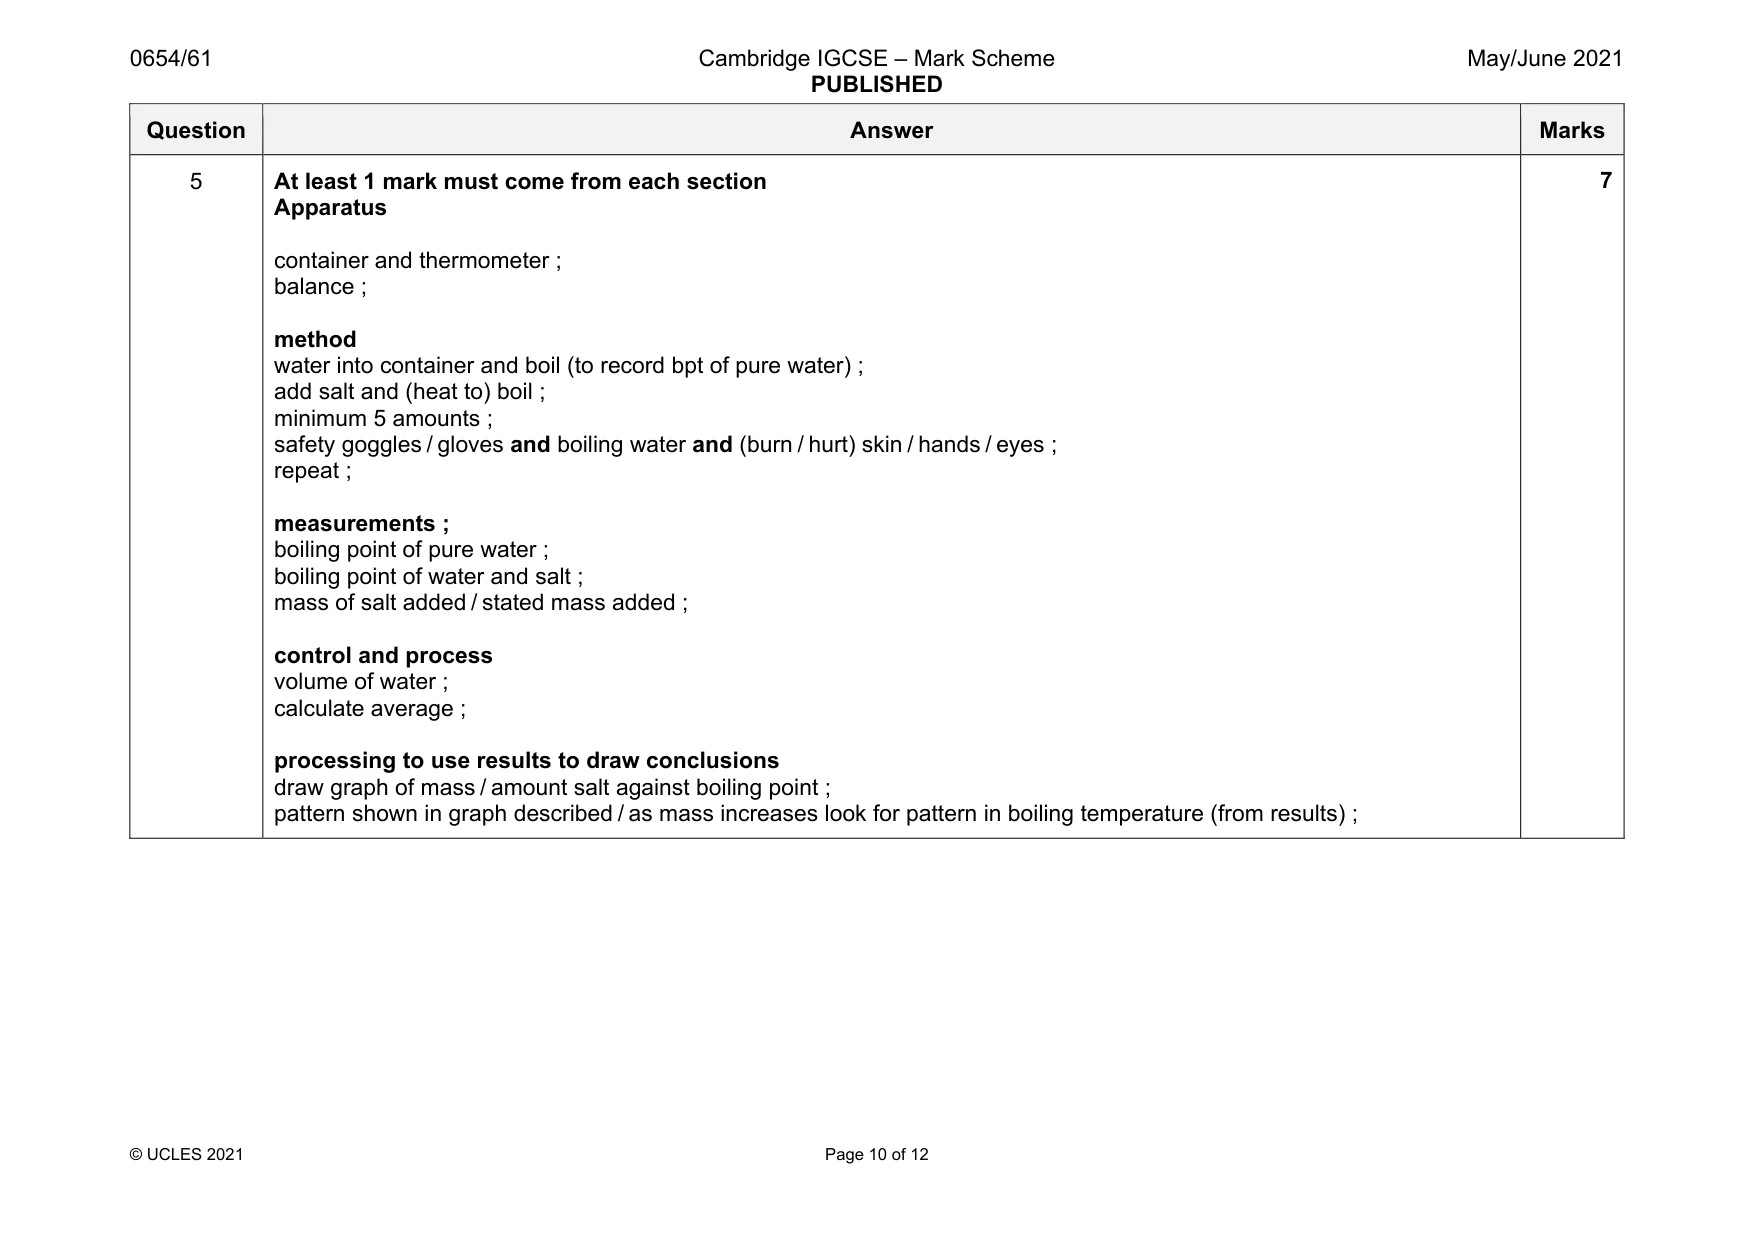
Mark scheme: 5 At least 1 mark must come from each section Apparatus container and thermometer ; balance ; method water into container and boil (to record bpt of pure water) ; add salt and (heat to) boil ; minimum 5 amounts ; safety goggles / gloves and boiling water and (burn / hurt) skin / hands / eyes ; repeat ; measurements ; boiling point of pure water ; boiling point of water and salt ; mass of salt added / stated mass added ; control and process volume of water ; calculate average ; processing to use results to draw conclusions draw graph of mass / amount salt against boiling point ; pattern shown in graph described / as mass increases look for pattern in boiling temperature (from results) ;
Q6 · A student investigates how the potential difference V across a lamp and the power P of…
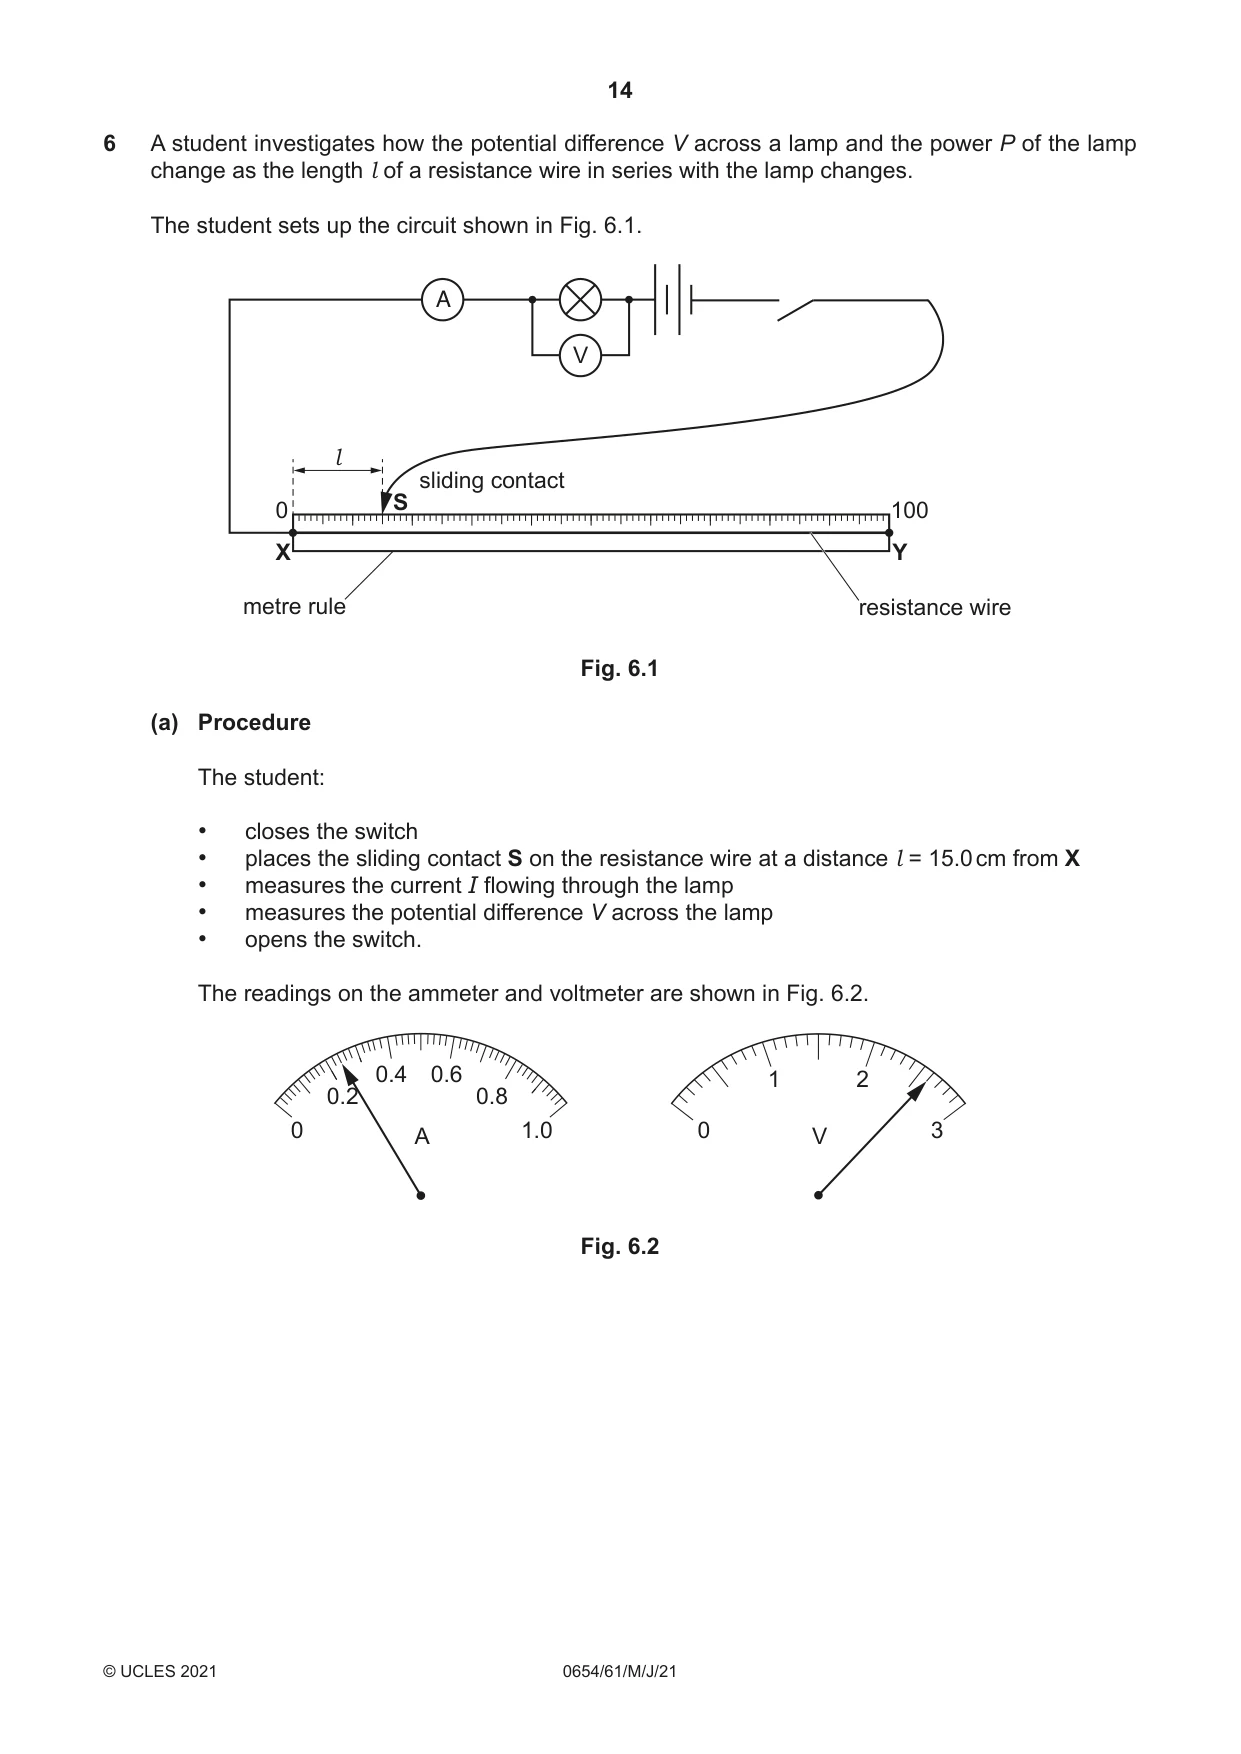
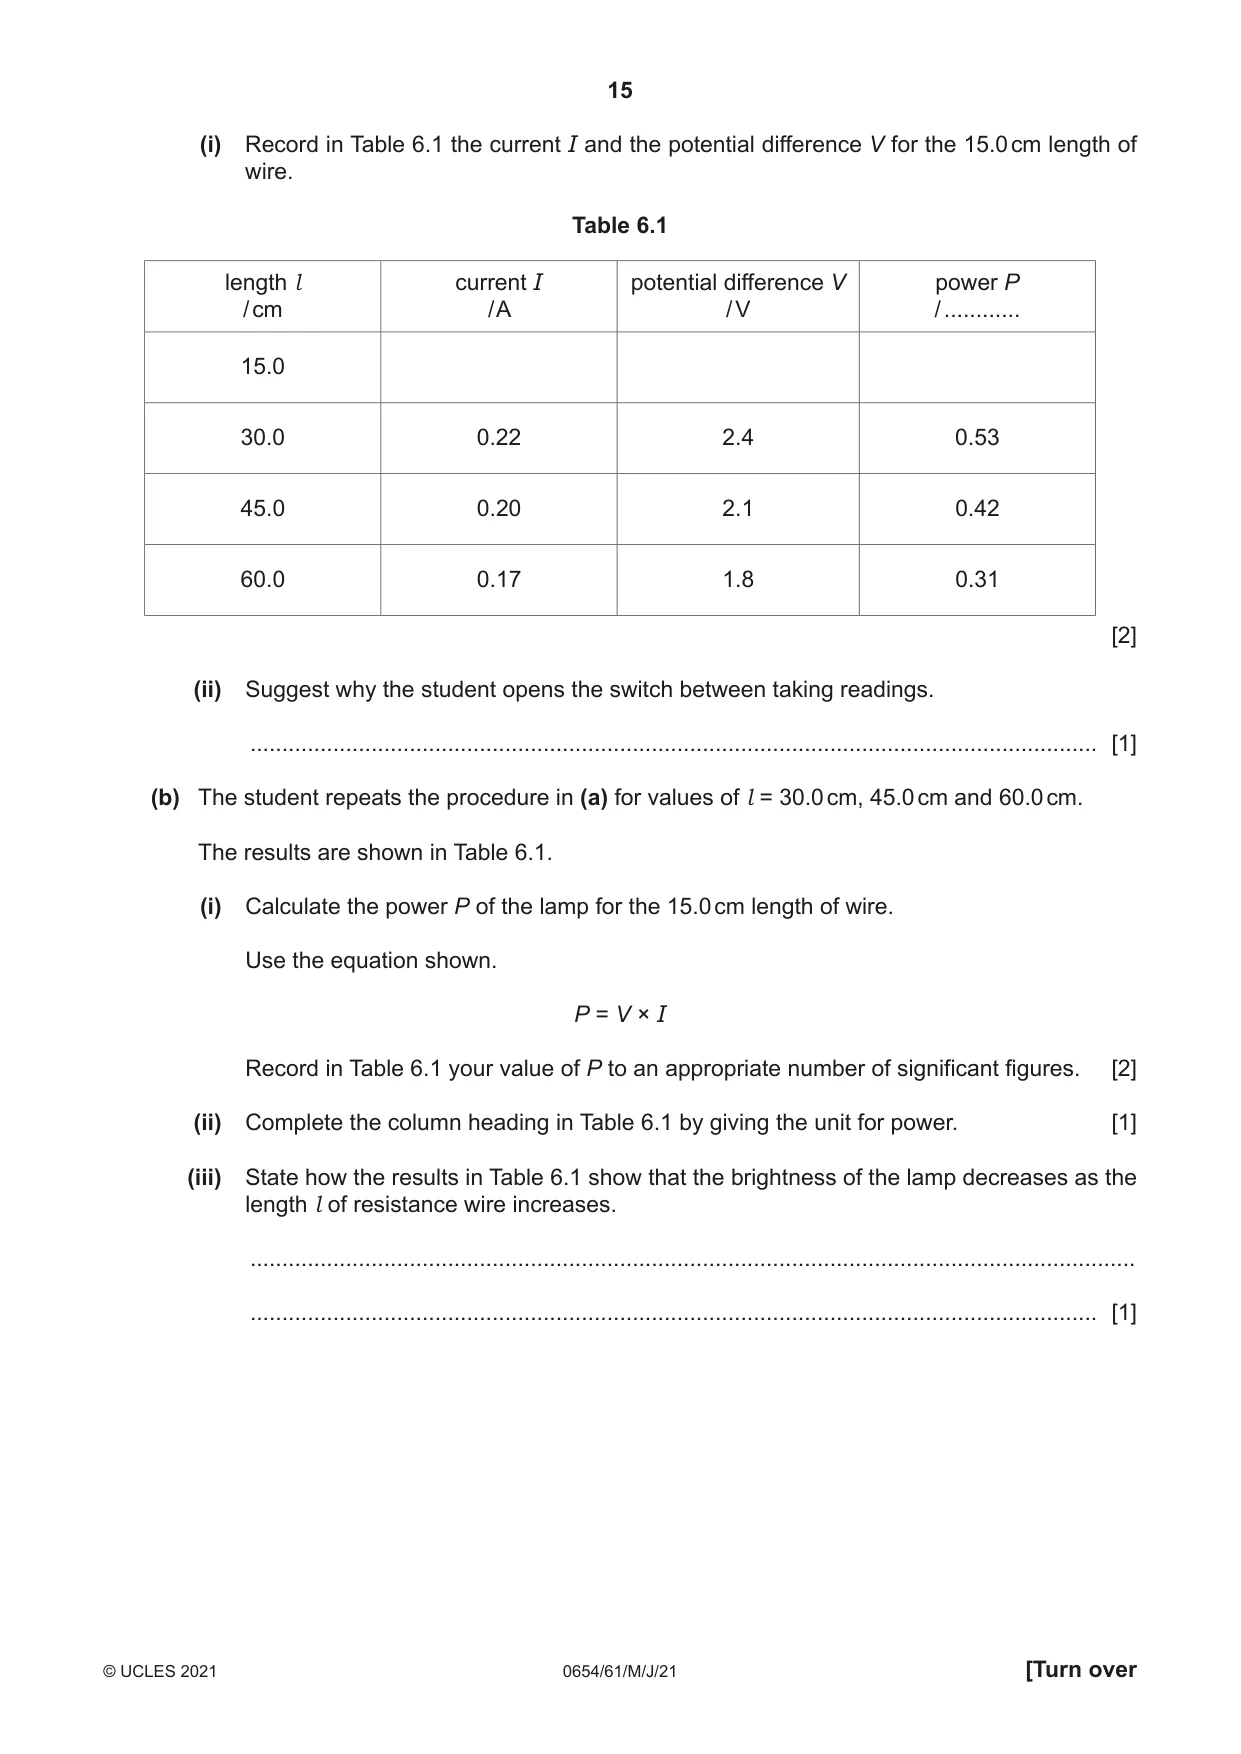
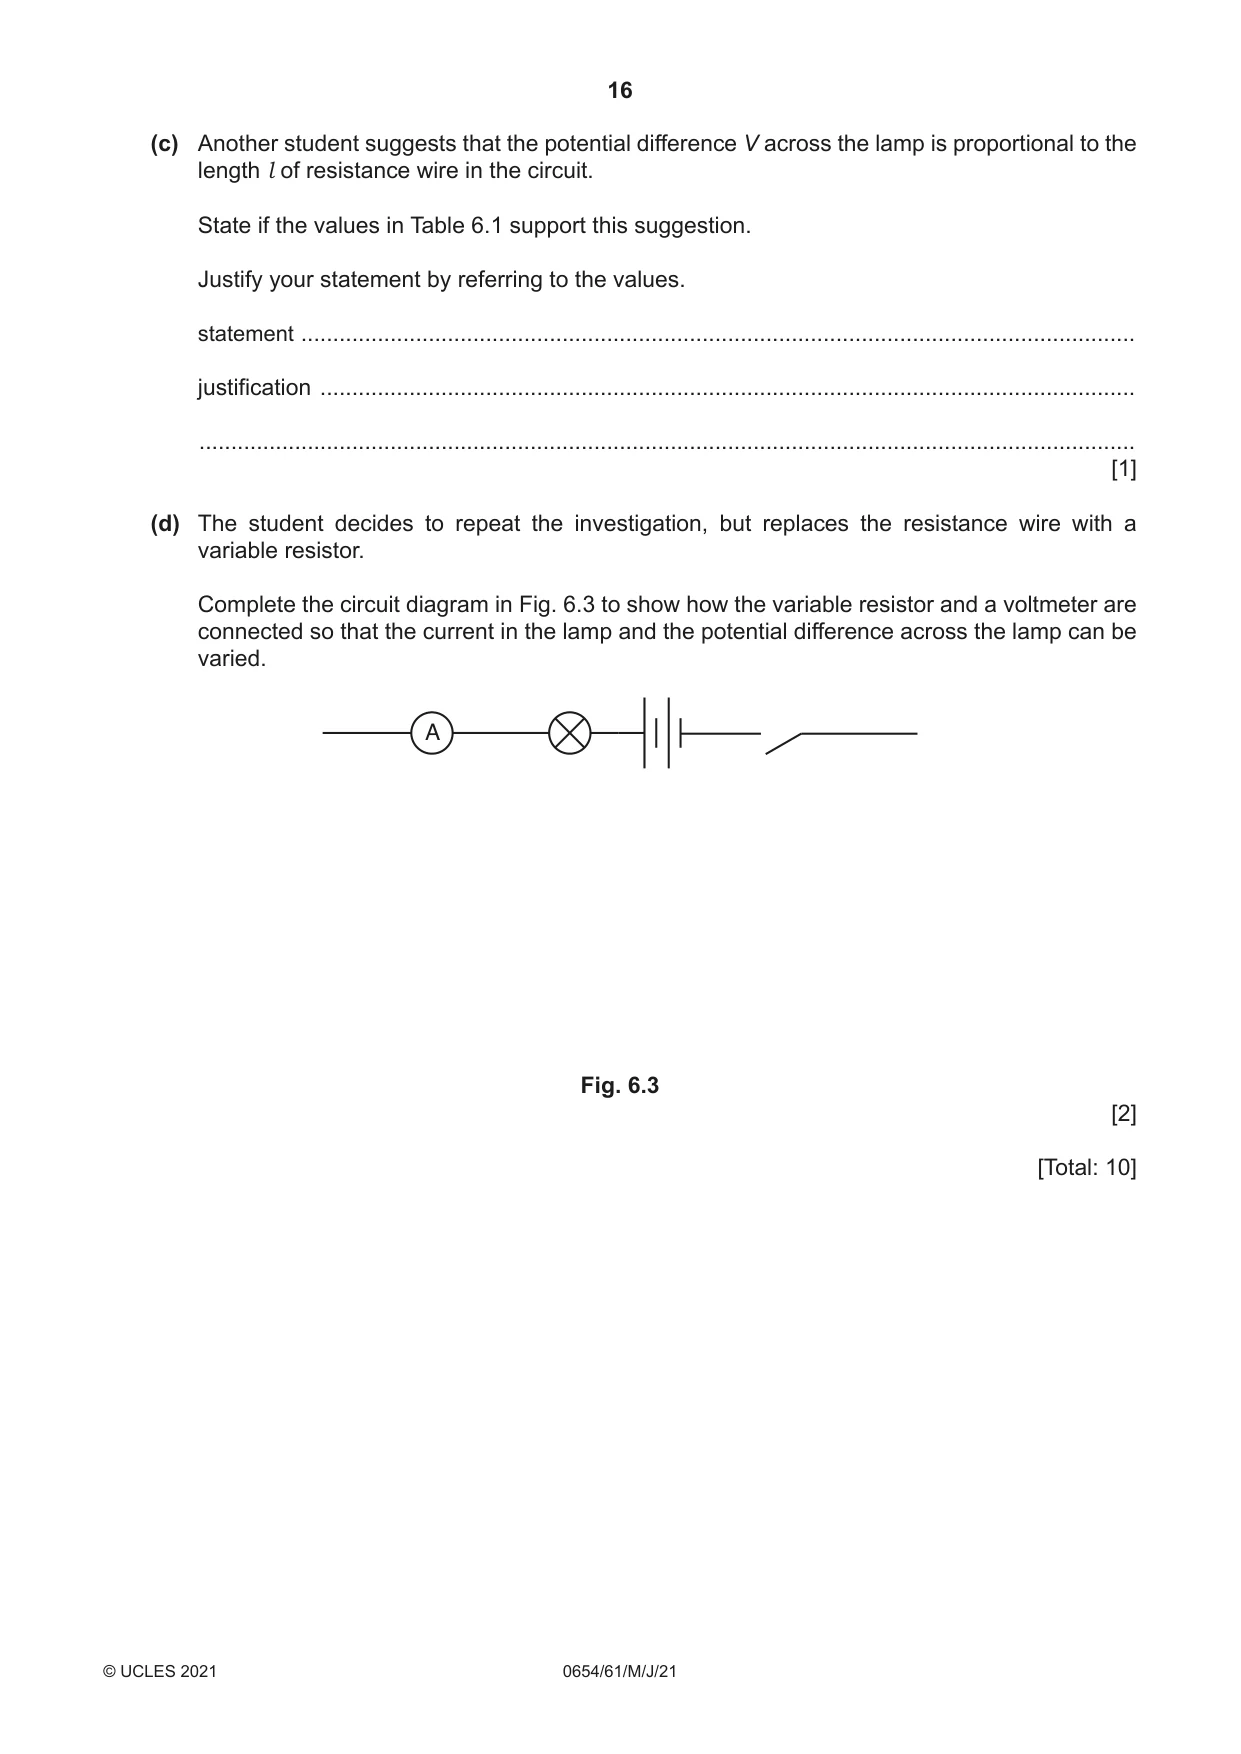
6 A student investigates how the potential difference V across a lamp and the power P of the lamp change as the length l of a resistance wire in series with the lamp changes. The student sets up the circuit shown in Fig. 6.1. A V l sliding contact 0 S 100 X Y metre rule resistance wire Fig. 6.1 (a) Procedure The student: • closes the switch • places the sliding contact S on the resistance wire at a distance l = 15.0 cm from X • measures the current I flowing through the lamp • measures the potential difference V across the lamp • opens the switch. The readings on the ammeter and voltmeter are shown in Fig. 6.2. 0.4 0.6 1 2 0.2 0.8 0 A 1.0 0 V 3 Fig. 6.2 (i) Record in Table 6.1 the current I and the potential difference V for the 15.0 cm length of wire. Table 6.1 length l current I potential difference V power P / cm / A / V / ............ 15.0 30.0 0.22 2.4 0.53 45.0 0.20 2.1 0.42 60.0 0.17 1.8 0.31 [2] (ii) Suggest why the student opens the switch between taking readings. ..................................................................................................................................... [1] (b) The student repeats the procedure in (a) for values of l = 30.0 cm, 45.0 cm and 60.0 cm. The results are shown in Table 6.1. (i) Calculate the power P of the lamp for the 15.0 cm length of wire. Use the equation shown. P = V × I Record in Table 6.1 your value of P to an appropriate number of significant figures. [2] (ii) Complete the column heading in Table 6.1 by giving the unit for power. [1] (iii) State how the results in Table 6.1 show that the brightness of the lamp decreases as the length l of resistance wire increases. ........................................................................................................................................... ..................................................................................................................................... [1] (c) Another student suggests that the potential difference V across the lamp is proportional to the length l of resistance wire in the circuit. State if the values in Table 6.1 support this suggestion. Justify your statement by referring to the values. statement ................................................................................................................................... justification ................................................................................................................................ ................................................................................................................................................... [1] (d) The student decides to repeat the investigation, but replaces the resistance wire with a variable resistor. Complete the circuit diagram in Fig. 6.3 to show how the variable resistor and a voltmeter are connected so that the current in the lamp and the potential difference across the lamp can be varied. A Fig. 6.3 [2] [Total: 10]
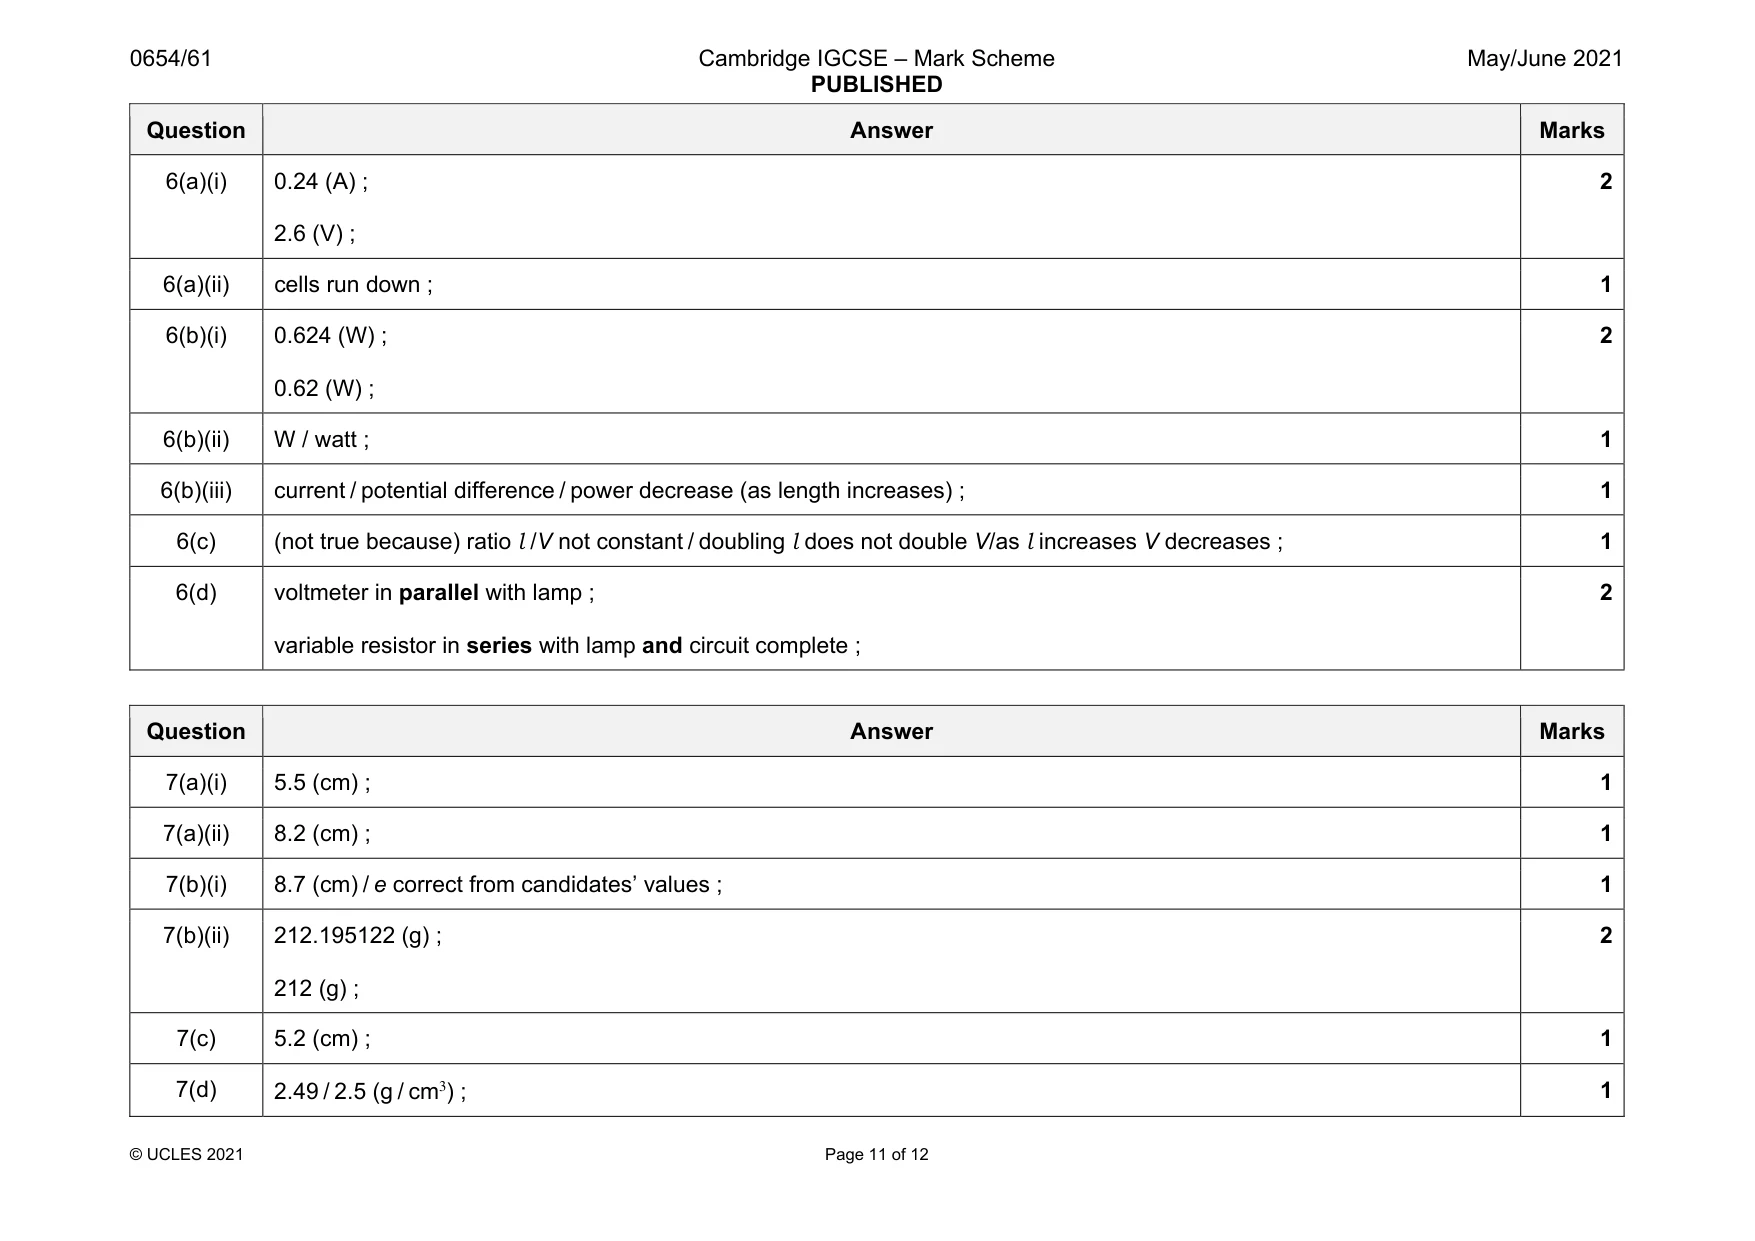
Mark scheme: 6(a)(i) 0.24 (A) ; 2.6 (V) ; 2 6(a)(ii) cells run down ; 1 6(b)(i) 0.624 (W) ; 0.62 (W) ; 2 6(b)(ii) W / watt ; 1 6(b)(iii) current / potential difference / power decrease (as length increases) ; 1 6(c) (not true because) ratio l /V not constant / doubling l does not double V/as l increases V decreases ; 1 6(d) voltmeter in parallel with lamp ; variable resistor in series with lamp and circuit complete ; 2
Q7 · A student uses a spring to measure the mass and density of a stone
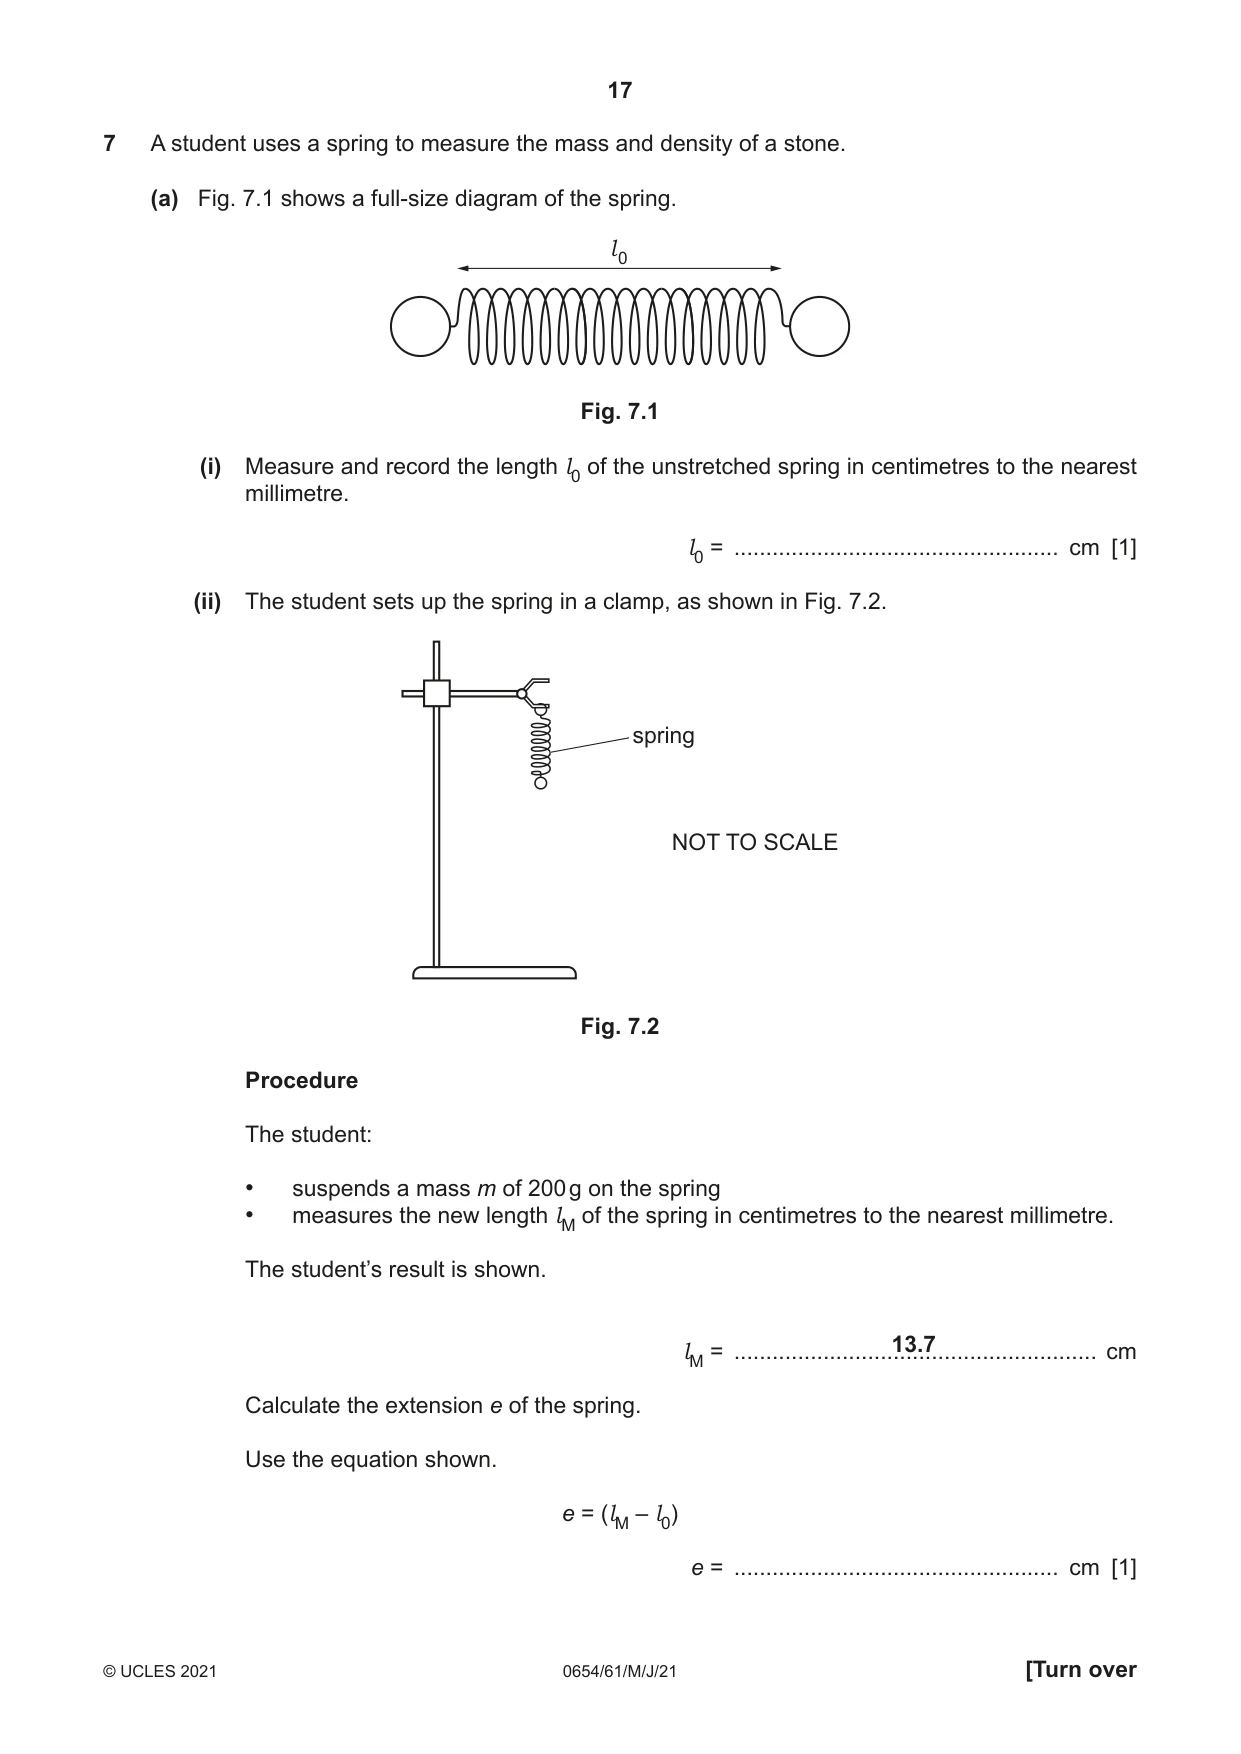
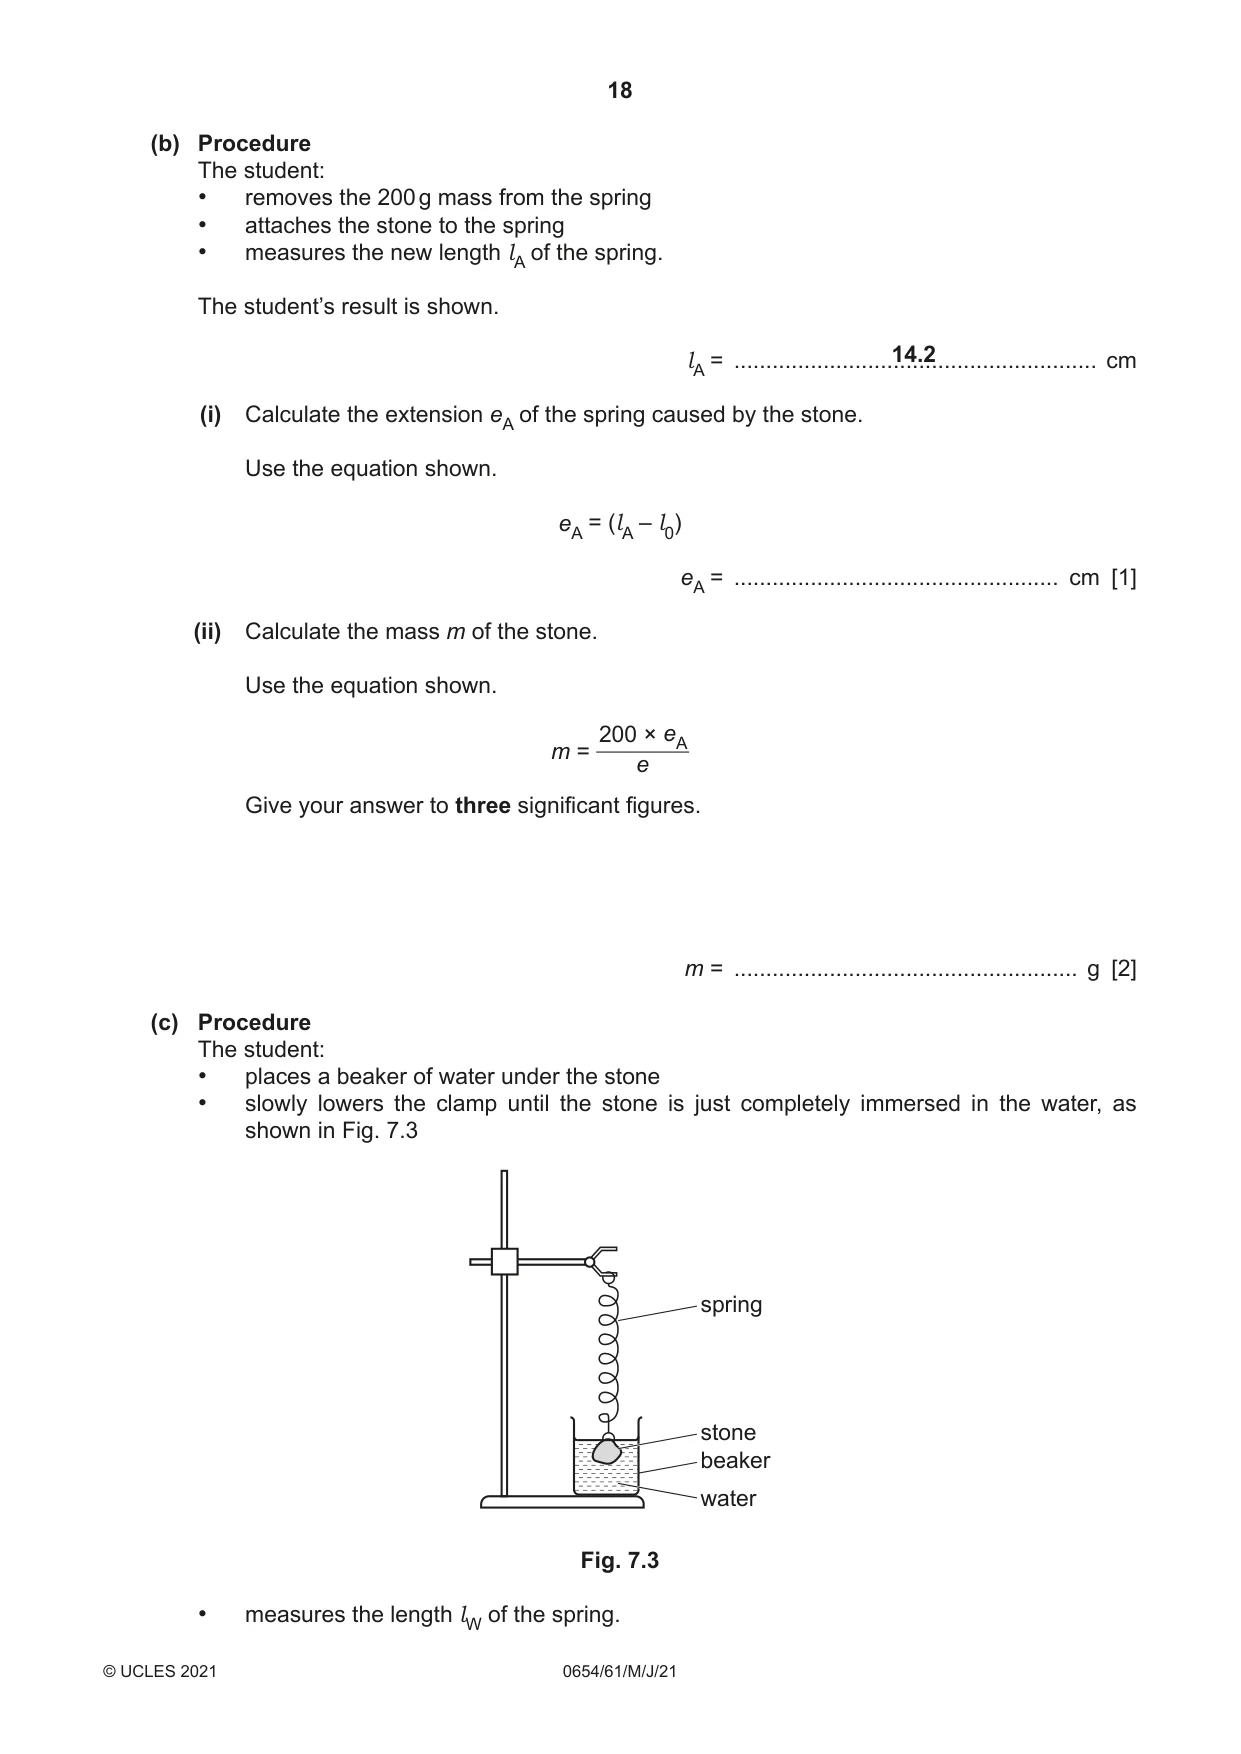
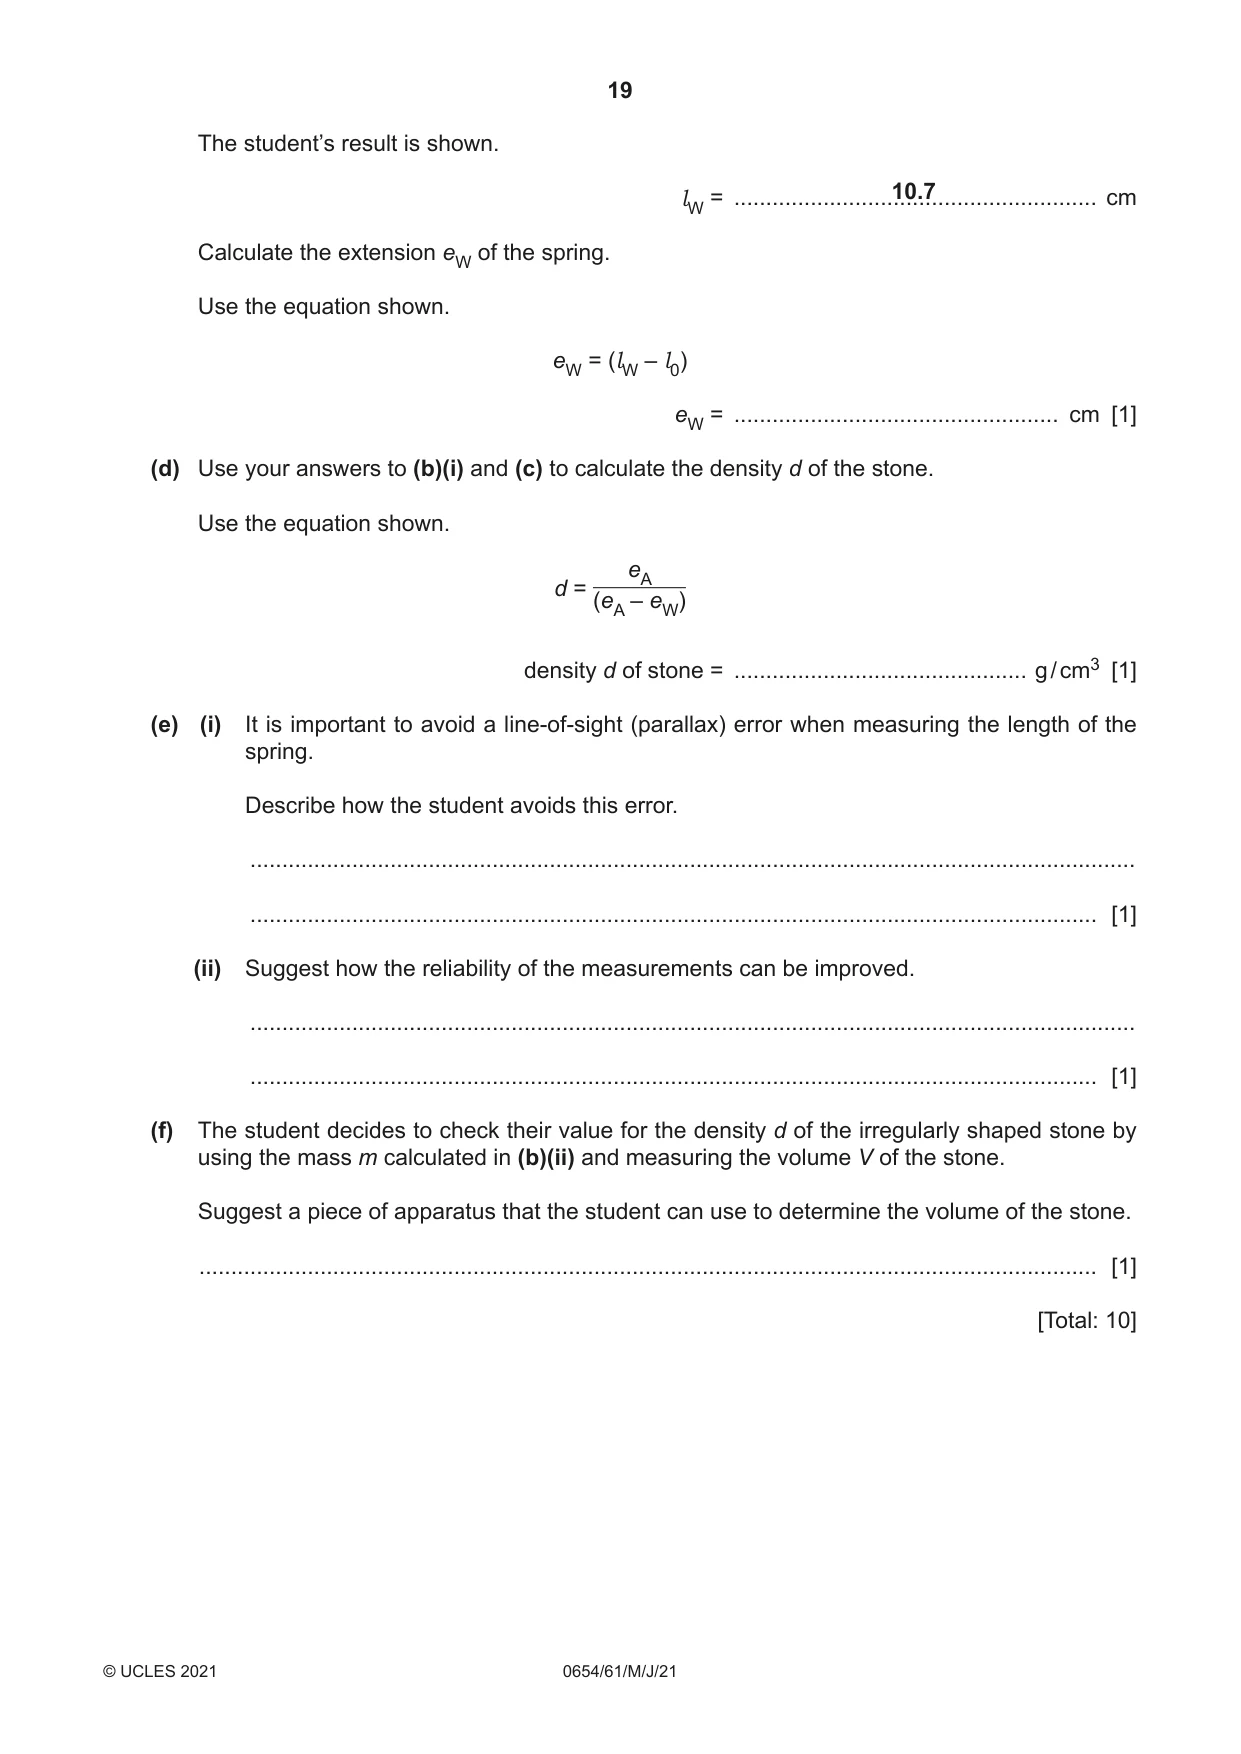
7 A student uses a spring to measure the mass and density of a stone. (a) Fig. 7.1 shows a full-size diagram of the spring. l 0 Fig. 7.1 (i) Measure and record the length l0 of the unstretched spring in centimetres to the nearest millimetre. l0 = ................................................... cm [1] (ii) The student sets up the spring in a clamp, as shown in Fig. 7.2. spring NOT TO SCALE Fig. 7.2 Procedure The student: • suspends a mass m of 200 g on the spring • measures the new length lM of the spring in centimetres to the nearest millimetre. The student’s result is shown. 13.7 cm lM = ......................................................... Calculate the extension e of the spring. Use the equation shown. e = (lM – l0) e = ................................................... cm [1] (b) Procedure The student: • removes the 200 g mass from the spring • attaches the stone to the spring • measures the new length lA of the spring. The student’s result is shown. 14.2 cm lA = ......................................................... (i) Calculate the extension eA of the spring caused by the stone. Use the equation shown. eA = (lA – l0) eA = ................................................... cm [1] (ii) Calculate the mass m of the stone. Use the equation shown. 200 × eA m = e Give your answer to three significant figures. m = ...................................................... g [2] (c) Procedure The student: • places a beaker of water under the stone • slowly lowers the clamp until the stone is just completely immersed in the water, as shown in Fig. 7.3 spring stone beaker water Fig. 7.3 • measures the length lW of the spring. The student’s result is shown. 10.7 cm lW = ......................................................... Calculate the extension eW of the spring. Use the equation shown. eW = (lW – l0) eW = ................................................... cm [1] (d) Use your answers to (b)(i) and (c) to calculate the density d of the stone. Use the equation shown. eA d = (eA – eW) density d of stone = .............................................. g / cm3 [1] (e) (i) It is important to avoid a line-of-sight (parallax) error when measuring the length of the spring. Describe how the student avoids this error. ........................................................................................................................................... ..................................................................................................................................... [1] (ii) Suggest how the reliability of the measurements can be improved. ........................................................................................................................................... ..................................................................................................................................... [1] (f) The student decides to check their value for the density d of the irregularly shaped stone by using the mass m calculated in (b)(ii) and measuring the volume V of the stone. Suggest a piece of apparatus that the student can use to determine the volume of the stone. ............................................................................................................................................. [1] [Total: 10]
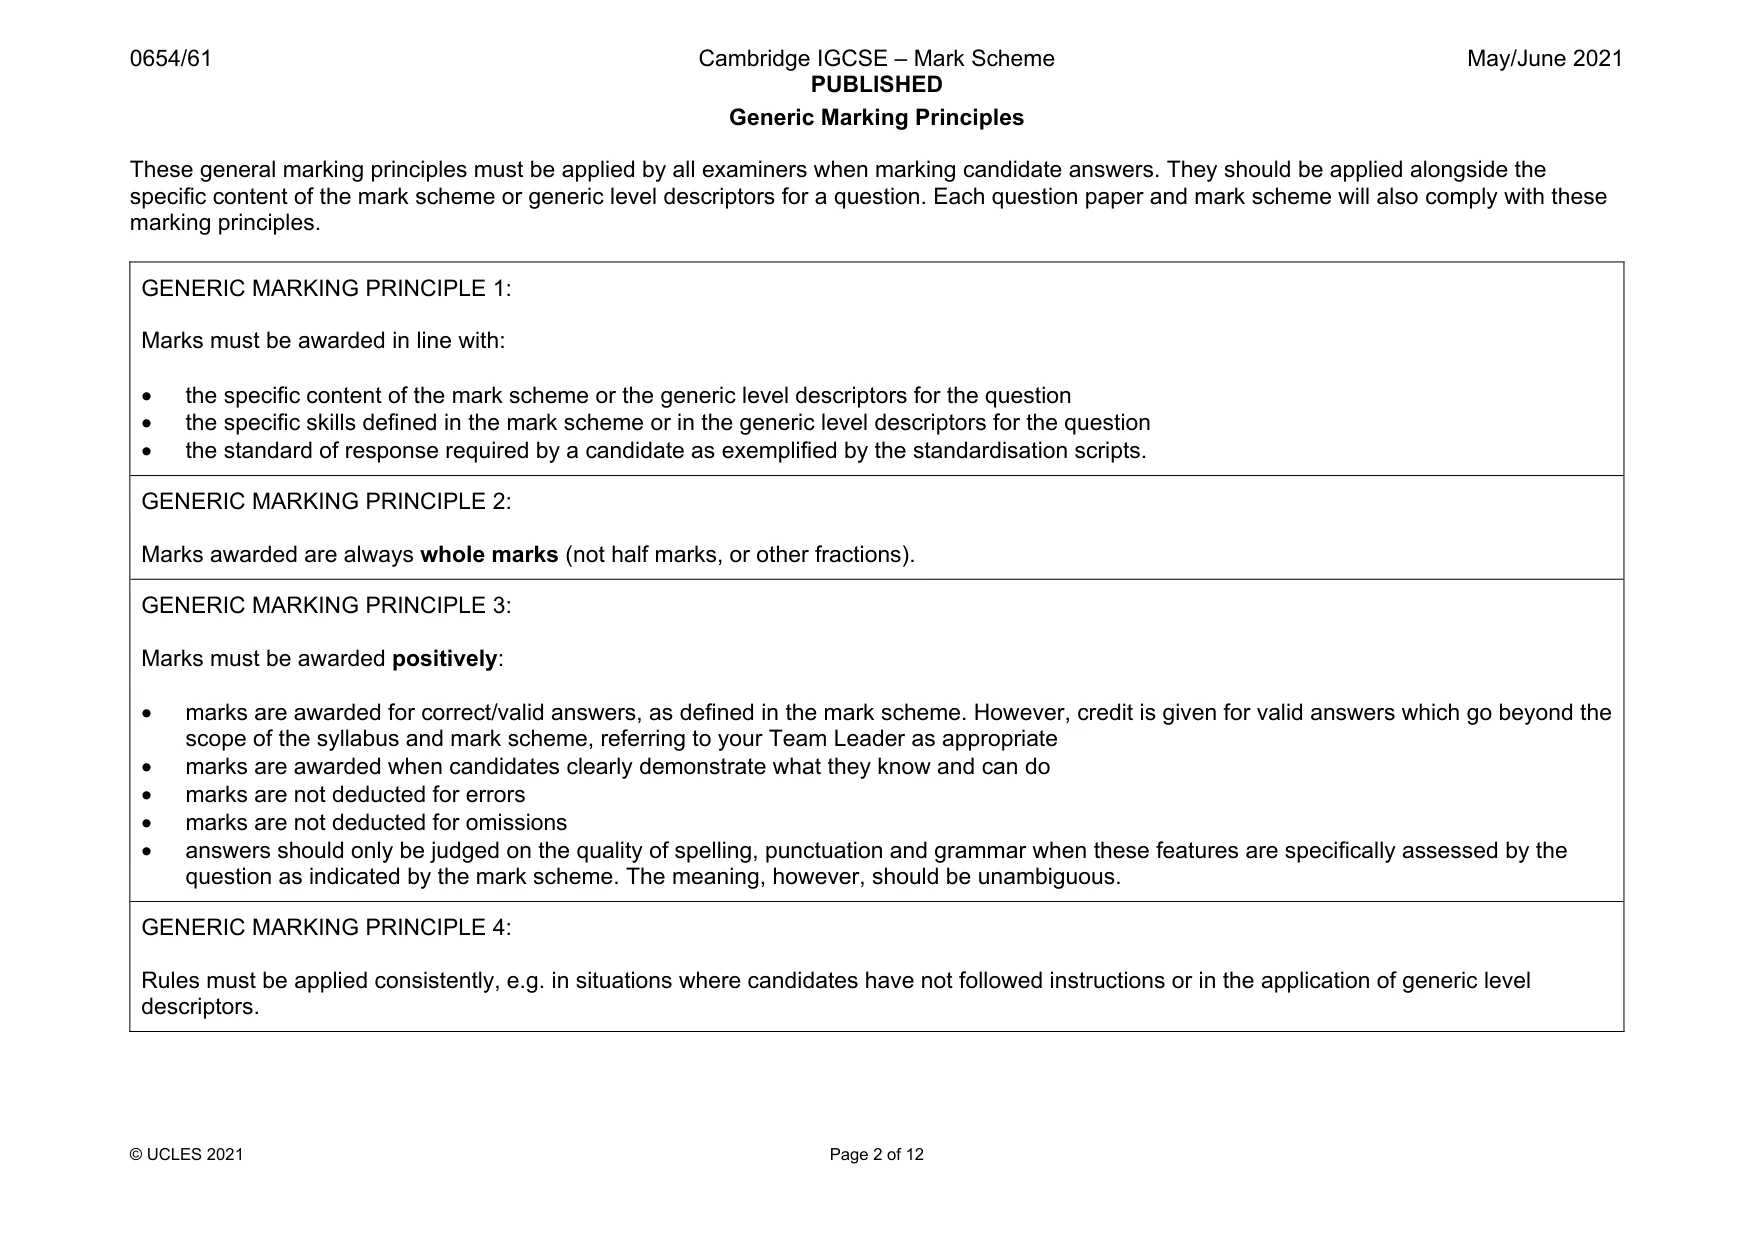
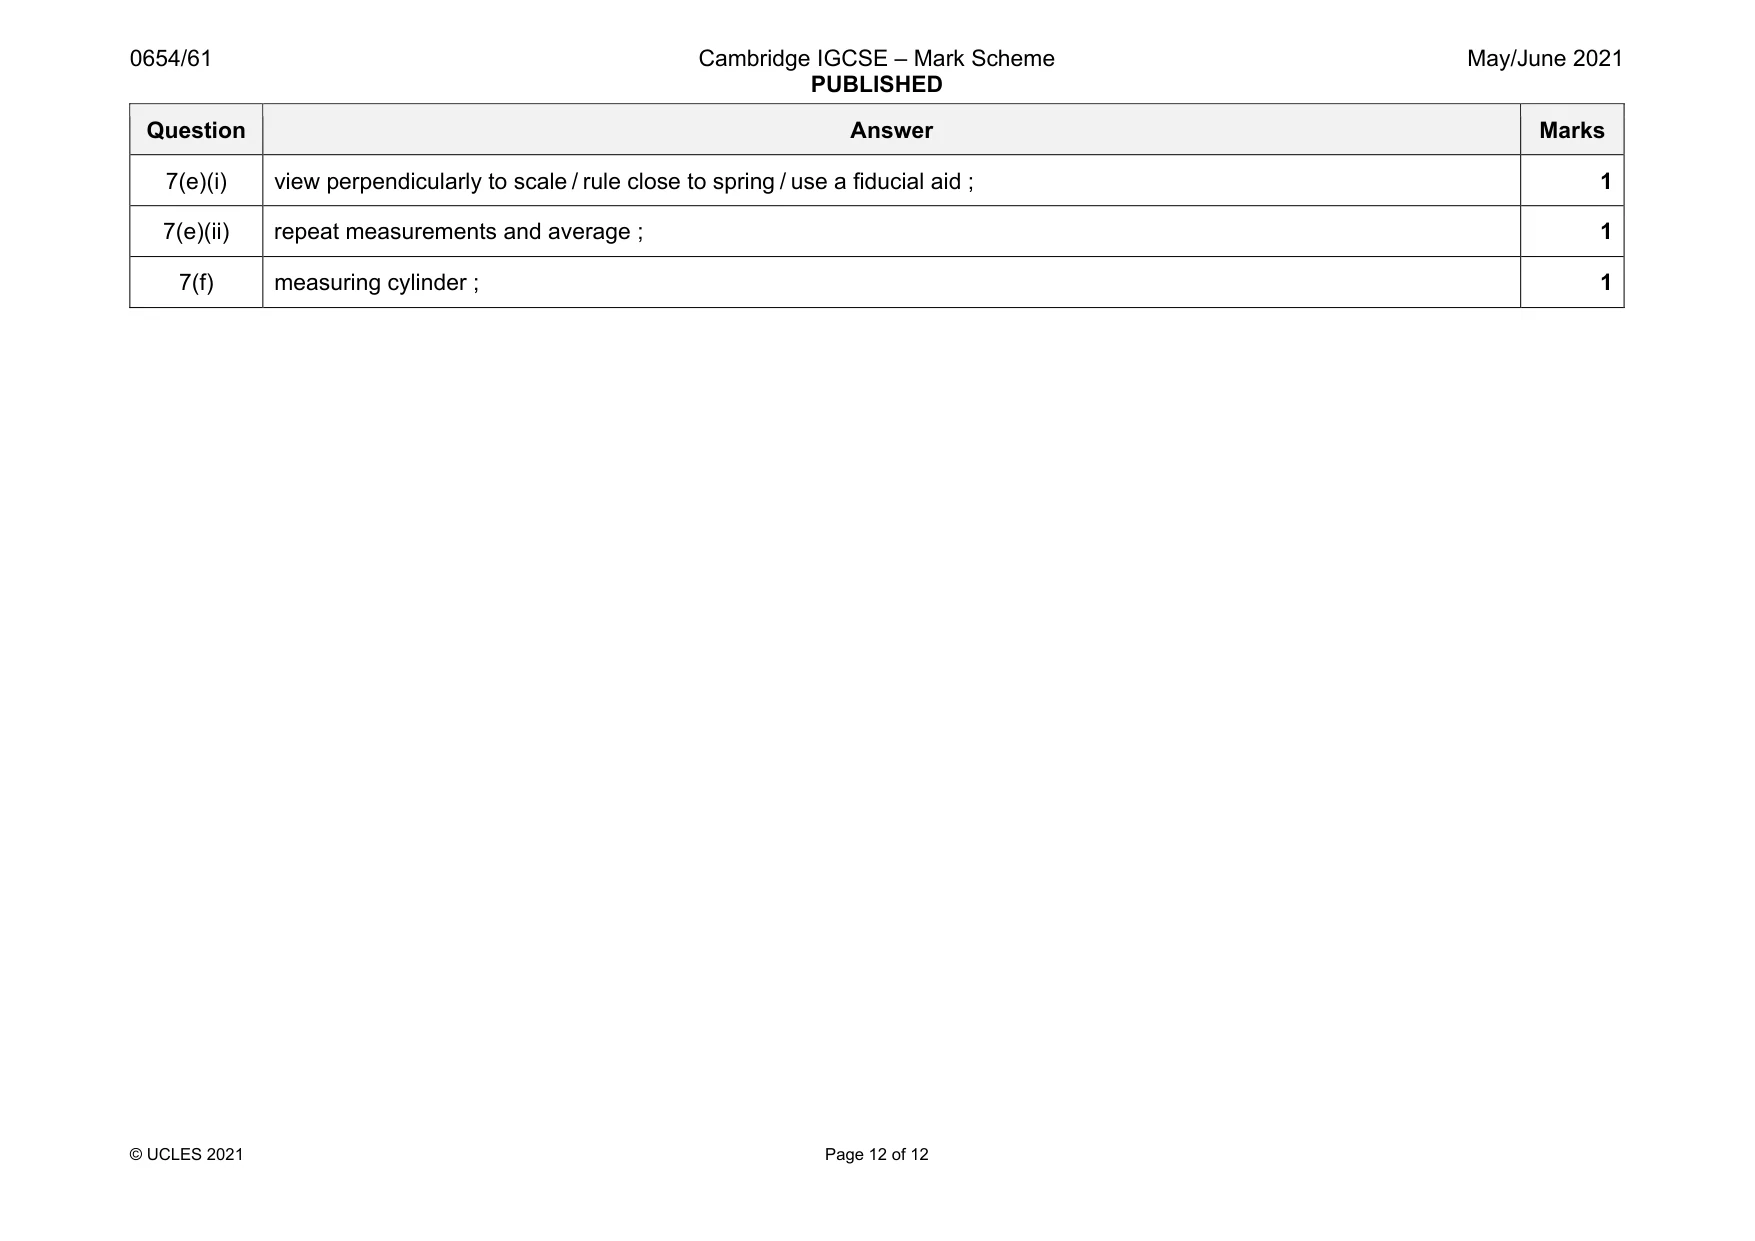
Mark scheme: 7(a)(i) 5.5 (cm) ; 1 7(a)(ii) 8.2 (cm) ; 1 7(b)(i) 8.7 (cm) / e correct from candidates’ values ; 1 7(b)(ii) 212.195122 (g) ; 212 (g) ; 2 7(c) 5.2 (cm) ; 1 7(d) 2.49 / 2.5 (g / cm3) ; 1 Question Answer Marks 7(e)(i) view perpendicularly to scale / rule close to spring / use a fiducial aid ; 1 7(e)(ii) repeat measurements and average ; 1 7(f) measuring cylinder ; 1
More questions on Physical quantities and measurement techniques
What was in this paper
The subtopics covered by these 7 questions, and how many questions each got. Open one in a new tab to see every Cambridge question on it.
What you needed in this session
Cambridge’s own grade thresholds for 2021 May/June, Paper 6 · Variant 1. A higher threshold means an easier paper — the bar moves with how the cohort did.