Cambridge IGCSE Sciences - Co-ordinated (Double) 0654 — 2019 Oct/Nov Paper 6 · Variant 3
0654/63/O/N/19 · 6 questions · 60 marks · ≈68 min
The question paper and its mark scheme, free to read here and free to download. This is Cambridge’s own paper, exactly as it was sat.
Question paper16 pages

Mark scheme10 pages
Answers below. Sit the paper first if you are practising.
Questions as text
Q1 · A student investigates an enzyme-catalysed reaction
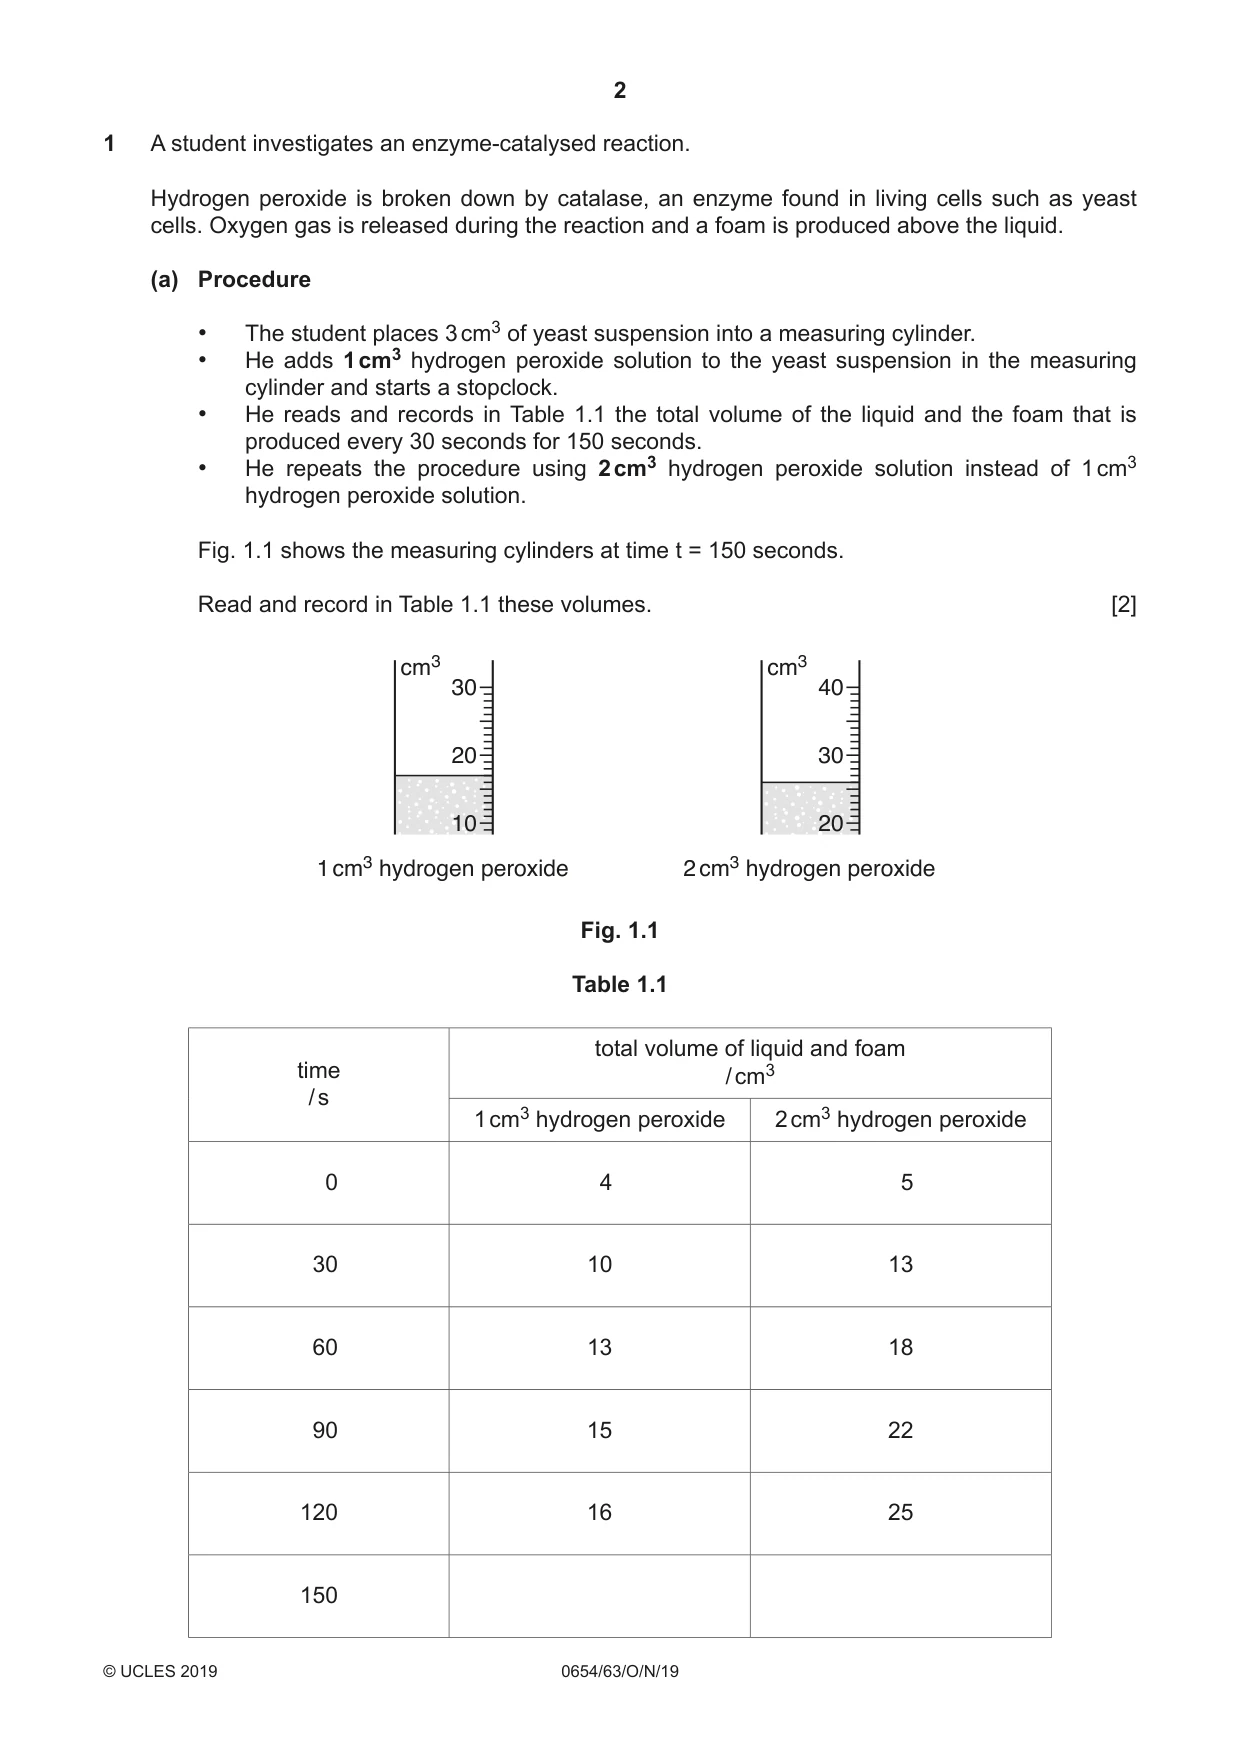
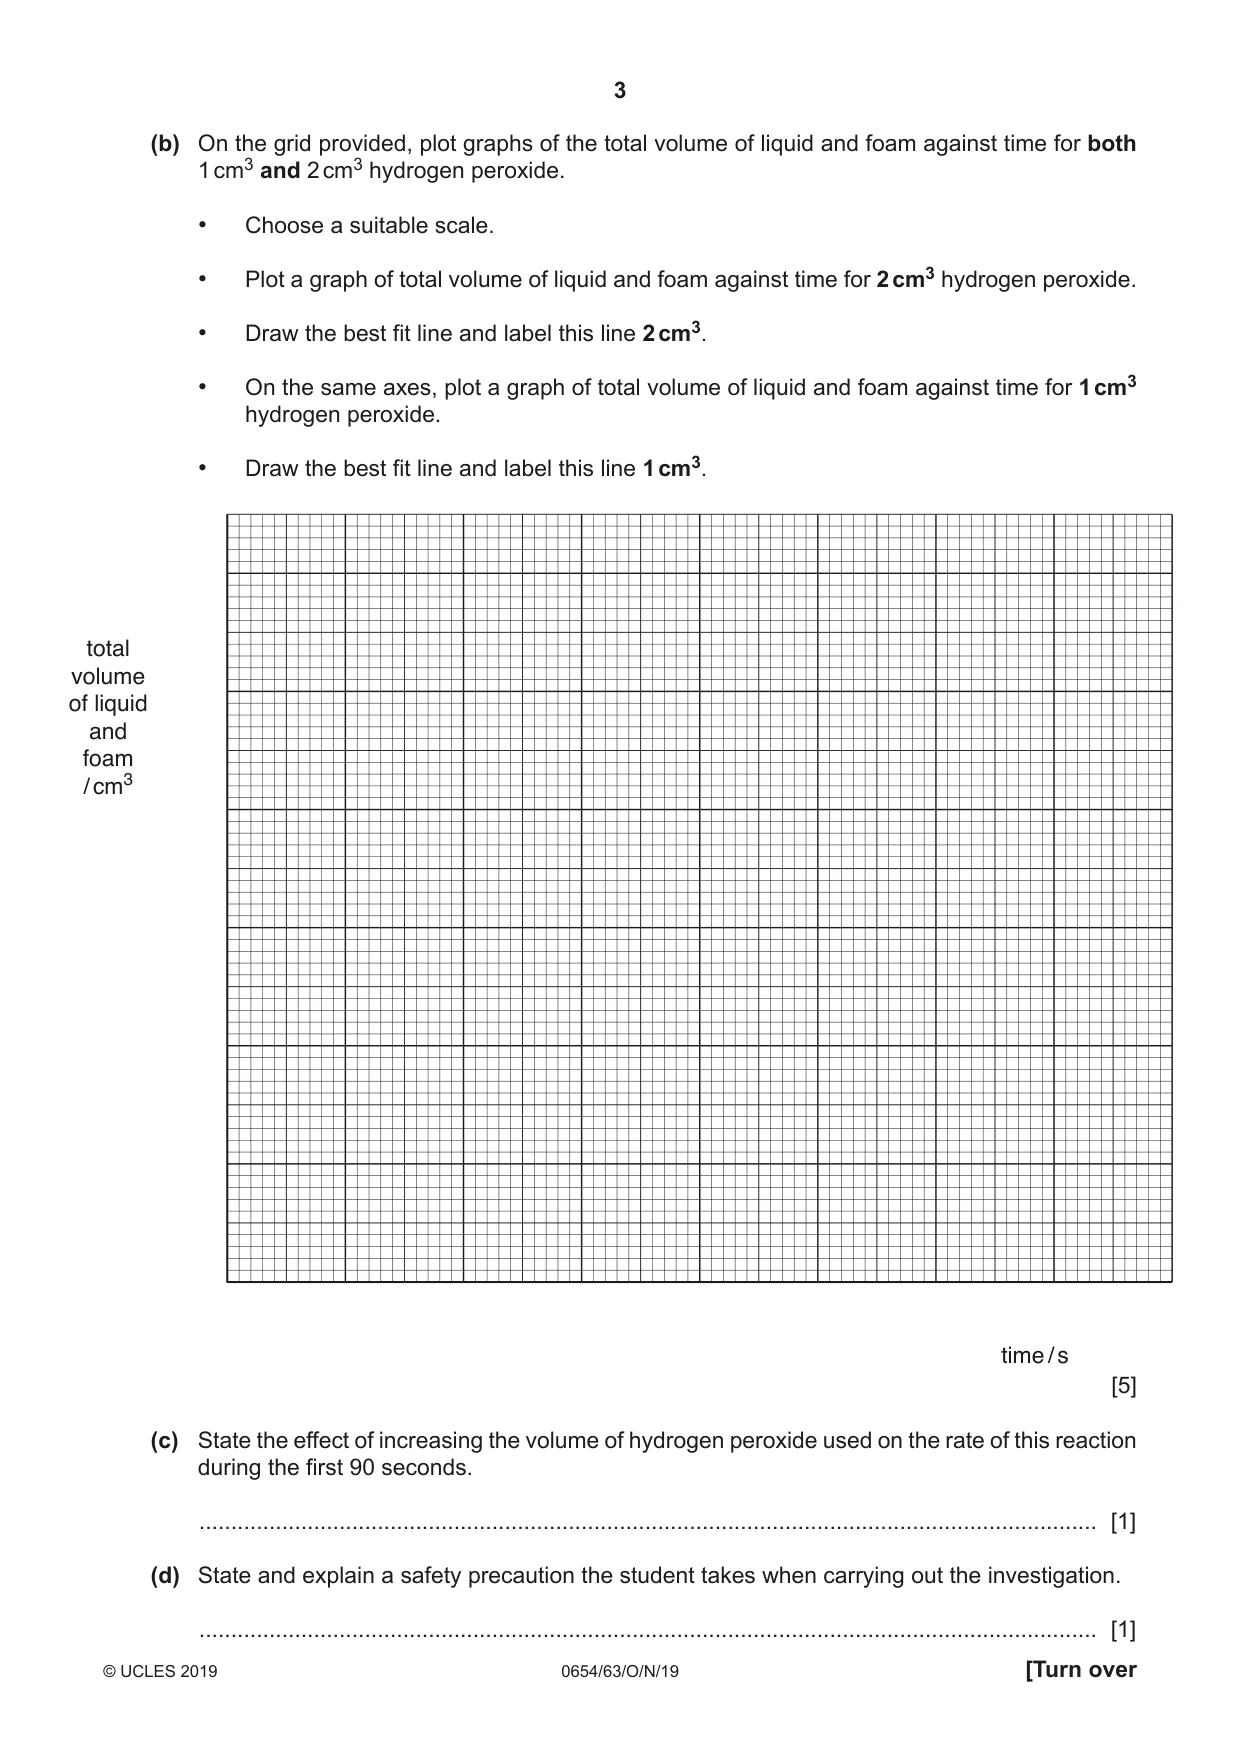
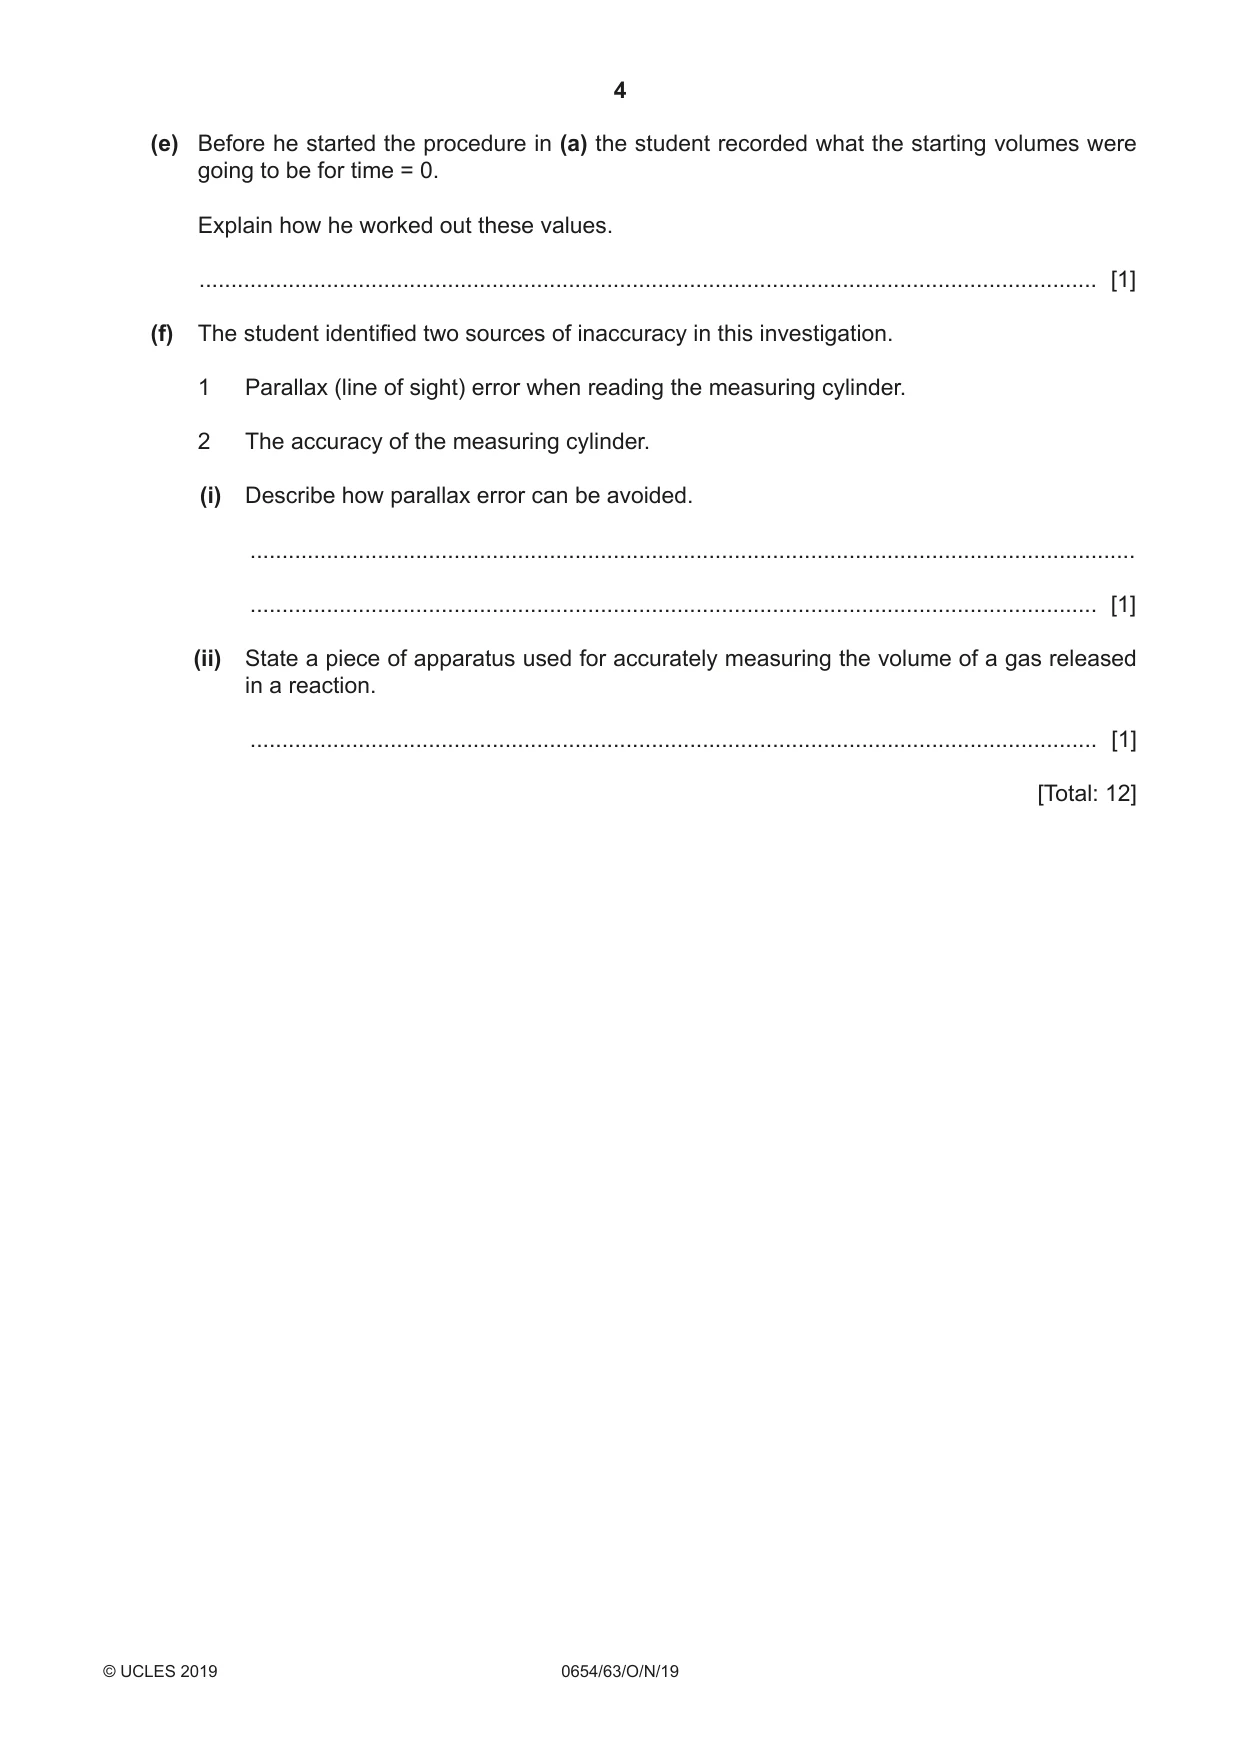
1 A student investigates an enzyme-catalysed reaction. Hydrogen peroxide is broken down by catalase, an enzyme found in living cells such as yeast cells. Oxygen gas is released during the reaction and a foam is produced above the liquid. (a) Procedure • The student places 3 cm3 of yeast suspension into a measuring cylinder. • He adds 1 cm3 hydrogen peroxide solution to the yeast suspension in the measuring cylinder and starts a stopclock. • He reads and records in Table 1.1 the total volume of the liquid and the foam that is produced every 30 seconds for 150 seconds. • He repeats the procedure using 2 cm3 hydrogen peroxide solution instead of 1 cm3 hydrogen peroxide solution. Fig. 1.1 shows the measuring cylinders at time t = 150 seconds. Read and record in Table 1.1 these volumes. [2] cm3 cm3 30 40 20 30 10 20 1 cm3 hydrogen peroxide 2 cm3 hydrogen peroxide Fig. 1.1 Table 1.1 total volume of liquid and foam time / cm3 / s 1 cm3 hydrogen peroxide 2 cm3 hydrogen peroxide 0 4 5 30 10 13 60 13 18 90 15 22 120 16 25 150 (b) On the grid provided, plot graphs of the total volume of liquid and foam against time for both 1 cm3 and 2 cm3 hydrogen peroxide. • Choose a suitable scale. • Plot a graph of total volume of liquid and foam against time for 2 cm3 hydrogen peroxide. • Draw the best fit line and label this line 2 cm3. • On the same axes, plot a graph of total volume of liquid and foam against time for 1 cm3 hydrogen peroxide. • Draw the best fit line and label this line 1 cm3. total volume of liquid and foam / cm3 time / s [5] (c) State the effect of increasing the volume of hydrogen peroxide used on the rate of this reaction during the first 90 seconds. ............................................................................................................................................. [1] (d) State and explain a safety precaution the student takes when carrying out the investigation. ............................................................................................................................................. [1] (e) Before he started the procedure in (a) the student recorded what the starting volumes were going to be for time = 0. Explain how he worked out these values. ............................................................................................................................................. [1] (f) The student identified two sources of inaccuracy in this investigation. 1 Parallax (line of sight) error when reading the measuring cylinder. 2 The accuracy of the measuring cylinder. (i) Describe how parallax error can be avoided. ........................................................................................................................................... ..................................................................................................................................... [1] (ii) State a piece of apparatus used for accurately measuring the volume of a gas released in a reaction. ..................................................................................................................................... [1] [Total: 12]
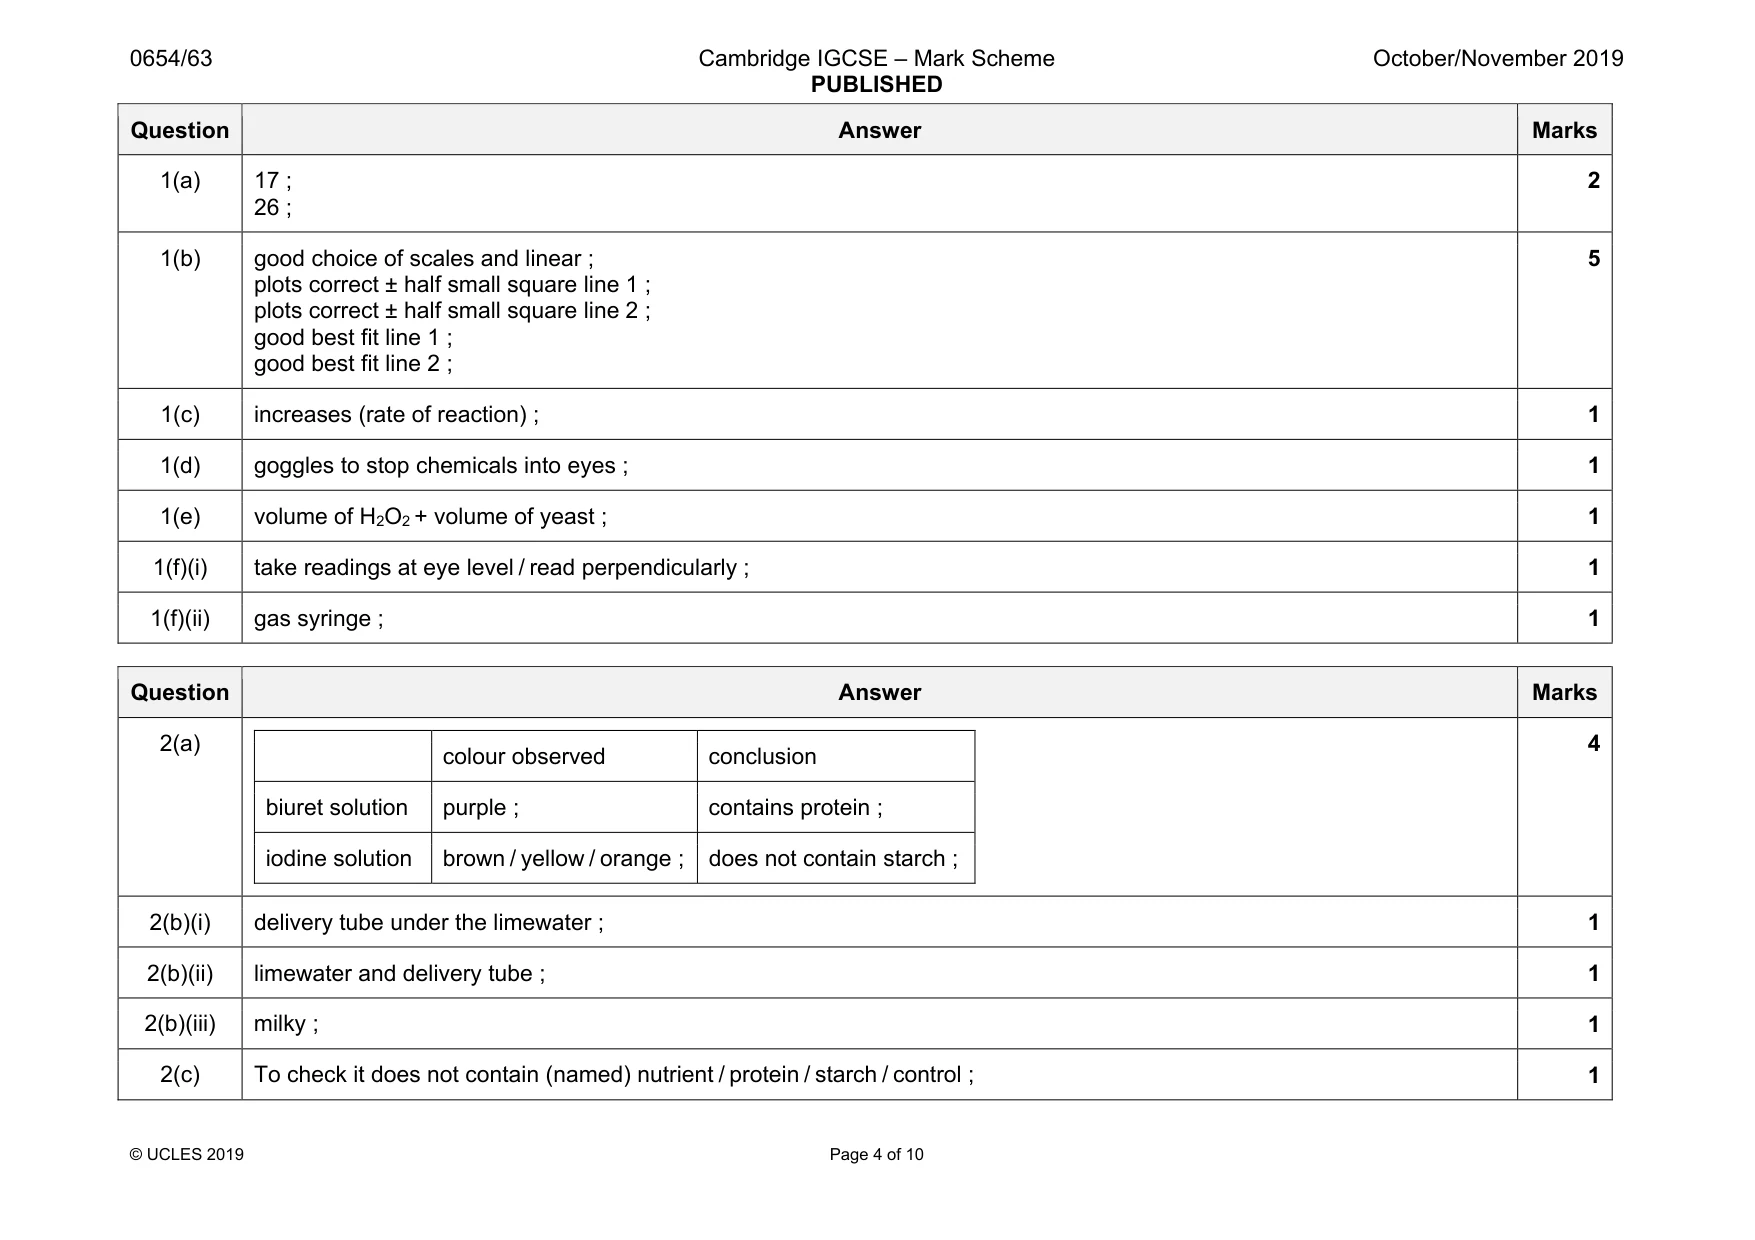
Mark scheme: 1(a) 17 ; 26 ; 2 1(b) good choice of scales and linear ; plots correct ± half small square line 1 ; plots correct ± half small square line 2 ; good best fit line 1 ; good best fit line 2 ; 5 1(c) increases (rate of reaction) ; 1 1(d) goggles to stop chemicals into eyes ; 1 1(e) volume of H2O2 + volume of yeast ; 1 1(f)(i) take readings at eye level / read perpendicularly ; 1 1(f)(ii) gas syringe ; 1
Q2 · A student investigates the nutrient content of yeast
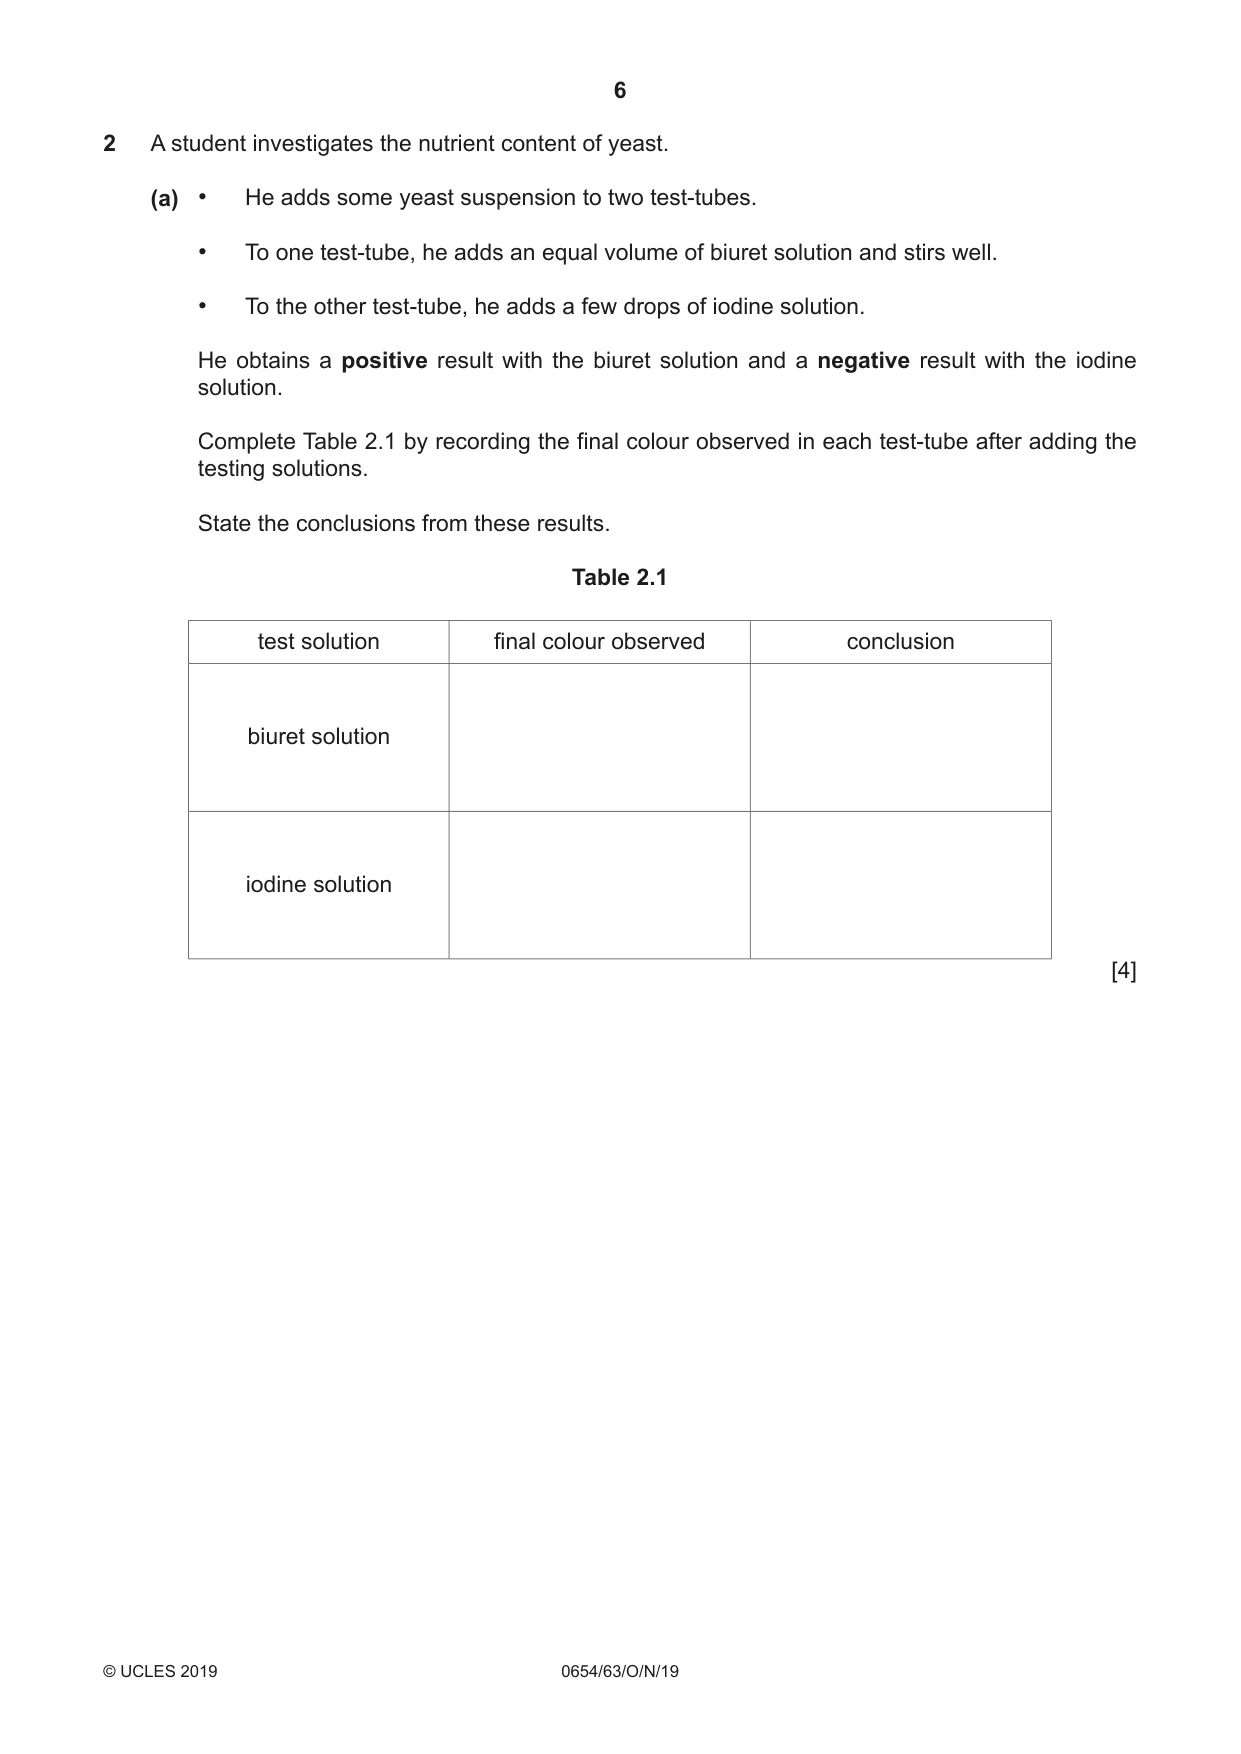
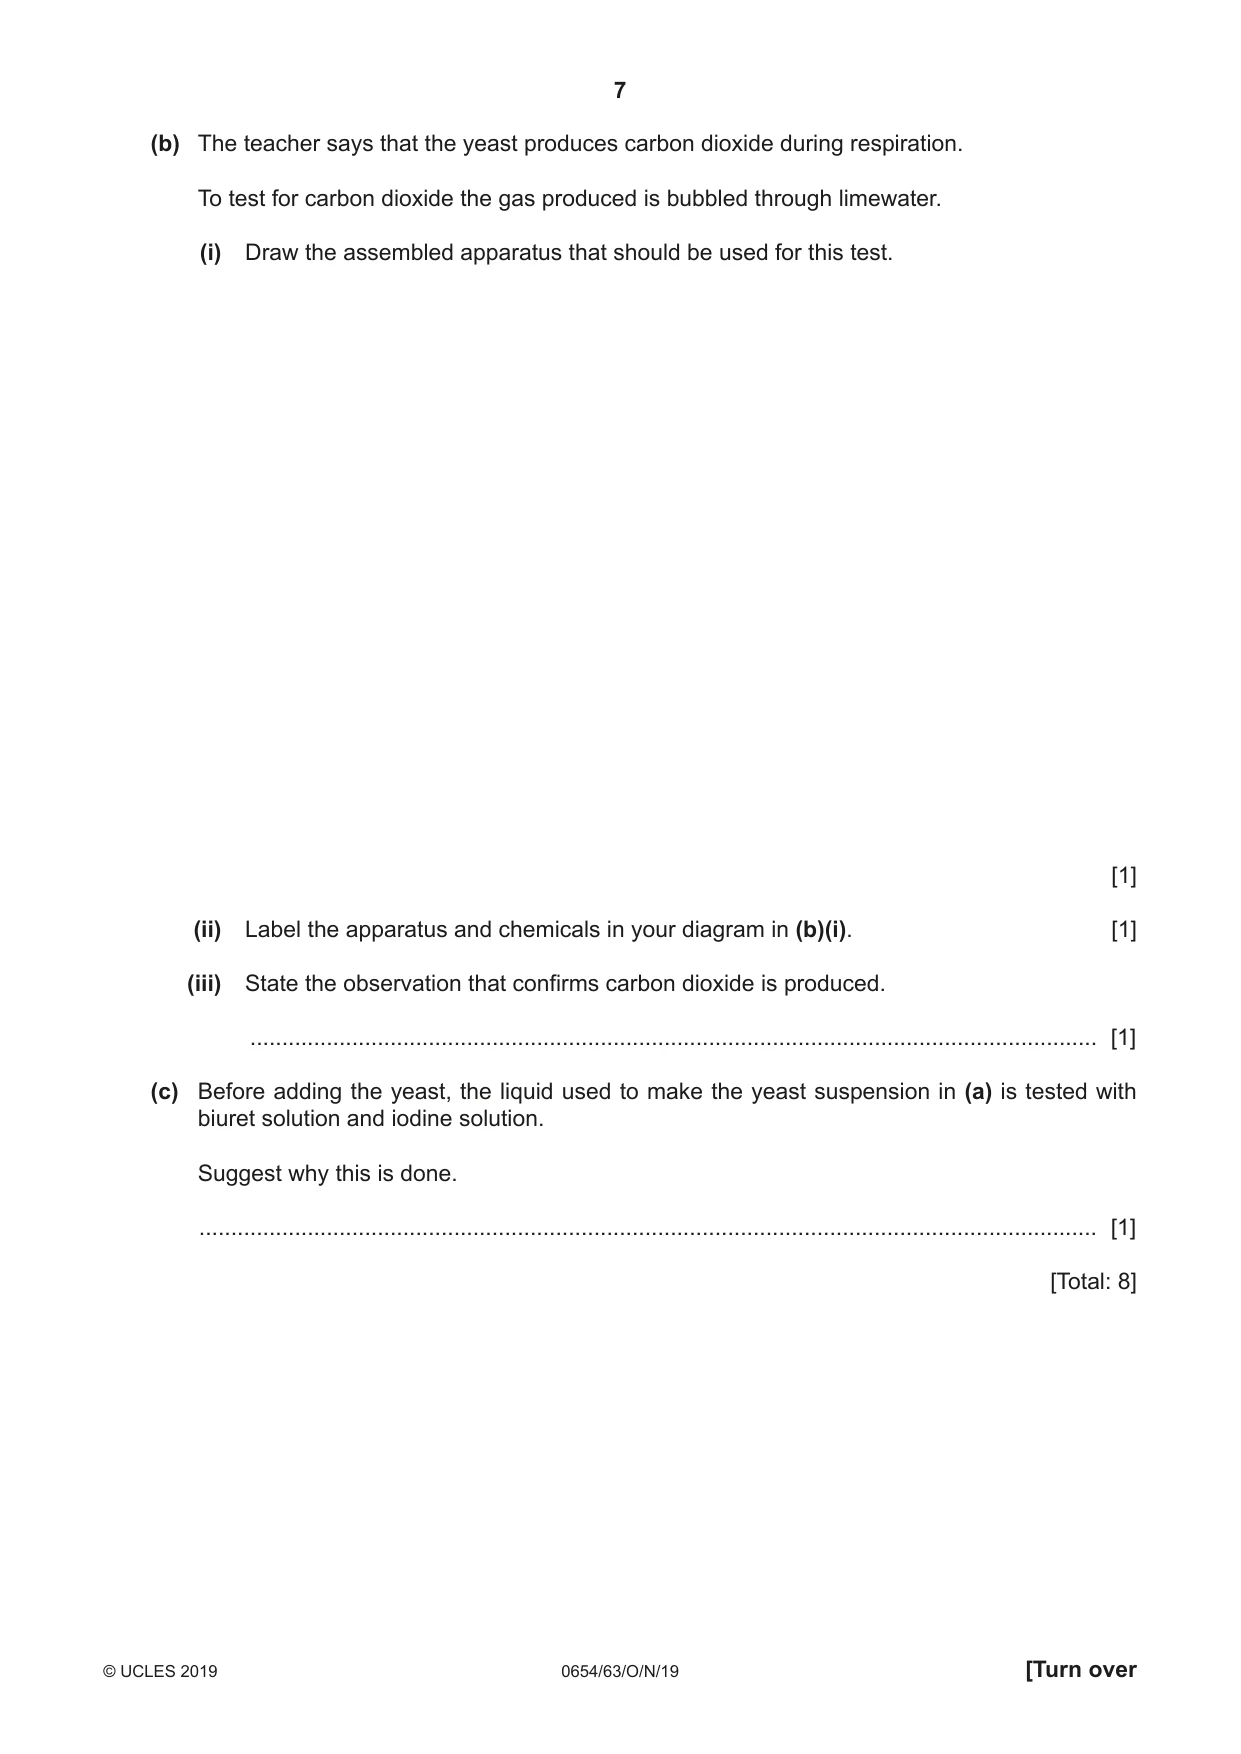
2 A student investigates the nutrient content of yeast. (a) • He adds some yeast suspension to two test-tubes. • To one test-tube, he adds an equal volume of biuret solution and stirs well. • To the other test-tube, he adds a few drops of iodine solution. He obtains a positive result with the biuret solution and a negative result with the iodine solution. Complete Table 2.1 by recording the final colour observed in each test-tube after adding the testing solutions. State the conclusions from these results. Table 2.1 test solution final colour observed conclusion biuret solution iodine solution [4] (b) The teacher says that the yeast produces carbon dioxide during respiration. To test for carbon dioxide the gas produced is bubbled through limewater. (i) Draw the assembled apparatus that should be used for this test. [1] (ii) Label the apparatus and chemicals in your diagram in (b)(i). [1] (iii) State the observation that confirms carbon dioxide is produced. ..................................................................................................................................... [1] (c) Before adding the yeast, the liquid used to make the yeast suspension in (a) is tested with biuret solution and iodine solution. Suggest why this is done. ............................................................................................................................................. [1] [Total: 8]
Mark scheme: 2(a) colour observed conclusion biuret solution purple ; contains protein ; iodine solution brown / yellow / orange ; does not contain starch ; 4 2(b)(i) delivery tube under the limewater ; 1 2(b)(ii) limewater and delivery tube ; 1 2(b)(iii) milky ; 1 2(c) To check it does not contain (named) nutrient / protein / starch / control ; 1
Q3 · Magnesium ribbon reacts with dilute sulfuric acid to produce magnesium sulfate solution…
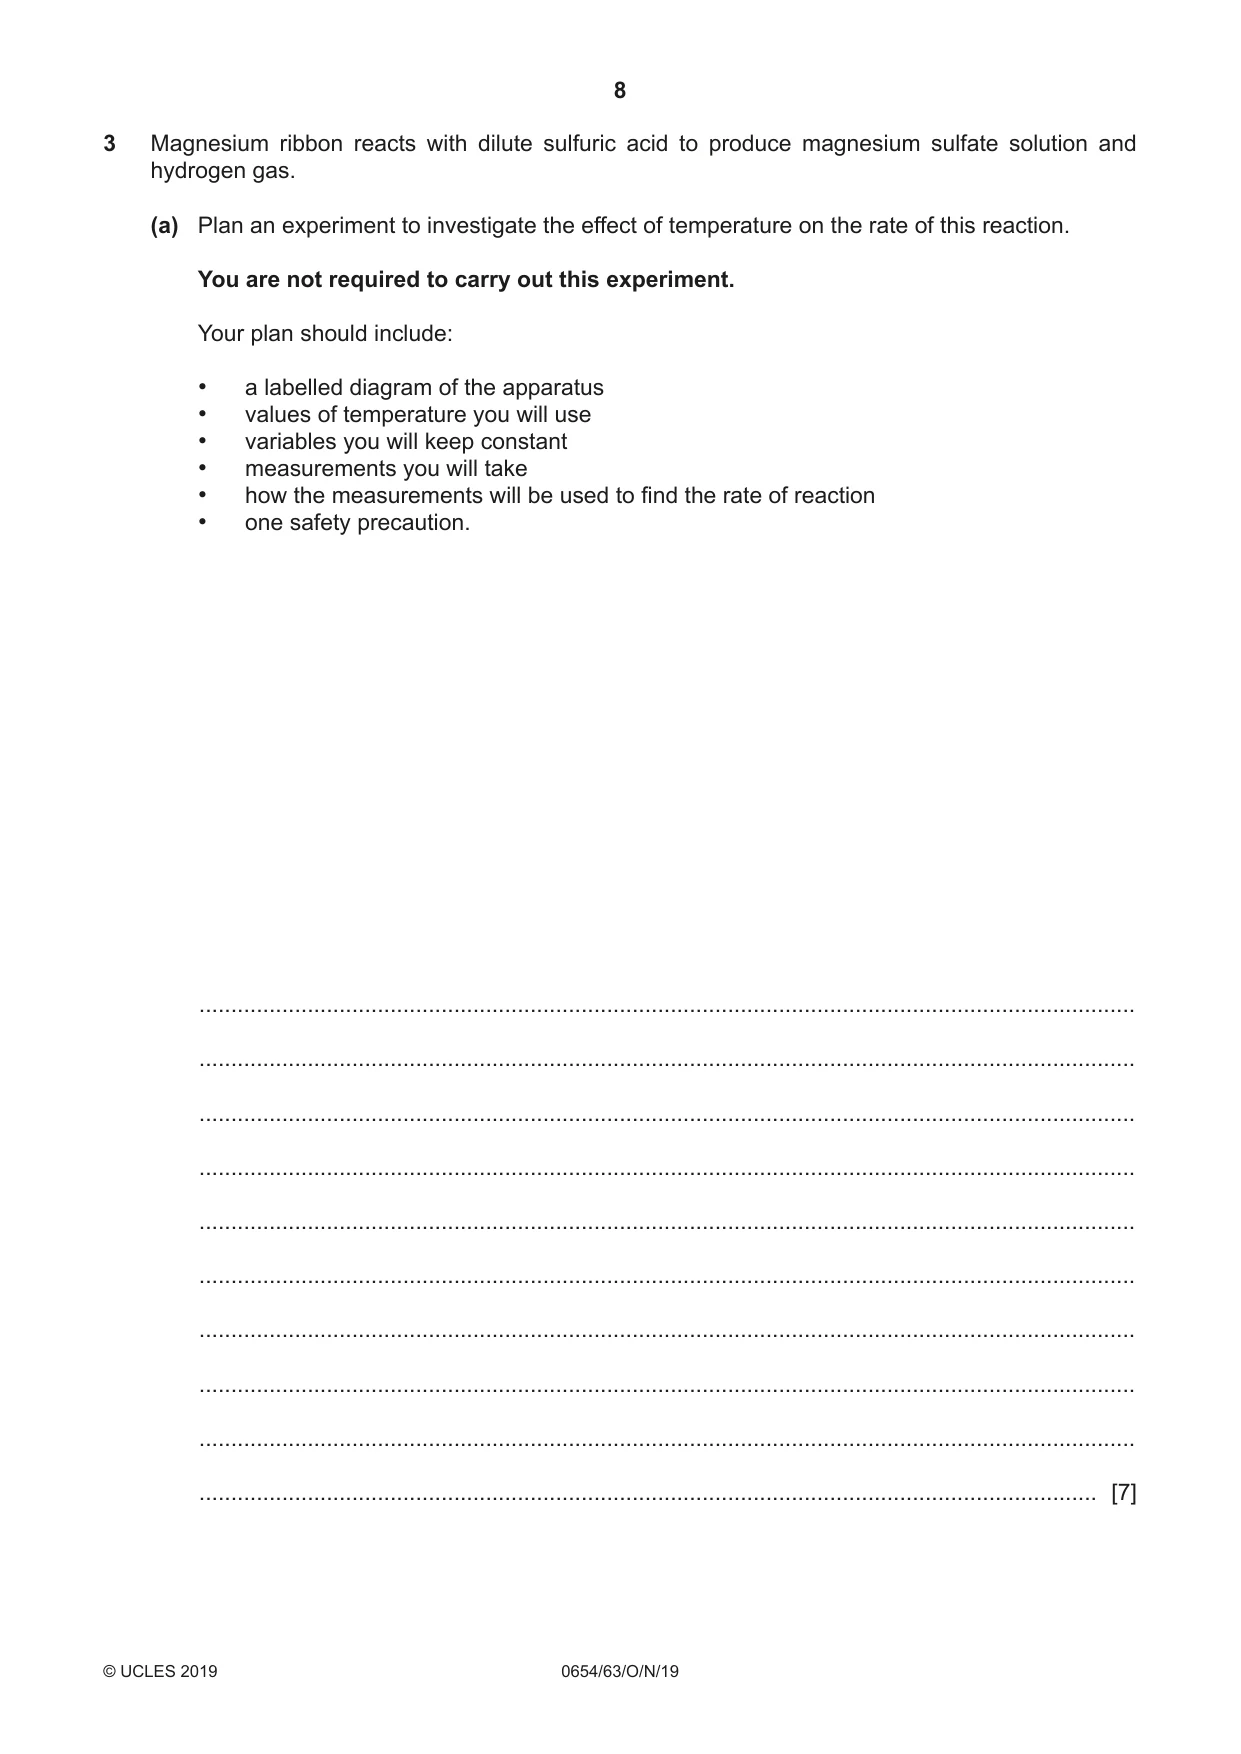
3 Magnesium ribbon reacts with dilute sulfuric acid to produce magnesium sulfate solution and hydrogen gas. (a) Plan an experiment to investigate the effect of temperature on the rate of this reaction. You are not required to carry out this experiment. Your plan should include: • a labelled diagram of the apparatus • values of temperature you will use • variables you will keep constant • measurements you will take • how the measurements will be used to find the rate of reaction • one safety precaution. ................................................................................................................................................... ................................................................................................................................................... ................................................................................................................................................... ................................................................................................................................................... ................................................................................................................................................... ................................................................................................................................................... ................................................................................................................................................... ................................................................................................................................................... ................................................................................................................................................... ............................................................................................................................................. [7] (b) Identify one possible source of error in your experiment. Explain an improvement to reduce the effect of this error. source of error ........................................................................................................................... ................................................................................................................................................... improvement .............................................................................................................................. ................................................................................................................................................... [2] [Total: 9]
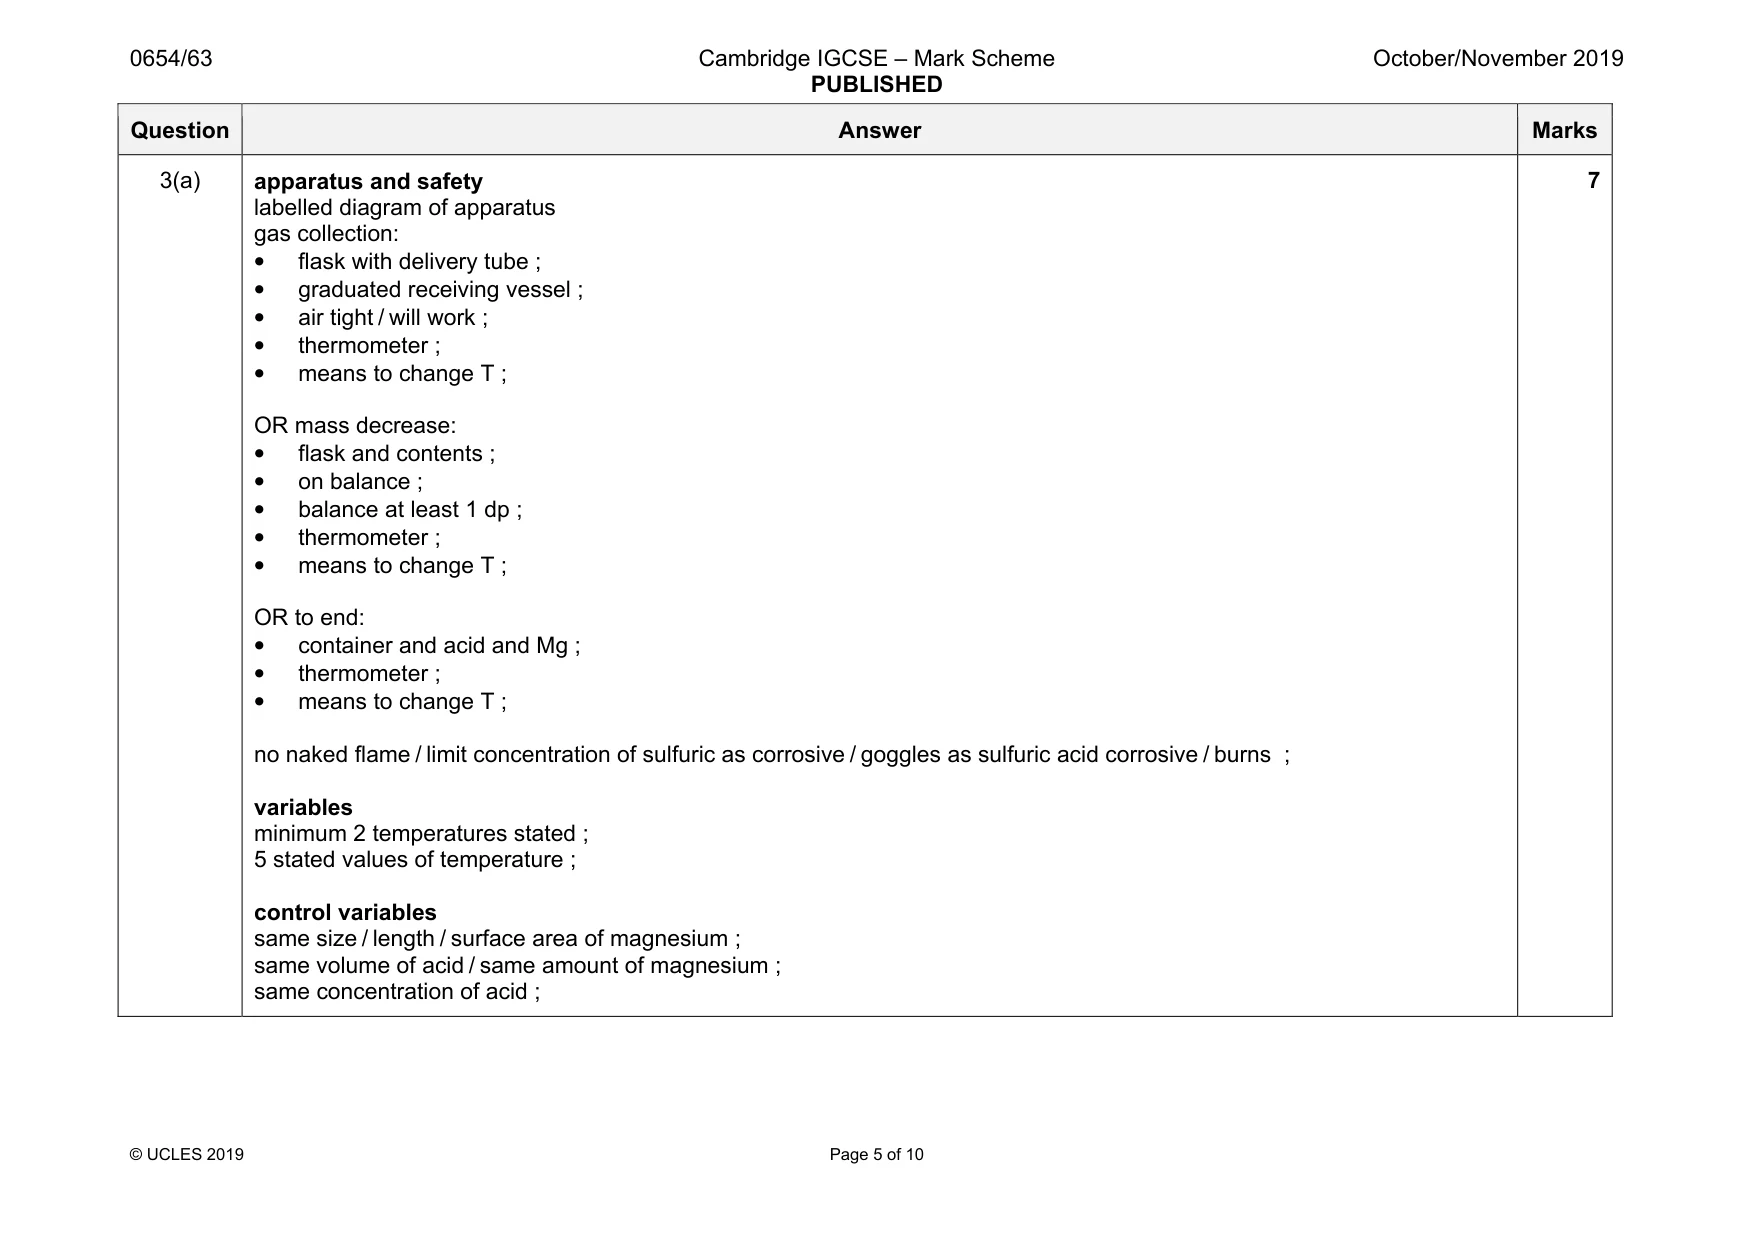
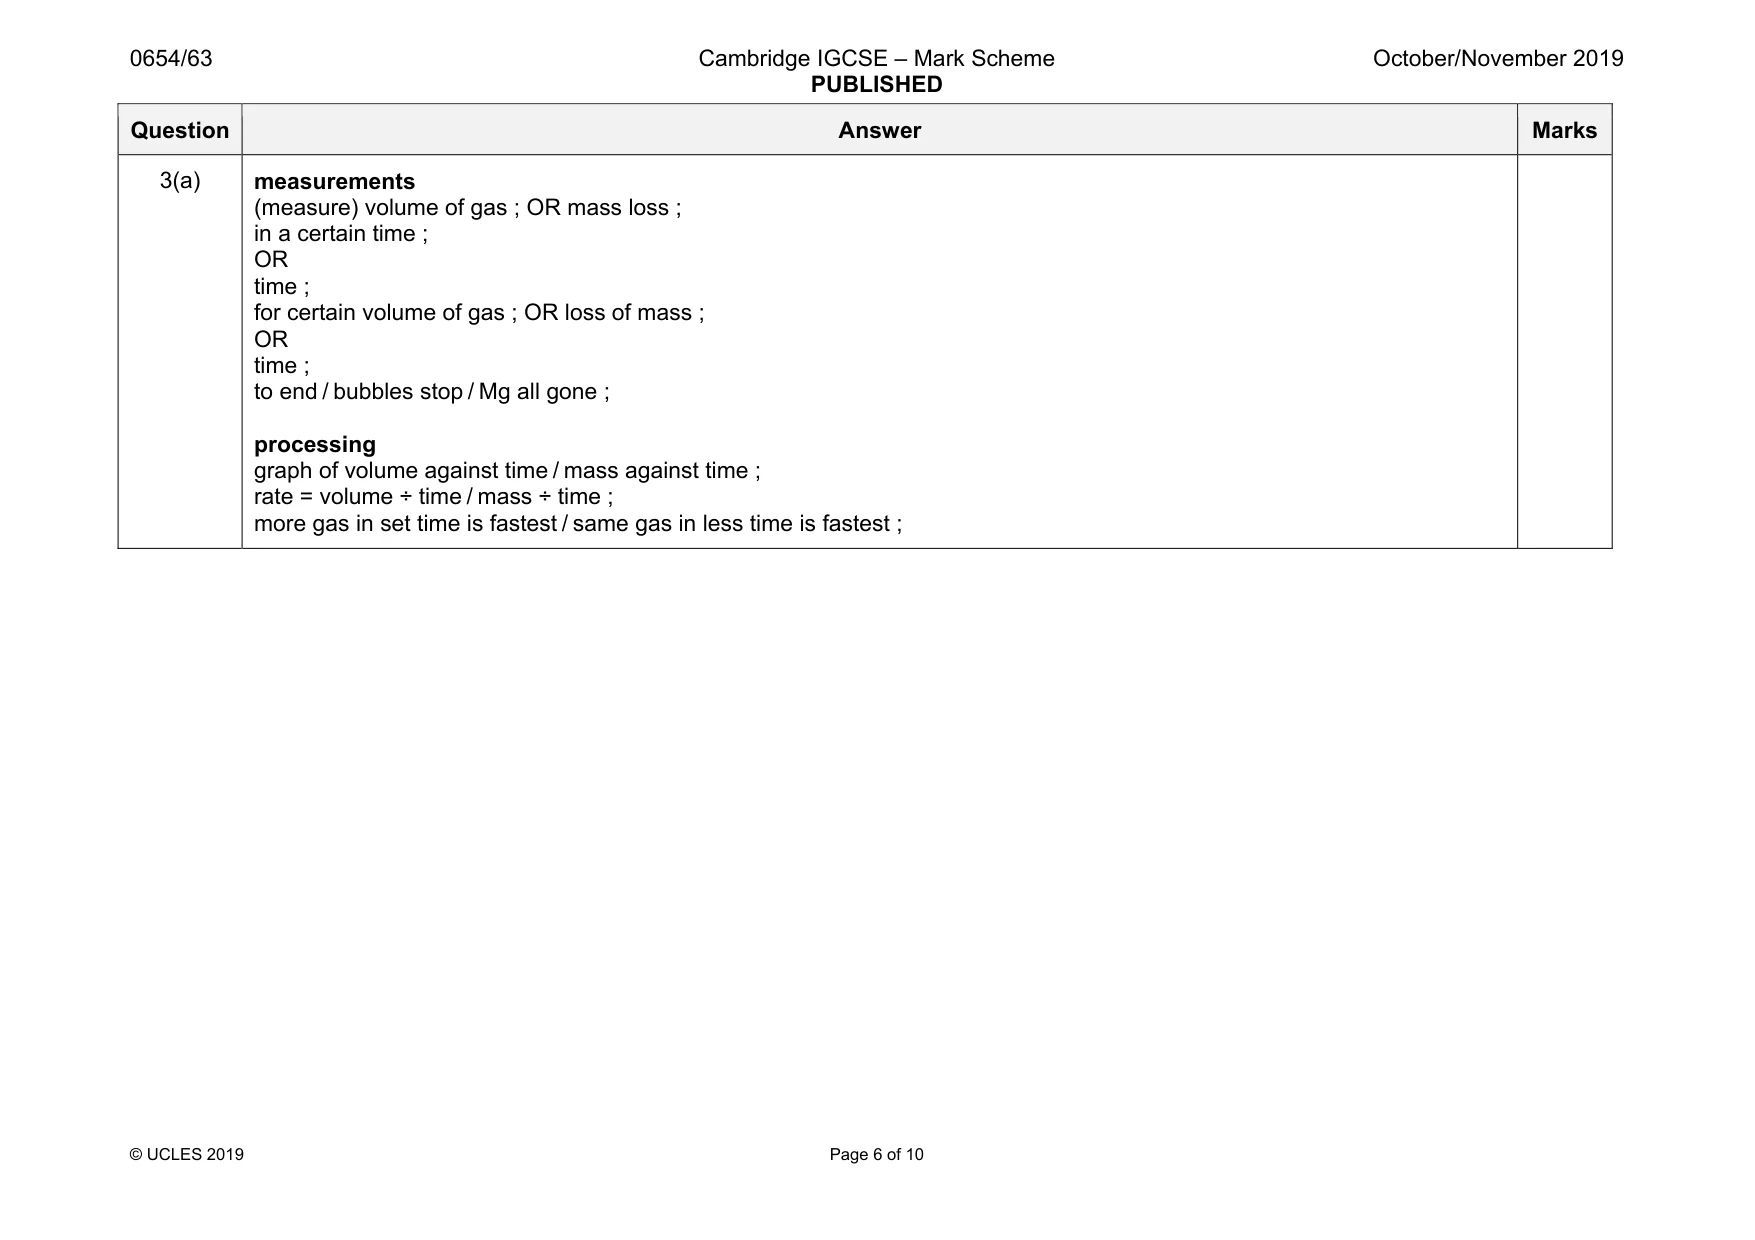
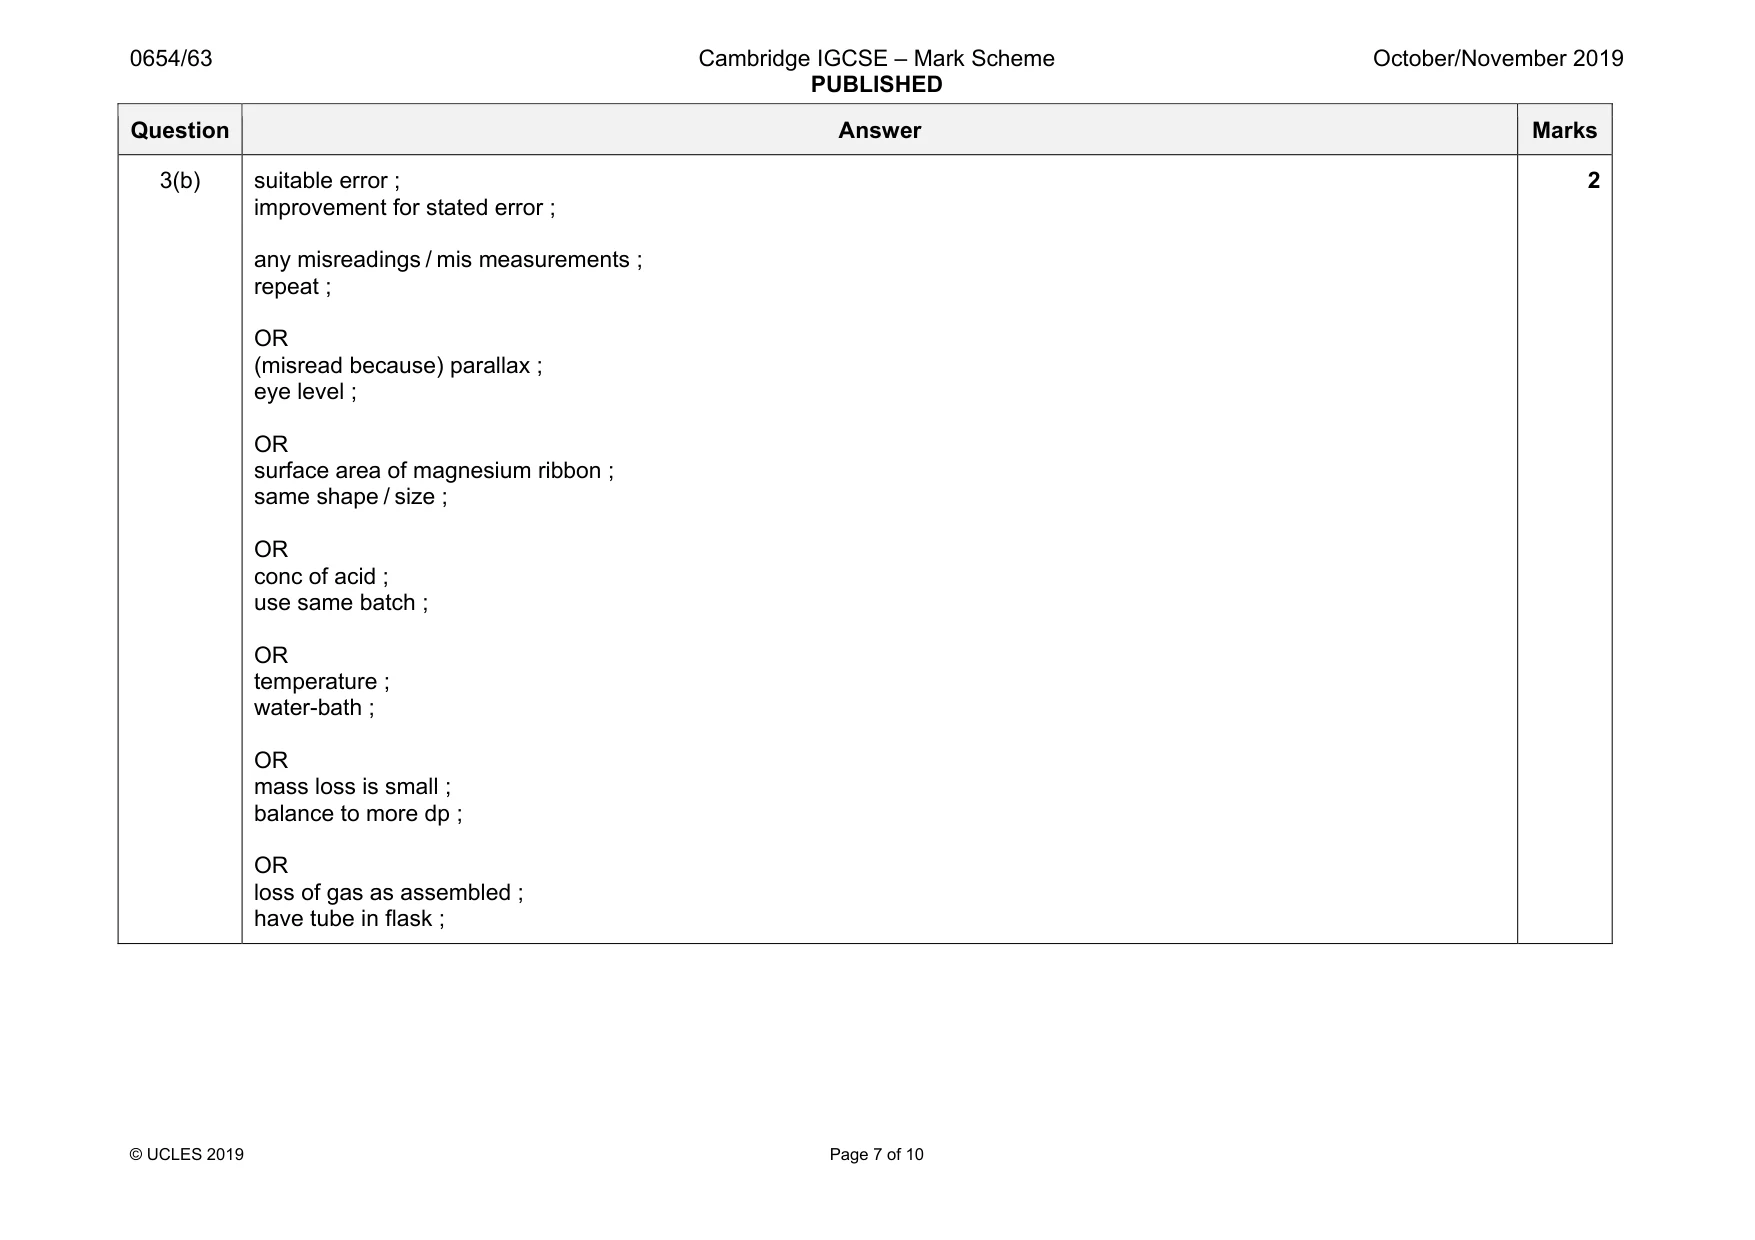
Mark scheme: 3(a) apparatus and safety labelled diagram of apparatus gas collection: • flask with delivery tube ; • graduated receiving vessel ; • air tight / will work ; • thermometer ; • means to change T ; OR mass decrease: • flask and contents ; • on balance ; • balance at least 1 dp ; • thermometer ; • means to change T ; OR to end: • container and acid and Mg ; • thermometer ; • means to change T ; no naked flame / limit concentration of sulfuric as corrosive / goggles as sulfuric acid corrosive / burns ; variables minimum 2 temperatures stated ; 5 stated values of temperature ; control variables same size / length / surface area of magnesium ; same volume of acid / same amount of magnesium ; same concentration of acid ; 7 Question Answer Marks 3(a) measurements (measure) volume of gas ; OR mass loss ; in a certain time ; OR time ; for certain volume of gas ; OR loss of mass ; OR time ; to end / bubbles stop / Mg all gone ; processing graph of volume against time / mass against time ; rate = volume ÷ time / mass ÷ time ; more gas in set time is fastest / same gas in less time is fastest ; Question Answer Marks 3(b) suitable error ; improvement for stated error ; any misreadings / mis measurements ; repeat ; OR (misread because) parallax ; eye level ; OR surface area of magnesium ribbon ; same shape / size ; OR conc of acid ; use same batch ; OR temperature ; water-bath ; OR mass loss is small ; balance to more dp ; OR loss of gas as assembled ; have tube in flask ; 2
Q4 · J contains two cations and one anion
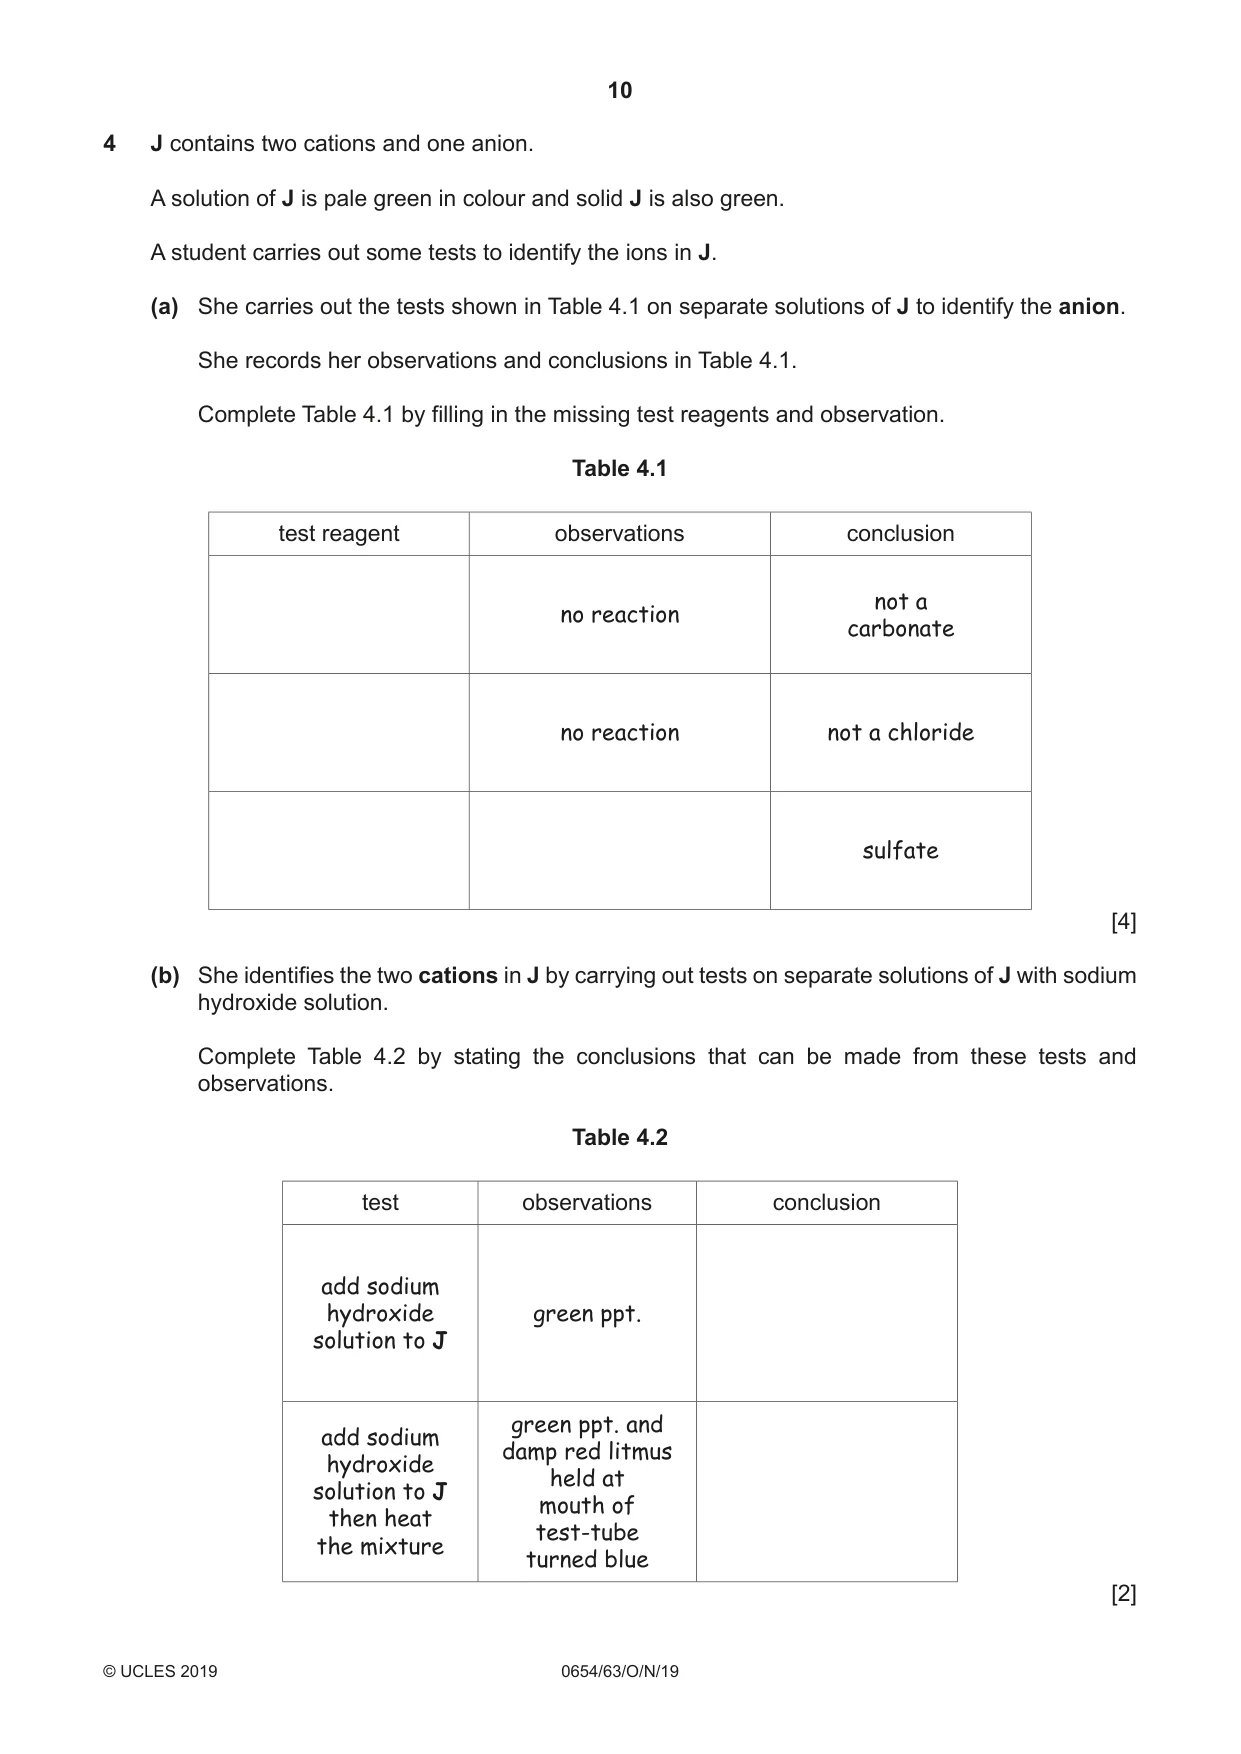
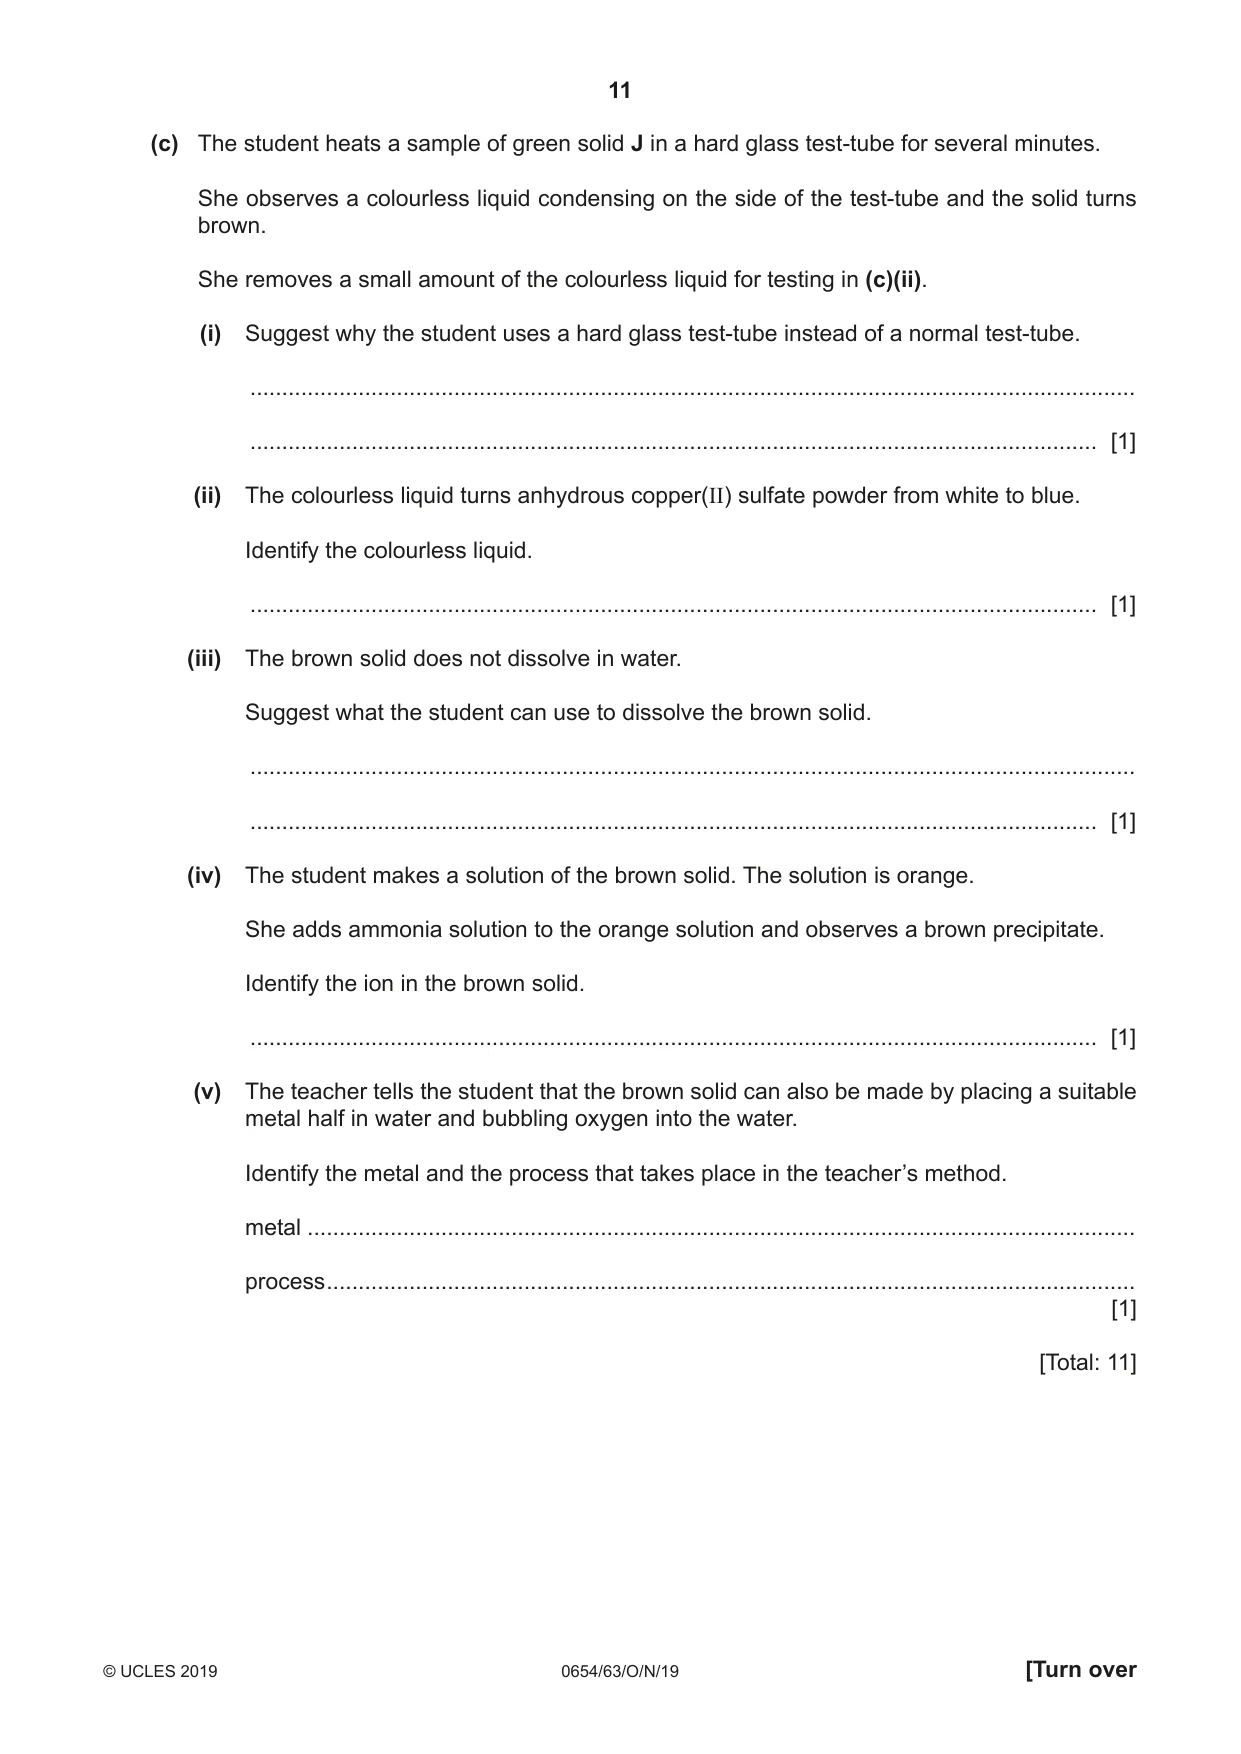
4 J contains two cations and one anion. A solution of J is pale green in colour and solid J is also green. A student carries out some tests to identify the ions in J. (a) She carries out the tests shown in Table 4.1 on separate solutions of J to identify the anion. She records her observations and conclusions in Table 4.1. Complete Table 4.1 by filling in the missing test reagents and observation. Table 4.1 test reagent observations conclusion not a no reaction carbonate no reaction not a chloride sulfate [4] (b) She identifies the two cations in J by carrying out tests on separate solutions of J with sodium hydroxide solution. Complete Table 4.2 by stating the conclusions that can be made from these tests and observations. Table 4.2 test observations conclusion add sodium hydroxide green ppt. solution to J green ppt. and add sodium damp red litmus hydroxide held at solution to J mouth of then heat test-tube the mixture turned blue [2] (c) The student heats a sample of green solid J in a hard glass test-tube for several minutes. She observes a colourless liquid condensing on the side of the test-tube and the solid turns brown. She removes a small amount of the colourless liquid for testing in (c)(ii). (i) Suggest why the student uses a hard glass test-tube instead of a normal test-tube. ........................................................................................................................................... ..................................................................................................................................... [1] (ii) The colourless liquid turns anhydrous copper(II) sulfate powder from white to blue. Identify the colourless liquid. ..................................................................................................................................... [1] (iii) The brown solid does not dissolve in water. Suggest what the student can use to dissolve the brown solid. ........................................................................................................................................... ..................................................................................................................................... [1] (iv) The student makes a solution of the brown solid. The solution is orange. She adds ammonia solution to the orange solution and observes a brown precipitate. Identify the ion in the brown solid. ..................................................................................................................................... [1] (v) The teacher tells the student that the brown solid can also be made by placing a suitable metal half in water and bubbling oxygen into the water. Identify the metal and the process that takes place in the teacher’s method. metal .................................................................................................................................. process ............................................................................................................................... [1] [Total: 11]
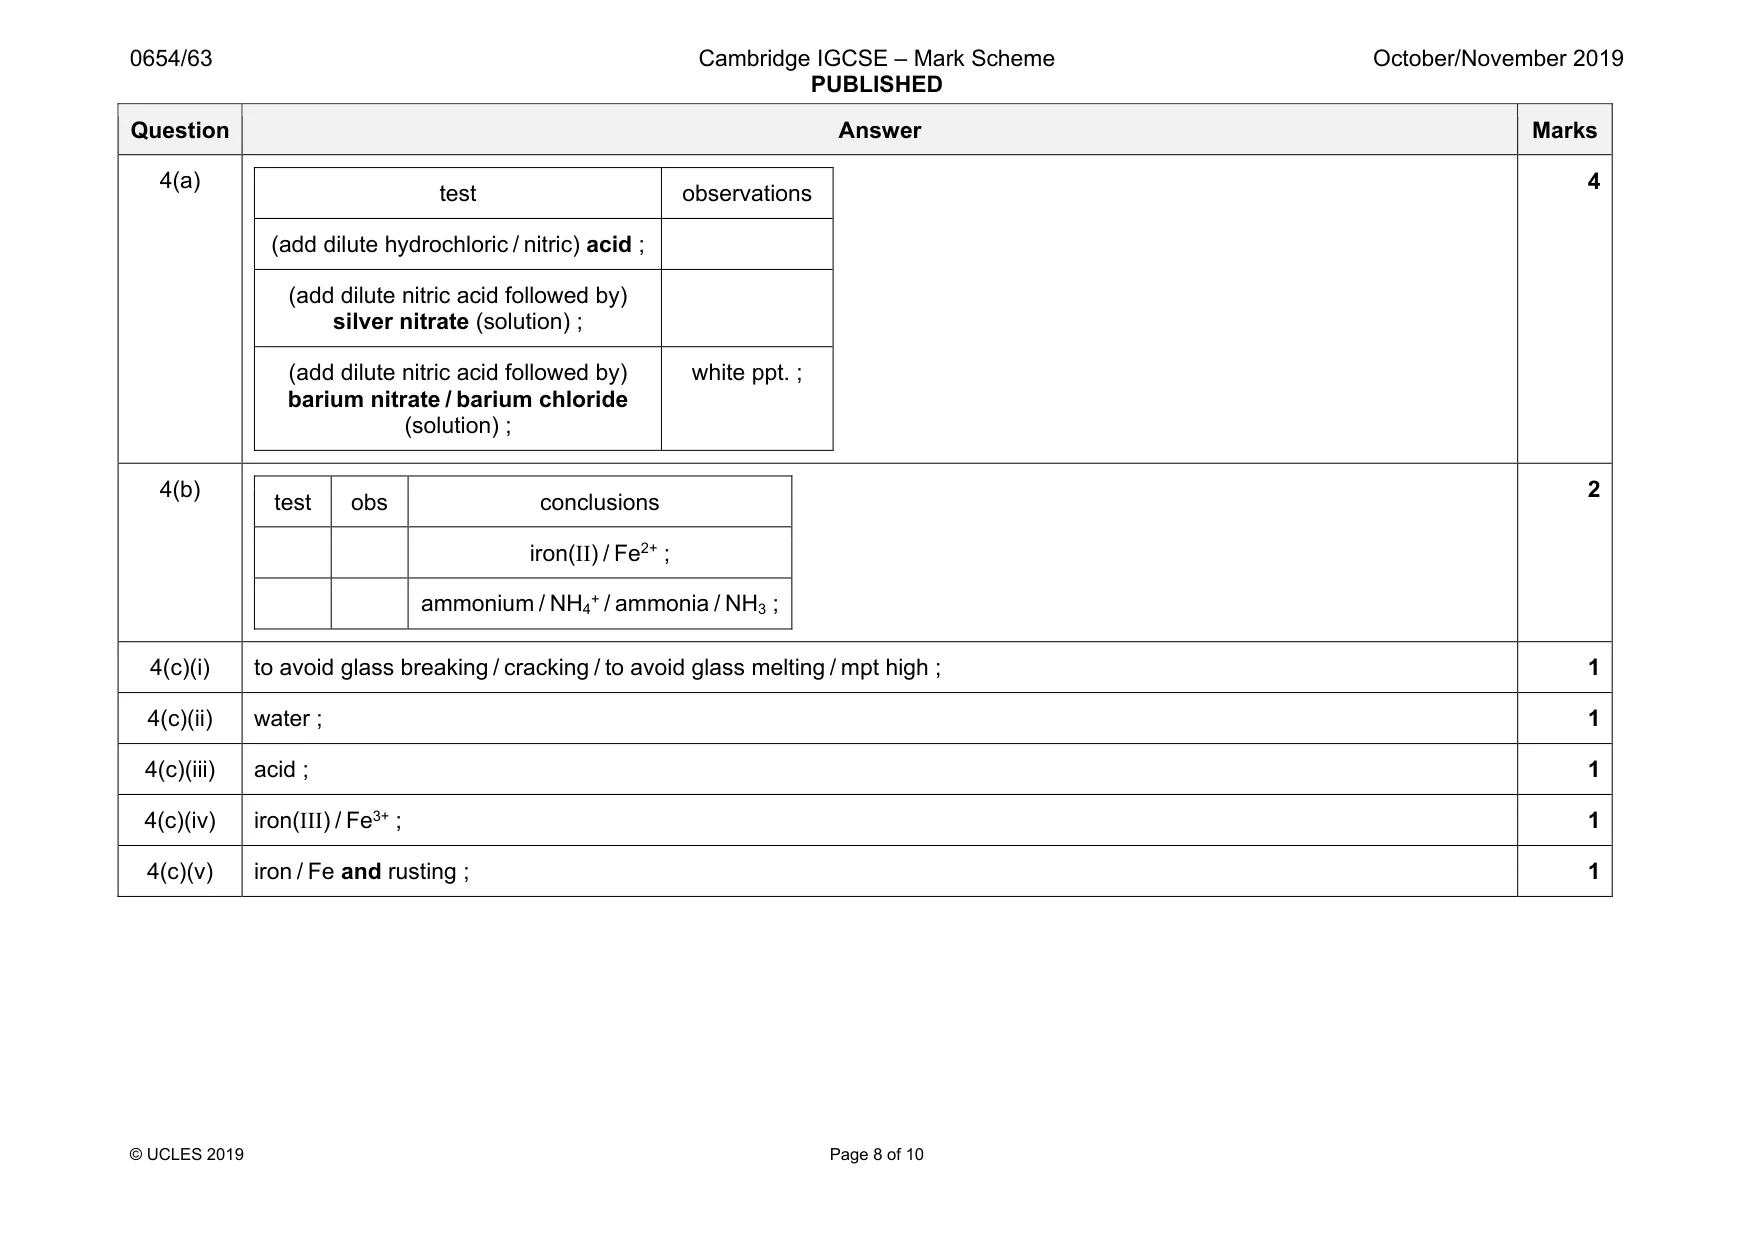
Mark scheme: 4(a) test observations (add dilute hydrochloric / nitric) acid ; (add dilute nitric acid followed by) silver nitrate (solution) ; (add dilute nitric acid followed by) barium nitrate / barium chloride (solution) ; white ppt. ; 4 4(b) test obs conclusions iron(II) / Fe2+ ; ammonium / NH4+ / ammonia / NH3 ; 2 4(c)(i) to avoid glass breaking / cracking / to avoid glass melting / mpt high ; 1 4(c)(ii) water ; 1 4(c)(iii) acid ; 1 4(c)(iv) iron(III) / Fe3+ ; 1 4(c)(v) iron / Fe and rusting ; 1
Q5 · A student determines the volume of a drinks cup using two methods
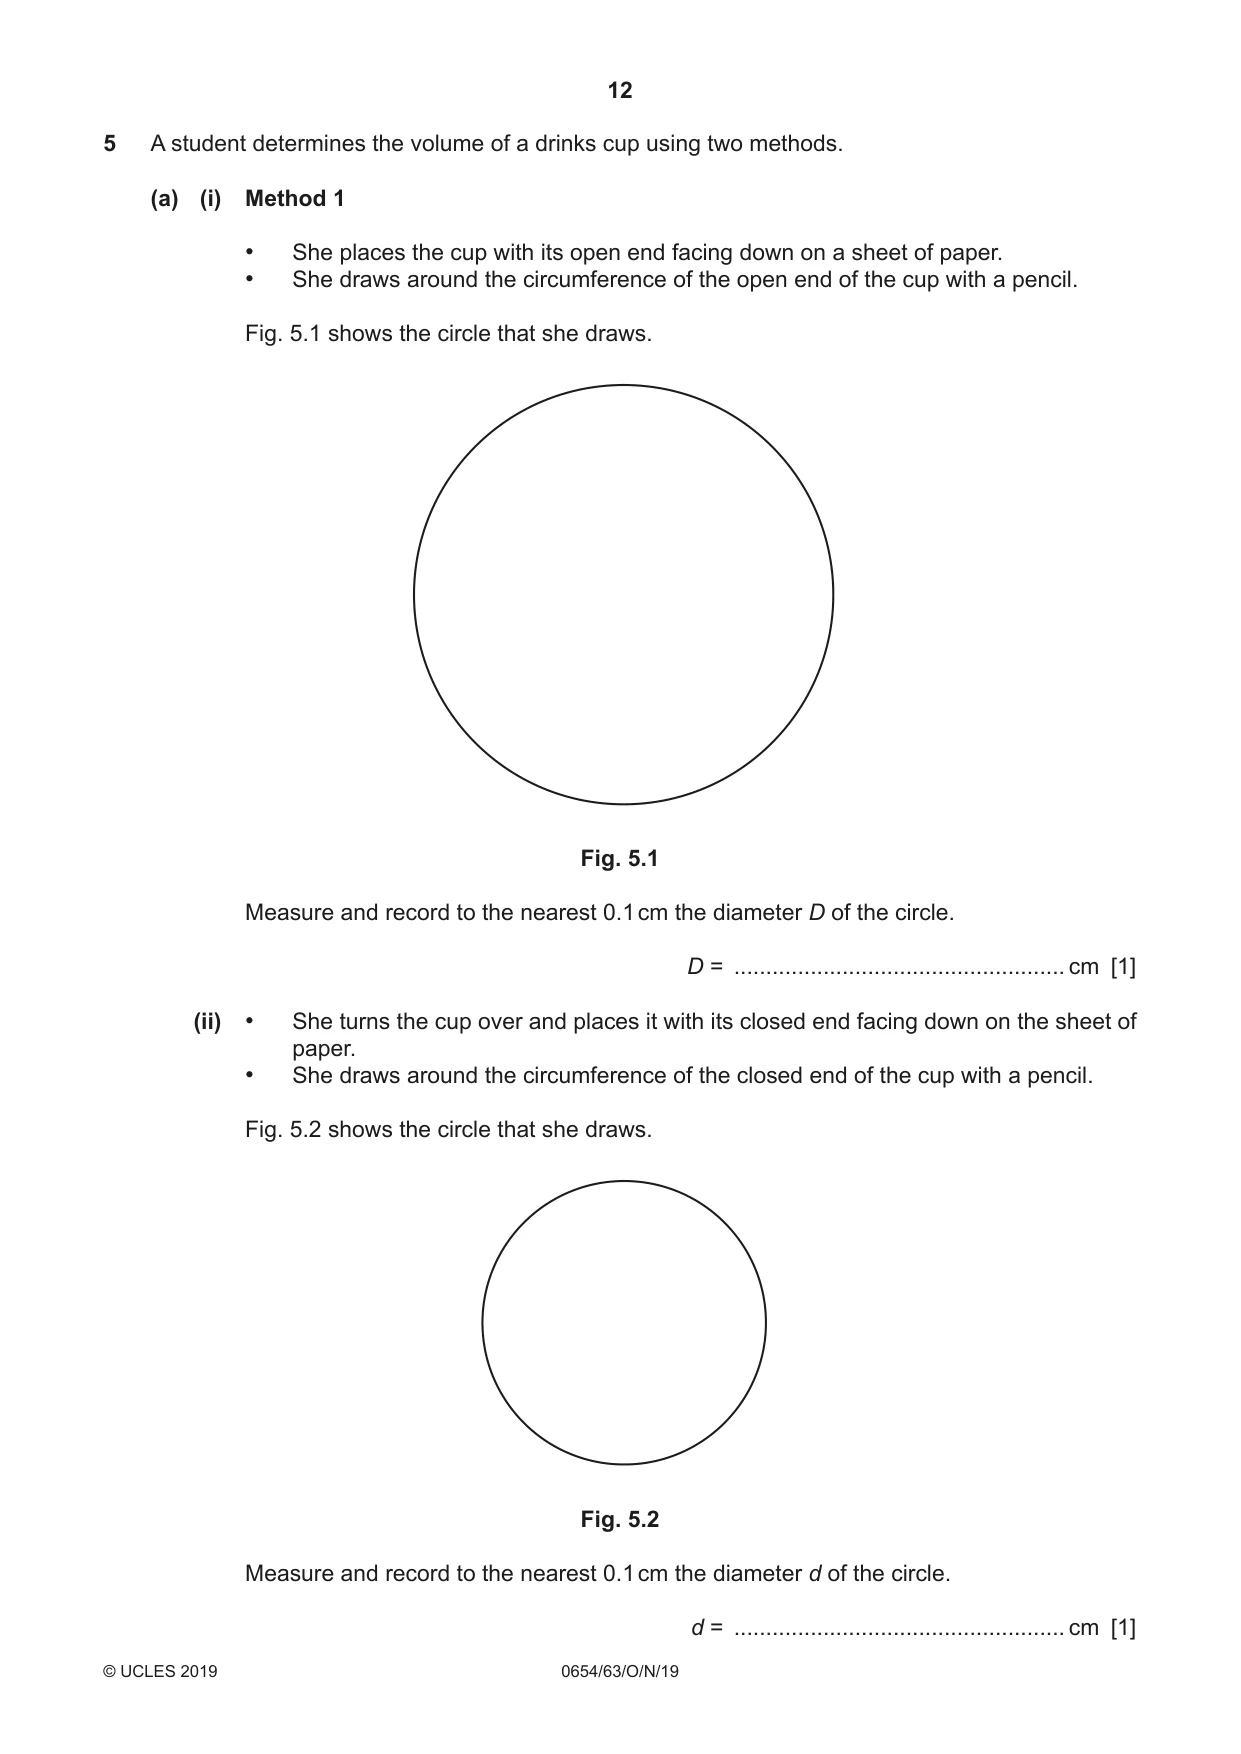
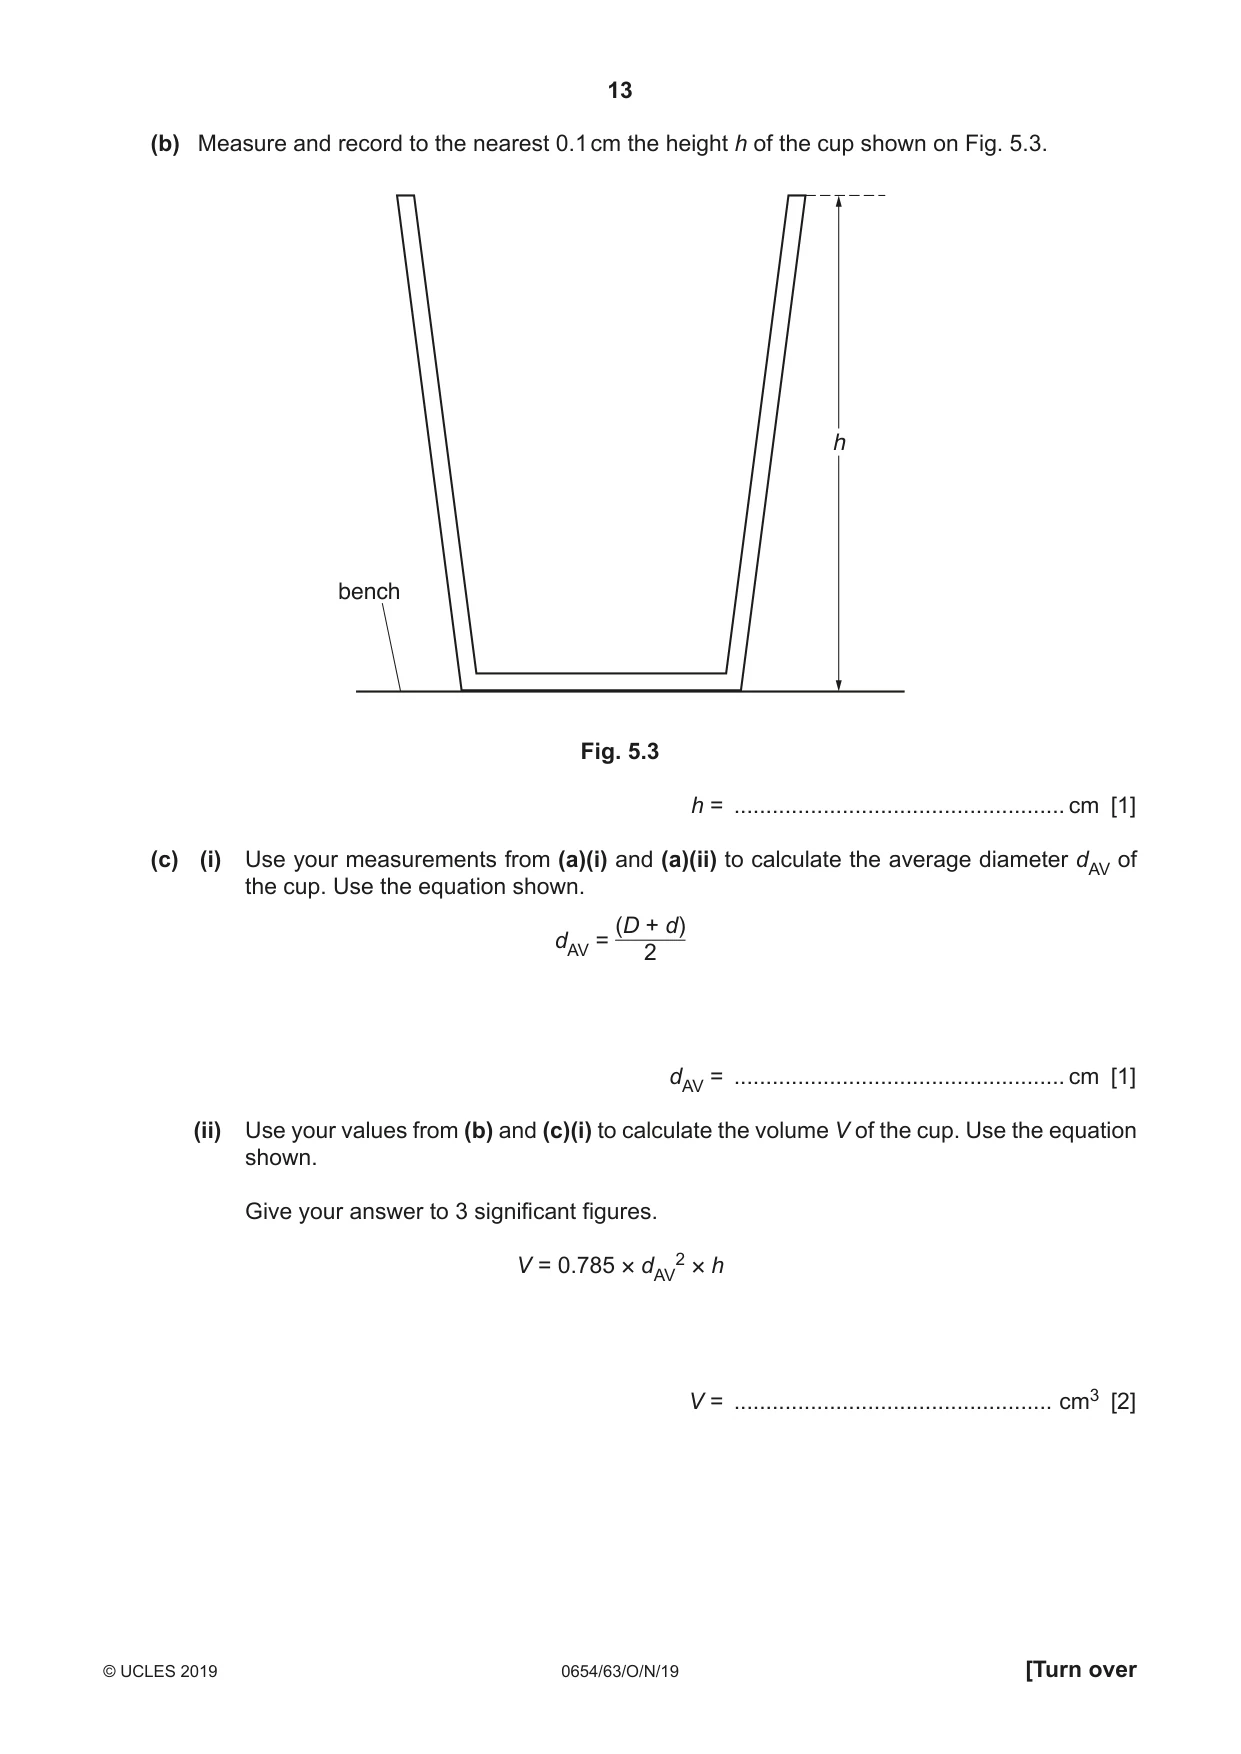
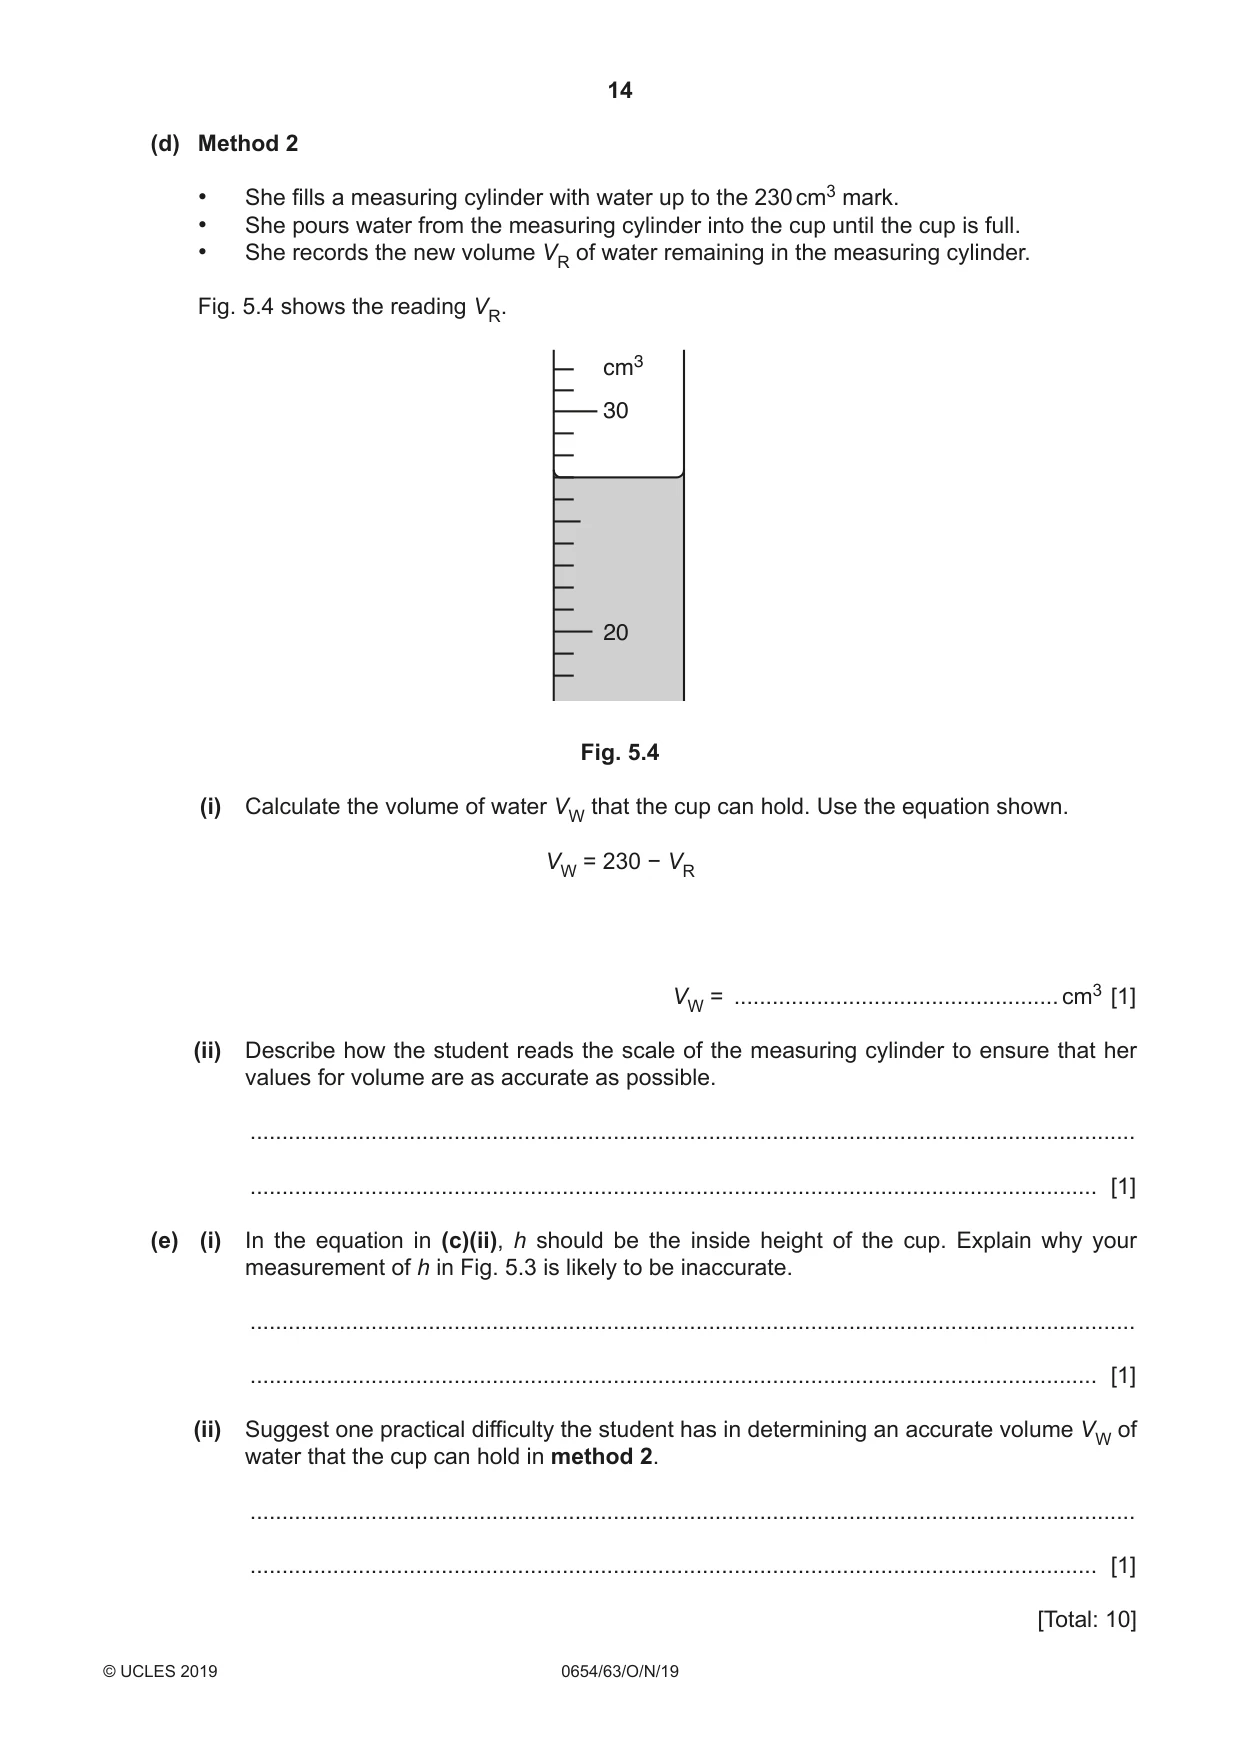
5 A student determines the volume of a drinks cup using two methods. (a) (i) Method 1 • She places the cup with its open end facing down on a sheet of paper. • She draws around the circumference of the open end of the cup with a pencil. Fig. 5.1 shows the circle that she draws. Fig. 5.1 Measure and record to the nearest 0.1 cm the diameter D of the circle. D = .................................................... cm [1] (ii) • She turns the cup over and places it with its closed end facing down on the sheet of paper. • She draws around the circumference of the closed end of the cup with a pencil. Fig. 5.2 shows the circle that she draws. Fig. 5.2 Measure and record to the nearest 0.1 cm the diameter d of the circle. d = .................................................... cm [1] (b) Measure and record to the nearest 0.1 cm the height h of the cup shown on Fig. 5.3. h bench Fig. 5.3 h = .................................................... cm [1] (c) (i) Use your measurements from (a)(i) and (a)(ii) to calculate the average diameter dAV of the cup. Use the equation shown. (D + d) dAV = 2 dAV = .................................................... cm [1] (ii) Use your values from (b) and (c)(i) to calculate the volume V of the cup. Use the equation shown. Give your answer to 3 significant figures. V = 0.785 × dAV2 × h V = .................................................. cm3 [2] (d) Method 2 • She fills a measuring cylinder with water up to the 230 cm3 mark. • She pours water from the measuring cylinder into the cup until the cup is full. • She records the new volume VR of water remaining in the measuring cylinder. Fig. 5.4 shows the reading VR. cm3 30 20 Fig. 5.4 (i) Calculate the volume of water VW that the cup can hold. Use the equation shown. VW = 230 − VR VW = ................................................... cm3 [1] (ii) Describe how the student reads the scale of the measuring cylinder to ensure that her values for volume are as accurate as possible. ........................................................................................................................................... ..................................................................................................................................... [1] (e) (i) In the equation in (c)(ii), h should be the inside height of the cup. Explain why your measurement of h in Fig. 5.3 is likely to be inaccurate. ........................................................................................................................................... ..................................................................................................................................... [1] (ii) Suggest one practical difficulty the student has in determining an accurate volume VW of water that the cup can hold in method 2. ........................................................................................................................................... ..................................................................................................................................... [1] [Total: 10]
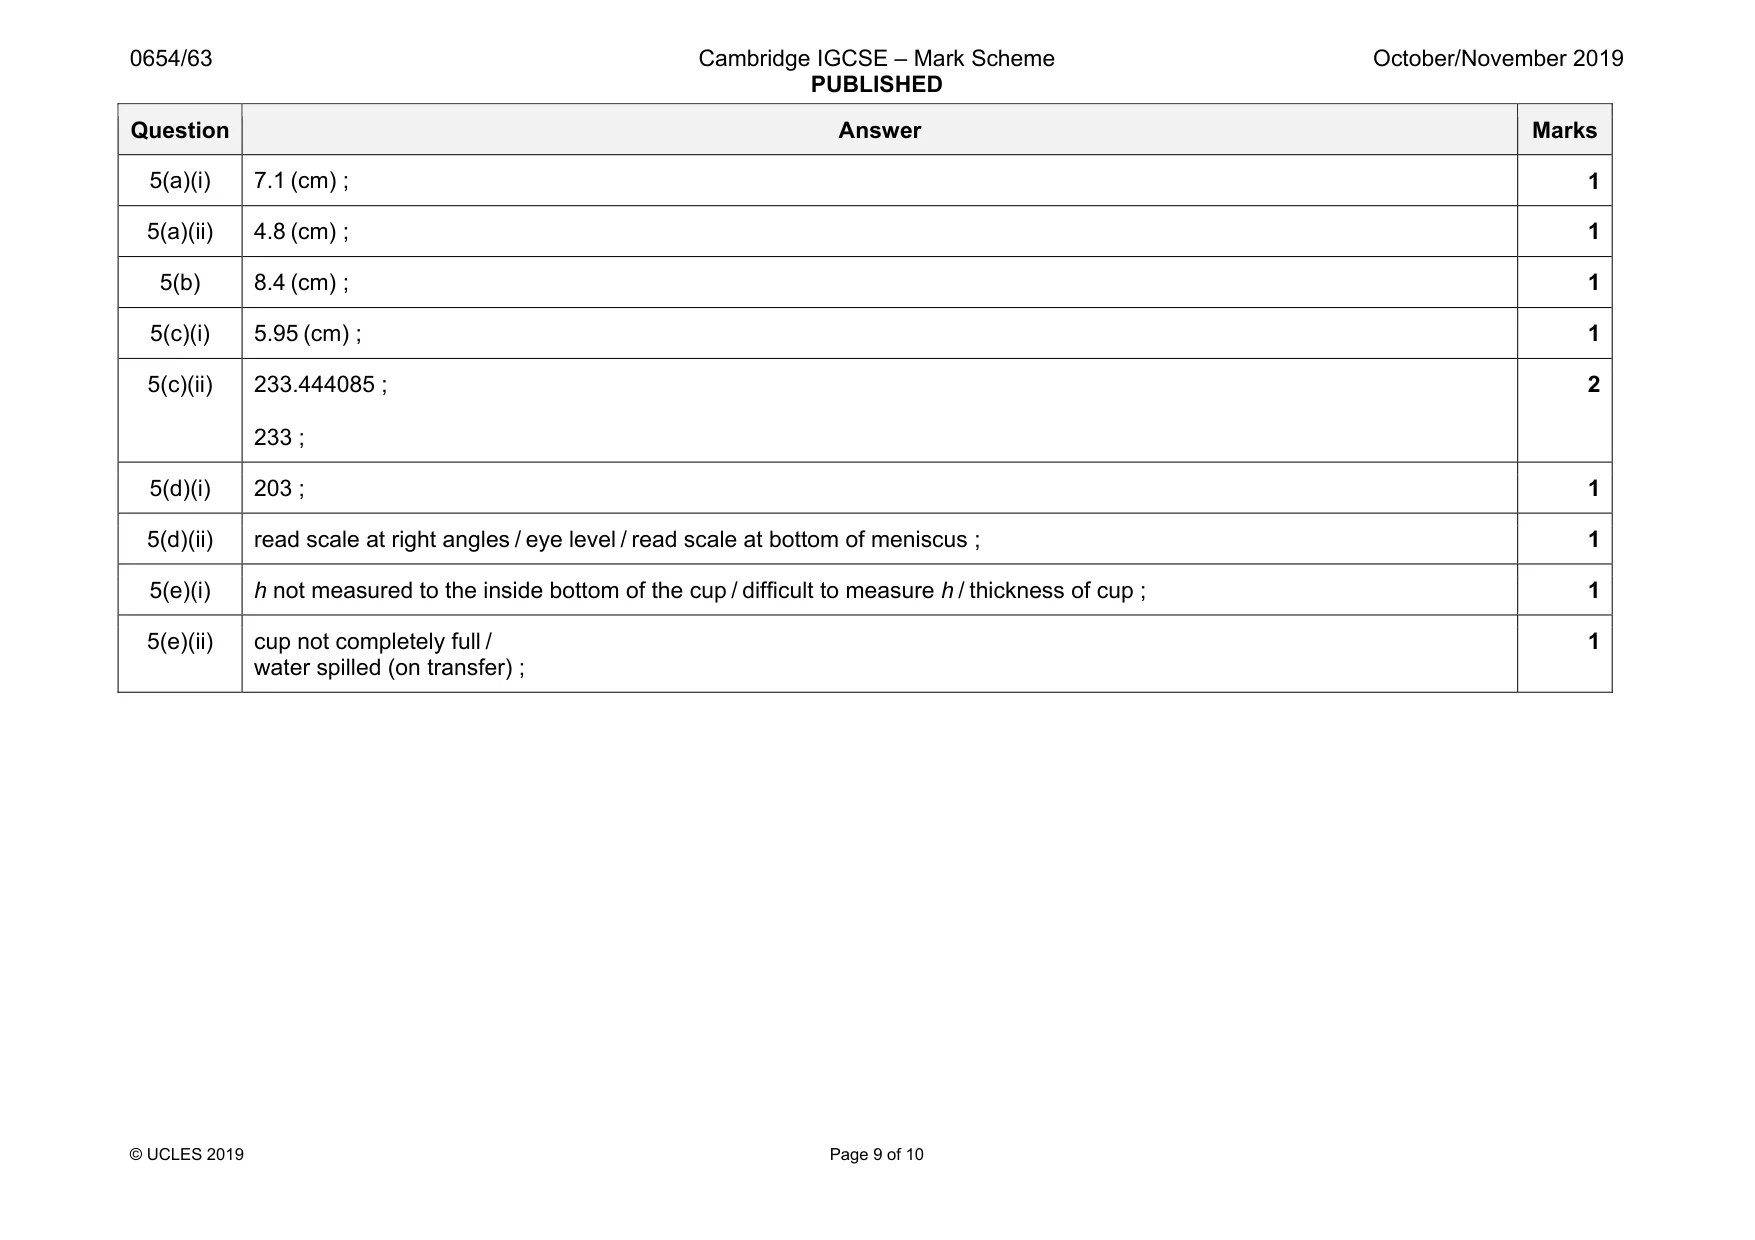
Mark scheme: 5(a)(i) 7.1 (cm) ; 1 5(a)(ii) 4.8 (cm) ; 1 5(b) 8.4 (cm) ; 1 5(c)(i) 5.95 (cm) ; 1 5(c)(ii) 233.444085 ; 233 ; 2 5(d)(i) 203 ; 1 5(d)(ii) read scale at right angles / eye level / read scale at bottom of meniscus ; 1 5(e)(i) h not measured to the inside bottom of the cup / difficult to measure h / thickness of cup ; 1 5(e)(ii) cup not completely full / water spilled (on transfer) ; 1
More questions on Physical quantities and measurement techniques
Q6 · A student measures the focal length of a convex lens
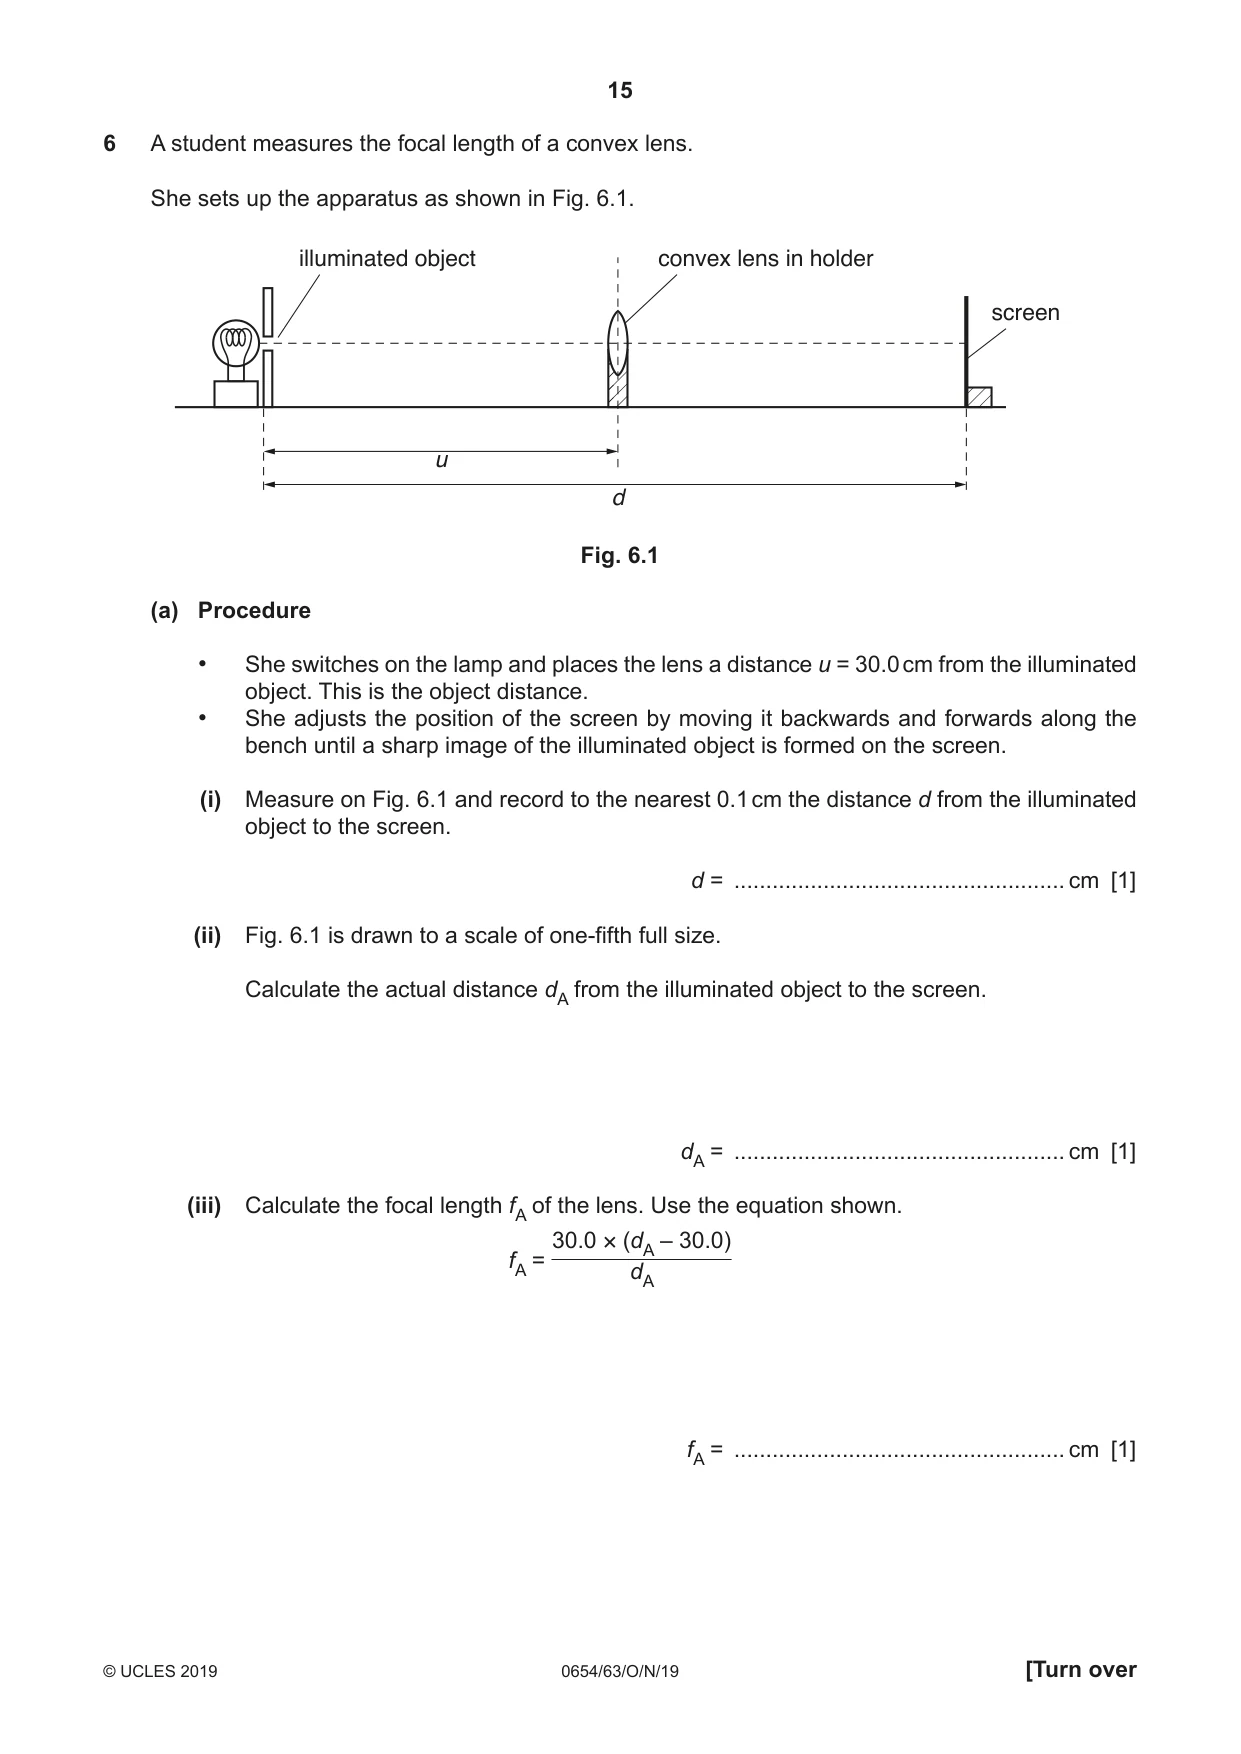
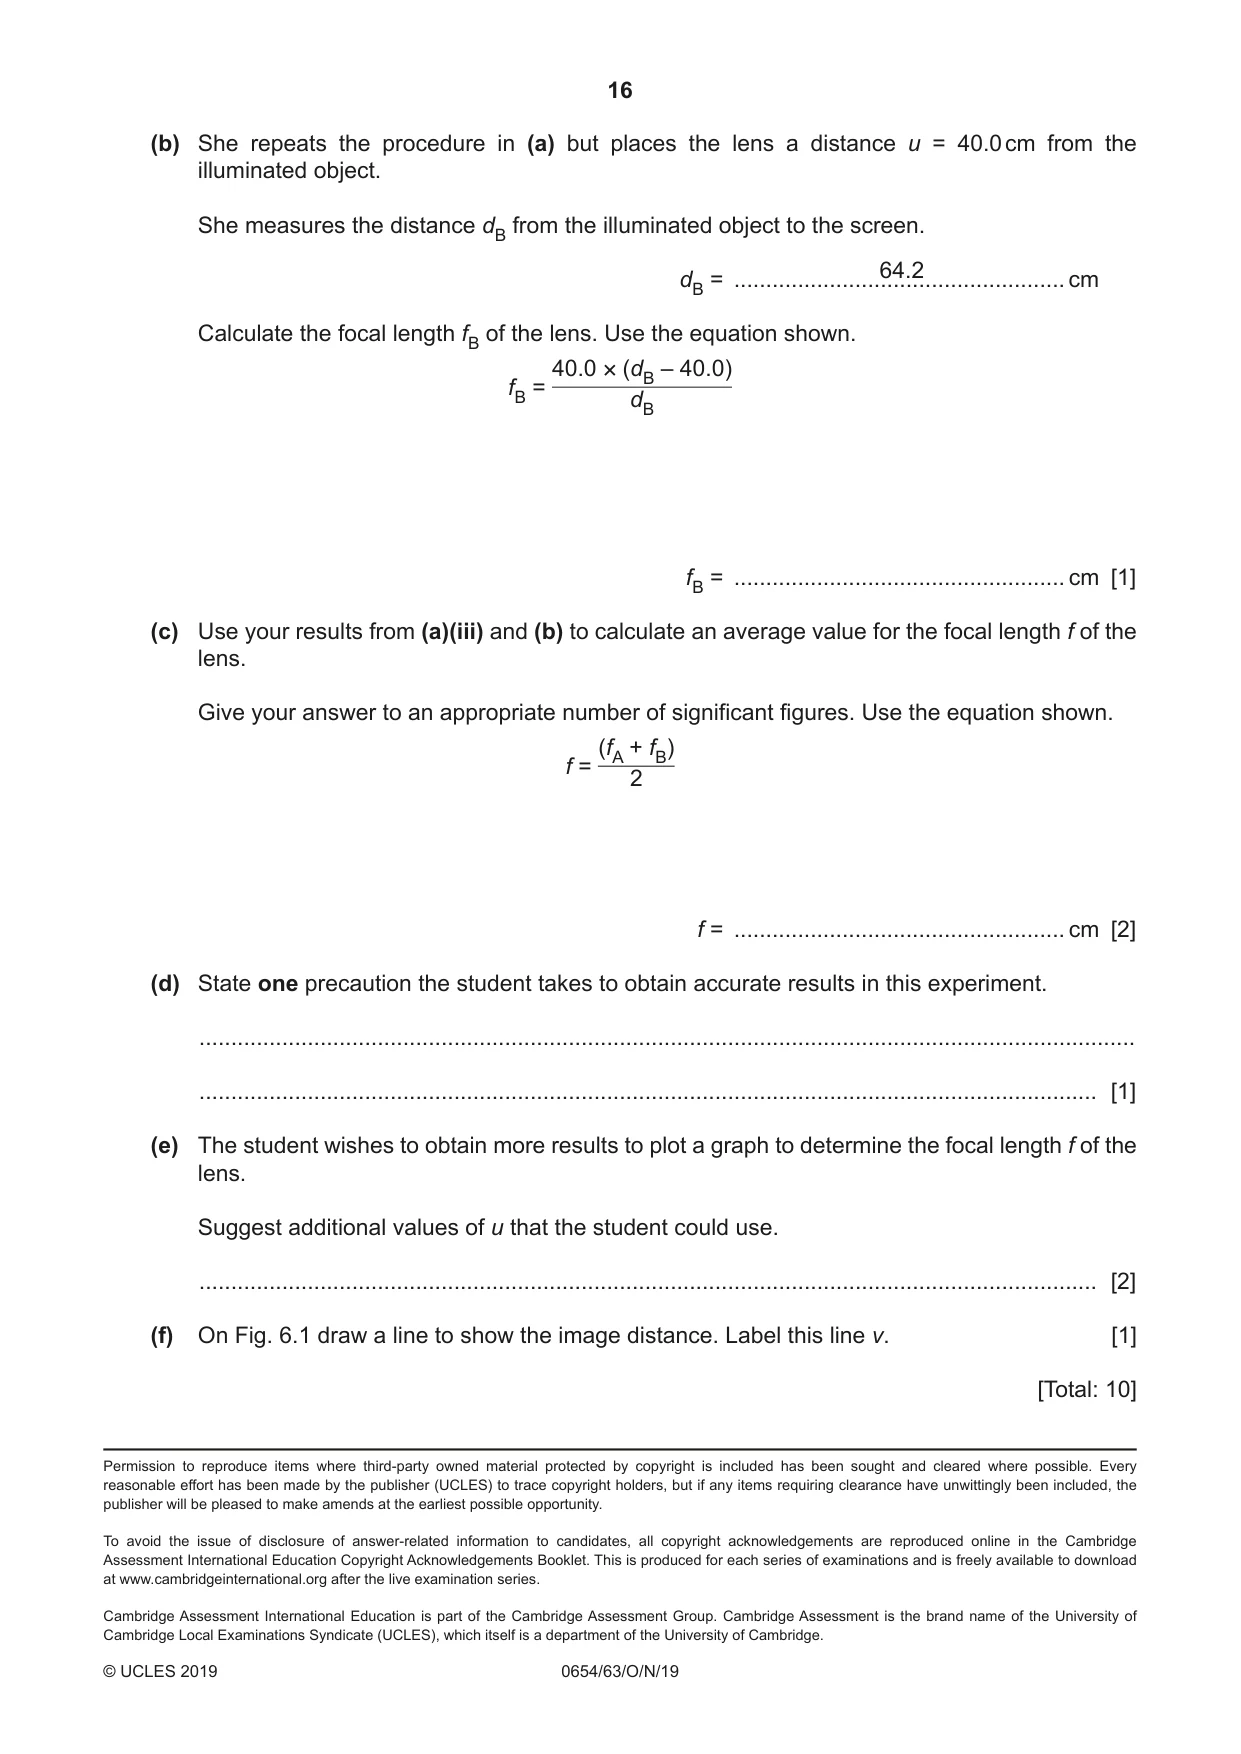
6 A student measures the focal length of a convex lens. She sets up the apparatus as shown in Fig. 6.1. illuminated object convex lens in holder screen u d Fig. 6.1 (a) Procedure • She switches on the lamp and places the lens a distance u = 30.0 cm from the illuminated object. This is the object distance. • She adjusts the position of the screen by moving it backwards and forwards along the bench until a sharp image of the illuminated object is formed on the screen. (i) Measure on Fig. 6.1 and record to the nearest 0.1 cm the distance d from the illuminated object to the screen. d = .................................................... cm [1] (ii) Fig. 6.1 is drawn to a scale of one-fifth full size. Calculate the actual distance dA from the illuminated object to the screen. dA = .................................................... cm [1] (iii) Calculate the focal length fA of the lens. Use the equation shown. 30.0 × (dA – 30.0) fA = dA fA = .................................................... cm [1] (b) She repeats the procedure in (a) but places the lens a distance u = 40.0 cm from the illuminated object. She measures the distance dB from the illuminated object to the screen. 64.2 dB = .................................................... cm Calculate the focal length fB of the lens. Use the equation shown. 40.0 × (dB – 40.0) fB = dB fB = .................................................... cm [1] (c) Use your results from (a)(iii) and (b) to calculate an average value for the focal length f of the lens. Give your answer to an appropriate number of significant figures. Use the equation shown. (fA + fB) f = 2 f = .................................................... cm [2] (d) State one precaution the student takes to obtain accurate results in this experiment. ................................................................................................................................................... ............................................................................................................................................. [1] (e) The student wishes to obtain more results to plot a graph to determine the focal length f of the lens. Suggest additional values of u that the student could use. ............................................................................................................................................. [2] (f) On Fig. 6.1 draw a line to show the image distance. Label this line v. [1] [Total: 10]
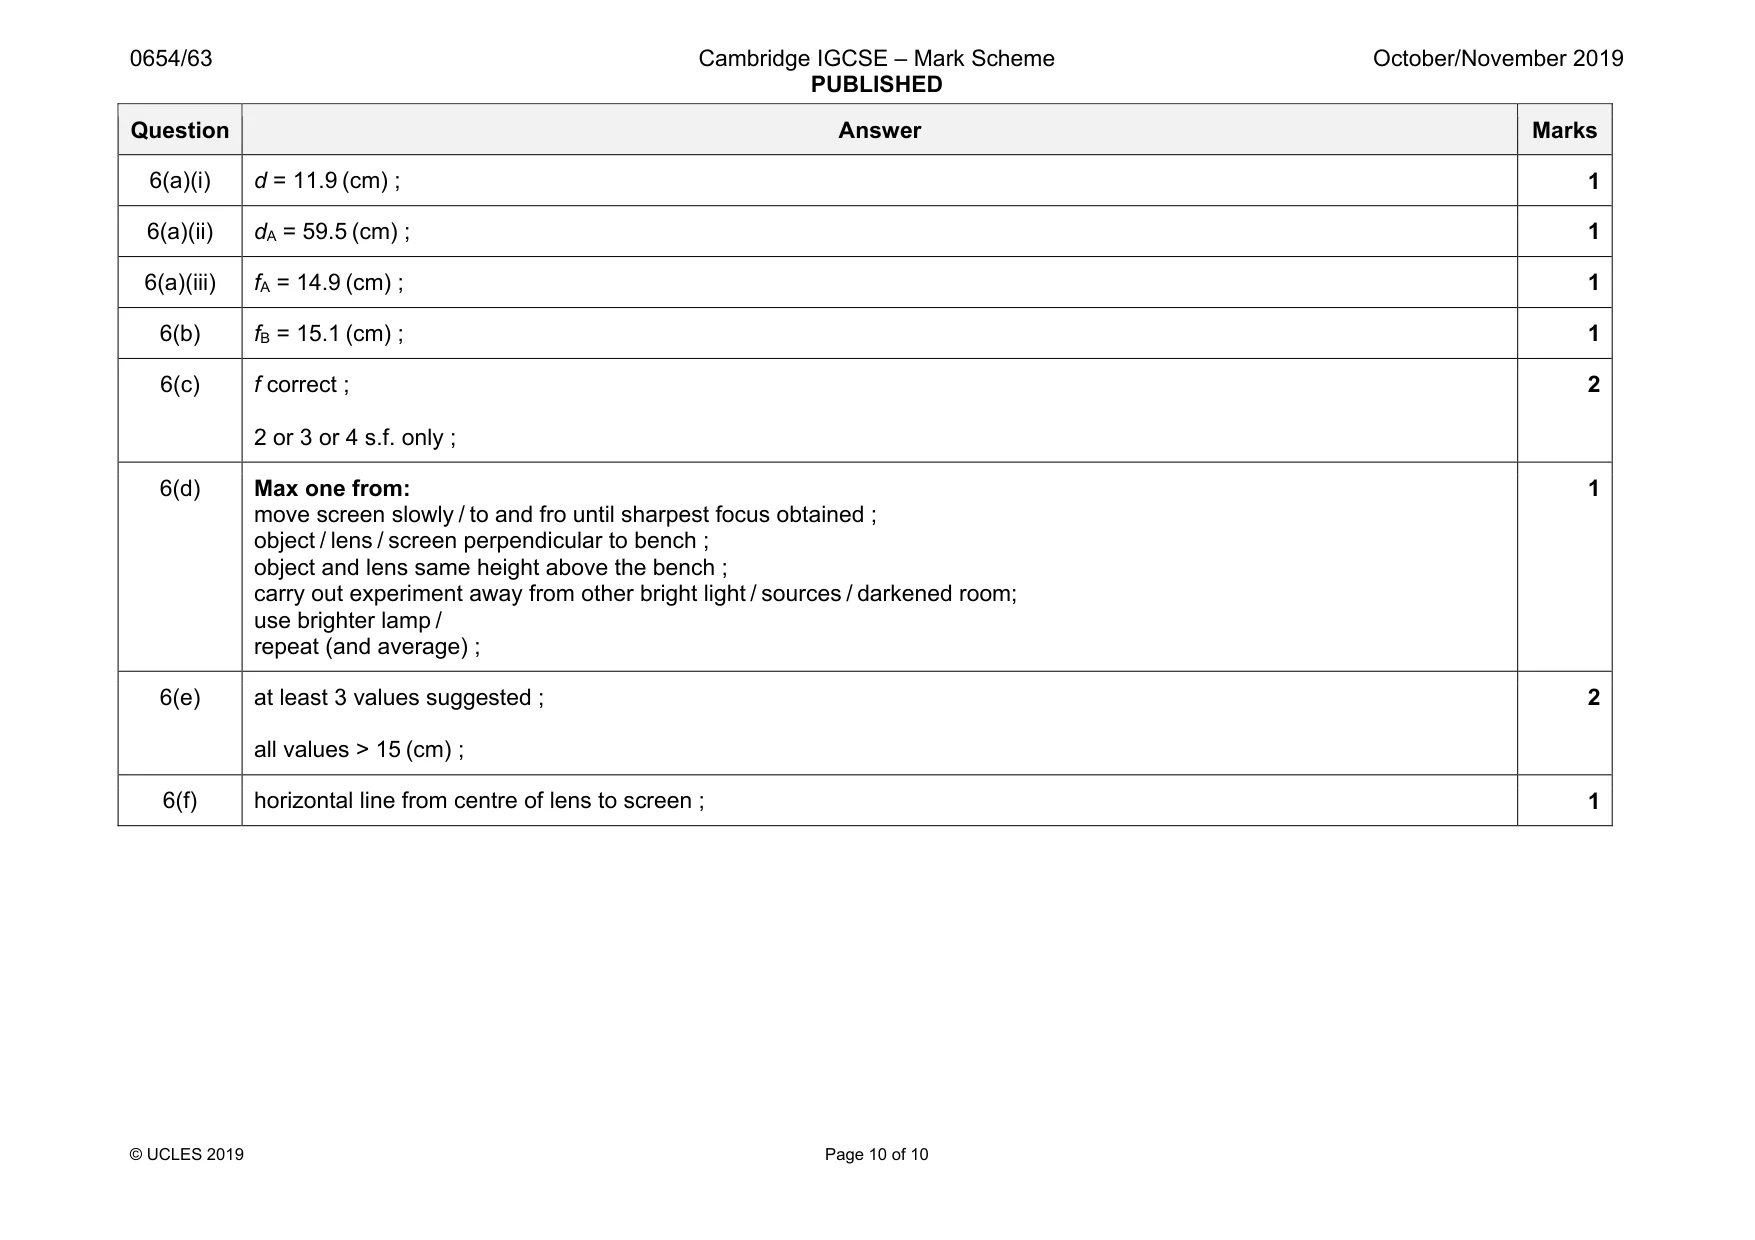
Mark scheme: 6(a)(i) d = 11.9 (cm) ; 1 6(a)(ii) dA = 59.5 (cm) ; 1 6(a)(iii) fA = 14.9 (cm) ; 1 6(b) fB = 15.1 (cm) ; 1 6(c) f correct ; 2 or 3 or 4 s.f. only ; 2 6(d) Max one from: move screen slowly / to and fro until sharpest focus obtained ; object / lens / screen perpendicular to bench ; object and lens same height above the bench ; carry out experiment away from other bright light / sources / darkened room; use brighter lamp / repeat (and average) ; 1 6(e) at least 3 values suggested ; all values > 15 (cm) ; 2 6(f) horizontal line from centre of lens to screen ; 1
What was in this paper
The subtopics covered by these 6 questions, and how many questions each got. Open one in a new tab to see every Cambridge question on it.
What you needed in this session
Cambridge’s own grade thresholds for 2019 Oct/Nov, Paper 6 · Variant 3. A higher threshold means an easier paper — the bar moves with how the cohort did.