Cambridge IGCSE Sciences - Co-ordinated (Double) 0654 — 2018 Oct/Nov Paper 6 · Variant 3
0654/63/O/N/18 · 6 questions · 60 marks · ≈68 min
The question paper and its mark scheme, free to read here and free to download. This is Cambridge’s own paper, exactly as it was sat.
Question paper20 pages

Mark scheme8 pages
Answers below. Sit the paper first if you are practising.
Questions as text
Q1 · A student investigates a flower
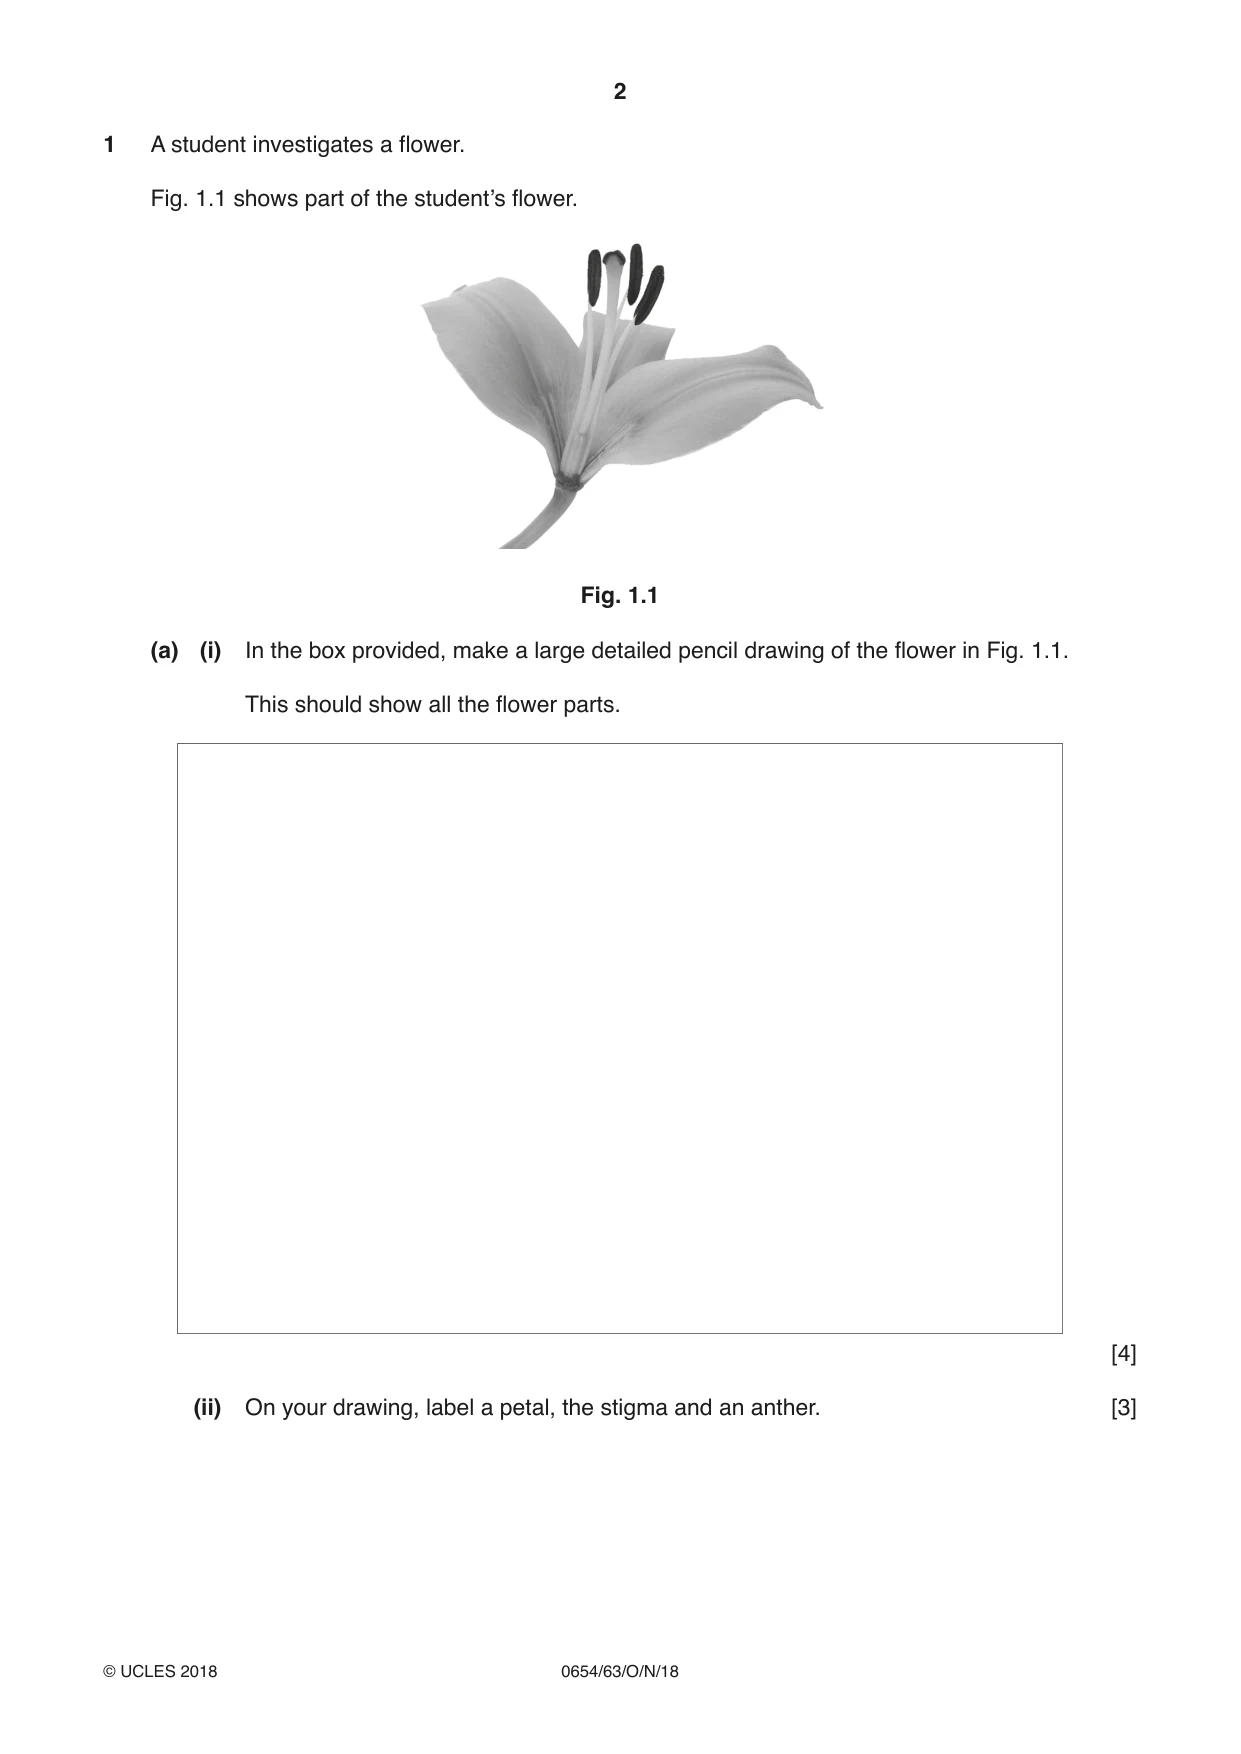
1 A student investigates a flower. Fig. 1.1 shows part of the student’s flower. Fig. 1.1 (a) (i) In the box provided, make a large detailed pencil drawing of the flower in Fig. 1.1. This should show all the flower parts. [4] (ii) On your drawing, label a petal, the stigma and an anther. [3] (b) (i) A student crushes some olives, producing olive juice. Describe a test that can be used to confirm that a sample of the olive juice contains fat. Include the observation for a positive result. test .................................................................................................................................... ........................................................................................................................................... observation ........................................................................................................................ [2] (ii) Suggest why this method would be unsuitable to test for the presence of fat in milk. ........................................................................................................................................... .......................................................................................................................................[1]
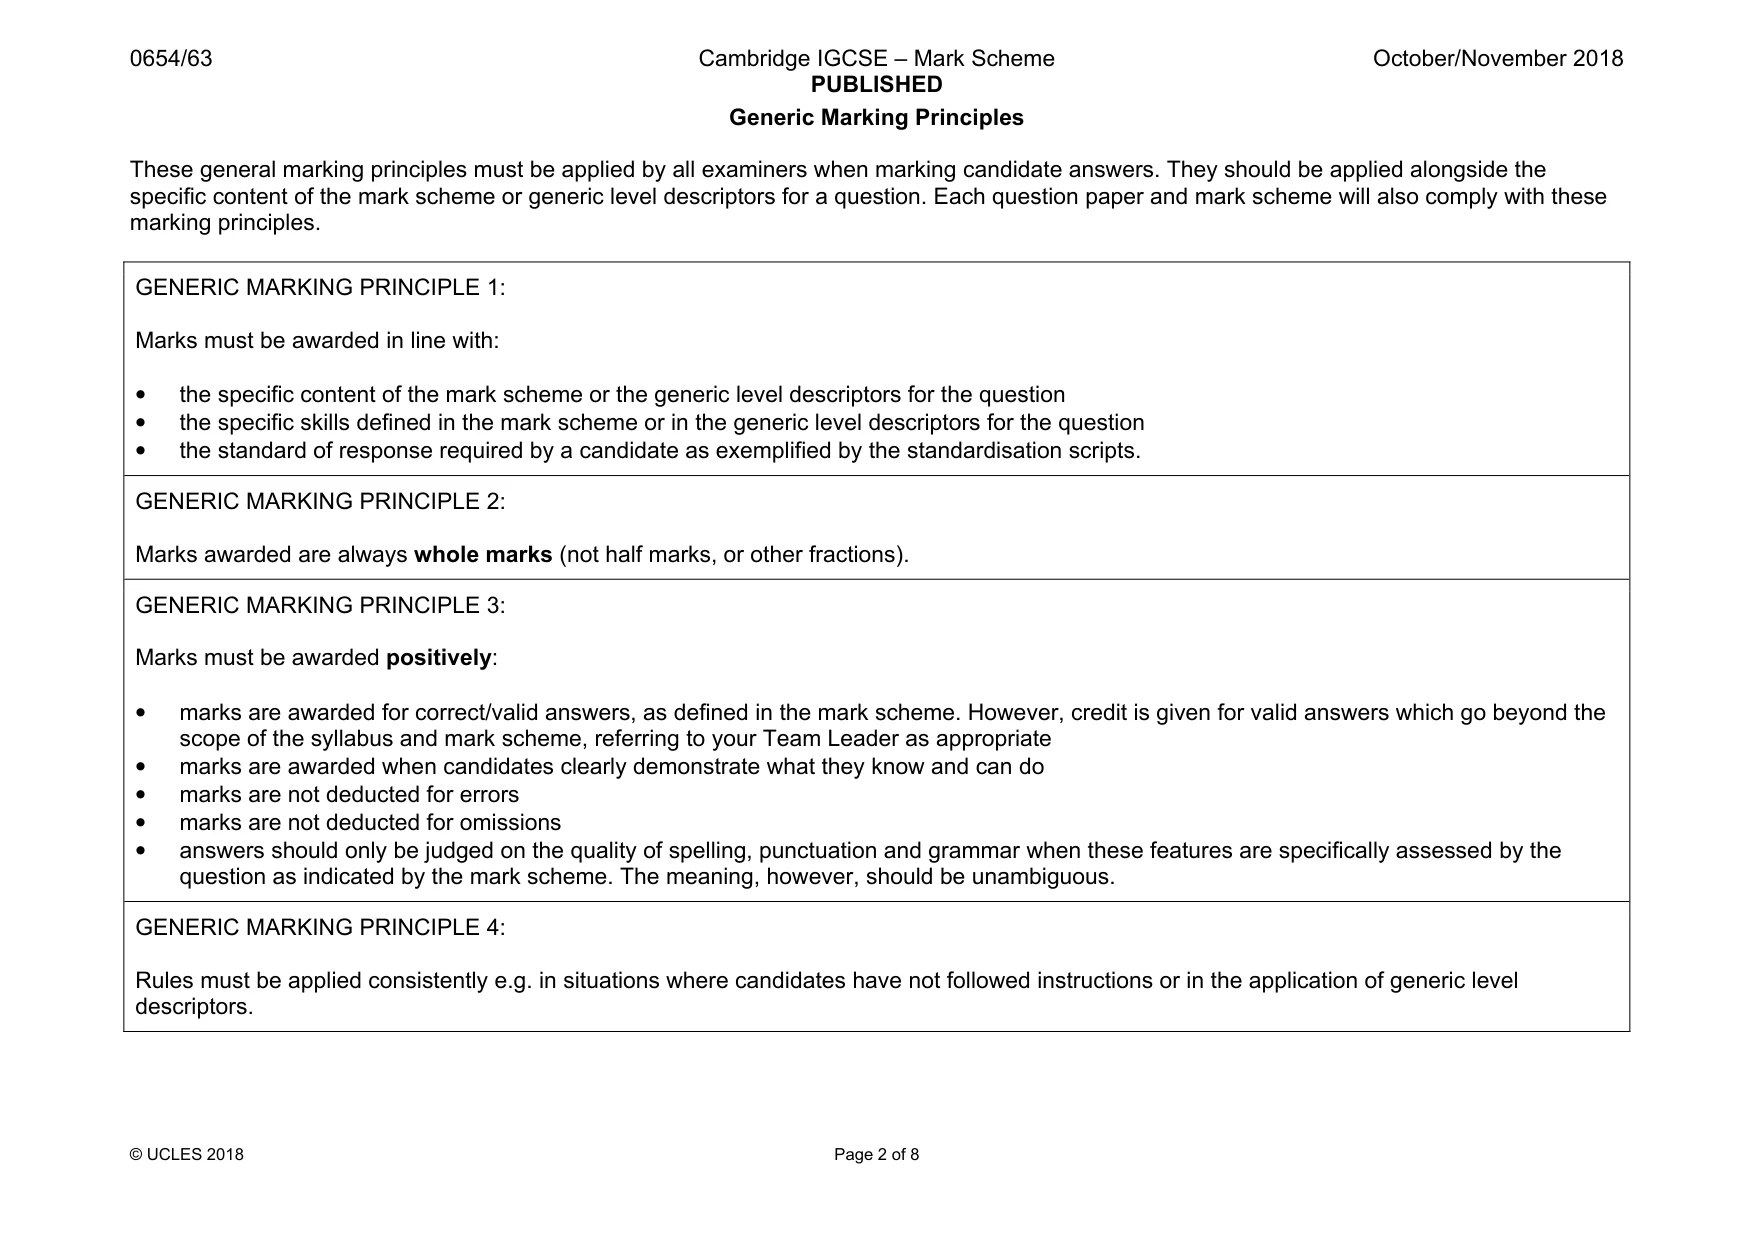
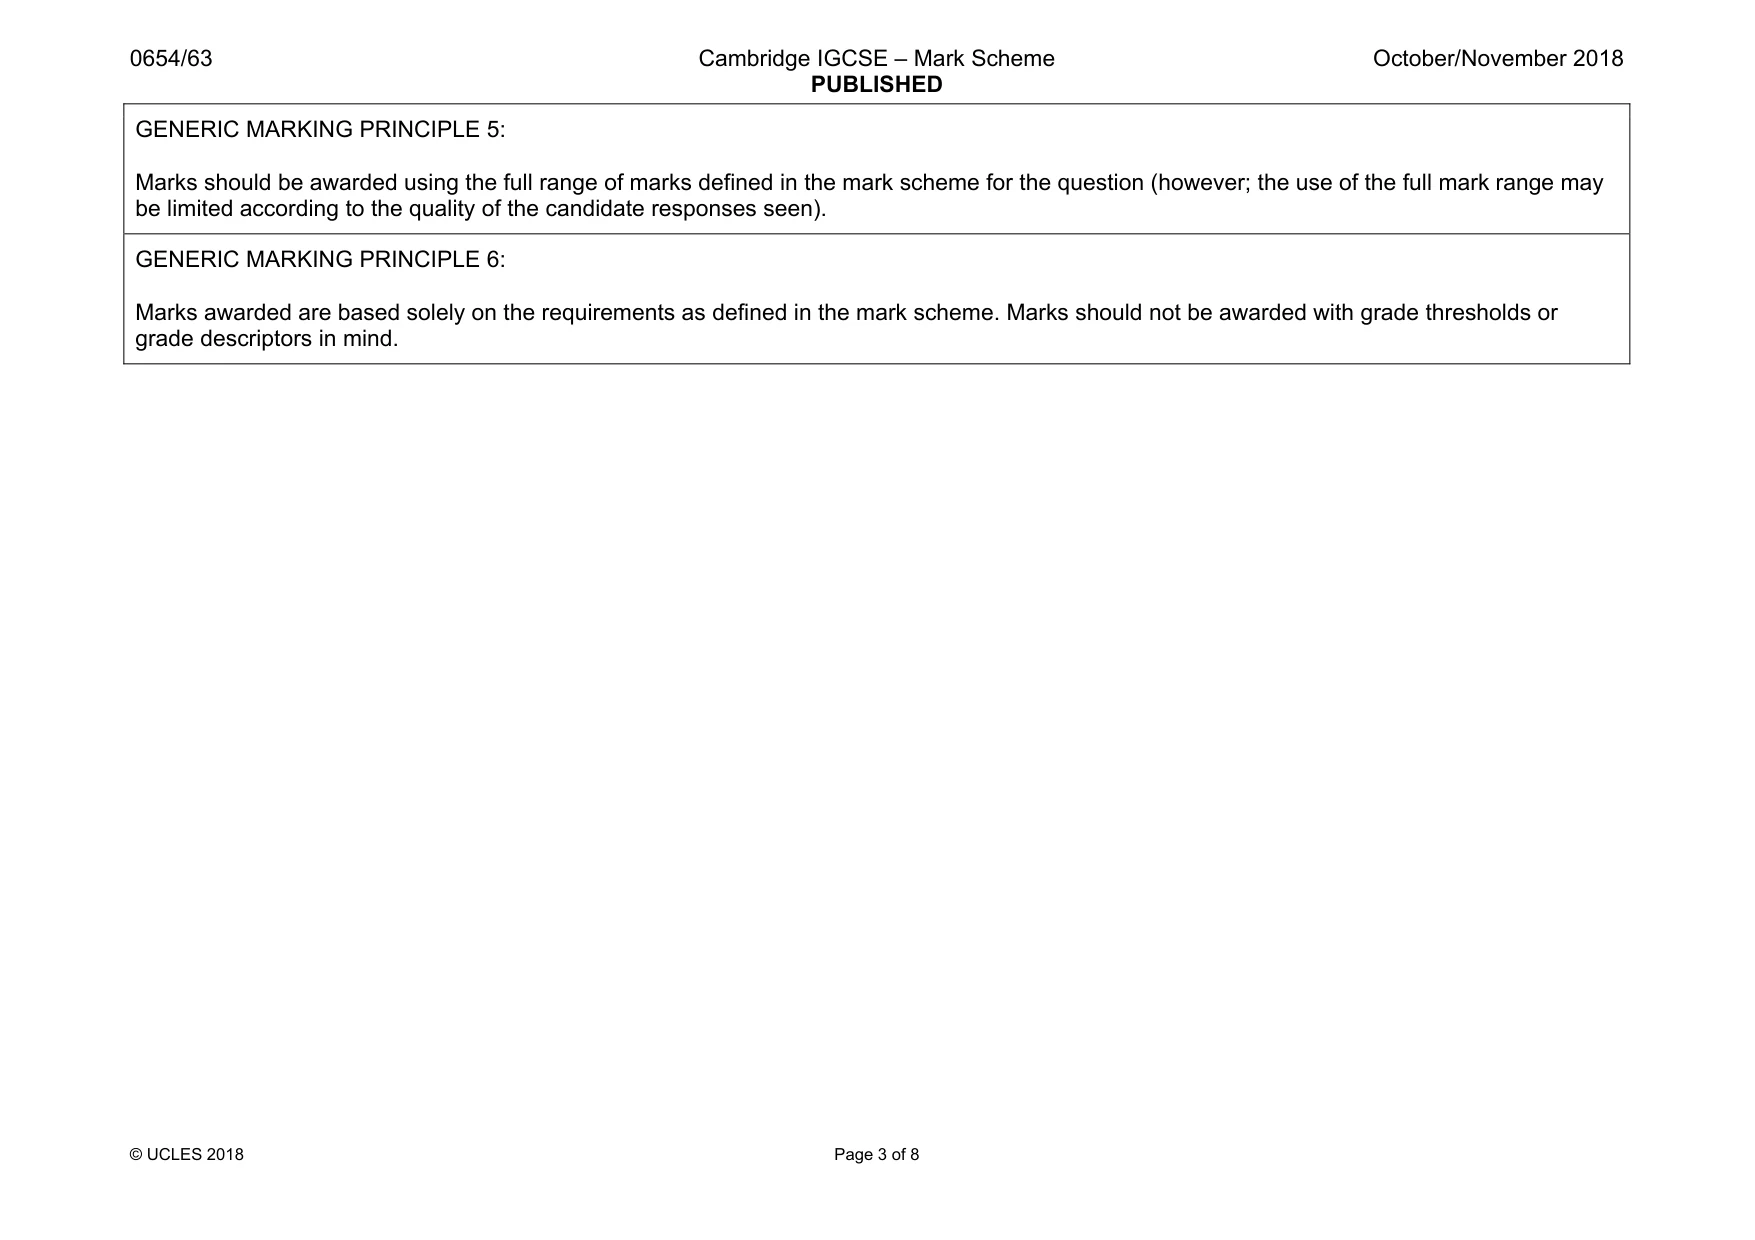
Mark scheme: 1(a)(i) smooth continuous outline; larger than original drawing ; anther and filament clearly visible ; stigma and style clearly visible ; 4 1(a)(ii) petal correctly labelled ; stigma correctly labelled ; anther correctly labelled ; 3 1(b)(i) ethanol ; water and white emulsion ; 2 1(b)(ii) opaque so masks observation ; 1
Q2 · Solid J is a mixture of two compounds
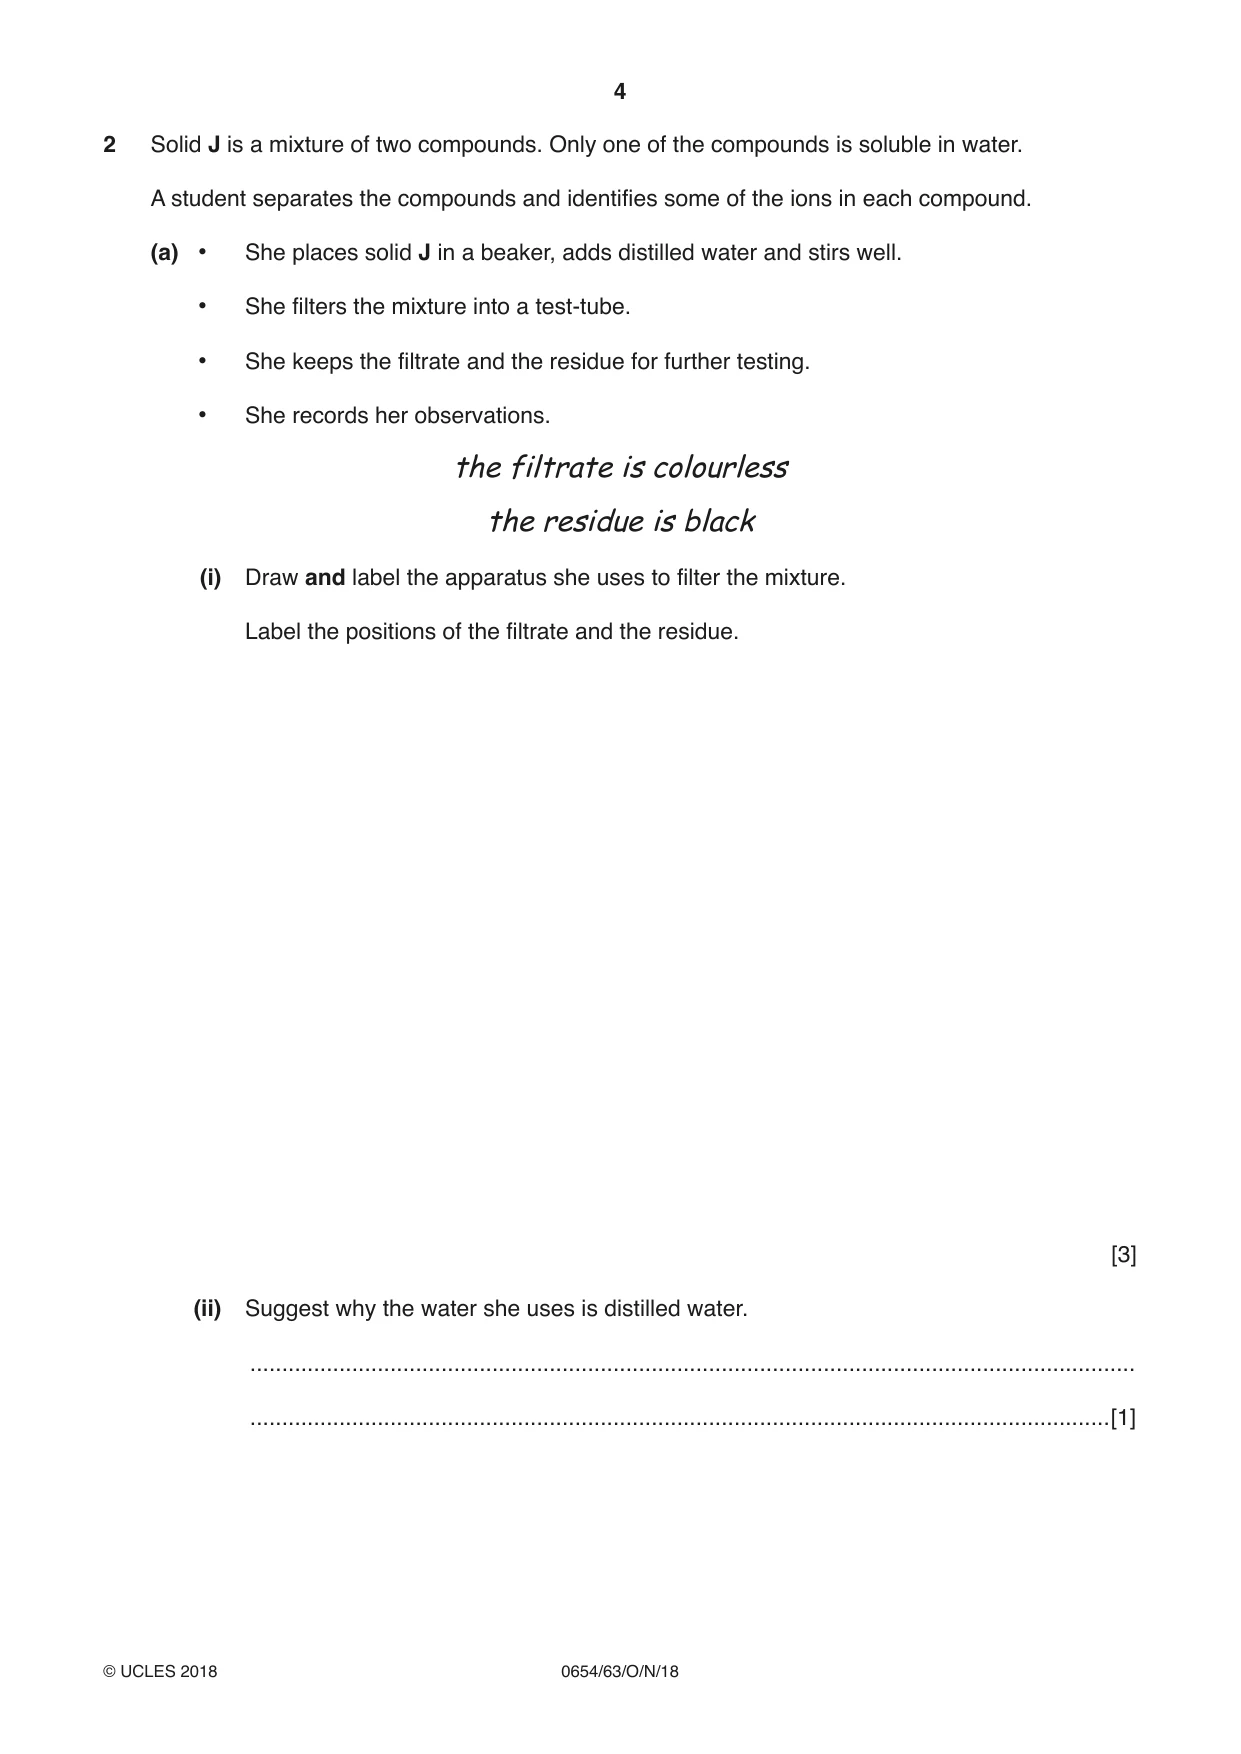
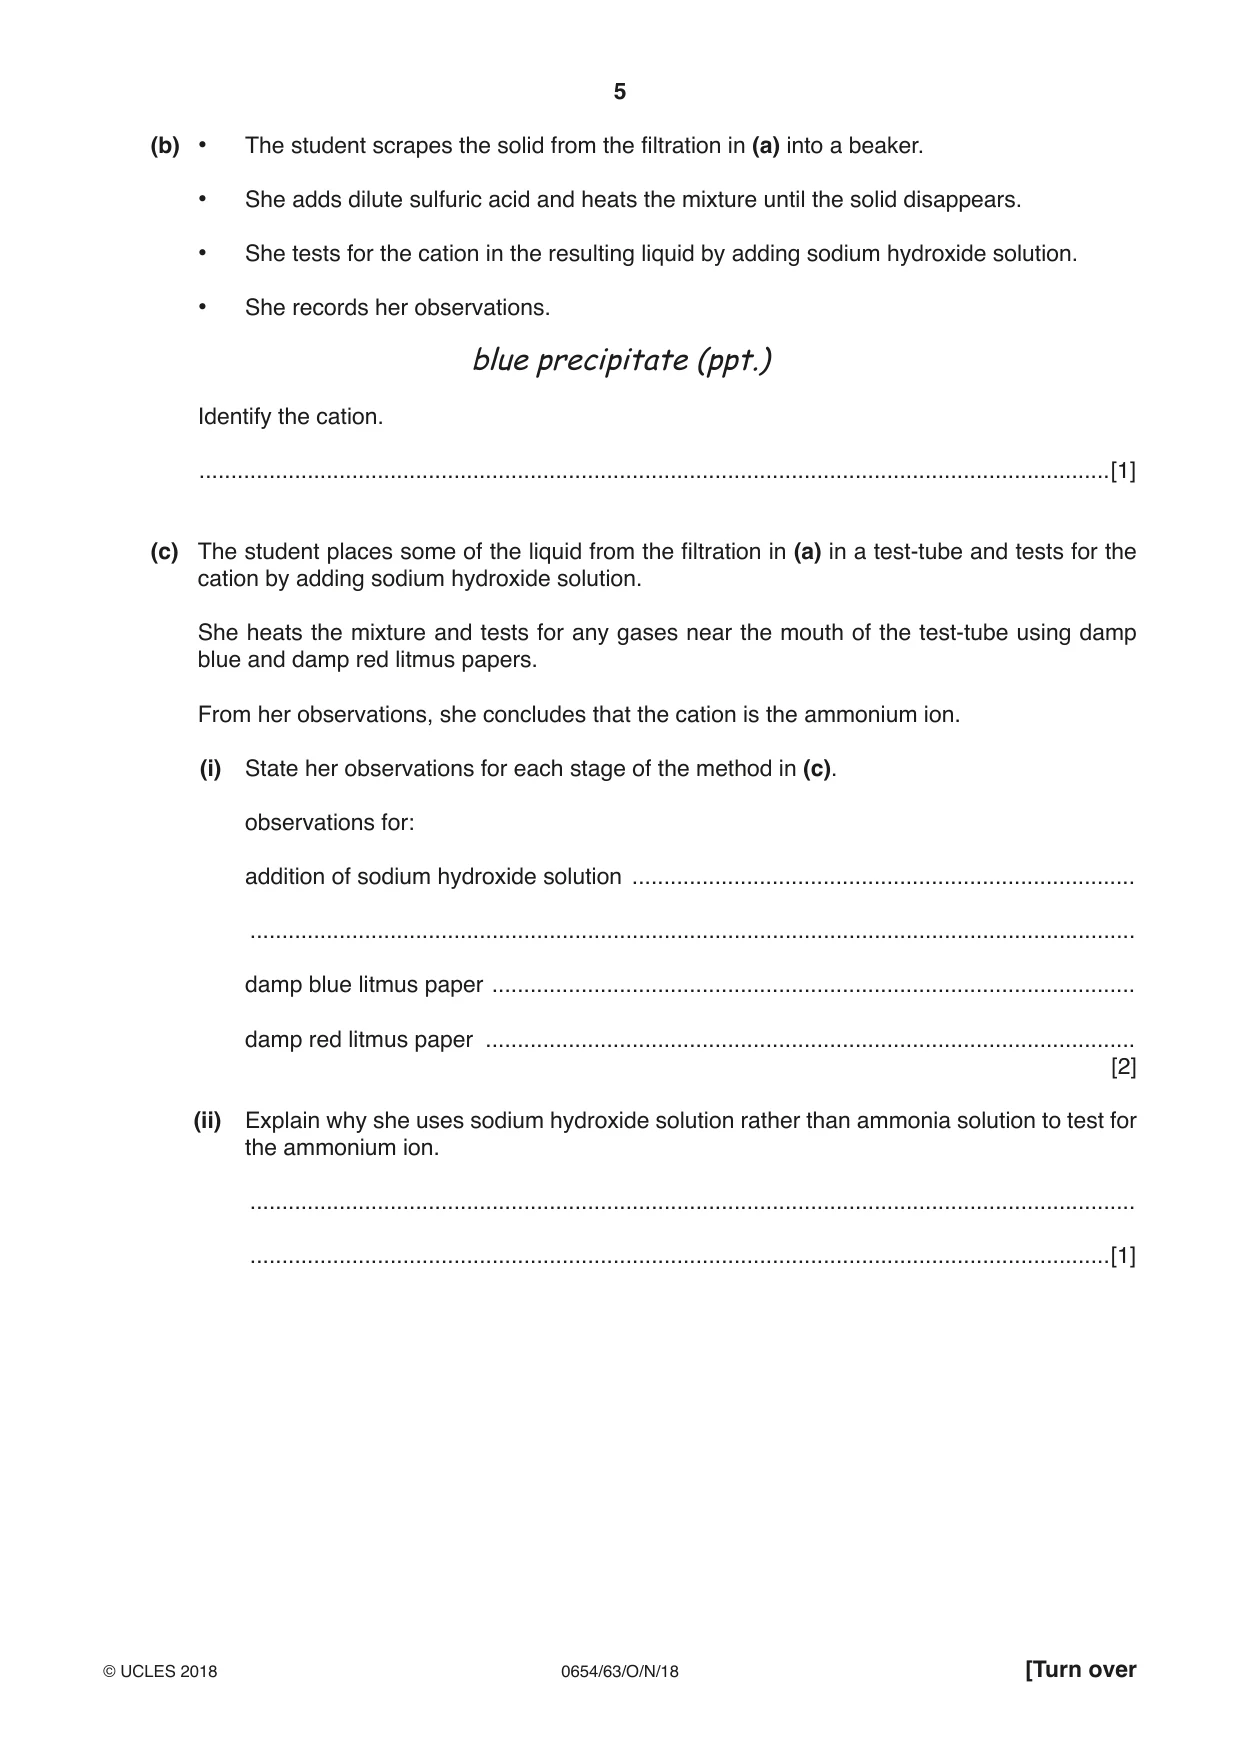
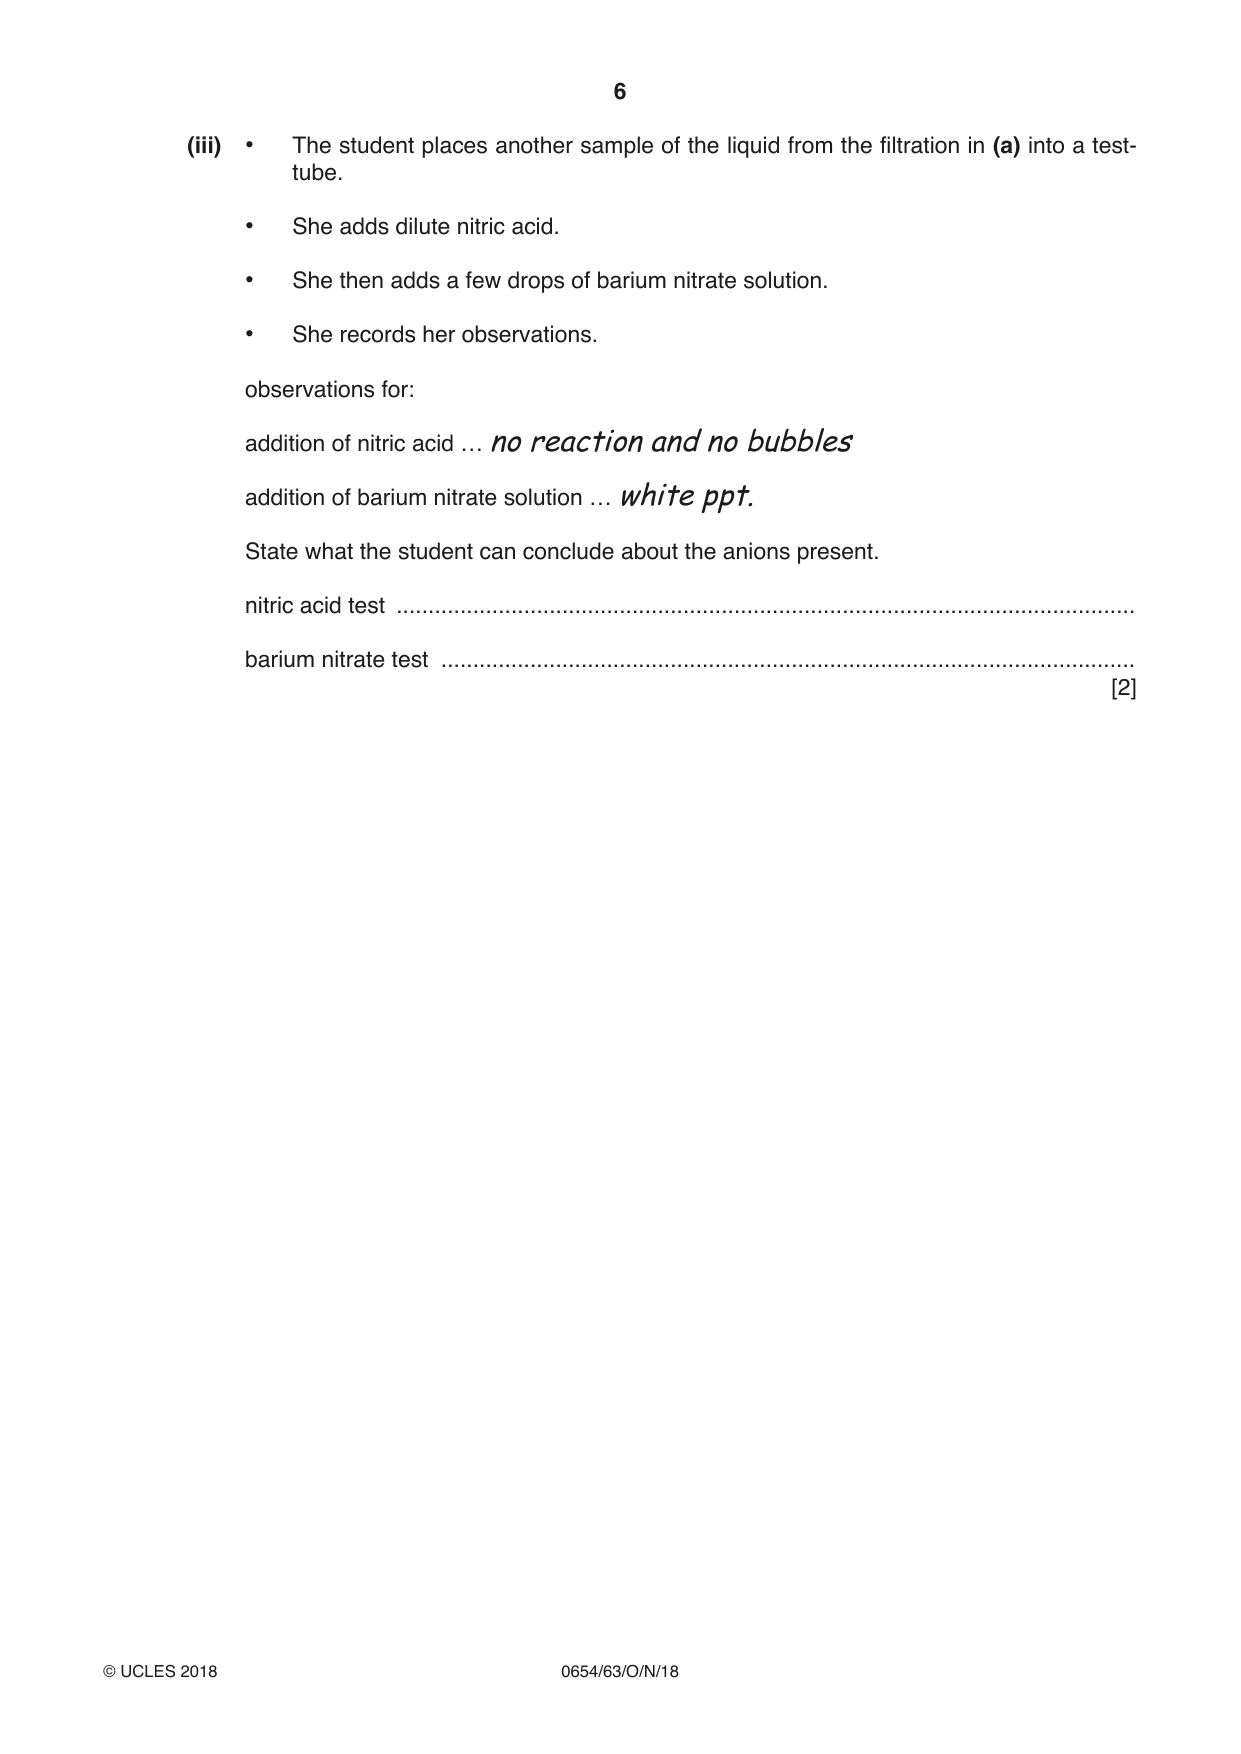
2 Solid J is a mixture of two compounds. Only one of the compounds is soluble in water. A student separates the compounds and identifies some of the ions in each compound. (a) • She places solid J in a beaker, adds distilled water and stirs well. • She filters the mixture into a test-tube. • She keeps the filtrate and the residue for further testing. • She records her observations. thefiltrateiscolourless theresidueisblack (i) Draw and label the apparatus she uses to filter the mixture. Label the positions of the filtrate and the residue. [3] (ii) Suggest why the water she uses is distilled water. ........................................................................................................................................... .......................................................................................................................................[1] (b) • The student scrapes the solid from the filtration in (a) into a beaker. • She adds dilute sulfuric acid and heats the mixture until the solid disappears. • She tests for the cation in the resulting liquid by adding sodium hydroxide solution. • She records her observations. blueprecipitate(ppt.) Identify the cation. ...............................................................................................................................................[1] (c) The student places some of the liquid from the filtration in (a) in a test-tube and tests for the cation by adding sodium hydroxide solution. She heats the mixture and tests for any gases near the mouth of the test-tube using damp blue and damp red litmus papers. From her observations, she concludes that the cation is the ammonium ion. (i) State her observations for each stage of the method in (c). observations for: addition of sodium hydroxide solution ............................................................................... ........................................................................................................................................... damp blue litmus paper ..................................................................................................... damp red litmus paper ...................................................................................................... [2] (ii) Explain why she uses sodium hydroxide solution rather than ammonia solution to test for the ammonium ion. ........................................................................................................................................... .......................................................................................................................................[1] (iii) • The student places another sample of the liquid from the filtration in (a) into a test- tube. • She adds dilute nitric acid. • She then adds a few drops of barium nitrate solution. • She records her observations. observations for: addition of nitric acid … noreactionandnobubbles addition of barium nitrate solution … whiteppt. State what the student can conclude about the anions present. nitric acid test .................................................................................................................... barium nitrate test ............................................................................................................. [2]
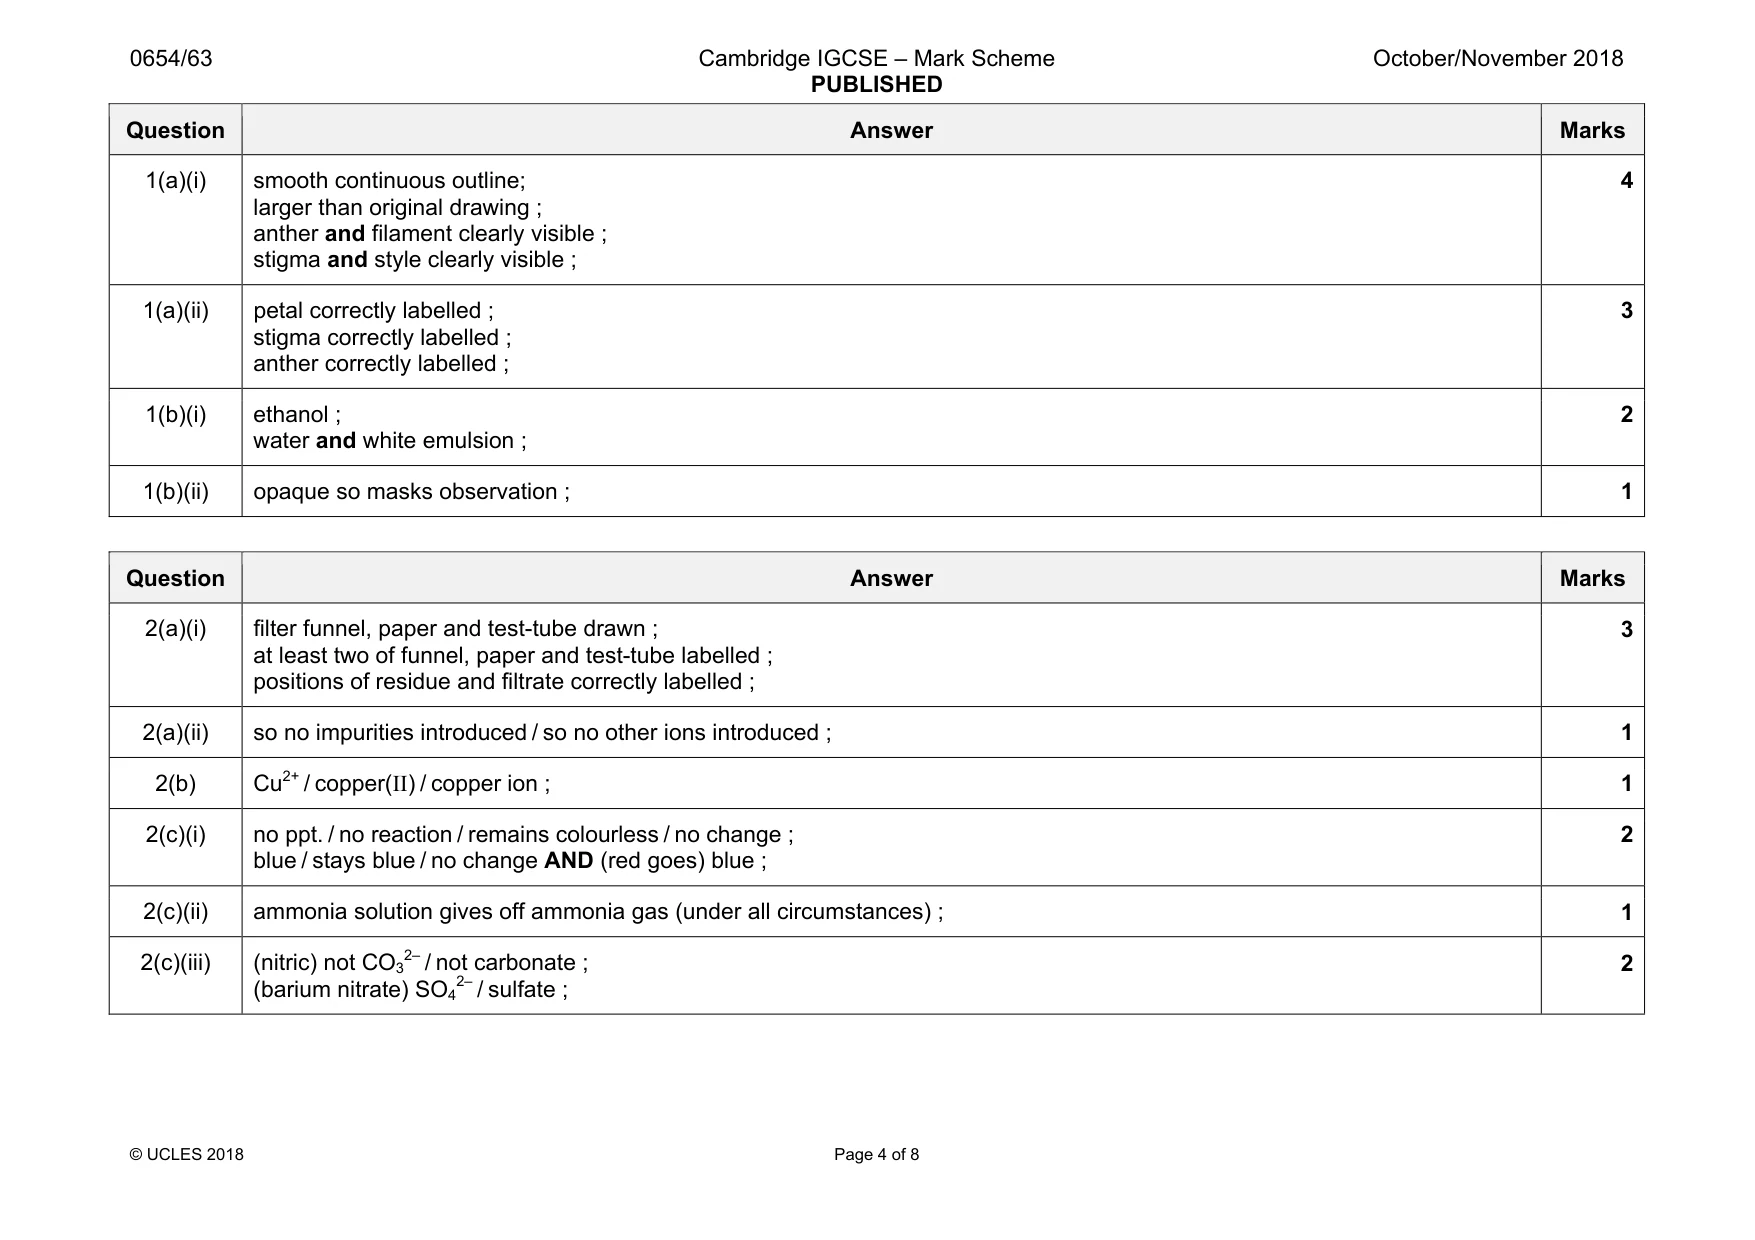
Mark scheme: 2(a)(i) filter funnel, paper and test-tube drawn ; at least two of funnel, paper and test-tube labelled ; positions of residue and filtrate correctly labelled ; 3 2(a)(ii) so no impurities introduced / so no other ions introduced ; 1 2(b) Cu2+ / copper(II) / copper ion ; 1 2(c)(i) no ppt. / no reaction / remains colourless / no change ; blue / stays blue / no change AND (red goes) blue ; 2 2(c)(ii) ammonia solution gives off ammonia gas (under all circumstances) ; 1 2(c)(iii) (nitric) not CO3 2– / not carbonate ; (barium nitrate) SO4 2– / sulfate ; 2
Q3 · A student investigates how the temperature of the surroundings affects the rate of…
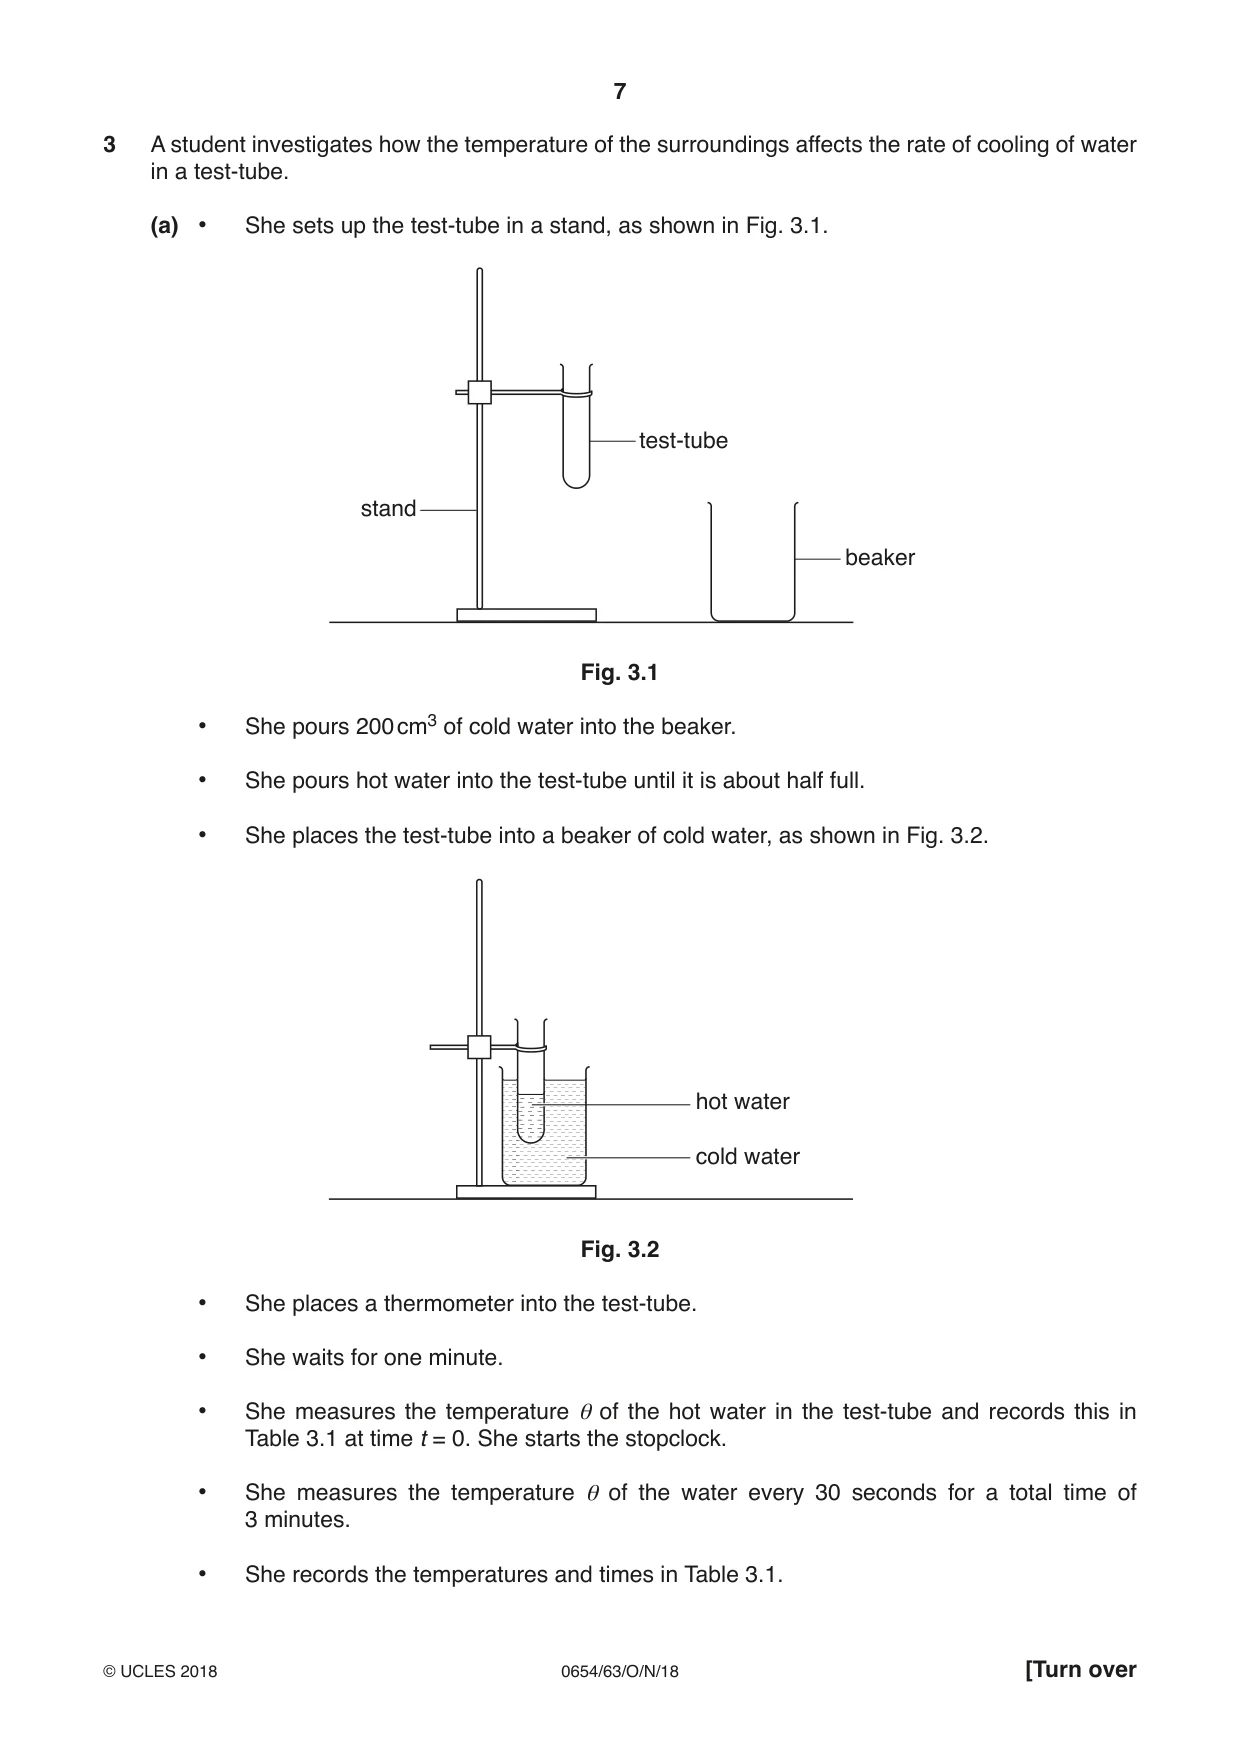
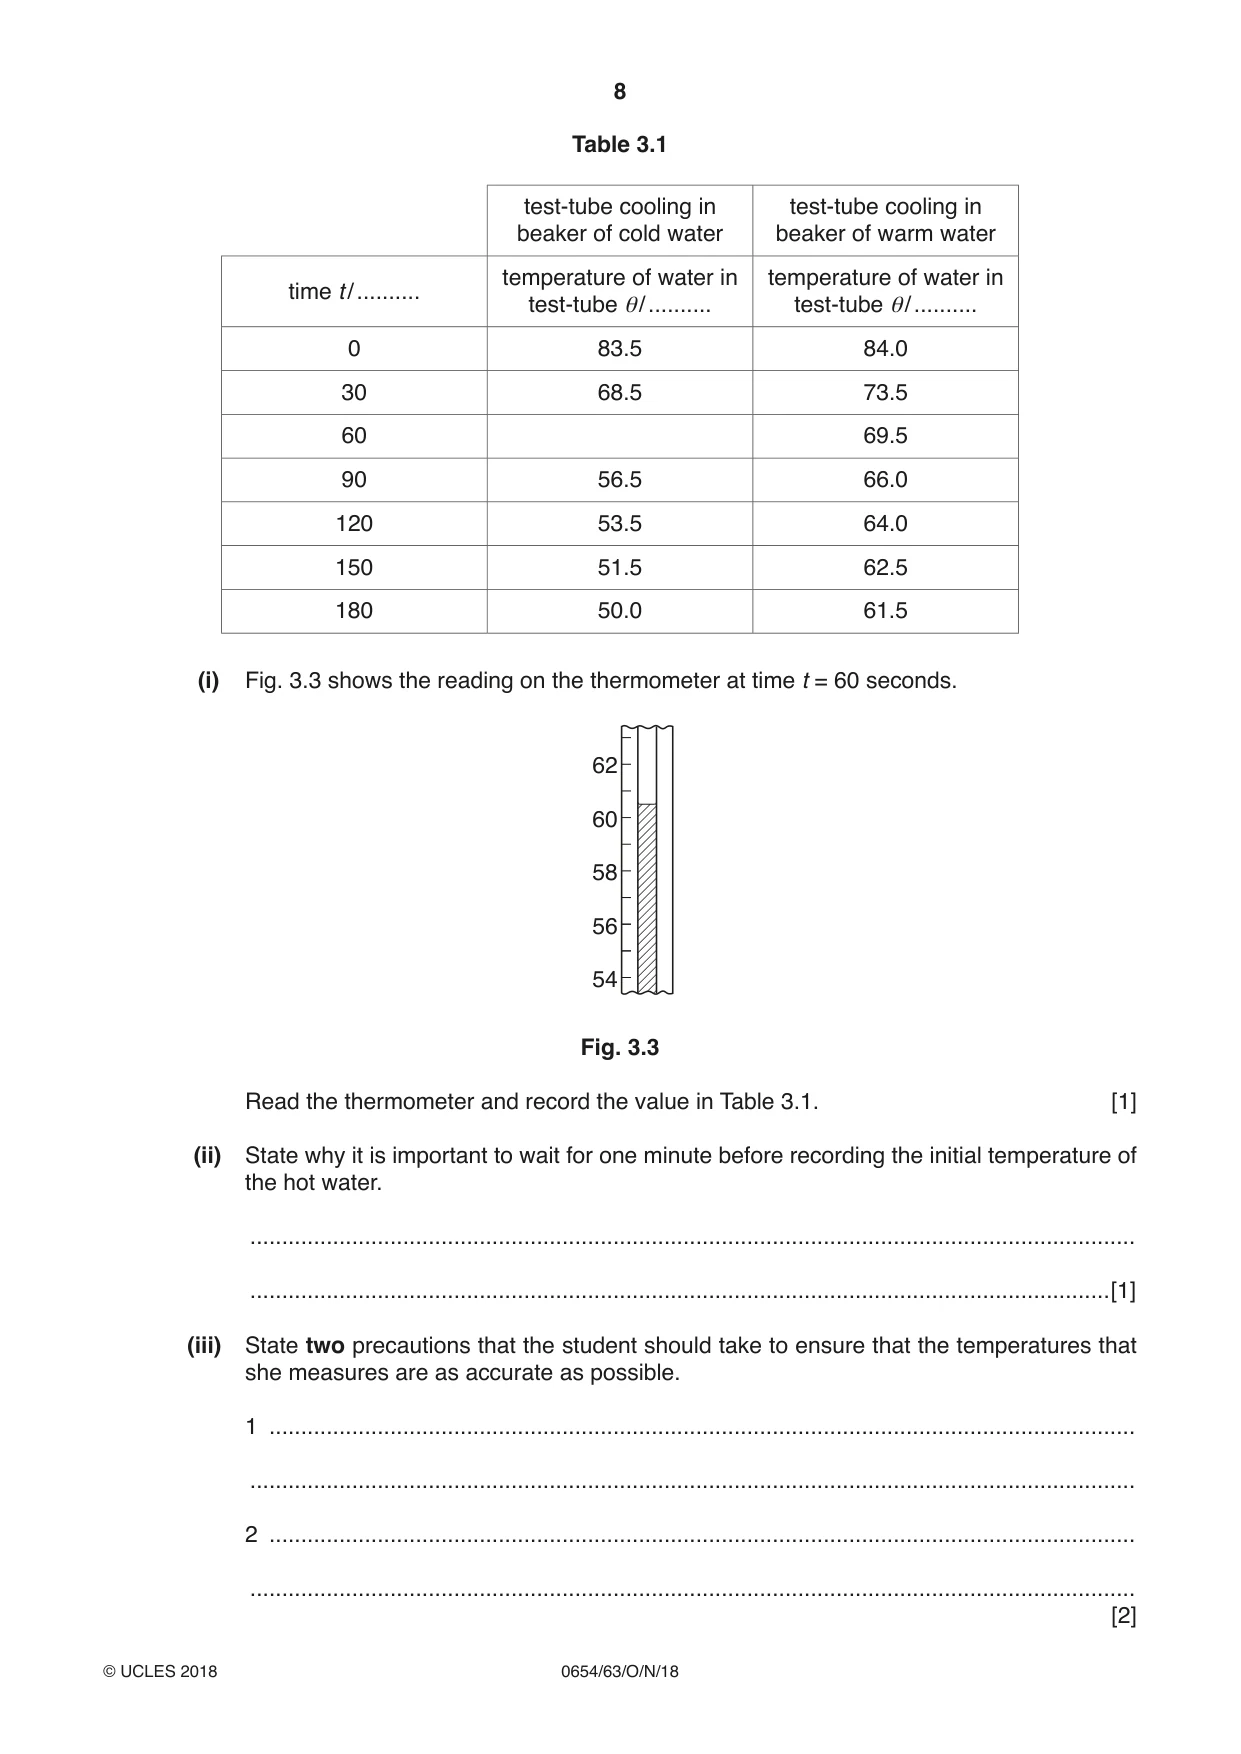
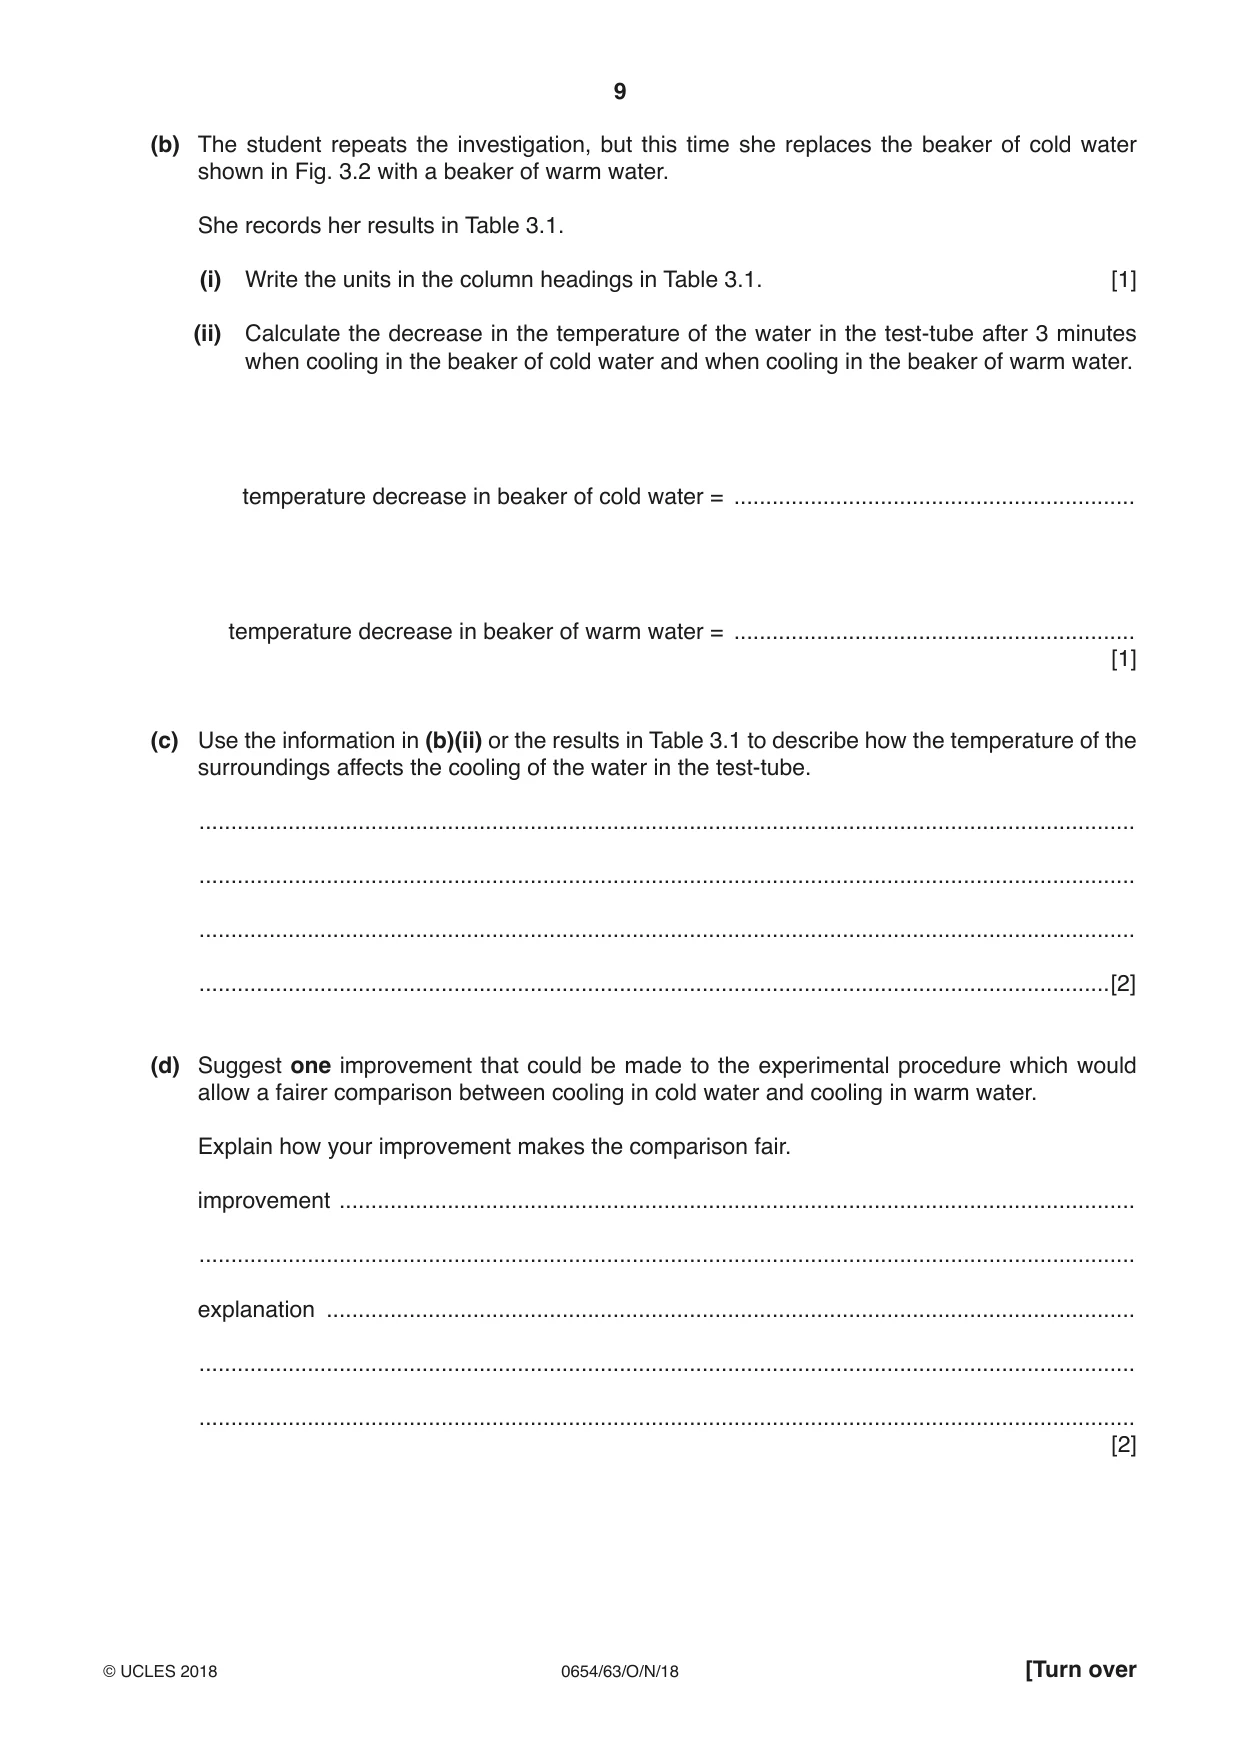
3 A student investigates how the temperature of the surroundings affects the rate of cooling of water in a test-tube. (a) • She sets up the test-tube in a stand, as shown in Fig. 3.1. test-tube stand beaker Fig. 3.1 • She pours 200 cm3 of cold water into the beaker. • She pours hot water into the test-tube until it is about half full. • She places the test-tube into a beaker of cold water, as shown in Fig. 3.2. hot water cold water Fig. 3.2 • She places a thermometer into the test-tube. • She waits for one minute. • She measures the temperature θ of the hot water in the test-tube and records this in Table 3.1 at time t = 0. She starts the stopclock. • She measures the temperature θ of the water every 30 seconds for a total time of 3 minutes. • She records the temperatures and times in Table 3.1. Table 3.1 test-tube cooling in test-tube cooling in beaker of cold water beaker of warm water temperature of water in temperature of water in time t / .......... test-tube θ/ .......... test-tube θ/ .......... 0 83.5 84.0 30 68.5 73.5 60 69.5 90 56.5 66.0 120 53.5 64.0 150 51.5 62.5 180 50.0 61.5 (i) Fig. 3.3 shows the reading on the thermometer at time t = 60 seconds. 62 60 58 56 54 Fig. 3.3 Read the thermometer and record the value in Table 3.1. [1] (ii) State why it is important to wait for one minute before recording the initial temperature of the hot water. ........................................................................................................................................... .......................................................................................................................................[1] (iii) State two precautions that the student should take to ensure that the temperatures that she measures are as accurate as possible. 1 ........................................................................................................................................ ........................................................................................................................................... 2 ........................................................................................................................................ ........................................................................................................................................... [2] (b) The student repeats the investigation, but this time she replaces the beaker of cold water shown in Fig. 3.2 with a beaker of warm water. She records her results in Table 3.1. (i) Write the units in the column headings in Table 3.1. [1] (ii) Calculate the decrease in the temperature of the water in the test-tube after 3 minutes when cooling in the beaker of cold water and when cooling in the beaker of warm water. temperature decrease in beaker of cold water = ............................................................... temperature decrease in beaker of warm water = ............................................................... [1] (c) Use the information in (b)(ii) or the results in Table 3.1 to describe how the temperature of the surroundings affects the cooling of the water in the test-tube. ................................................................................................................................................... ................................................................................................................................................... ................................................................................................................................................... ...............................................................................................................................................[2] (d) Suggest one improvement that could be made to the experimental procedure which would allow a fairer comparison between cooling in cold water and cooling in warm water. Explain how your improvement makes the comparison fair. improvement ............................................................................................................................. ................................................................................................................................................... explanation ............................................................................................................................... ................................................................................................................................................... ................................................................................................................................................... [2]
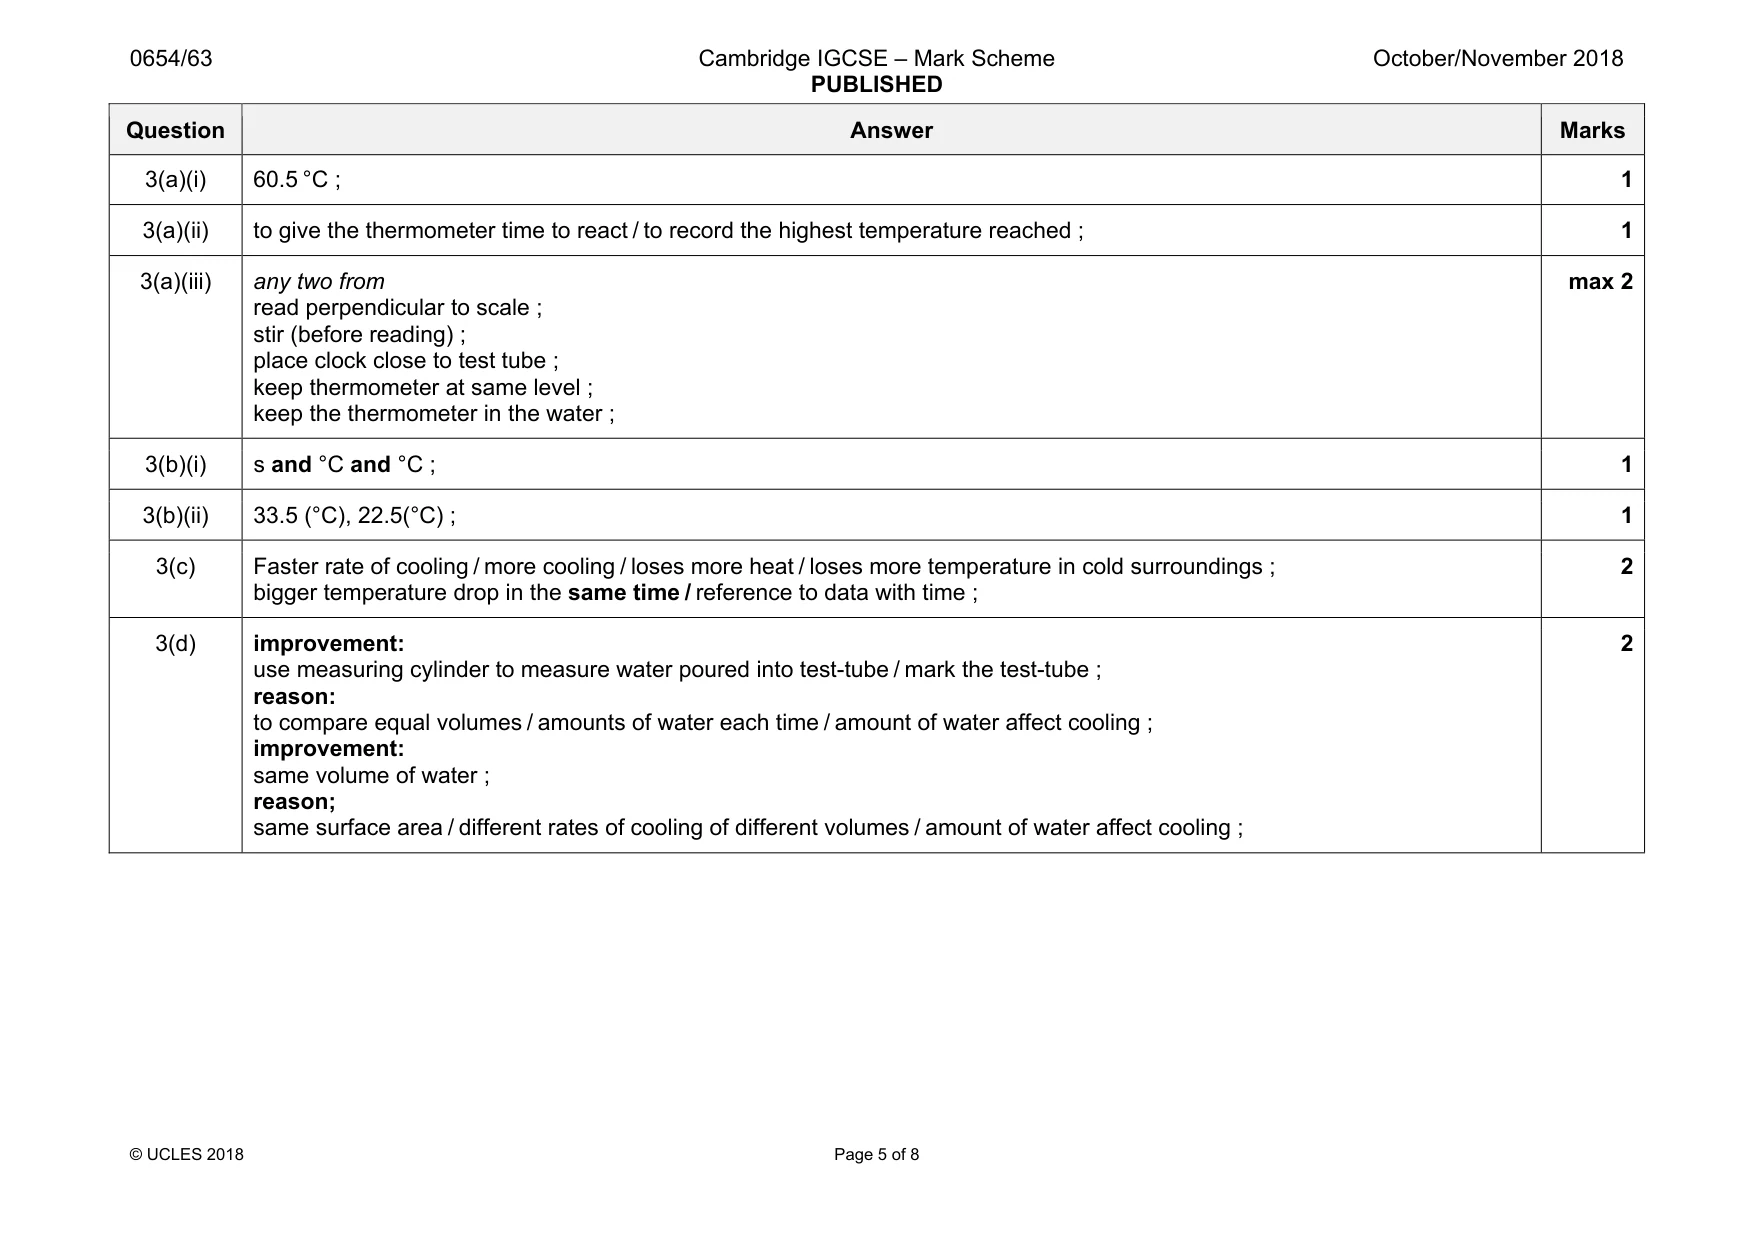
Mark scheme: 3(a)(i) 60.5 °C ; 1 3(a)(ii) to give the thermometer time to react / to record the highest temperature reached ; 1 3(a)(iii) any two from read perpendicular to scale ; stir (before reading) ; place clock close to test tube ; keep thermometer at same level ; keep the thermometer in the water ; max 2 3(b)(i) s and °C and °C ; 1 3(b)(ii) 33.5 (°C), 22.5(°C) ; 1 3(c) Faster rate of cooling / more cooling / loses more heat / loses more temperature in cold surroundings ; bigger temperature drop in the same time / reference to data with time ; 2 3(d) improvement: use measuring cylinder to measure water poured into test-tube / mark the test-tube ; reason: to compare equal volumes / amounts of water each time / amount of water affect cooling ; improvement: same volume of water ; reason; same surface area / different rates of cooling of different volumes / amount of water affect cooling ; 2
Q4 · A student uses a choice chamber to investigate the responses of woodlice (small…
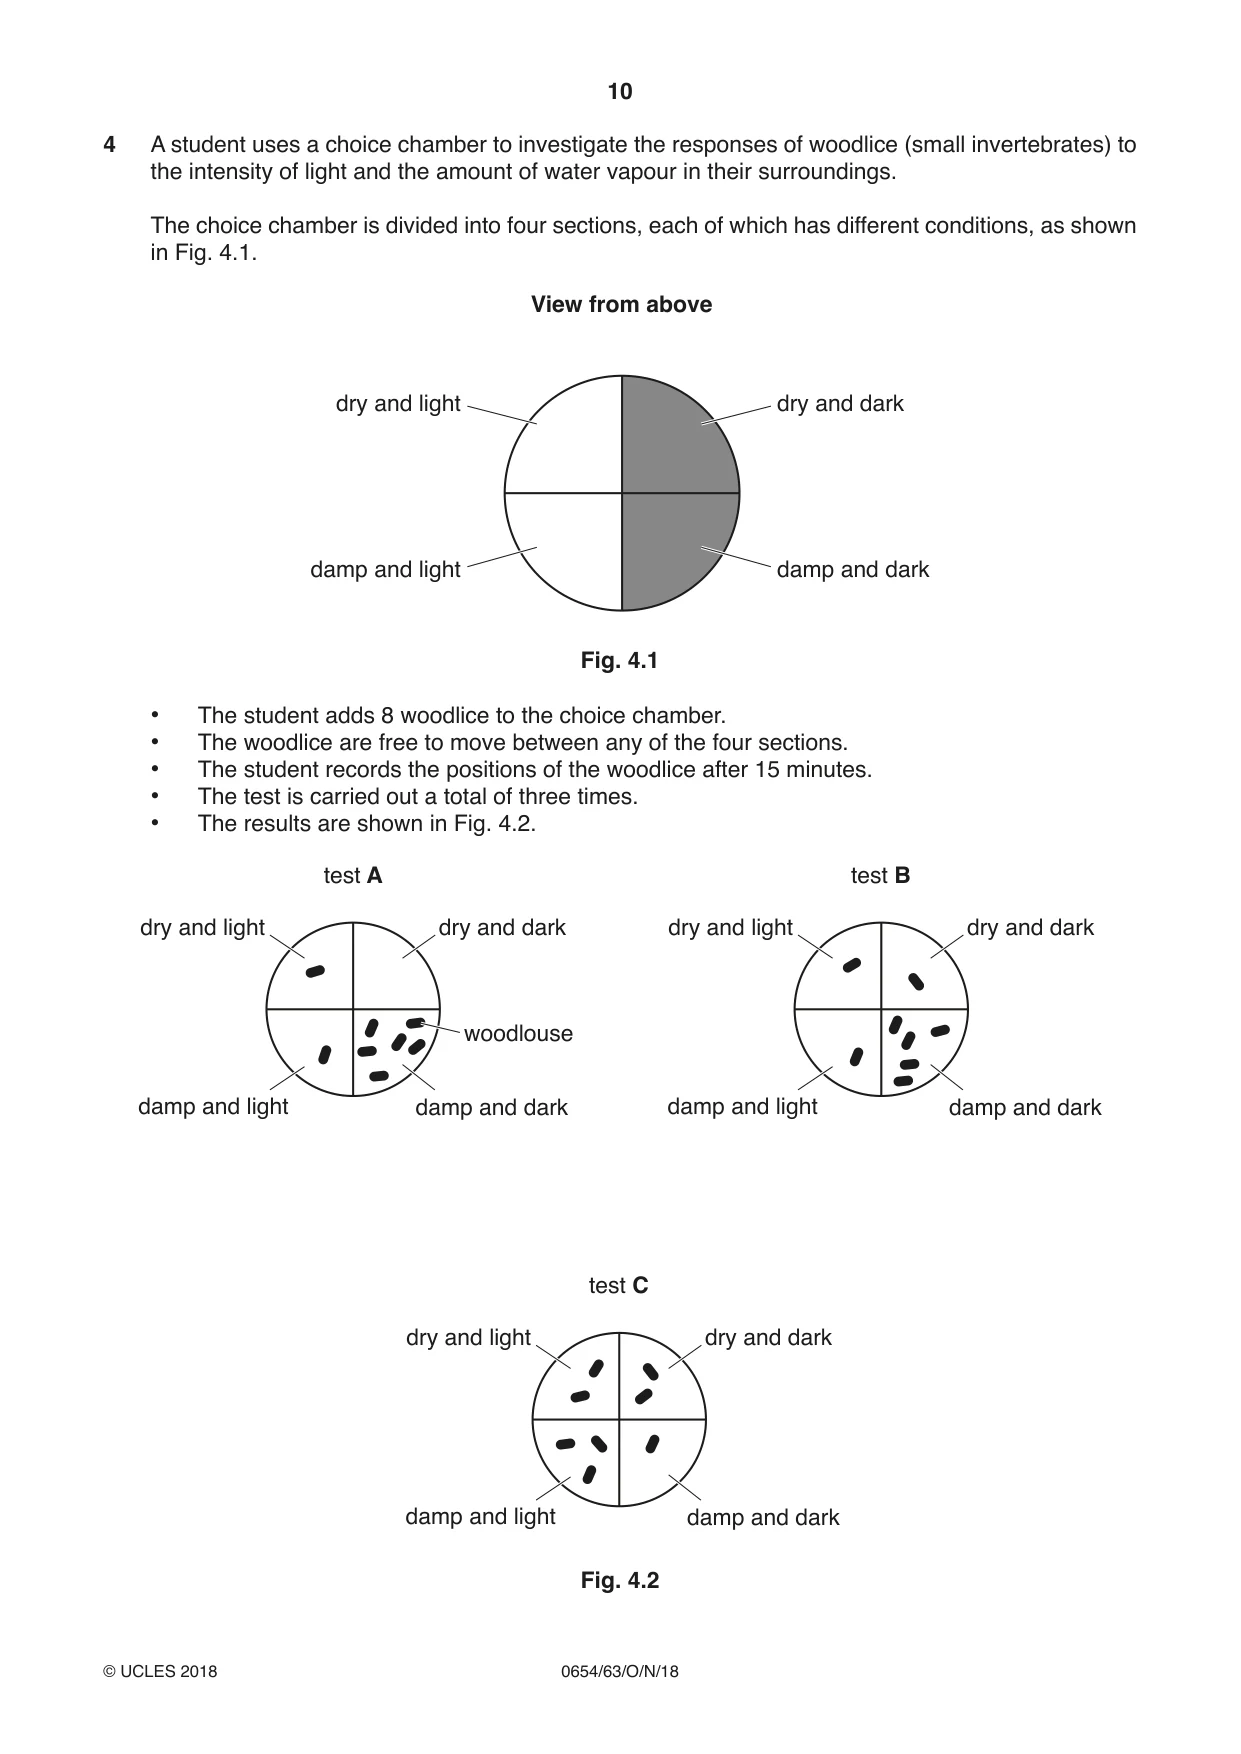
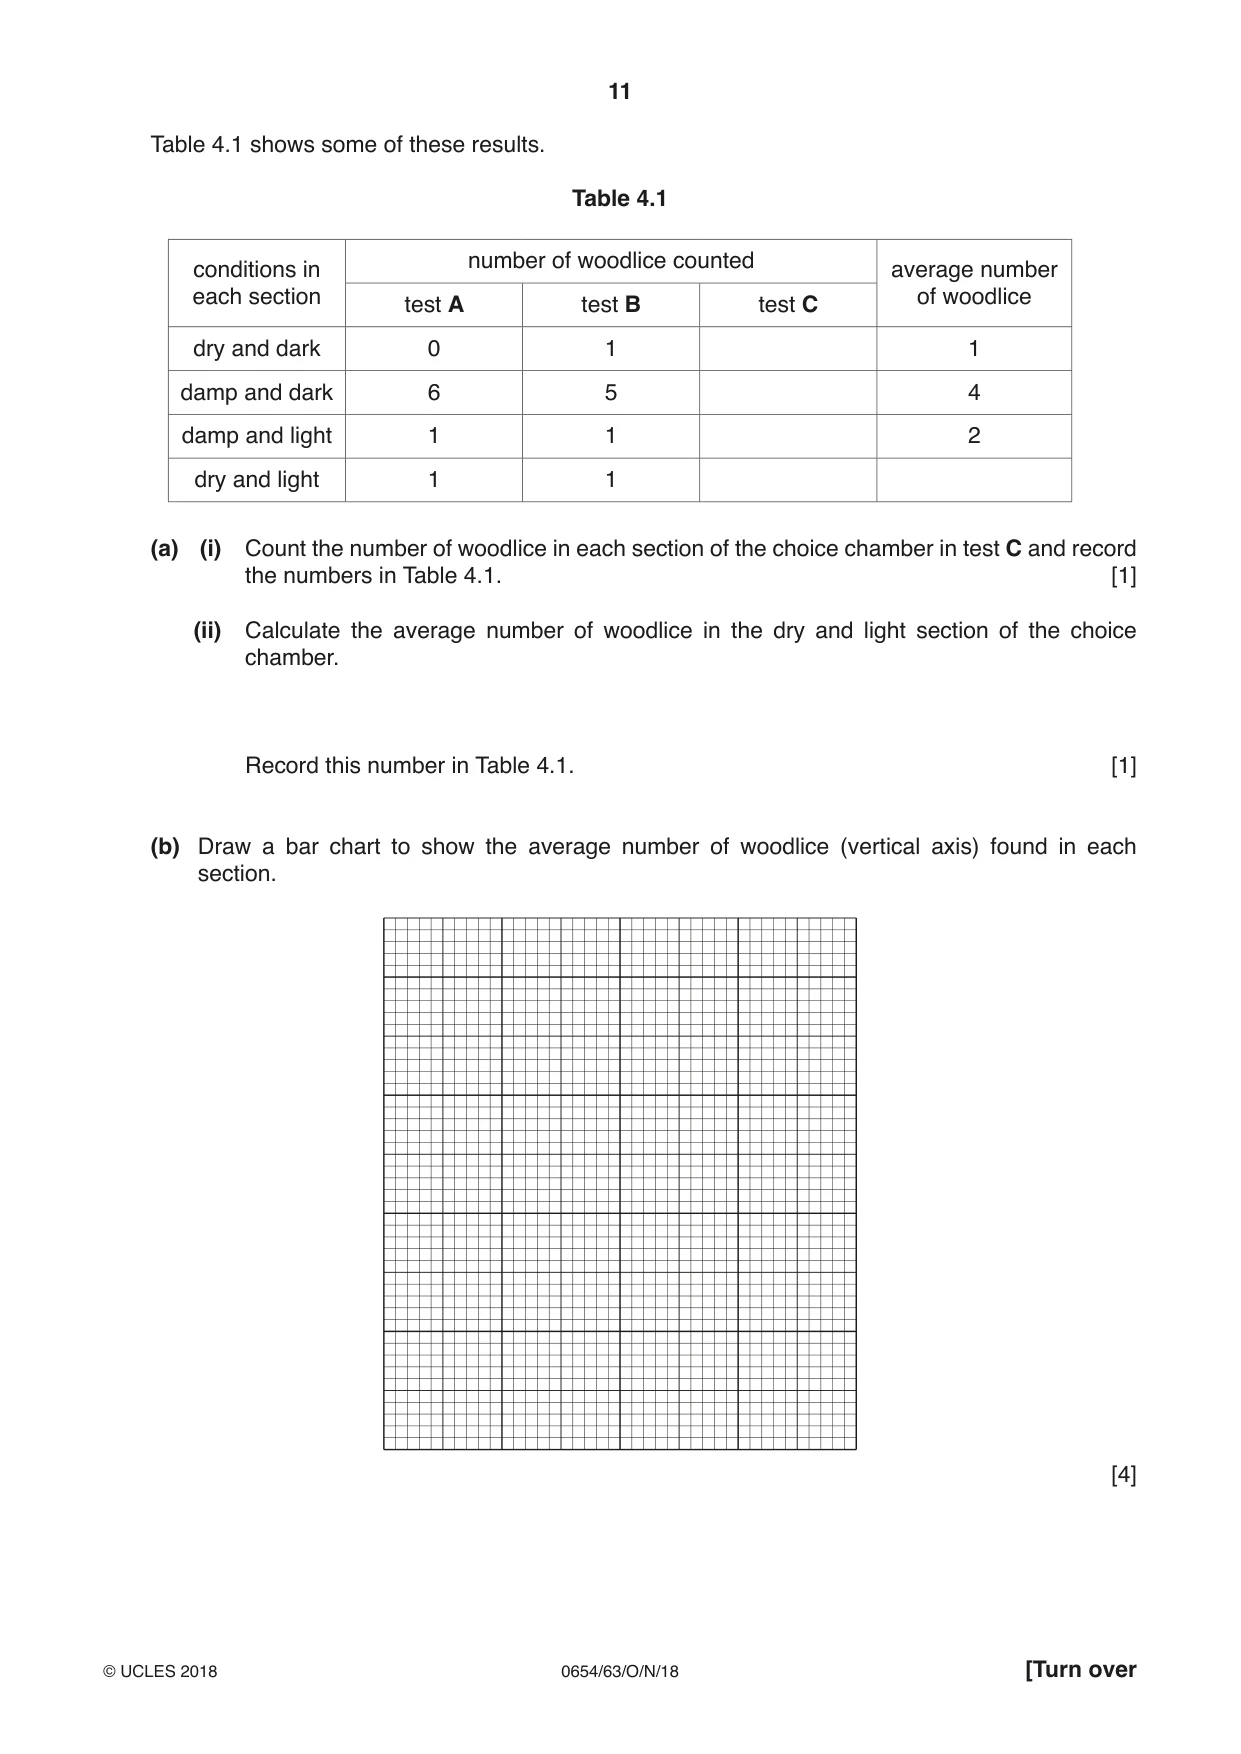
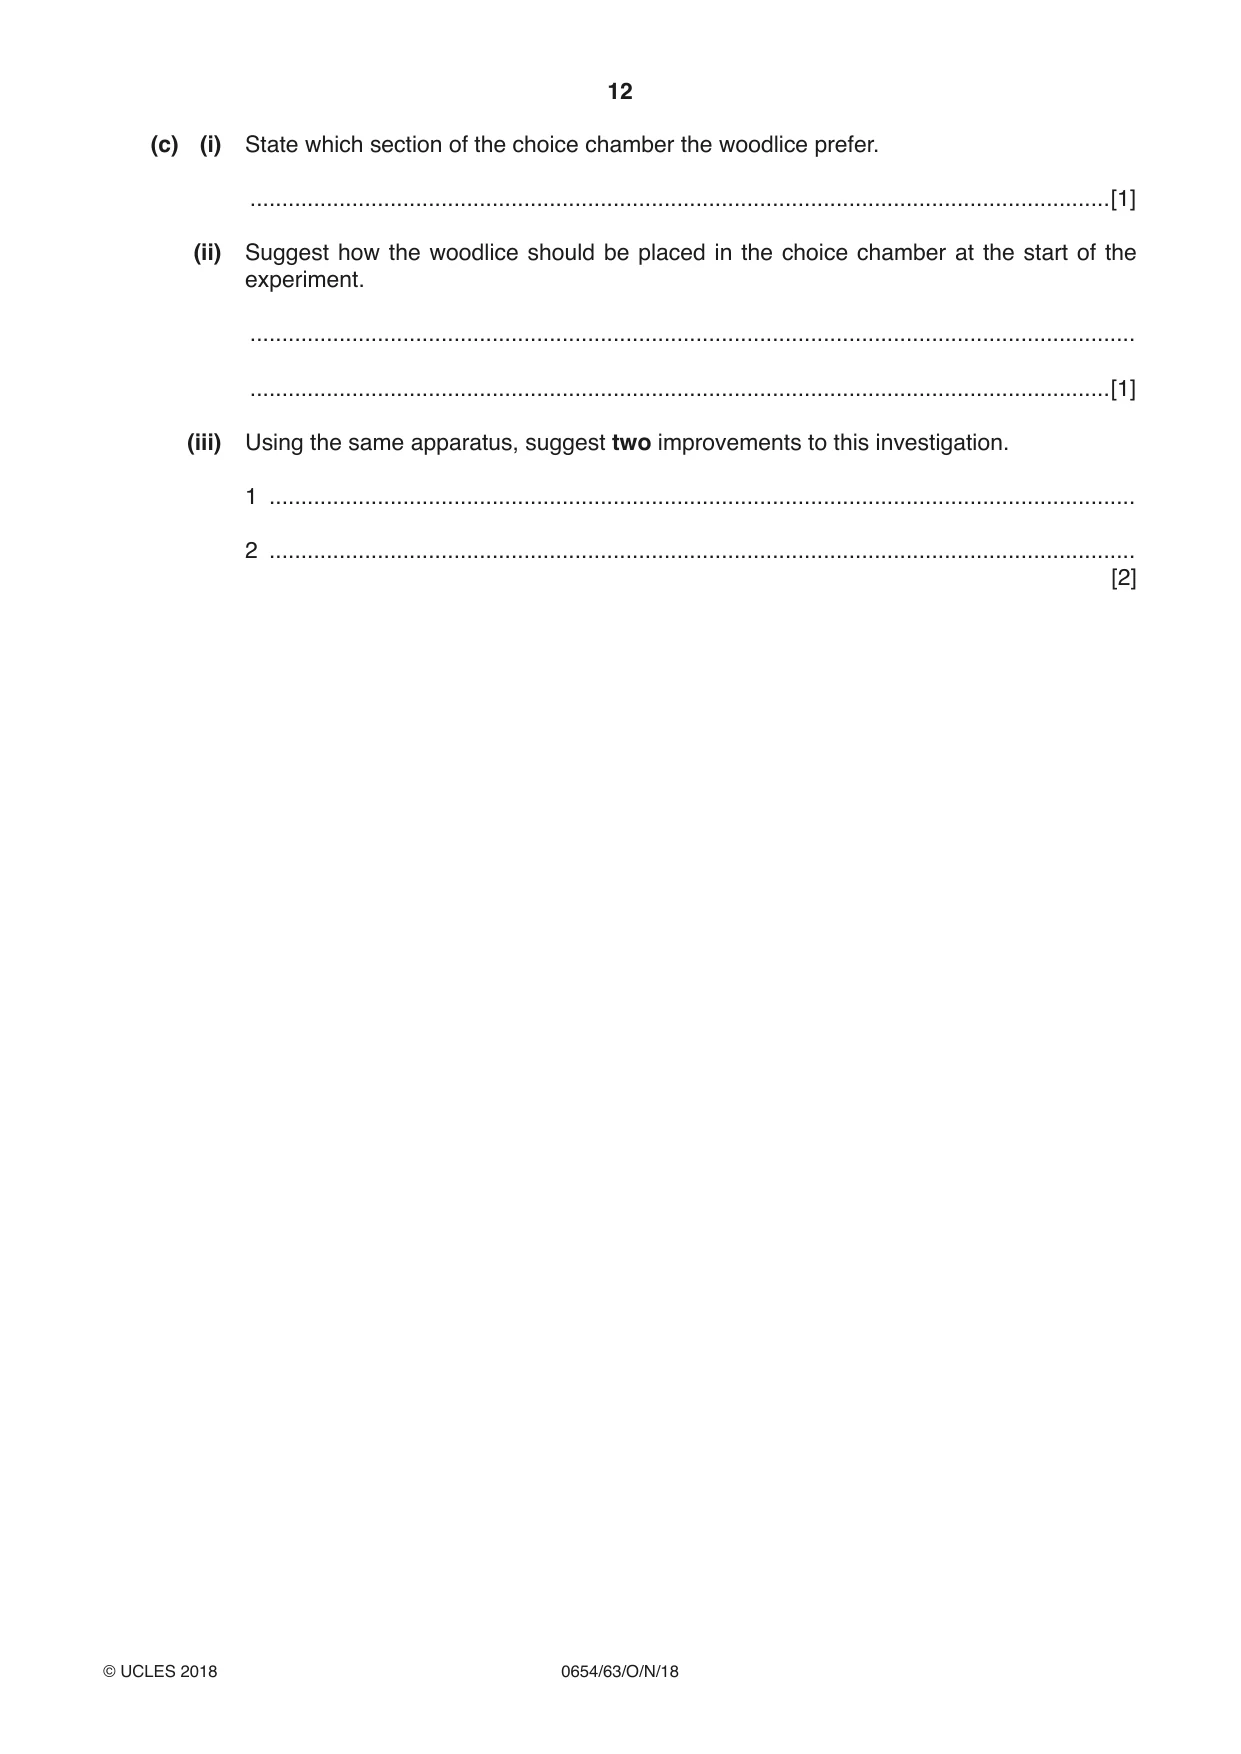
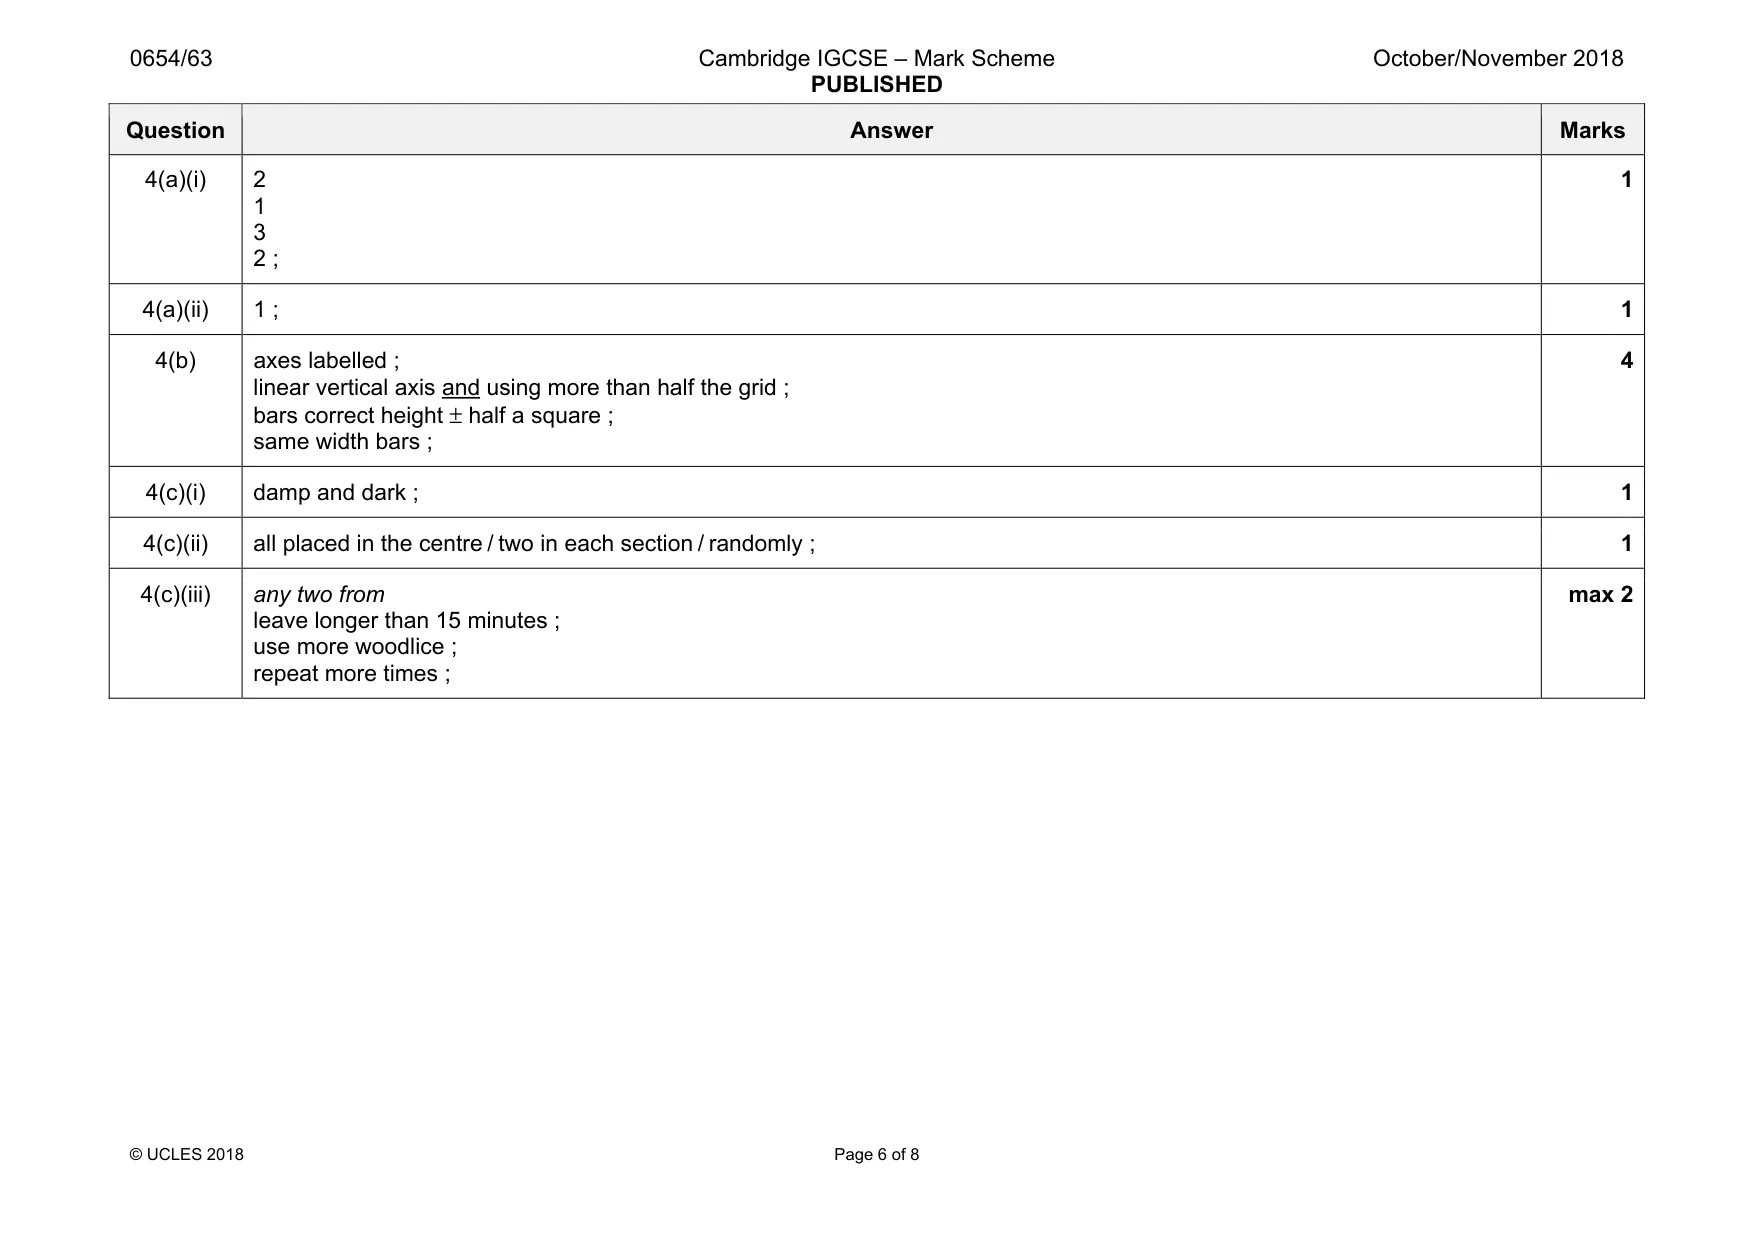
4 A student uses a choice chamber to investigate the responses of woodlice (small invertebrates) to the intensity of light and the amount of water vapour in their surroundings. The choice chamber is divided into four sections, each of which has different conditions, as shown in Fig. 4.1. View from above dry and light dry and dark damp and light damp and dark Fig. 4.1 • The student adds 8 woodlice to the choice chamber. • The woodlice are free to move between any of the four sections. • The student records the positions of the woodlice after 15 minutes. • The test is carried out a total of three times. • The results are shown in Fig. 4.2. test A test B dry and light dry and dark dry and light dry and dark woodlouse damp and light damp and dark damp and light damp and dark test C dry and light dry and dark damp and light damp and dark Fig. 4.2 Table 4.1 shows some of these results. Table 4.1 number of woodlice counted conditions in average number each section of woodlice test A test B test C dry and dark 0 1 1 damp and dark 6 5 4 damp and light 1 1 2 dry and light 1 1 (a) (i) Count the number of woodlice in each section of the choice chamber in test C and record the numbers in Table 4.1. [1] (ii) Calculate the average number of woodlice in the dry and light section of the choice chamber. Record this number in Table 4.1. [1] (b) Draw a bar chart to show the average number of woodlice (vertical axis) found in each section. [4] (c) (i) State which section of the choice chamber the woodlice prefer. .......................................................................................................................................[1] (ii) Suggest how the woodlice should be placed in the choice chamber at the start of the experiment. ........................................................................................................................................... .......................................................................................................................................[1] (iii) Using the same apparatus, suggest two improvements to this investigation. 1 ........................................................................................................................................ 2 ........................................................................................................................................ [2] Please turn over for Question 5.
Mark scheme: 4(a)(i) 2 1 3 2 ; 1 4(a)(ii) 1 ; 1 4(b) axes labelled ; linear vertical axis and using more than half the grid ; bars correct height ± half a square ; same width bars ; 4 4(c)(i) damp and dark ; 1 4(c)(ii) all placed in the centre / two in each section / randomly ; 1 4(c)(iii) any two from leave longer than 15 minutes ; use more woodlice ; repeat more times ; max 2
Q5 · A student investigates the products of combustion of a hydrocarbon
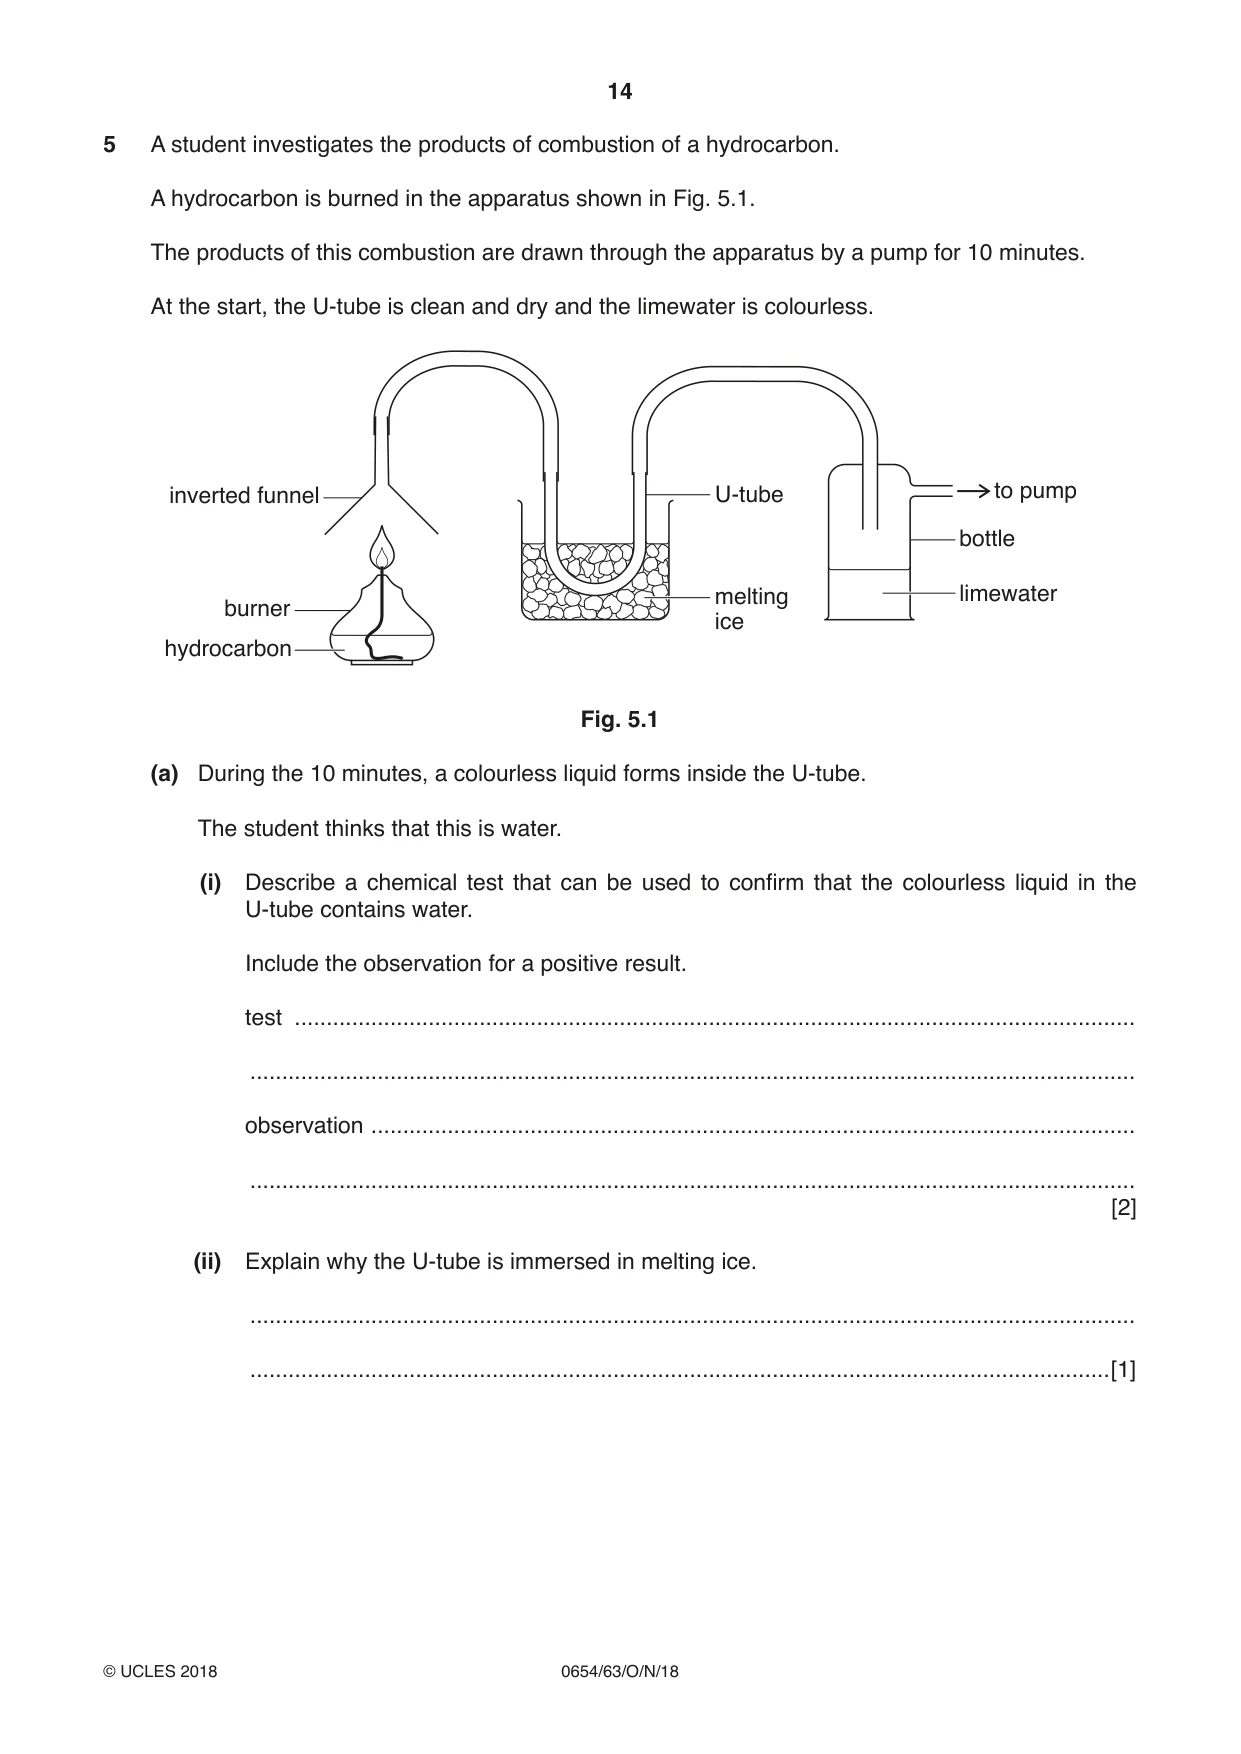
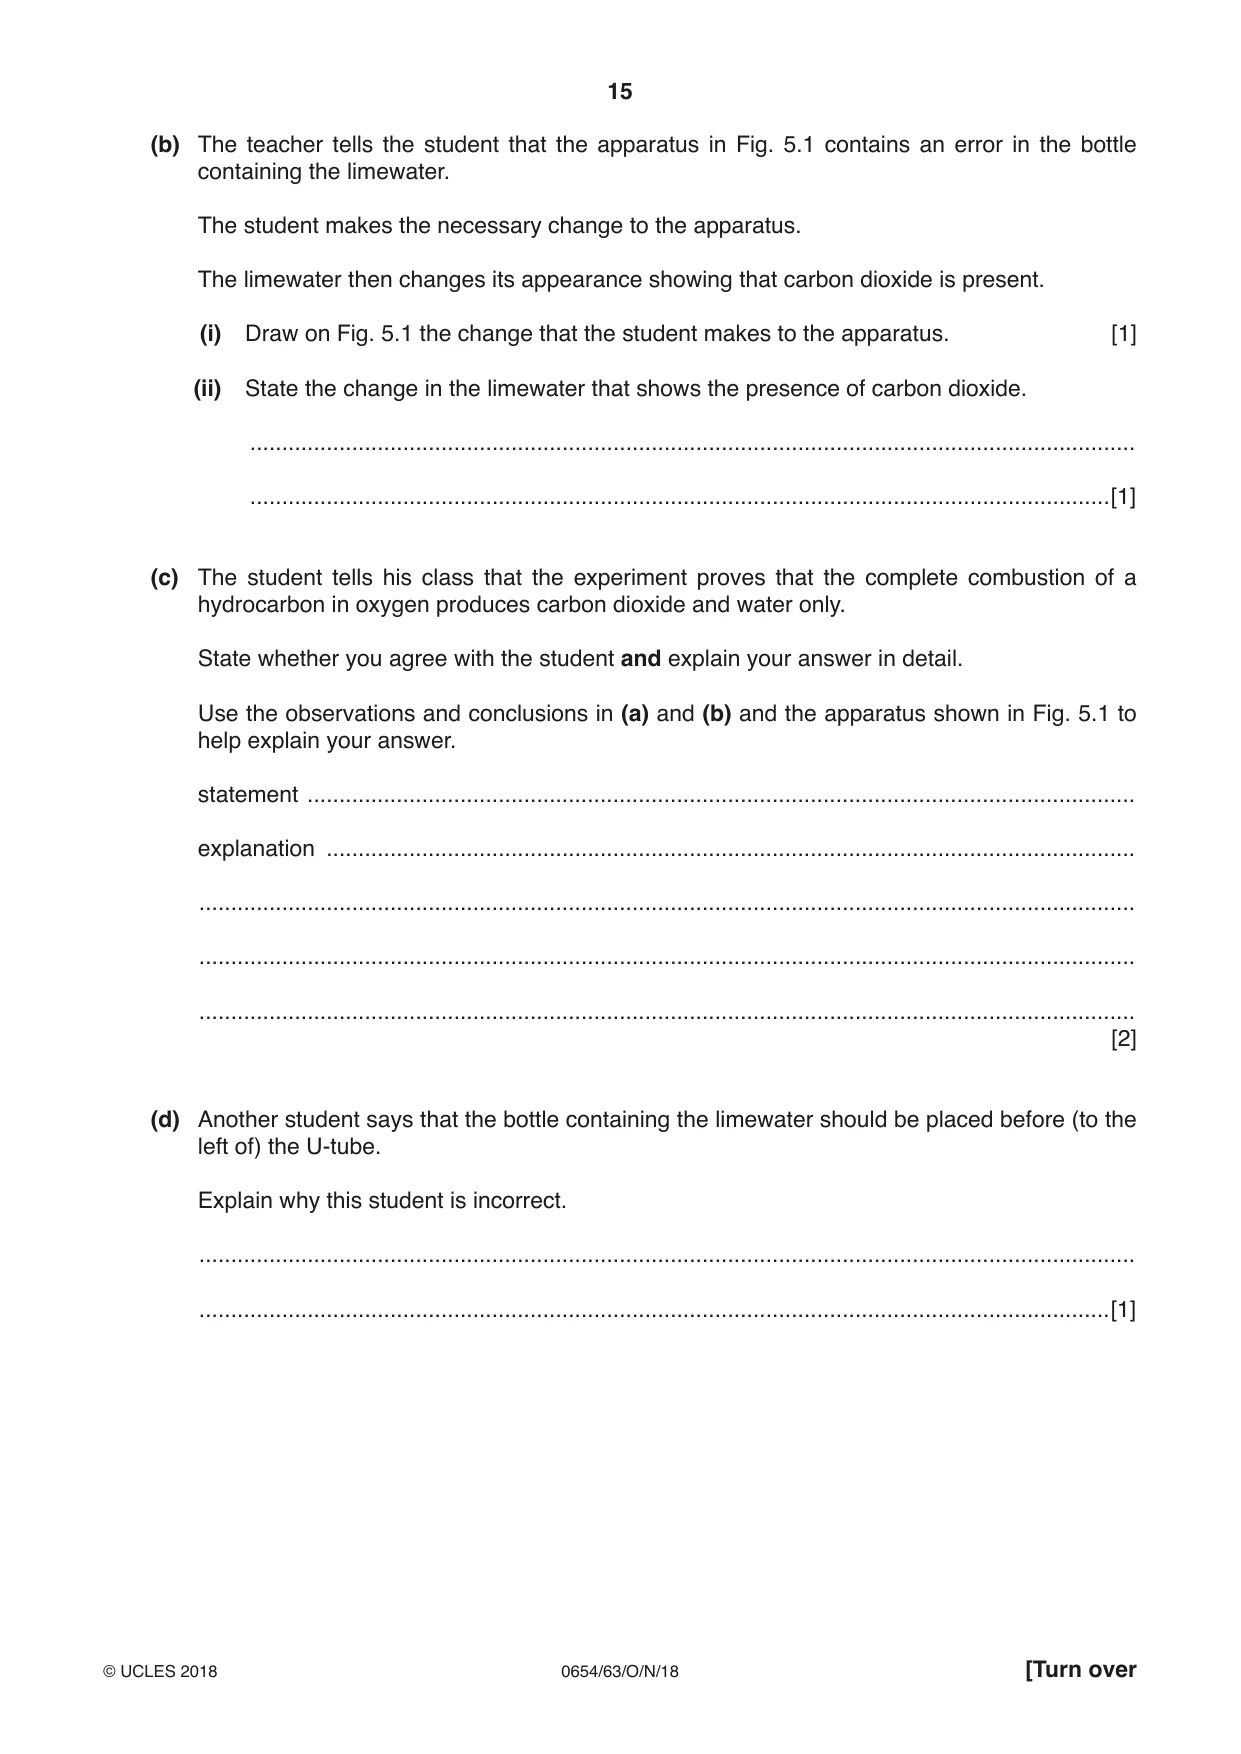
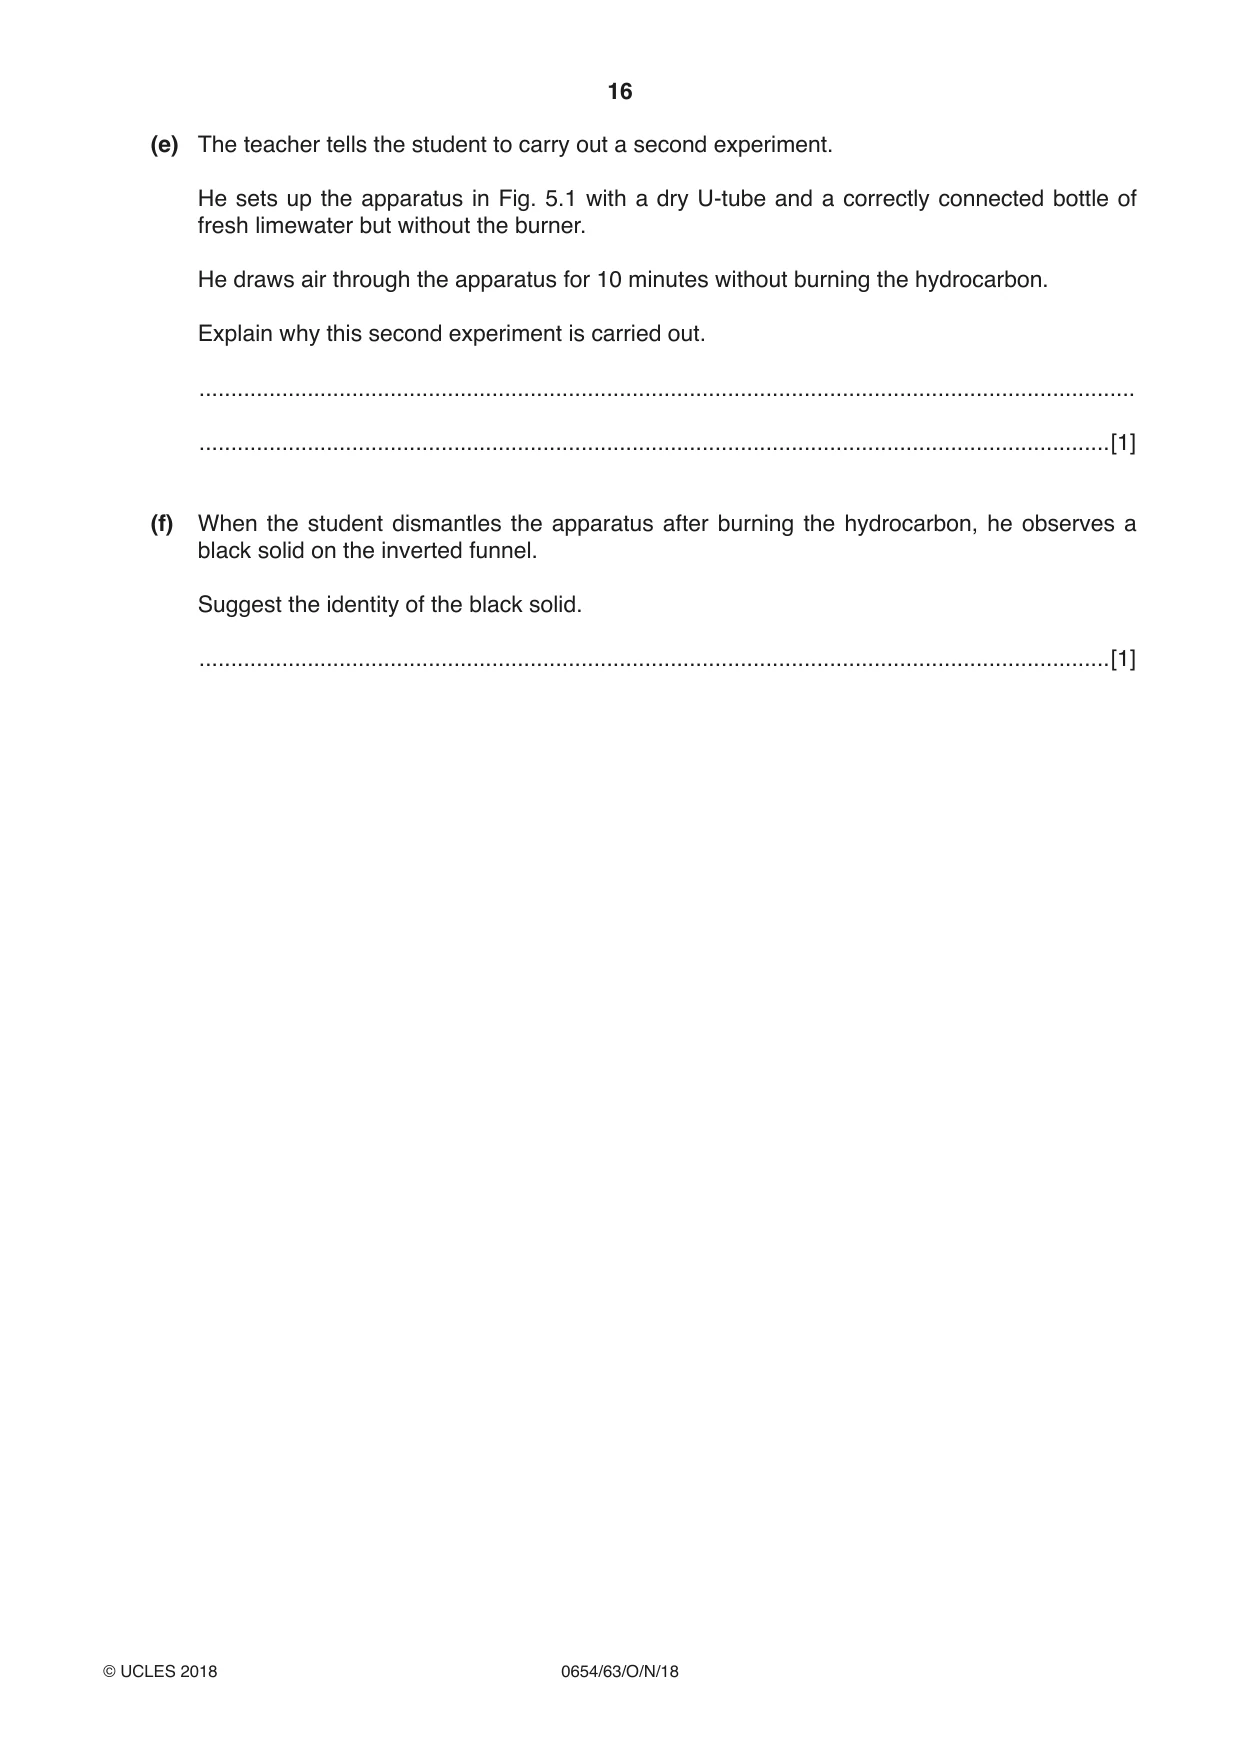
5 A student investigates the products of combustion of a hydrocarbon. A hydrocarbon is burned in the apparatus shown in Fig. 5.1. The products of this combustion are drawn through the apparatus by a pump for 10 minutes. At the start, the U-tube is clean and dry and the limewater is colourless. inverted funnel U-tube to pump bottle melting limewater burner ice hydrocarbon Fig. 5.1 (a) During the 10 minutes, a colourless liquid forms inside the U-tube. The student thinks that this is water. (i) Describe a chemical test that can be used to confirm that the colourless liquid in the U-tube contains water. Include the observation for a positive result. test .................................................................................................................................... ........................................................................................................................................... observation ........................................................................................................................ ........................................................................................................................................... [2] (ii) Explain why the U-tube is immersed in melting ice. ........................................................................................................................................... .......................................................................................................................................[1] (b) The teacher tells the student that the apparatus in Fig. 5.1 contains an error in the bottle containing the limewater. The student makes the necessary change to the apparatus. The limewater then changes its appearance showing that carbon dioxide is present. (i) Draw on Fig. 5.1 the change that the student makes to the apparatus. [1] (ii) State the change in the limewater that shows the presence of carbon dioxide. ........................................................................................................................................... .......................................................................................................................................[1] (c) The student tells his class that the experiment proves that the complete combustion of a hydrocarbon in oxygen produces carbon dioxide and water only. State whether you agree with the student and explain your answer in detail. Use the observations and conclusions in (a) and (b) and the apparatus shown in Fig. 5.1 to help explain your answer. statement .................................................................................................................................. explanation ............................................................................................................................... ................................................................................................................................................... ................................................................................................................................................... ................................................................................................................................................... [2] (d) Another student says that the bottle containing the limewater should be placed before (to the left of) the U-tube. Explain why this student is incorrect. ................................................................................................................................................... ...............................................................................................................................................[1] (e) The teacher tells the student to carry out a second experiment. He sets up the apparatus in Fig. 5.1 with a dry U-tube and a correctly connected bottle of fresh limewater but without the burner. He draws air through the apparatus for 10 minutes without burning the hydrocarbon. Explain why this second experiment is carried out. ................................................................................................................................................... ...............................................................................................................................................[1] (f) When the student dismantles the apparatus after burning the hydrocarbon, he observes a black solid on the inverted funnel. Suggest the identity of the black solid. ...............................................................................................................................................[1]
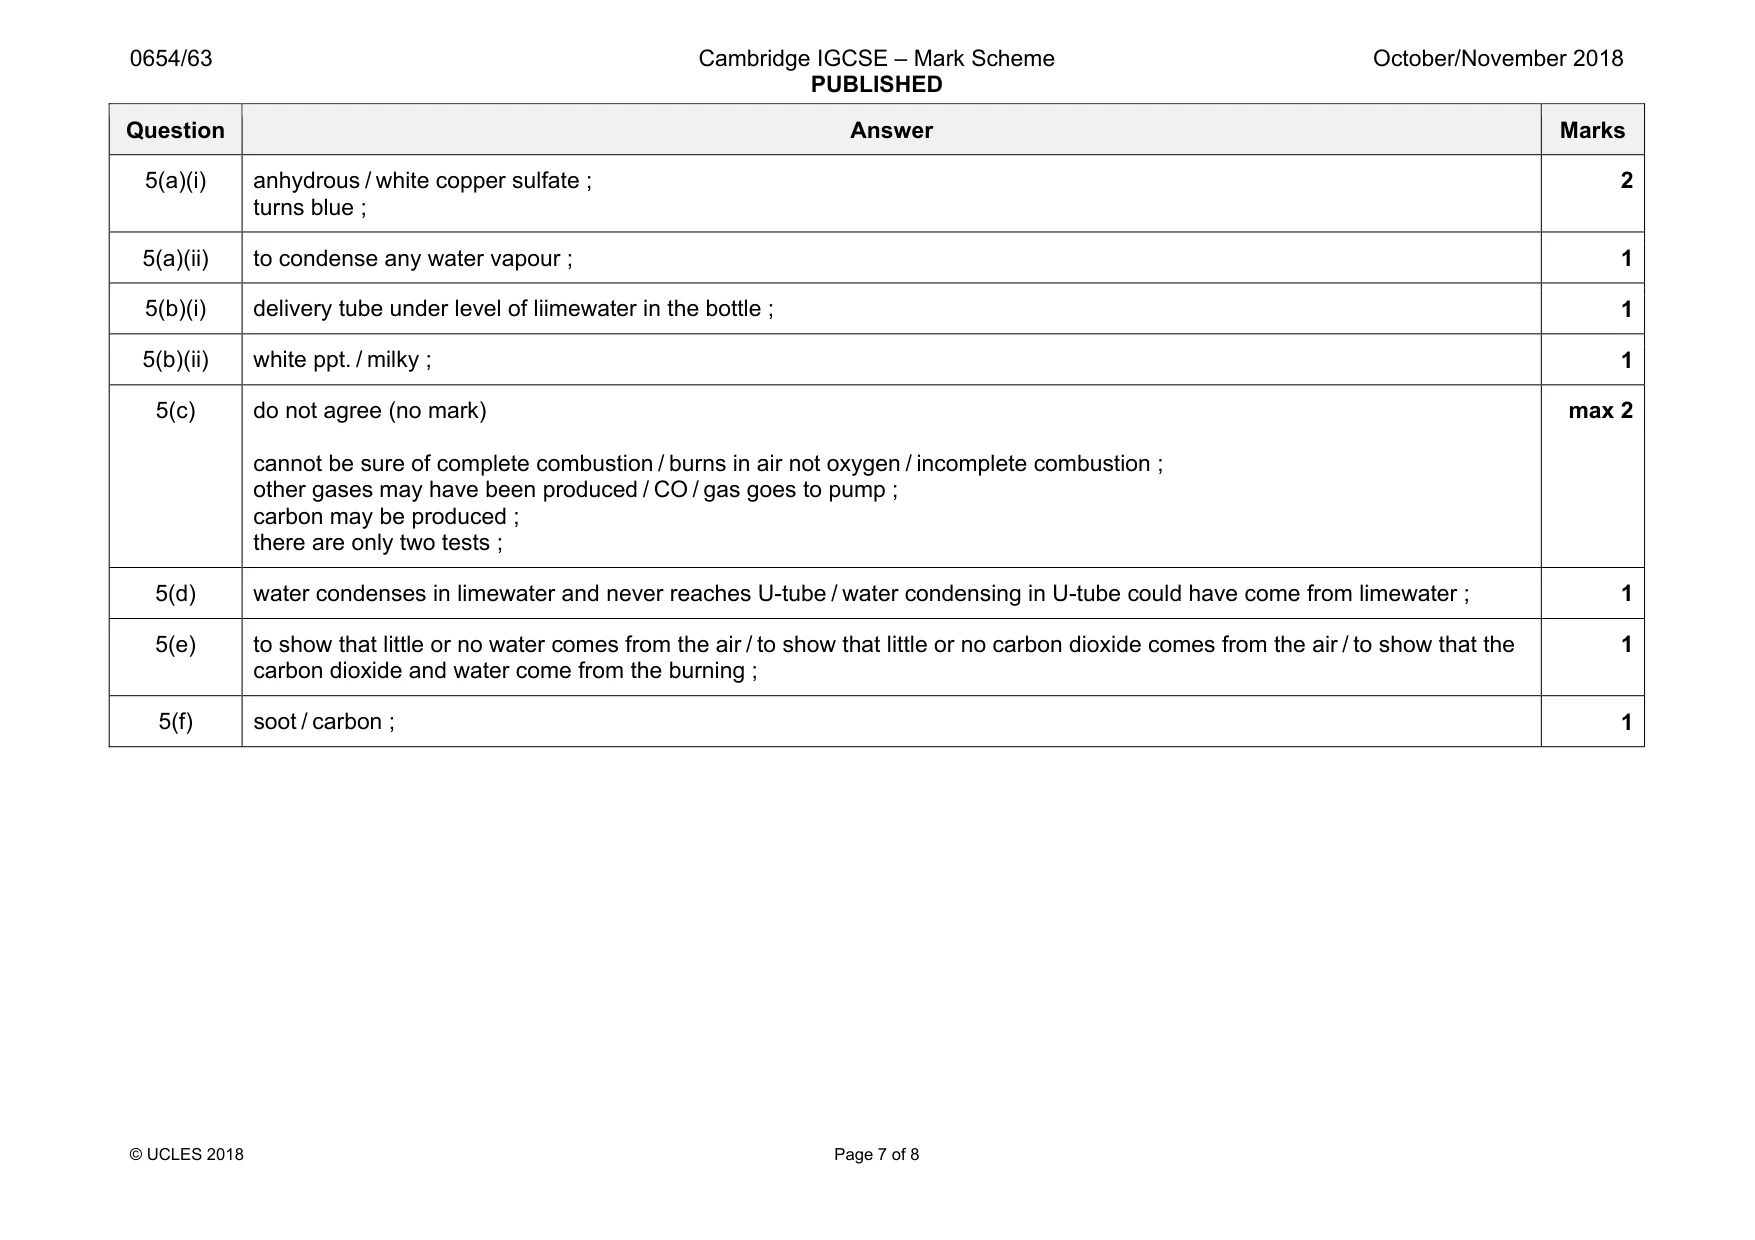
Mark scheme: 5(a)(i) anhydrous / white copper sulfate ; turns blue ; 2 5(a)(ii) to condense any water vapour ; 1 5(b)(i) delivery tube under level of liimewater in the bottle ; 1 5(b)(ii) white ppt. / milky ; 1 5(c) do not agree (no mark) cannot be sure of complete combustion / burns in air not oxygen / incomplete combustion ; other gases may have been produced / CO / gas goes to pump ; carbon may be produced ; there are only two tests ; max 2 5(d) water condenses in limewater and never reaches U-tube / water condensing in U-tube could have come from limewater ; 1 5(e) to show that little or no water comes from the air / to show that little or no carbon dioxide comes from the air / to show that the carbon dioxide and water come from the burning ; 1 5(f) soot / carbon ; 1
Q6 · A student is using refraction of light to determine the concentration of a solution of…
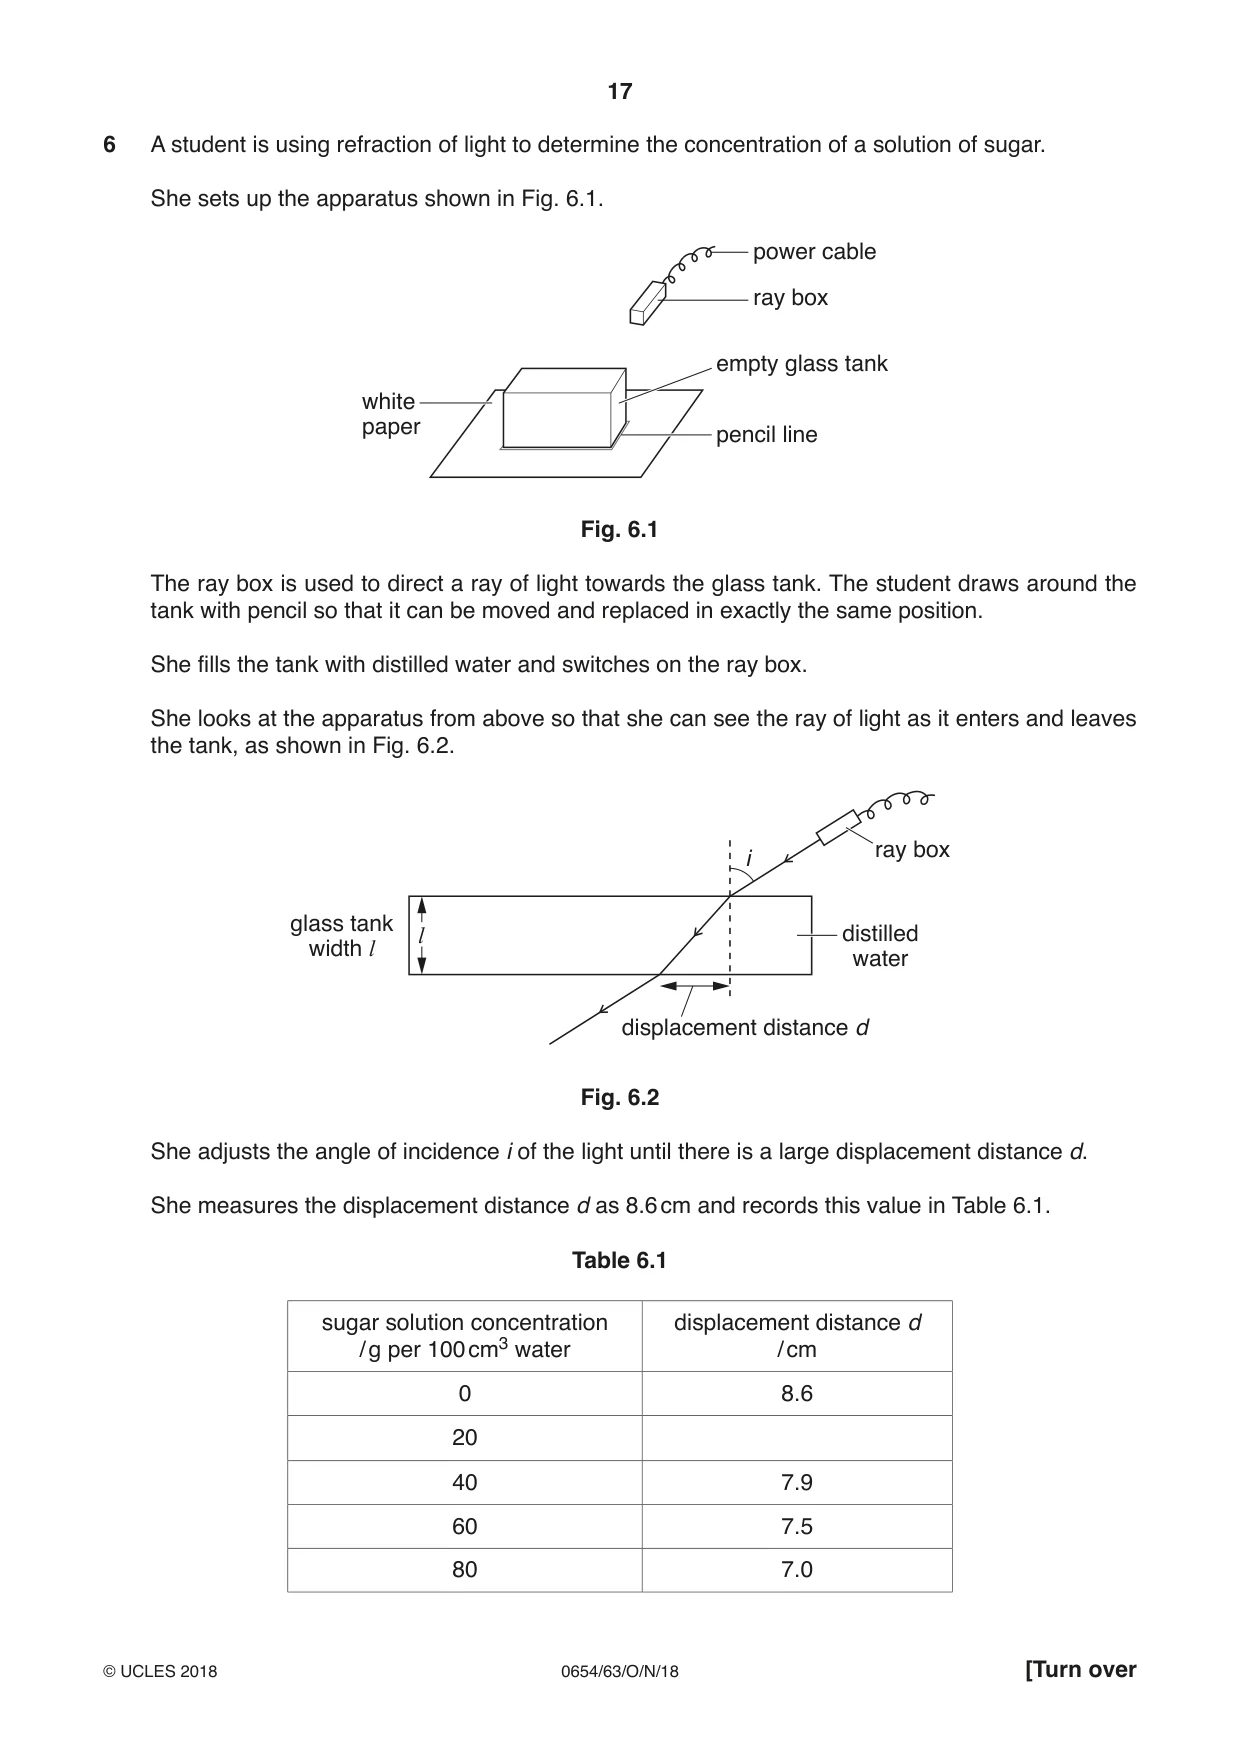
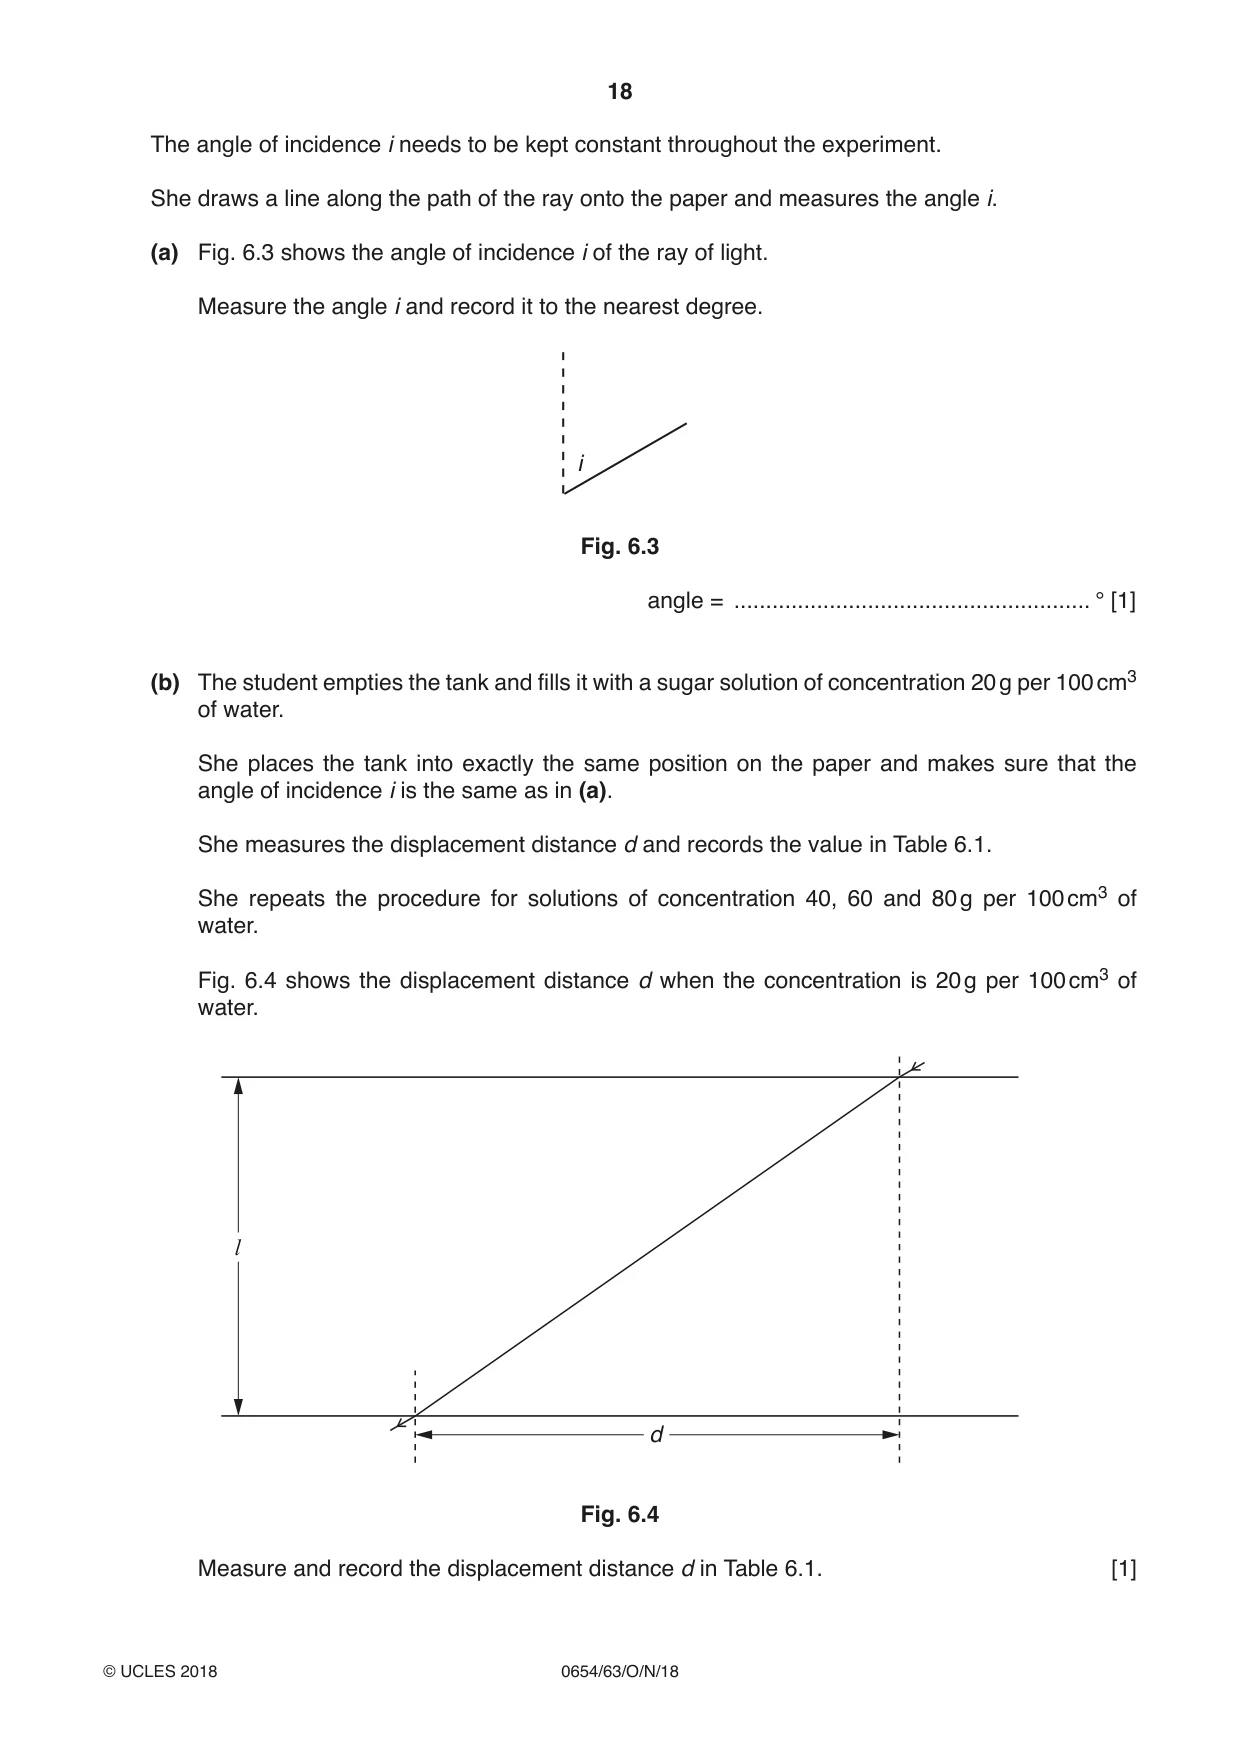
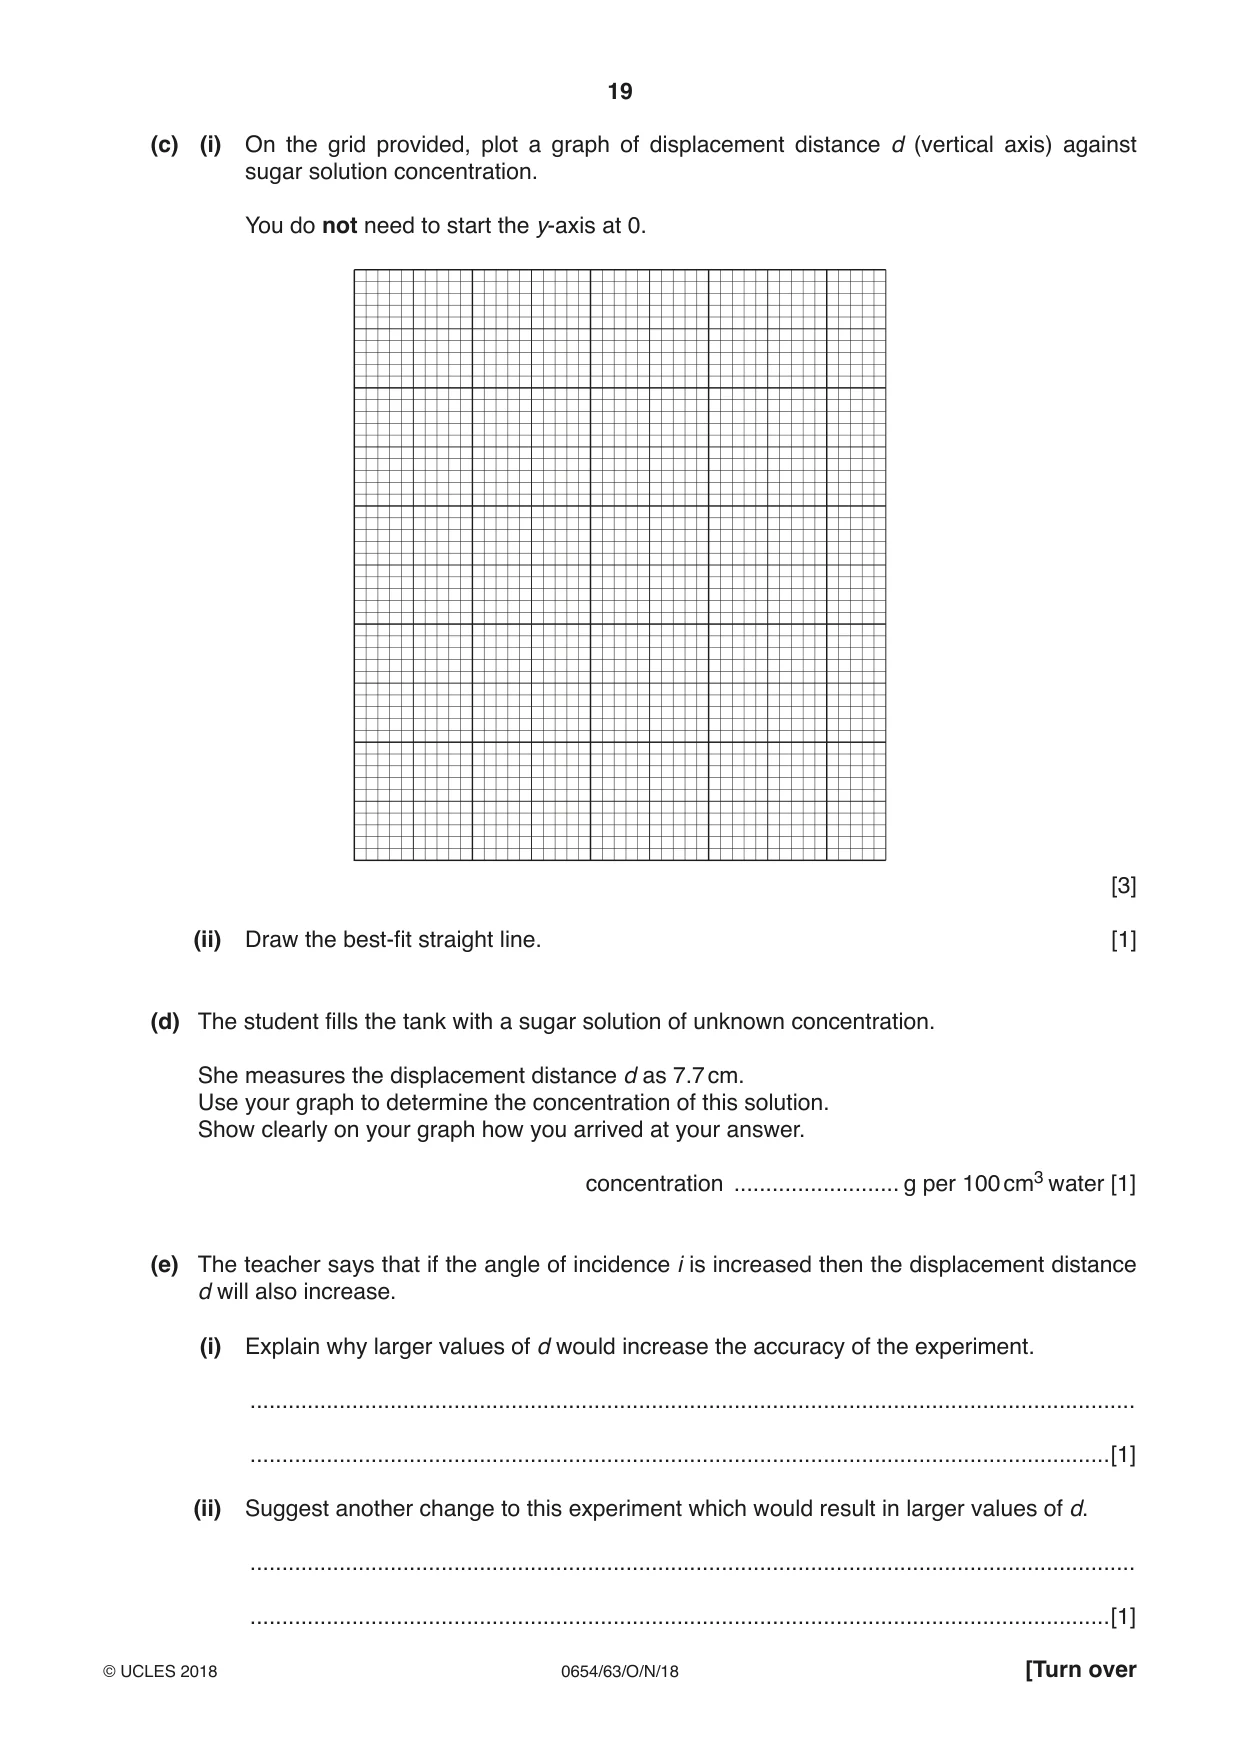
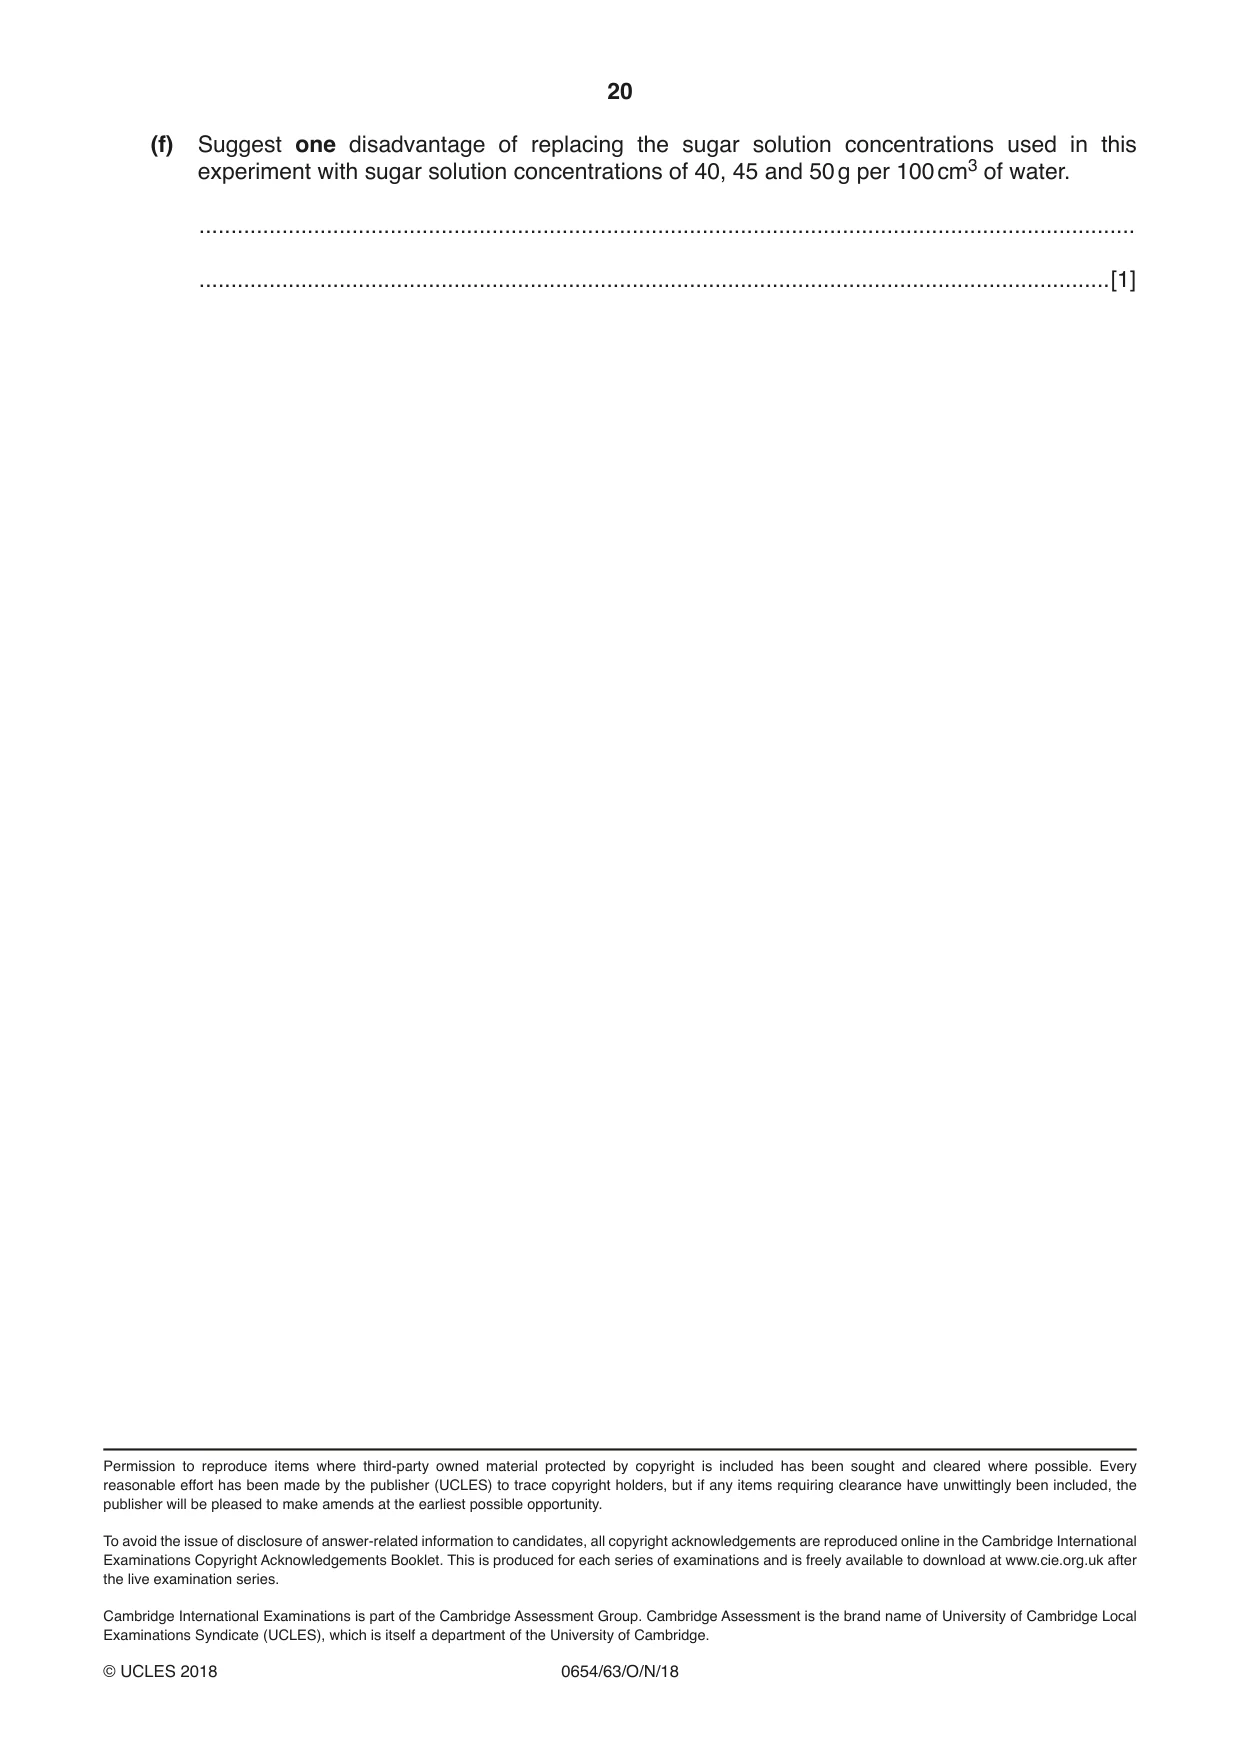
6 A student is using refraction of light to determine the concentration of a solution of sugar. She sets up the apparatus shown in Fig. 6.1. power cable ray box empty glass tank white paper pencil line Fig. 6.1 The ray box is used to direct a ray of light towards the glass tank. The student draws around the tank with pencil so that it can be moved and replaced in exactly the same position. She fills the tank with distilled water and switches on the ray box. She looks at the apparatus from above so that she can see the ray of light as it enters and leaves the tank, as shown in Fig. 6.2. ray box i glass tank l distilled width l water displacement distance d Fig. 6.2 She adjusts the angle of incidence i of the light until there is a large displacement distance d. She measures the displacement distance d as 8.6 cm and records this value in Table 6.1. Table 6.1 sugar solution concentration displacement distance d / g per 100 cm3 water / cm 0 8.6 20 40 7.9 60 7.5 80 7.0 The angle of incidence i needs to be kept constant throughout the experiment. She draws a line along the path of the ray onto the paper and measures the angle i. (a) Fig. 6.3 shows the angle of incidence i of the ray of light. Measure the angle i and record it to the nearest degree. i Fig. 6.3 angle = ........................................................ ° [1] (b) The student empties the tank and fills it with a sugar solution of concentration 20 g per 100 cm3 of water. She places the tank into exactly the same position on the paper and makes sure that the angle of incidence i is the same as in (a). She measures the displacement distance d and records the value in Table 6.1. She repeats the procedure for solutions of concentration 40, 60 and 80 g per 100 cm3 of water. Fig. 6.4 shows the displacement distance d when the concentration is 20 g per 100 cm3 of water. l d Fig. 6.4 Measure and record the displacement distance d in Table 6.1. [1] (c) (i) On the grid provided, plot a graph of displacement distance d (vertical axis) against sugar solution concentration. You do not need to start the y-axis at 0. [3] (ii) Draw the best-fit straight line. [1] (d) The student fills the tank with a sugar solution of unknown concentration. She measures the displacement distance d as 7.7 cm. Use your graph to determine the concentration of this solution. Show clearly on your graph how you arrived at your answer. concentration .......................... g per 100 cm3 water [1] (e) The teacher says that if the angle of incidence i is increased then the displacement distance d will also increase. (i) Explain why larger values of d would increase the accuracy of the experiment. ........................................................................................................................................... .......................................................................................................................................[1] (ii) Suggest another change to this experiment which would result in larger values of d. ........................................................................................................................................... .......................................................................................................................................[1]
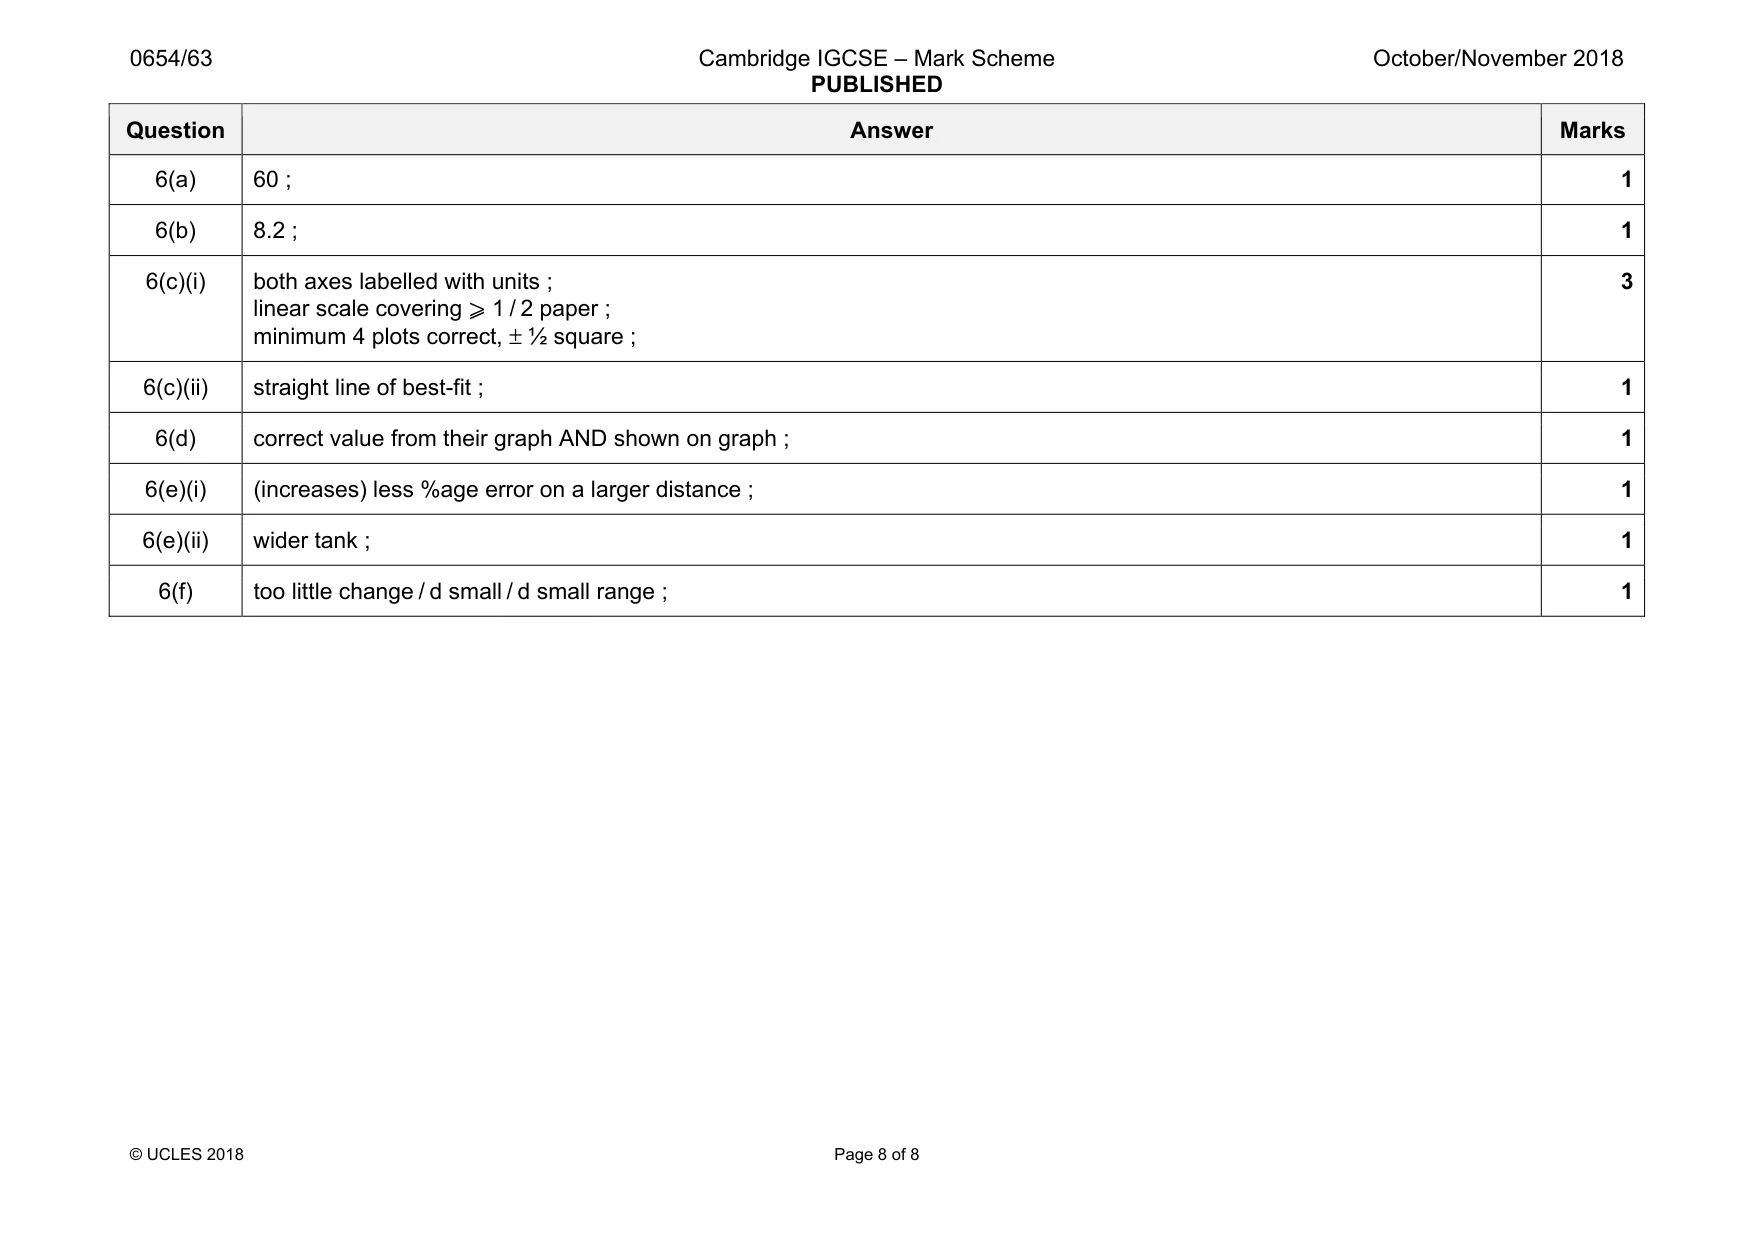
Mark scheme: 6(a) 60 ; 1 6(b) 8.2 ; 1 6(c)(i) both axes labelled with units ; linear scale covering ⩾ 1 / 2 paper ; minimum 4 plots correct, ± ½ square ; 3 6(c)(ii) straight line of best-fit ; 1 6(d) correct value from their graph AND shown on graph ; 1 6(e)(i) (increases) less %age error on a larger distance ; 1 6(e)(ii) wider tank ; 1 6(f) too little change / d small / d small range ; 1
More questions on Physical quantities and measurement techniques
What was in this paper
The subtopics covered by these 6 questions, and how many questions each got. Open one in a new tab to see every Cambridge question on it.
What you needed in this session
Cambridge’s own grade thresholds for 2018 Oct/Nov, Paper 6 · Variant 3. A higher threshold means an easier paper — the bar moves with how the cohort did.