Cambridge IGCSE Sciences - Co-ordinated (Double) 0654 — 2018 Oct/Nov Paper 5 · Variant 3
0654/53/O/N/18 · 3 questions · 45 marks · ≈51 min
The question paper and its mark scheme, free to read here and free to download. This is Cambridge’s own paper, exactly as it was sat.
Question paper12 pages

Mark scheme6 pages
Answers below. Sit the paper first if you are practising.
Questions as text
Q1 · You are going to investigate a flower
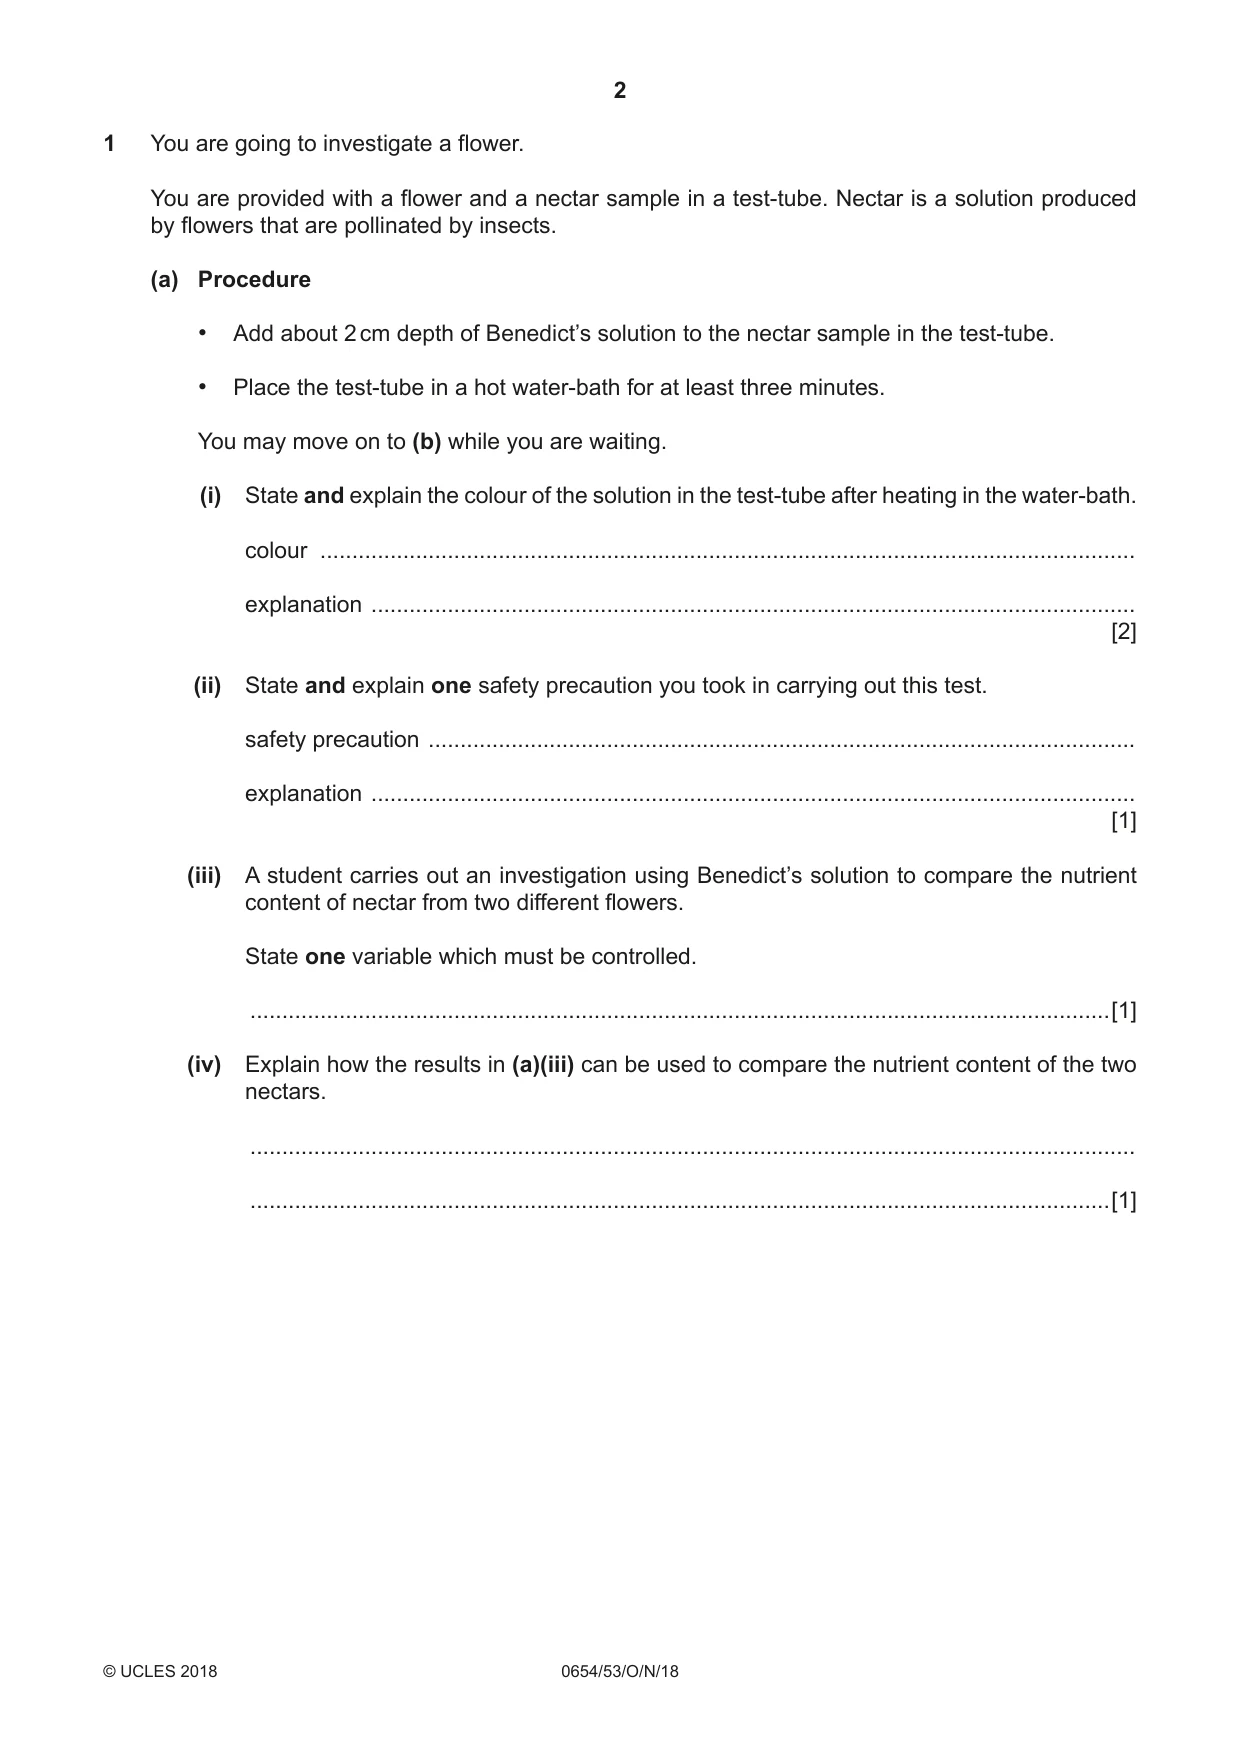
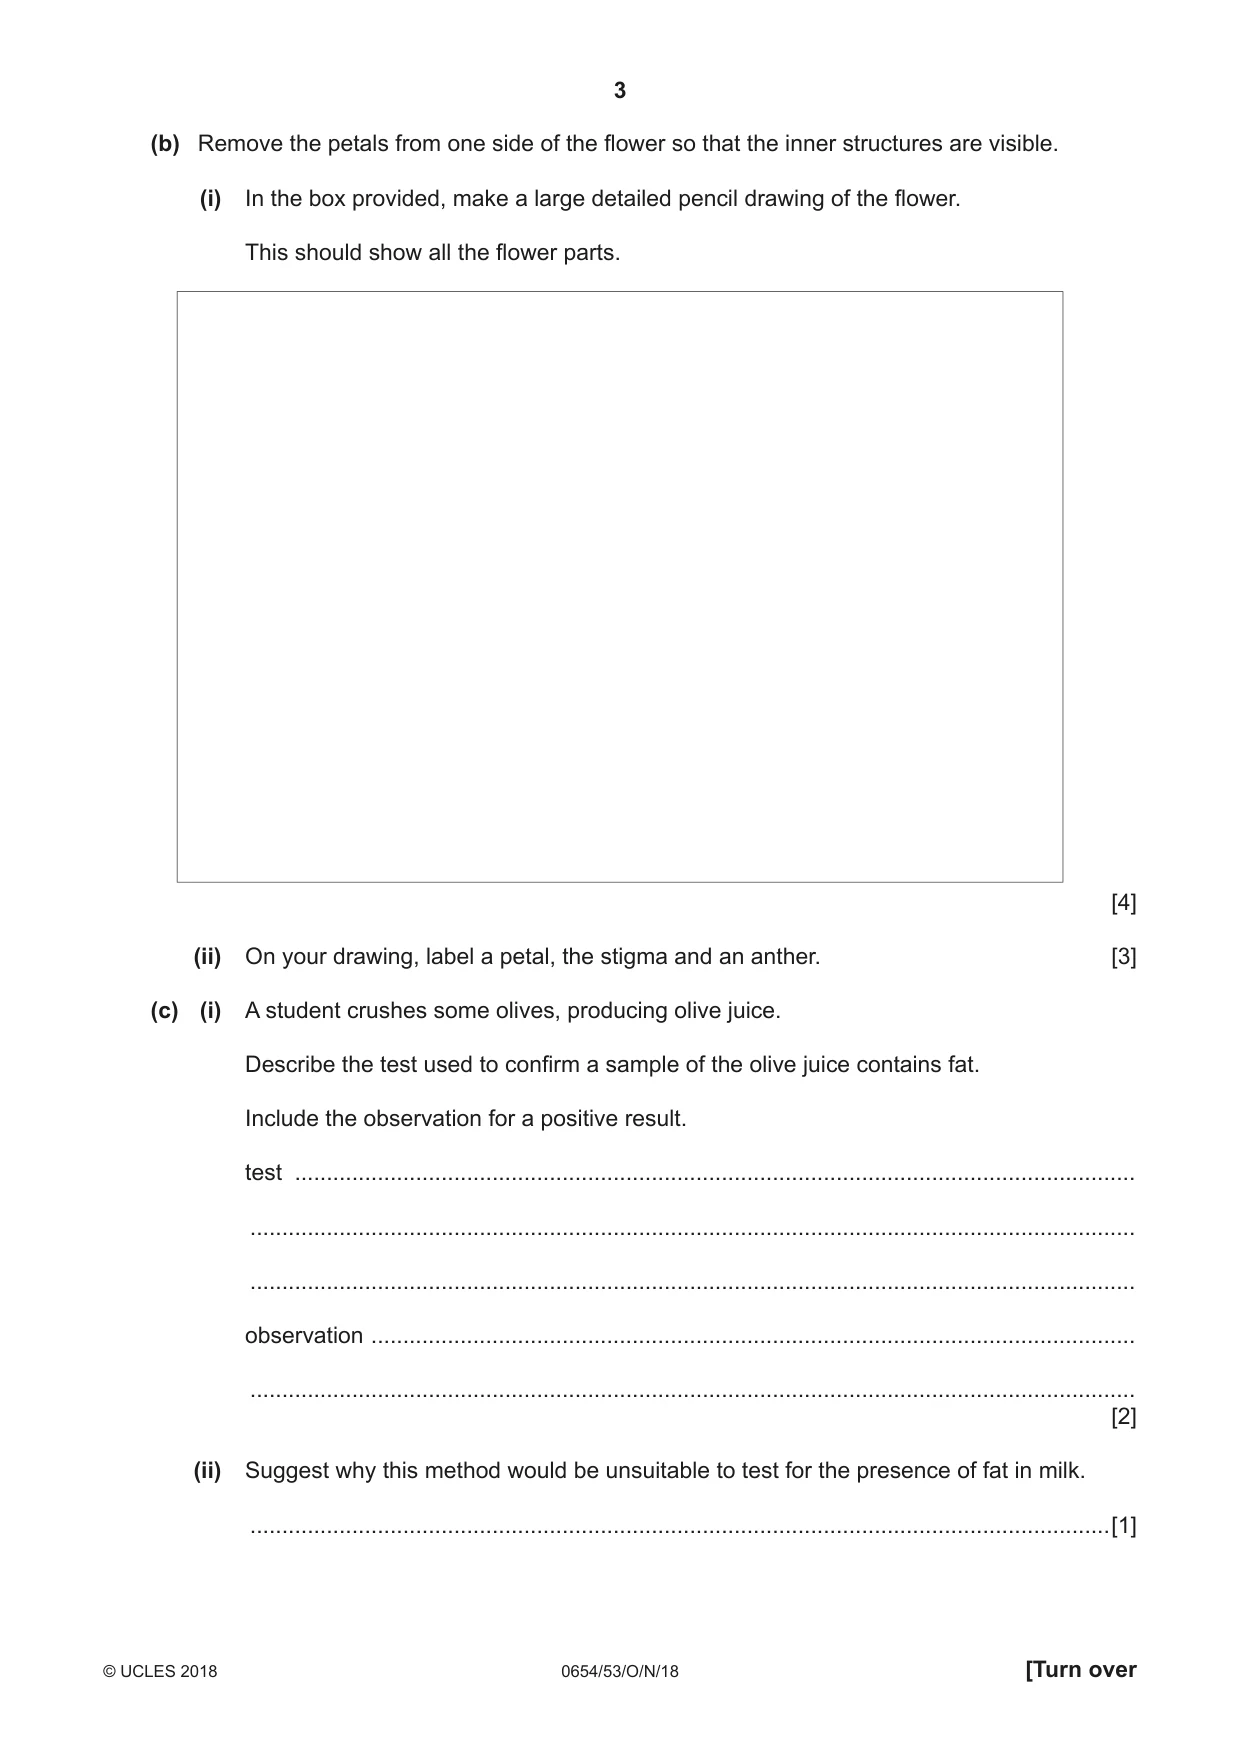
1 You are going to investigate a flower. You are provided with a flower and a nectar sample in a test-tube. Nectar is a solution produced by flowers that are pollinated by insects. (a) Procedure • Add about 2 cm depth of Benedict’s solution to the nectar sample in the test-tube. • Place the test-tube in a hot water-bath for at least three minutes. You may move on to (b) while you are waiting. (i) State and explain the colour of the solution in the test-tube after heating in the water-bath. colour ................................................................................................................................ explanation ........................................................................................................................ [2] (ii) State and explain one safety precaution you took in carrying out this test. safety precaution ............................................................................................................... explanation ........................................................................................................................ [1] (iii) A student carries out an investigation using Benedict’s solution to compare the nutrient content of nectar from two different flowers. State one variable which must be controlled. .......................................................................................................................................[1] (iv) Explain how the results in (a)(iii) can be used to compare the nutrient content of the two nectars. ........................................................................................................................................... .......................................................................................................................................[1] (b) Remove the petals from one side of the flower so that the inner structures are visible. (i) In the box provided, make a large detailed pencil drawing of the flower. This should show all the flower parts. [4] (ii) On your drawing, label a petal, the stigma and an anther. [3] (c) (i) A student crushes some olives, producing olive juice. Describe the test used to confirm a sample of the olive juice contains fat. Include the observation for a positive result. test .................................................................................................................................... ........................................................................................................................................... ........................................................................................................................................... observation ........................................................................................................................ ........................................................................................................................................... [2] (ii) Suggest why this method would be unsuitable to test for the presence of fat in milk. .......................................................................................................................................[1]
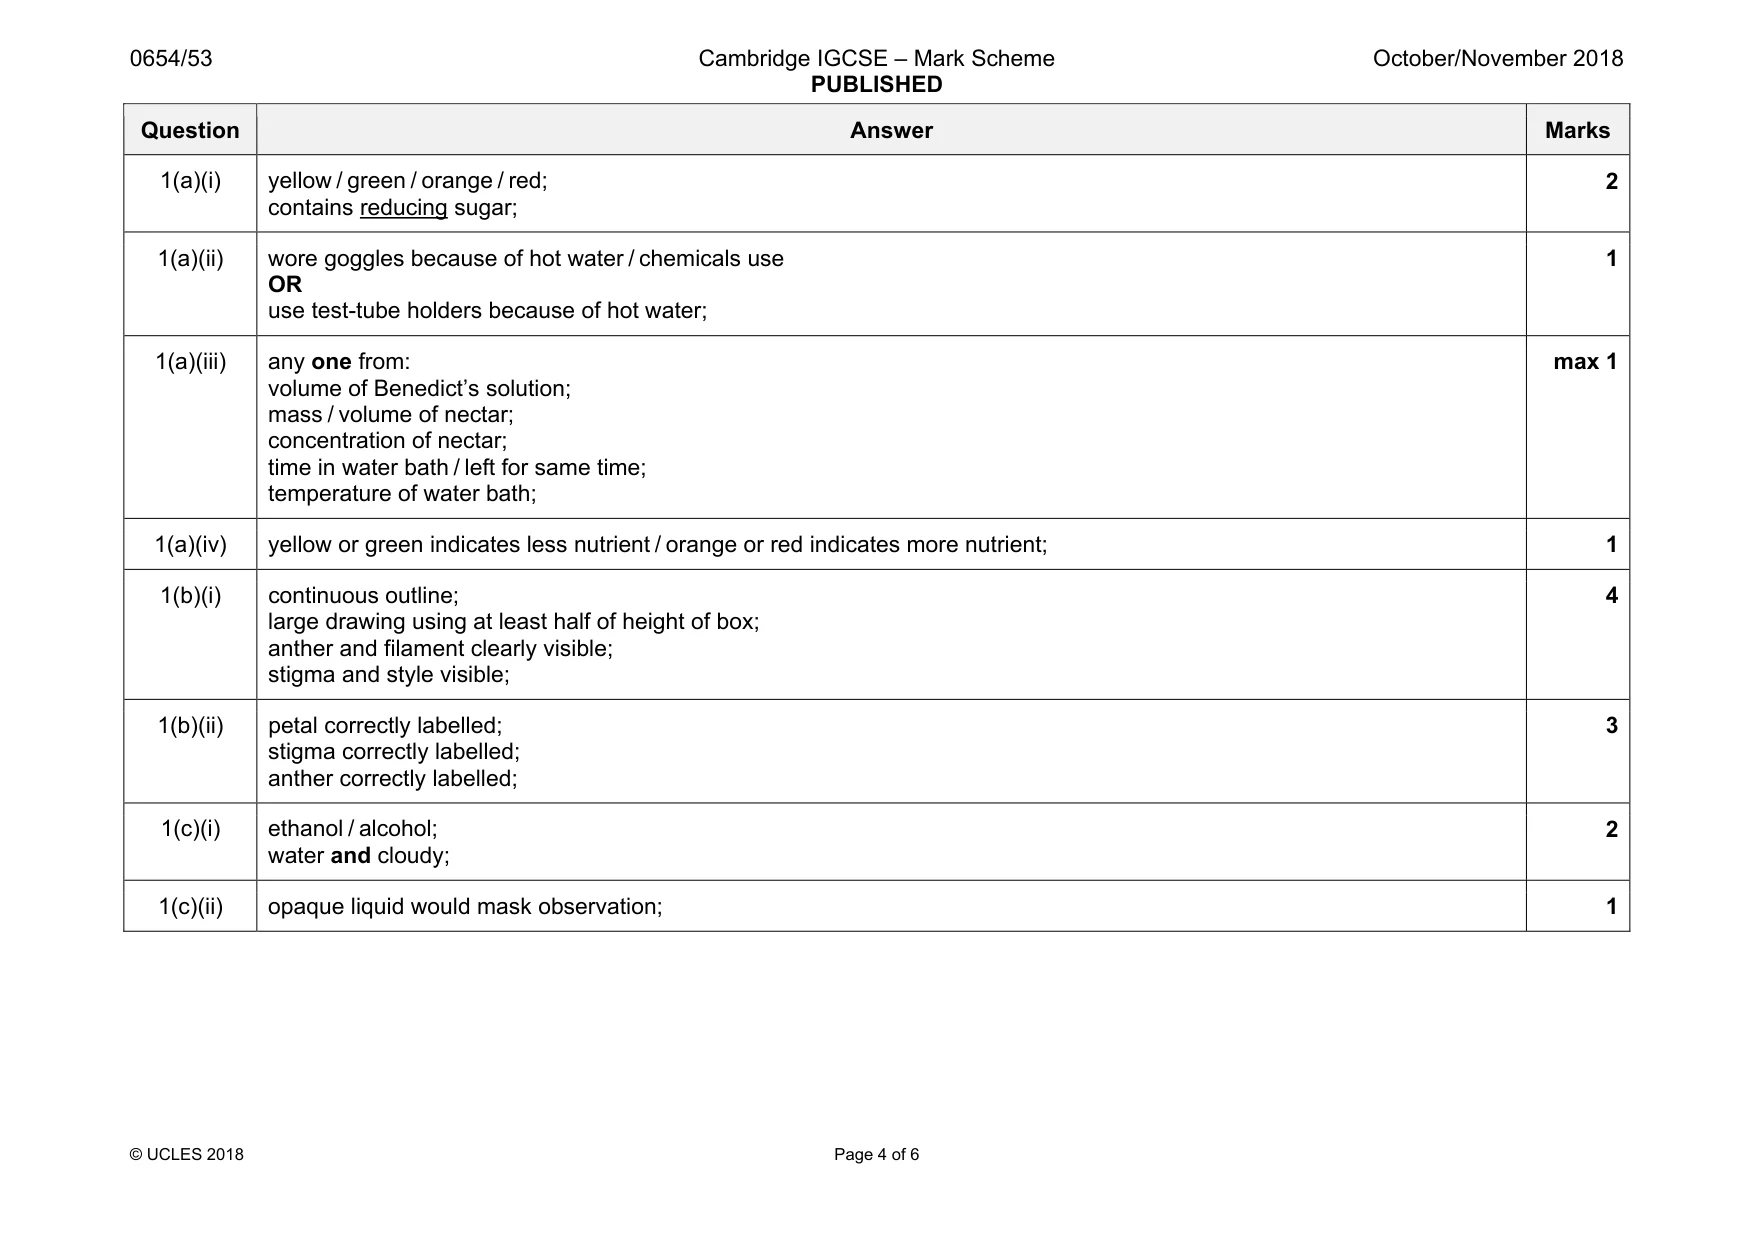
Mark scheme: 1(a)(i) yellow / green / orange / red; contains reducing sugar; 2 1(a)(ii) wore goggles because of hot water / chemicals use OR use test-tube holders because of hot water; 1 1(a)(iii) any one from: volume of Benedict’s solution; mass / volume of nectar; concentration of nectar; time in water bath / left for same time; temperature of water bath; max 1 1(a)(iv) yellow or green indicates less nutrient / orange or red indicates more nutrient; 1 1(b)(i) continuous outline; large drawing using at least half of height of box; anther and filament clearly visible; stigma and style visible; 4 1(b)(ii) petal correctly labelled; stigma correctly labelled; anther correctly labelled; 3 1(c)(i) ethanol / alcohol; water and cloudy; 2 1(c)(ii) opaque liquid would mask observation; 1
Q2 · Notes for use in Qualitative Analysis for this question are printed on page 12
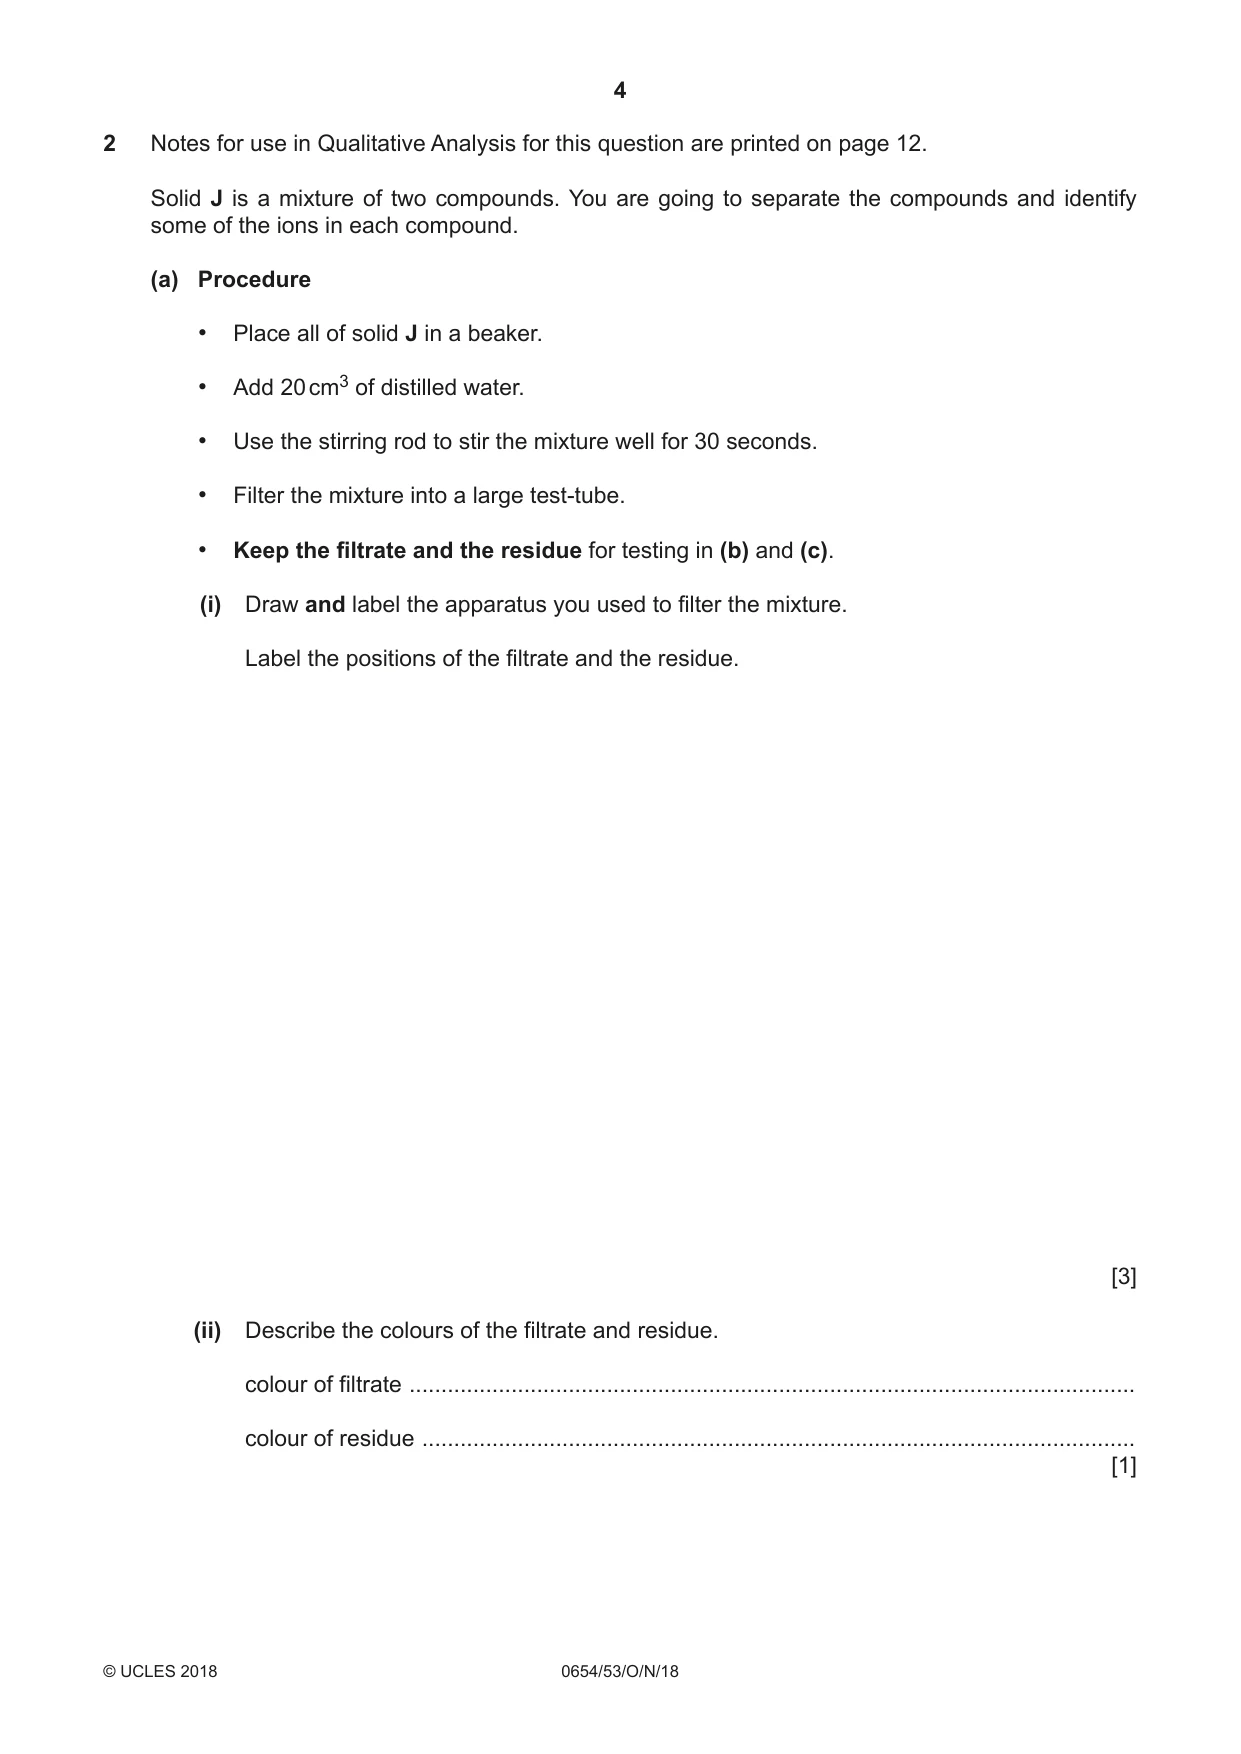
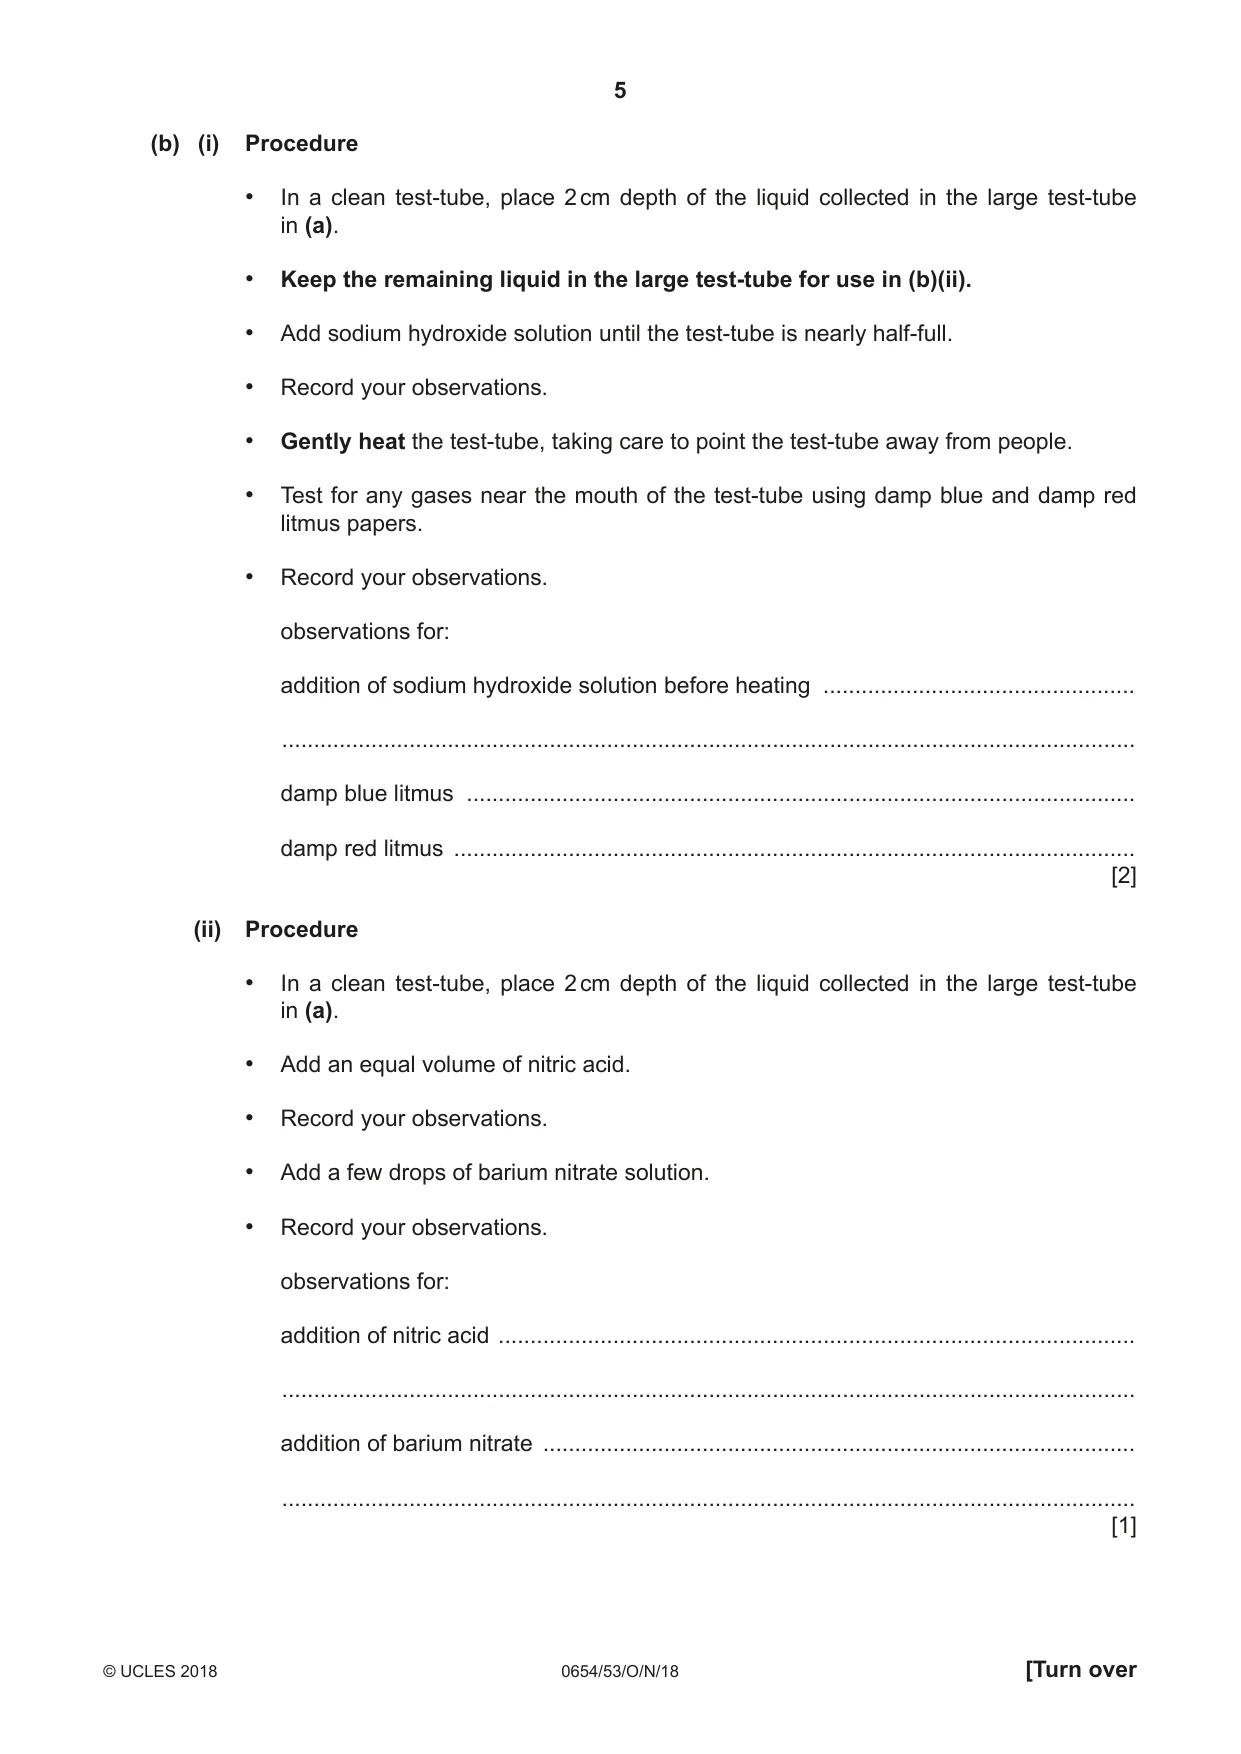
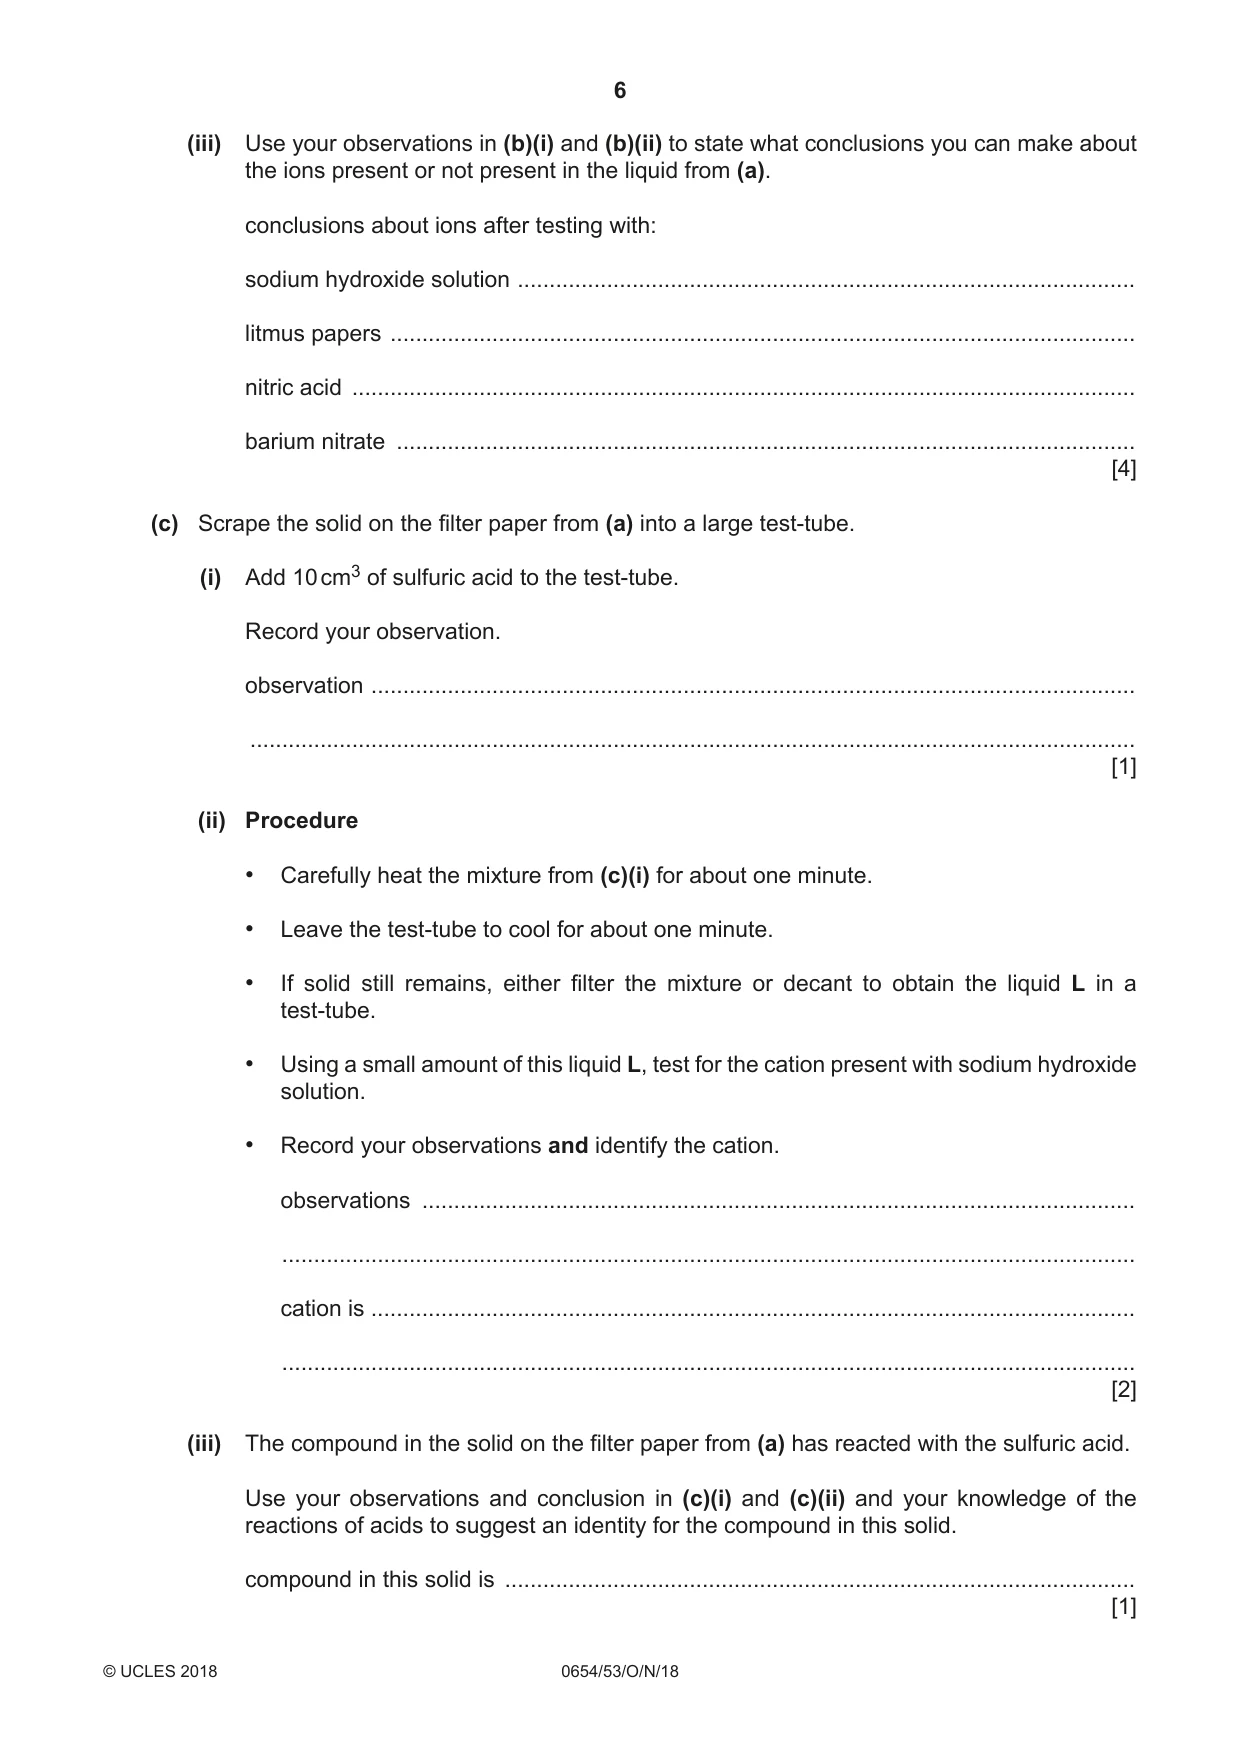
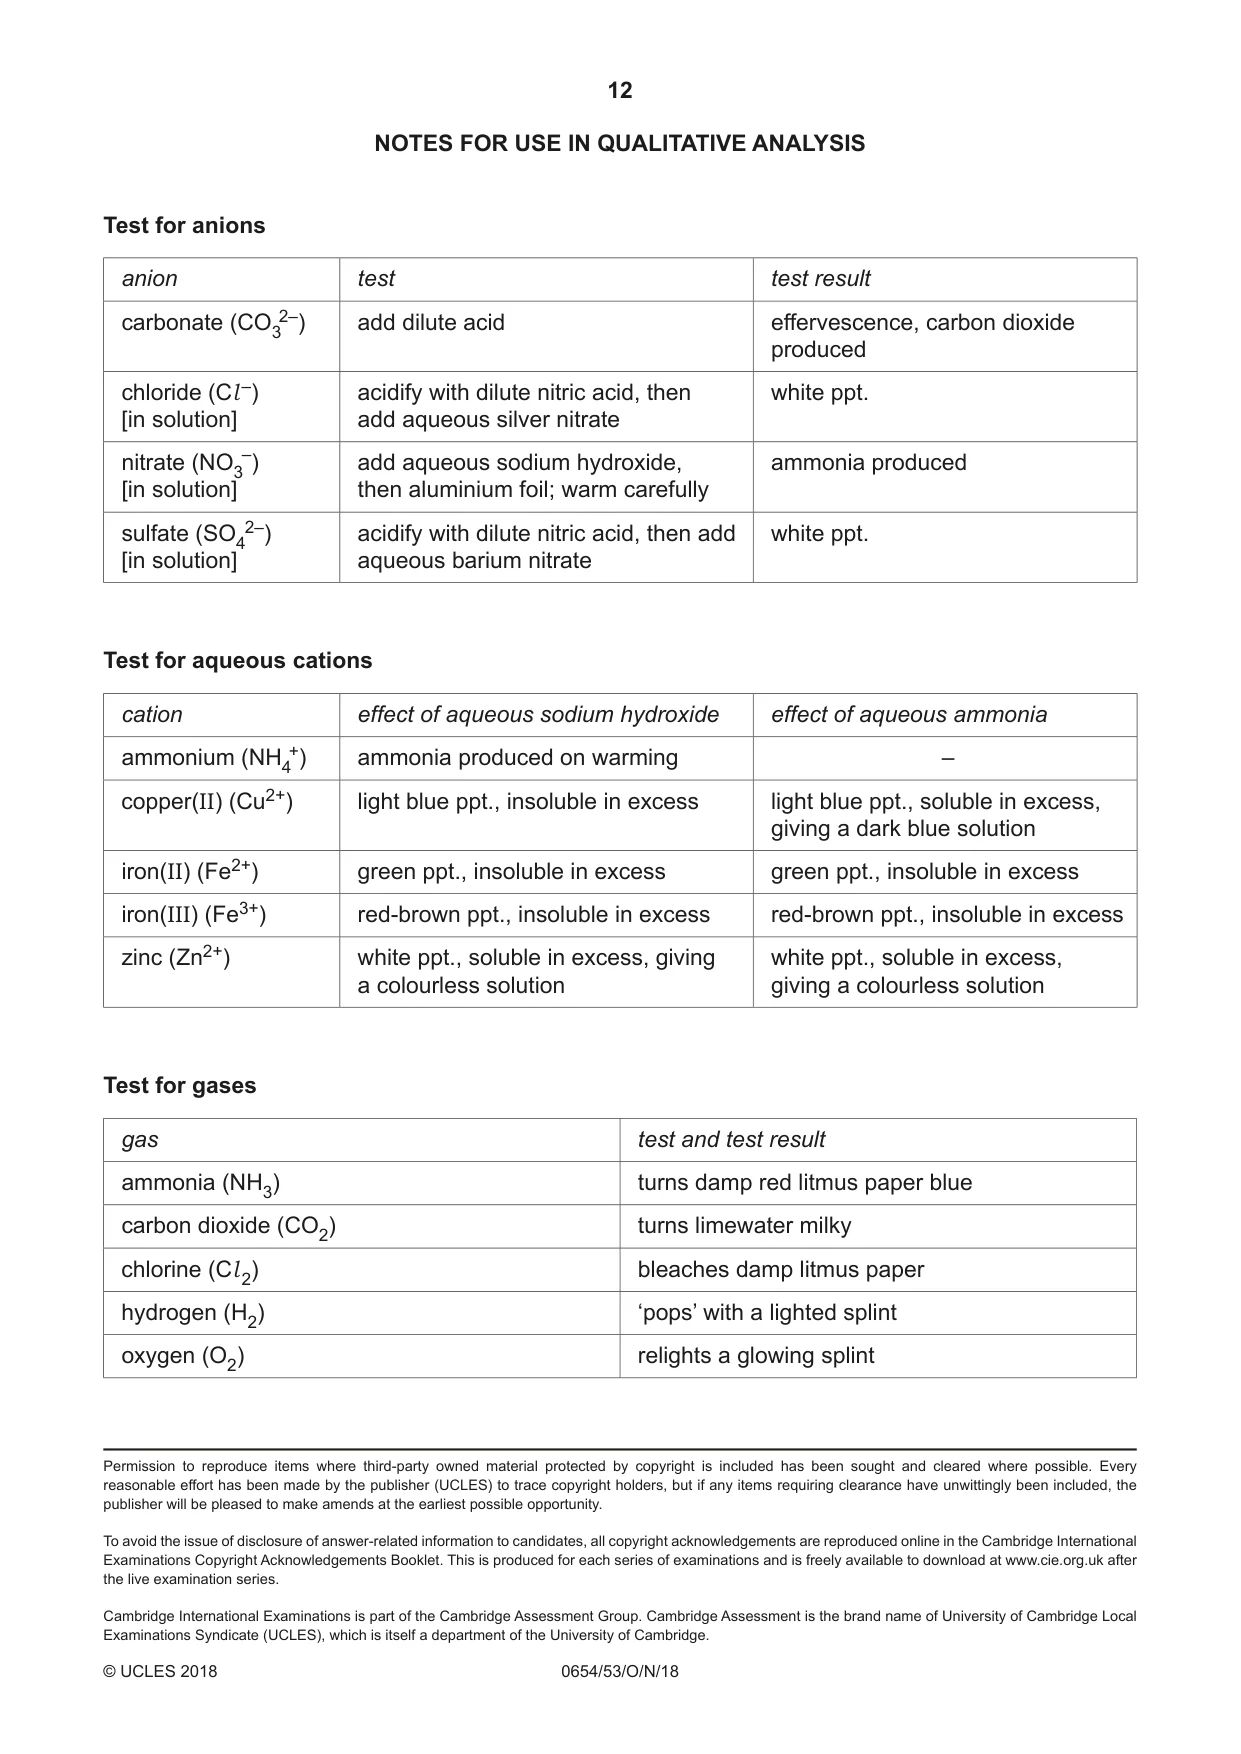
2 Notes for use in Qualitative Analysis for this question are printed on page 12. Solid J is a mixture of two compounds. You are going to separate the compounds and identify some of the ions in each compound. (a) Procedure • Place all of solid J in a beaker. • Add 20 cm3 of distilled water. • Use the stirring rod to stir the mixture well for 30 seconds. • Filter the mixture into a large test-tube. • Keep the filtrate and the residue for testing in (b) and (c). (i) Draw and label the apparatus you used to filter the mixture. Label the positions of the filtrate and the residue. [3] (ii) Describe the colours of the filtrate and residue. colour of filtrate .................................................................................................................. colour of residue ................................................................................................................ [1] (b) (i) Procedure • In a clean test-tube, place 2 cm depth of the liquid collected in the large test-tube in (a). • Keep the remaining liquid in the large test-tube for use in (b)(ii). • Add sodium hydroxide solution until the test-tube is nearly half-full. • Record your observations. • Gently heat the test-tube, taking care to point the test-tube away from people. • Test for any gases near the mouth of the test-tube using damp blue and damp red litmus papers. • Record your observations. observations for: addition of sodium hydroxide solution before heating ................................................. ...................................................................................................................................... damp blue litmus ......................................................................................................... damp red litmus ........................................................................................................... [2] (ii) Procedure • In a clean test-tube, place 2 cm depth of the liquid collected in the large test-tube in (a). • Add an equal volume of nitric acid. • Record your observations. • Add a few drops of barium nitrate solution. • Record your observations. observations for: addition of nitric acid .................................................................................................... ...................................................................................................................................... addition of barium nitrate ............................................................................................. ...................................................................................................................................... [1] (iii) Use your observations in (b)(i) and (b)(ii) to state what conclusions you can make about the ions present or not present in the liquid from (a). conclusions about ions after testing with: sodium hydroxide solution ................................................................................................. litmus papers ..................................................................................................................... nitric acid ........................................................................................................................... barium nitrate .................................................................................................................... [4] (c) Scrape the solid on the filter paper from (a) into a large test-tube. (i) Add 10 cm3 of sulfuric acid to the test-tube. Record your observation. observation ........................................................................................................................ ........................................................................................................................................... [1] (ii) Procedure • Carefully heat the mixture from (c)(i) for about one minute. • Leave the test-tube to cool for about one minute. • If solid still remains, either filter the mixture or decant to obtain the liquid L in a test-tube. • Using a small amount of this liquid L, test for the cation present with sodium hydroxide solution. • Record your observations and identify the cation. observations ................................................................................................................ ...................................................................................................................................... cation is ........................................................................................................................ ...................................................................................................................................... [2] (iii) The compound in the solid on the filter paper from (a) has reacted with the sulfuric acid. Use your observations and conclusion in (c)(i) and (c)(ii) and your knowledge of the reactions of acids to suggest an identity for the compound in this solid. compound in this solid is ................................................................................................... [1]
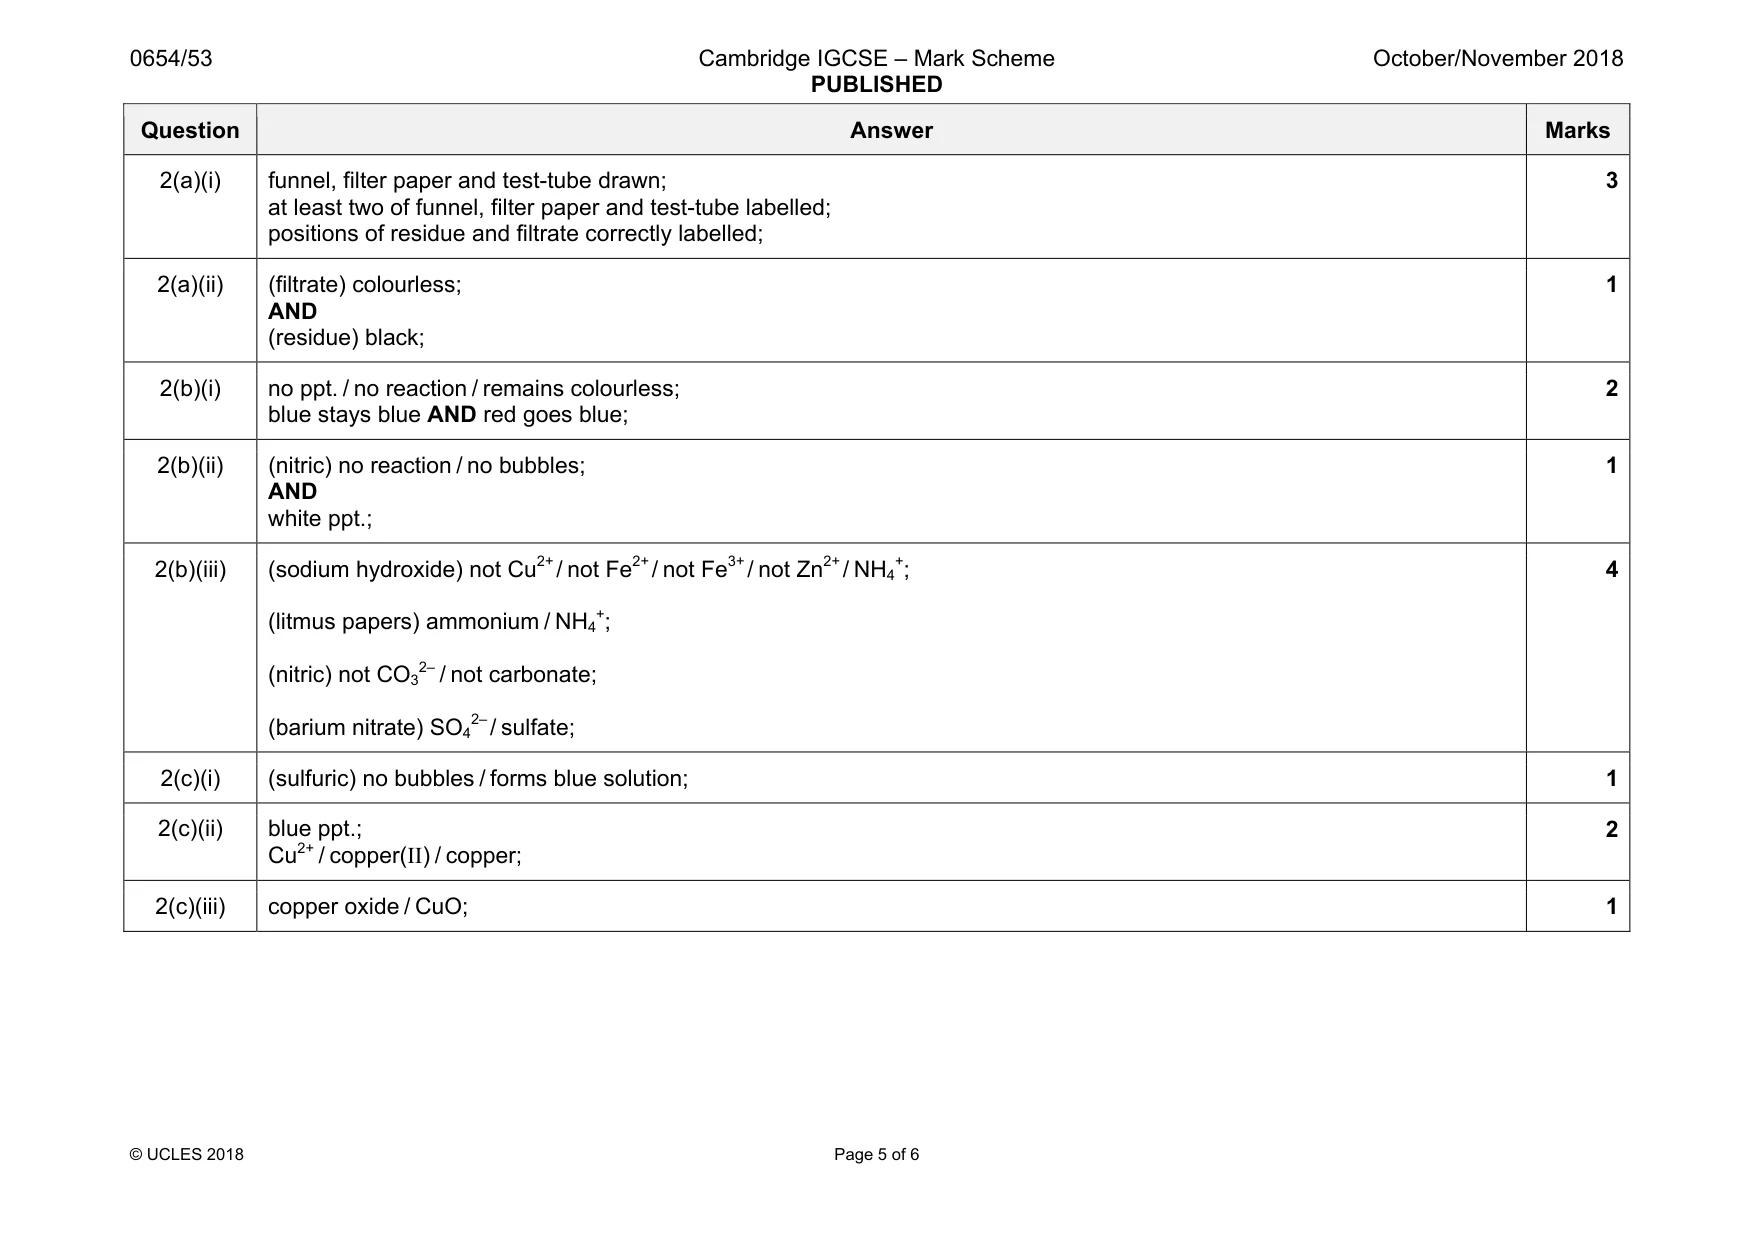
Mark scheme: 2(a)(i) funnel, filter paper and test-tube drawn; at least two of funnel, filter paper and test-tube labelled; positions of residue and filtrate correctly labelled; 3 2(a)(ii) (filtrate) colourless; AND (residue) black; 1 2(b)(i) no ppt. / no reaction / remains colourless; blue stays blue AND red goes blue; 2 2(b)(ii) (nitric) no reaction / no bubbles; AND white ppt.; 1 2(b)(iii) (sodium hydroxide) not Cu2+/ not Fe2+/ not Fe3+/ not Zn2+/ NH4 +; (litmus papers) ammonium / NH4 +; (nitric) not CO3 2– / not carbonate; (barium nitrate) SO4 2– / sulfate; 4 2(c)(i) (sulfuric) no bubbles / forms blue solution; 1 2(c)(ii) blue ppt.; Cu2+ / copper(II) / copper; 2 2(c)(iii) copper oxide / CuO; 1
Q3 · You are going to investigate how the temperature of the surroundings affects the rate of…
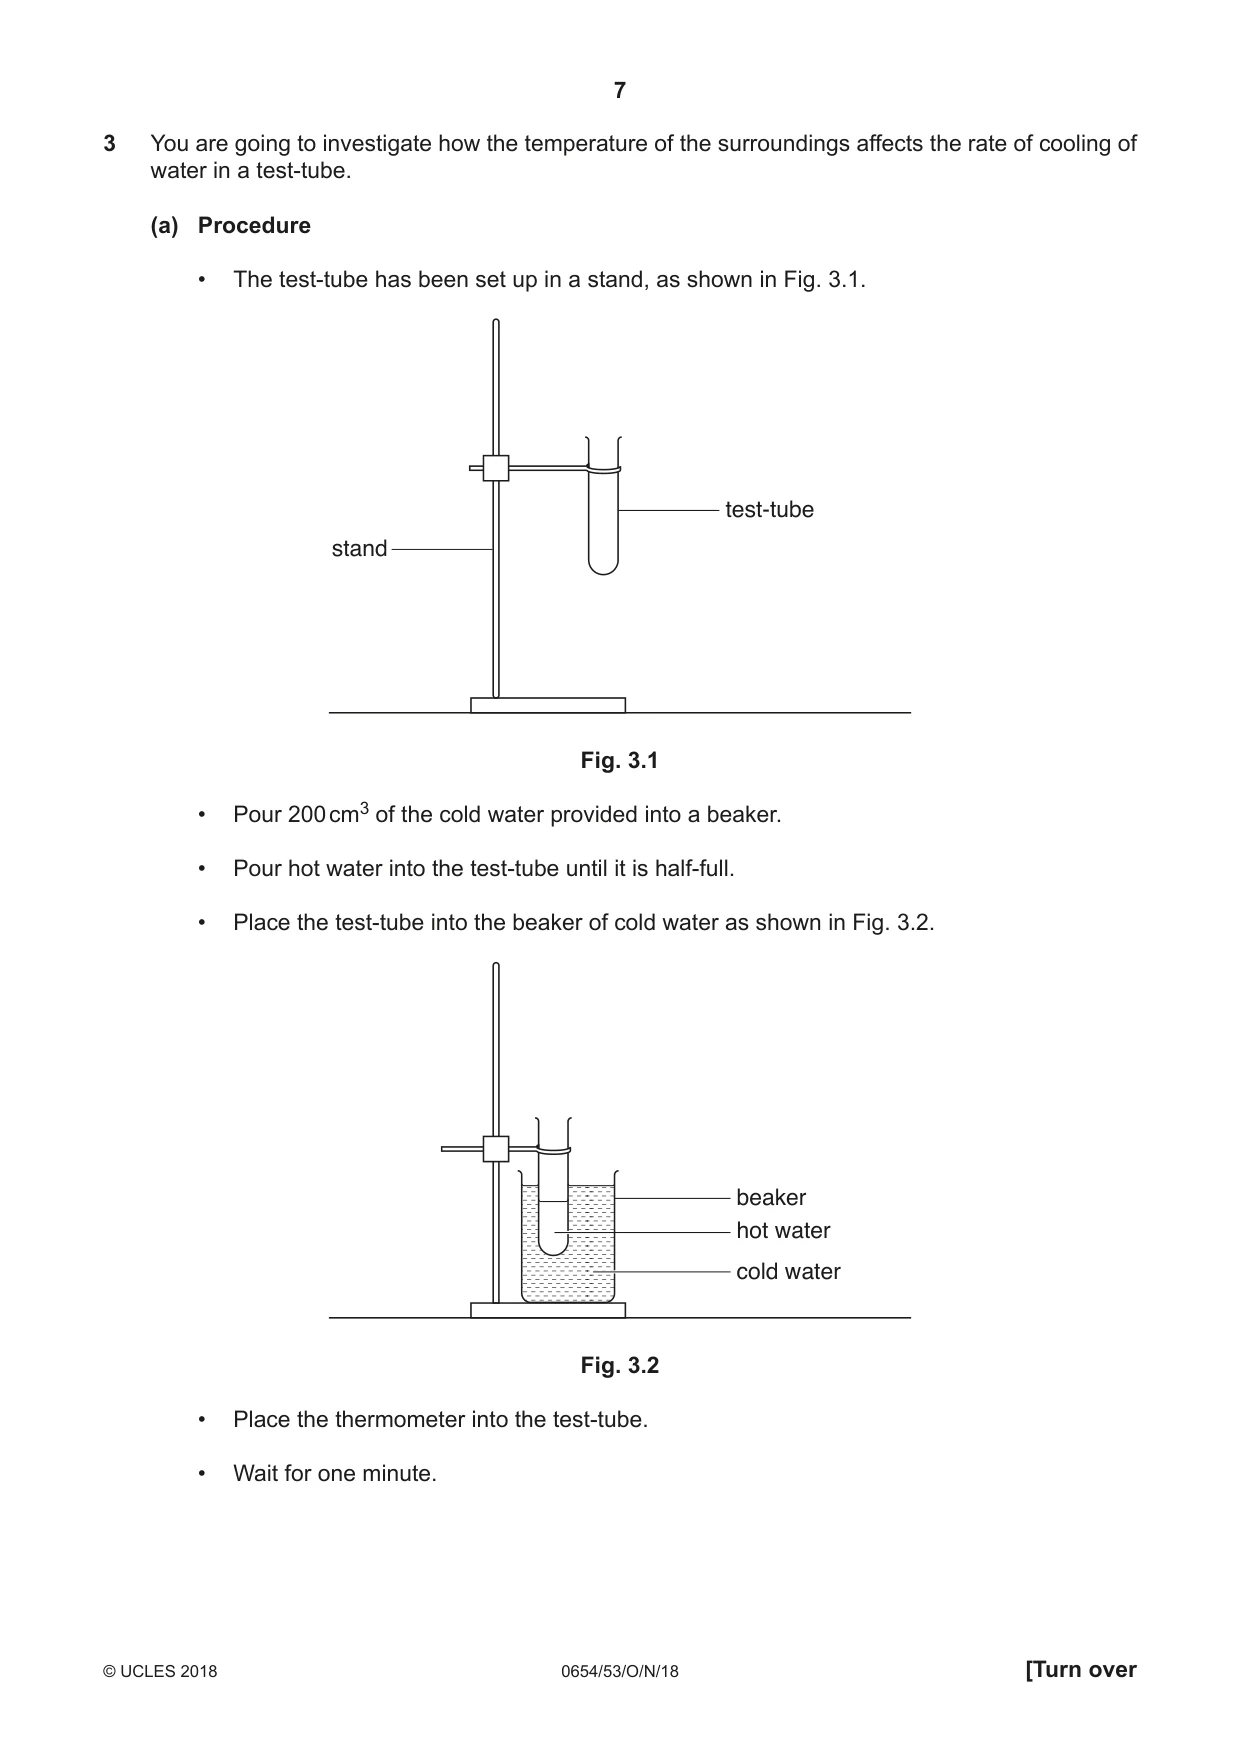
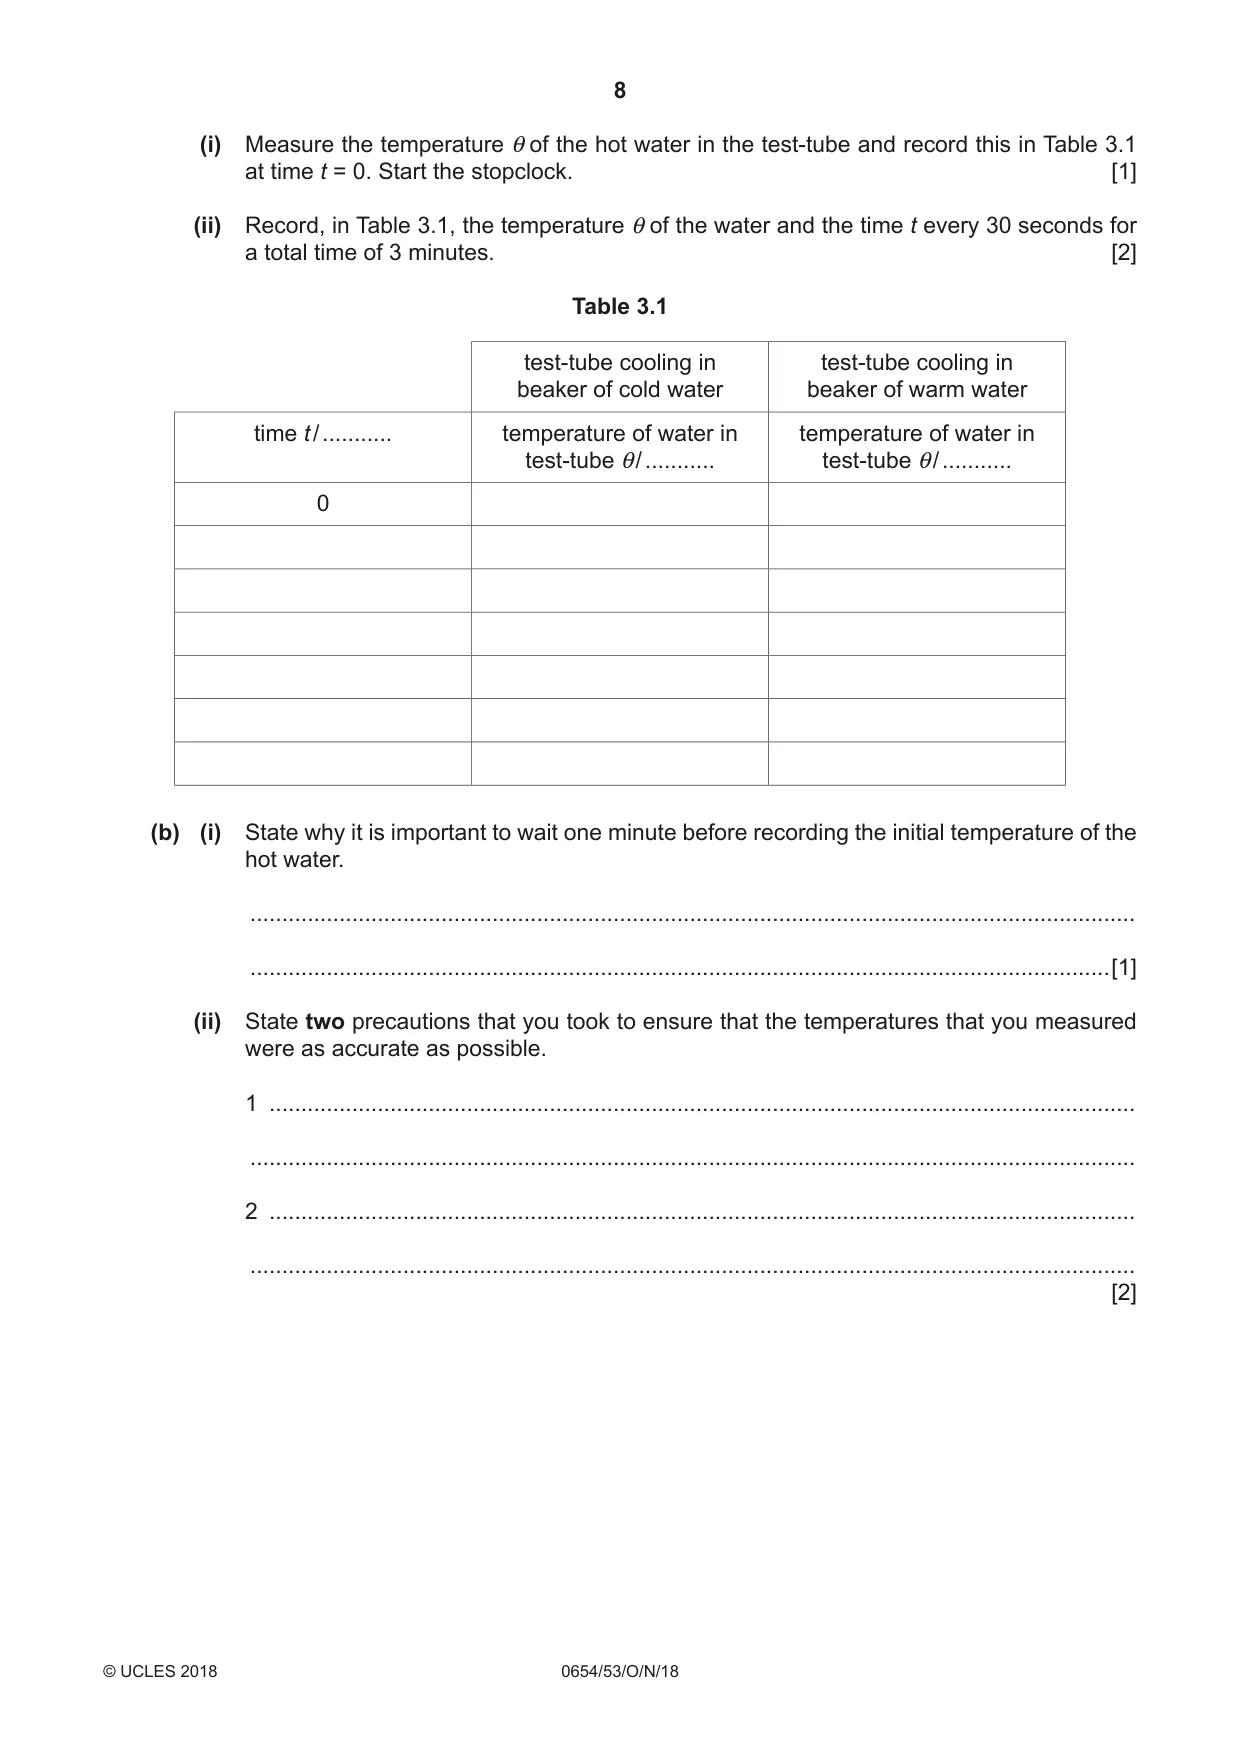
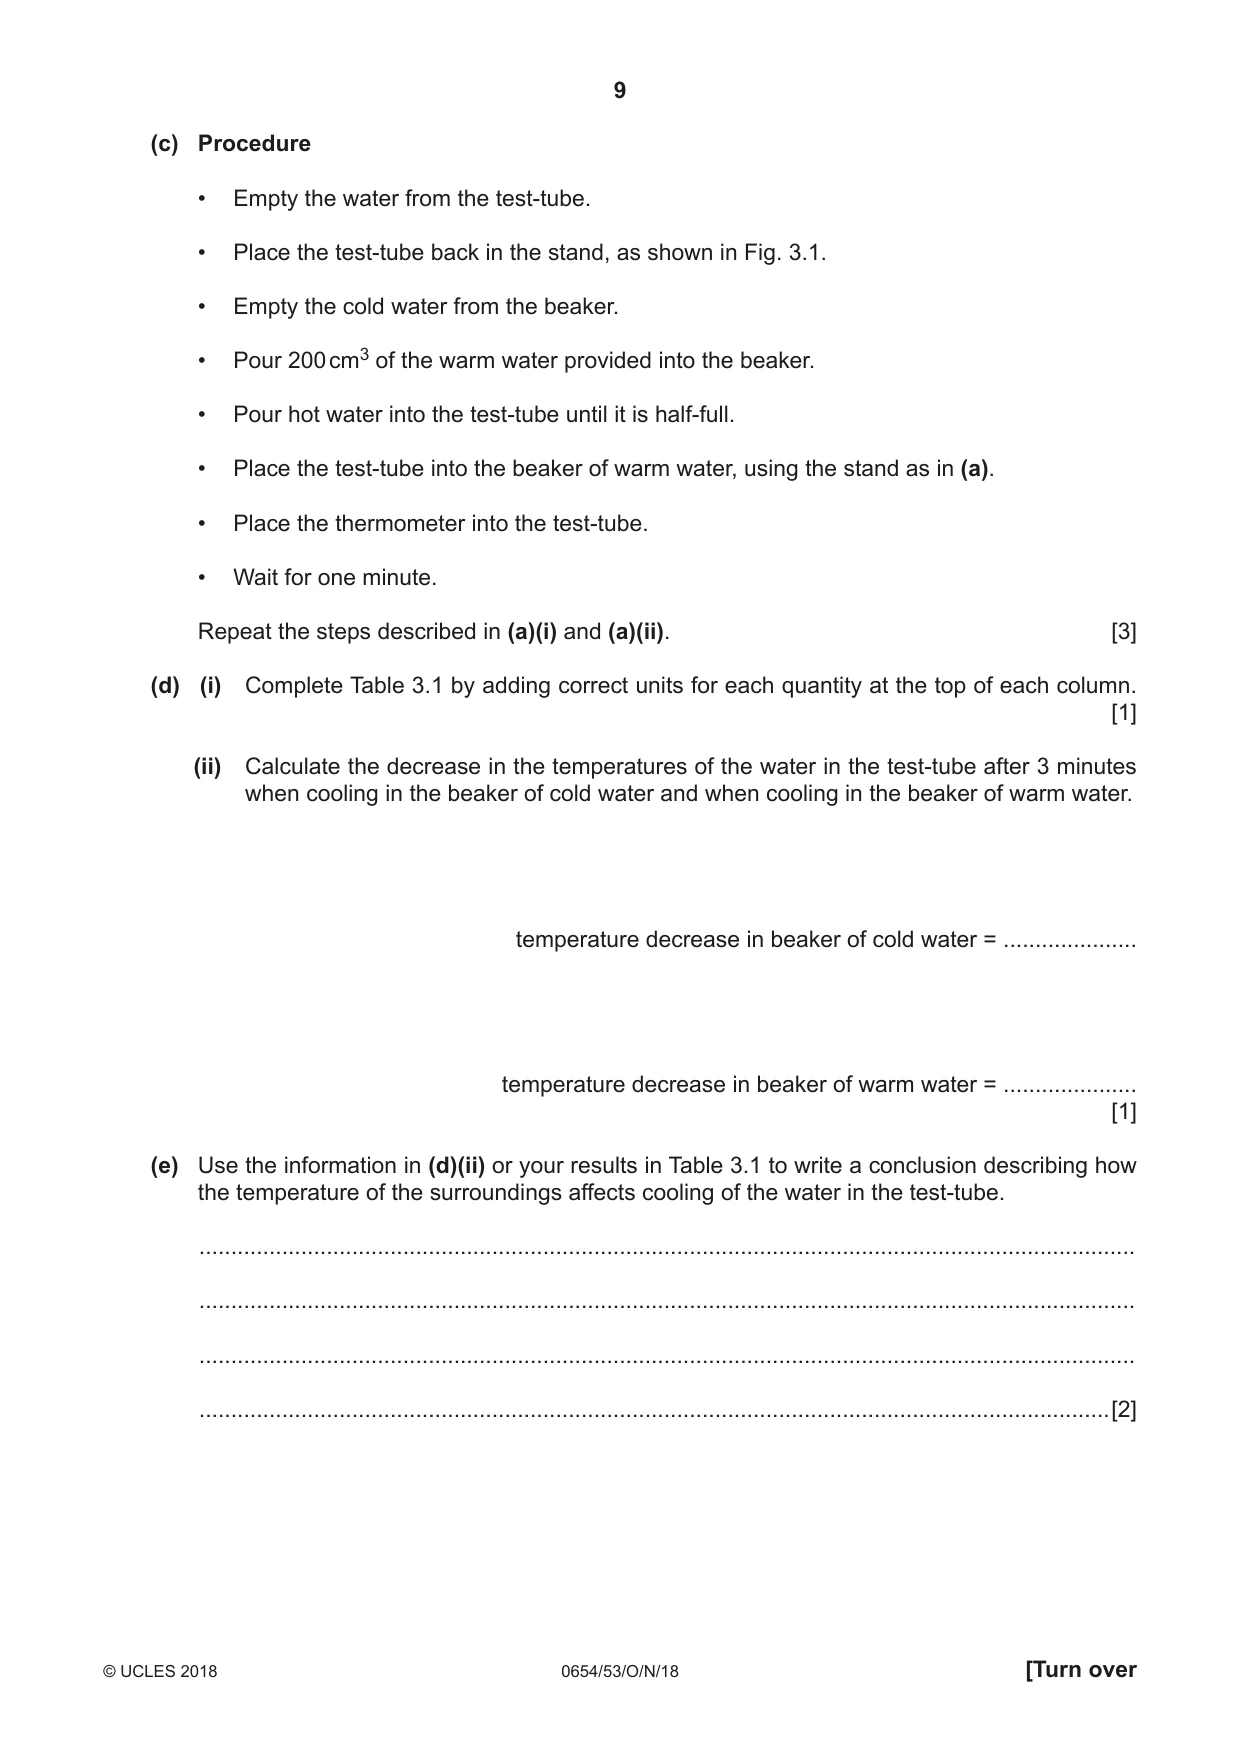
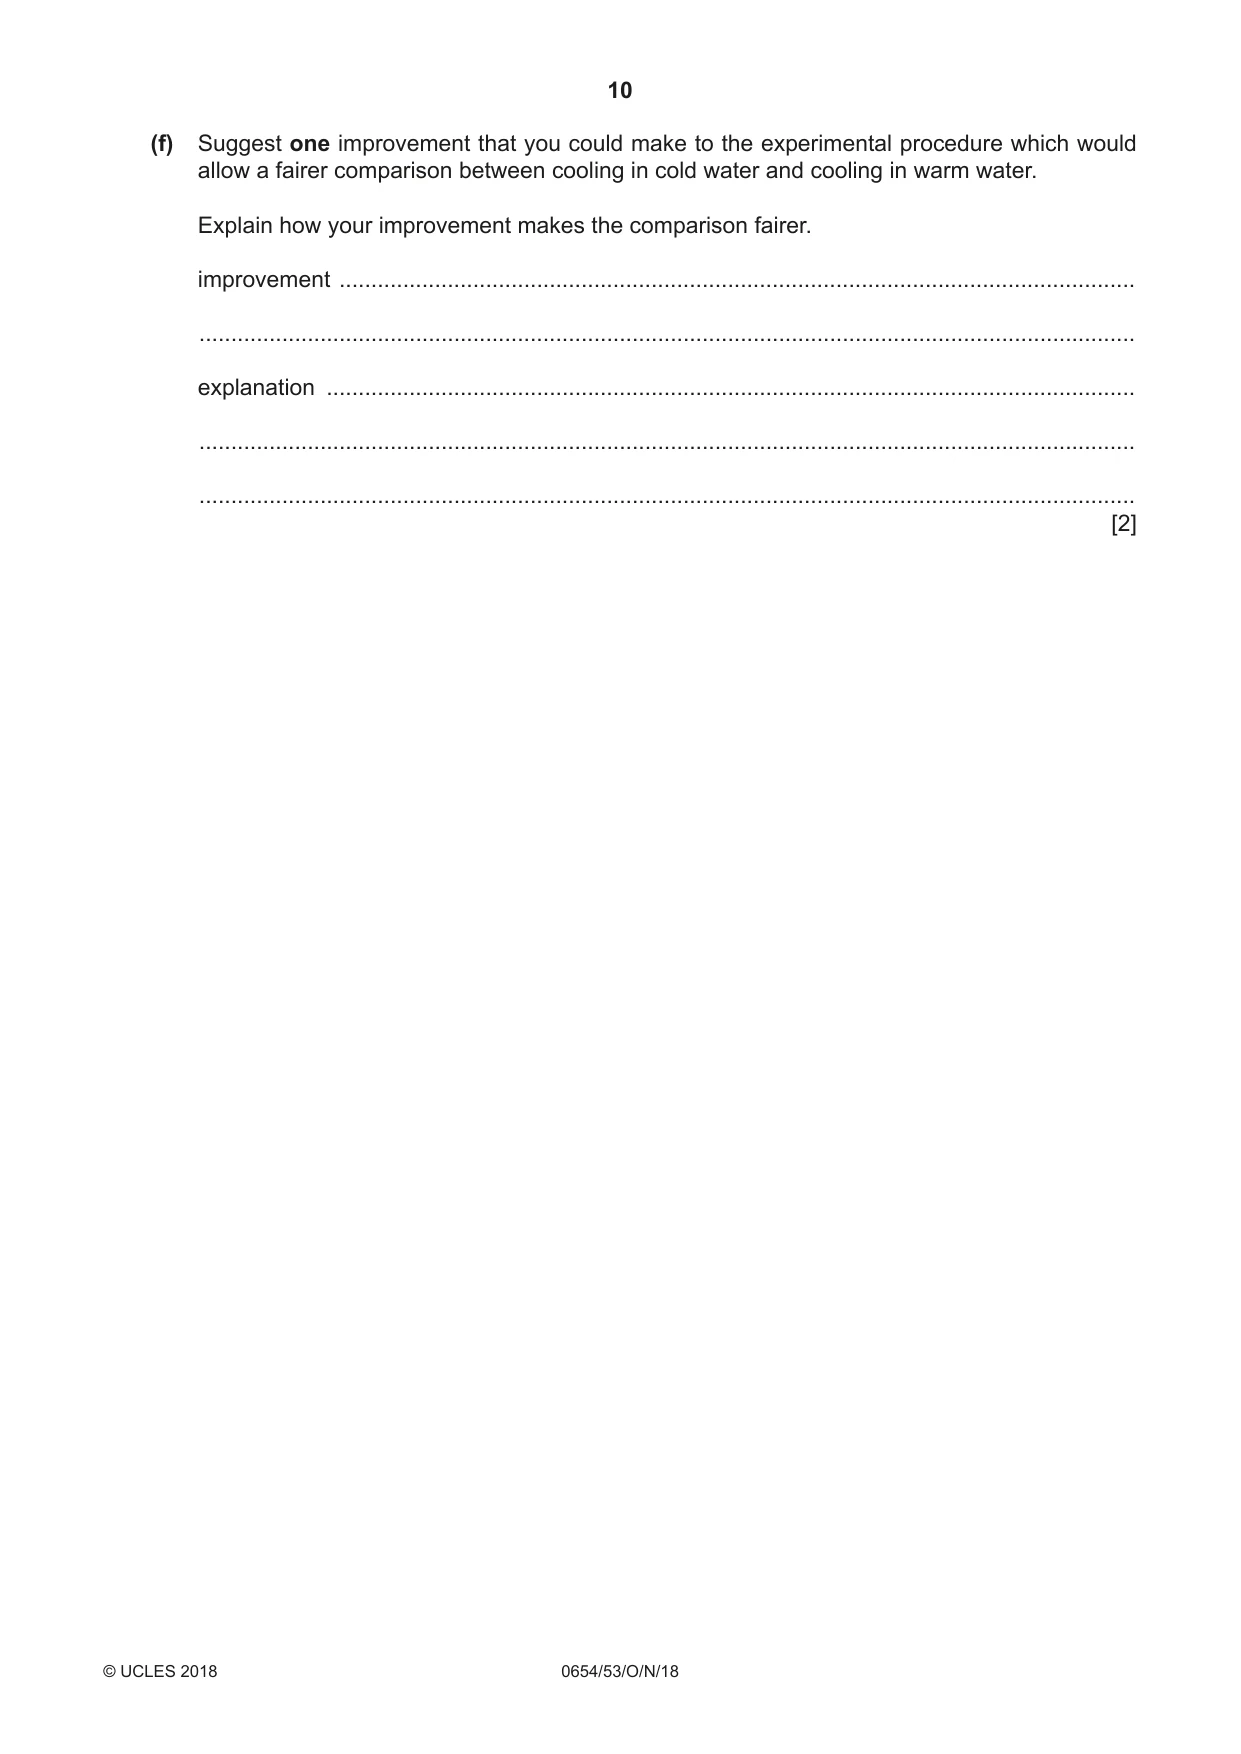
3 You are going to investigate how the temperature of the surroundings affects the rate of cooling of water in a test-tube. (a) Procedure • The test-tube has been set up in a stand, as shown in Fig. 3.1. test-tube stand Fig. 3.1 • Pour 200 cm3 of the cold water provided into a beaker. • Pour hot water into the test-tube until it is half-full. • Place the test-tube into the beaker of cold water as shown in Fig. 3.2. beaker hot water cold water Fig. 3.2 • Place the thermometer into the test-tube. • Wait for one minute. (i) Measure the temperature θ of the hot water in the test-tube and record this in Table 3.1 at time t = 0. Start the stopclock. [1] (ii) Record, in Table 3.1, the temperature θ of the water and the time t every 30 seconds for a total time of 3 minutes. [2] Table 3.1 test-tube cooling in test-tube cooling in beaker of cold water beaker of warm water time t / ........... temperature of water in temperature of water in test-tube θ/ ........... test-tube θ/ ........... 0 (b) (i) State why it is important to wait one minute before recording the initial temperature of the hot water. ........................................................................................................................................... .......................................................................................................................................[1] (ii) State two precautions that you took to ensure that the temperatures that you measured were as accurate as possible. 1 ........................................................................................................................................ ........................................................................................................................................... 2 ........................................................................................................................................ ........................................................................................................................................... [2] (c) Procedure • Empty the water from the test-tube. • Place the test-tube back in the stand, as shown in Fig. 3.1. • Empty the cold water from the beaker. • Pour 200 cm3 of the warm water provided into the beaker. • Pour hot water into the test-tube until it is half-full. • Place the test-tube into the beaker of warm water, using the stand as in (a). • Place the thermometer into the test-tube. • Wait for one minute. Repeat the steps described in (a)(i) and (a)(ii). [3] (d) (i) Complete Table 3.1 by adding correct units for each quantity at the top of each column. [1] (ii) Calculate the decrease in the temperatures of the water in the test-tube after 3 minutes when cooling in the beaker of cold water and when cooling in the beaker of warm water. temperature decrease in beaker of cold water = ..................... temperature decrease in beaker of warm water = ..................... [1] (e) Use the information in (d)(ii) or your results in Table 3.1 to write a conclusion describing how the temperature of the surroundings affects cooling of the water in the test-tube. ................................................................................................................................................... ................................................................................................................................................... ................................................................................................................................................... ...............................................................................................................................................[2]
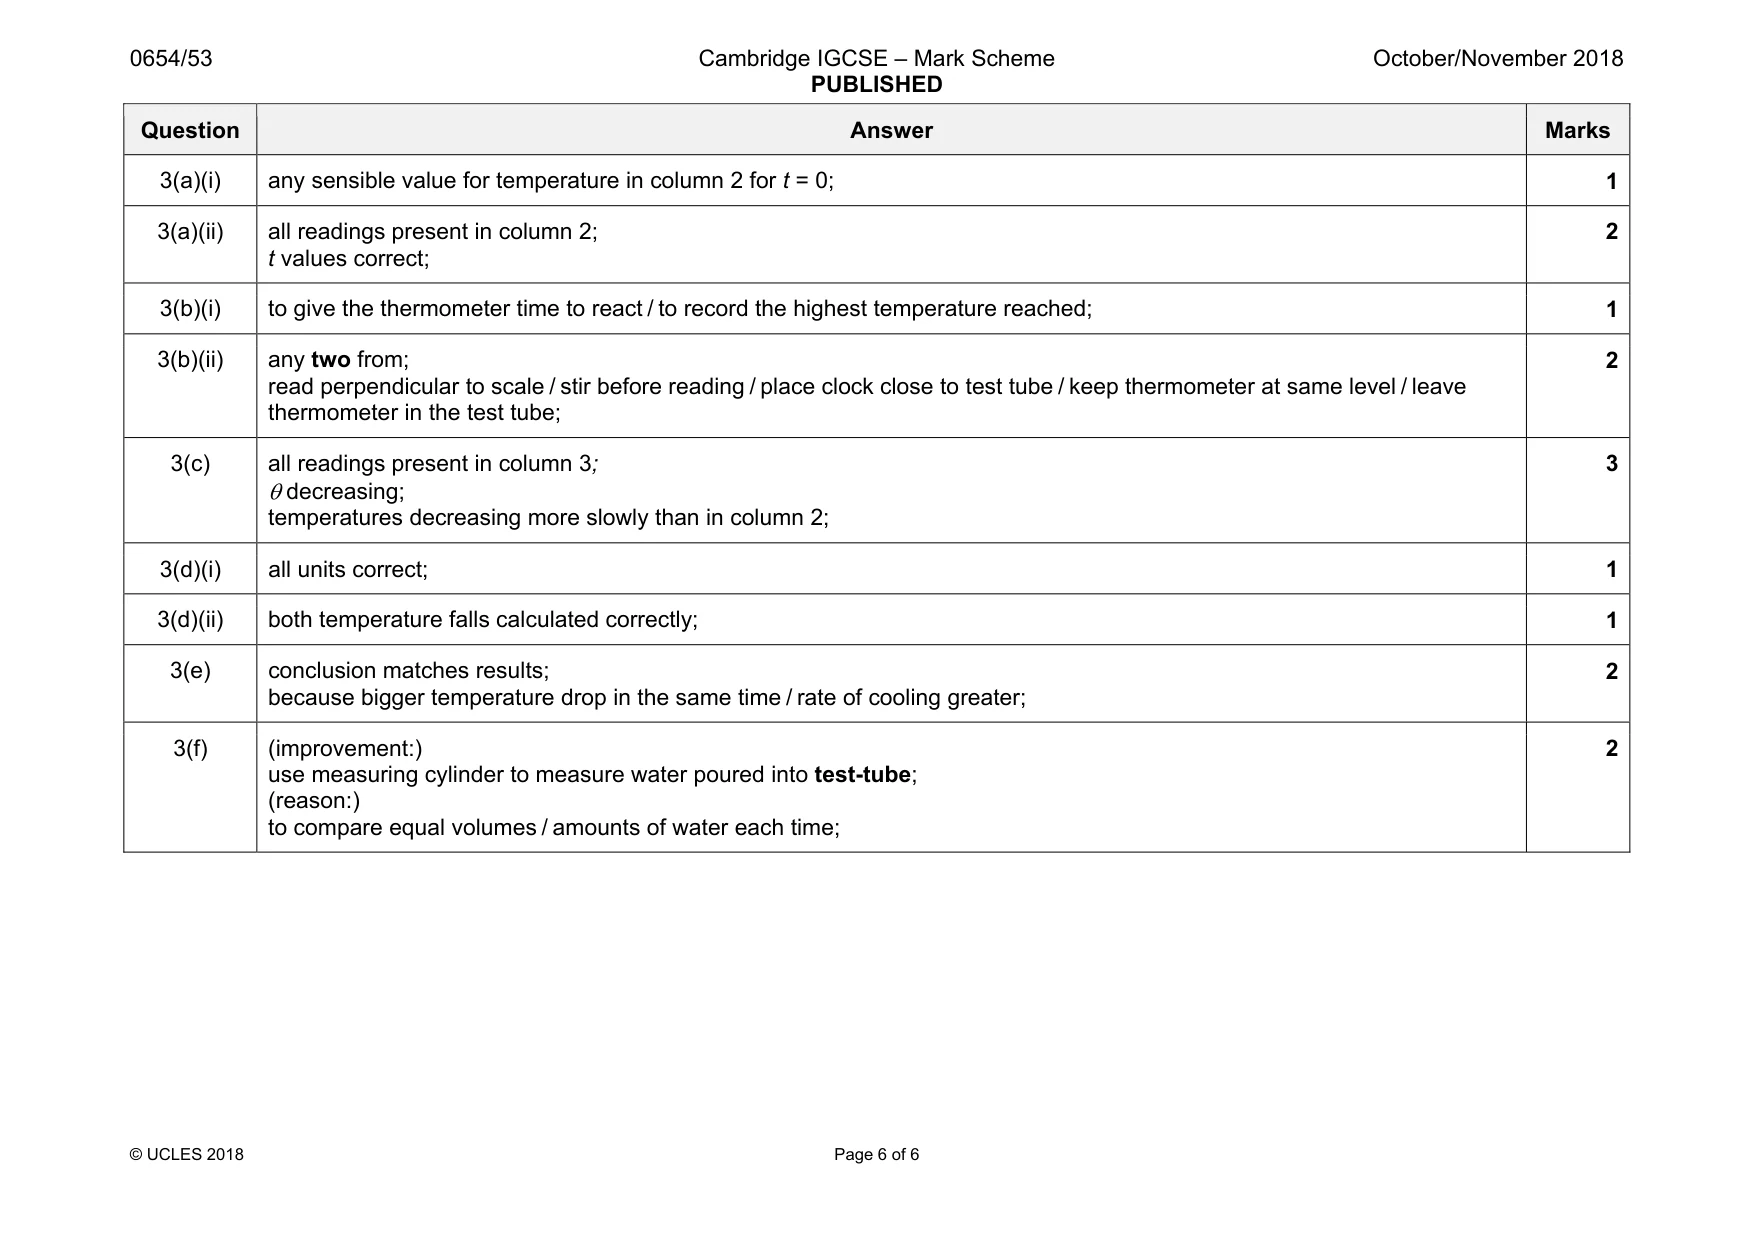
Mark scheme: 3(a)(i) any sensible value for temperature in column 2 for t = 0; 1 3(a)(ii) all readings present in column 2; t values correct; 2 3(b)(i) to give the thermometer time to react / to record the highest temperature reached; 1 3(b)(ii) any two from; read perpendicular to scale / stir before reading / place clock close to test tube / keep thermometer at same level / leave thermometer in the test tube; 2 3(c) all readings present in column 3; θ decreasing; temperatures decreasing more slowly than in column 2; 3 3(d)(i) all units correct; 1 3(d)(ii) both temperature falls calculated correctly; 1 3(e) conclusion matches results; because bigger temperature drop in the same time / rate of cooling greater; 2 3(f) (improvement:) use measuring cylinder to measure water poured into test-tube; (reason:) to compare equal volumes / amounts of water each time; 2
What was in this paper
The subtopics covered by these 3 questions, and how many questions each got. Open one in a new tab to see every Cambridge question on it.
What you needed in this session
Cambridge’s own grade thresholds for 2018 Oct/Nov, Paper 5 · Variant 3. A higher threshold means an easier paper — the bar moves with how the cohort did.