Cambridge IGCSE Sciences - Co-ordinated (Double) 0654 — 2023 May/June Paper 5 · Variant 3
0654/53/M/J/23 · 6 questions · 60 marks · ≈68 min
The question paper and its mark scheme, free to read here and free to download. This is Cambridge’s own paper, exactly as it was sat.
Question paper16 pages



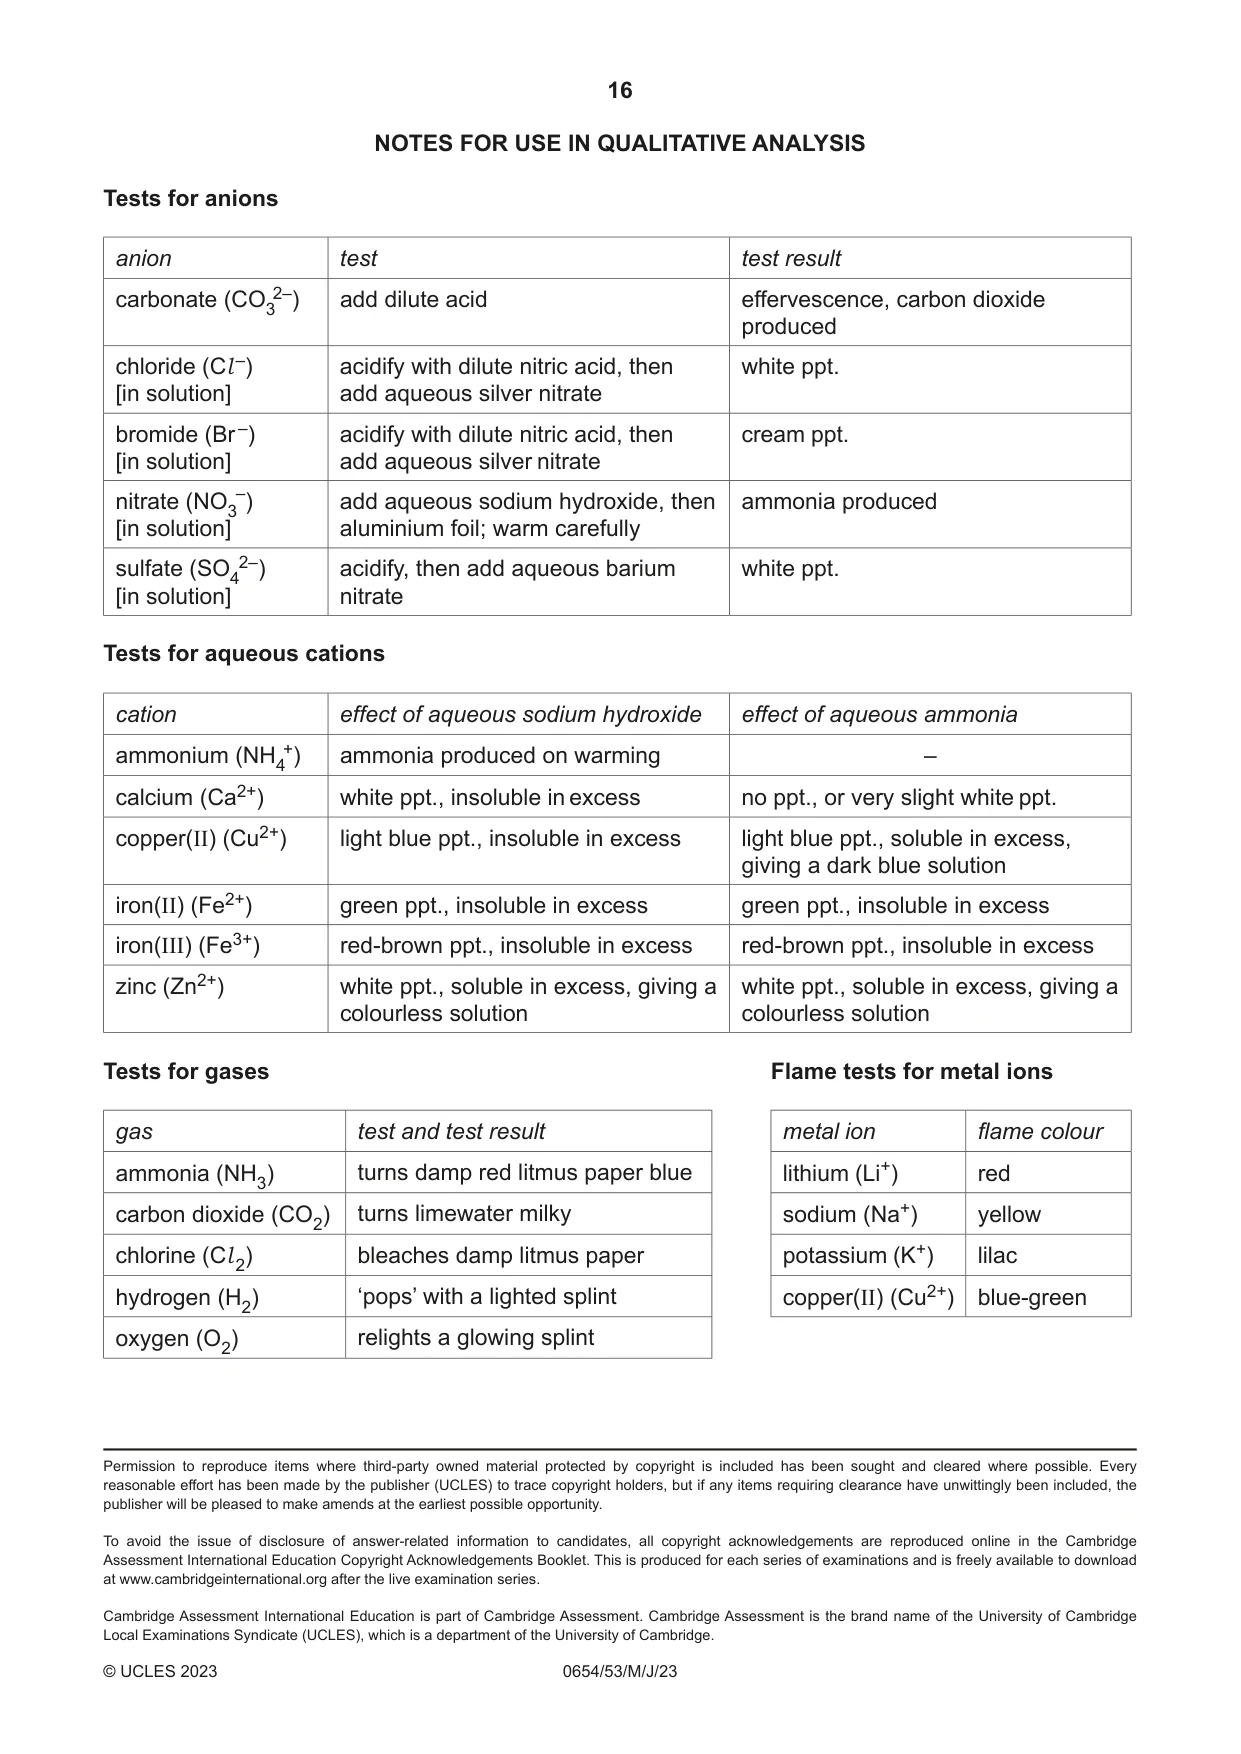
Mark scheme12 pages
Answers below. Sit the paper first if you are practising.
Questions as text
Q1 · You are provided with a flower
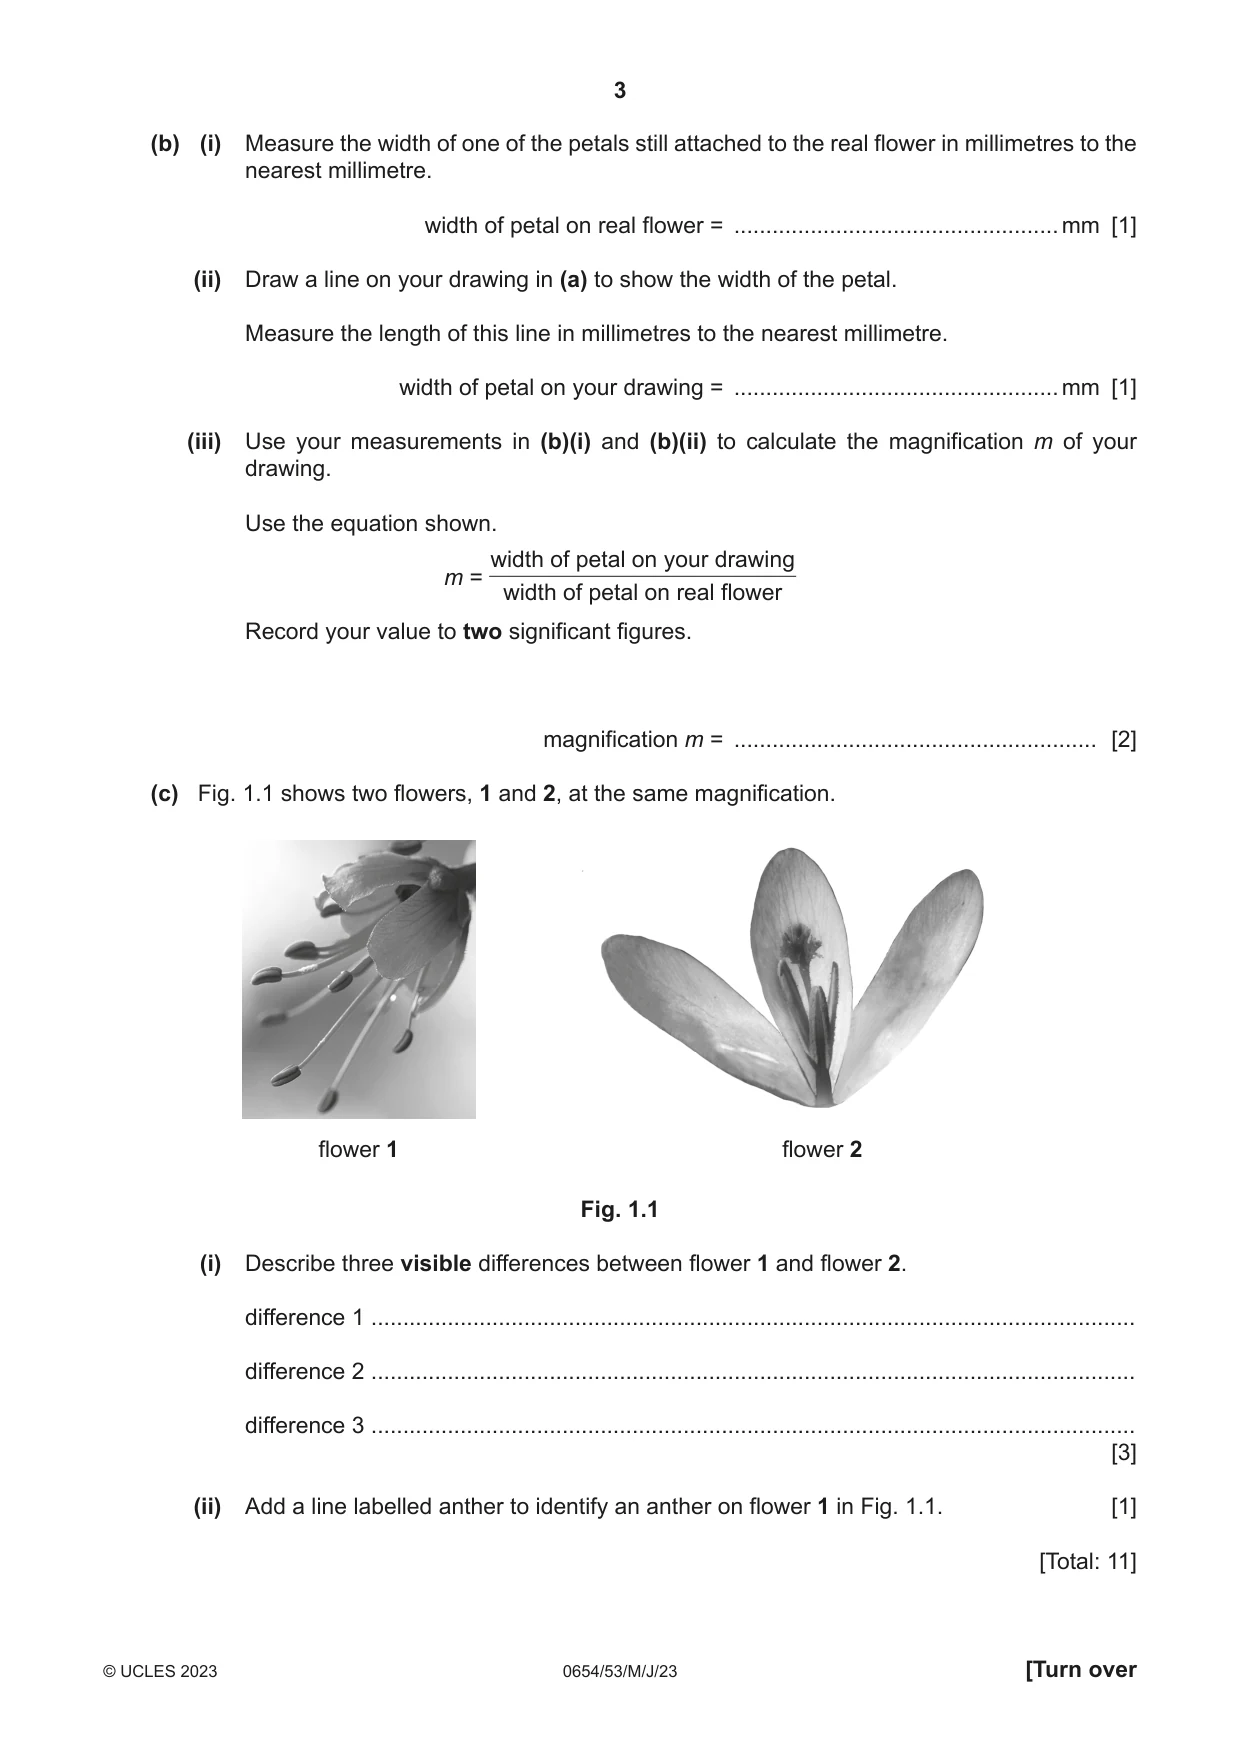
1 You are provided with a flower. (a) Remove three petals from one side of the flower so that the internal structures of the flower are clearly visible. In the box, make a large and detailed pencil drawing of the flower. Include the internal parts of the flower. [3] (b) (i) Measure the width of one of the petals still attached to the real flower in millimetres to the nearest millimetre. width of petal on real flower = ................................................... mm [1] (ii) Draw a line on your drawing in (a) to show the width of the petal. Measure the length of this line in millimetres to the nearest millimetre. width of petal on your drawing = ................................................... mm [1] (iii) Use your measurements in (b)(i) and (b)(ii) to calculate the magnification m of your drawing. Use the equation shown. width of petal on your drawing m = width of petal on real flower Record your value to two significant figures. magnification m = ......................................................... [2] (c) Fig. 1.1 shows two flowers, 1 and 2, at the same magnification. flower 1 flower 2 Fig. 1.1 (i) Describe three visible differences between flower 1 and flower 2. difference 1 ........................................................................................................................ difference 2 ........................................................................................................................ difference 3 ........................................................................................................................ [3] (ii) Add a line labelled anther to identify an anther on flower 1 in Fig. 1.1. [1] [Total: 11]
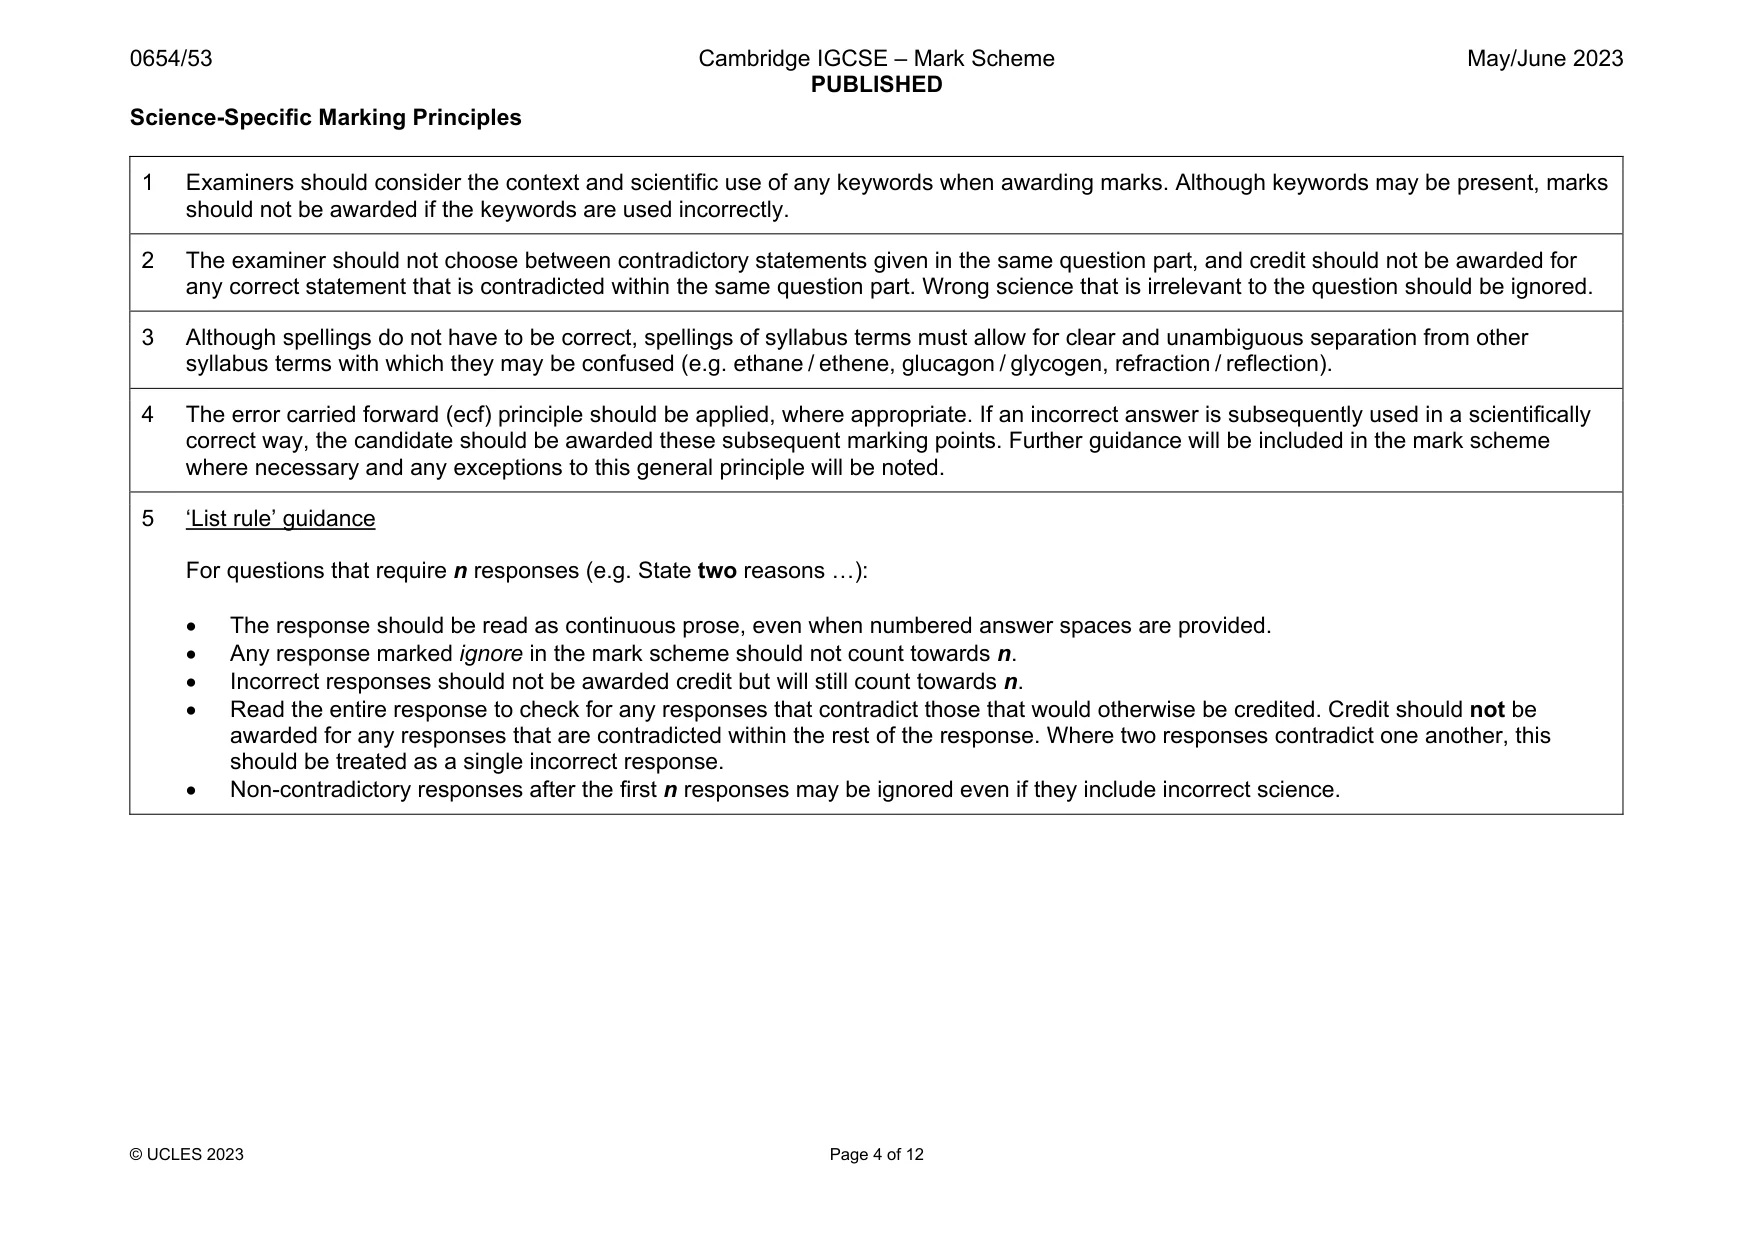
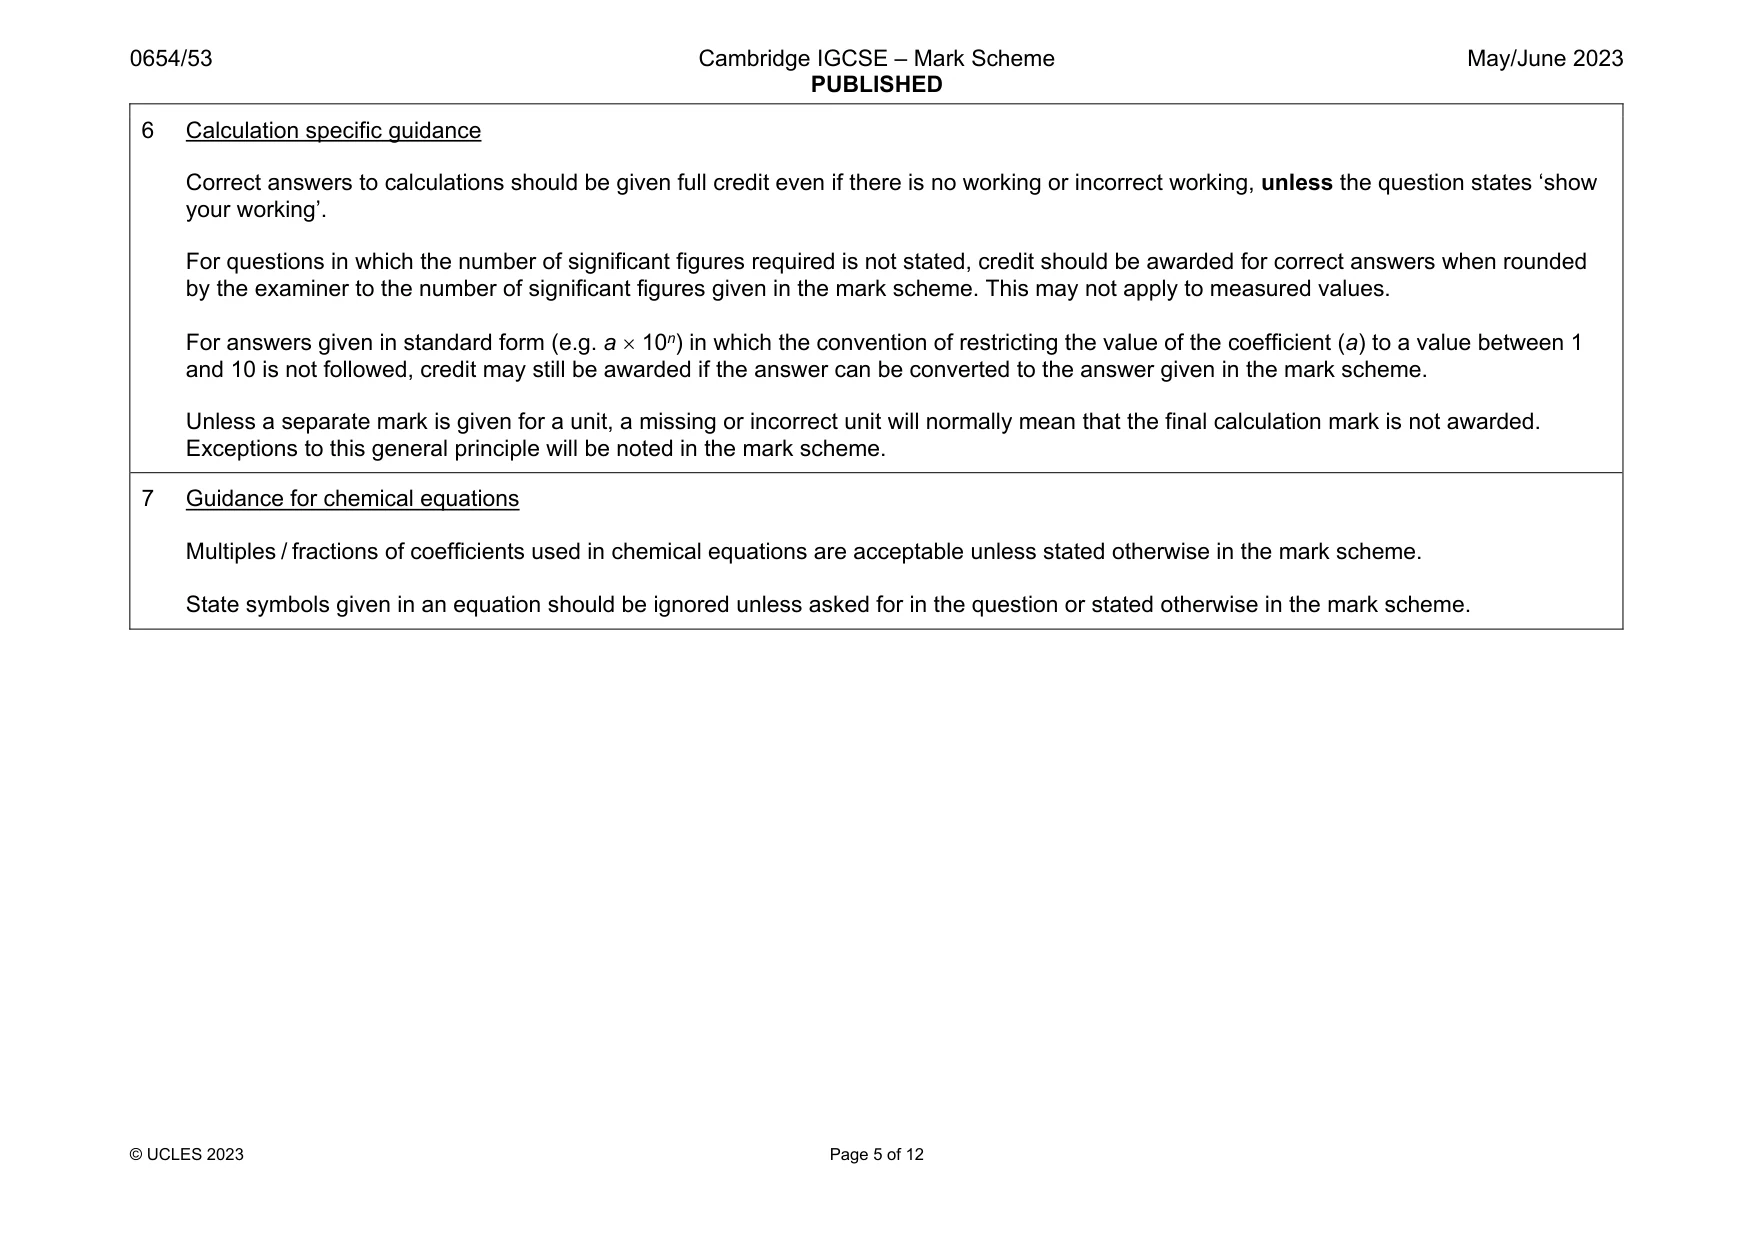
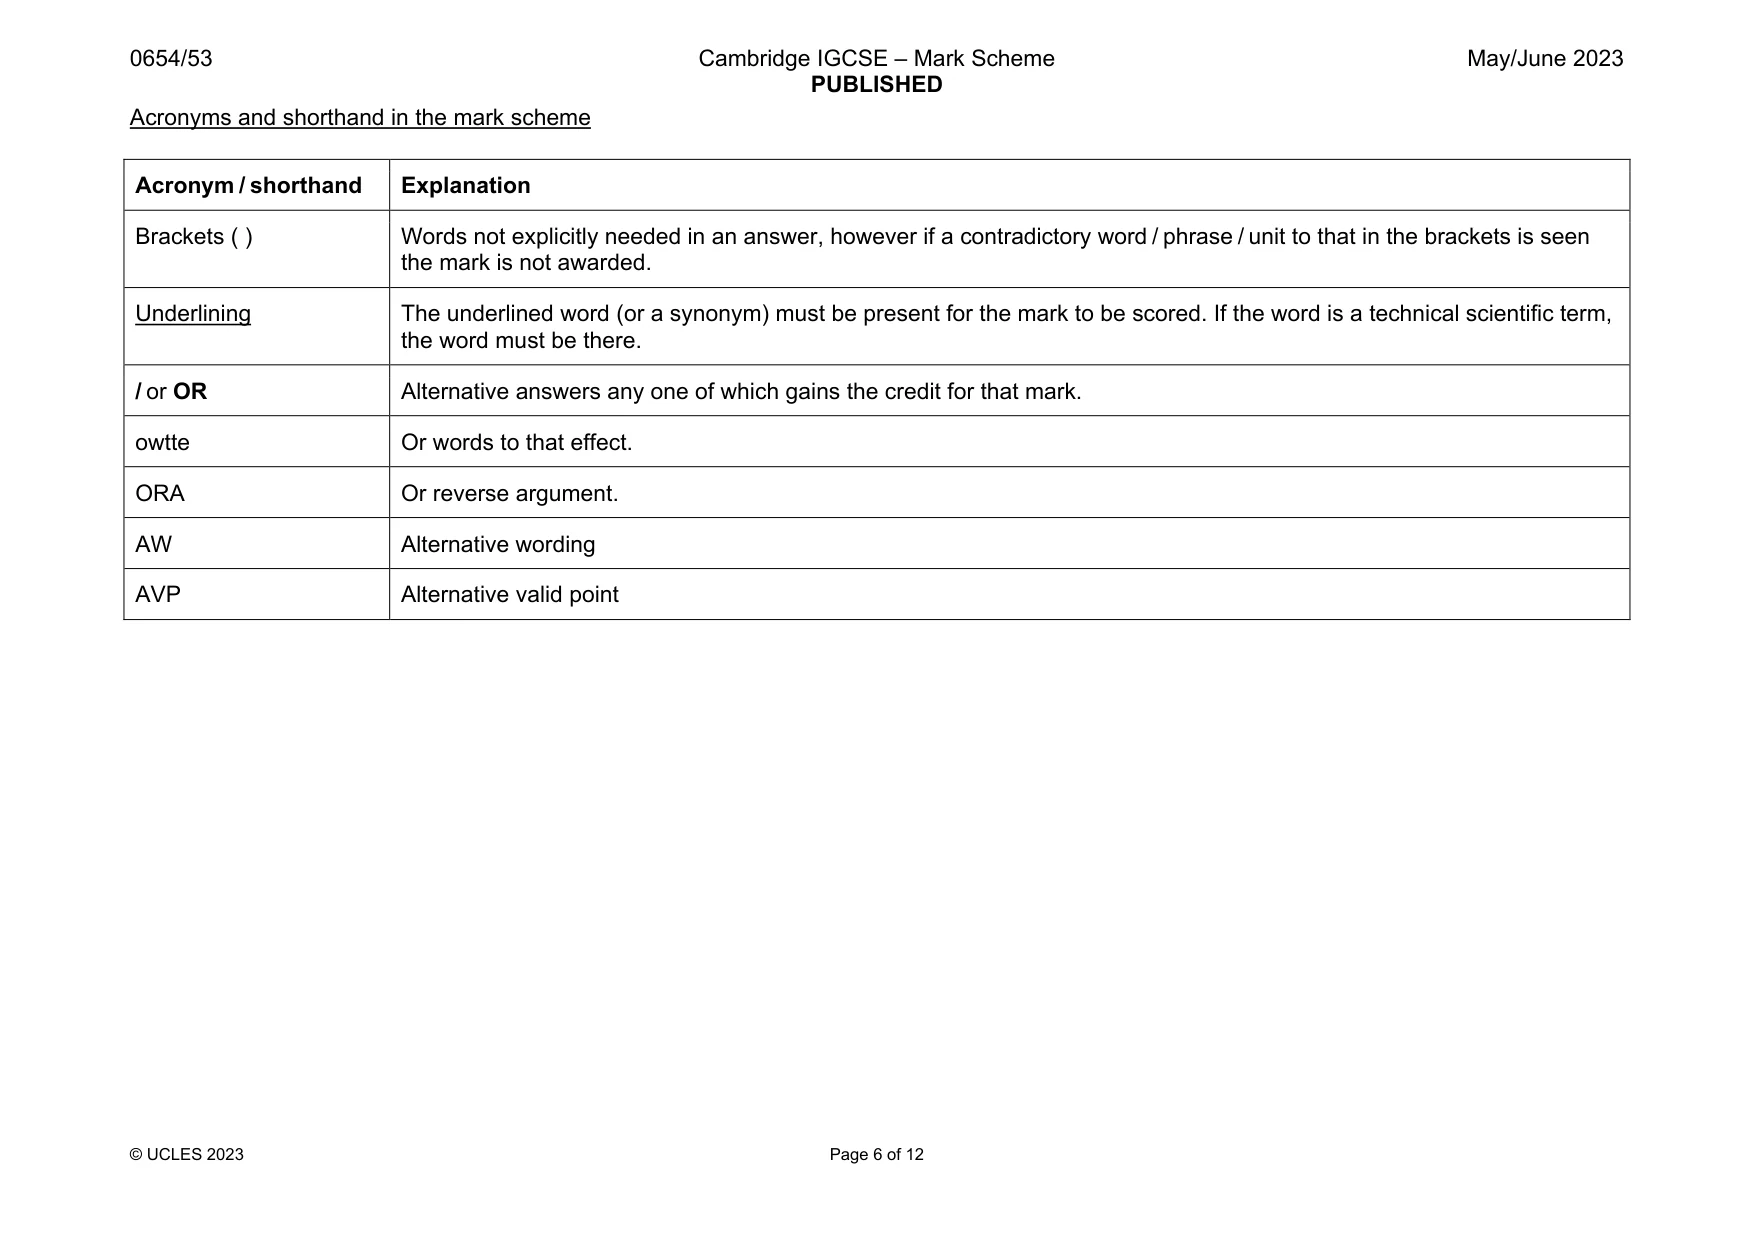
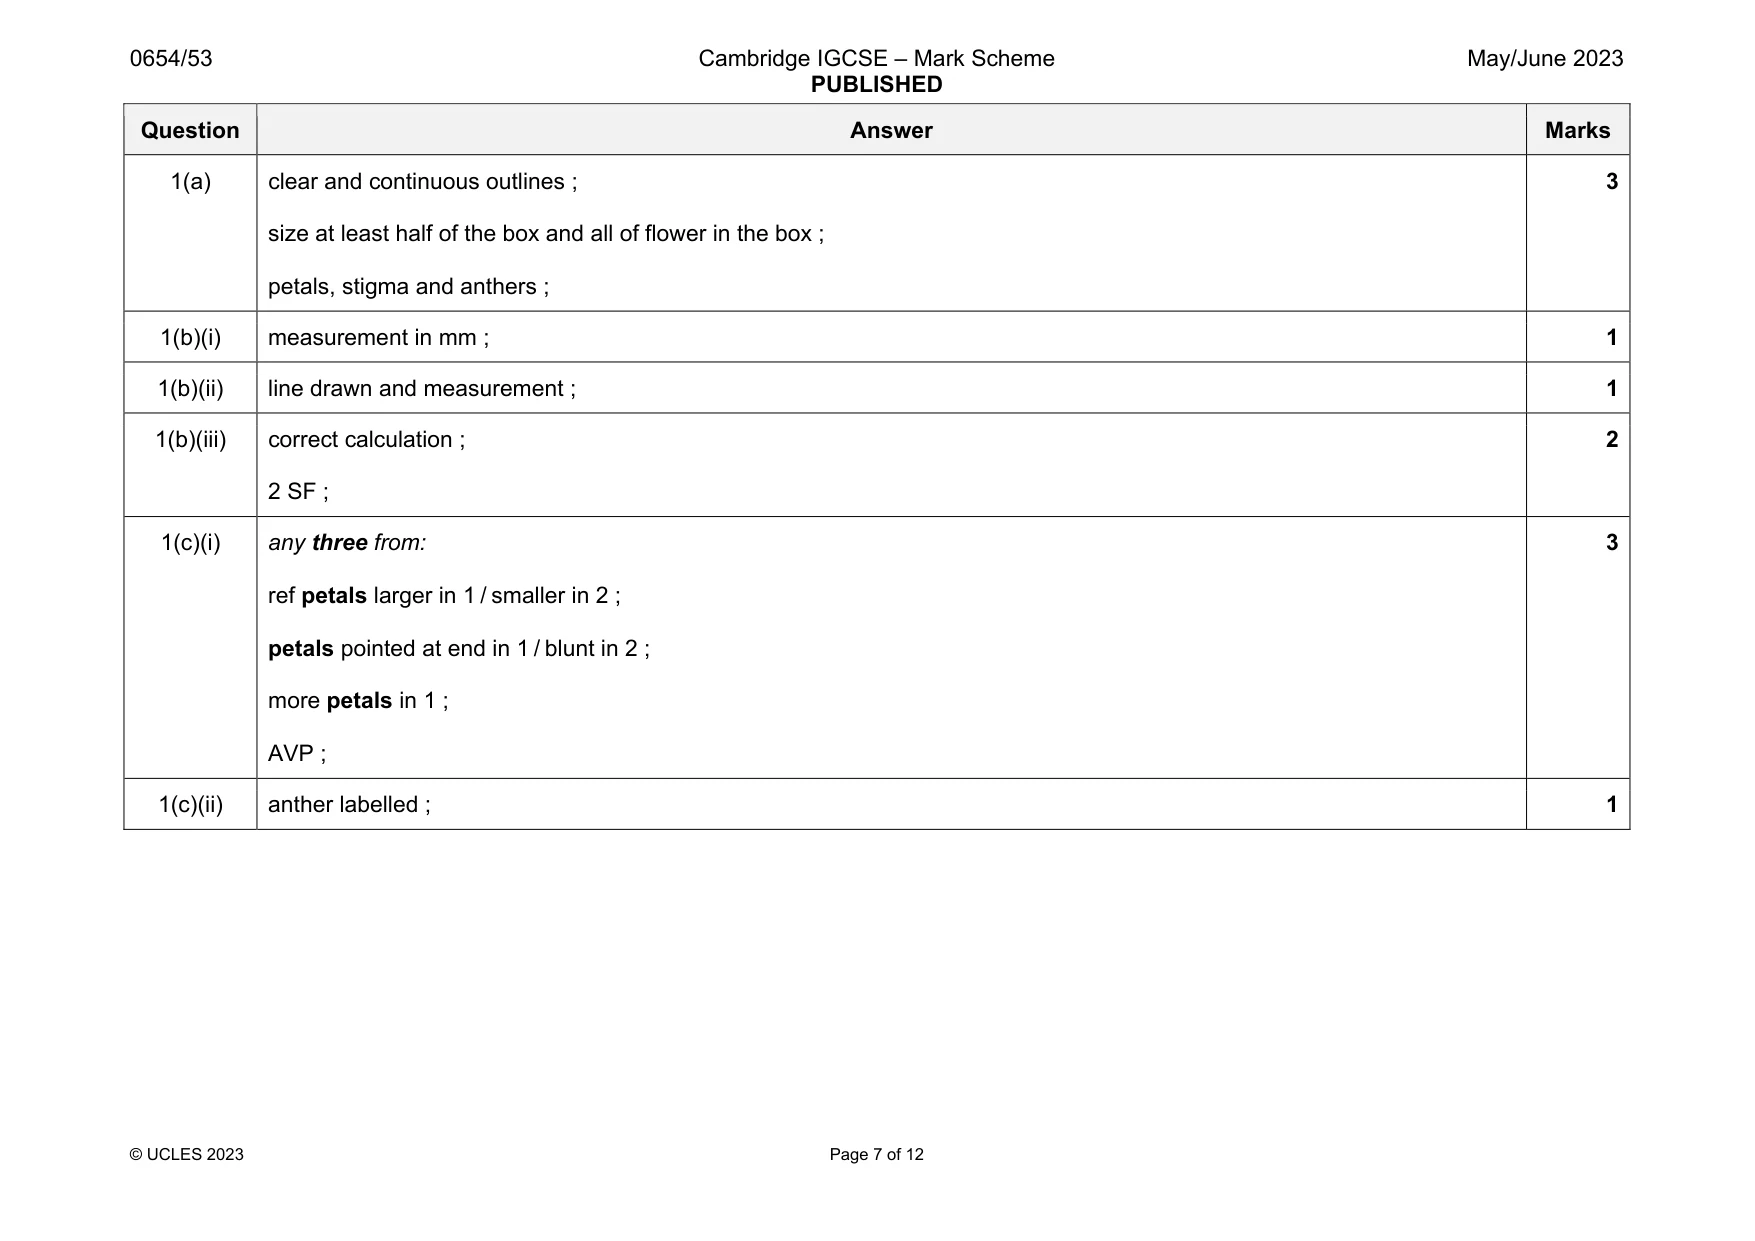
Mark scheme: 1(a) clear and continuous outlines ; size at least half of the box and all of flower in the box ; petals, stigma and anthers ; 3 1(b)(i) measurement in mm ; 1 1(b)(ii) line drawn and measurement ; 1 1(b)(iii) correct calculation ; 2 SF ; 2 1(c)(i) any three from: ref petals larger in 1 / smaller in 2 ; petals pointed at end in 1 / blunt in 2 ; more petals in 1 ; AVP ; 3 1(c)(ii) anther labelled ; 1
Q2 · You are going to investigate the action of three different concentrations of an enzyme on…
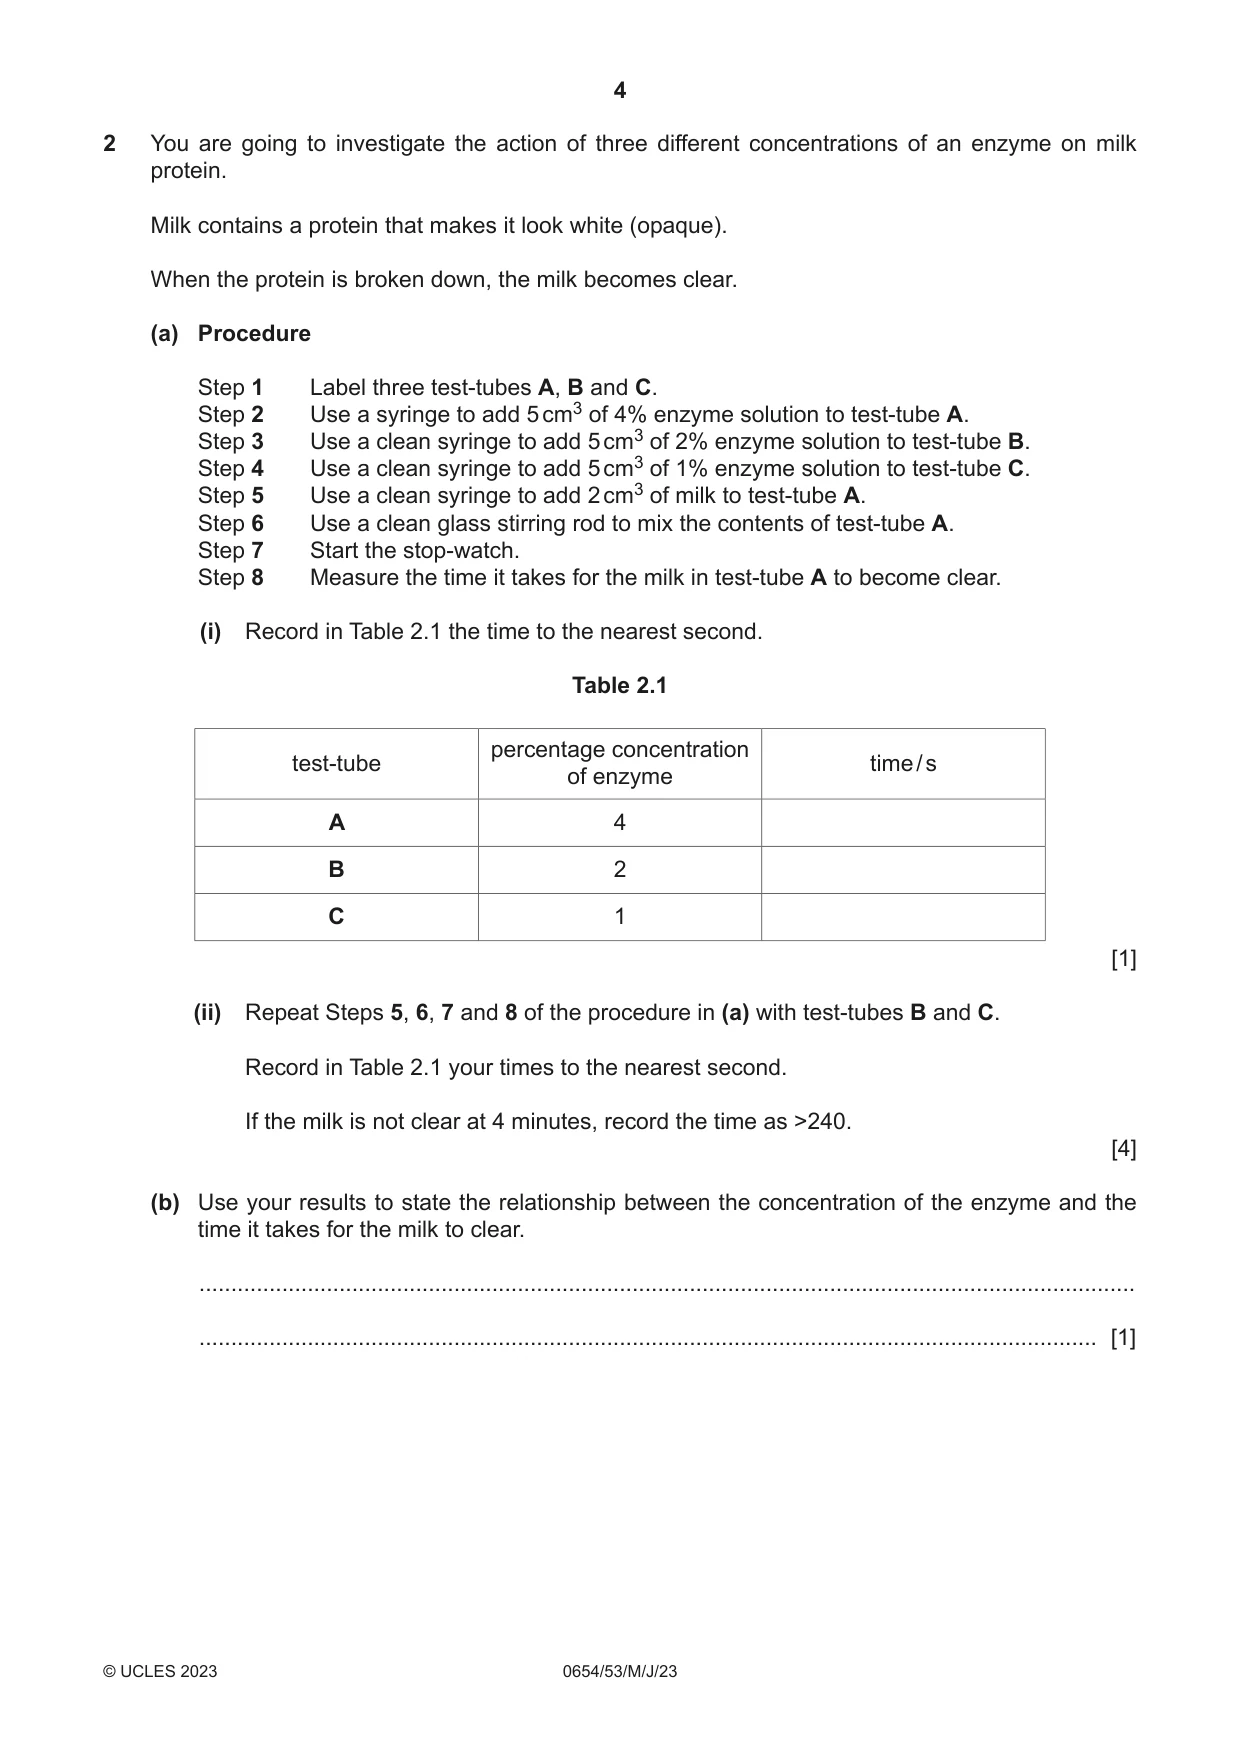
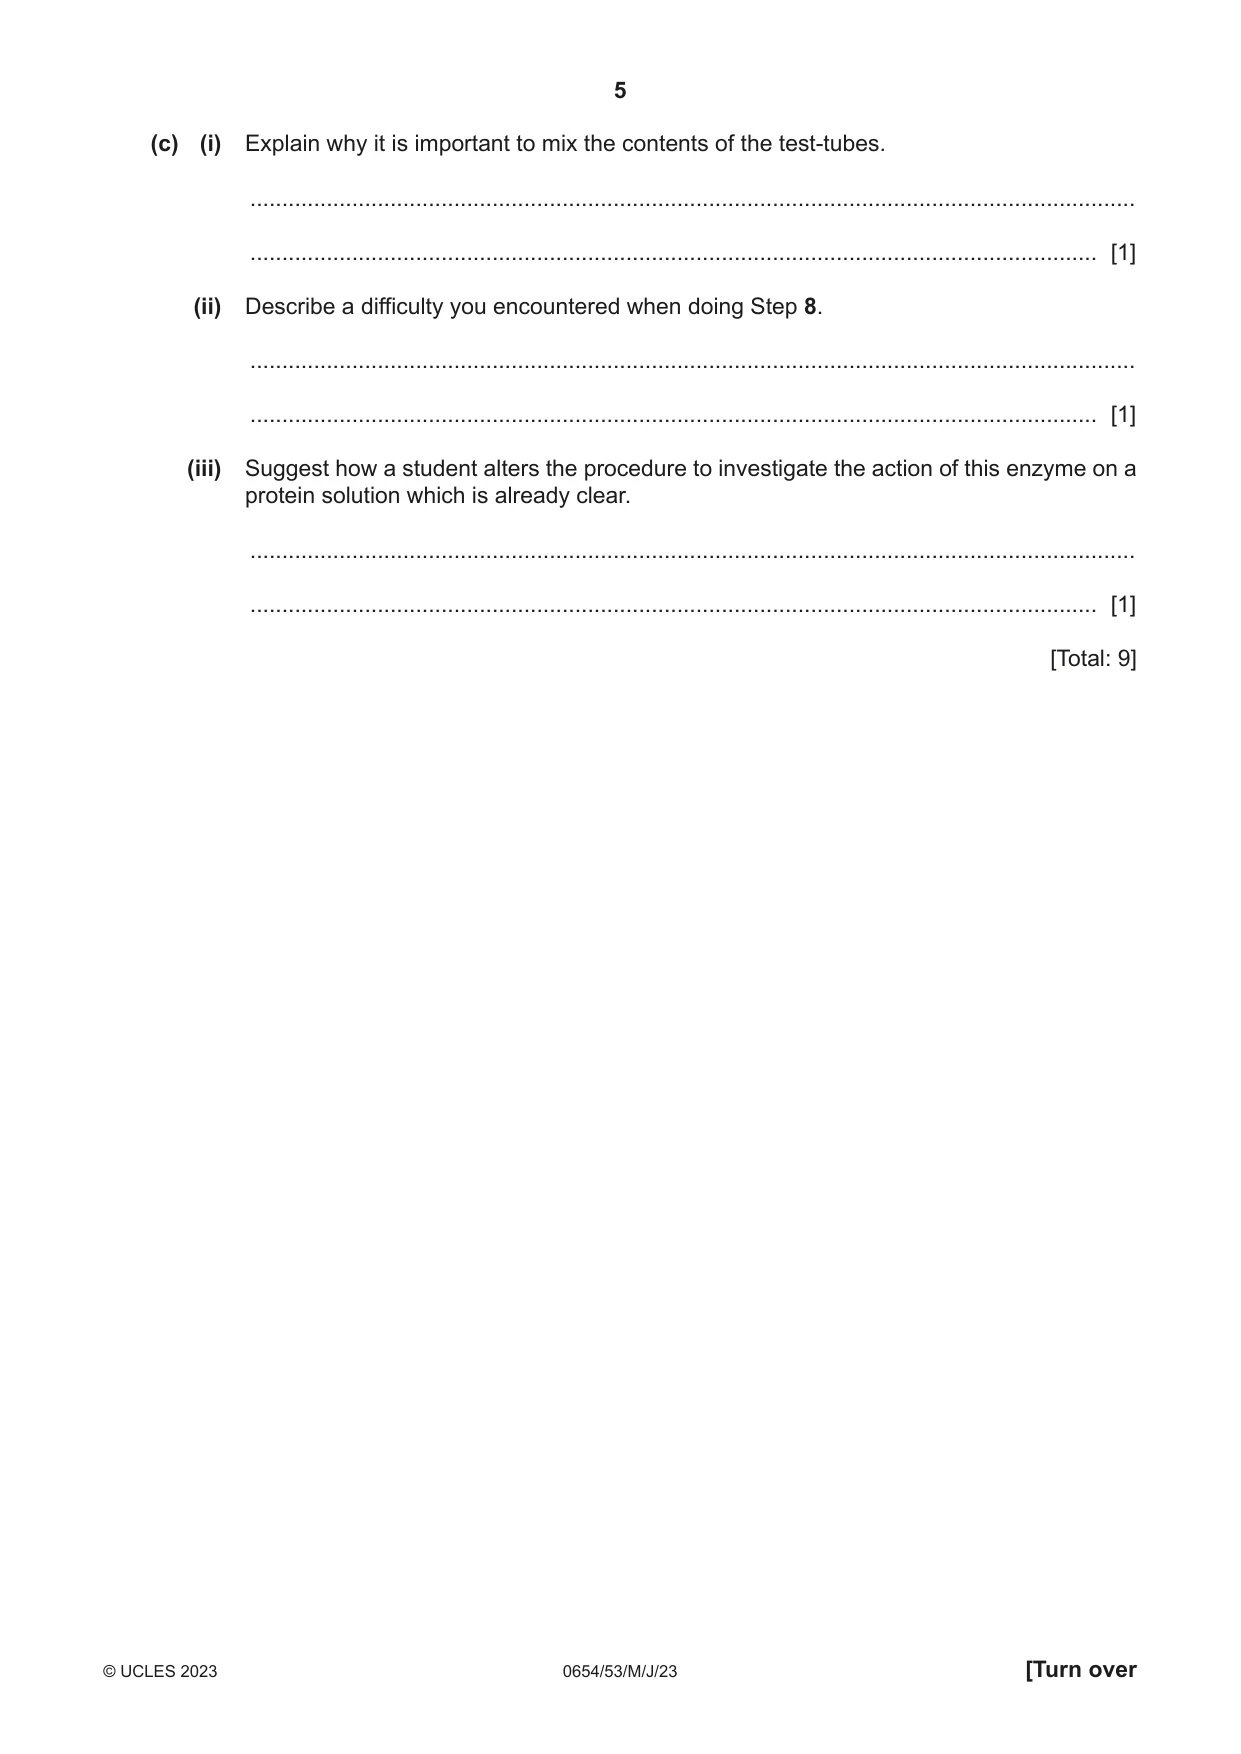
2 You are going to investigate the action of three different concentrations of an enzyme on milk protein. Milk contains a protein that makes it look white (opaque). When the protein is broken down, the milk becomes clear. (a) Procedure Step 1 Label three test-tubes A, B and C. Step 2 Use a syringe to add 5 cm3 of 4% enzyme solution to test-tube A. Step 3 Use a clean syringe to add 5 cm3 of 2% enzyme solution to test-tube B. Step 4 Use a clean syringe to add 5 cm3 of 1% enzyme solution to test-tube C. Step 5 Use a clean syringe to add 2 cm3 of milk to test-tube A. Step 6 Use a clean glass stirring rod to mix the contents of test-tube A. Step 7 Start the stop-watch. Step 8 Measure the time it takes for the milk in test-tube A to become clear. (i) Record in Table 2.1 the time to the nearest second. Table 2.1 percentage concentration test-tube time / s of enzyme A 4 B 2 C 1 [1] (ii) Repeat Steps 5, 6, 7 and 8 of the procedure in (a) with test-tubes B and C. Record in Table 2.1 your times to the nearest second. If the milk is not clear at 4 minutes, record the time as >240. [4] (b) Use your results to state the relationship between the concentration of the enzyme and the time it takes for the milk to clear. ................................................................................................................................................... ............................................................................................................................................. [1] (c) (i) Explain why it is important to mix the contents of the test-tubes. ........................................................................................................................................... ..................................................................................................................................... [1] (ii) Describe a difficulty you encountered when doing Step 8. ........................................................................................................................................... ..................................................................................................................................... [1] (iii) Suggest how a student alters the procedure to investigate the action of this enzyme on a protein solution which is already clear. ........................................................................................................................................... ..................................................................................................................................... [1] [Total: 9]
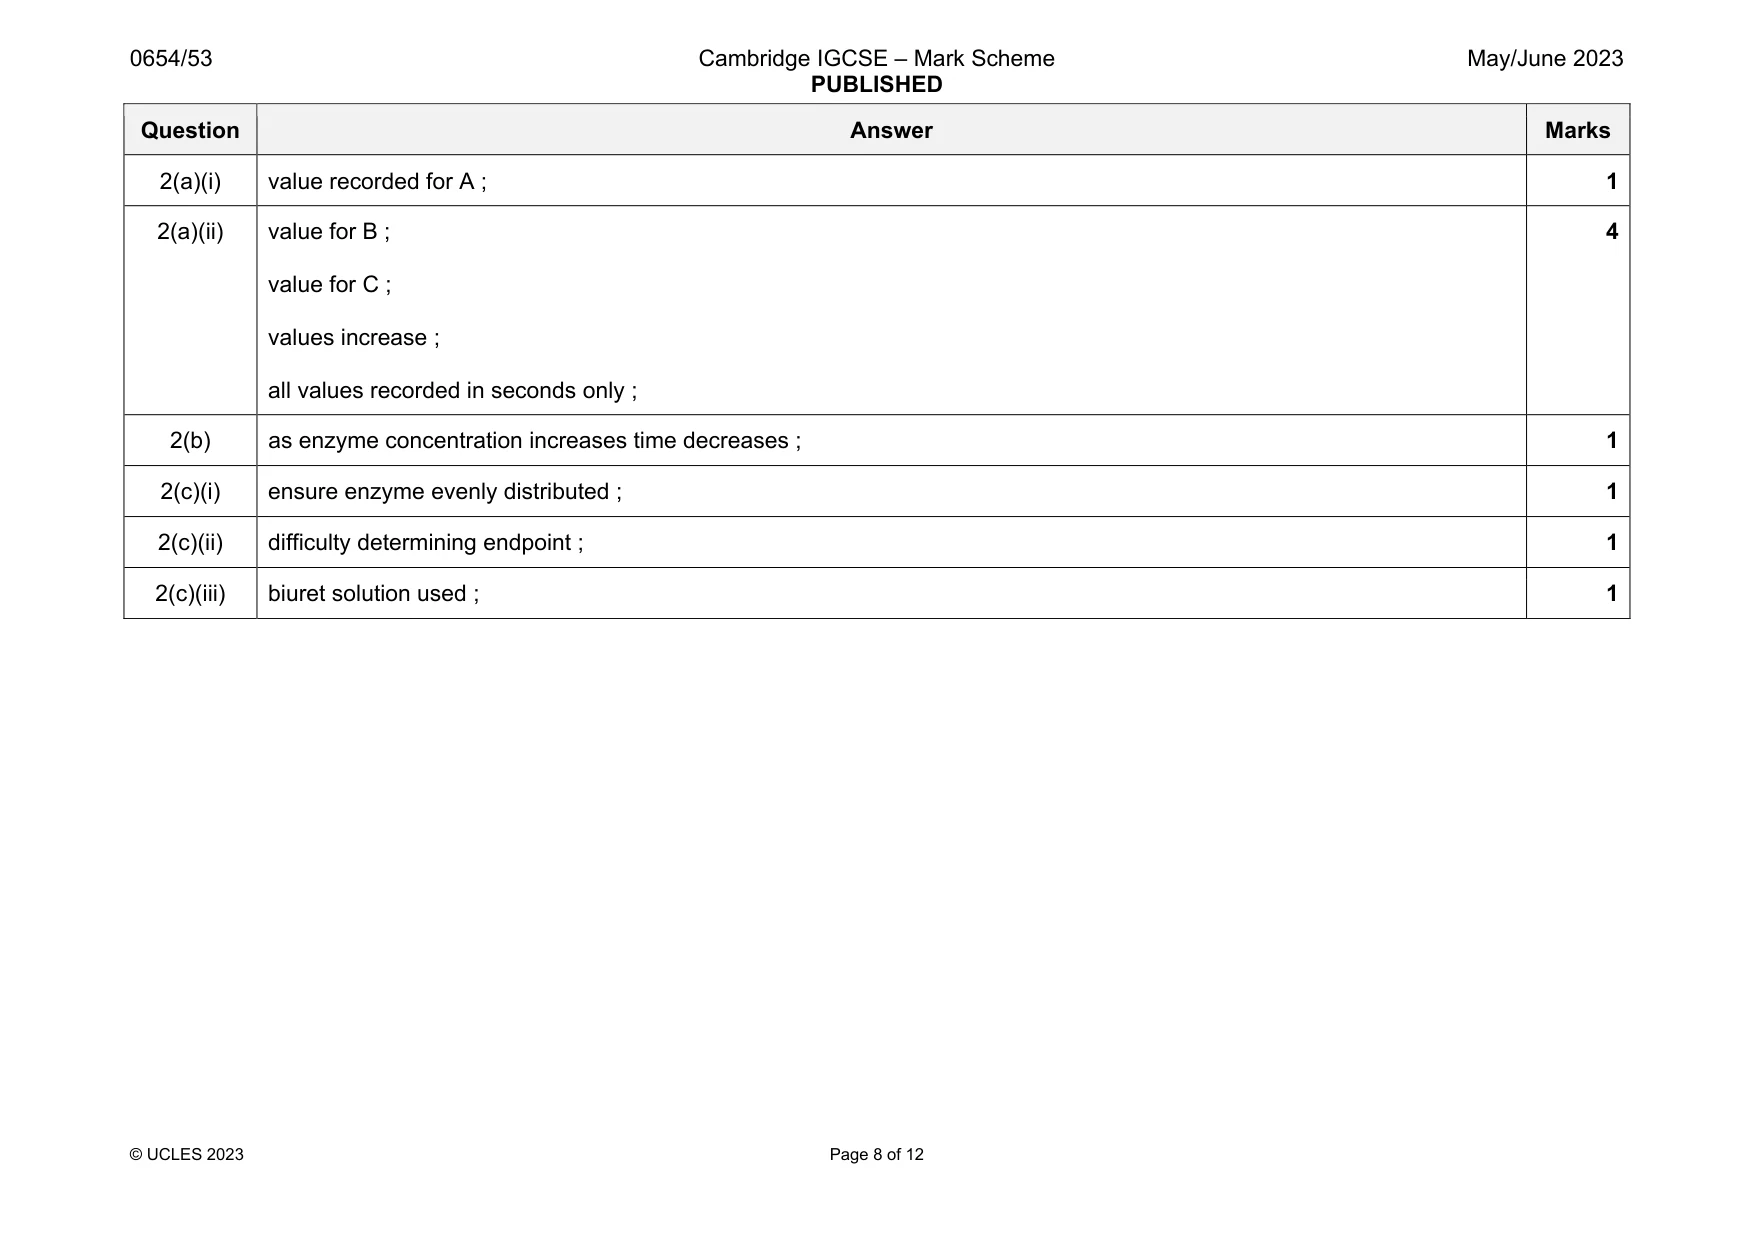
Mark scheme: 2(a)(i) value recorded for A ; 1 2(a)(ii) value for B ; value for C ; values increase ; all values recorded in seconds only ; 4 2(b) as enzyme concentration increases time decreases ; 1 2(c)(i) ensure enzyme evenly distributed ; 1 2(c)(ii) difficulty determining endpoint ; 1 2(c)(iii) biuret solution used ; 1
Q3 · You are going to investigate the rate of reaction between solution H and solution K
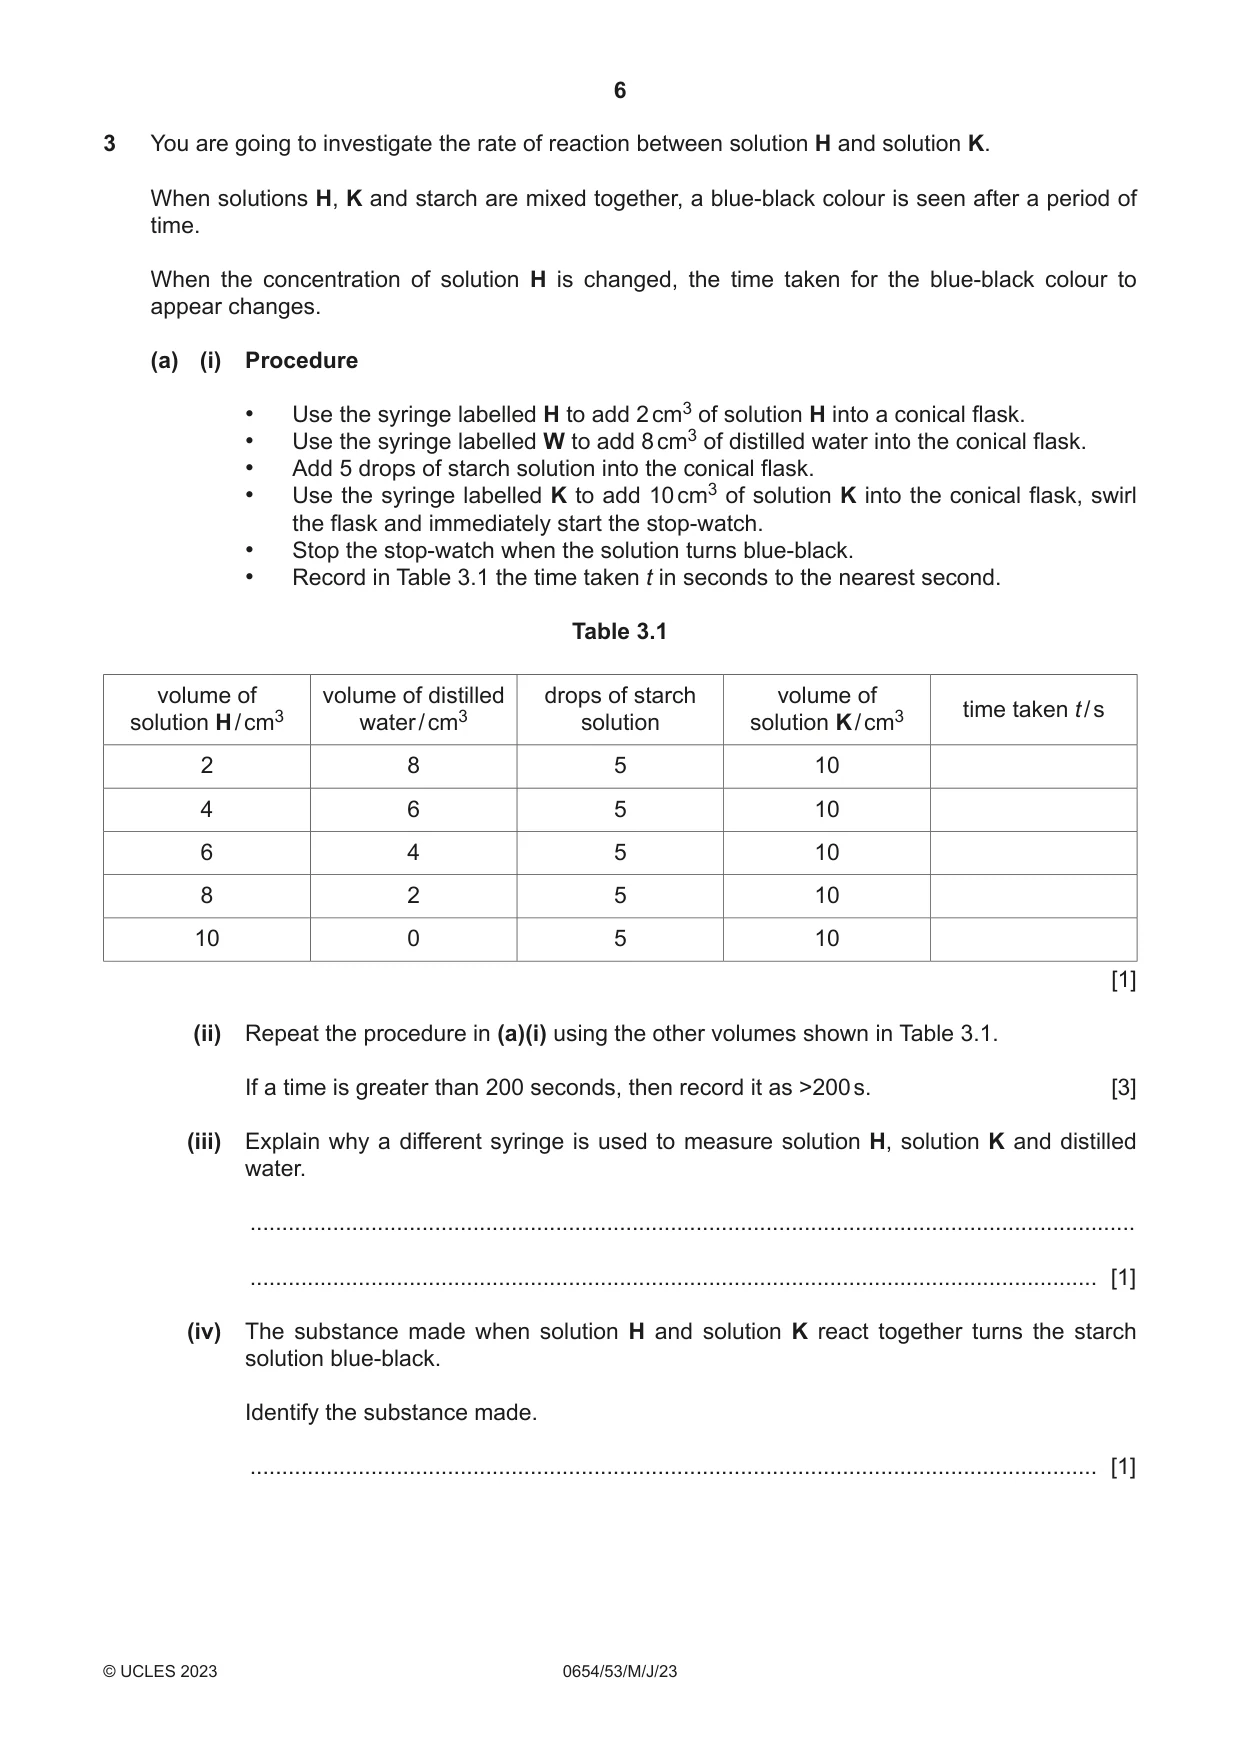
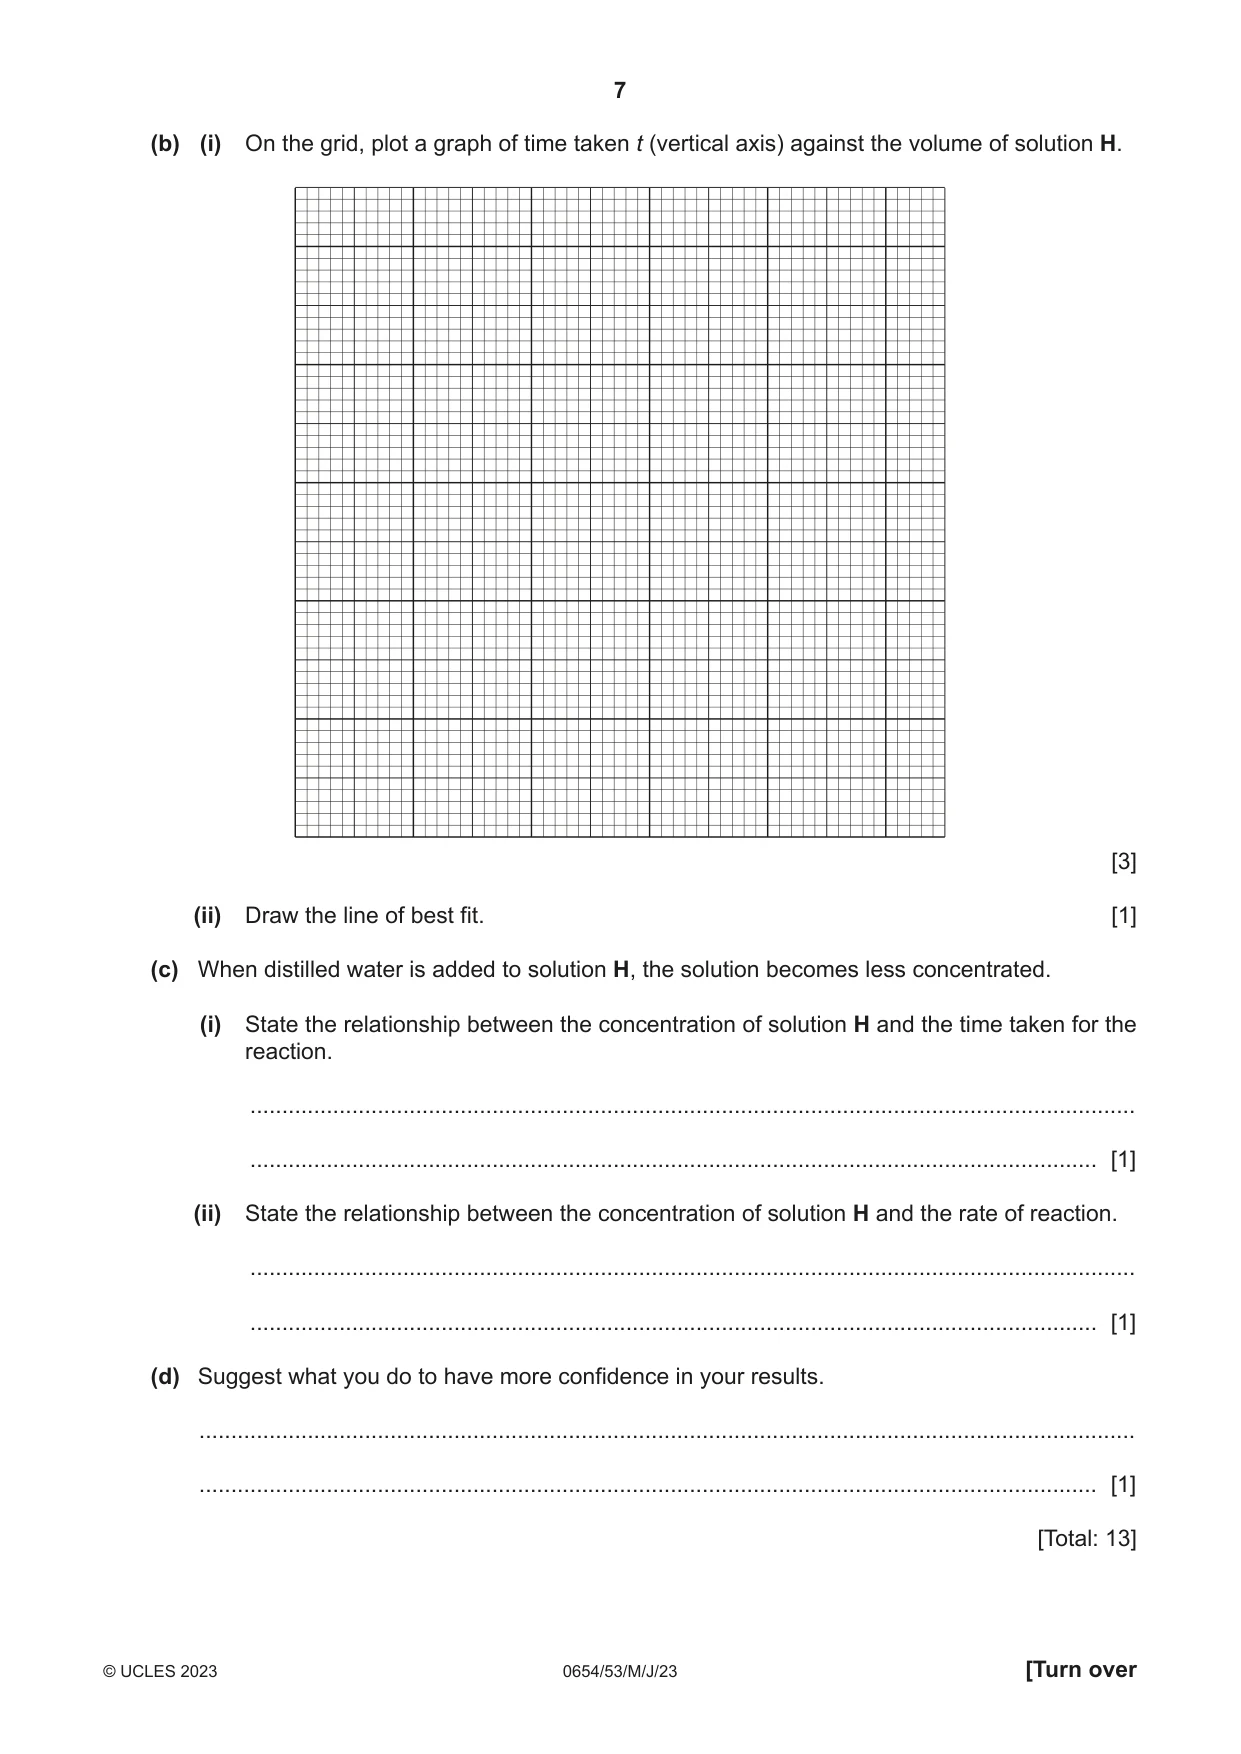
3 You are going to investigate the rate of reaction between solution H and solution K. When solutions H, K and starch are mixed together, a blue-black colour is seen after a period of time. When the concentration of solution H is changed, the time taken for the blue-black colour to appear changes. (a) (i) Procedure • Use the syringe labelled H to add 2 cm3 of solution H into a conical flask. • Use the syringe labelled W to add 8 cm3 of distilled water into the conical flask. • Add 5 drops of starch solution into the conical flask. • Use the syringe labelled K to add 10 cm3 of solution K into the conical flask, swirl the flask and immediately start the stop-watch. • Stop the stop-watch when the solution turns blue-black. • Record in Table 3.1 the time taken t in seconds to the nearest second. Table 3.1 volume of volume of distilled drops of starch volume of time taken t / s solution H / cm3 water / cm3 solution solution K / cm3 2 8 5 10 4 6 5 10 6 4 5 10 8 2 5 10 10 0 5 10 [1] (ii) Repeat the procedure in (a)(i) using the other volumes shown in Table 3.1. If a time is greater than 200 seconds, then record it as >200 s. [3] (iii) Explain why a different syringe is used to measure solution H, solution K and distilled water. ........................................................................................................................................... ..................................................................................................................................... [1] (iv) The substance made when solution H and solution K react together turns the starch solution blue-black. Identify the substance made. ..................................................................................................................................... [1] (b) (i) On the grid, plot a graph of time taken t (vertical axis) against the volume of solution H. [3] (ii) Draw the line of best fit. [1] (c) When distilled water is added to solution H, the solution becomes less concentrated. (i) State the relationship between the concentration of solution H and the time taken for the reaction. ........................................................................................................................................... ..................................................................................................................................... [1] (ii) State the relationship between the concentration of solution H and the rate of reaction. ........................................................................................................................................... ..................................................................................................................................... [1] (d) Suggest what you do to have more confidence in your results. ................................................................................................................................................... ............................................................................................................................................. [1] [Total: 13]
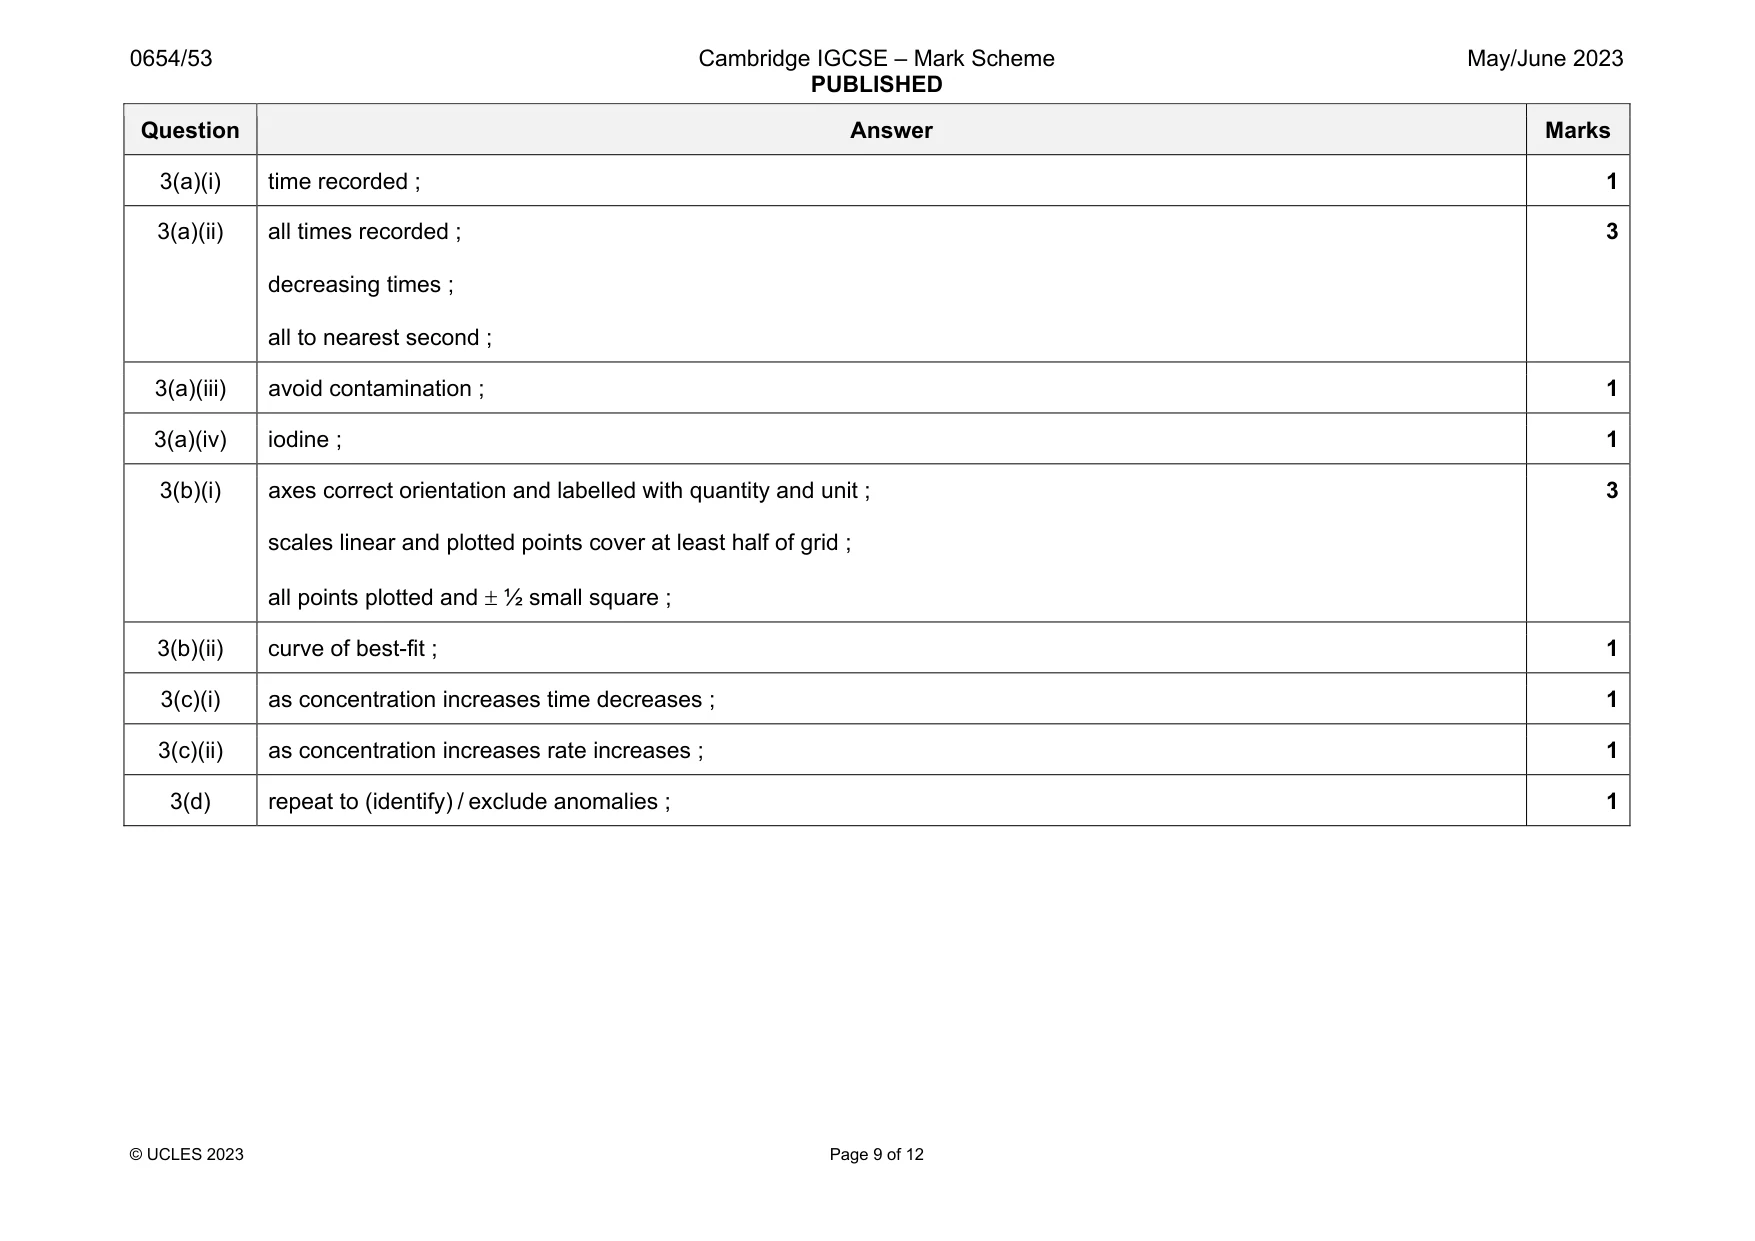
Mark scheme: 3(a)(i) time recorded ; 1 3(a)(ii) all times recorded ; decreasing times ; all to nearest second ; 3 3(a)(iii) avoid contamination ; 1 3(a)(iv) iodine ; 1 3(b)(i) axes correct orientation and labelled with quantity and unit ; scales linear and plotted points cover at least half of grid ; all points plotted and ½ small square ; 3 3(b)(ii) curve of best-fit ; 1 3(c)(i) as concentration increases time decreases ; 1 3(c)(ii) as concentration increases rate increases ; 1 3(d) repeat to (identify) / exclude anomalies ; 1
Q4 · You are going to identify solution L
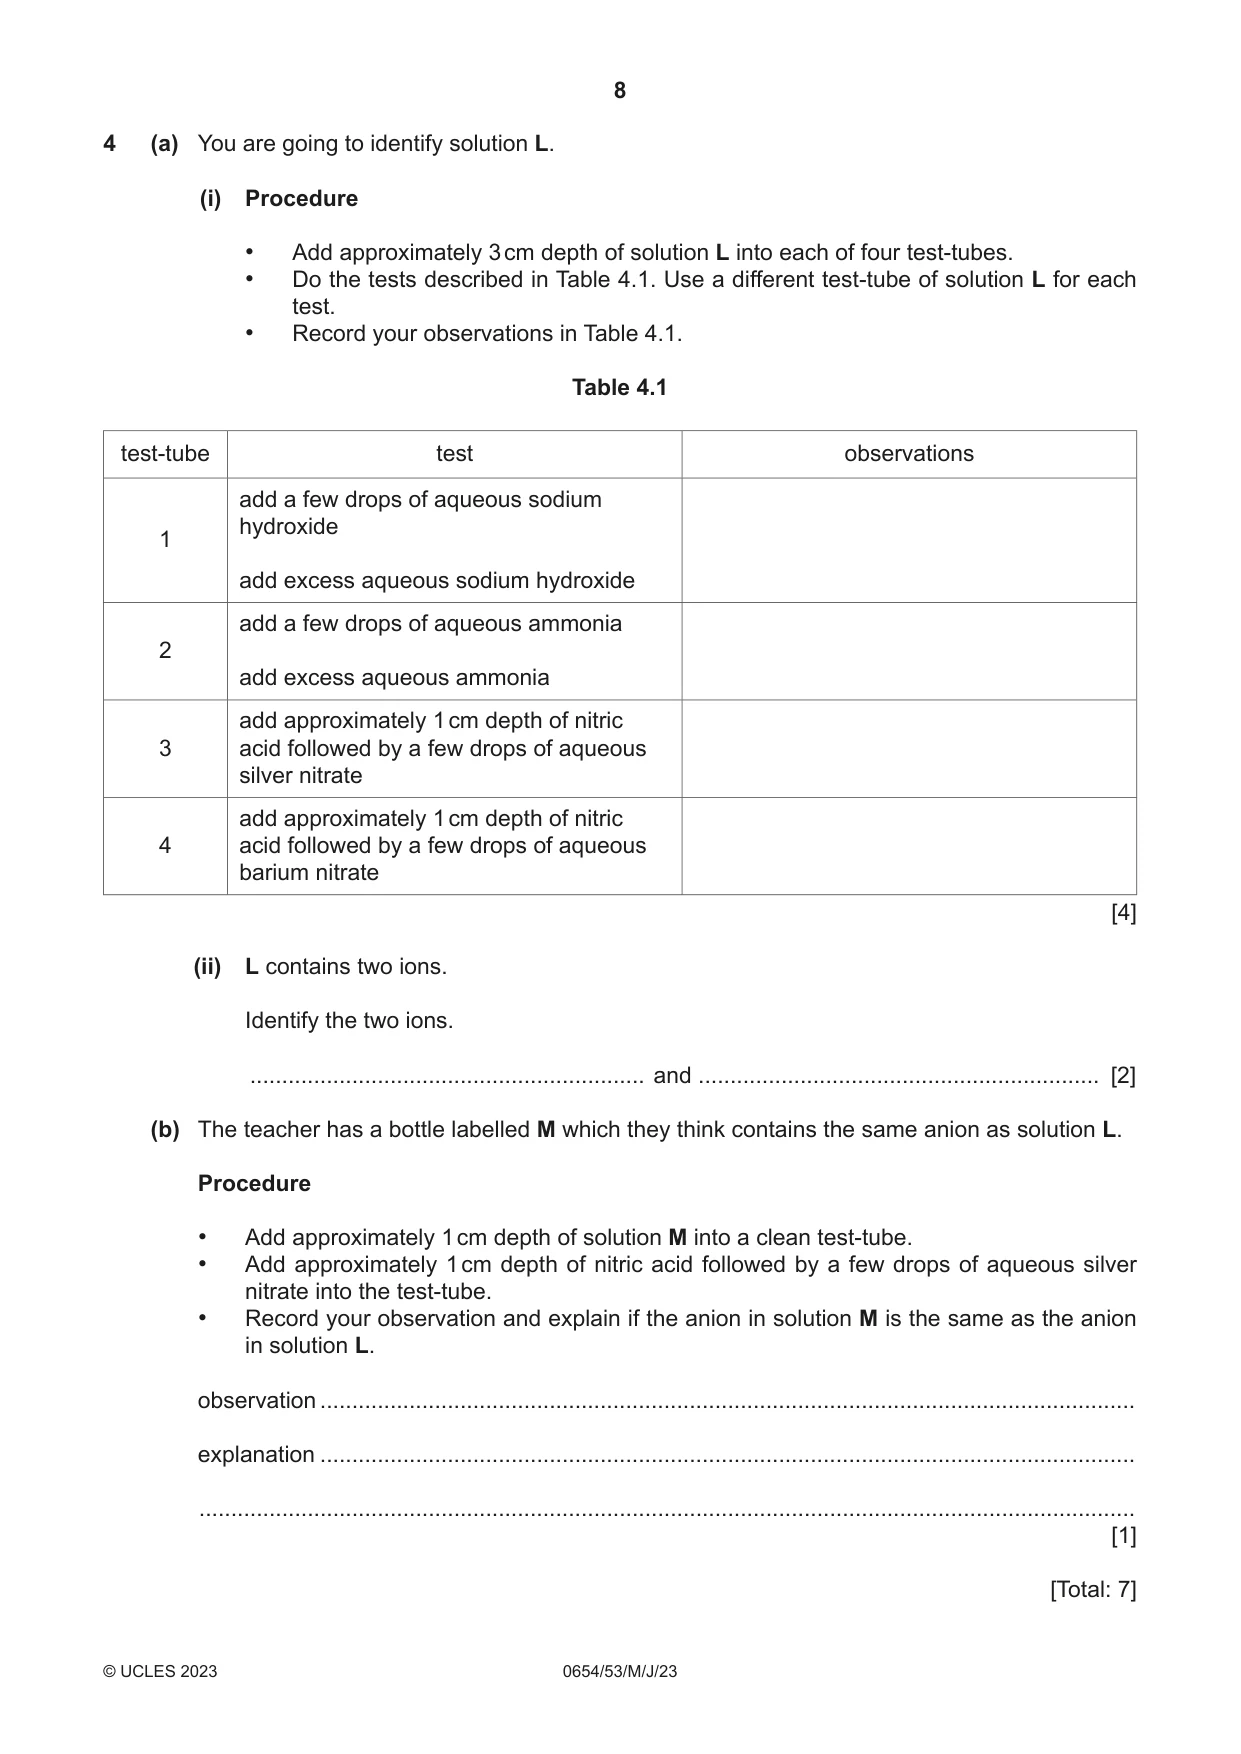
4 (a) You are going to identify solution L. (i) Procedure • Add approximately 3 cm depth of solution L into each of four test-tubes. • Do the tests described in Table 4.1. Use a different test-tube of solution L for each test. • Record your observations in Table 4.1. Table 4.1 test-tube test observations add a few drops of aqueous sodium hydroxide 1 add excess aqueous sodium hydroxide add a few drops of aqueous ammonia 2 add excess aqueous ammonia add approximately 1 cm depth of nitric 3 acid followed by a few drops of aqueous silver nitrate add approximately 1 cm depth of nitric 4 acid followed by a few drops of aqueous barium nitrate [4] (ii) L contains two ions. Identify the two ions. .............................................................. and ............................................................... [2] (b) The teacher has a bottle labelled M which they think contains the same anion as solution L. Procedure • Add approximately 1 cm depth of solution M into a clean test-tube. • Add approximately 1 cm depth of nitric acid followed by a few drops of aqueous silver nitrate into the test-tube. • Record your observation and explain if the anion in solution M is the same as the anion in solution L. observation ................................................................................................................................ explanation ................................................................................................................................ ................................................................................................................................................... [1] [Total: 7]
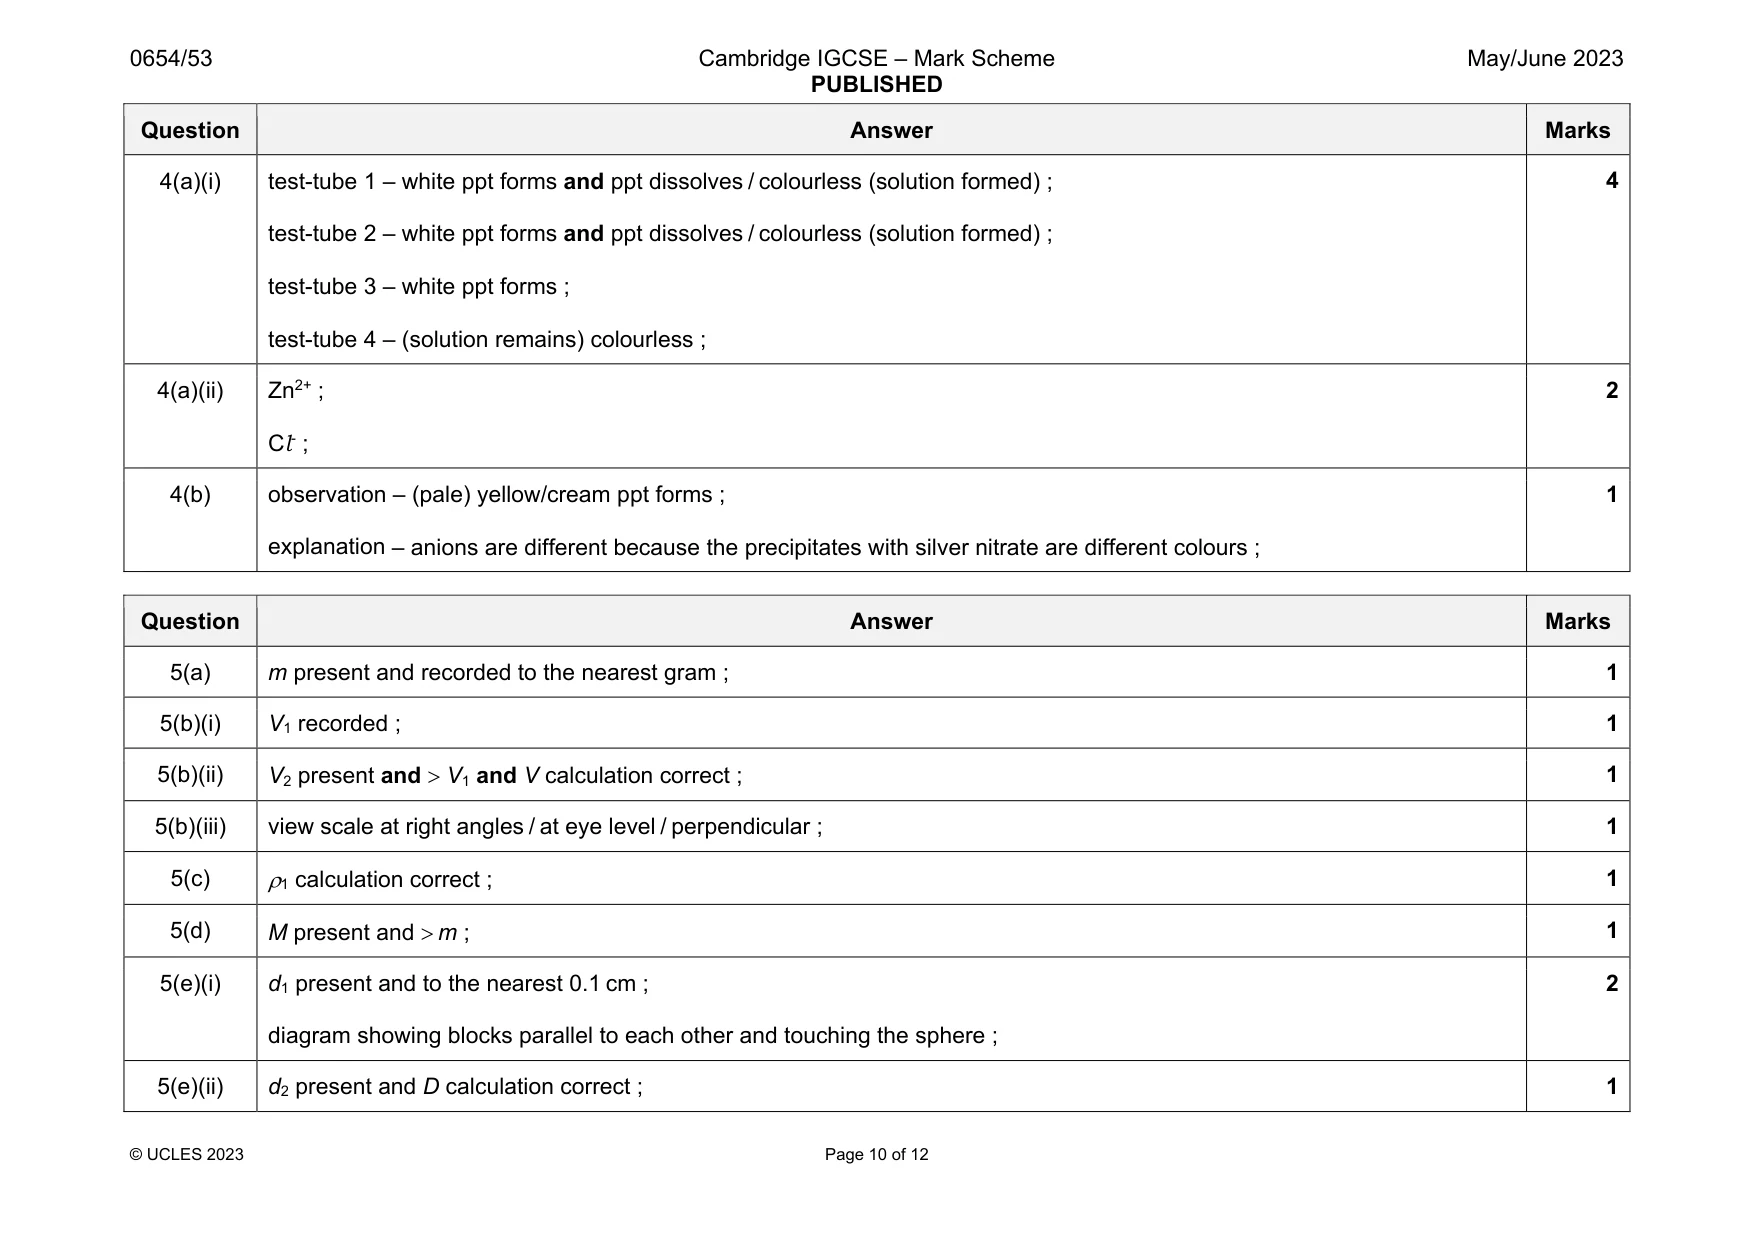
Mark scheme: 4(a)(i) test-tube 1 – white ppt forms and ppt dissolves / colourless (solution formed) ; test-tube 2 – white ppt forms and ppt dissolves / colourless (solution formed) ; test-tube 3 – white ppt forms ; test-tube 4 – (solution remains) colourless ; 4(a)(ii) Zn2+ ; Cl- ; 2 4(b) observation – (pale) yellow/cream ppt forms ; explanation – anions are different because the precipitates with silver nitrate are different colours ; 1
Q5 · You are going to measure the density of plasticine (modelling clay) by two different…
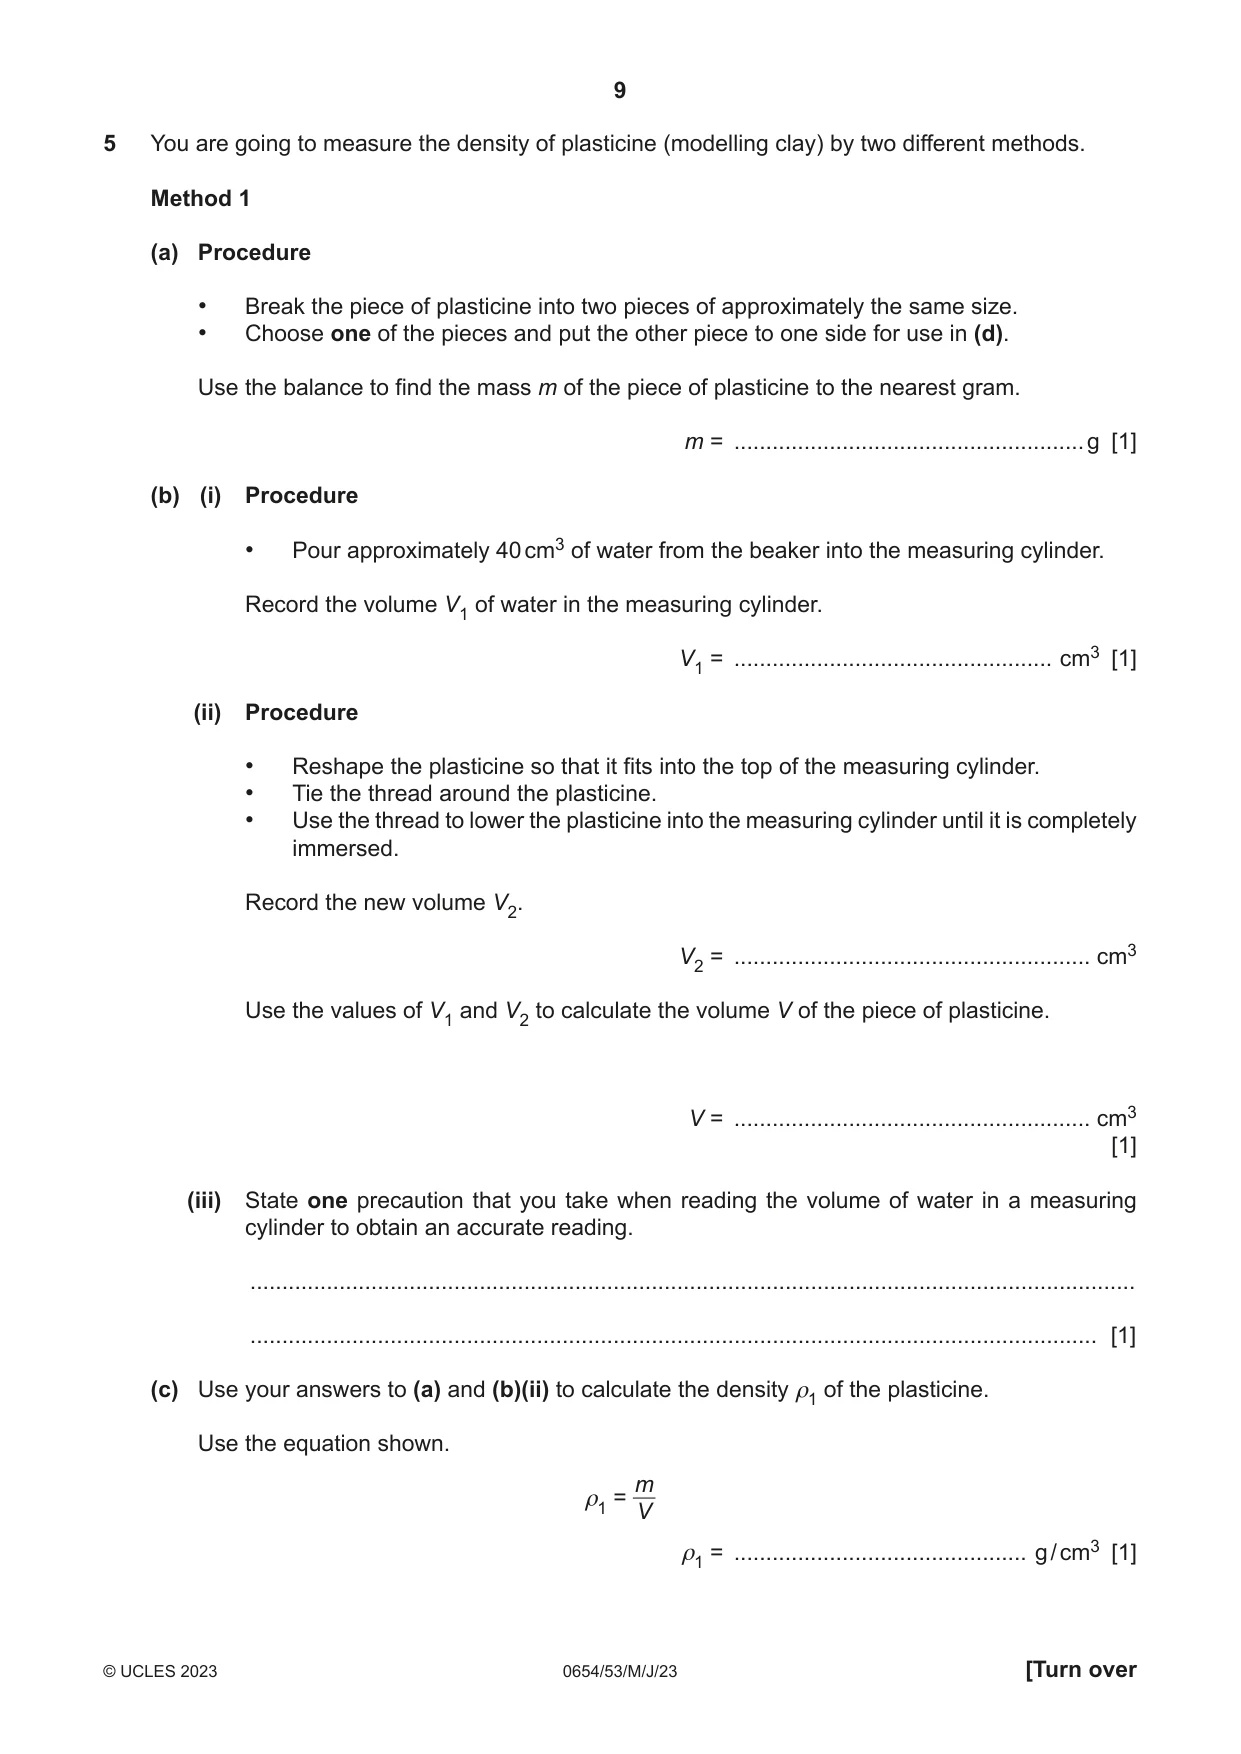
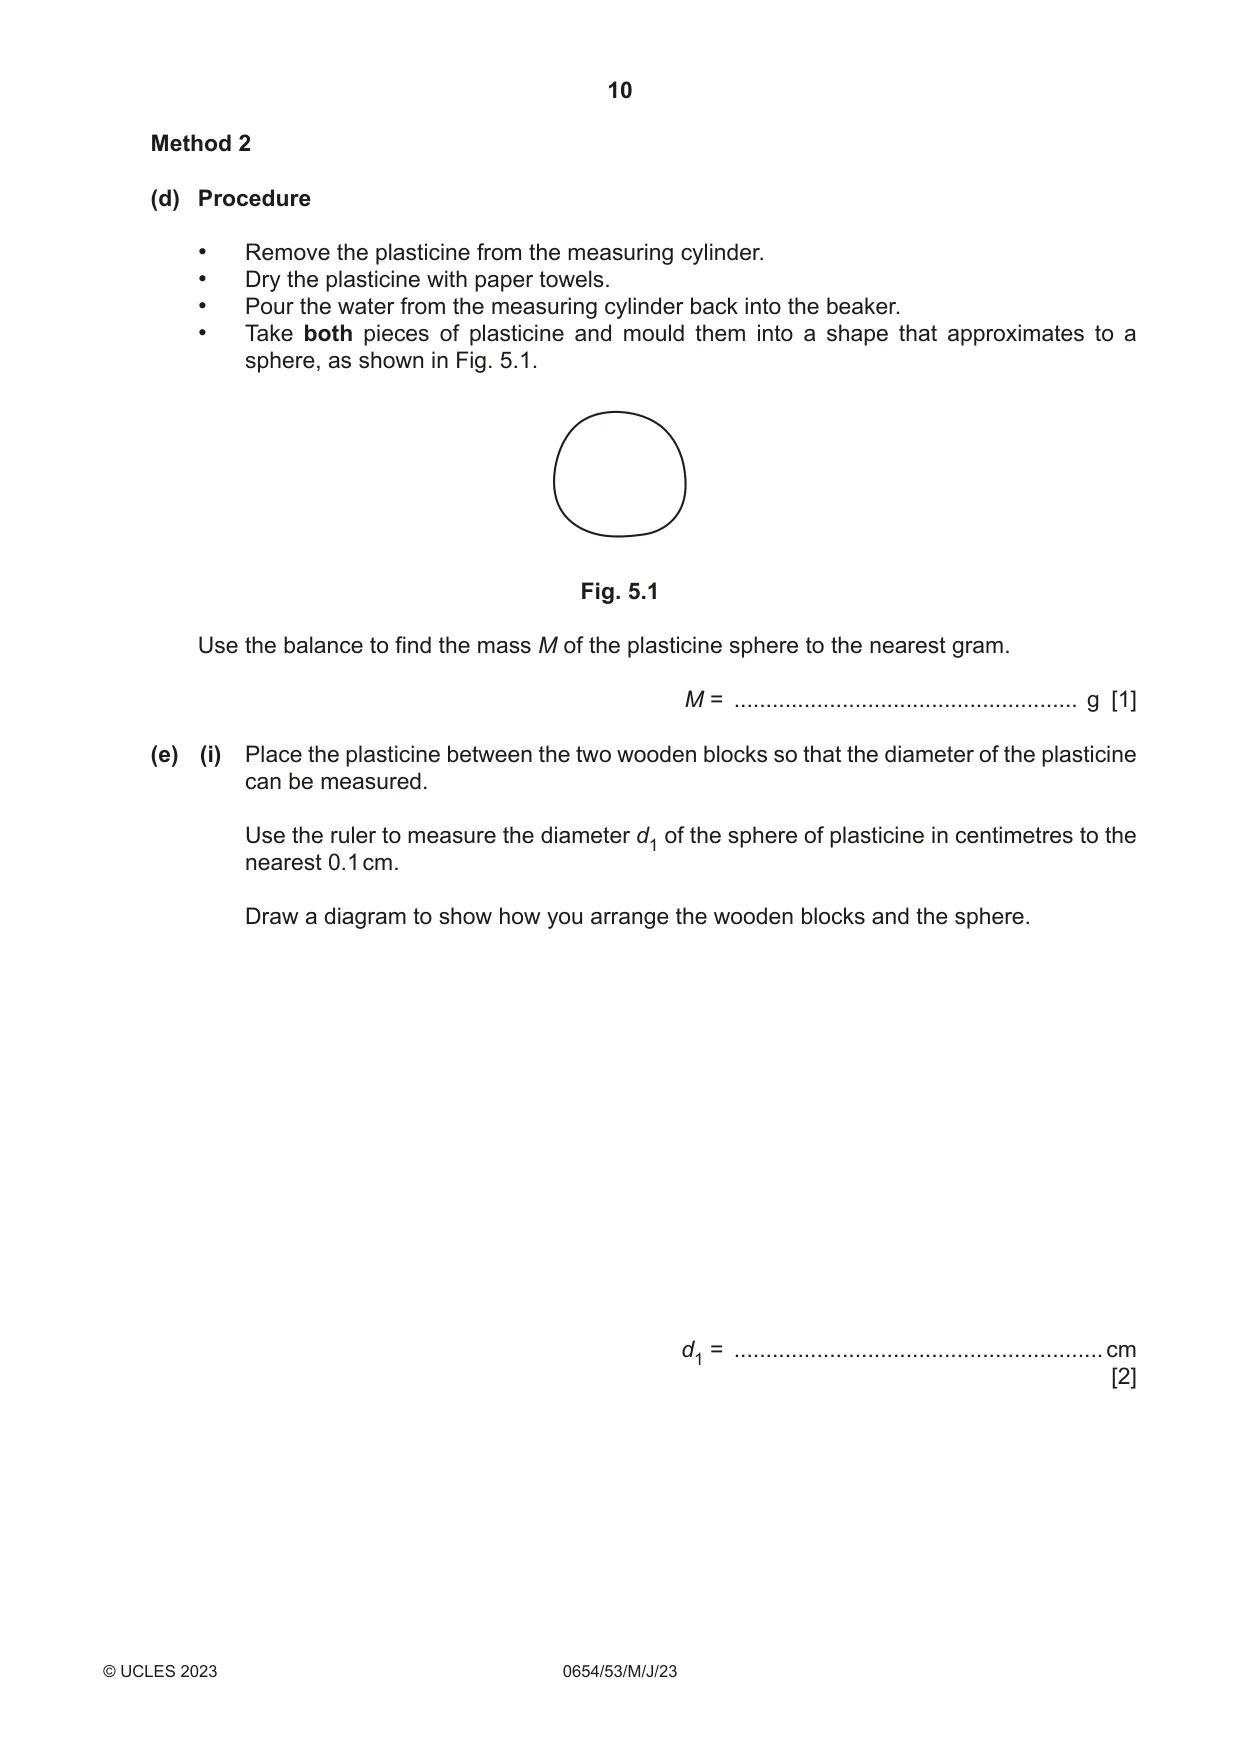
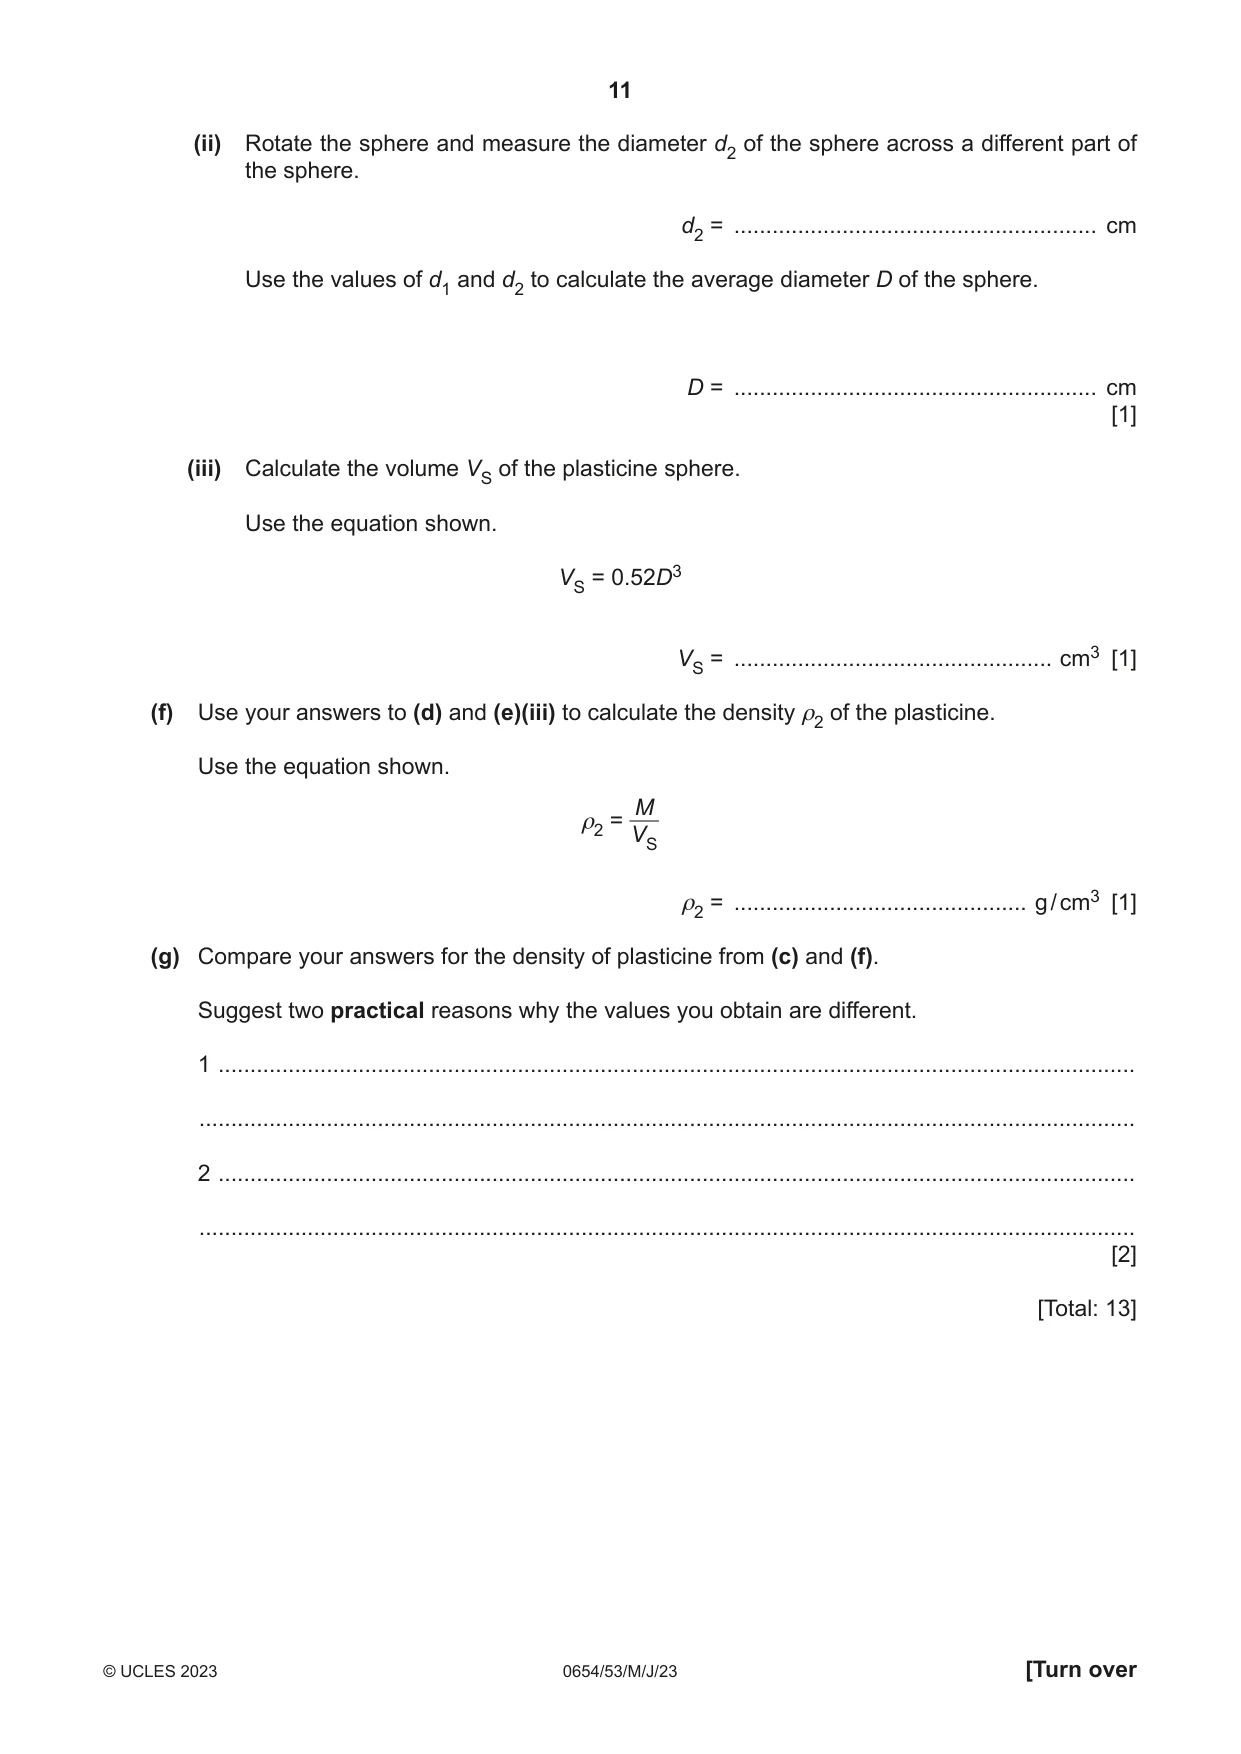
5 You are going to measure the density of plasticine (modelling clay) by two different methods. Method 1 (a) Procedure • Break the piece of plasticine into two pieces of approximately the same size. • Choose one of the pieces and put the other piece to one side for use in (d). Use the balance to find the mass m of the piece of plasticine to the nearest gram. m = ....................................................... g [1] (b) (i) Procedure • Pour approximately 40 cm3 of water from the beaker into the measuring cylinder. Record the volume V1 of water in the measuring cylinder. V1 = .................................................. cm3 [1] (ii) Procedure • Reshape the plasticine so that it fits into the top of the measuring cylinder. • Tie the thread around the plasticine. • Use the thread to lower the plasticine into the measuring cylinder until it is completely immersed. Record the new volume V2. V2 = ........................................................ cm3 Use the values of V1 and V2 to calculate the volume V of the piece of plasticine. V = ........................................................ cm3 [1] (iii) State one precaution that you take when reading the volume of water in a measuring cylinder to obtain an accurate reading. ........................................................................................................................................... ..................................................................................................................................... [1] (c) Use your answers to (a) and (b)(ii) to calculate the density ρ1 of the plasticine. Use the equation shown. m ρ1 = V ρ1 = .............................................. g / cm3 [1] Method 2 (d) Procedure • Remove the plasticine from the measuring cylinder. • Dry the plasticine with paper towels. • Pour the water from the measuring cylinder back into the beaker. • Take both pieces of plasticine and mould them into a shape that approximates to a sphere, as shown in Fig. 5.1. Fig. 5.1 Use the balance to find the mass M of the plasticine sphere to the nearest gram. M = ...................................................... g [1] (e) (i) Place the plasticine between the two wooden blocks so that the diameter of the plasticine can be measured. Use the ruler to measure the diameter d1 of the sphere of plasticine in centimetres to the nearest 0.1 cm. Draw a diagram to show how you arrange the wooden blocks and the sphere. d1 = .......................................................... cm [2] (ii) Rotate the sphere and measure the diameter d2 of the sphere across a different part of the sphere. d2 = ......................................................... cm Use the values of d1 and d2 to calculate the average diameter D of the sphere. D = ......................................................... cm [1] (iii) Calculate the volume VS of the plasticine sphere. Use the equation shown. VS = 0.52D3 VS = .................................................. cm3 [1] (f) Use your answers to (d) and (e)(iii) to calculate the density ρ2 of the plasticine. Use the equation shown. M ρ2 = VS ρ2 = .............................................. g / cm3 [1] (g) Compare your answers for the density of plasticine from (c) and (f). Suggest two practical reasons why the values you obtain are different. 1 ................................................................................................................................................ ................................................................................................................................................... 2 ................................................................................................................................................ ................................................................................................................................................... [2] [Total: 13]
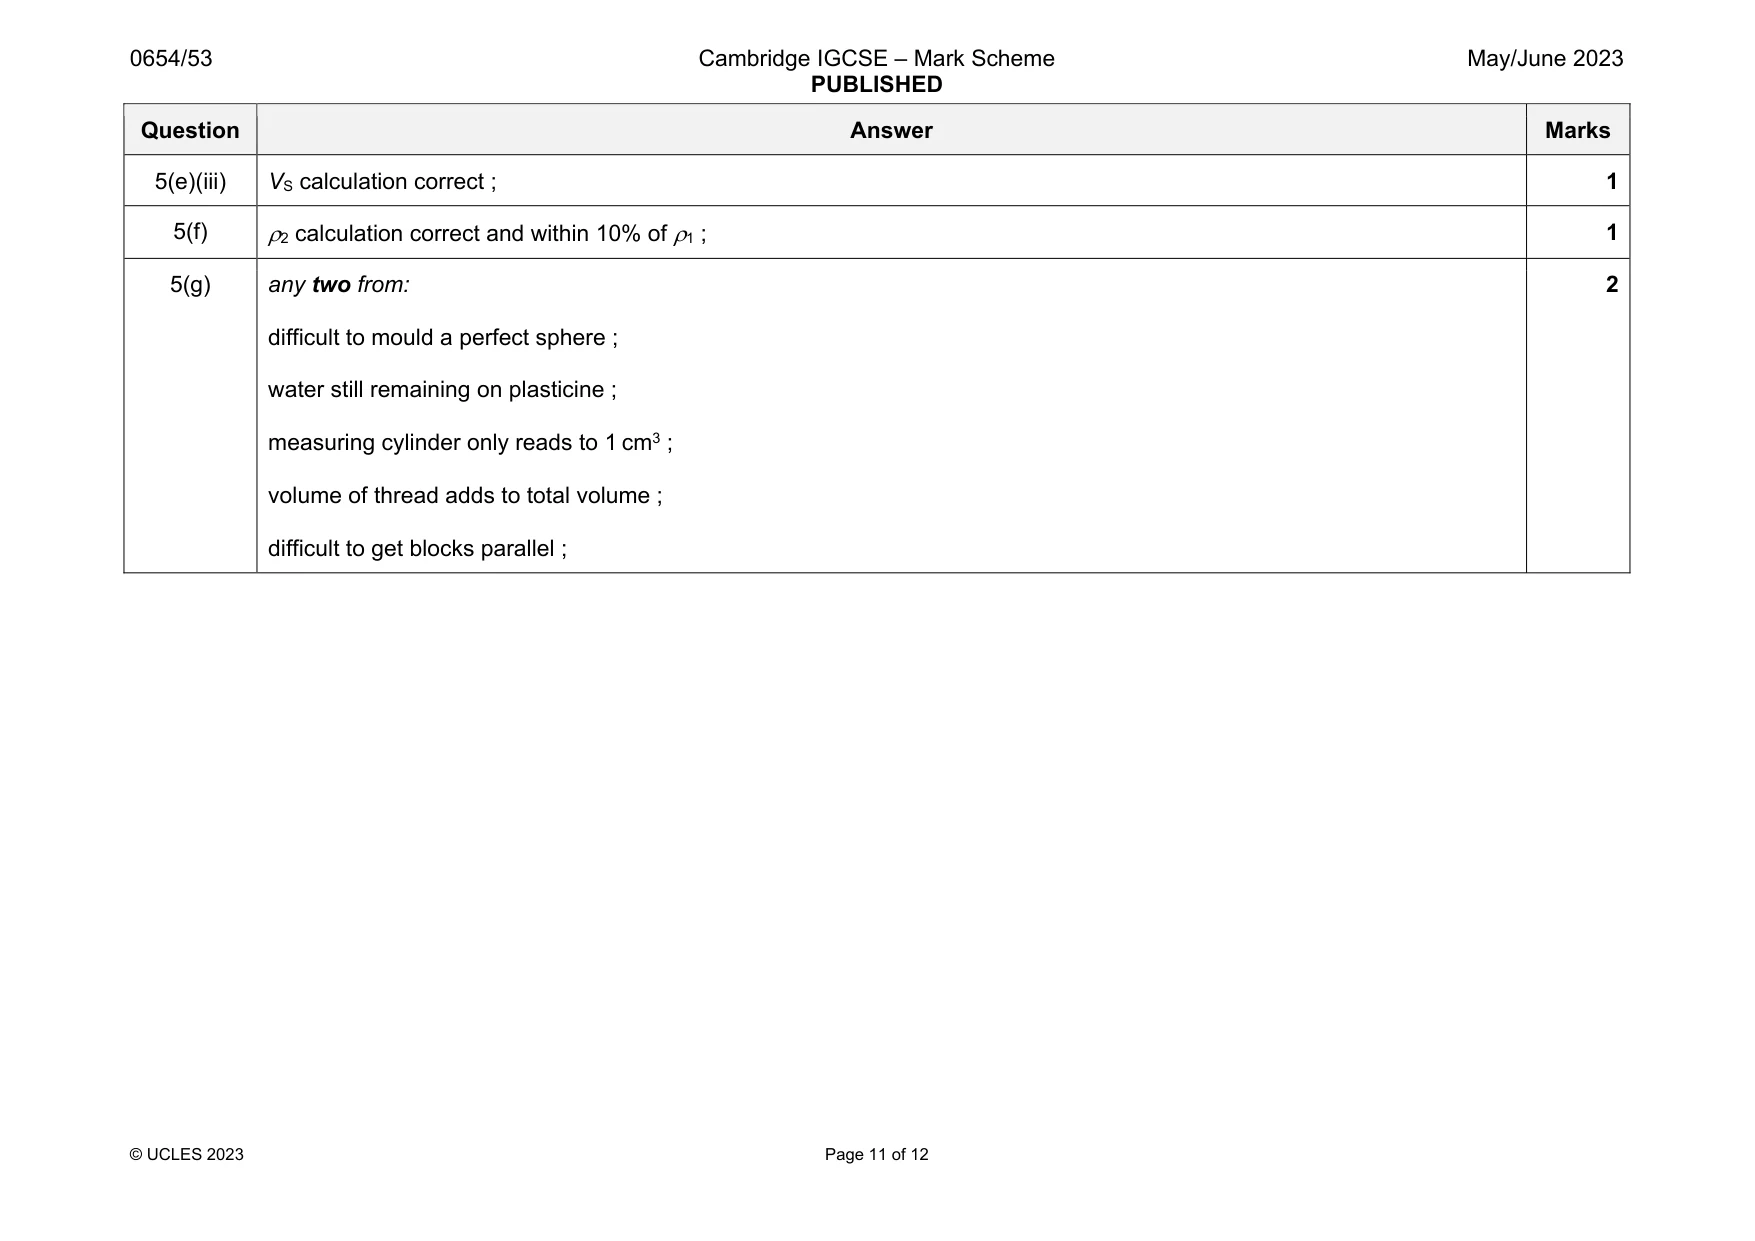
Mark scheme: 5(a) m present and recorded to the nearest gram ; 1 5(b)(i) V1 recorded ; 1 5(b)(ii) V2 present and V1 and V calculation correct ; 1 5(b)(iii) view scale at right angles / at eye level / perpendicular ; 1 5(c) 1 calculation correct ; 1 5(d) M present and m ; 1 5(e)(i) d1 present and to the nearest 0.1 cm ; diagram showing blocks parallel to each other and touching the sphere ; 2 5(e)(ii) d2 present and D calculation correct ; 1 Question Answer Marks 5(e)(iii) VS calculation correct ; 1 5(f) 2 calculation correct and within 10% of 1 ; 1 5(g) any two from: difficult to mould a perfect sphere ; water still remaining on plasticine ; measuring cylinder only reads to 1 cm3 ; volume of thread adds to total volume ; difficult to get blocks parallel ; 2
Q6 · Plan an investigation to find out if the material from which a spring is made affects the…
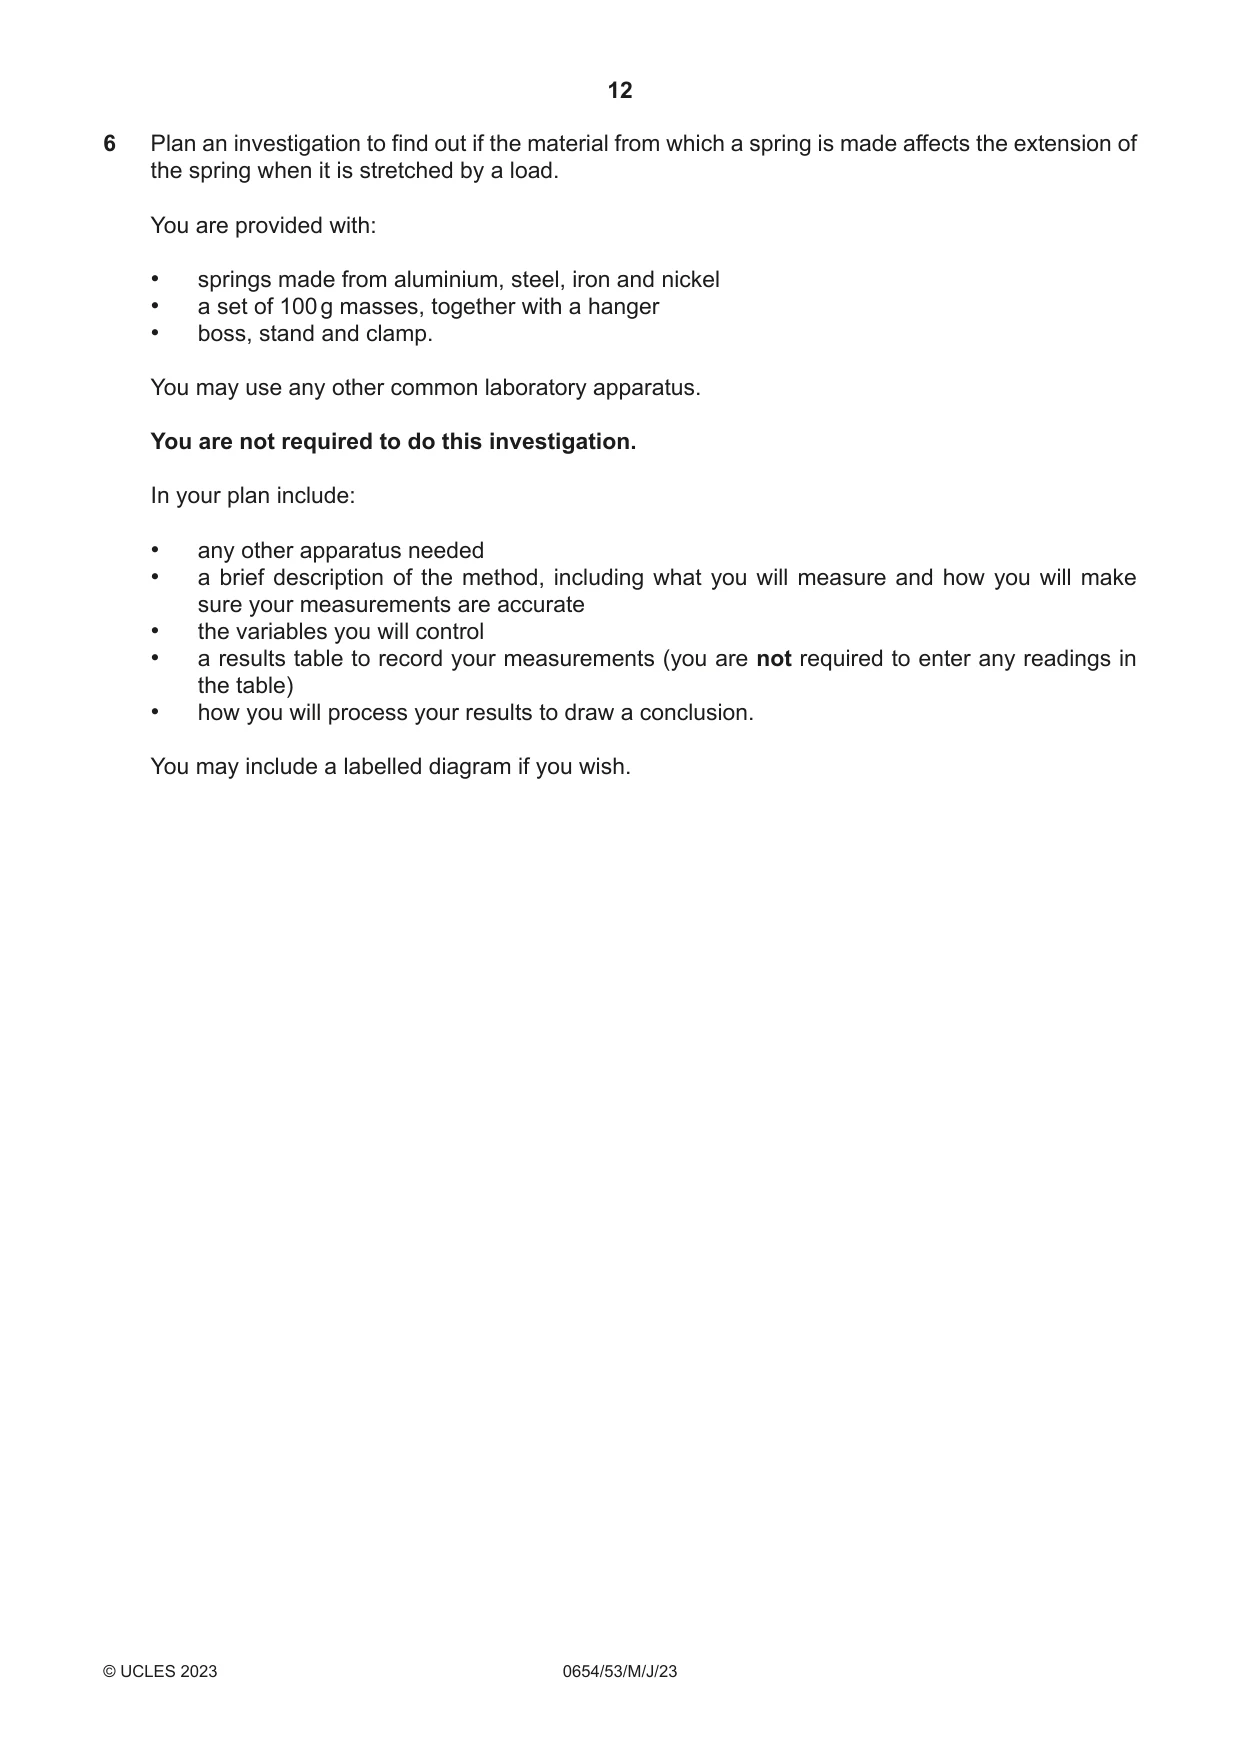
6 Plan an investigation to find out if the material from which a spring is made affects the extension of the spring when it is stretched by a load. You are provided with: • springs made from aluminium, steel, iron and nickel • a set of 100 g masses, together with a hanger • boss, stand and clamp. You may use any other common laboratory apparatus. You are not required to do this investigation. In your plan include: • any other apparatus needed • a brief description of the method, including what you will measure and how you will make sure your measurements are accurate • the variables you will control • a results table to record your measurements (you are not required to enter any readings in the table) • how you will process your results to draw a conclusion. You may include a labelled diagram if you wish. .......................................................................................................................................................... .......................................................................................................................................................... .......................................................................................................................................................... .......................................................................................................................................................... .......................................................................................................................................................... .......................................................................................................................................................... .......................................................................................................................................................... .......................................................................................................................................................... .......................................................................................................................................................... .......................................................................................................................................................... .......................................................................................................................................................... .......................................................................................................................................................... .......................................................................................................................................................... .......................................................................................................................................................... .......................................................................................................................................................... .......................................................................................................................................................... .......................................................................................................................................................... .......................................................................................................................................................... .......................................................................................................................................................... .......................................................................................................................................................... .................................................................................................................................................... [7]
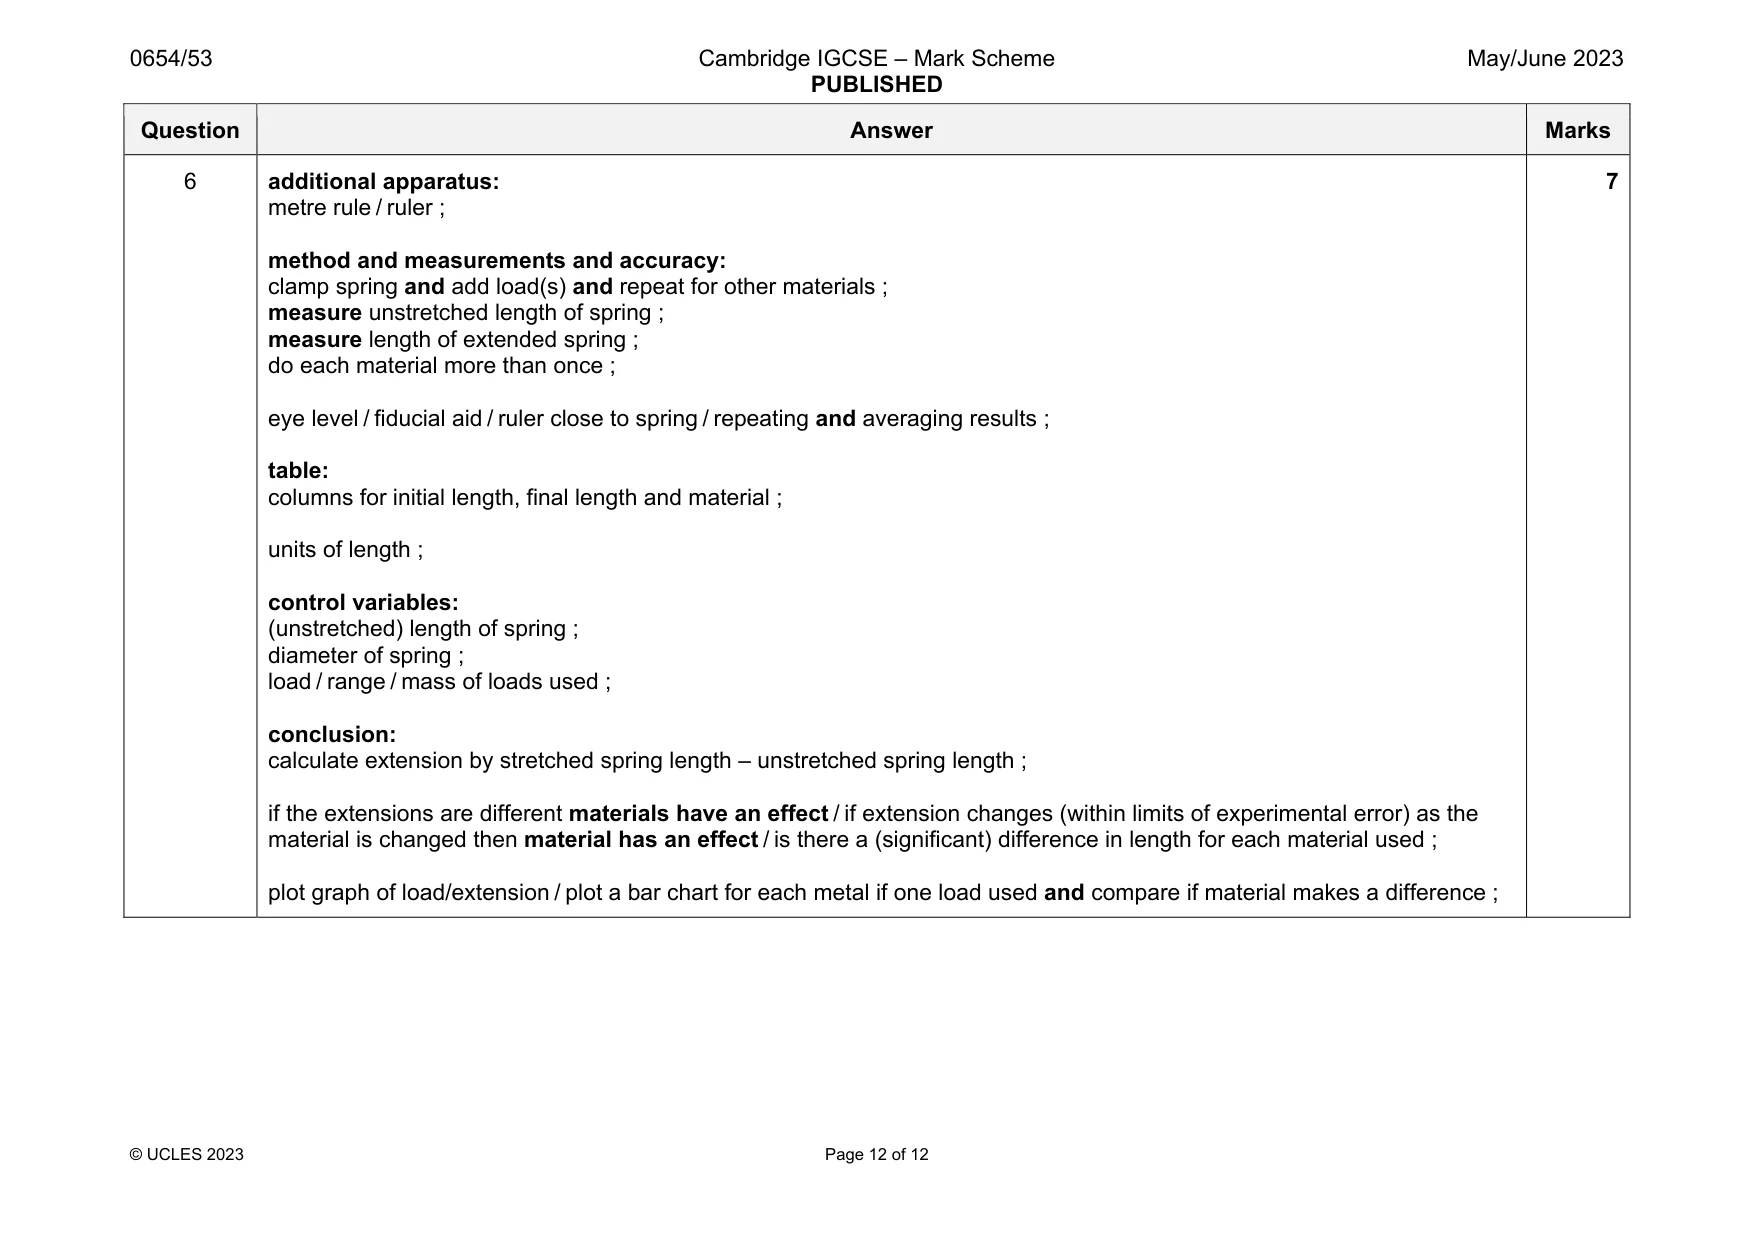
Mark scheme: 6 additional apparatus: metre rule / ruler ; method and measurements and accuracy: clamp spring and add load(s) and repeat for other materials ; measure unstretched length of spring ; measure length of extended spring ; do each material more than once ; eye level / fiducial aid / ruler close to spring / repeating and averaging results ; table: columns for initial length, final length and material ; units of length ; control variables: (unstretched) length of spring ; diameter of spring ; load / range / mass of loads used ; conclusion: calculate extension by stretched spring length – unstretched spring length ; if the extensions are different materials have an effect / if extension changes (within limits of experimental error) as the material is changed then material has an effect / is there a (significant) difference in length for each material used ; plot graph of load/extension / plot a bar chart for each metal if one load used and compare if material makes a difference ; 7
What was in this paper
The subtopics covered by these 6 questions, and how many questions each got. Open one in a new tab to see every Cambridge question on it.
What you needed in this session
Cambridge’s own grade thresholds for 2023 May/June, Paper 5 · Variant 3. A higher threshold means an easier paper — the bar moves with how the cohort did.