Cambridge IGCSE Sciences - Co-ordinated (Double) 0654 — 2018 Oct/Nov Paper 5 · Variant 1
0654/51/O/N/18 · 3 questions · 45 marks · ≈51 min
The question paper and its mark scheme, free to read here and free to download. This is Cambridge’s own paper, exactly as it was sat.
Question paper12 pages


Mark scheme6 pages
Answers below. Sit the paper first if you are practising.
Questions as text
Q1 · You are going to investigate a leaf
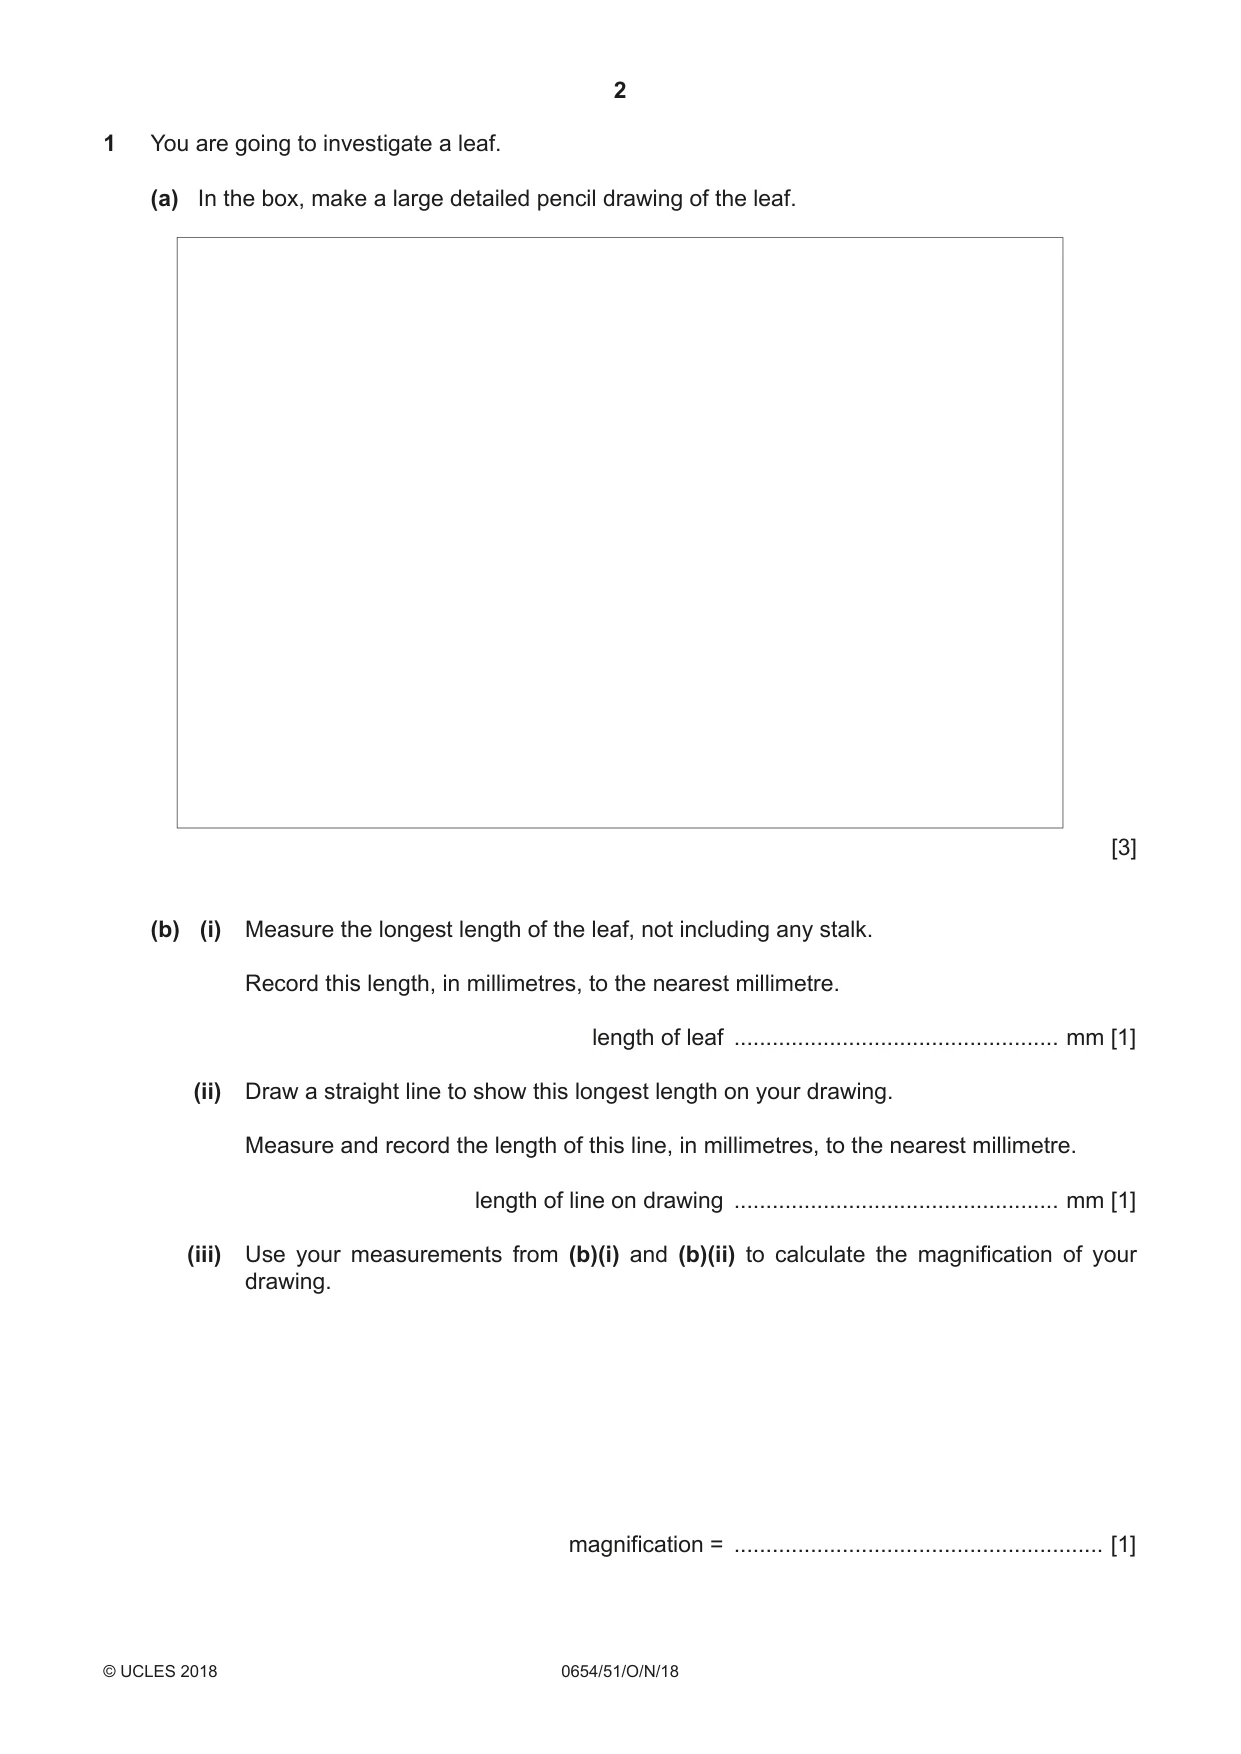
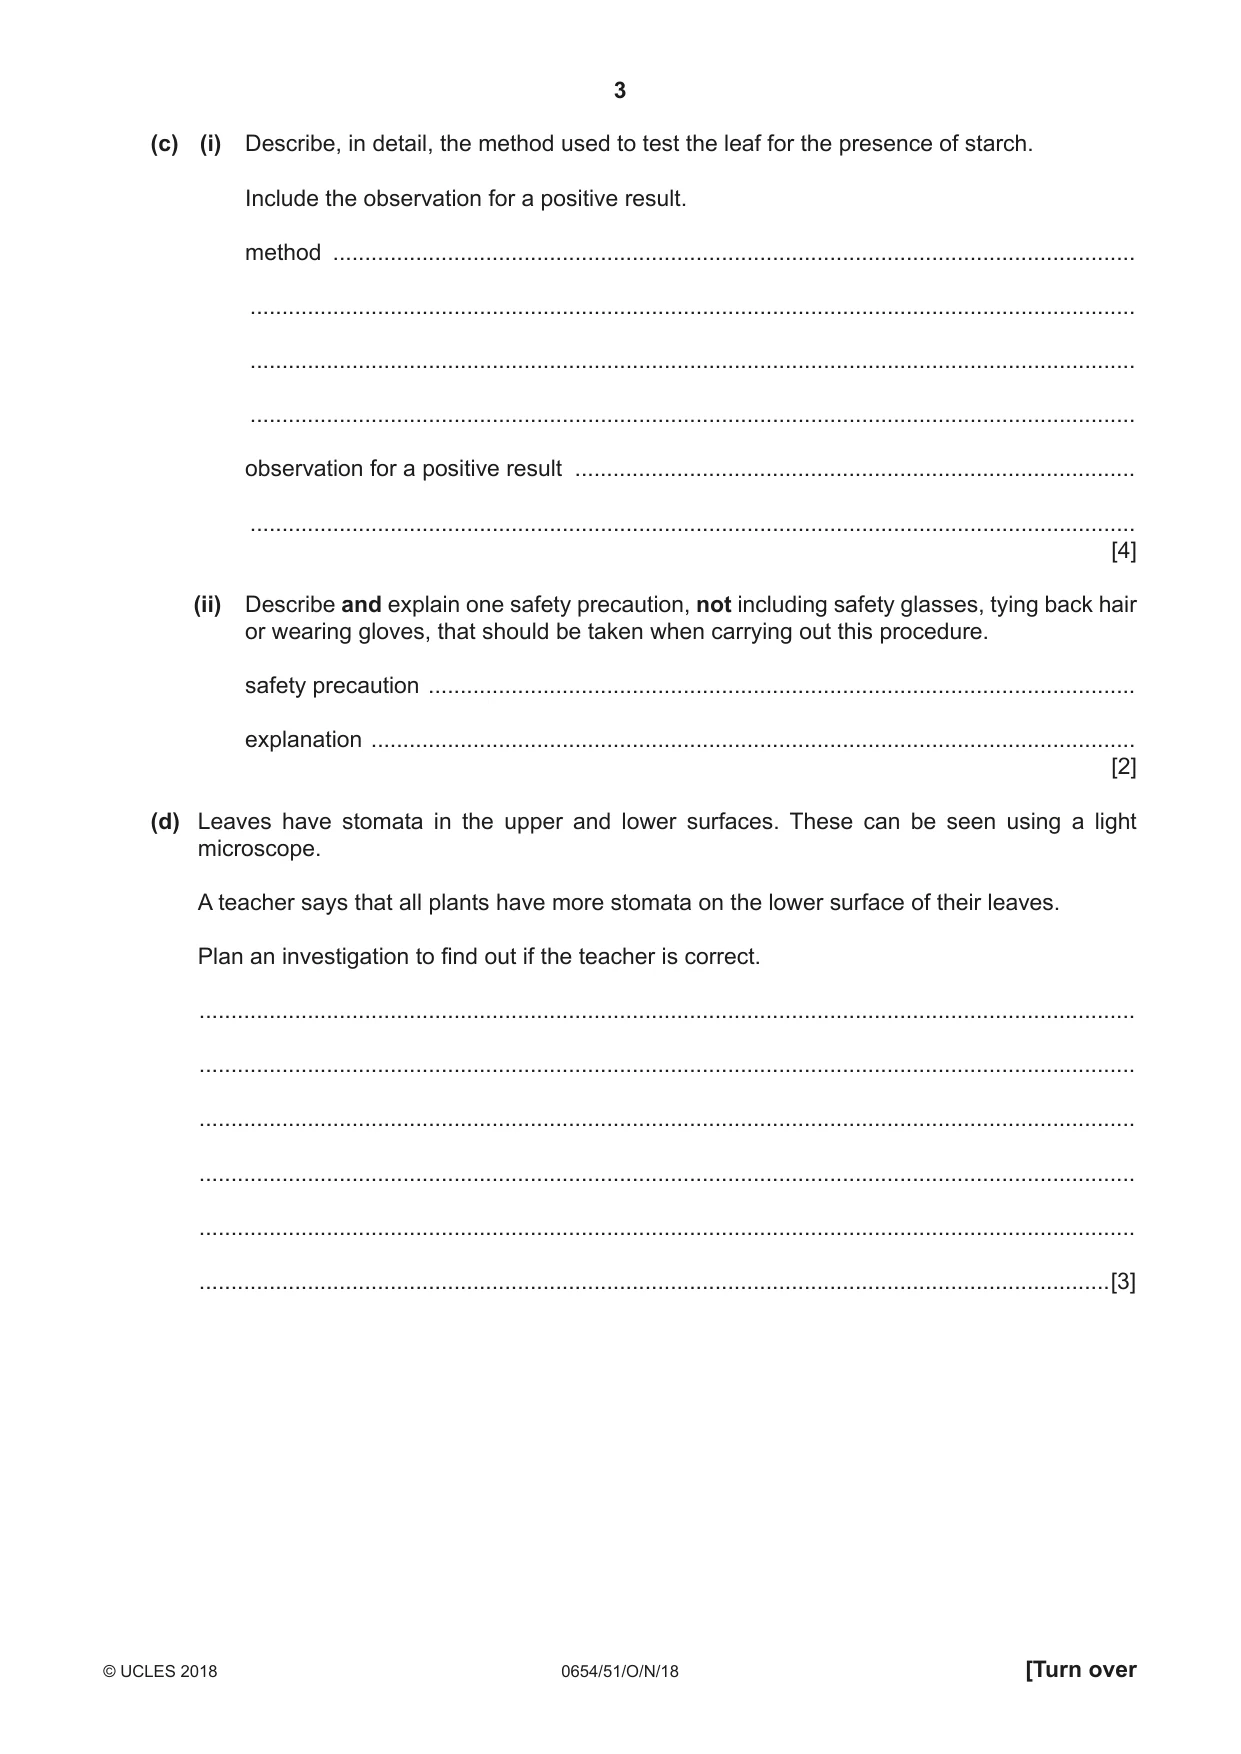
1 You are going to investigate a leaf. (a) In the box, make a large detailed pencil drawing of the leaf. [3] (b) (i) Measure the longest length of the leaf, not including any stalk. Record this length, in millimetres, to the nearest millimetre. length of leaf ................................................... mm [1] (ii) Draw a straight line to show this longest length on your drawing. Measure and record the length of this line, in millimetres, to the nearest millimetre. length of line on drawing ................................................... mm [1] (iii) Use your measurements from (b)(i) and (b)(ii) to calculate the magnification of your drawing. magnification = .......................................................... [1] (c) (i) Describe, in detail, the method used to test the leaf for the presence of starch. Include the observation for a positive result. method .............................................................................................................................. ........................................................................................................................................... ........................................................................................................................................... ........................................................................................................................................... observation for a positive result ........................................................................................ ........................................................................................................................................... [4] (ii) Describe and explain one safety precaution, not including safety glasses, tying back hair or wearing gloves, that should be taken when carrying out this procedure. safety precaution ............................................................................................................... explanation ........................................................................................................................ [2] (d) Leaves have stomata in the upper and lower surfaces. These can be seen using a light microscope. A teacher says that all plants have more stomata on the lower surface of their leaves. Plan an investigation to find out if the teacher is correct. ................................................................................................................................................... ................................................................................................................................................... ................................................................................................................................................... ................................................................................................................................................... ................................................................................................................................................... ...............................................................................................................................................[3]
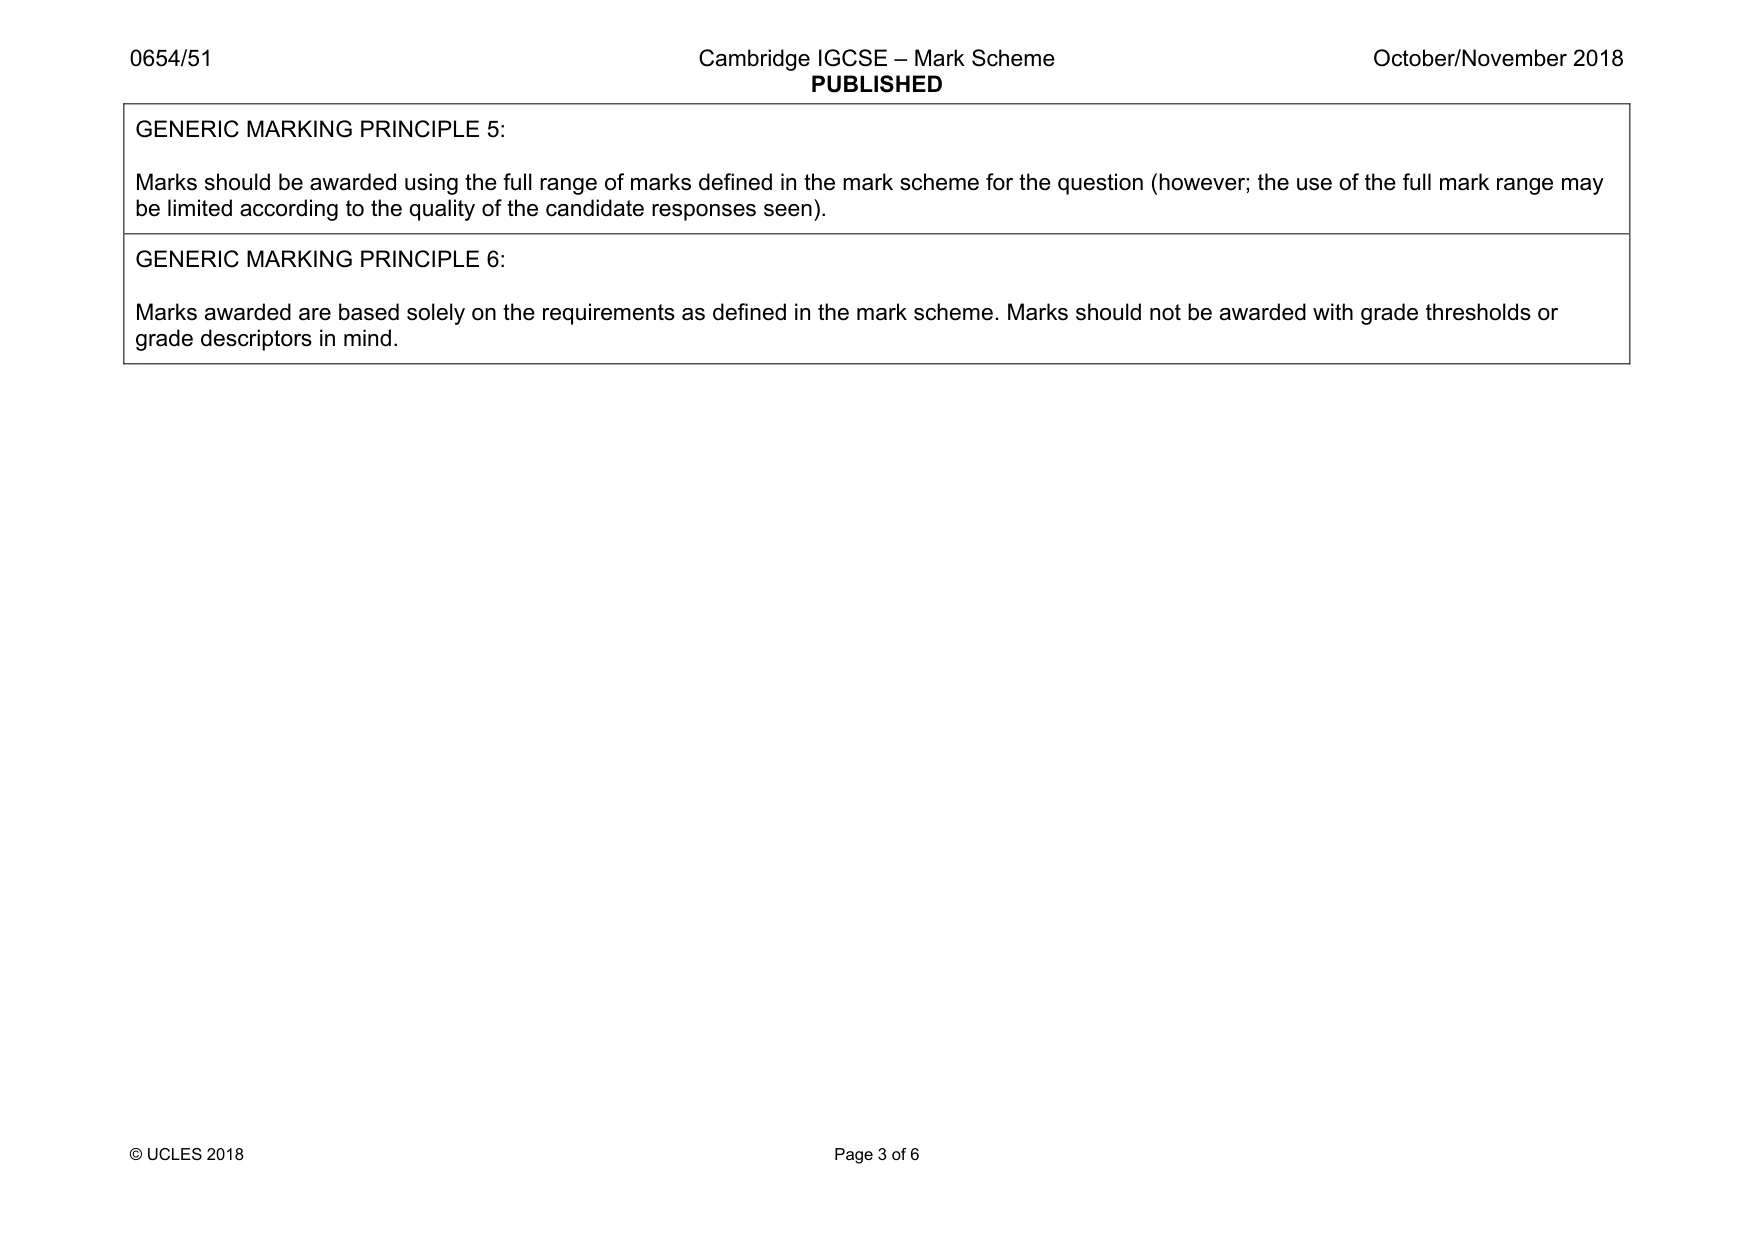
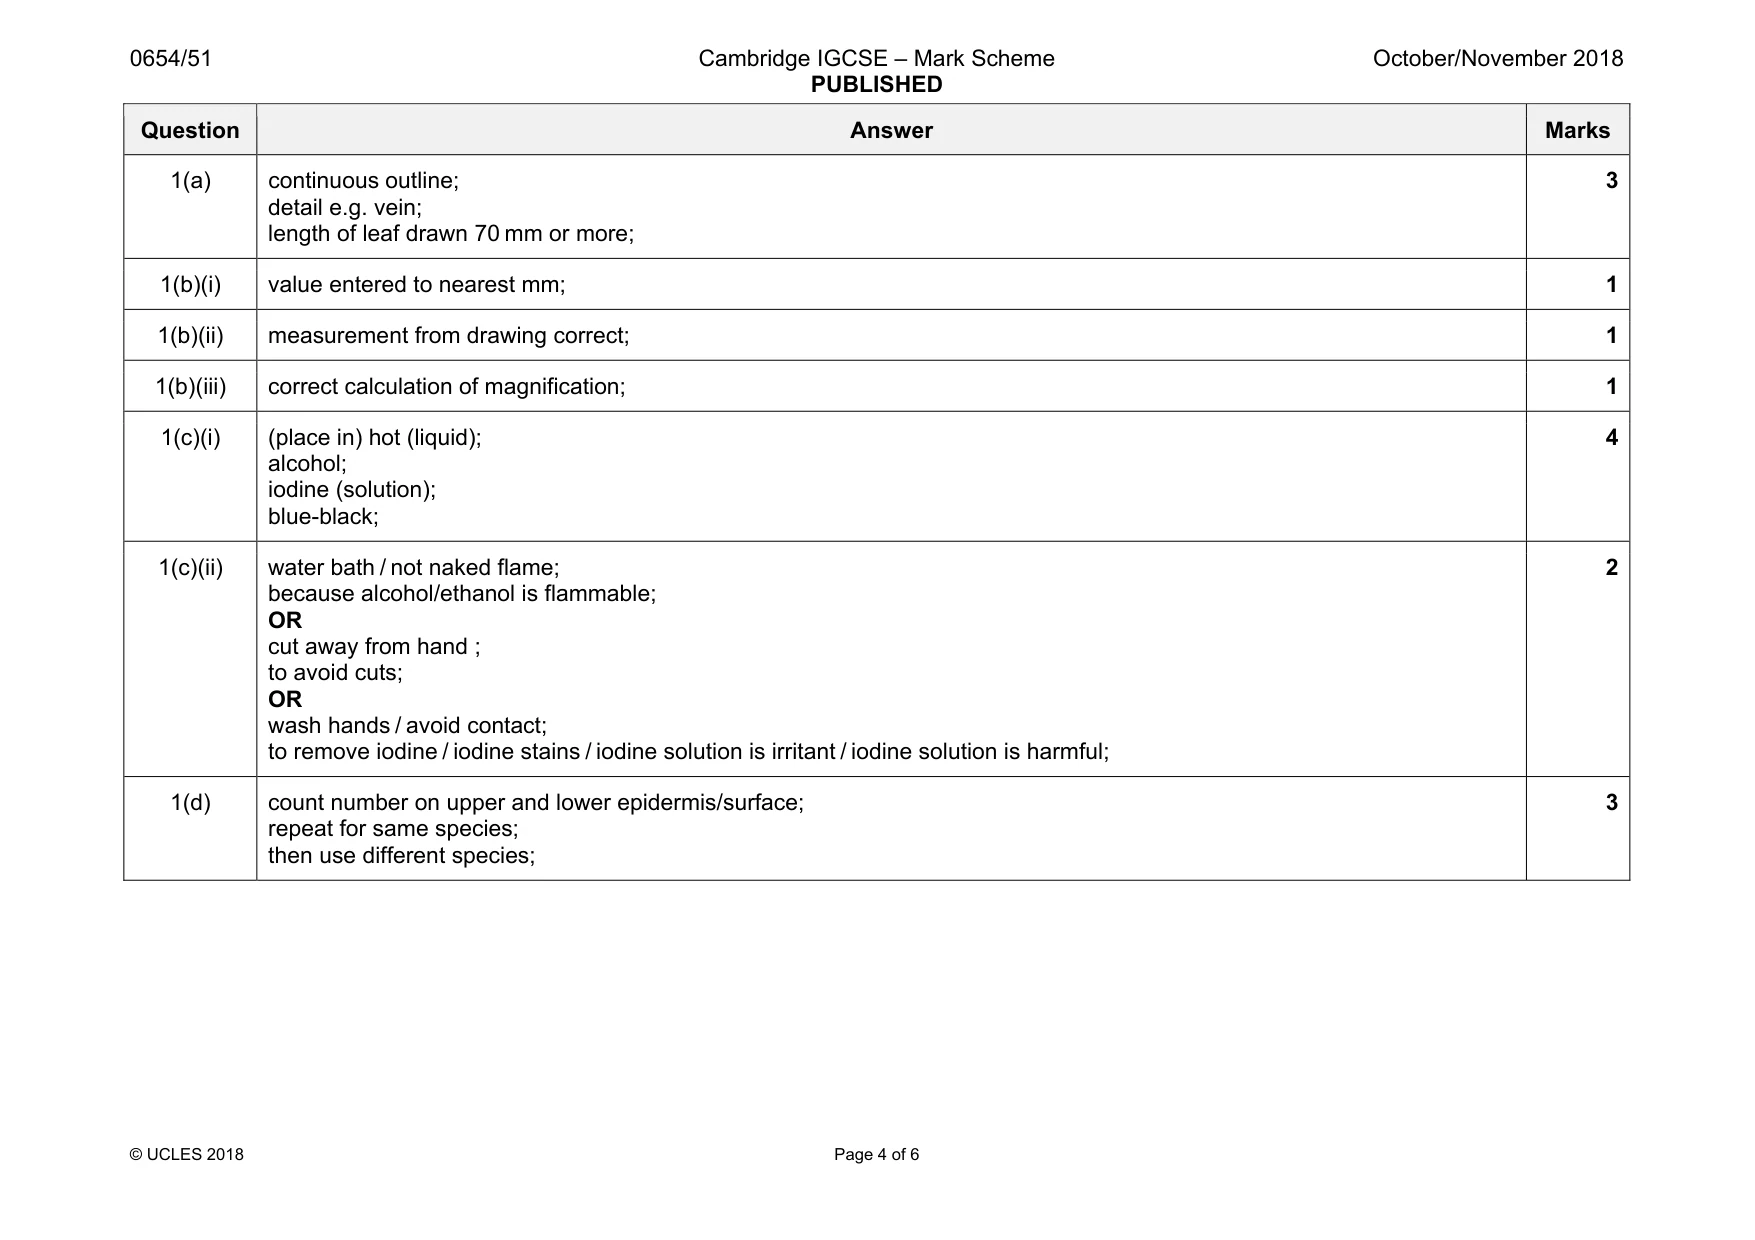
Mark scheme: 1(a) continuous outline; detail e.g. vein; length of leaf drawn 70 mm or more; 3 1(b)(i) value entered to nearest mm; 1 1(b)(ii) measurement from drawing correct; 1 1(b)(iii) correct calculation of magnification; 1 1(c)(i) (place in) hot (liquid); alcohol; iodine (solution); blue-black; 4 1(c)(ii) water bath / not naked flame; because alcohol/ethanol is flammable; OR cut away from hand ; to avoid cuts; OR wash hands / avoid contact; to remove iodine / iodine stains / iodine solution is irritant / iodine solution is harmful; 2 1(d) count number on upper and lower epidermis/surface; repeat for same species; then use different species; 3
Q2 · You are going to investigate the temperature changes when solid H reacts with solution J
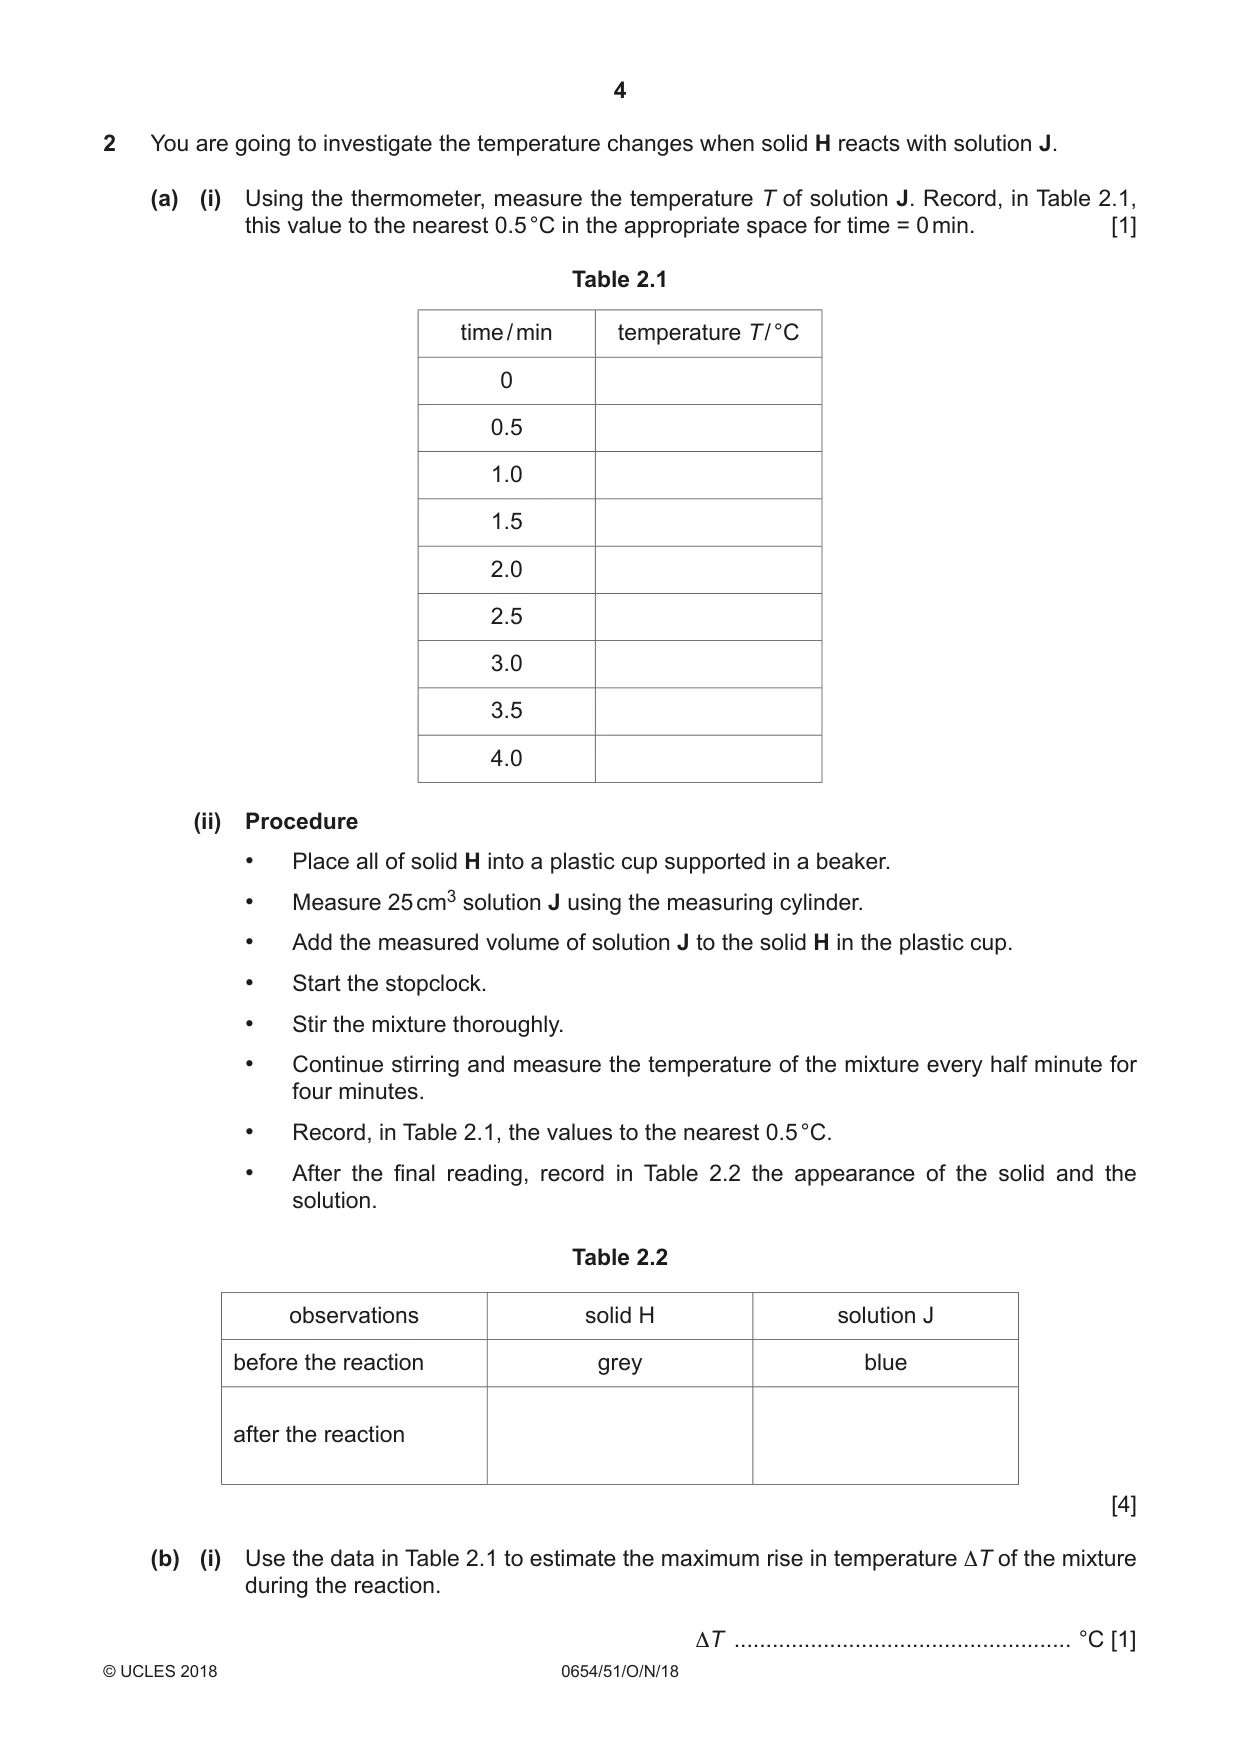
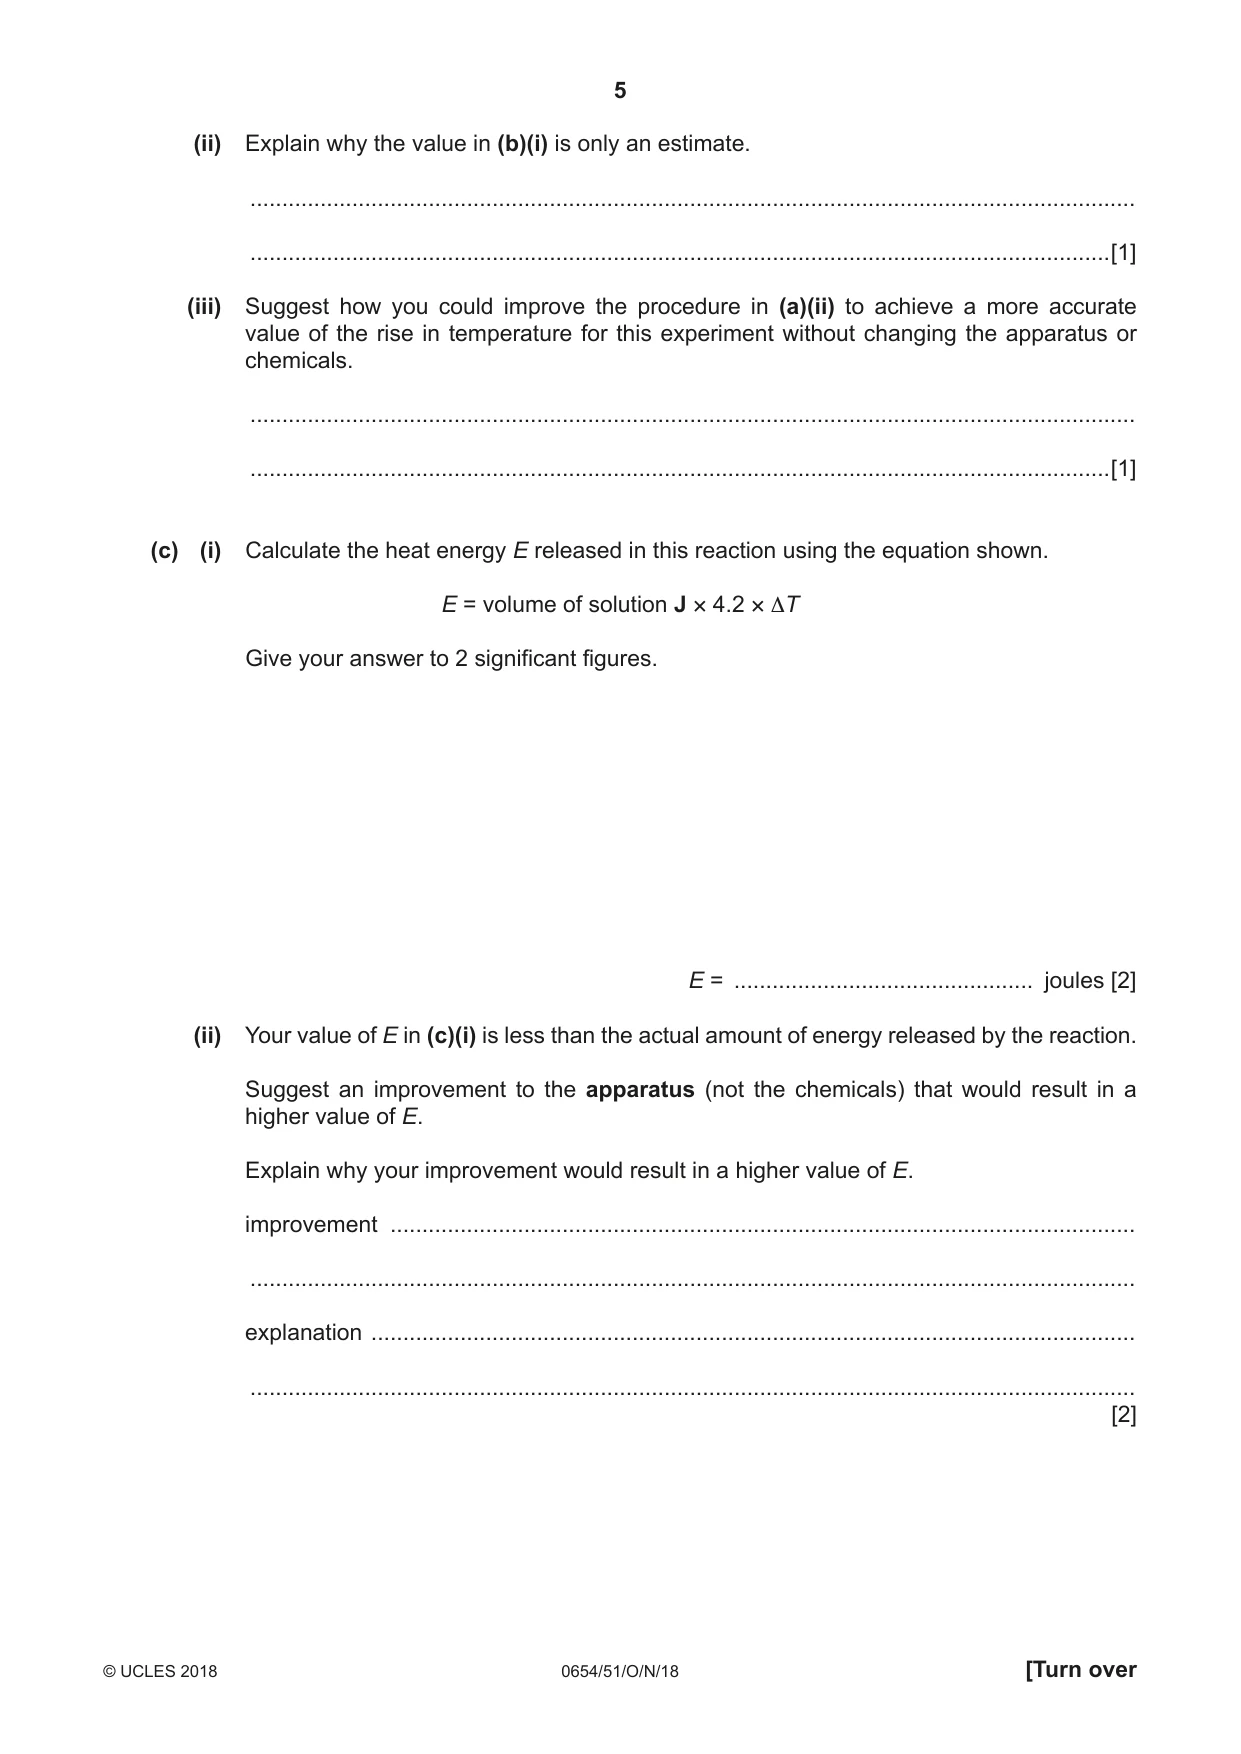
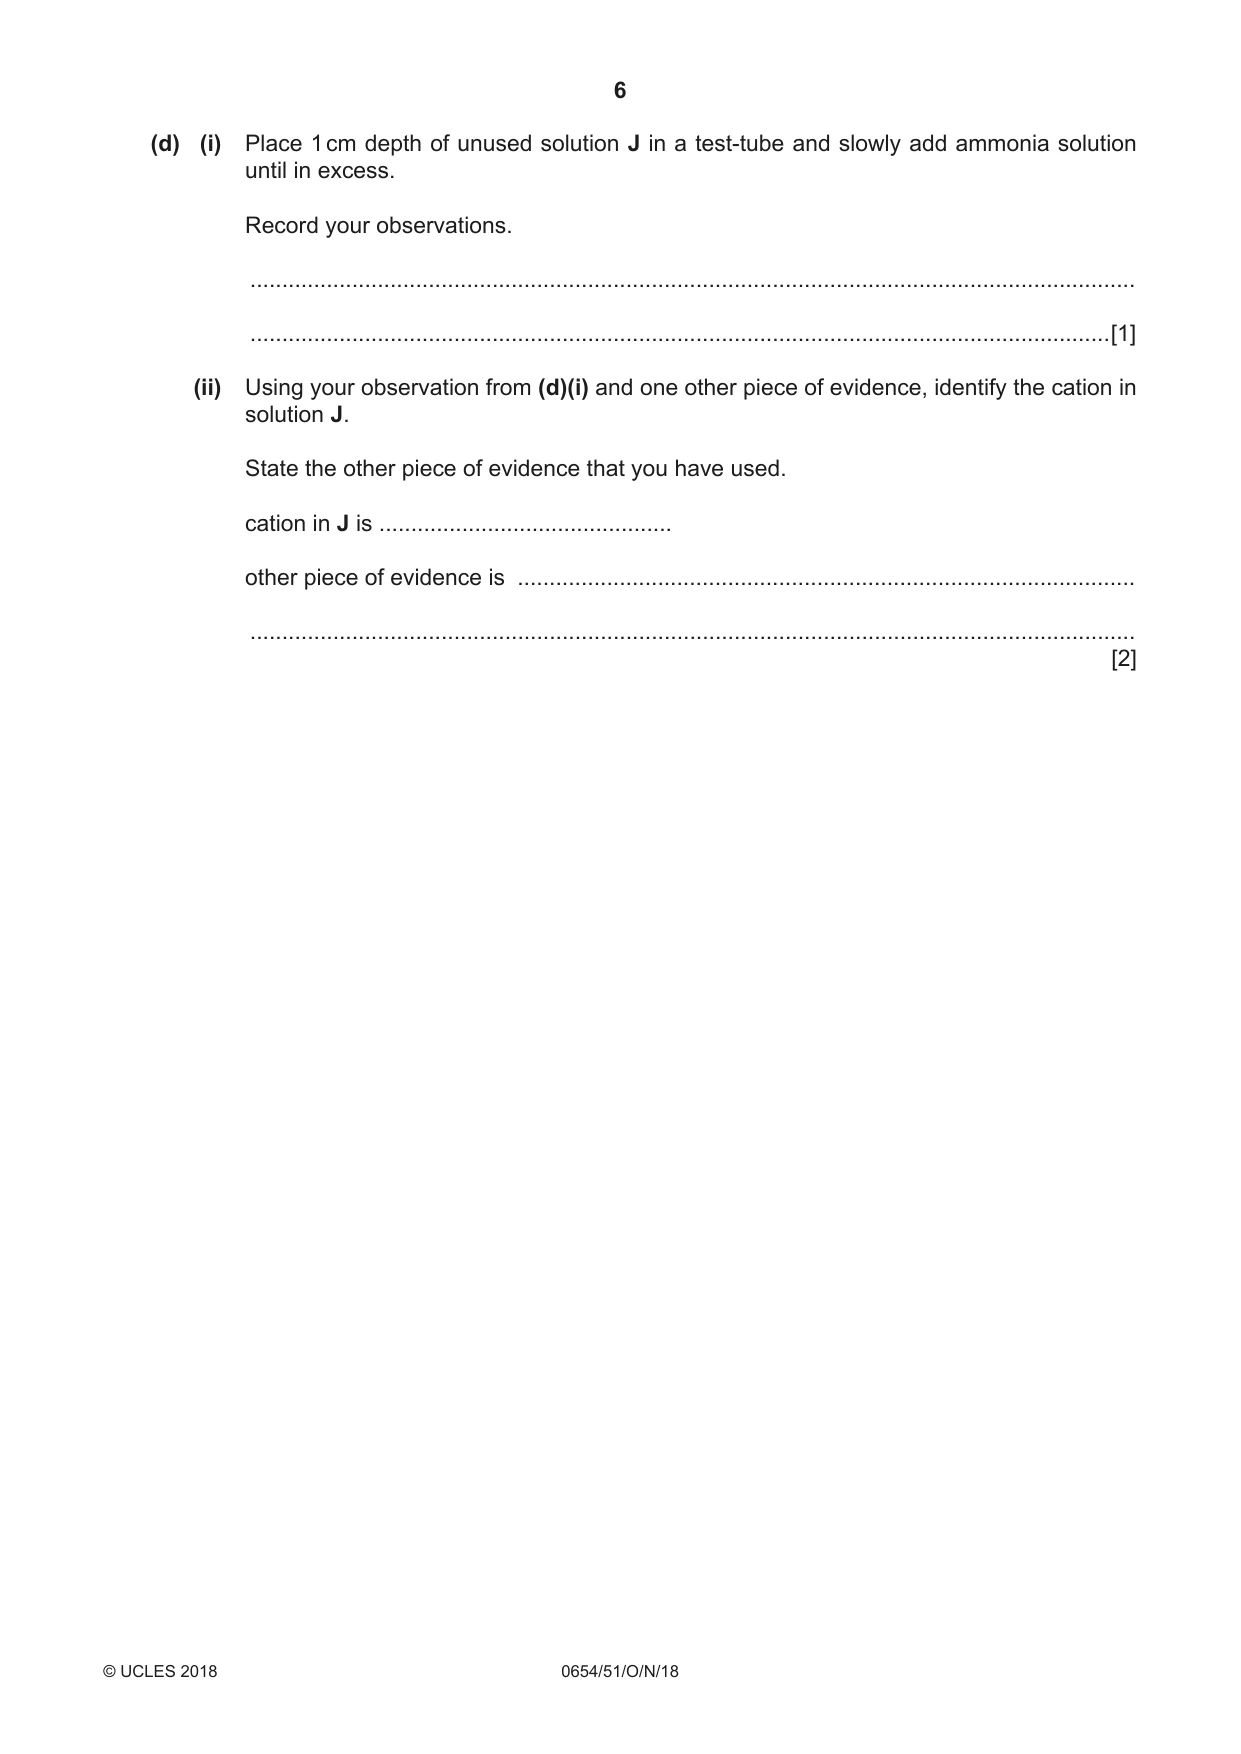
2 You are going to investigate the temperature changes when solid H reacts with solution J. (a) (i) Using the thermometer, measure the temperature T of solution J. Record, in Table 2.1, this value to the nearest 0.5 °C in the appropriate space for time = 0 min. [1] Table 2.1 time / min temperature T / °C 0 0.5 1.0 1.5 2.0 2.5 3.0 3.5 4.0 (ii) Procedure • Place all of solid H into a plastic cup supported in a beaker. • Measure 25 cm3 solution J using the measuring cylinder. • Add the measured volume of solution J to the solid H in the plastic cup. • Start the stopclock. • Stir the mixture thoroughly. • Continue stirring and measure the temperature of the mixture every half minute for four minutes. • Record, in Table 2.1, the values to the nearest 0.5 °C. • After the final reading, record in Table 2.2 the appearance of the solid and the solution. Table 2.2 observations solid H solution J before the reaction grey blue after the reaction [4] (b) (i) Use the data in Table 2.1 to estimate the maximum rise in temperature ΔT of the mixture during the reaction. ΔT ..................................................... °C [1] (ii) Explain why the value in (b)(i) is only an estimate. ........................................................................................................................................... .......................................................................................................................................[1] (iii) Suggest how you could improve the procedure in (a)(ii) to achieve a more accurate value of the rise in temperature for this experiment without changing the apparatus or chemicals. ........................................................................................................................................... .......................................................................................................................................[1] (c) (i) Calculate the heat energy E released in this reaction using the equation shown. E = volume of solution J × 4.2 × ΔT Give your answer to 2 significant figures. E = ............................................... joules [2] (ii) Your value of E in (c)(i) is less than the actual amount of energy released by the reaction. Suggest an improvement to the apparatus (not the chemicals) that would result in a higher value of E. Explain why your improvement would result in a higher value of E. improvement ..................................................................................................................... ........................................................................................................................................... explanation ........................................................................................................................ ........................................................................................................................................... [2] (d) (i) Place 1 cm depth of unused solution J in a test-tube and slowly add ammonia solution until in excess. Record your observations. ........................................................................................................................................... .......................................................................................................................................[1] (ii) Using your observation from (d)(i) and one other piece of evidence, identify the cation in solution J. State the other piece of evidence that you have used. cation in J is .............................................. other piece of evidence is ................................................................................................. ........................................................................................................................................... [2]
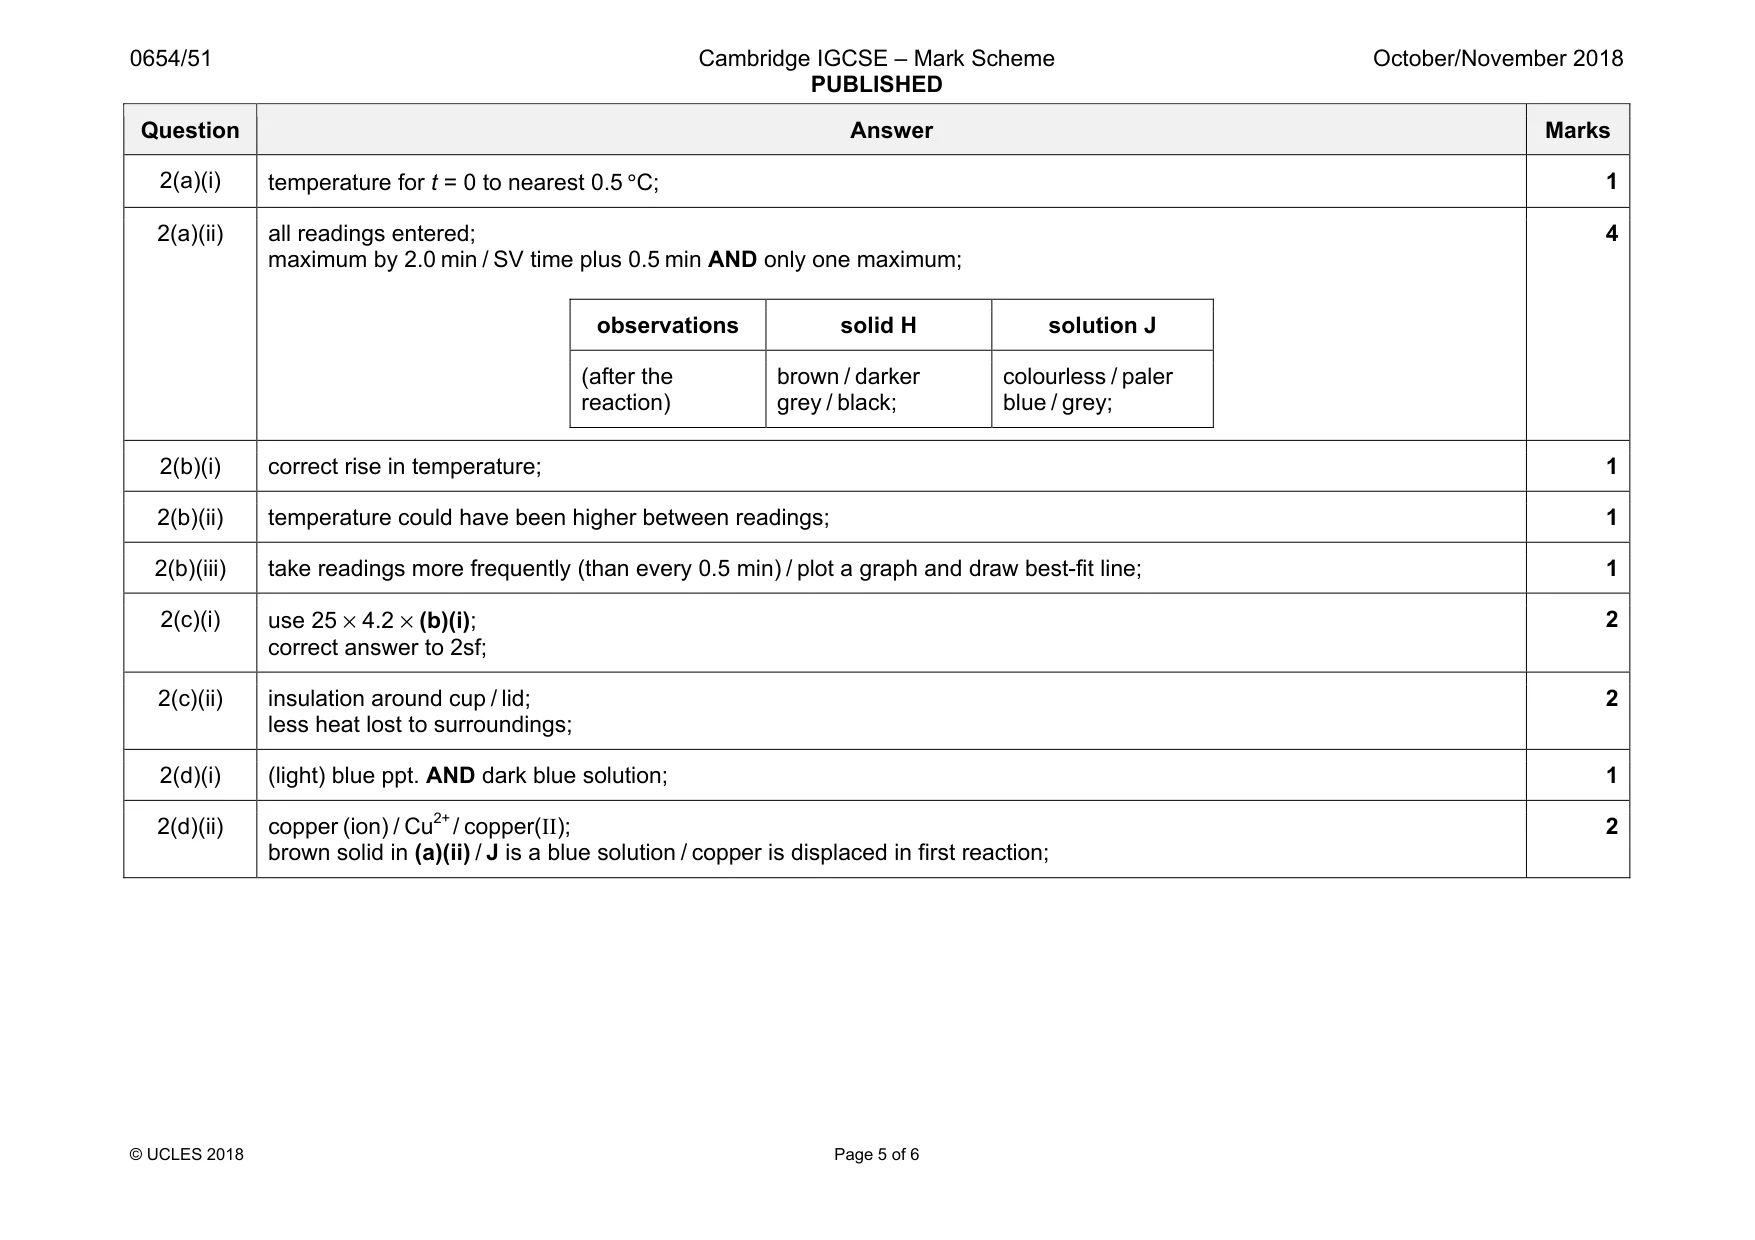
Mark scheme: 2(a)(i) 1 2(a)(ii) all readings entered; maximum by 2.0 min / SV time plus 0.5 min AND only one maximum; observations solid H solution J (after the reaction) brown / darker grey / black; colourless / paler blue / grey; 4 2(b)(i) correct rise in temperature; 1 2(b)(ii) temperature could have been higher between readings; 1 2(b)(iii) take readings more frequently (than every 0.5 min) / plot a graph and draw best-fit line; 1 2(c)(i) use 25 × 4.2 × (b)(i); correct answer to 2sf; 2 2(c)(ii) insulation around cup / lid; less heat lost to surroundings; 2 2(d)(i) (light) blue ppt. AND dark blue solution; 1 2(d)(ii) copper (ion) / Cu2+ / copper(II); brown solid in (a)(ii) / J is a blue solution / copper is displaced in first reaction; 2
Q3 · You are going to measure the acceleration of free fall g using a spring
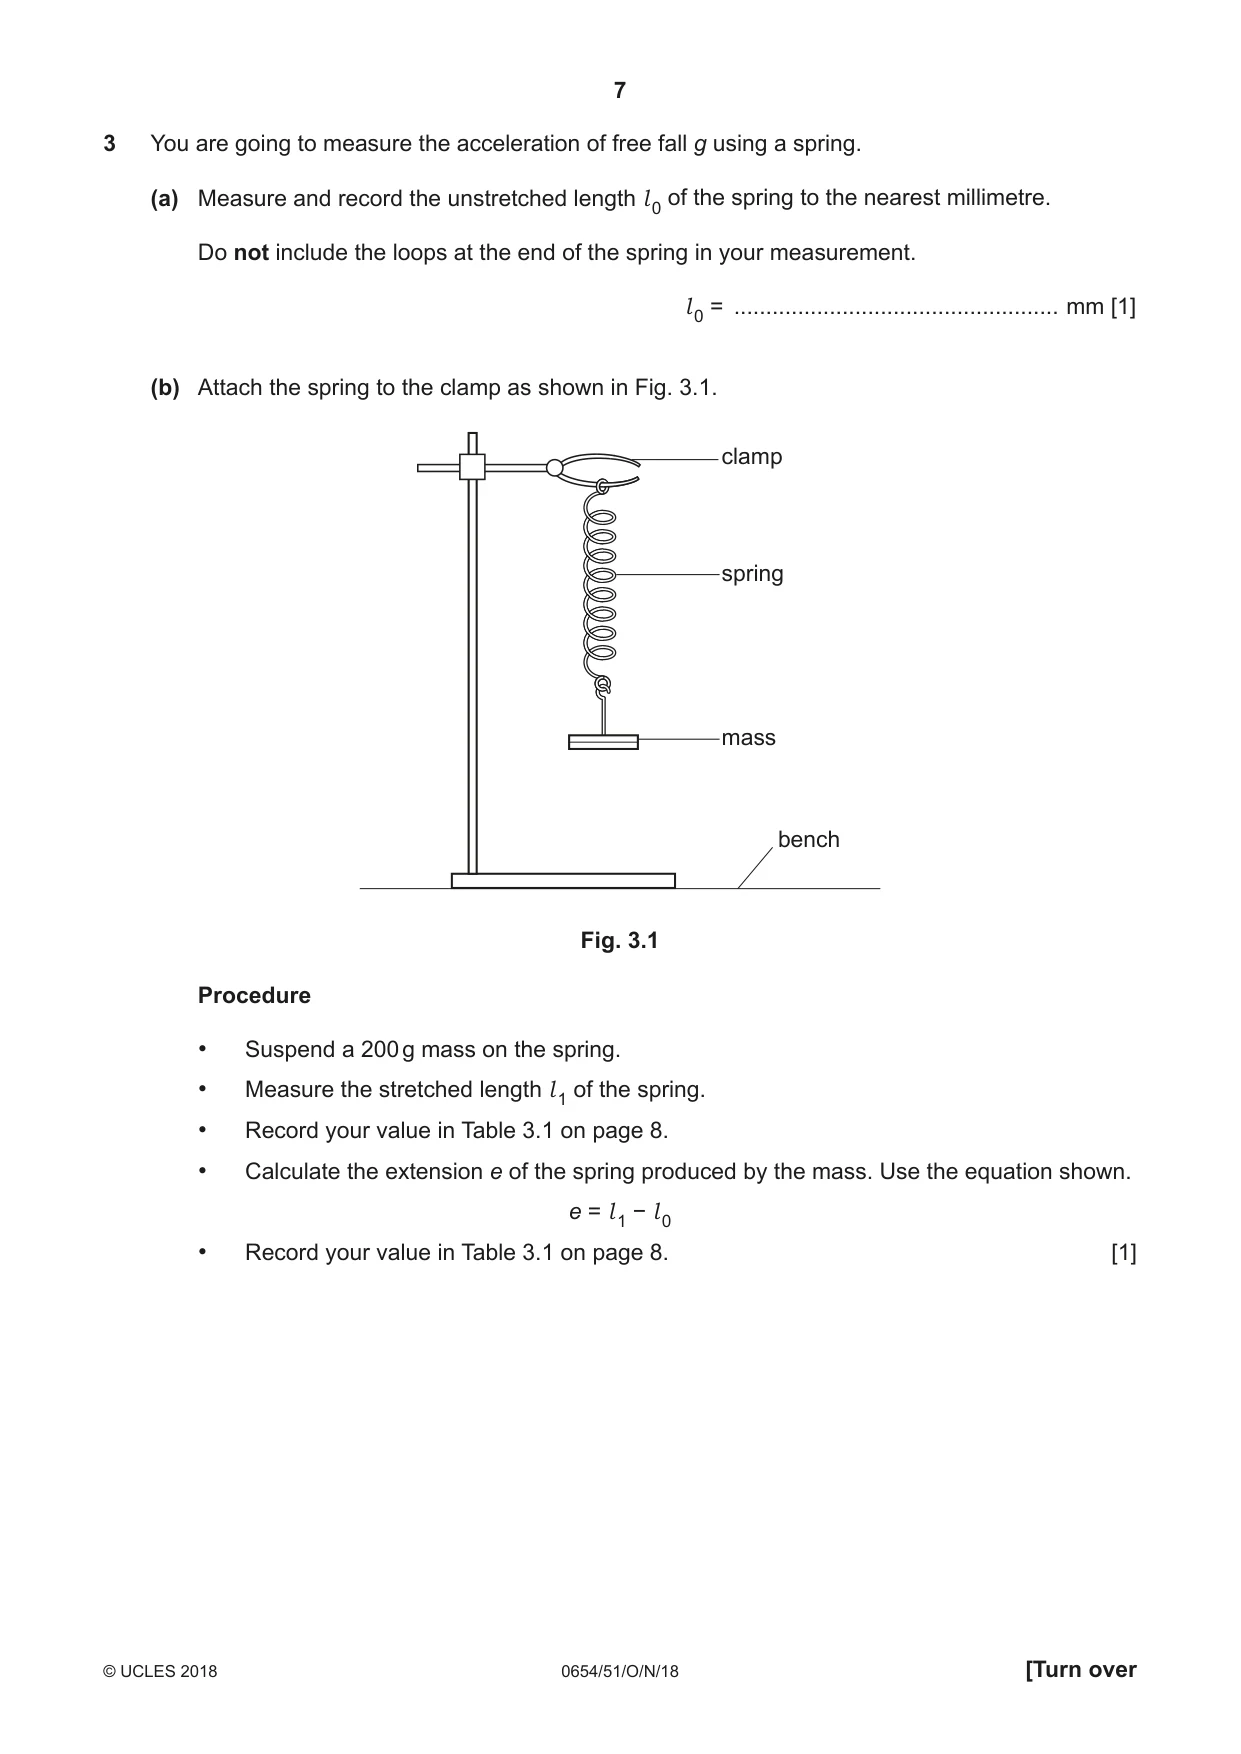
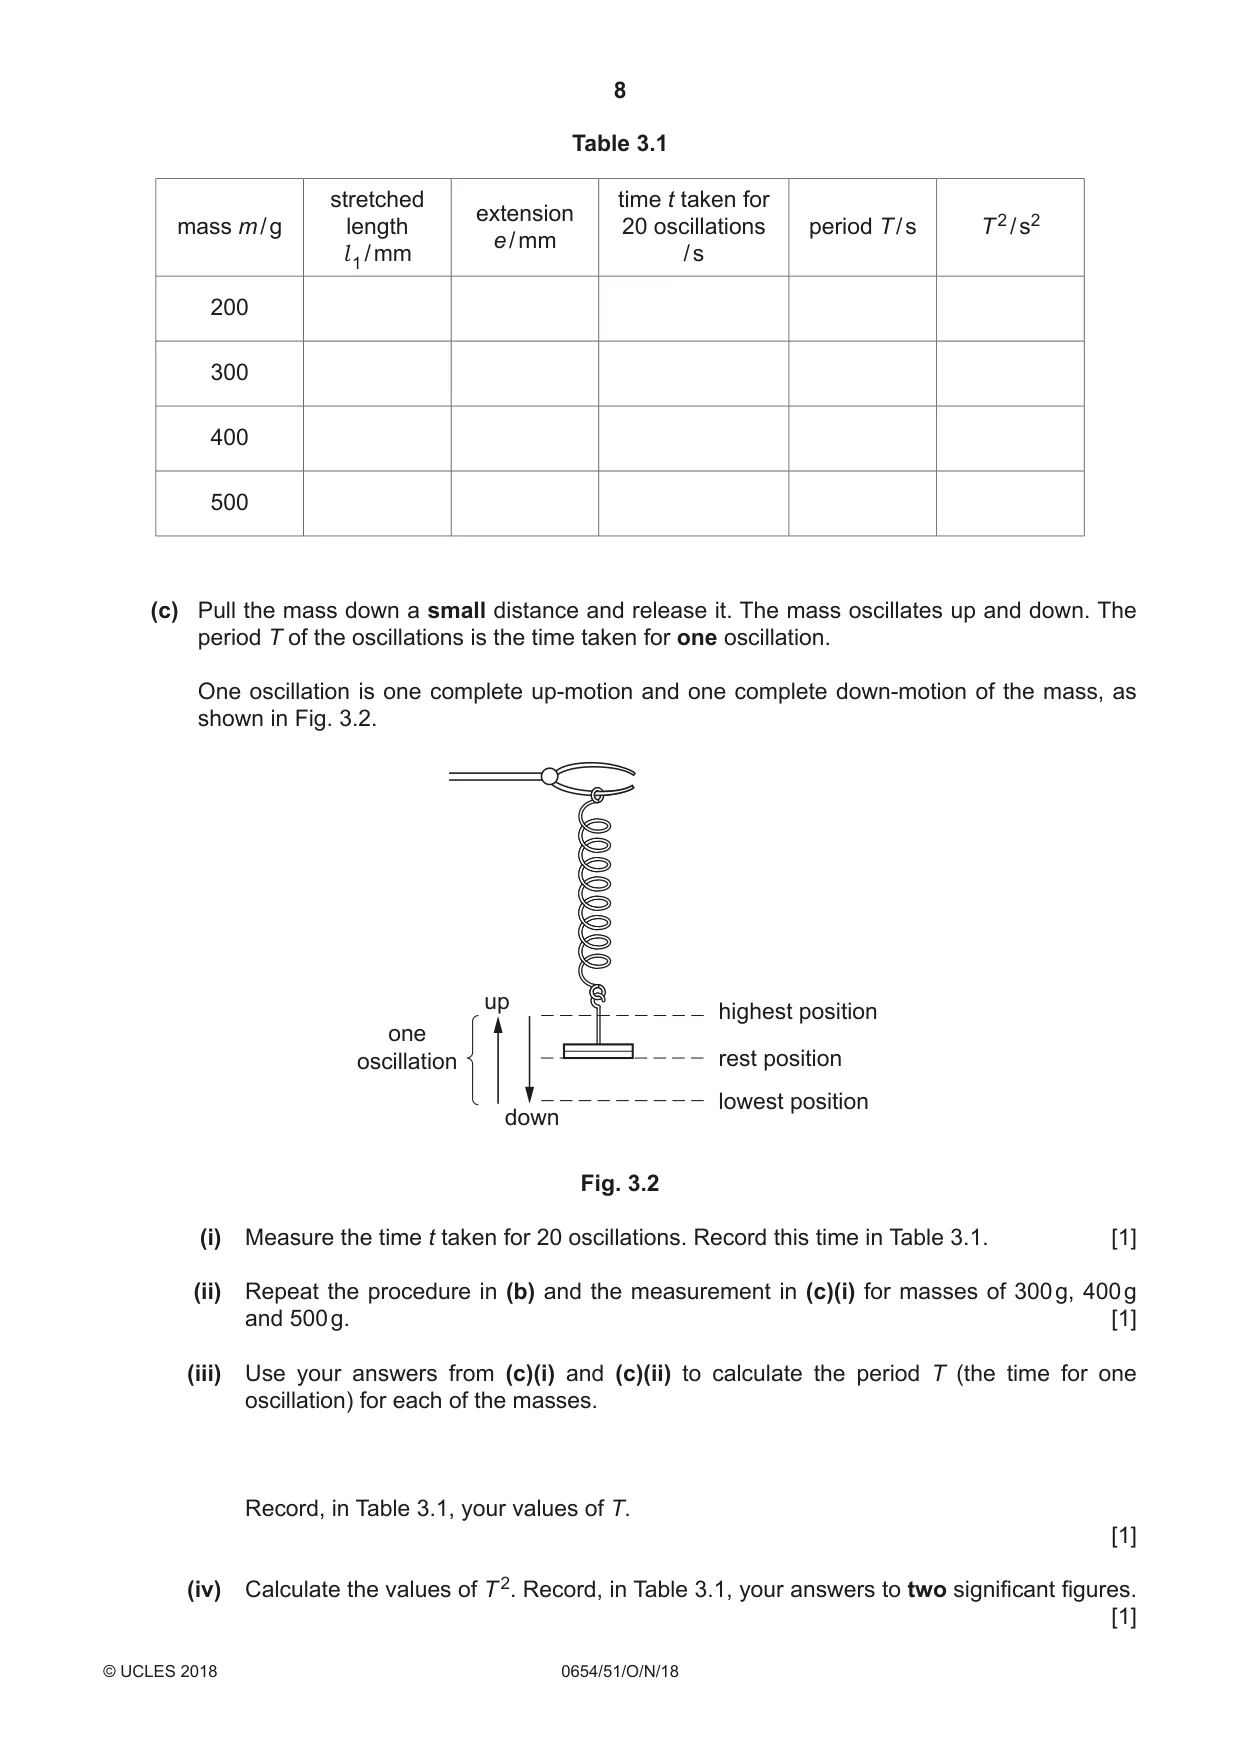
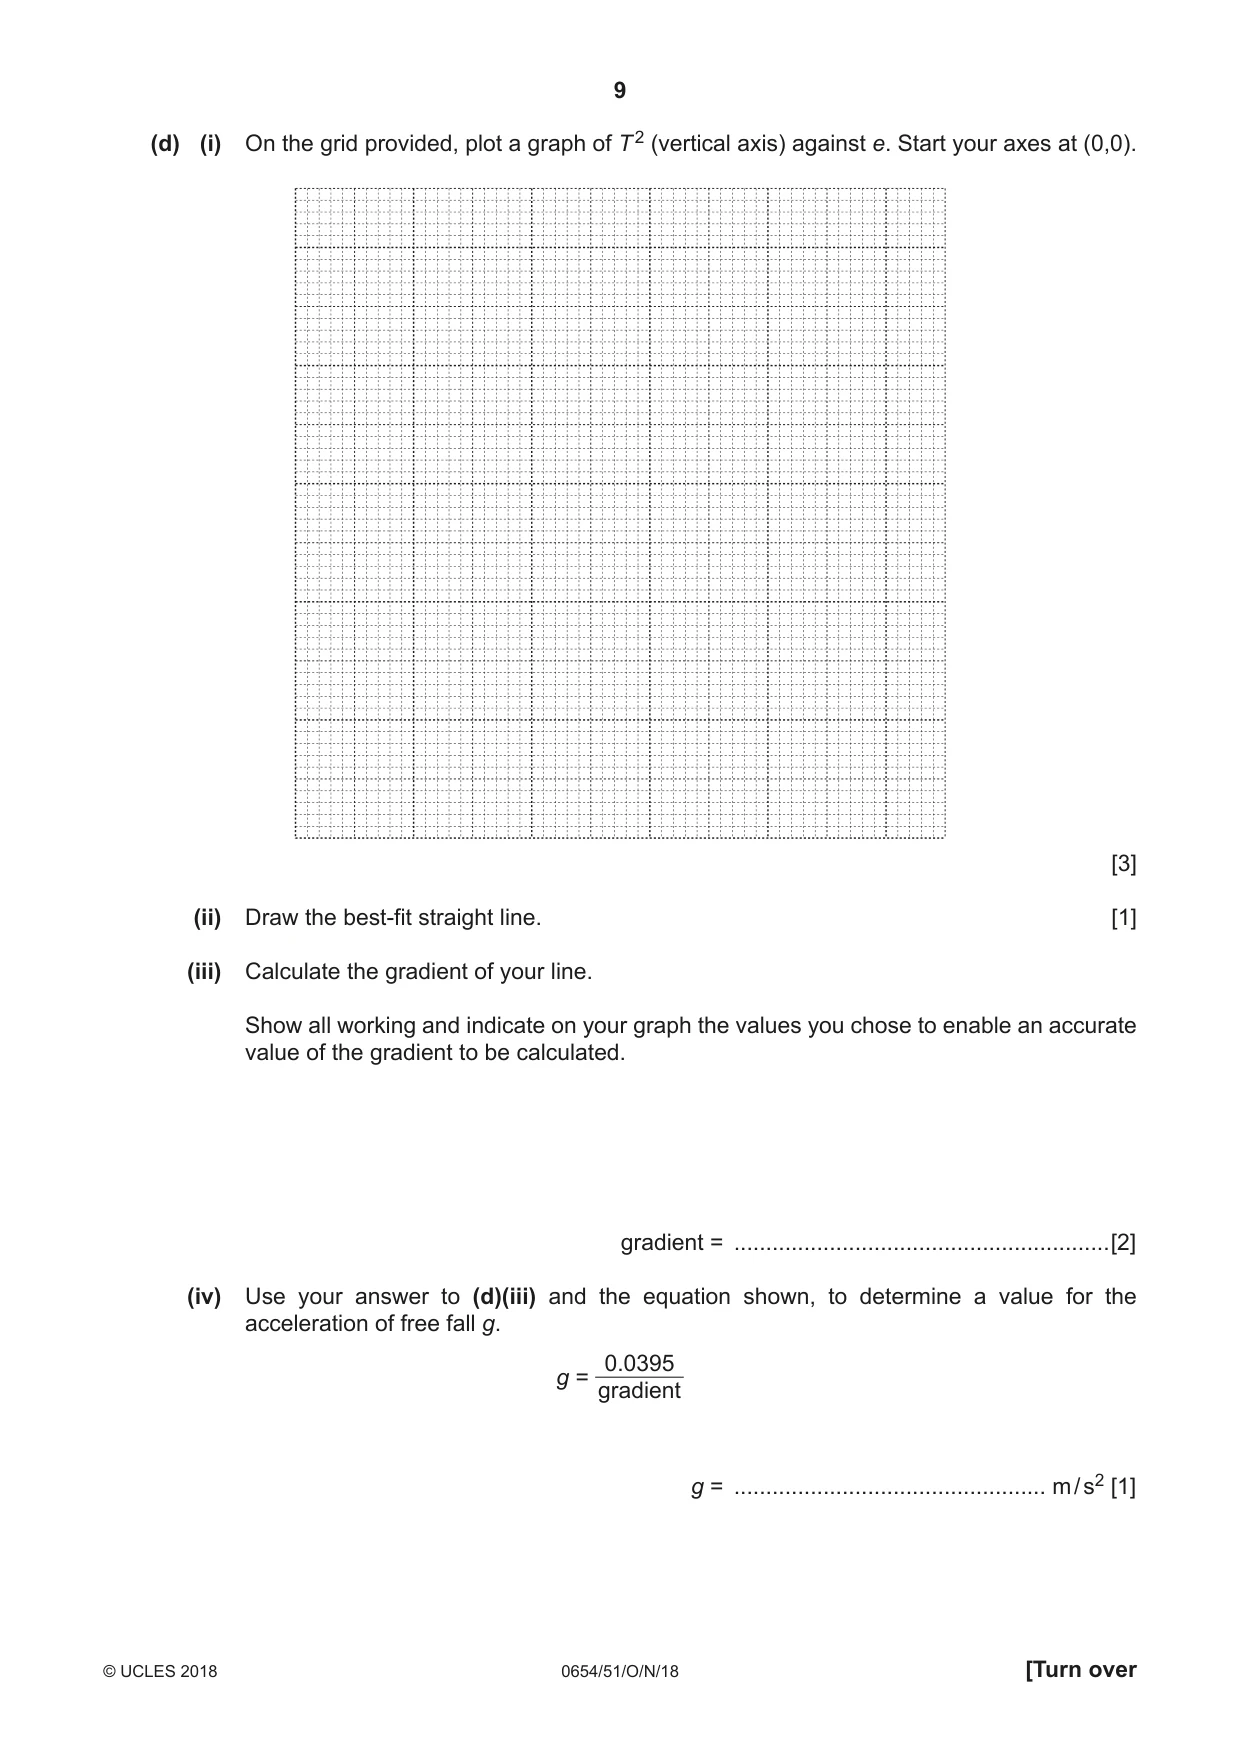
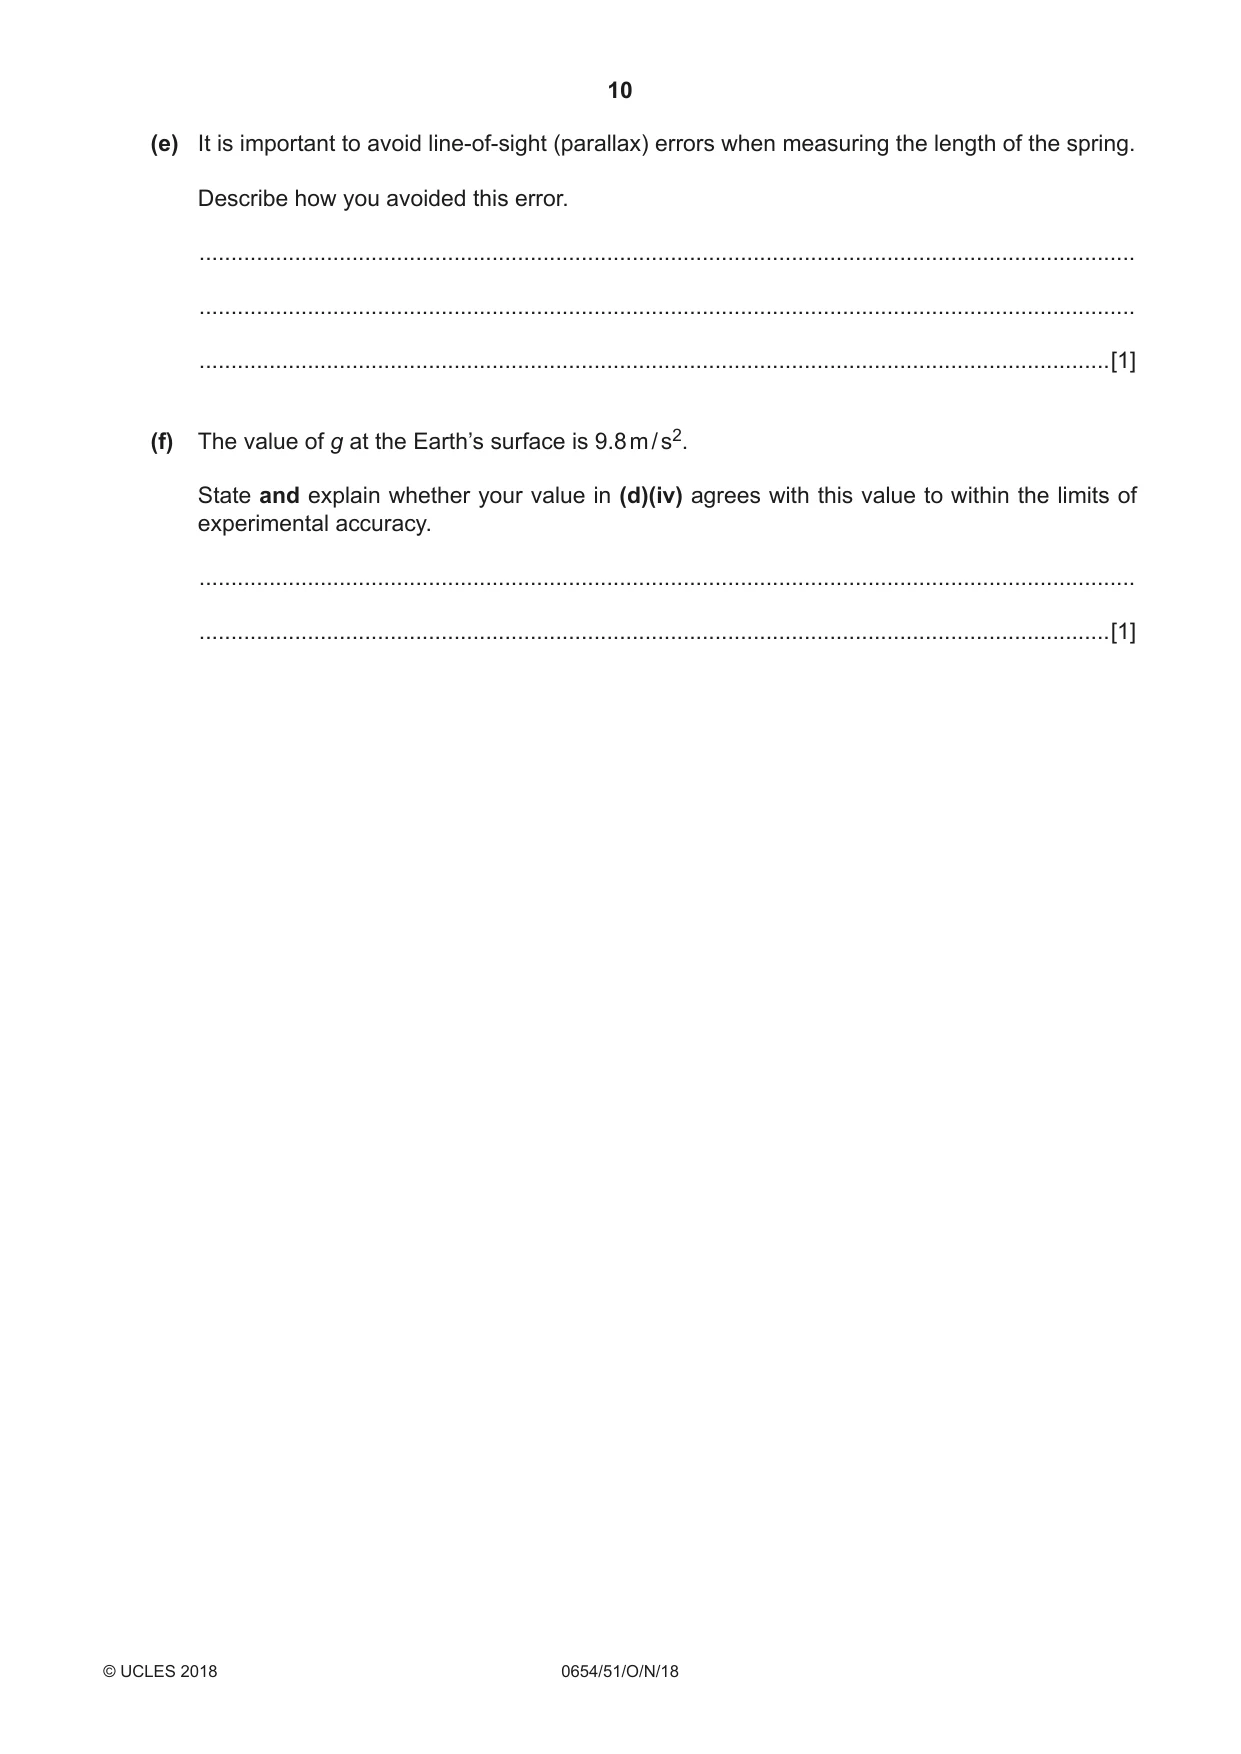
3 You are going to measure the acceleration of free fall g using a spring. (a) Measure and record the unstretched length l 0 of the spring to the nearest millimetre. Do not include the loops at the end of the spring in your measurement. l 0 = ................................................... mm [1] (b) Attach the spring to the clamp as shown in Fig. 3.1. clamp spring mass bench Fig. 3.1 Procedure • Suspend a 200 g mass on the spring. • Measure the stretched length l 1 of the spring. • Record your value in Table 3.1 on page 8. • Calculate the extension e of the spring produced by the mass. Use the equation shown. e = l 1 − l 0 • Record your value in Table 3.1 on page 8. [1] Table 3.1 stretched time t taken for extension 2 mass m / g length 20 oscillations period T / s T / s2 e / mm l 1 / mm / s 200 300 400 500 (c) Pull the mass down a small distance and release it. The mass oscillates up and down. The period T of the oscillations is the time taken for one oscillation. One oscillation is one complete up-motion and one complete down-motion of the mass, as shown in Fig. 3.2. up highest position one oscillation rest position lowest position down Fig. 3.2 (i) Measure the time t taken for 20 oscillations. Record this time in Table 3.1. [1] (ii) Repeat the procedure in (b) and the measurement in (c)(i) for masses of 300 g, 400 g and 500 g. [1] (iii) Use your answers from (c)(i) and (c)(ii) to calculate the period T (the time for one oscillation) for each of the masses. Record, in Table 3.1, your values of T. [1] (iv) Calculate the values of T 2. Record, in Table 3.1, your answers to two significant figures. [1] (d) (i) On the grid provided, plot a graph of T 2 (vertical axis) against e. Start your axes at (0,0). [3] (ii) Draw the best-fit straight line. [1] (iii) Calculate the gradient of your line. Show all working and indicate on your graph the values you chose to enable an accurate value of the gradient to be calculated. gradient = ...........................................................[2] (iv) Use your answer to (d)(iii) and the equation shown, to determine a value for the acceleration of free fall g. 0.0395 g = gradient g = ................................................. m / s2 [1]
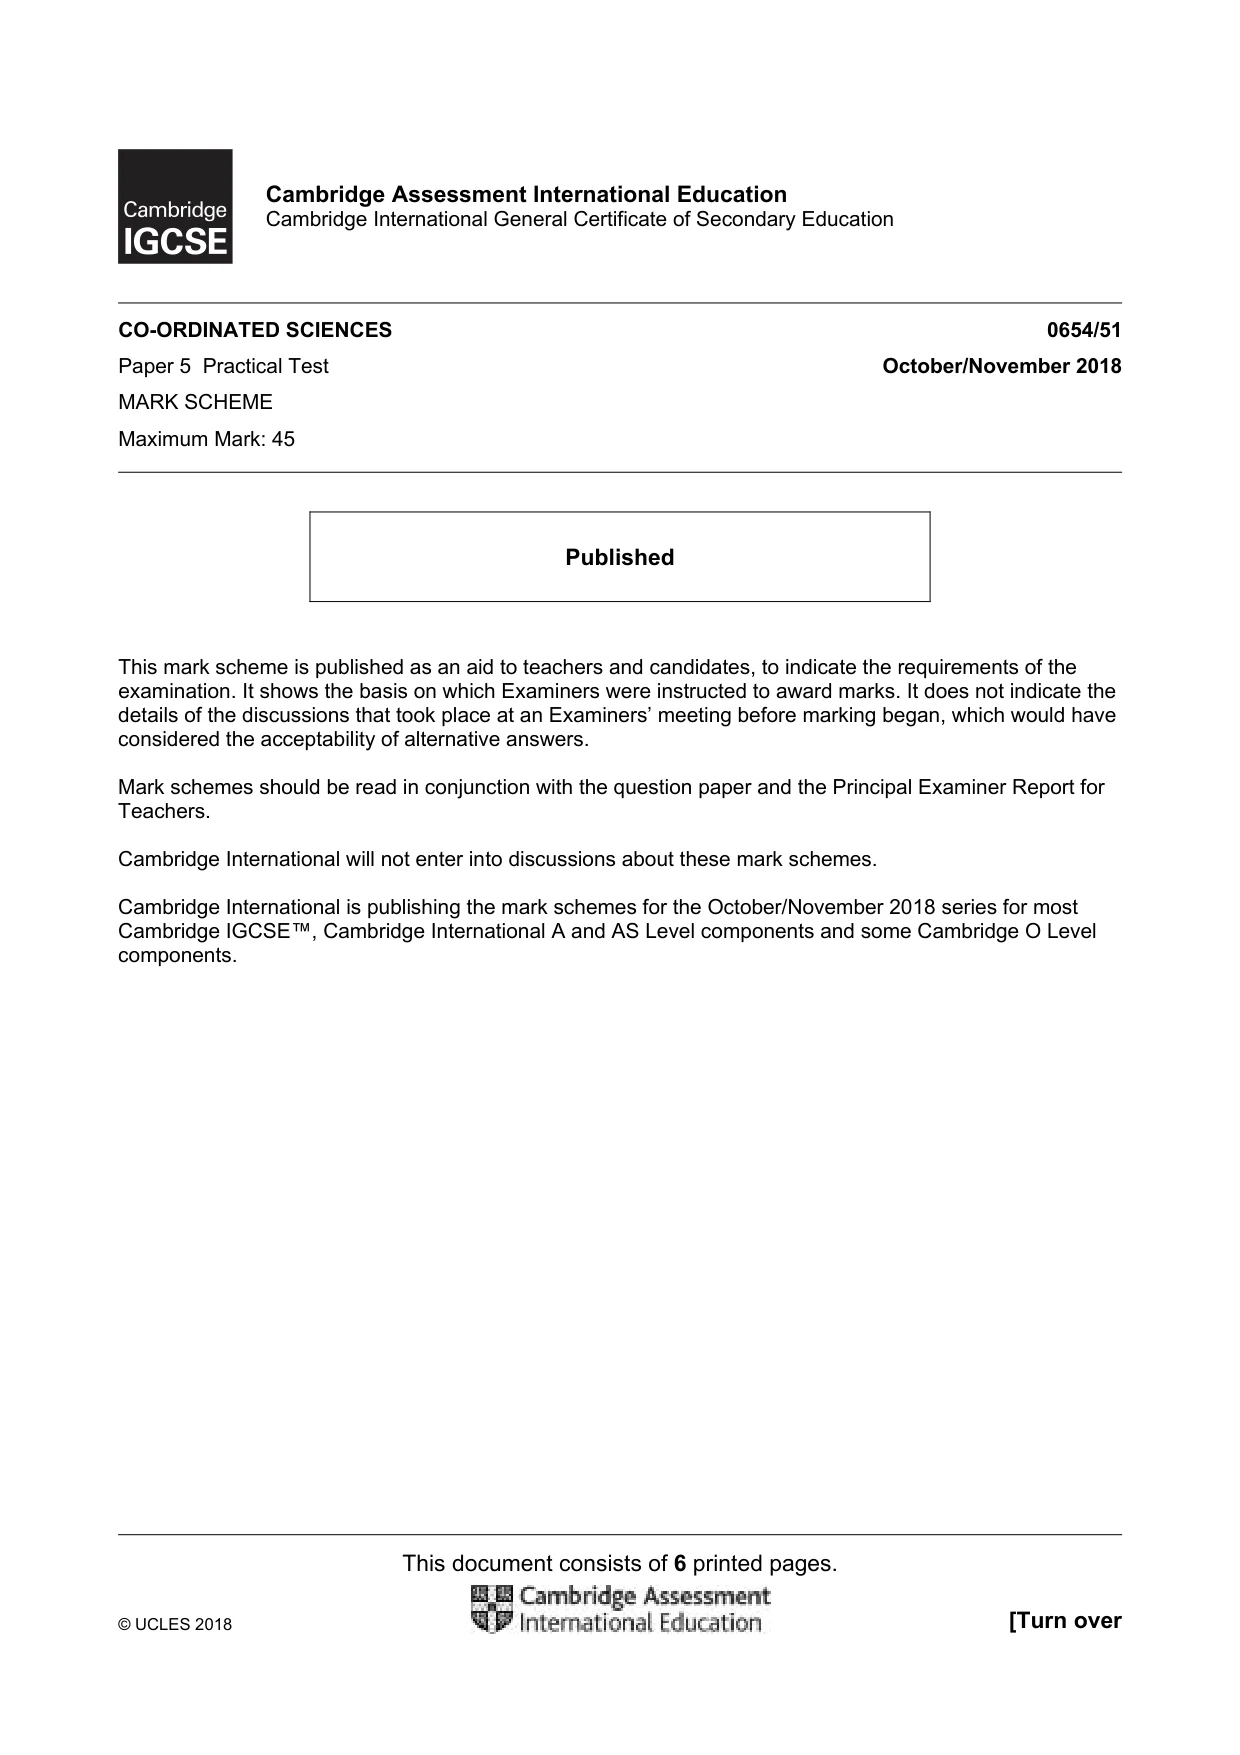
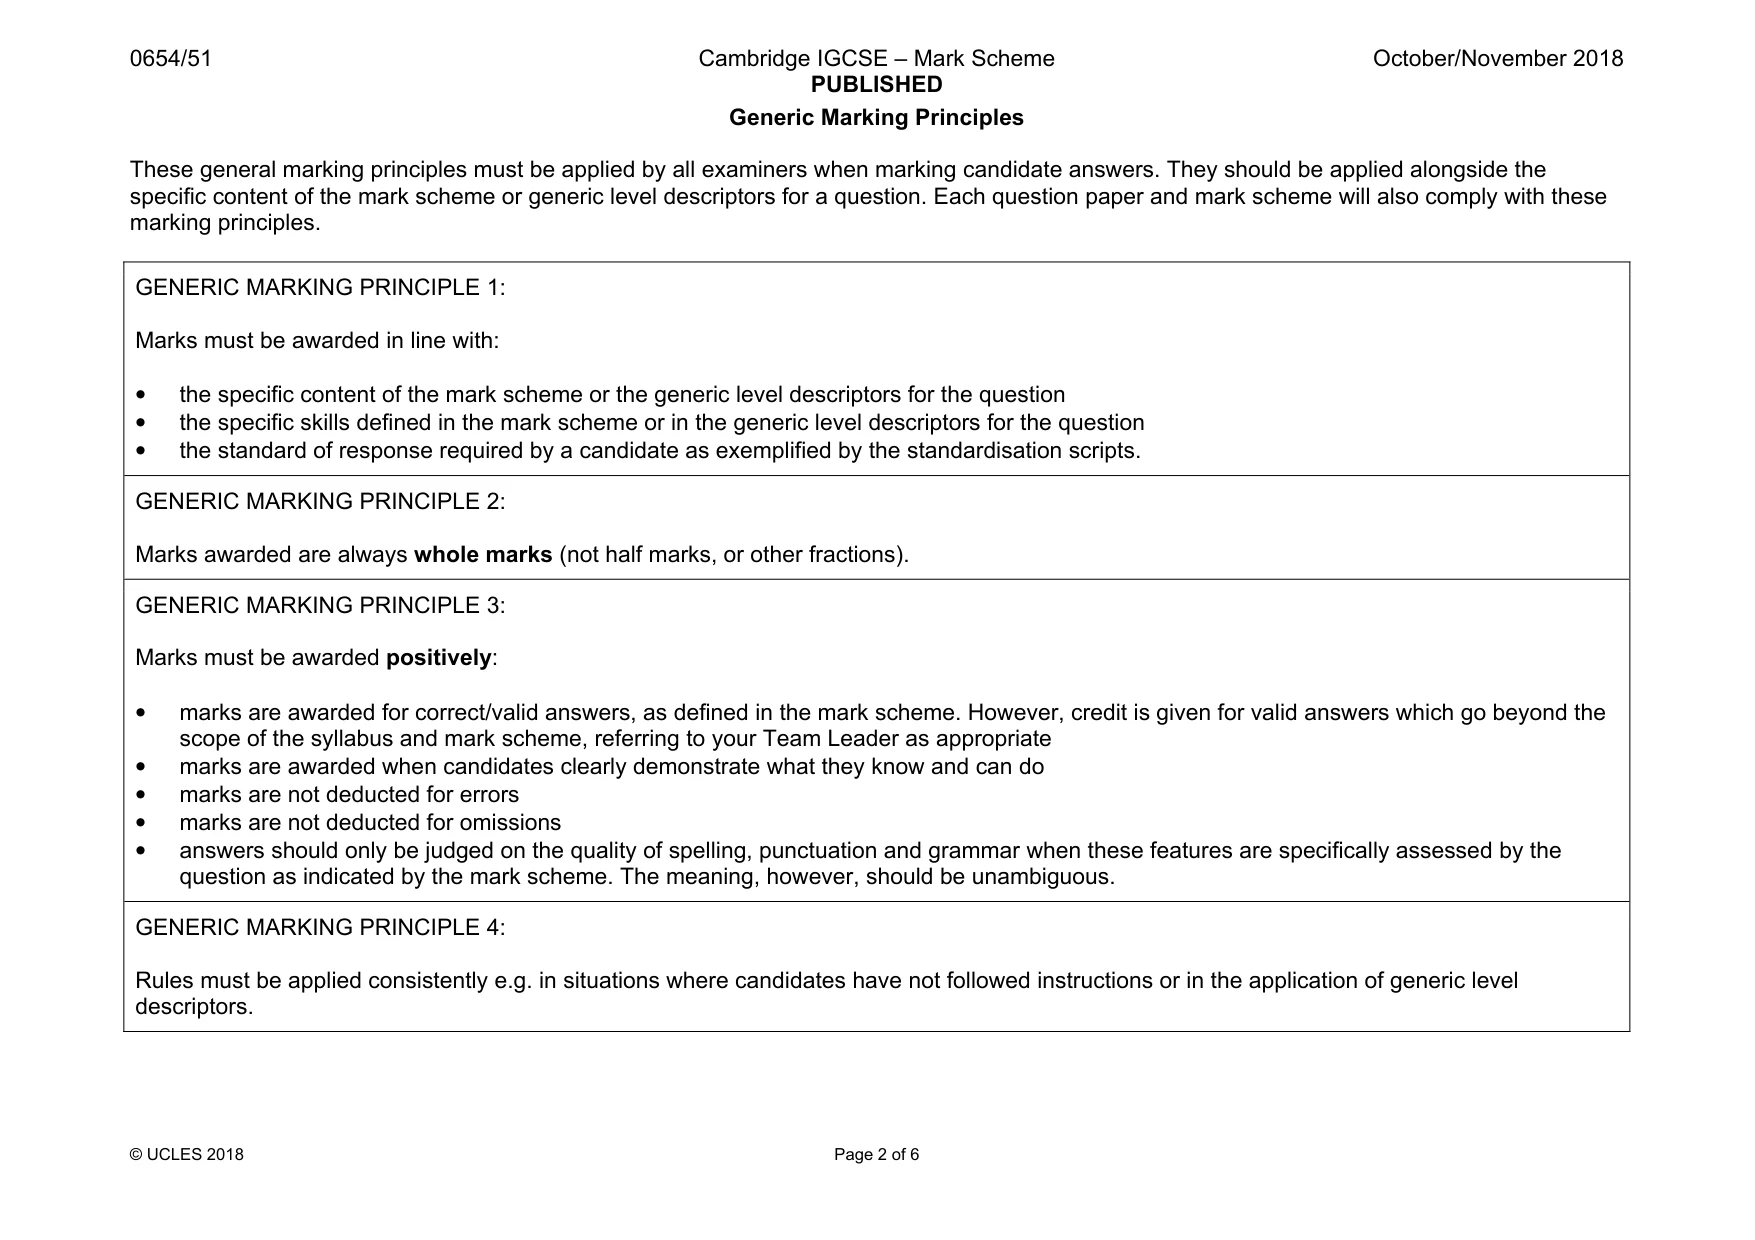
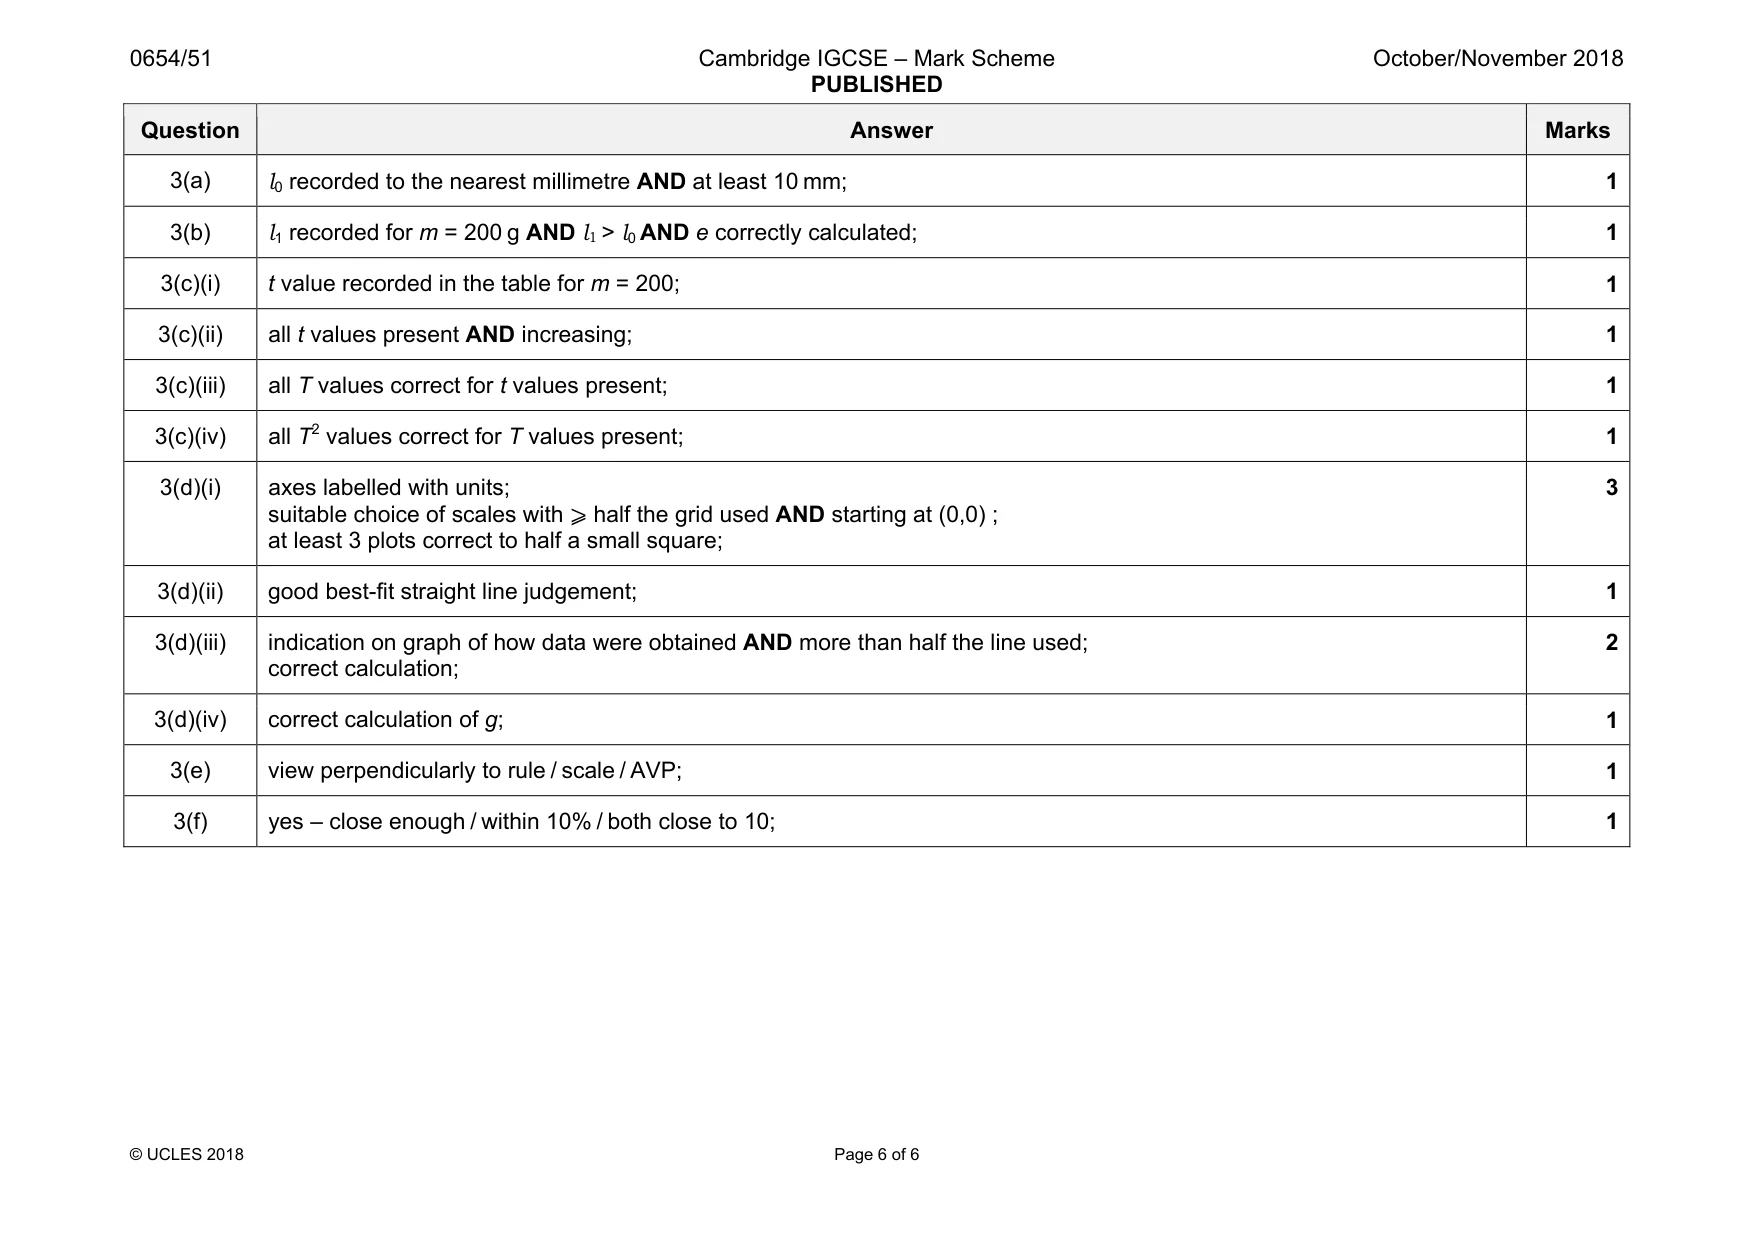
Mark scheme: 3(a) 1 3(b) l1 recorded for m = 200 g AND l1 > l0 AND e correctly calculated; 1 3(c)(i) t value recorded in the table for m = 200; 1 3(c)(ii) all t values present AND increasing; 1 3(c)(iii) all T values correct for t values present; 1 3(c)(iv) all T2 values correct for T values present; 1 3(d)(i) axes labelled with units; suitable choice of scales with ⩾ half the grid used AND starting at (0,0) ; at least 3 plots correct to half a small square; 3 3(d)(ii) good best-fit straight line judgement; 1 3(d)(iii) indication on graph of how data were obtained AND more than half the line used; correct calculation; 2 3(d)(iv) correct calculation of g; 1 3(e) view perpendicularly to rule / scale / AVP; 1 3(f) yes – close enough / within 10% / both close to 10; 1
What was in this paper
The subtopics covered by these 3 questions, and how many questions each got. Open one in a new tab to see every Cambridge question on it.
What you needed in this session
Cambridge’s own grade thresholds for 2018 Oct/Nov, Paper 5 · Variant 1. A higher threshold means an easier paper — the bar moves with how the cohort did.