Cambridge IGCSE Sciences - Co-ordinated (Double) 0654 — 2024 May/June Paper 5 · Variant 3
0654/53/M/J/24 · 6 questions · 60 marks · ≈68 min
The question paper and its mark scheme, free to read here and free to download. This is Cambridge’s own paper, exactly as it was sat.
Question paper20 pages





Mark scheme9 pages
Answers below. Sit the paper first if you are practising.
Questions as text
Q1 · You are going to investigate the effect of temperature on the movement of molecules…
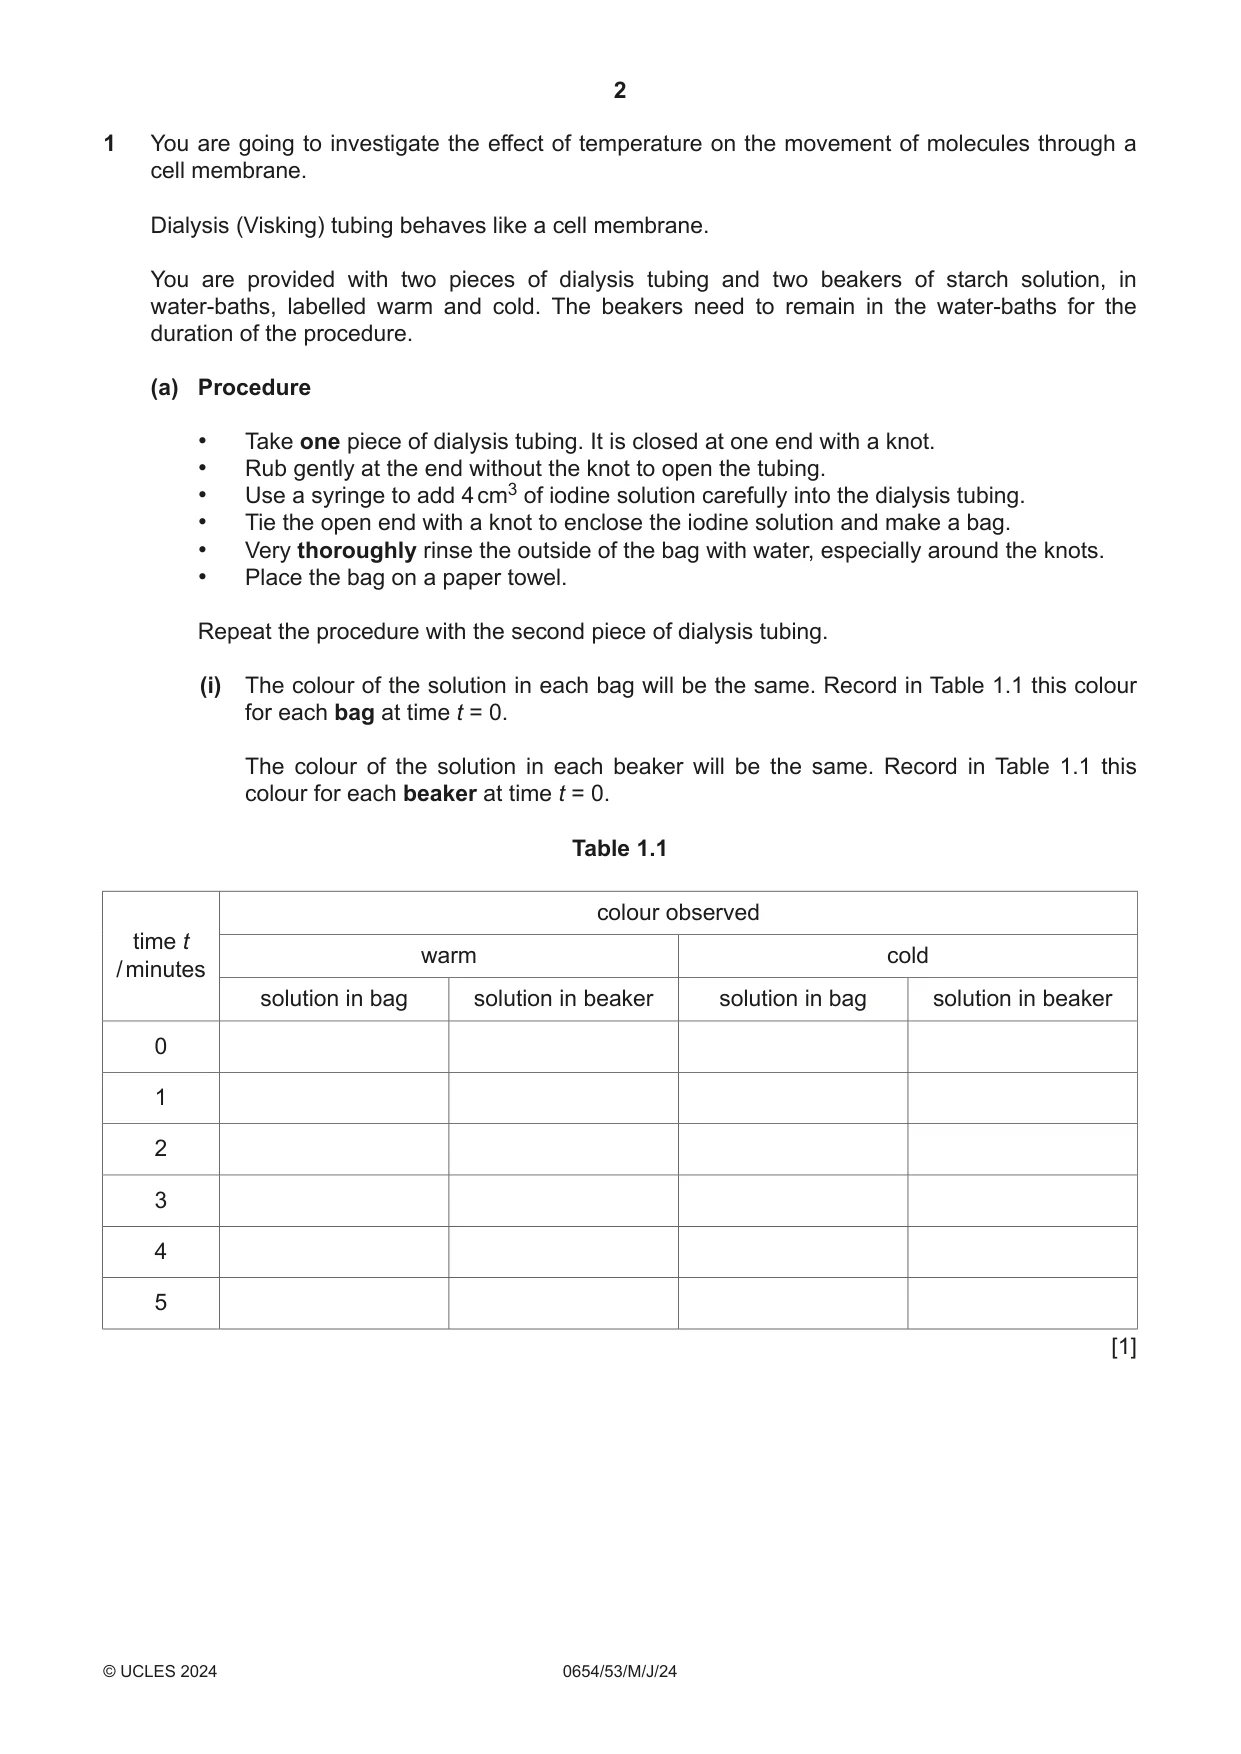
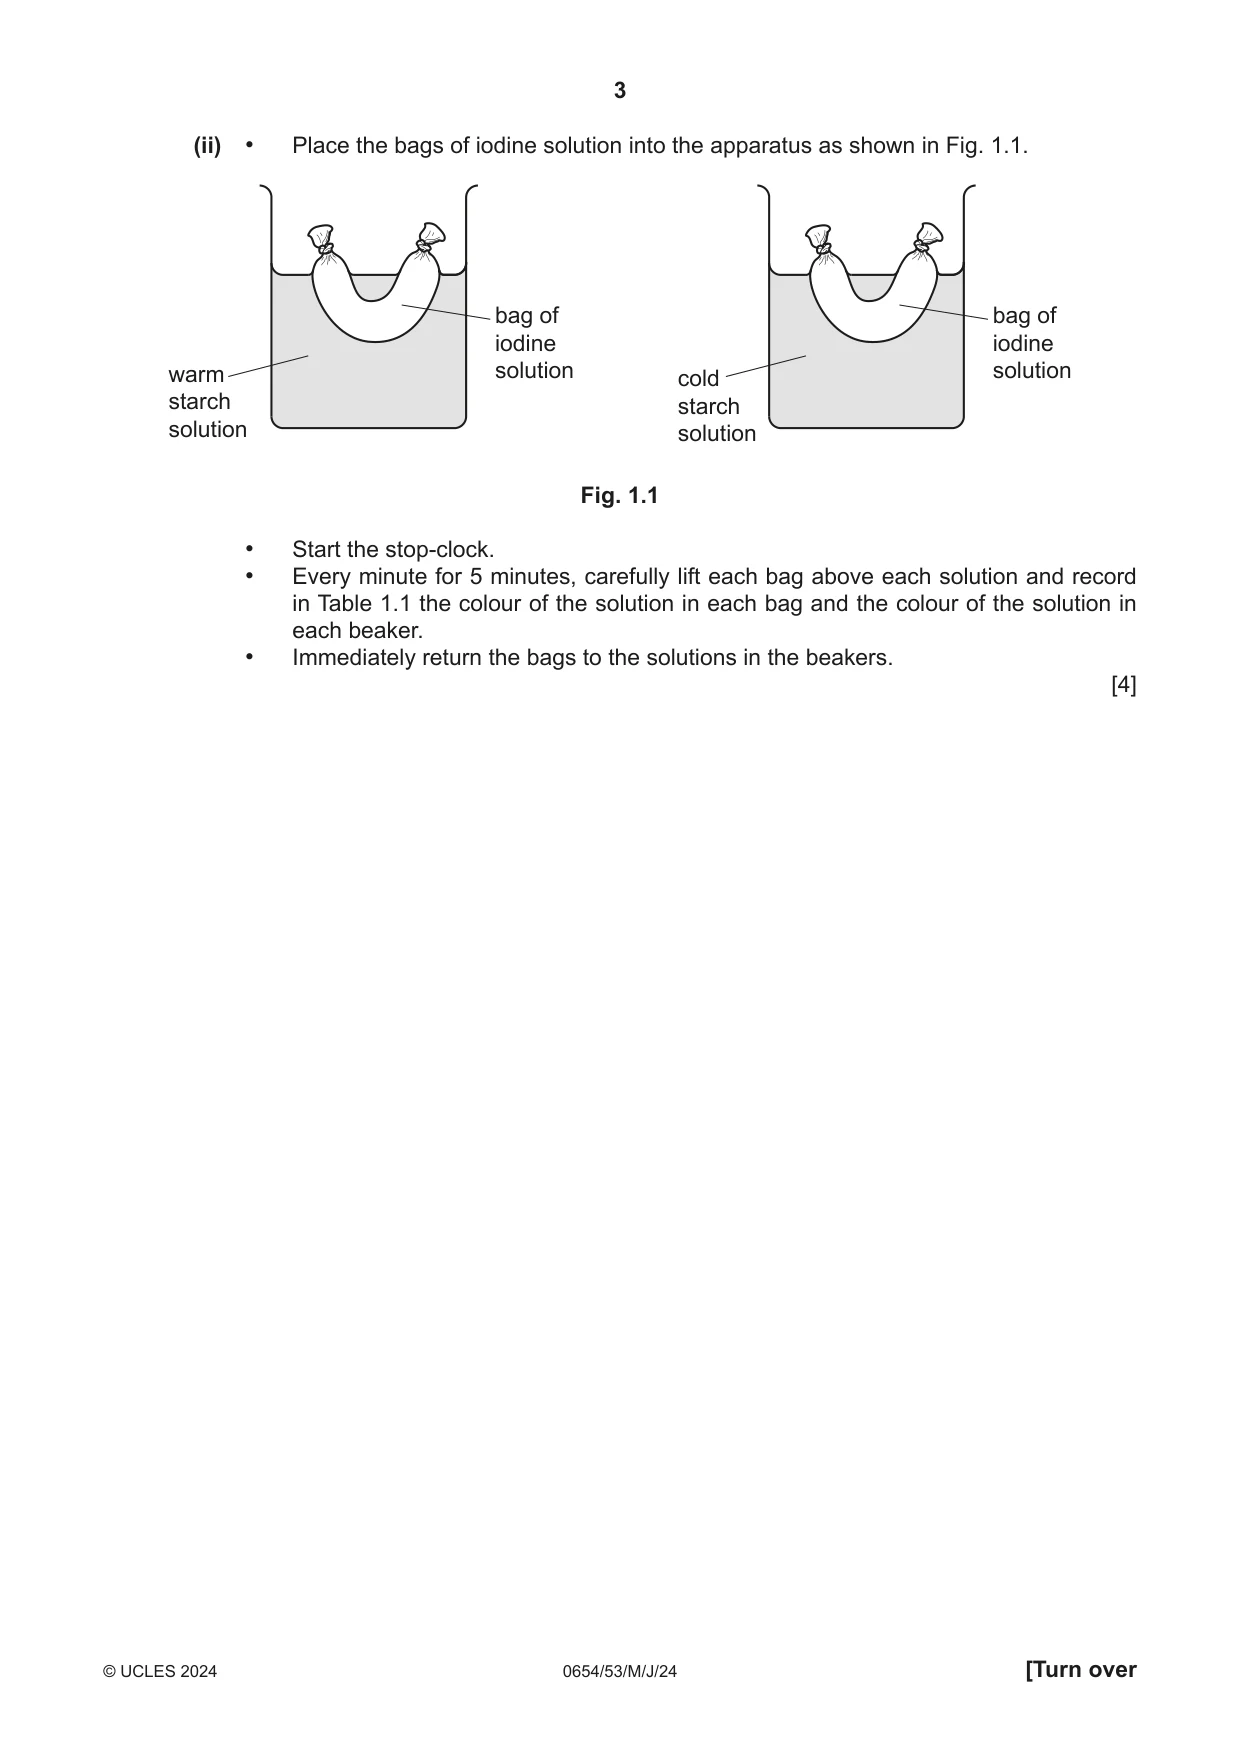
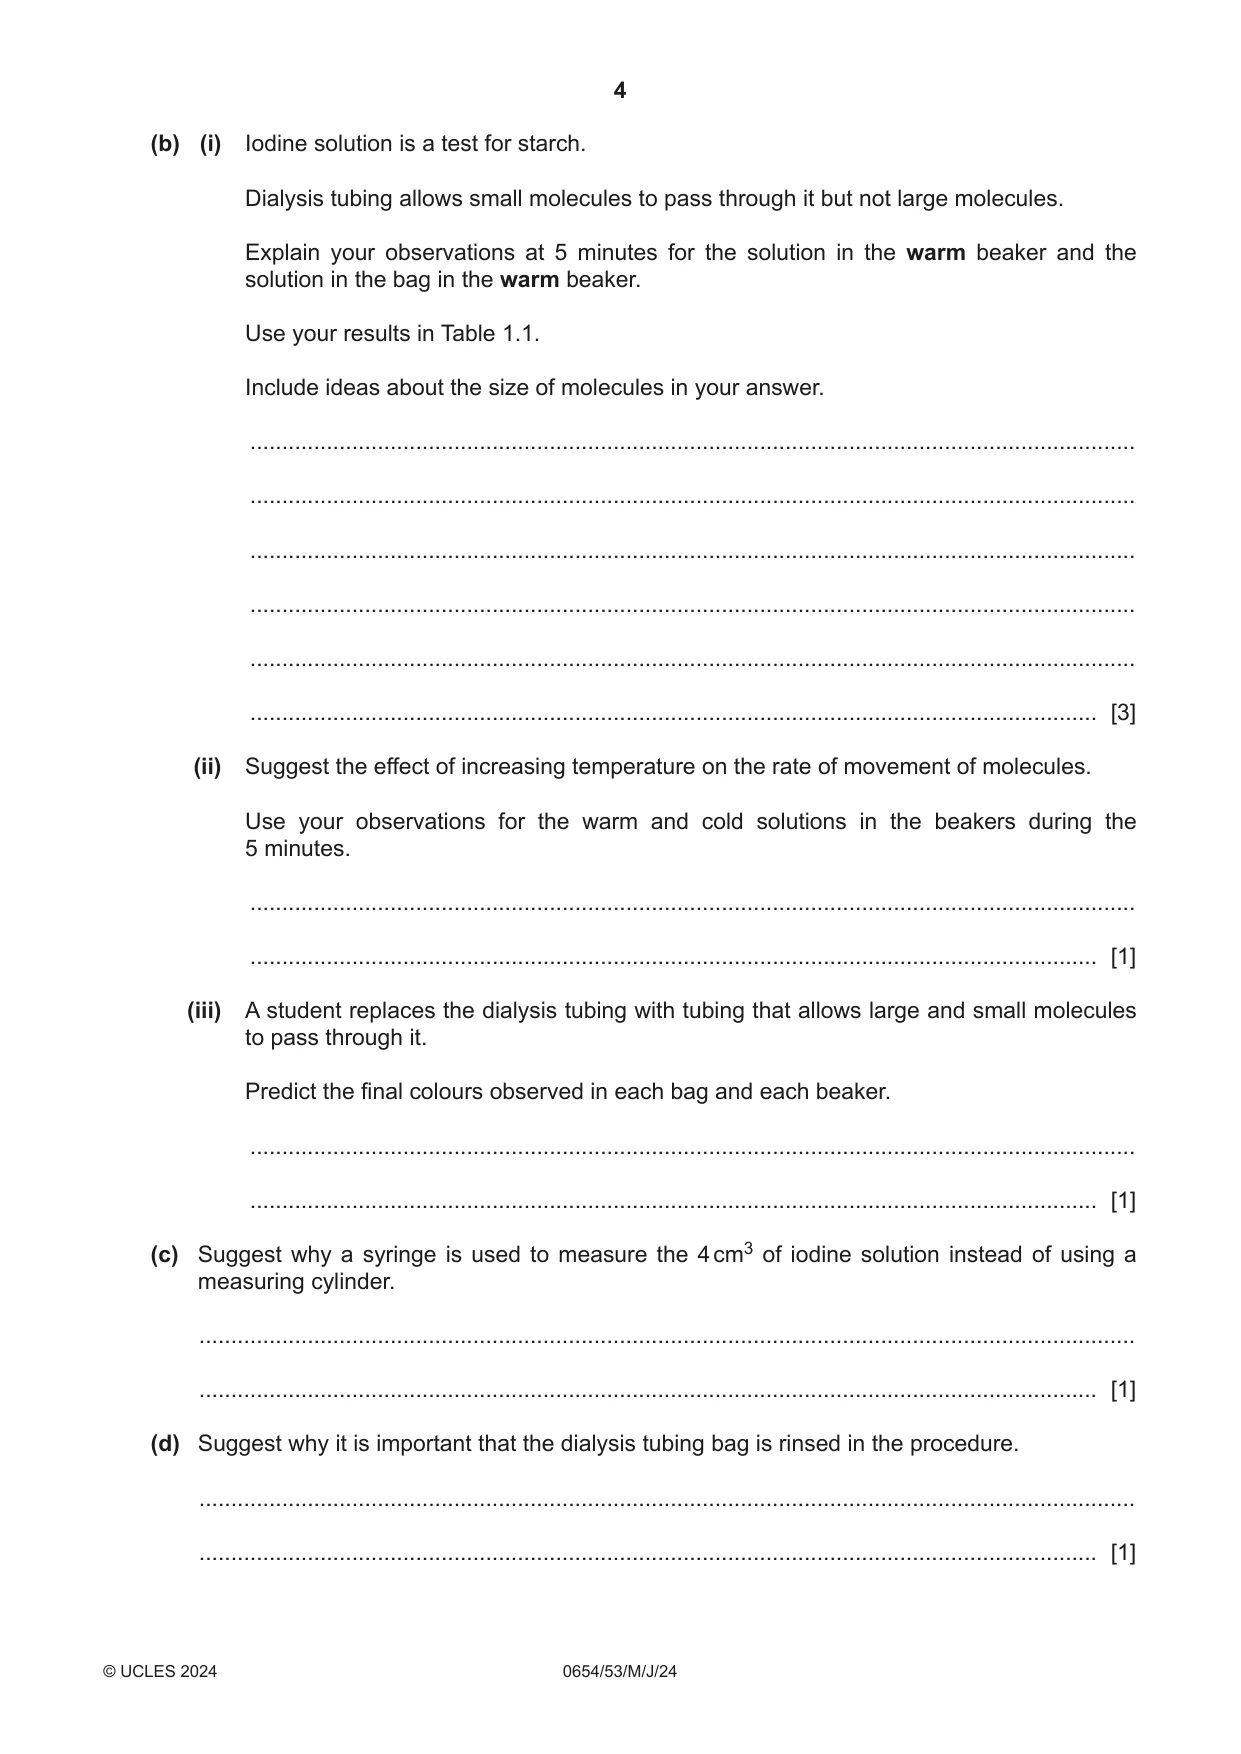
1 You are going to investigate the effect of temperature on the movement of molecules through a cell membrane. Dialysis (Visking) tubing behaves like a cell membrane. You are provided with two pieces of dialysis tubing and two beakers of starch solution, in water-baths, labelled warm and cold. The beakers need to remain in the water-baths for the duration of the procedure. (a) Procedure • Take one piece of dialysis tubing. It is closed at one end with a knot. • Rub gently at the end without the knot to open the tubing. • Use a syringe to add 4 cm3 of iodine solution carefully into the dialysis tubing. • Tie the open end with a knot to enclose the iodine solution and make a bag. • Very thoroughly rinse the outside of the bag with water, especially around the knots. • Place the bag on a paper towel. Repeat the procedure with the second piece of dialysis tubing. (i) The colour of the solution in each bag will be the same. Record in Table 1.1 this colour for each bag at time t = 0. The colour of the solution in each beaker will be the same. Record in Table 1.1 this colour for each beaker at time t = 0. Table 1.1 colour observed time t warm cold / minutes solution in bag solution in beaker solution in bag solution in beaker 0 1 2 3 4 5 [1] (ii) • Place the bags of iodine solution into the apparatus as shown in Fig. 1.1. bag of bag of iodine iodine warm solution cold solution starch starch solution solution Fig. 1.1 • Start the stop-clock. • Every minute for 5 minutes, carefully lift each bag above each solution and record in Table 1.1 the colour of the solution in each bag and the colour of the solution in each beaker. • Immediately return the bags to the solutions in the beakers. [4] (b) (i) Iodine solution is a test for starch. Dialysis tubing allows small molecules to pass through it but not large molecules. Explain your observations at 5 minutes for the solution in the warm beaker and the solution in the bag in the warm beaker. Use your results in Table 1.1. Include ideas about the size of molecules in your answer. ........................................................................................................................................... ........................................................................................................................................... ........................................................................................................................................... ........................................................................................................................................... ........................................................................................................................................... ..................................................................................................................................... [3] (ii) Suggest the effect of increasing temperature on the rate of movement of molecules. Use your observations for the warm and cold solutions in the beakers during the 5 minutes. ........................................................................................................................................... ..................................................................................................................................... [1] (iii) A student replaces the dialysis tubing with tubing that allows large and small molecules to pass through it. Predict the final colours observed in each bag and each beaker. ........................................................................................................................................... ..................................................................................................................................... [1] (c) Suggest why a syringe is used to measure the 4 cm3 of iodine solution instead of using a measuring cylinder. ................................................................................................................................................... ............................................................................................................................................. [1] (d) Suggest why it is important that the dialysis tubing bag is rinsed in the procedure. ................................................................................................................................................... ............................................................................................................................................. [1] (e) Suggest one improvement to the procedure to increase confidence in the results. Explain your answer. improvement ............................................................................................................................. explanation ............................................................................................................................... ................................................................................................................................................... [1] [Total: 13]
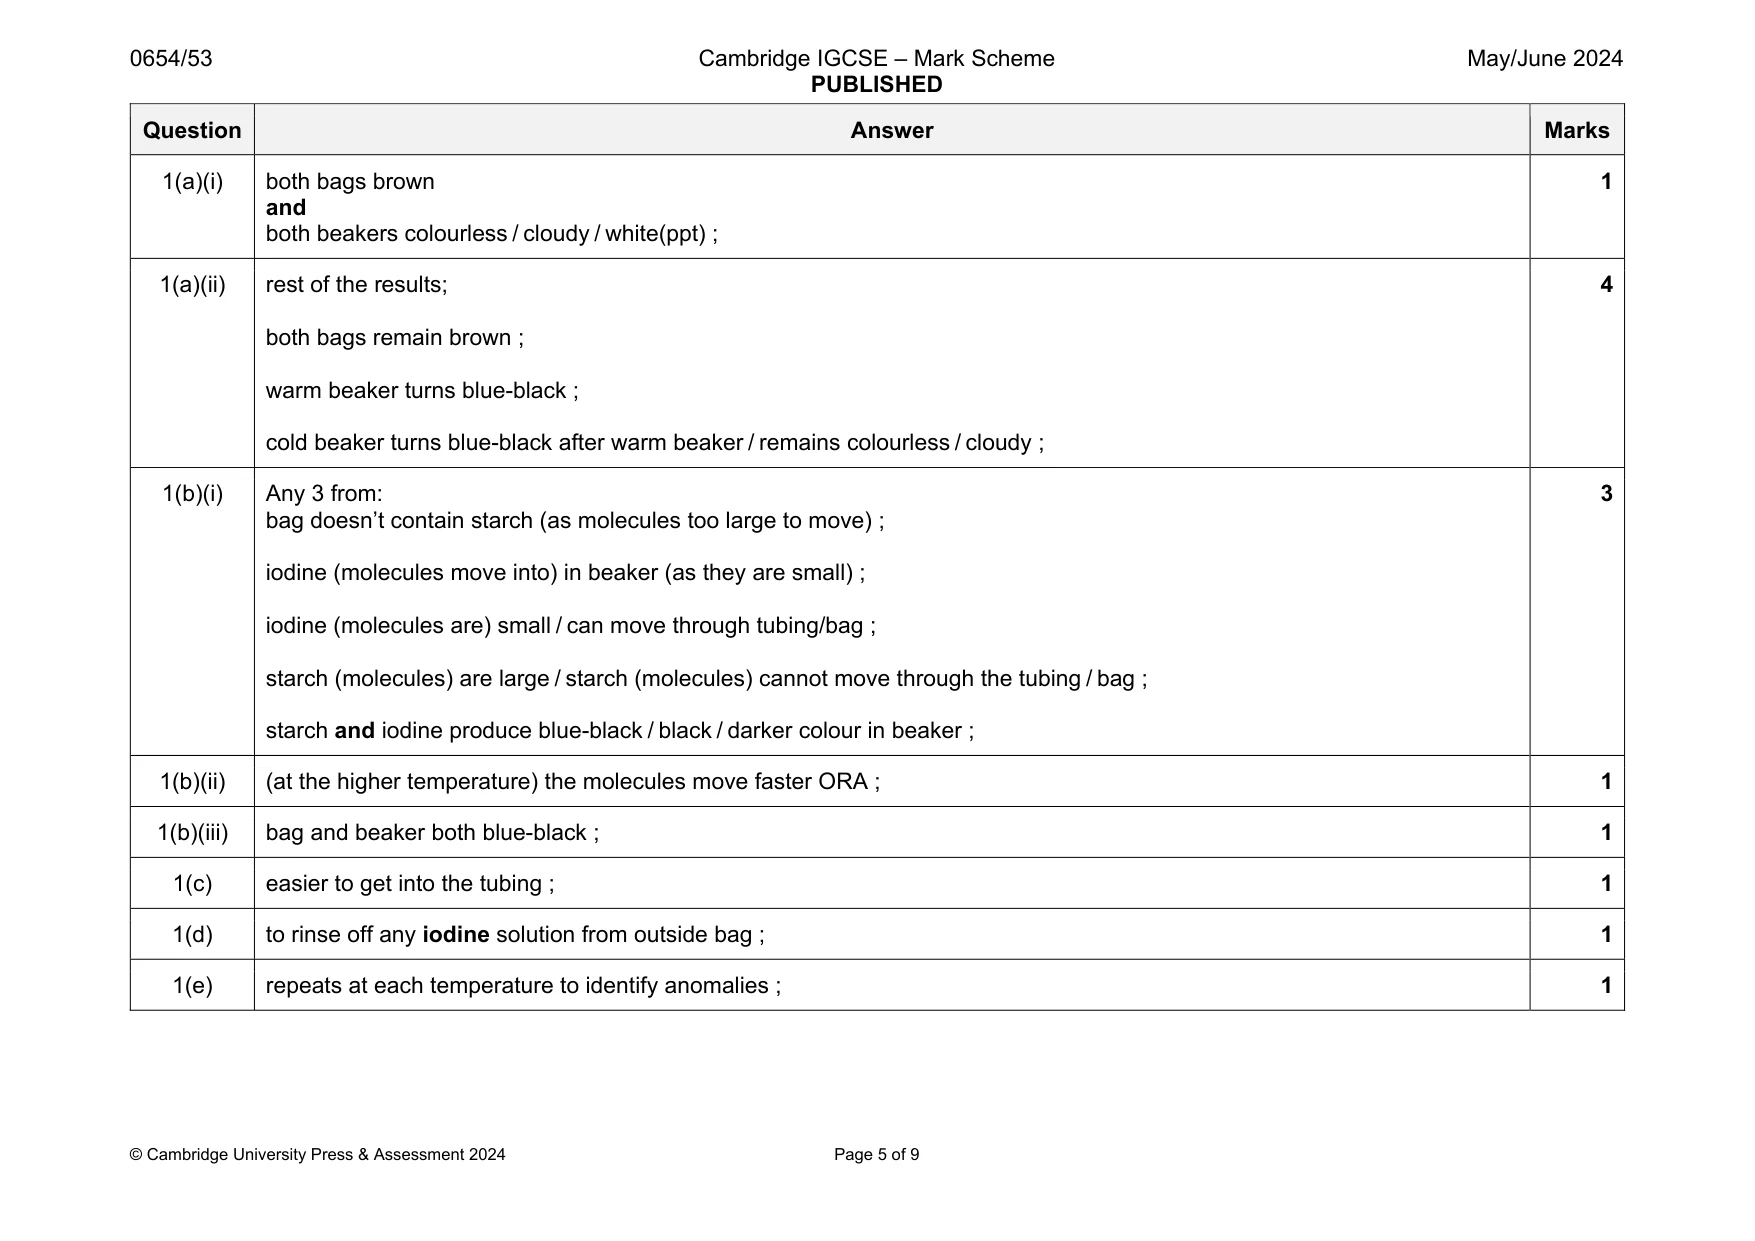
Mark scheme: 1(a)(i) both bags brown and both beakers colourless / cloudy / white(ppt) ; 1 1(a)(ii) rest of the results; both bags remain brown ; warm beaker turns blue-black ; cold beaker turns blue-black after warm beaker / remains colourless / cloudy ; 4 1(b)(i) Any 3 from: bag doesn’t contain starch (as molecules too large to move) ; iodine (molecules move into) in beaker (as they are small) ; iodine (molecules are) small / can move through tubing/bag ; starch (molecules) are large / starch (molecules) cannot move through the tubing / bag ; starch and iodine produce blue-black / black / darker colour in beaker ; 3 1(b)(ii) (at the higher temperature) the molecules move faster ORA ; 1 1(b)(iii) bag and beaker both blue-black ; 1 1(c) easier to get into the tubing ; 1 1(d) to rinse off any iodine solution from outside bag ; 1 1(e) repeats at each temperature to identify anomalies ; 1
Q2 · Plant seedlings need light to grow
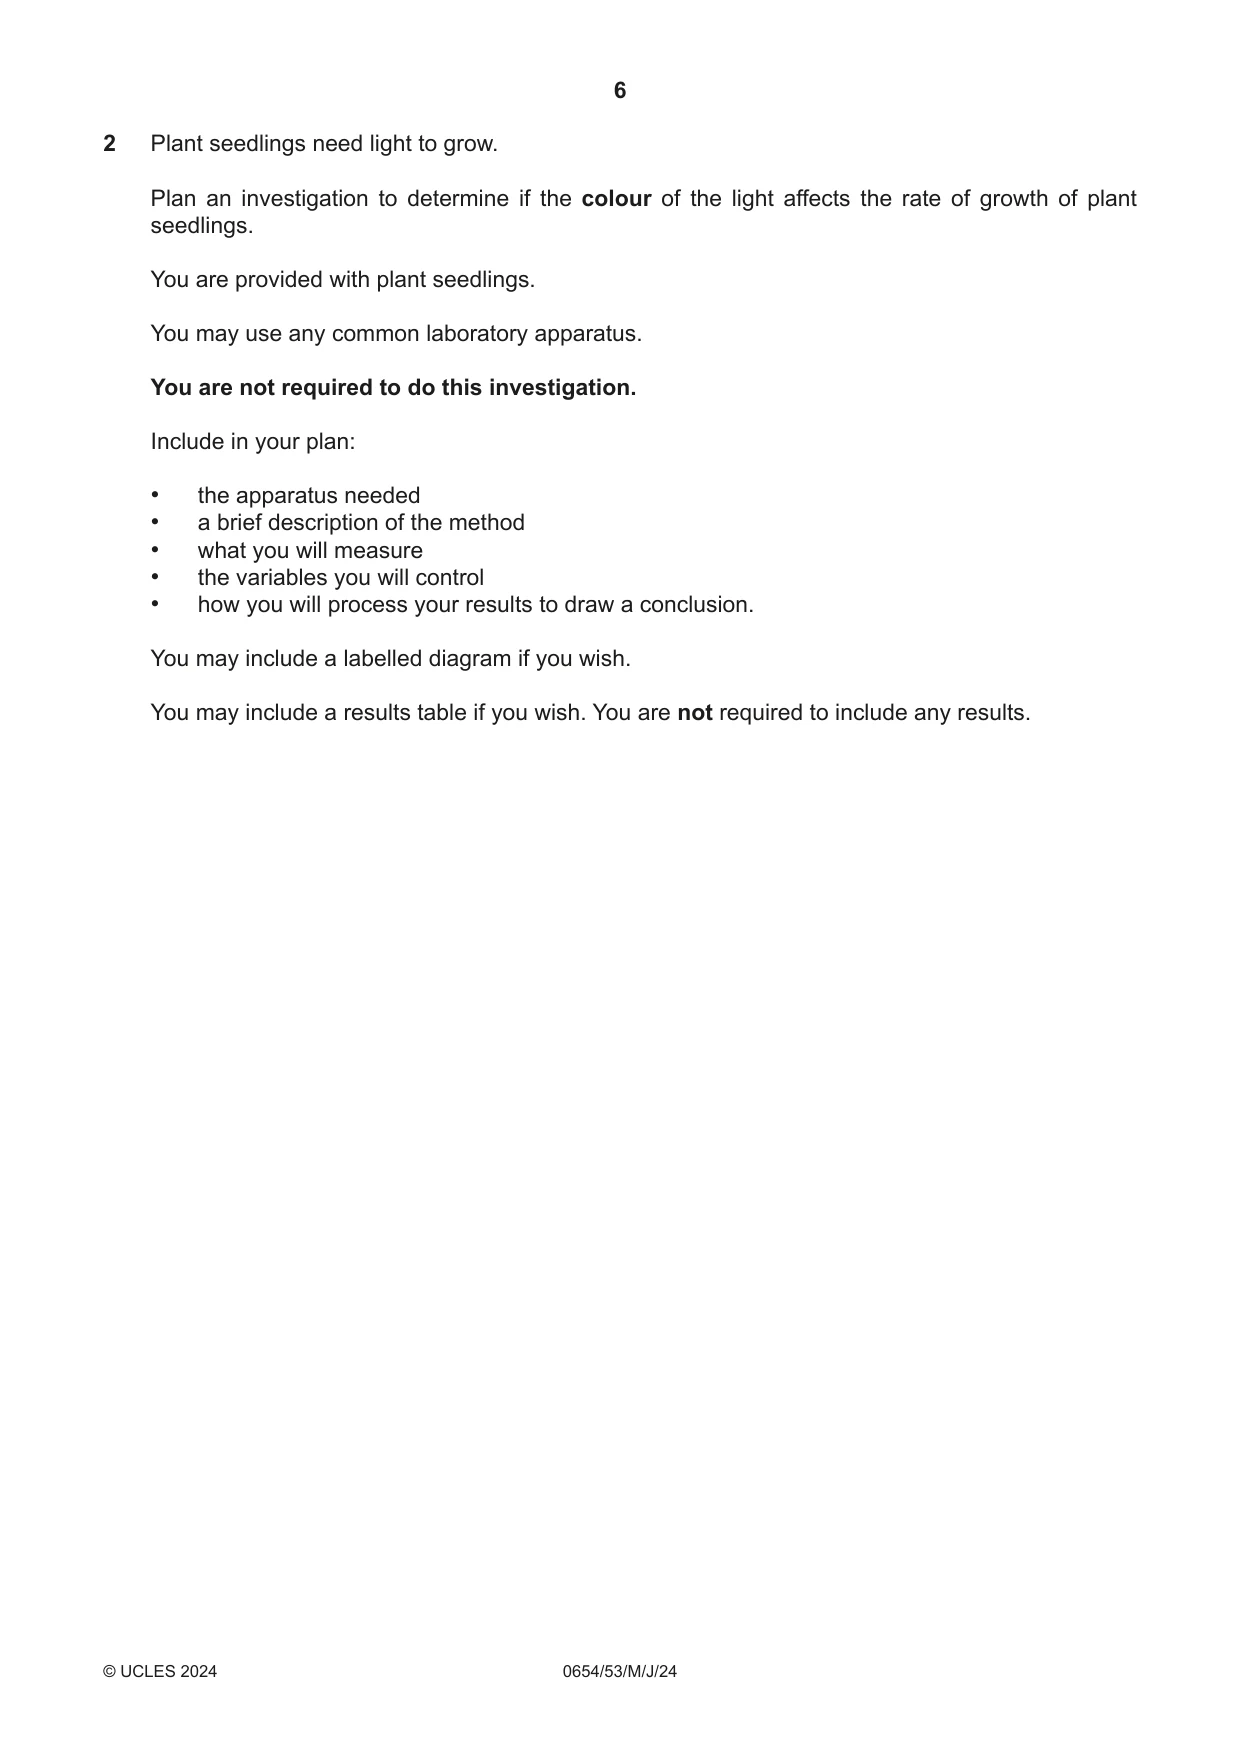
2 Plant seedlings need light to grow. Plan an investigation to determine if the colour of the light affects the rate of growth of plant seedlings. You are provided with plant seedlings. You may use any common laboratory apparatus. You are not required to do this investigation. Include in your plan: • the apparatus needed • a brief description of the method • what you will measure • the variables you will control • how you will process your results to draw a conclusion. You may include a labelled diagram if you wish. You may include a results table if you wish. You are not required to include any results. .......................................................................................................................................................... .......................................................................................................................................................... .......................................................................................................................................................... .......................................................................................................................................................... .......................................................................................................................................................... .......................................................................................................................................................... .......................................................................................................................................................... .......................................................................................................................................................... .......................................................................................................................................................... .......................................................................................................................................................... .......................................................................................................................................................... .......................................................................................................................................................... .......................................................................................................................................................... .......................................................................................................................................................... .......................................................................................................................................................... .......................................................................................................................................................... .......................................................................................................................................................... .......................................................................................................................................................... .......................................................................................................................................................... .......................................................................................................................................................... .................................................................................................................................................... [7]
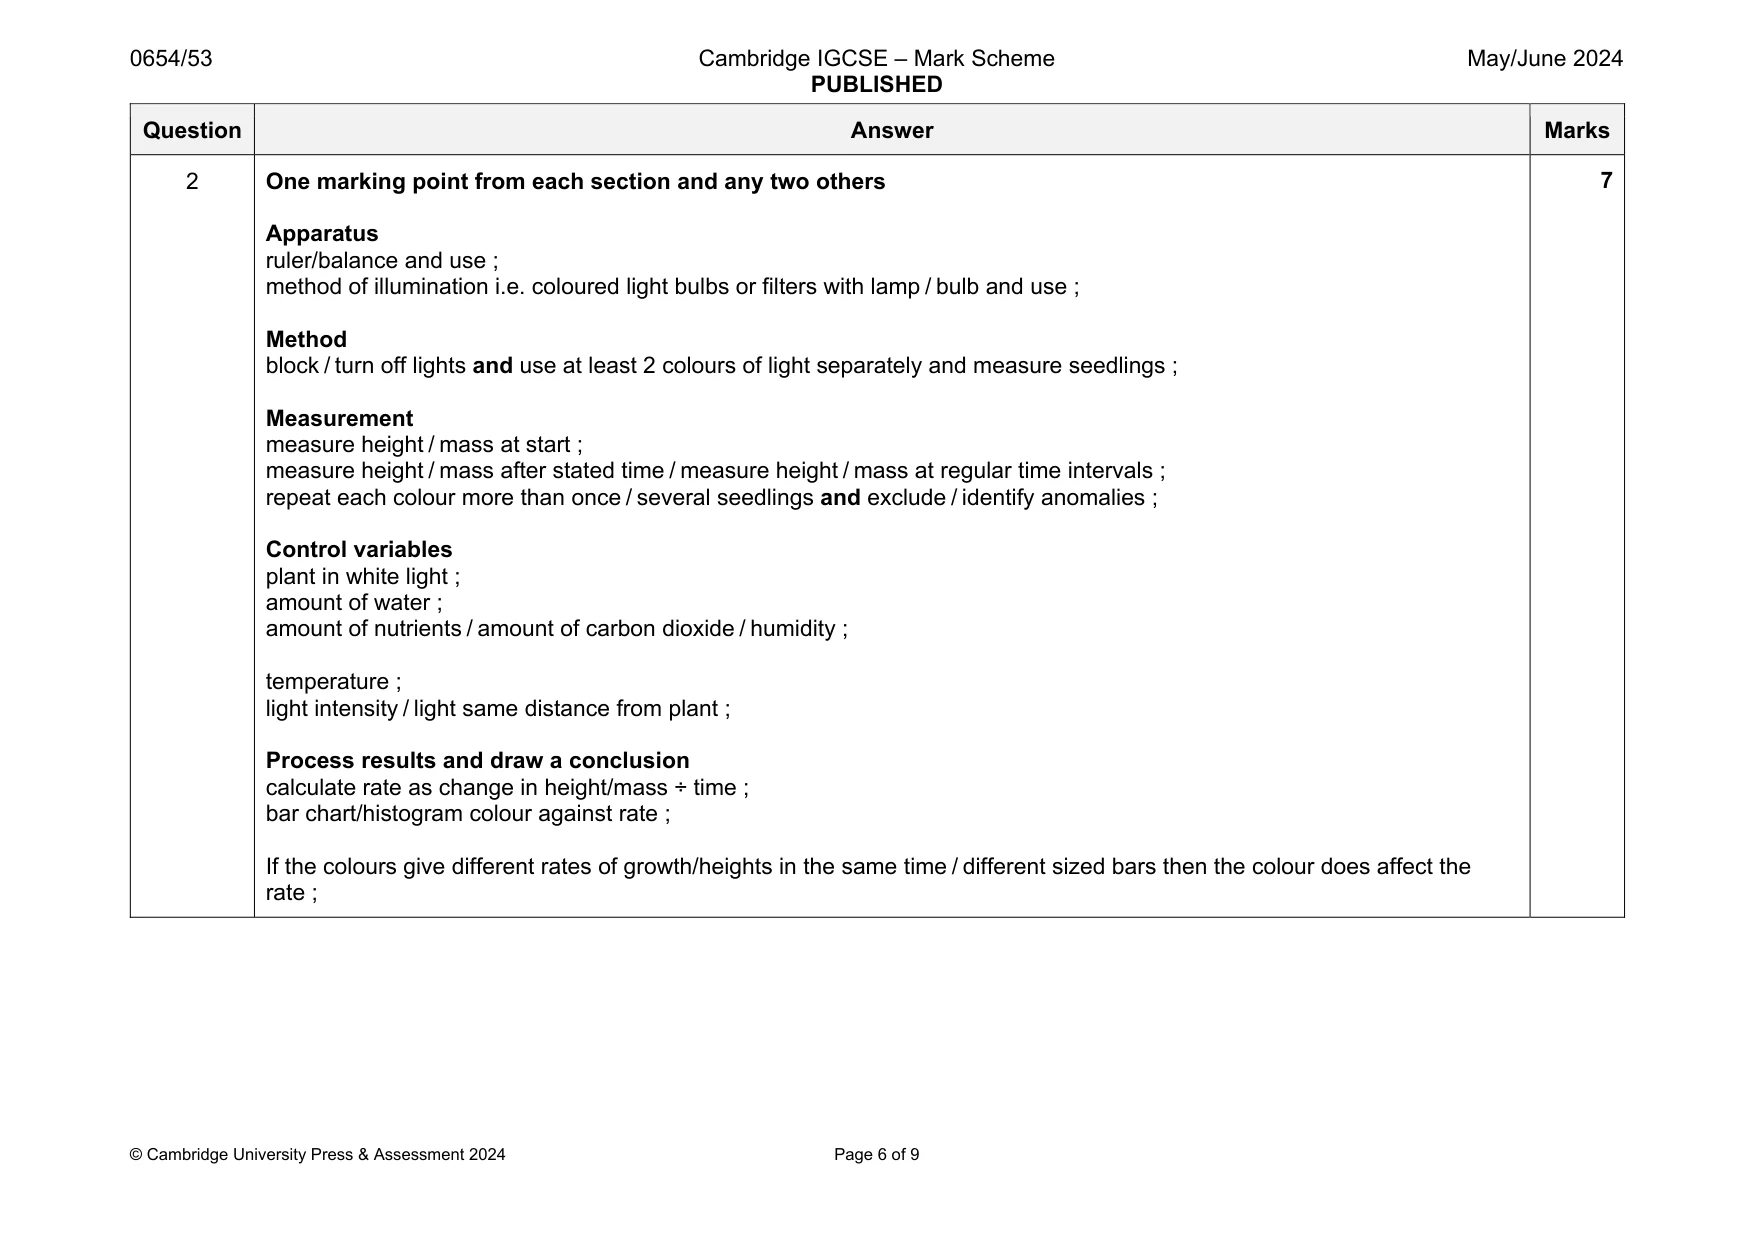
Mark scheme: 2 One marking point from each section and any two others Apparatus ruler/balance and use ; method of illumination i.e. coloured light bulbs or filters with lamp / bulb and use ; Method block / turn off lights and use at least 2 colours of light separately and measure seedlings ; Measurement measure height / mass at start ; measure height / mass after stated time / measure height / mass at regular time intervals ; repeat each colour more than once / several seedlings and exclude / identify anomalies ; Control variables plant in white light ; amount of water ; amount of nutrients / amount of carbon dioxide / humidity ; temperature ; light intensity / light same distance from plant ; Process results and draw a conclusion calculate rate as change in height/mass ÷ time ; bar chart/histogram colour against rate ; If the colours give different rates of growth/heights in the same time / different sized bars then the colour does affect the rate ;
Q3 · You are going to investigate the thermal energy released during a neutralisation reaction
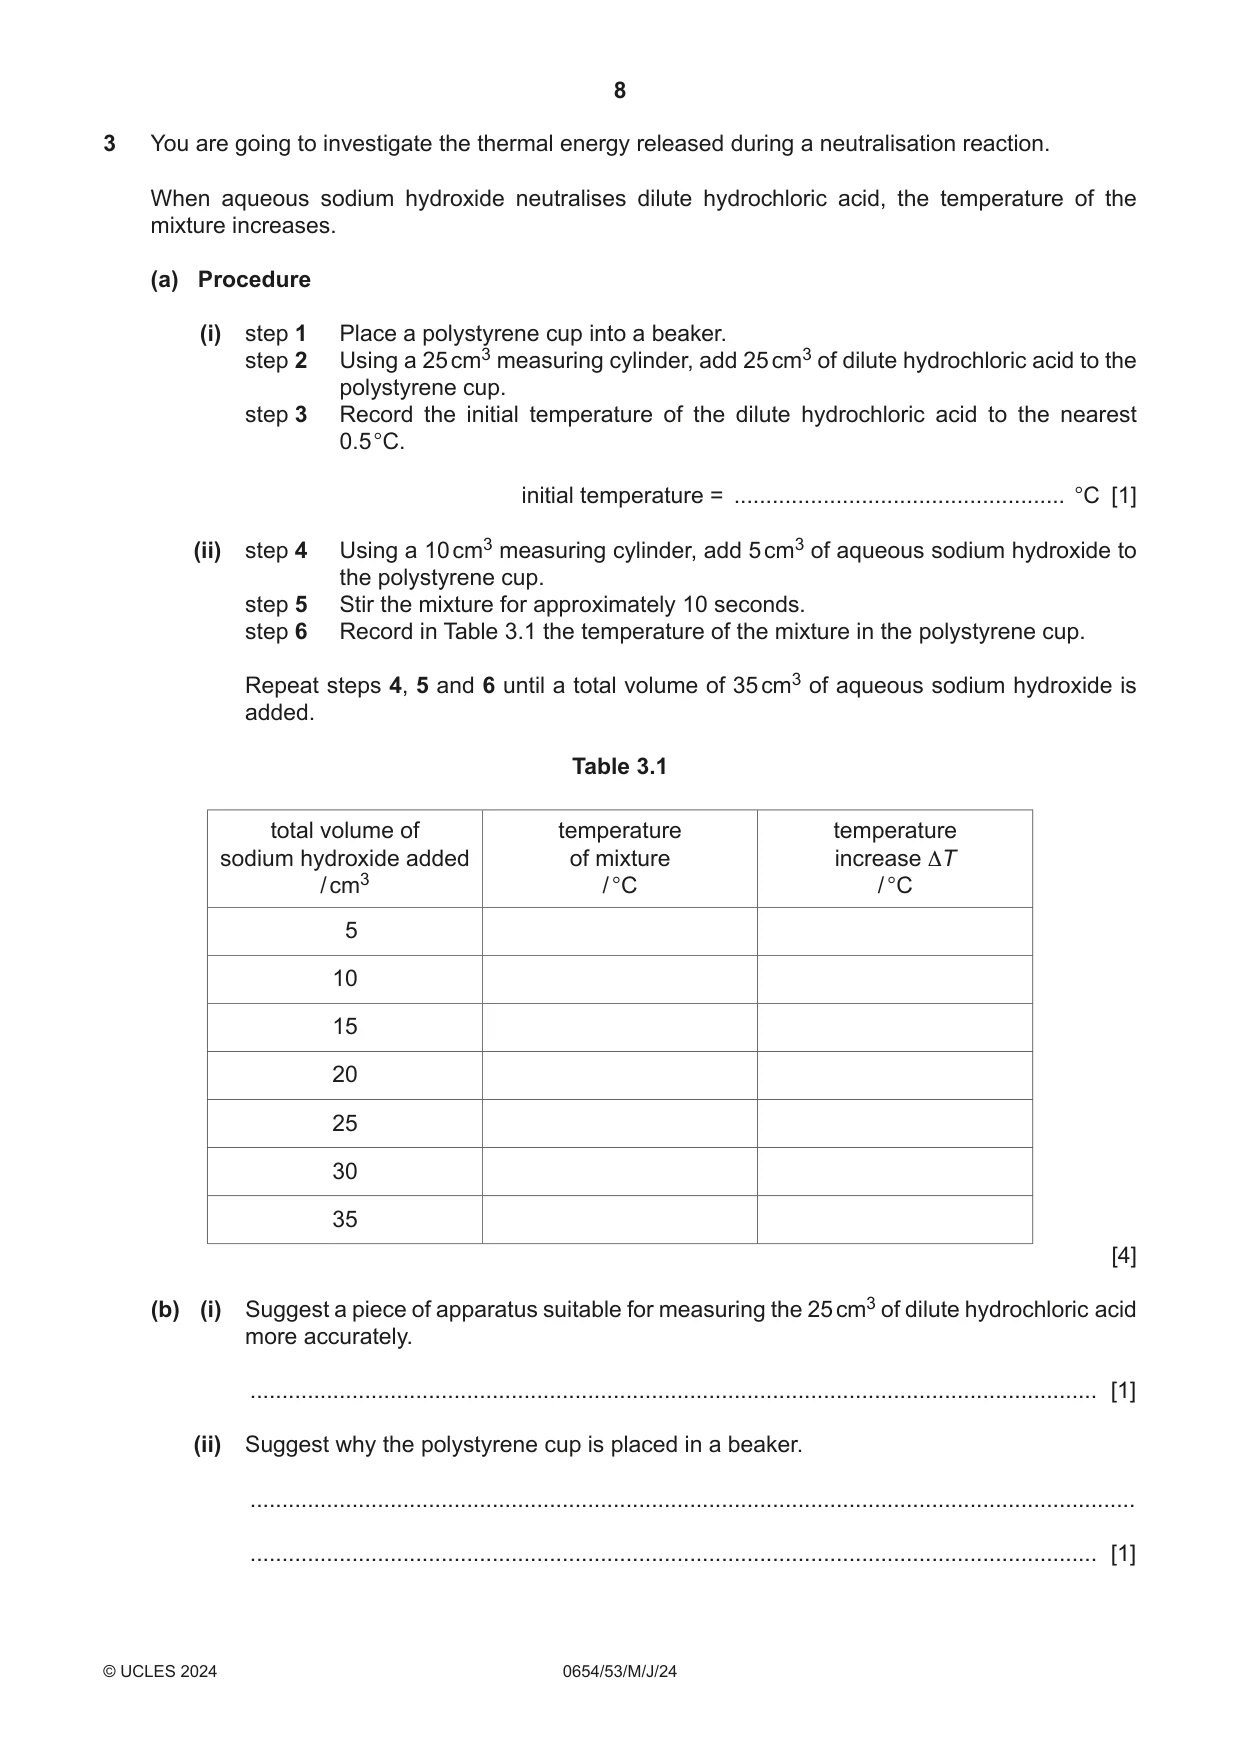
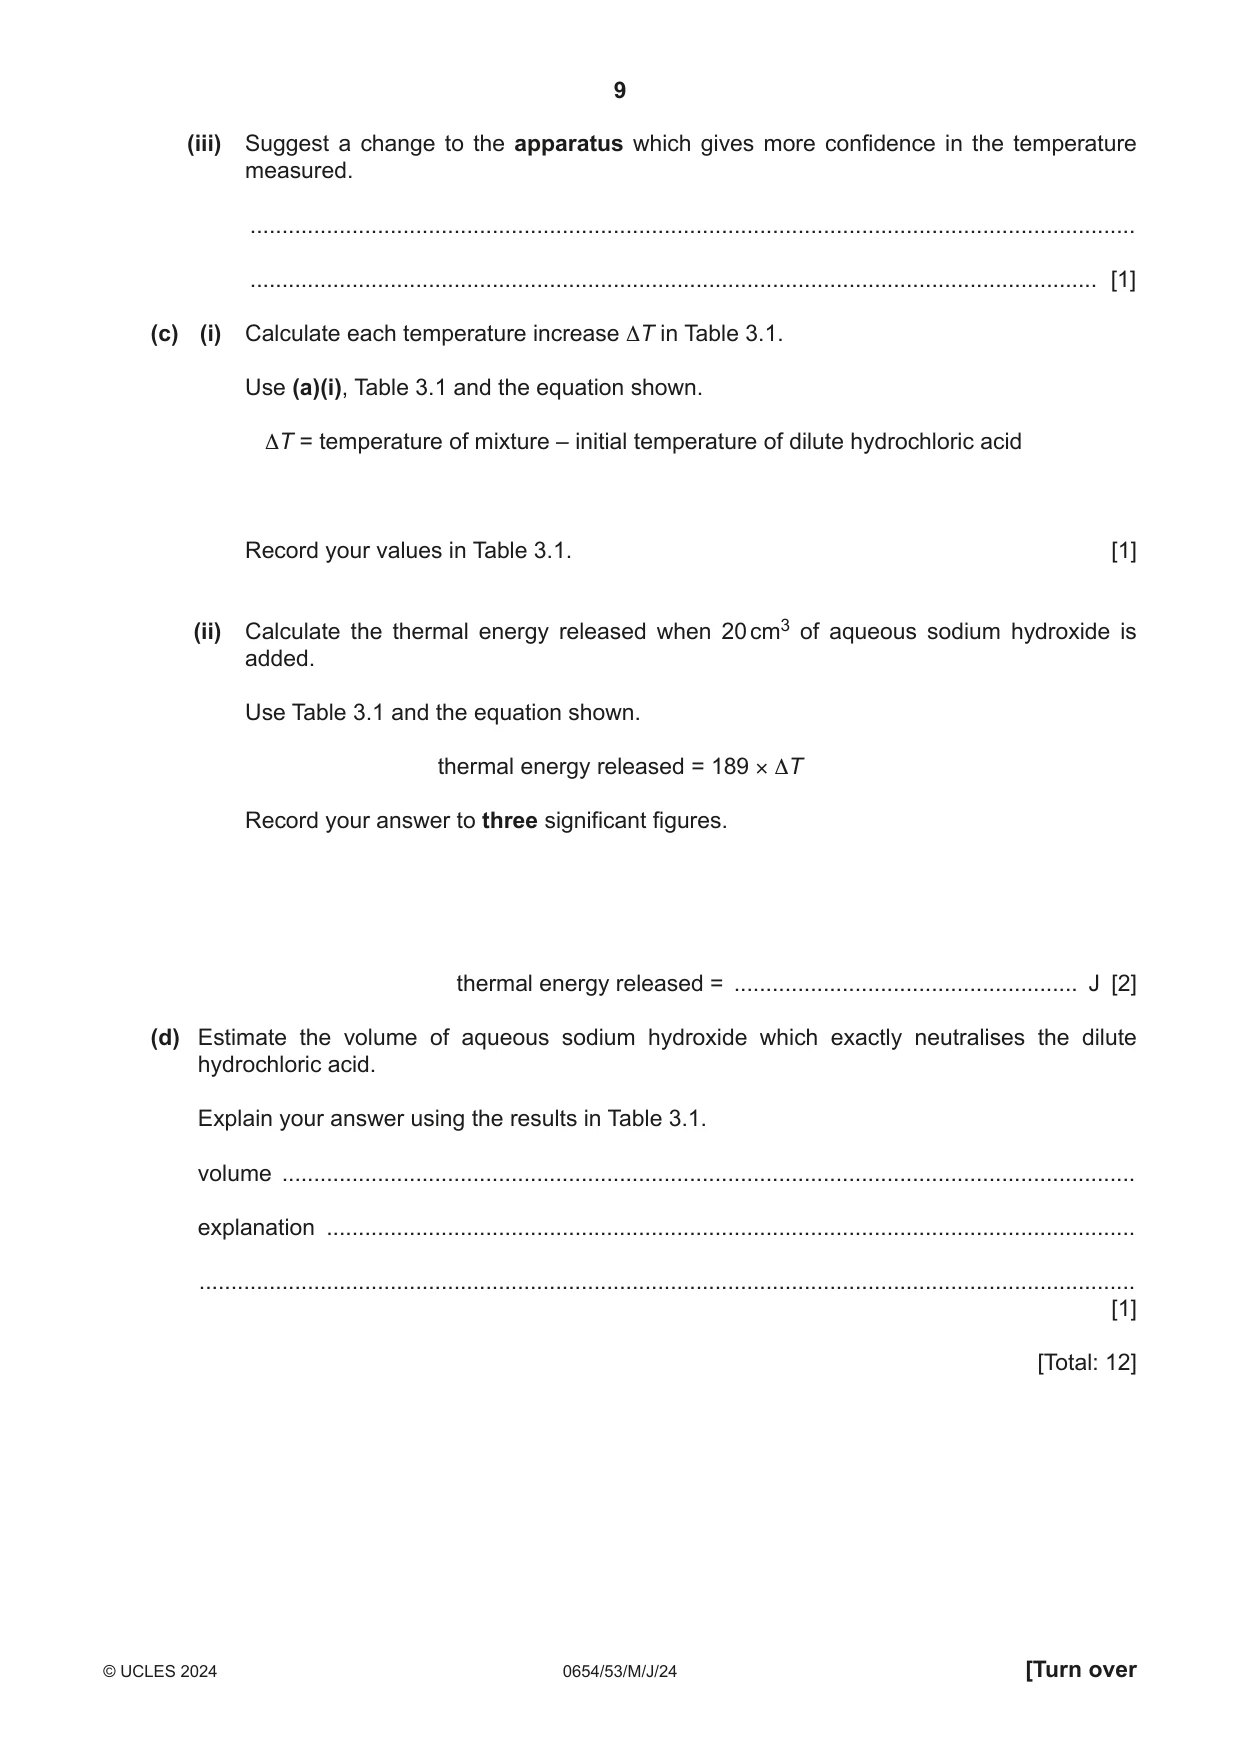
3 You are going to investigate the thermal energy released during a neutralisation reaction. When aqueous sodium hydroxide neutralises dilute hydrochloric acid, the temperature of the mixture increases. (a) Procedure (i) step 1 Place a polystyrene cup into a beaker. step 2 Using a 25 cm3 measuring cylinder, add 25 cm3 of dilute hydrochloric acid to the polystyrene cup. step 3 Record the initial temperature of the dilute hydrochloric acid to the nearest 0.5 °C. initial temperature = .................................................... °C [1] (ii) step 4 Using a 10 cm3 measuring cylinder, add 5 cm3 of aqueous sodium hydroxide to the polystyrene cup. step 5 Stir the mixture for approximately 10 seconds. step 6 Record in Table 3.1 the temperature of the mixture in the polystyrene cup. Repeat steps 4, 5 and 6 until a total volume of 35 cm3 of aqueous sodium hydroxide is added. Table 3.1 total volume of temperature temperature sodium hydroxide added of mixture increase ΔT / cm3 / °C / °C 5 10 15 20 25 30 35 [4] (b) (i) Suggest a piece of apparatus suitable for measuring the 25 cm3 of dilute hydrochloric acid more accurately. ..................................................................................................................................... [1] (ii) Suggest why the polystyrene cup is placed in a beaker. ........................................................................................................................................... ..................................................................................................................................... [1] (iii) Suggest a change to the apparatus which gives more confidence in the temperature measured. ........................................................................................................................................... ..................................................................................................................................... [1] (c) (i) Calculate each temperature increase ΔT in Table 3.1. Use (a)(i), Table 3.1 and the equation shown. ΔT = temperature of mixture – initial temperature of dilute hydrochloric acid Record your values in Table 3.1. [1] (ii) Calculate the thermal energy released when 20 cm3 of aqueous sodium hydroxide is added. Use Table 3.1 and the equation shown. thermal energy released = 189 × ΔT Record your answer to three significant figures. thermal energy released = ...................................................... J [2] (d) Estimate the volume of aqueous sodium hydroxide which exactly neutralises the dilute hydrochloric acid. Explain your answer using the results in Table 3.1. volume ...................................................................................................................................... explanation ............................................................................................................................... ................................................................................................................................................... [1] [Total: 12]
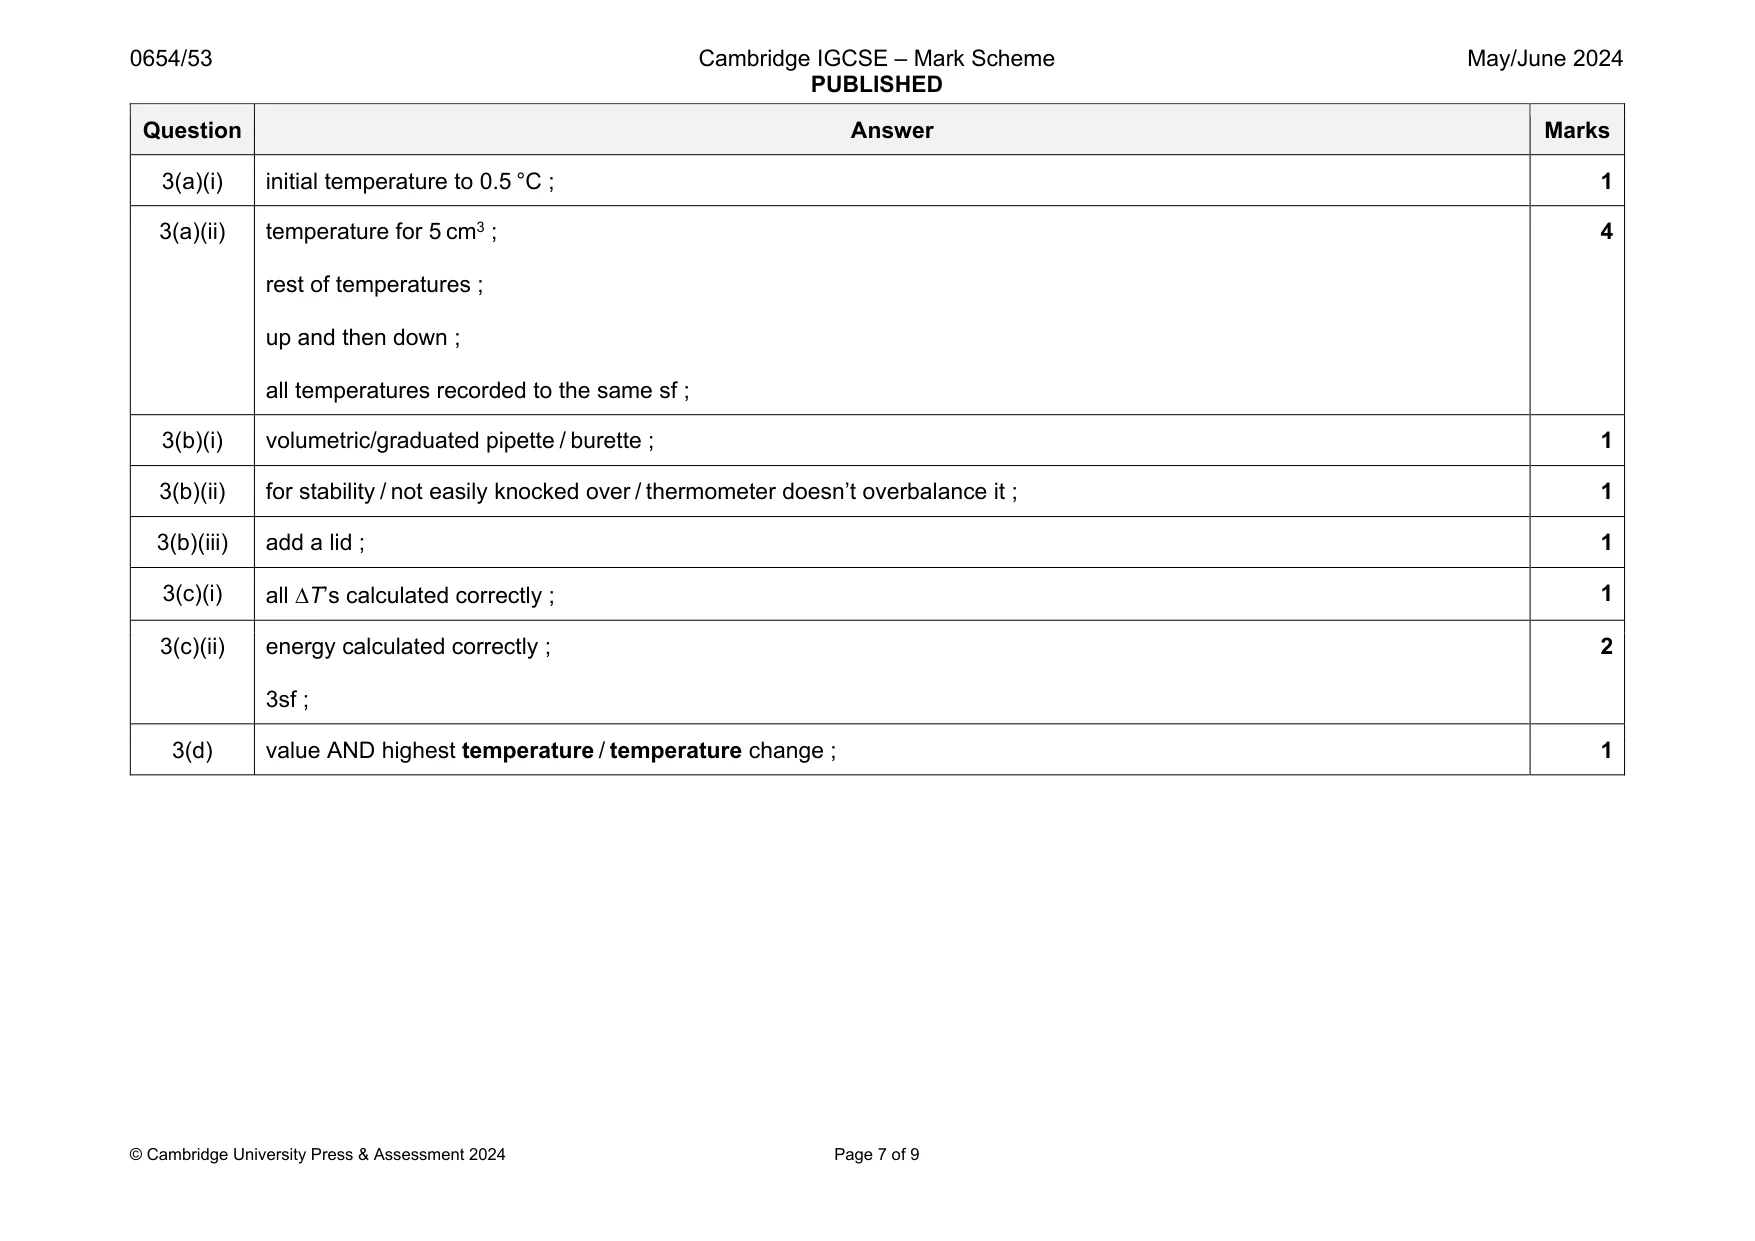
Mark scheme: 3(a)(i) initial temperature to 0.5 °C ; 1 3(a)(ii) temperature for 5 cm3 ; rest of temperatures ; up and then down ; all temperatures recorded to the same sf ; 4 3(b)(i) volumetric/graduated pipette / burette ; 1 3(b)(ii) for stability / not easily knocked over / thermometer doesn’t overbalance it ; 1 3(b)(iii) add a lid ; 1 3(c)(i) all T’s calculated correctly ; 1 3(c)(ii) energy calculated correctly ; 3sf ; 2 3(d) value AND highest temperature / temperature change ; 1
Q4 · You are going to investigate the ions present in solution H
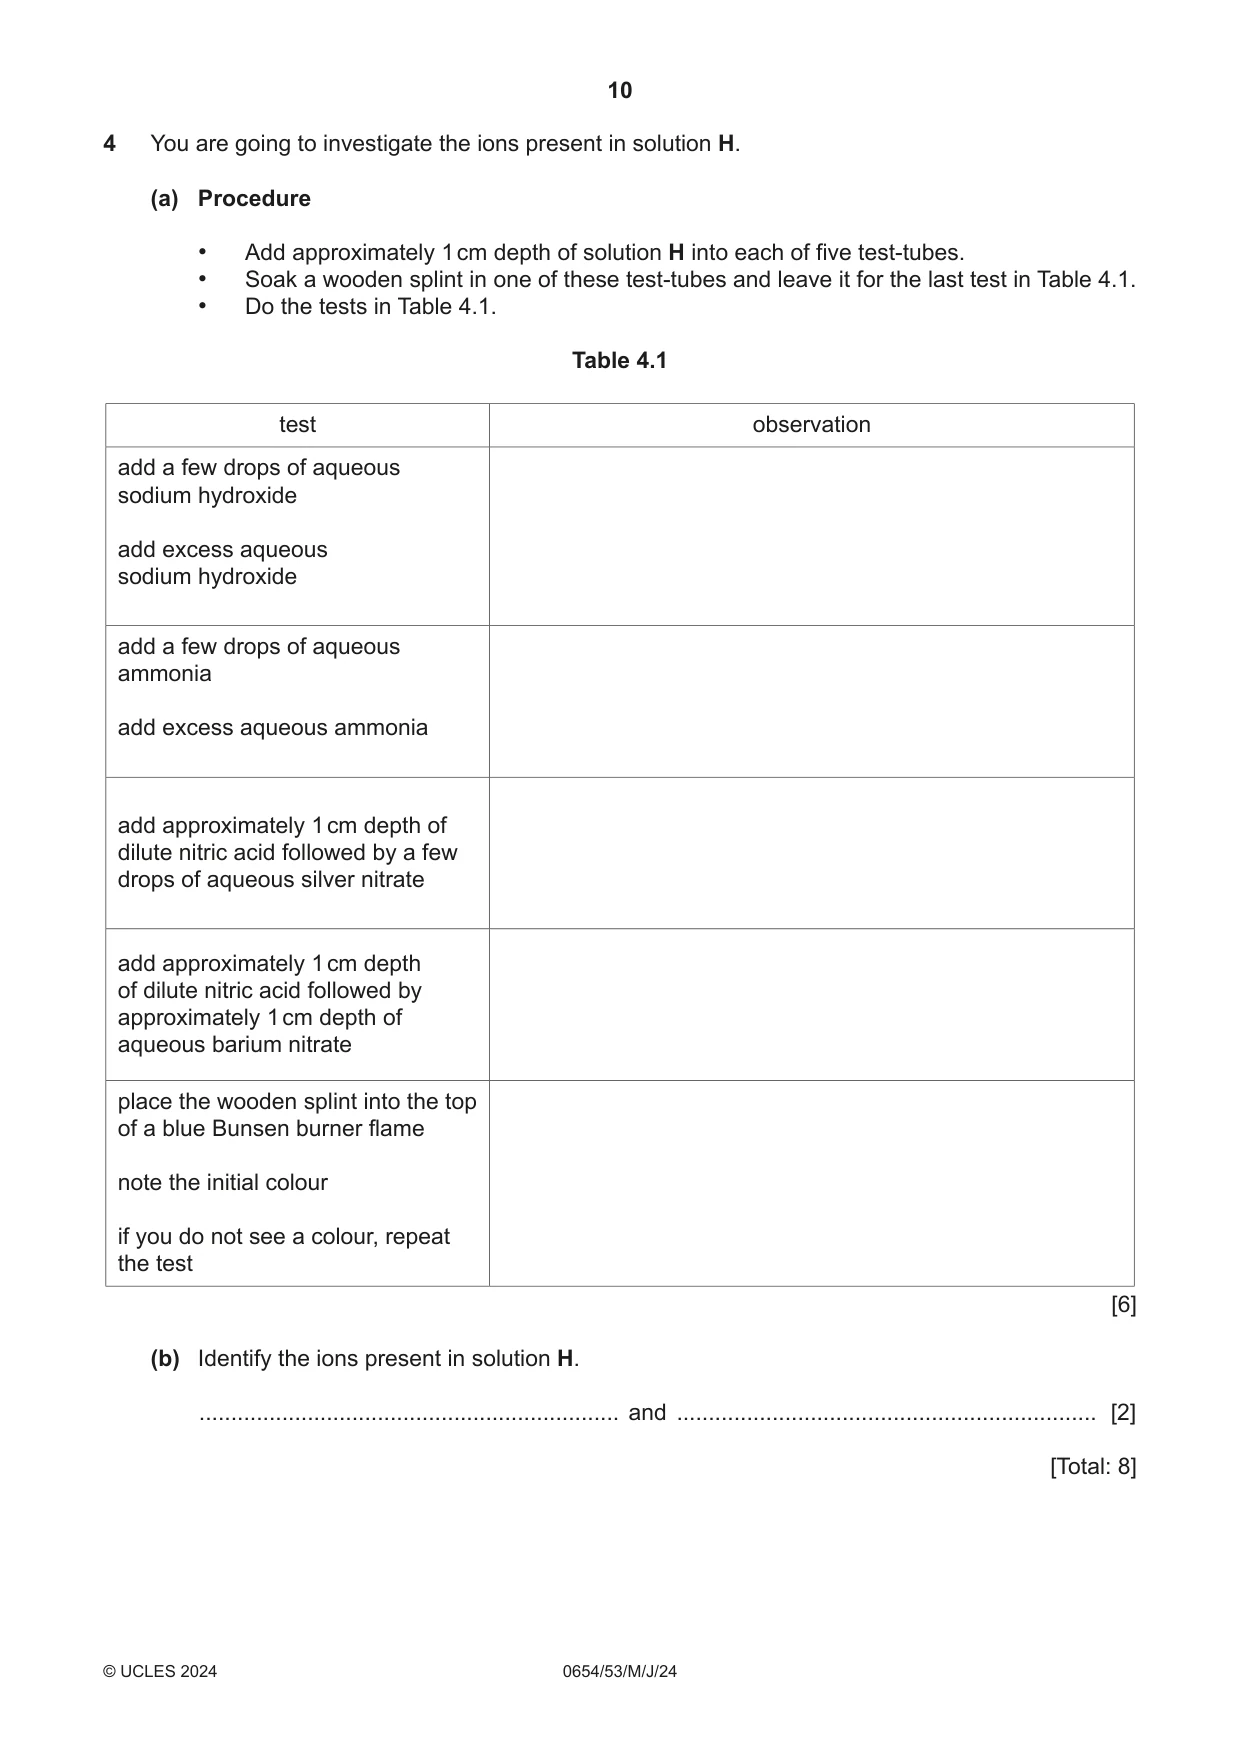
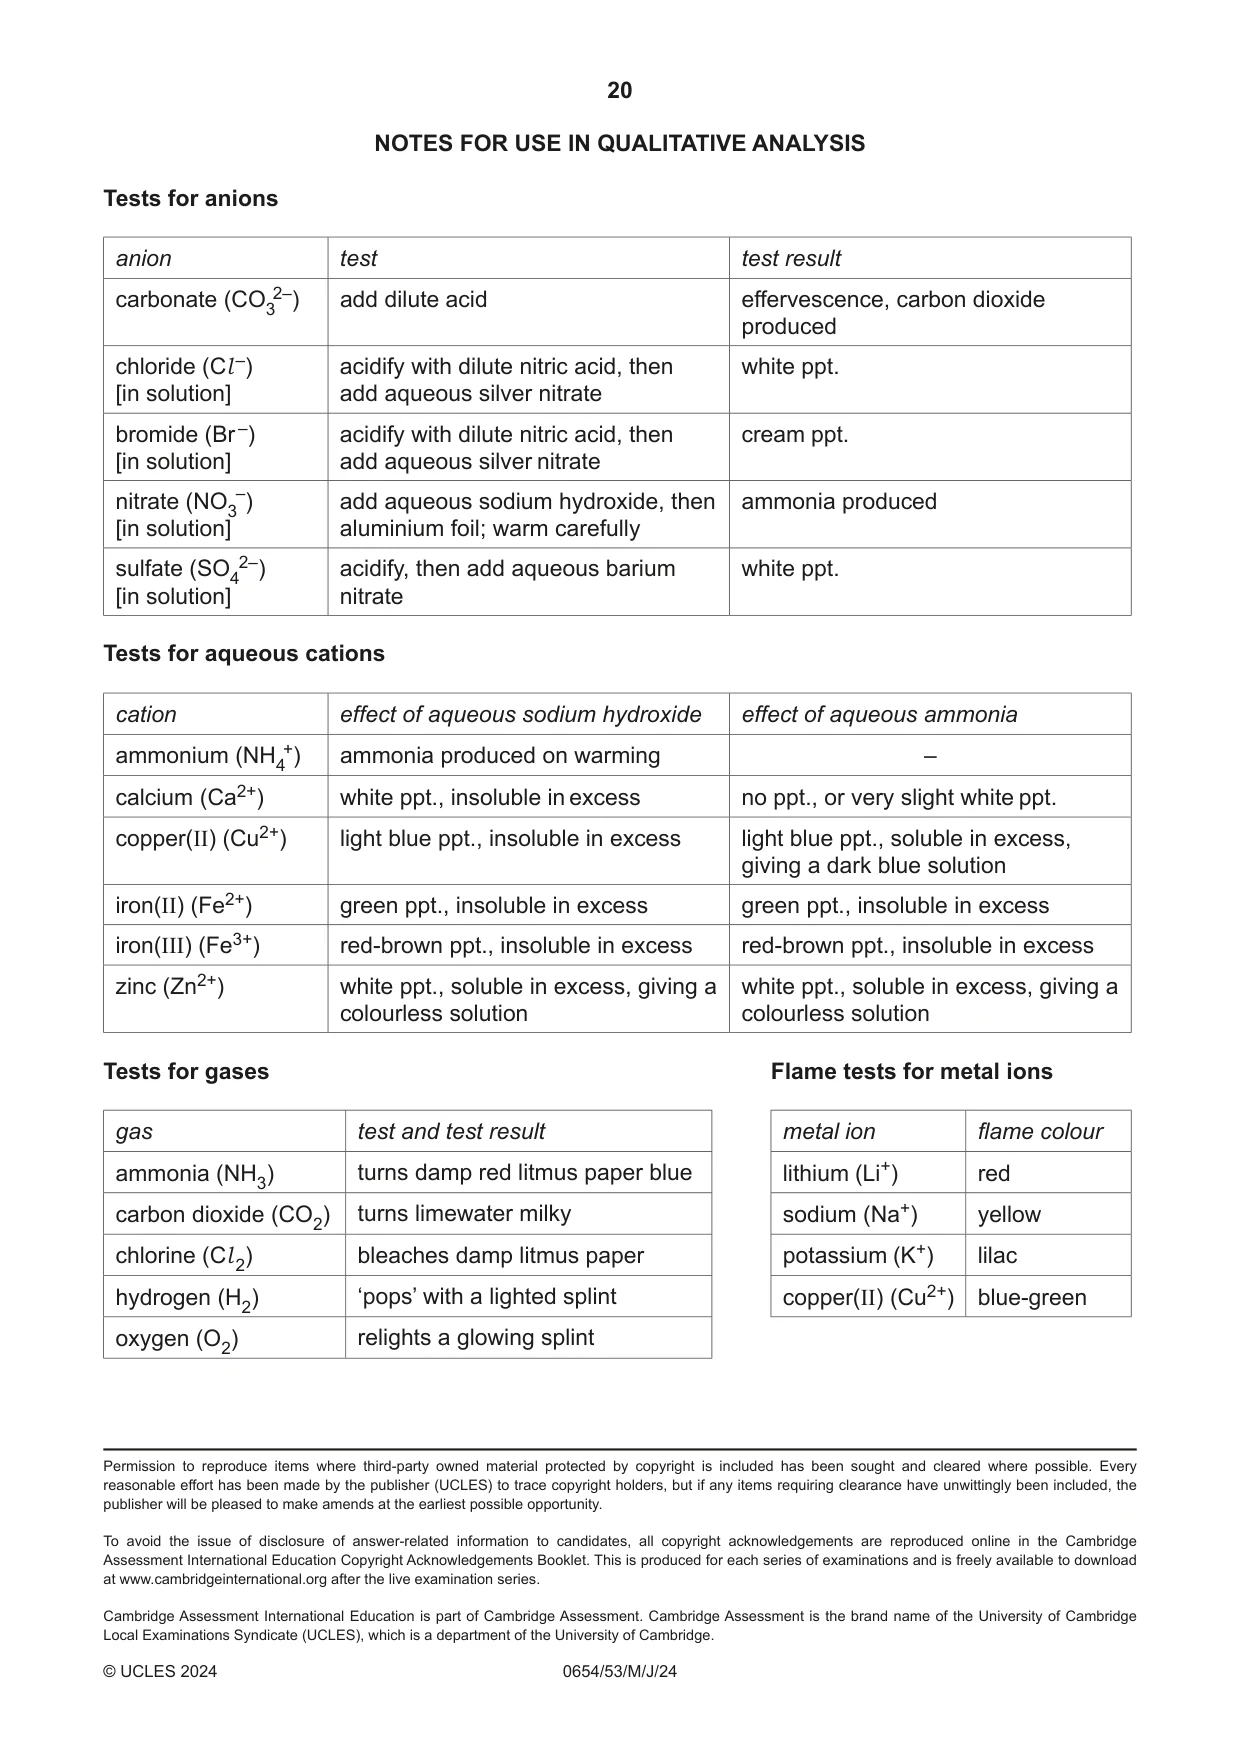
4 You are going to investigate the ions present in solution H. (a) Procedure • Add approximately 1 cm depth of solution H into each of five test-tubes. • Soak a wooden splint in one of these test-tubes and leave it for the last test in Table 4.1. • Do the tests in Table 4.1. Table 4.1 test observation add a few drops of aqueous sodium hydroxide add excess aqueous sodium hydroxide add a few drops of aqueous ammonia add excess aqueous ammonia add approximately 1 cm depth of dilute nitric acid followed by a few drops of aqueous silver nitrate add approximately 1 cm depth of dilute nitric acid followed by approximately 1 cm depth of aqueous barium nitrate place the wooden splint into the top of a blue Bunsen burner flame note the initial colour if you do not see a colour, repeat the test [6] (b) Identify the ions present in solution H. .................................................................. and .................................................................. [2] [Total: 8]
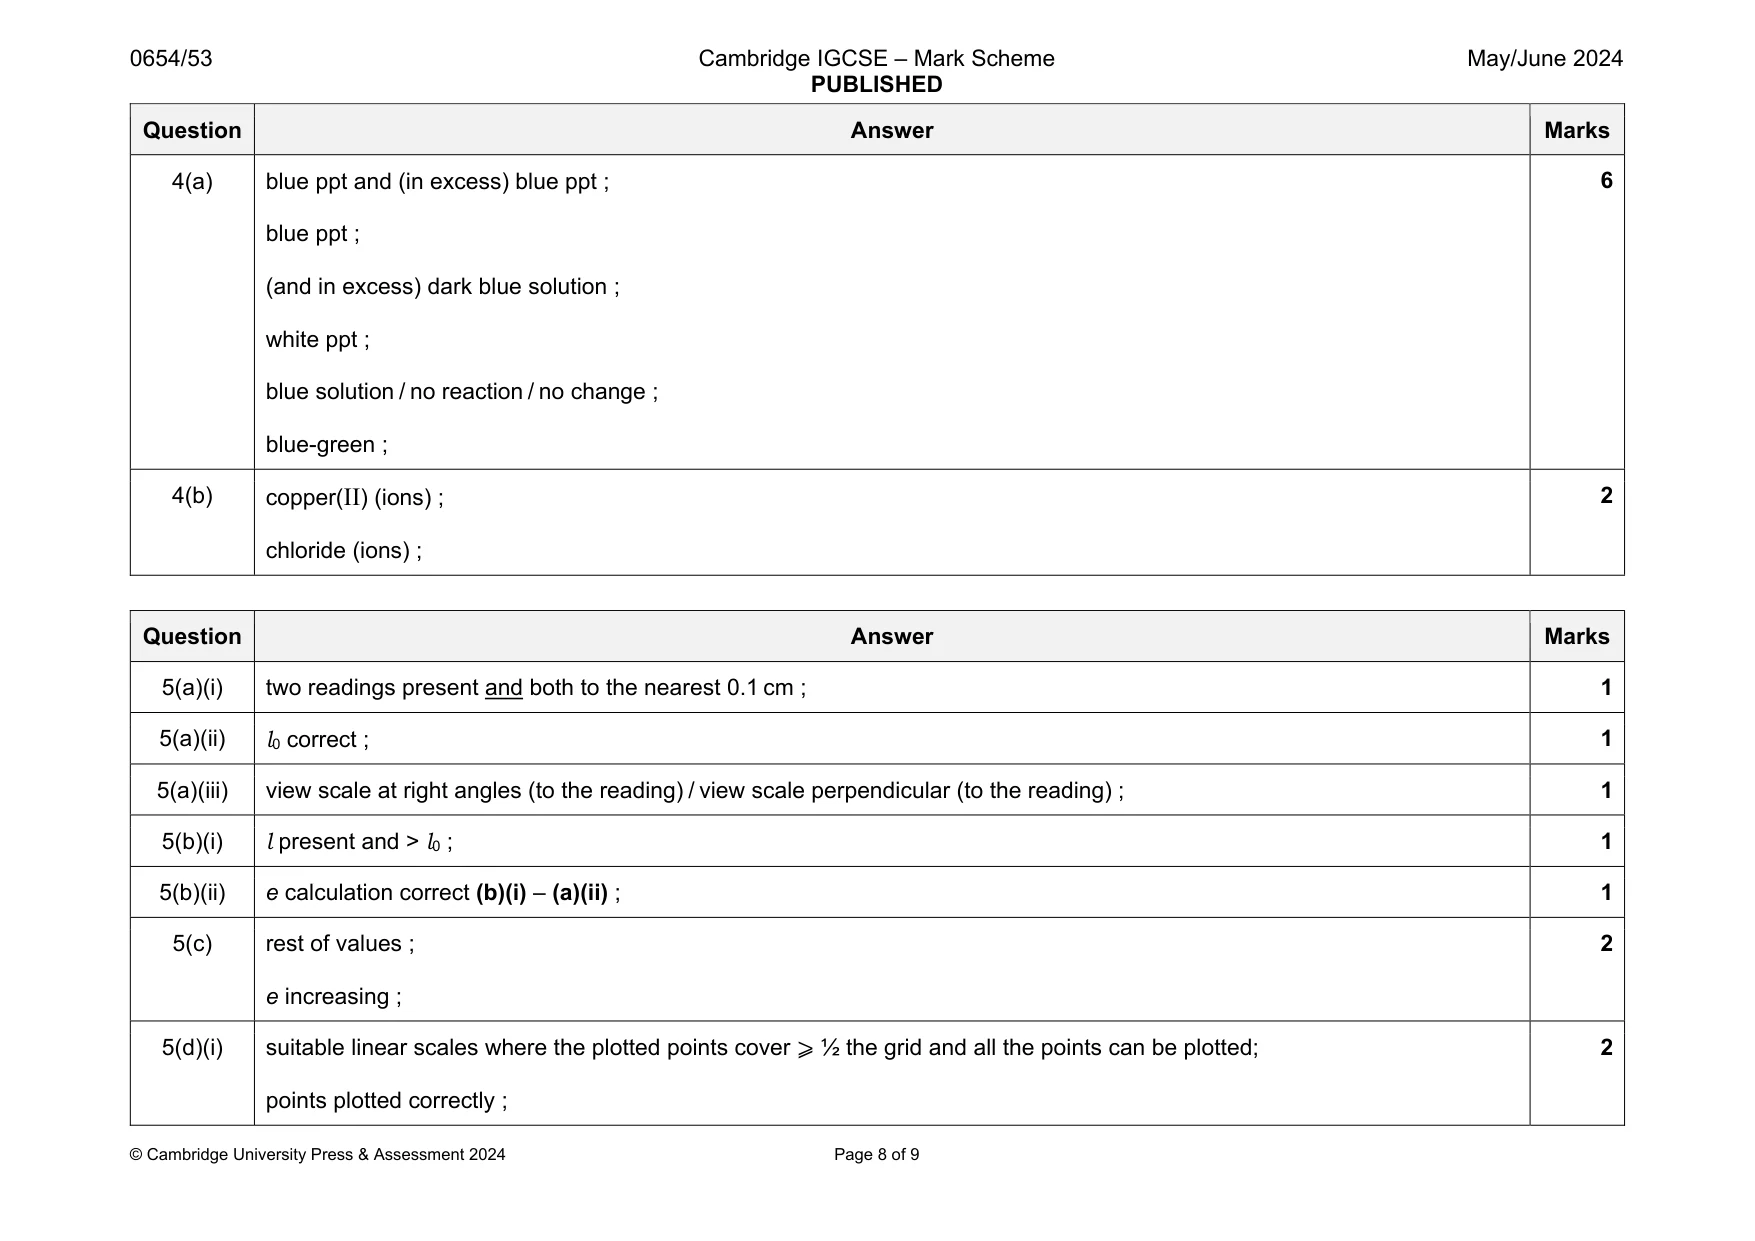
Mark scheme: 4(a) blue ppt and (in excess) blue ppt ; blue ppt ; (and in excess) dark blue solution ; white ppt ; blue solution / no reaction / no change ; blue-green ; 4(b) copper(II) (ions) ; chloride (ions) ; 2
Q5 · You are going to investigate the stretching of a spring
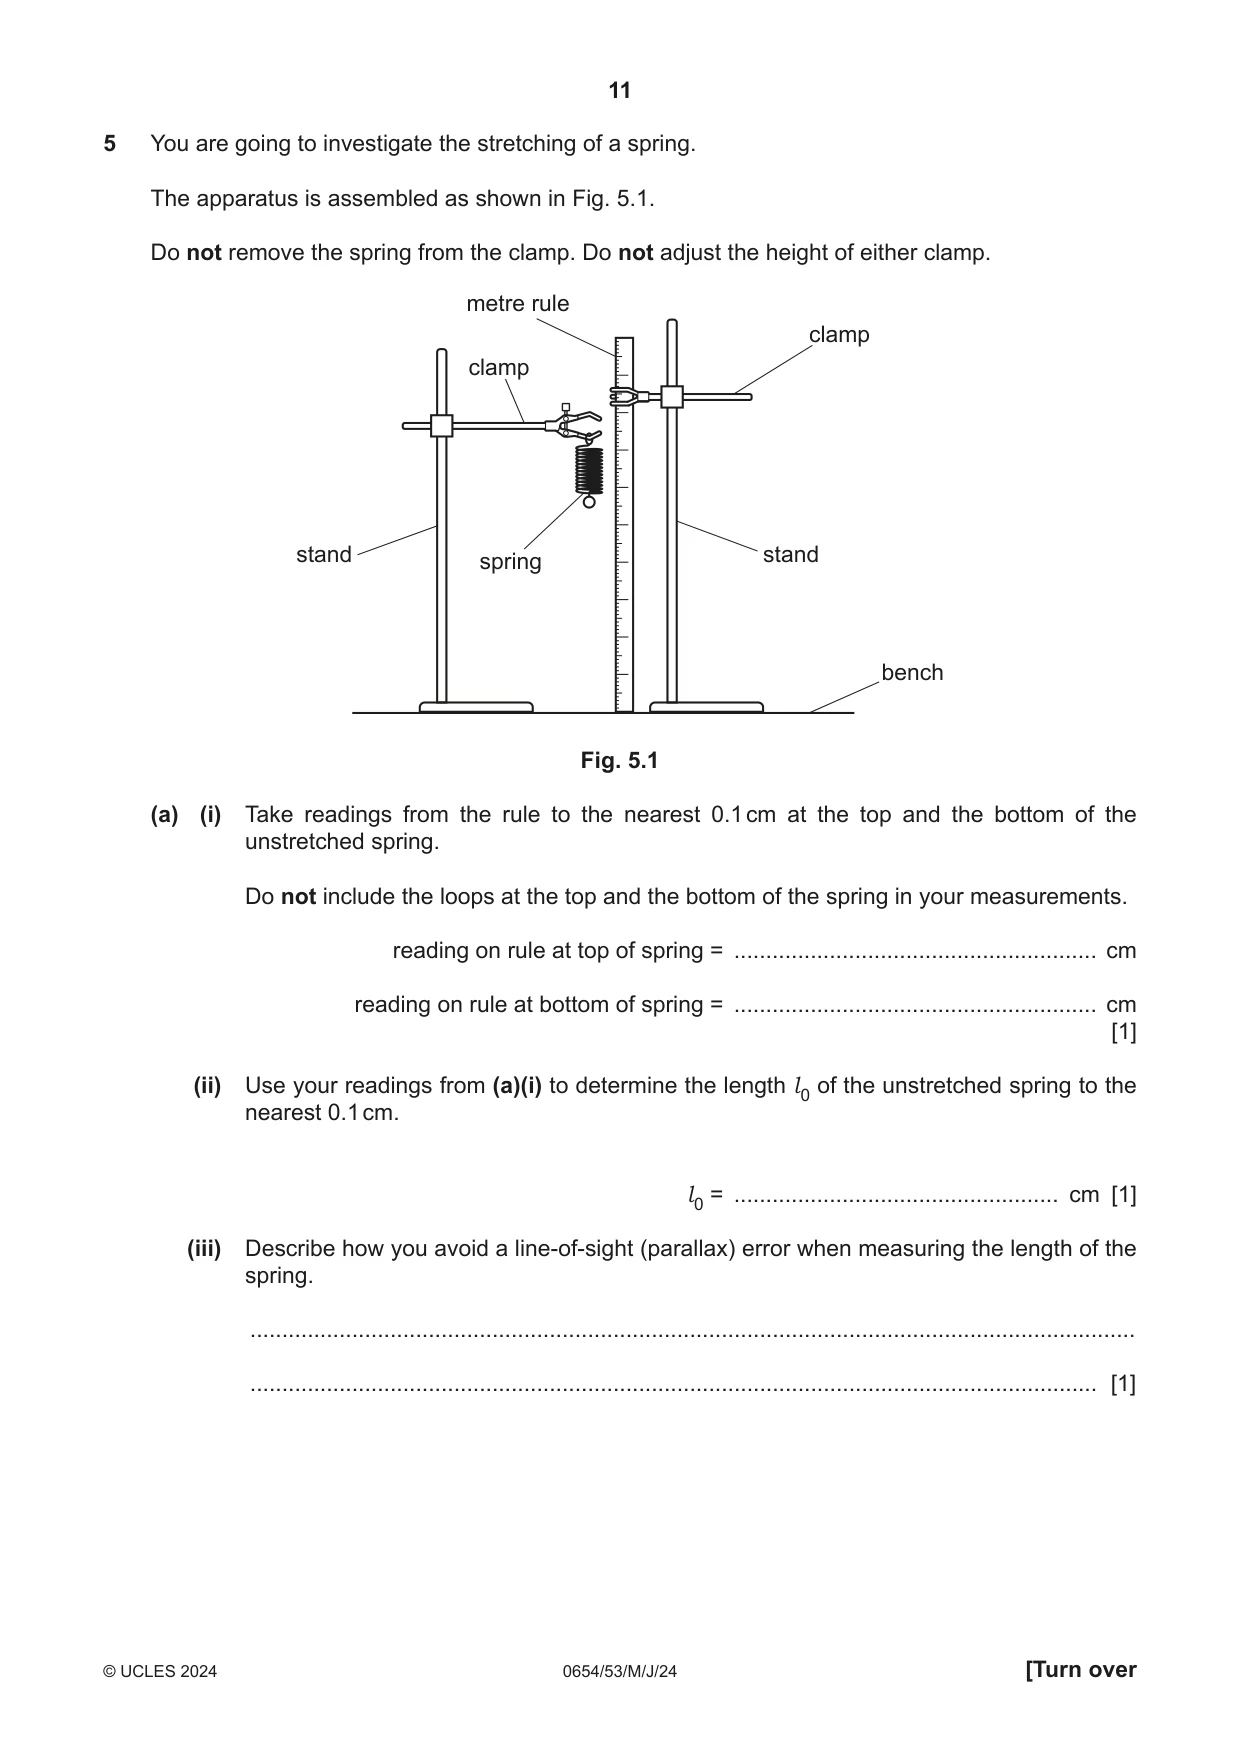
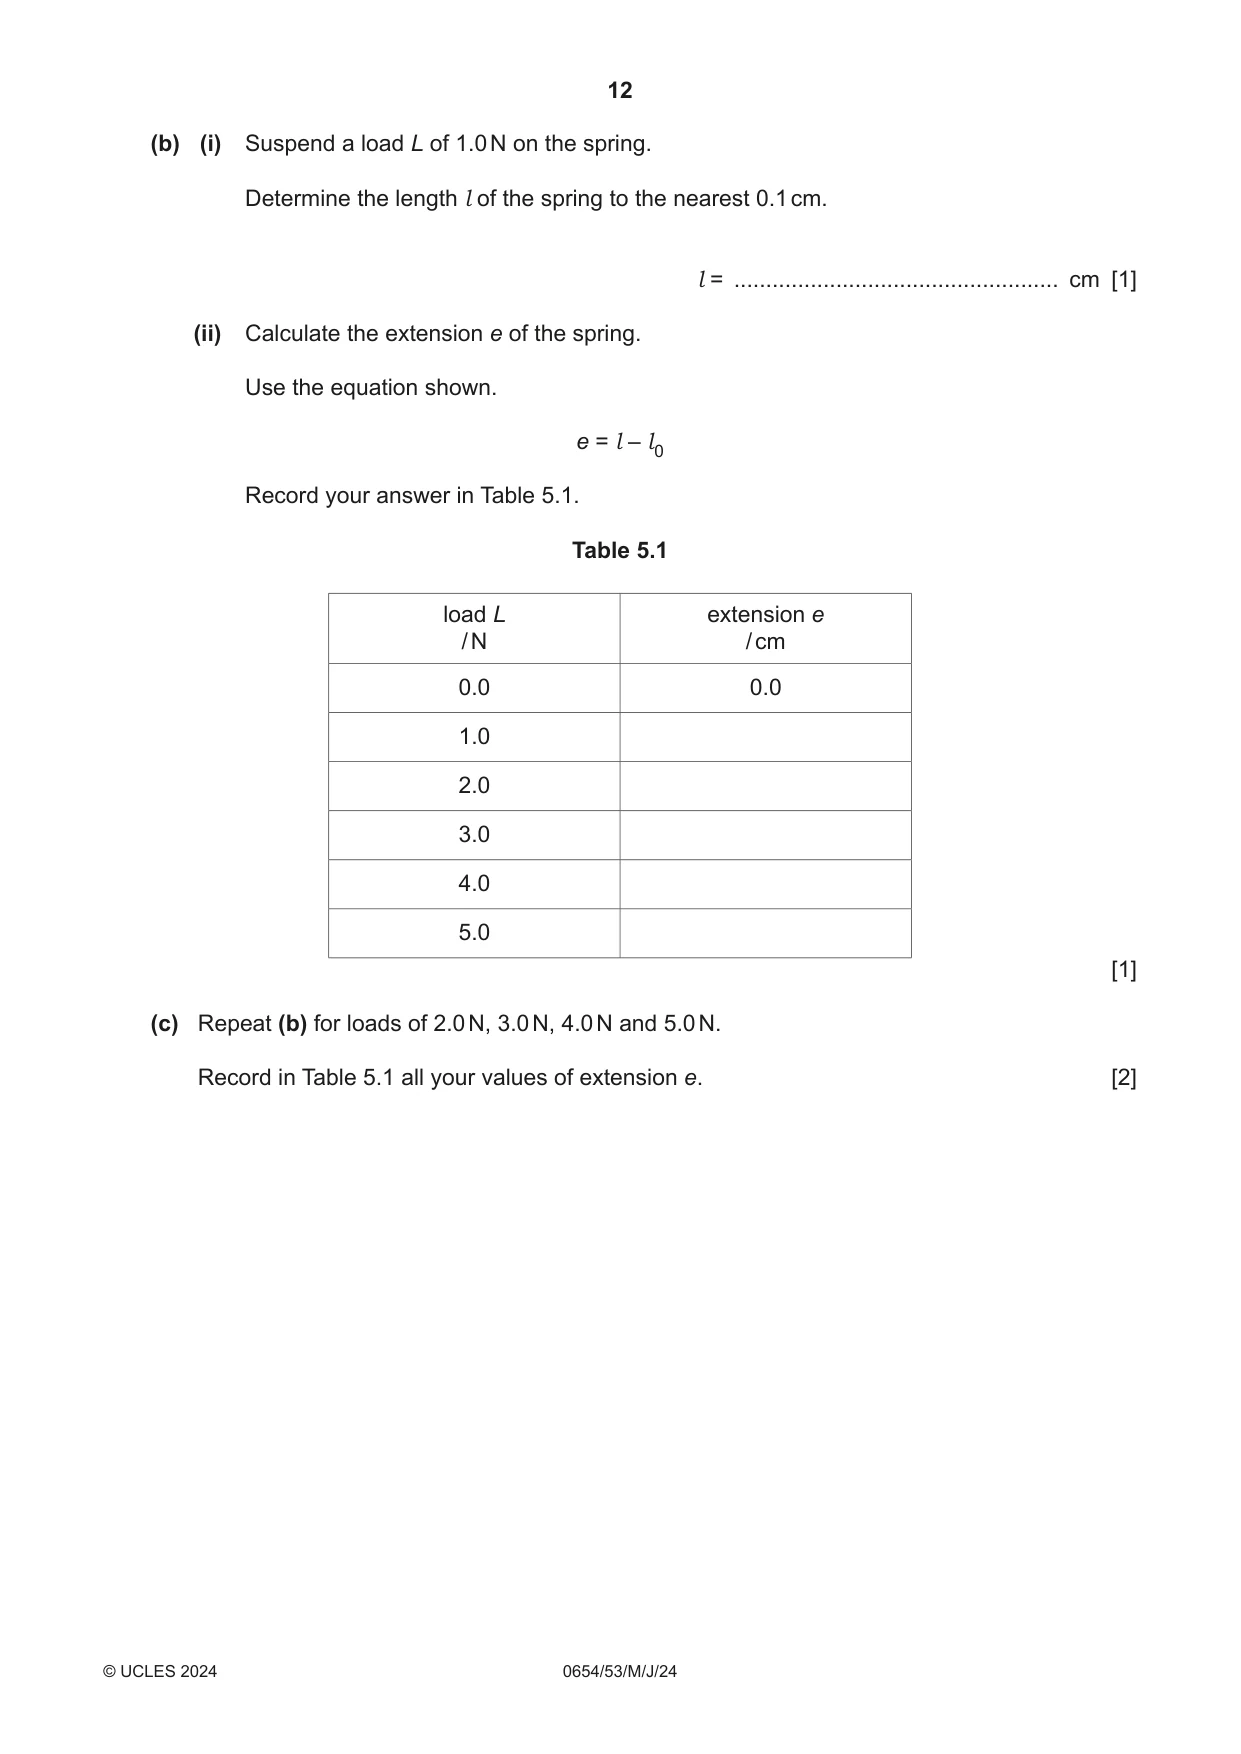
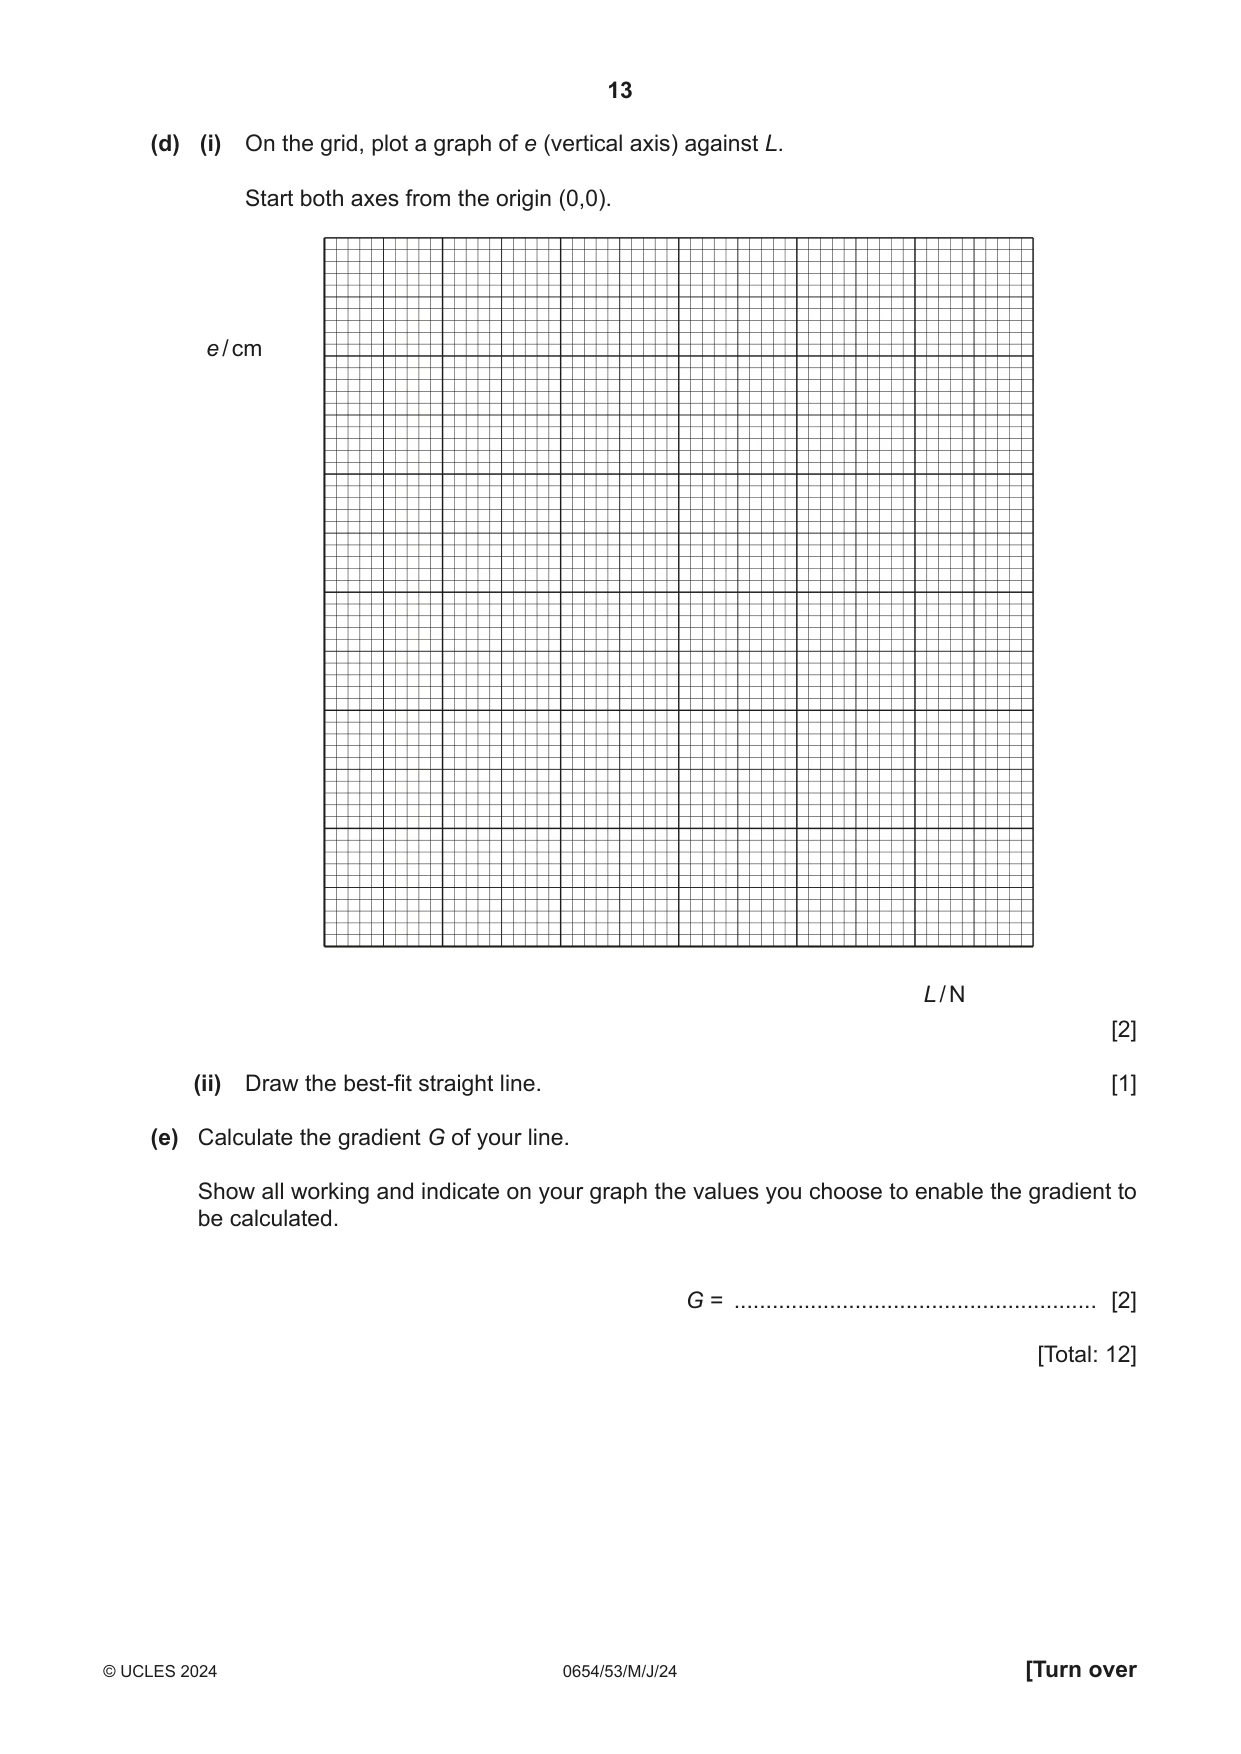
5 You are going to investigate the stretching of a spring. The apparatus is assembled as shown in Fig. 5.1. Do not remove the spring from the clamp. Do not adjust the height of either clamp. metre rule clamp clamp stand stand spring bench Fig. 5.1 (a) (i) Take readings from the rule to the nearest 0.1 cm at the top and the bottom of the unstretched spring. Do not include the loops at the top and the bottom of the spring in your measurements. reading on rule at top of spring = ......................................................... cm reading on rule at bottom of spring = ......................................................... cm [1] (ii) Use your readings from (a)(i) to determine the length l 0 of the unstretched spring to the nearest 0.1 cm. l 0 = ................................................... cm [1] (iii) Describe how you avoid a line-of-sight (parallax) error when measuring the length of the spring. ........................................................................................................................................... ..................................................................................................................................... [1] (b) (i) Suspend a load L of 1.0 N on the spring. Determine the length l of the spring to the nearest 0.1 cm. l = ................................................... cm [1] (ii) Calculate the extension e of the spring. Use the equation shown. e = l – l 0 Record your answer in Table 5.1. Table 5.1 load L extension e / N / cm 0.0 0.0 1.0 2.0 3.0 4.0 5.0 [1] (c) Repeat (b) for loads of 2.0 N, 3.0 N, 4.0 N and 5.0 N. Record in Table 5.1 all your values of extension e. [2] (d) (i) On the grid, plot a graph of e (vertical axis) against L. Start both axes from the origin (0,0). e / cm L / N [2] (ii) Draw the best-fit straight line. [1] (e) Calculate the gradient G of your line. Show all working and indicate on your graph the values you choose to enable the gradient to be calculated. G = ......................................................... [2] [Total: 12]
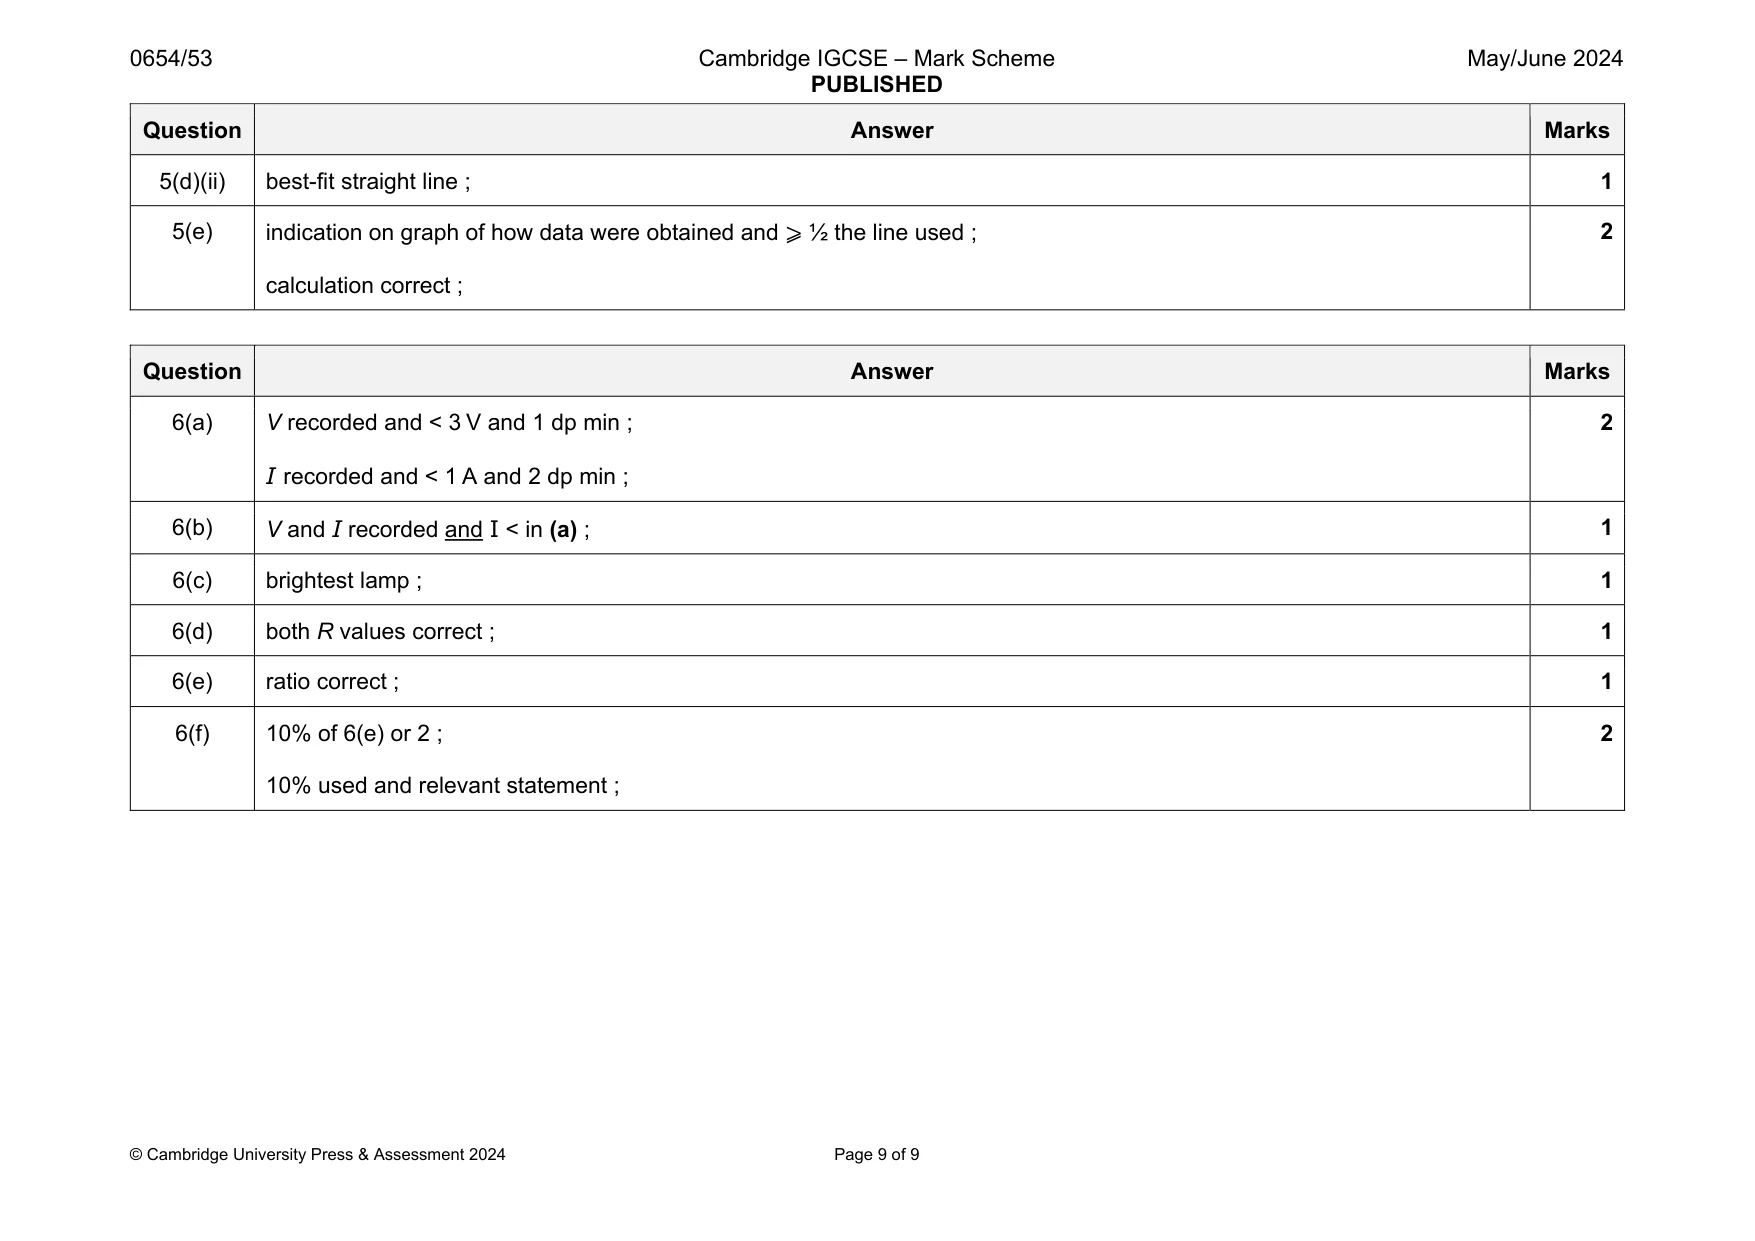
Mark scheme: 5(a)(i) two readings present and both to the nearest 0.1 cm ; 1 5(a)(ii) l0 correct ; 1 5(a)(iii) view scale at right angles (to the reading) / view scale perpendicular (to the reading) ; 1 5(b)(i) l present and > l0 ; 1 5(b)(ii) e calculation correct (b)(i) – (a)(ii) ; 1 5(c) rest of values ; e increasing ; 2 5(d)(i) suitable linear scales where the plotted points cover ⩾ ½ the grid and all the points can be plotted; points plotted correctly ; 2 Question Answer Marks 5(d)(ii) best-fit straight line ; 1 5(e) indication on graph of how data were obtained and ⩾ ½ the line used ; calculation correct ; 2
More questions on Physical quantities and measurement techniques
Q6 · You are going to investigate the resistance of lamps
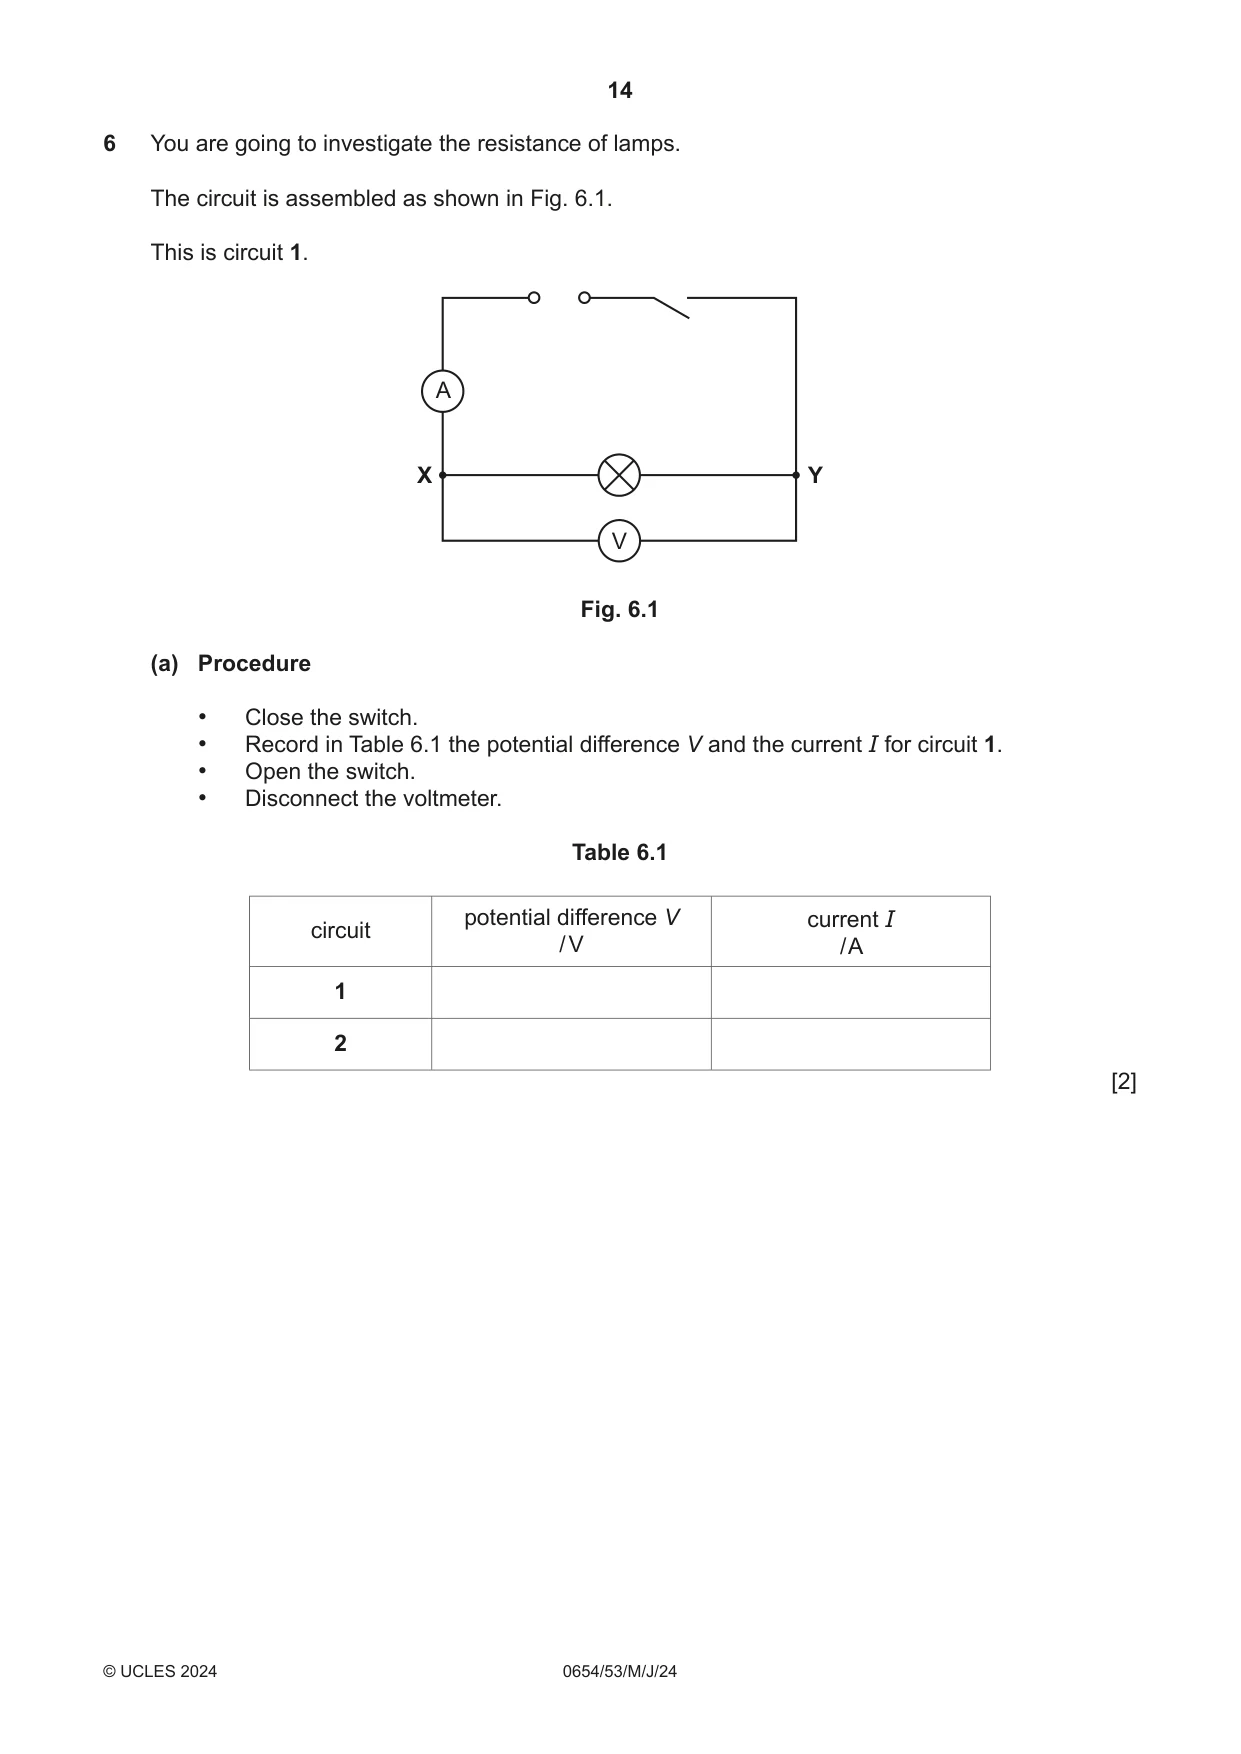
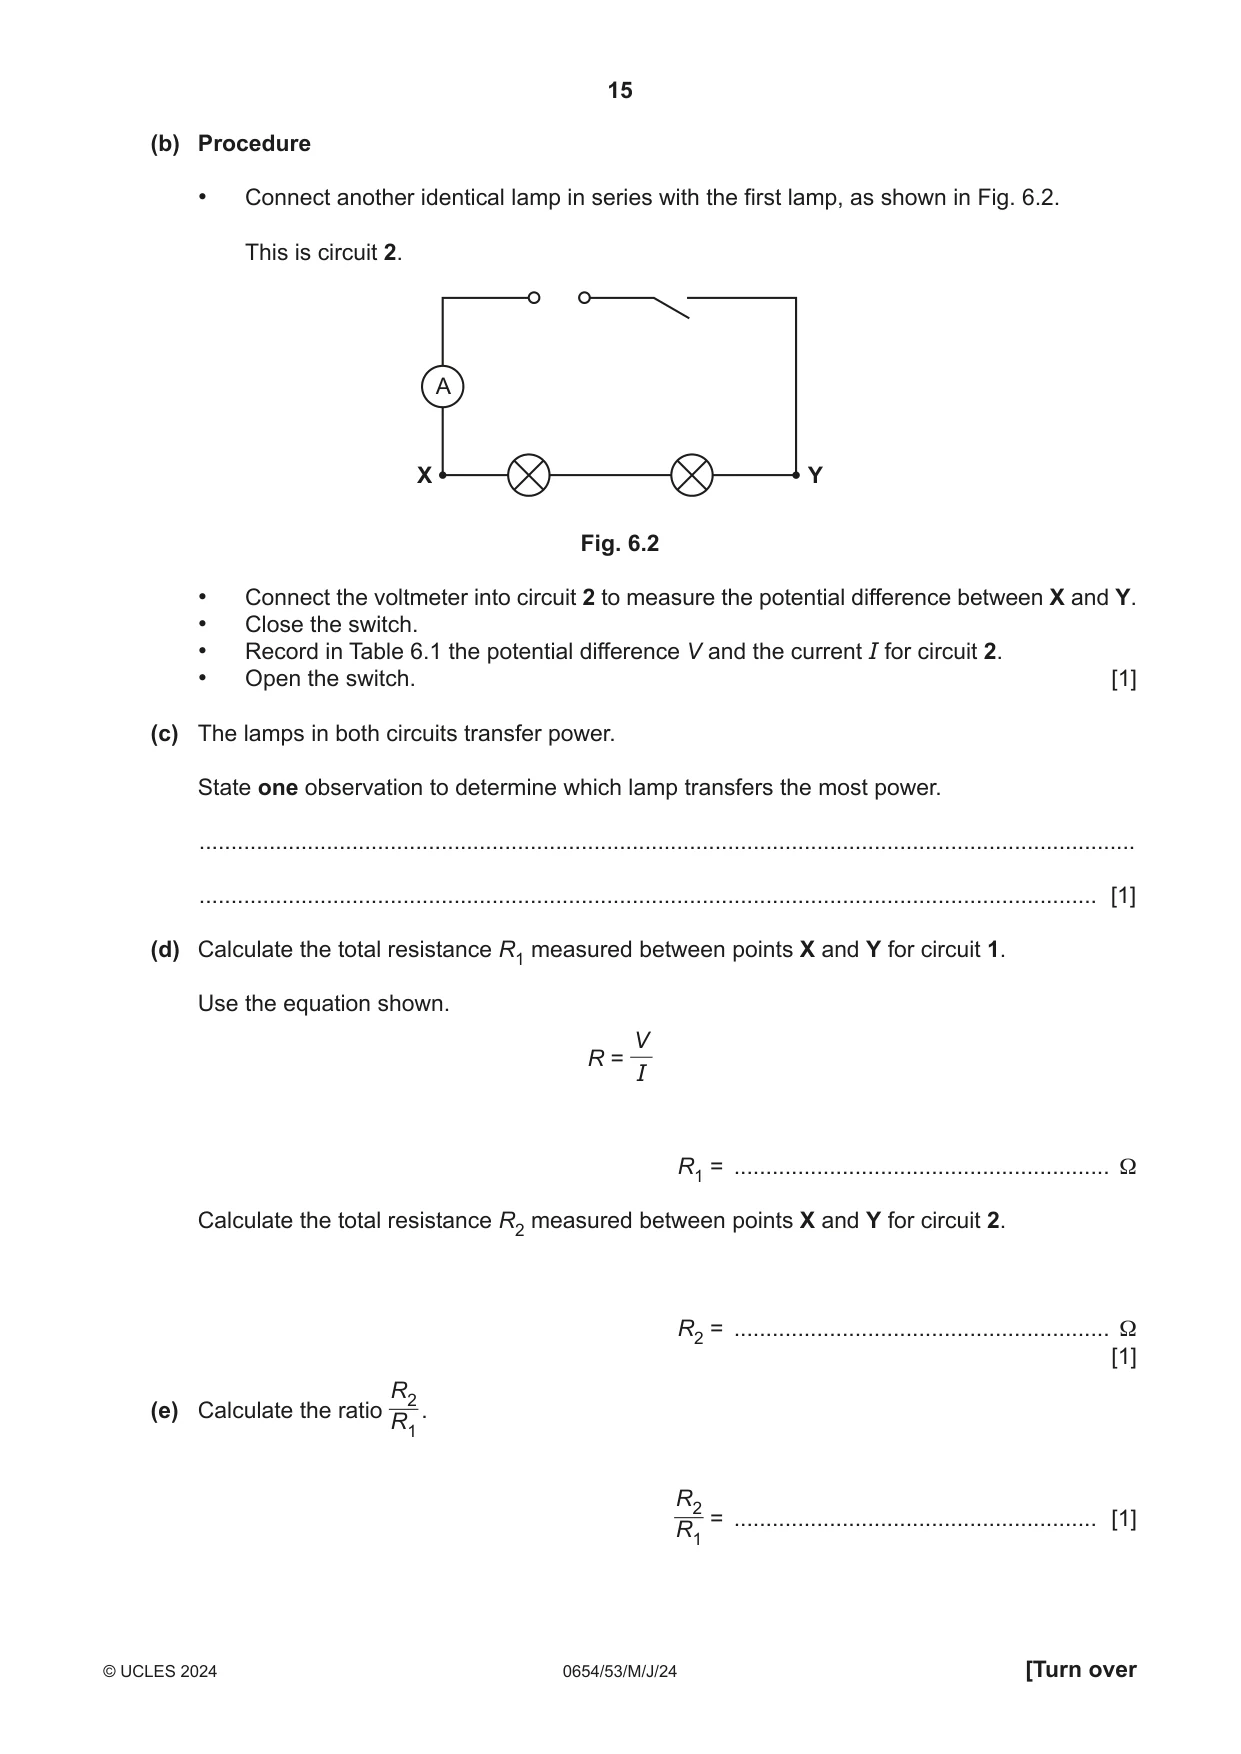
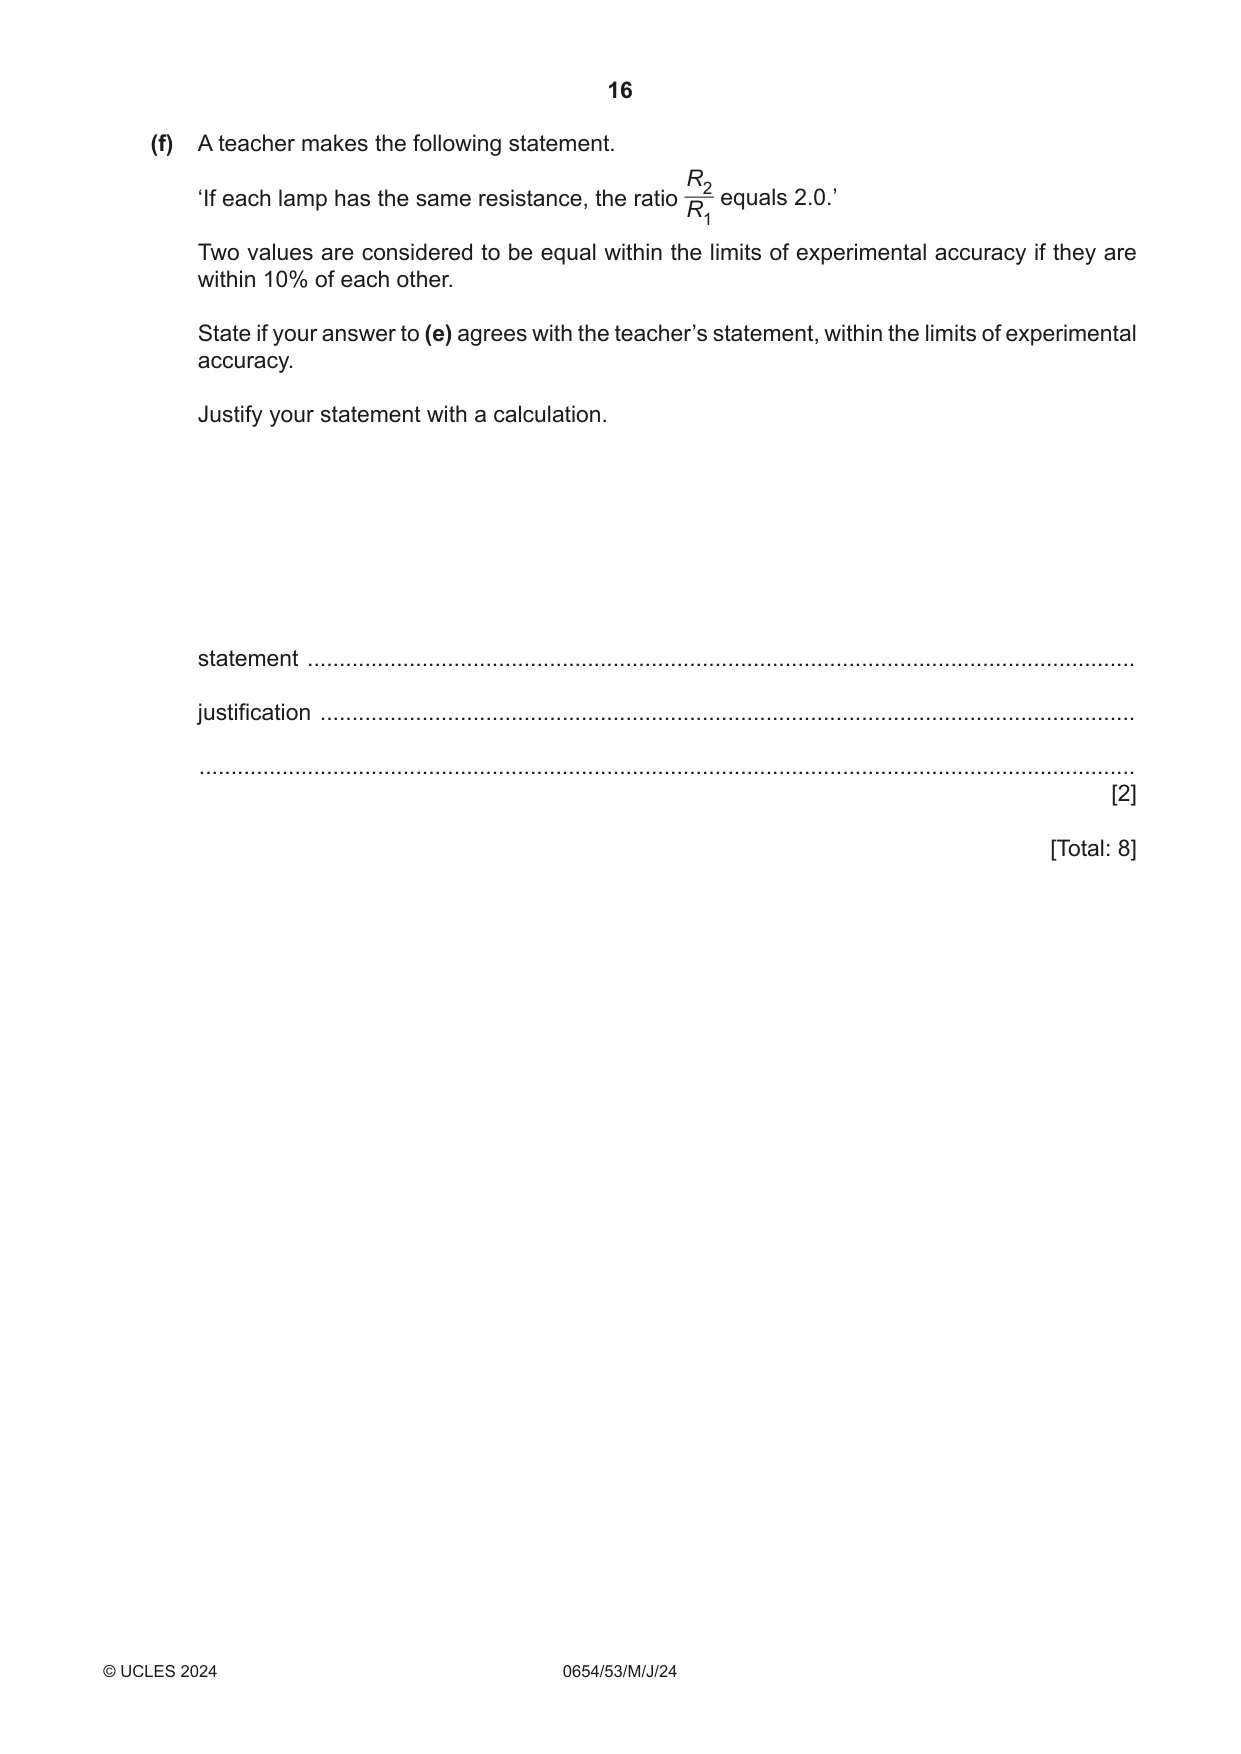
6 You are going to investigate the resistance of lamps. The circuit is assembled as shown in Fig. 6.1. This is circuit 1. A X Y V Fig. 6.1 (a) Procedure • Close the switch. • Record in Table 6.1 the potential difference V and the current I for circuit 1. • Open the switch. • Disconnect the voltmeter. Table 6.1 potential difference V current I circuit / V / A 1 2 [2] (b) Procedure • Connect another identical lamp in series with the first lamp, as shown in Fig. 6.2. This is circuit 2. A X Y Fig. 6.2 • Connect the voltmeter into circuit 2 to measure the potential difference between X and Y. • Close the switch. • Record in Table 6.1 the potential difference V and the current I for circuit 2. • Open the switch. [1] (c) The lamps in both circuits transfer power. State one observation to determine which lamp transfers the most power. ................................................................................................................................................... ............................................................................................................................................. [1] (d) Calculate the total resistance R1 measured between points X and Y for circuit 1. Use the equation shown. V R = I R1 = ........................................................... Ω Calculate the total resistance R2 measured between points X and Y for circuit 2. R2 = ........................................................... Ω [1] R2(e) Calculate the ratio . R1 R2 = ......................................................... [1] R1 (f) A teacher makes the following statement. R2 ‘If each lamp has the same resistance, the ratio equals 2.0.’ R1 Two values are considered to be equal within the limits of experimental accuracy if they are within 10% of each other. State if your answer to (e) agrees with the teacher’s statement, within the limits of experimental accuracy. Justify your statement with a calculation. statement .................................................................................................................................. justification ................................................................................................................................ ................................................................................................................................................... [2] [Total: 8]
Mark scheme: 6(a) V recorded and < 3 V and 1 dp min ; I recorded and < 1 A and 2 dp min ; 6(b) V and I recorded and I < in (a) ; 1 6(c) brightest lamp ; 1 6(d) both R values correct ; 1 6(e) ratio correct ; 1 6(f) 10% of 6(e) or 2 ; 10% used and relevant statement ; 2
What was in this paper
The subtopics covered by these 6 questions, and how many questions each got. Open one in a new tab to see every Cambridge question on it.
What you needed in this session
Cambridge’s own grade thresholds for 2024 May/June, Paper 5 · Variant 3. A higher threshold means an easier paper — the bar moves with how the cohort did.