Cambridge IGCSE Sciences - Co-ordinated (Double) 0654 — 2018 Oct/Nov Paper 5 · Variant 2
0654/52/O/N/18 · 3 questions · 45 marks · ≈51 min
The question paper and its mark scheme, free to read here and free to download. This is Cambridge’s own paper, exactly as it was sat.
Question paper12 pages

Mark scheme6 pages
Answers below. Sit the paper first if you are practising.
Questions as text
Q1 · You are going to investigate the nutrient content of three solutions A, B and C
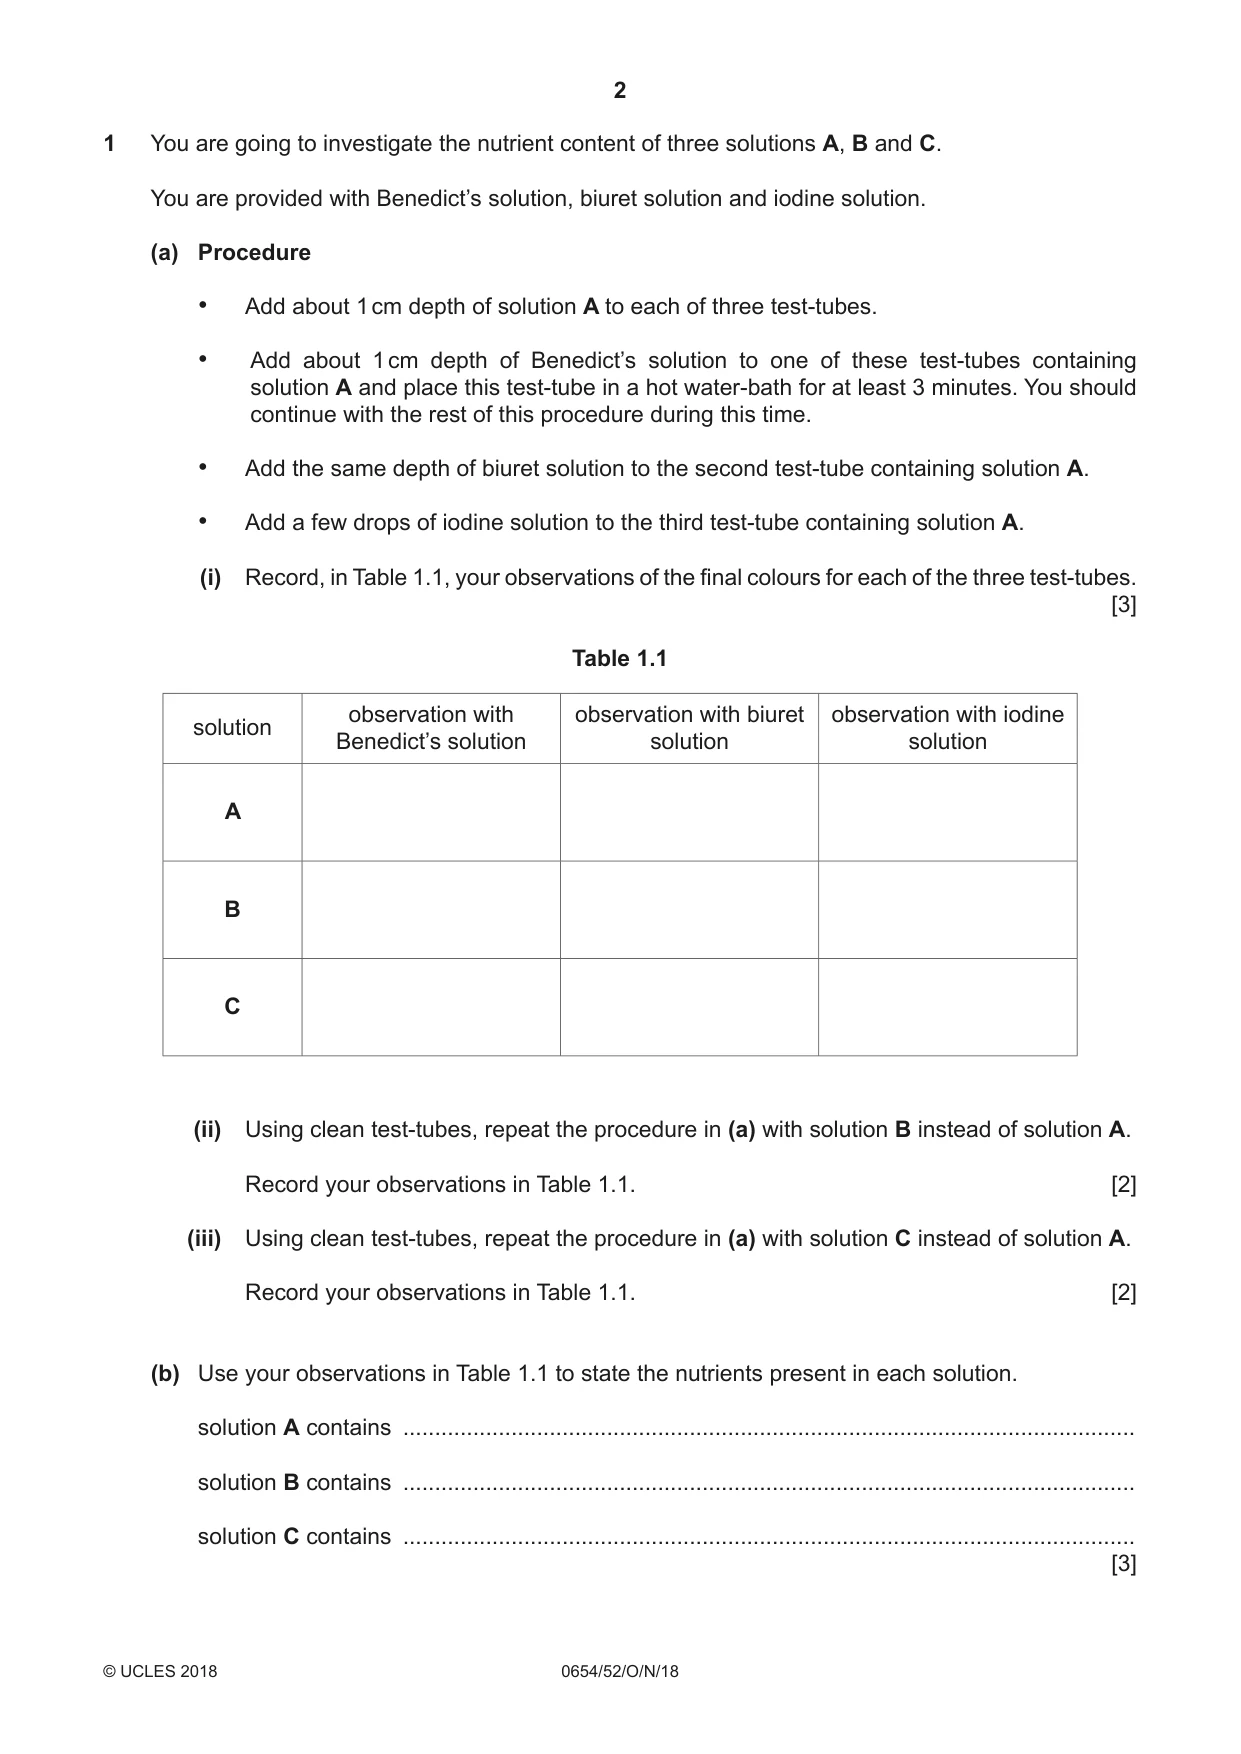
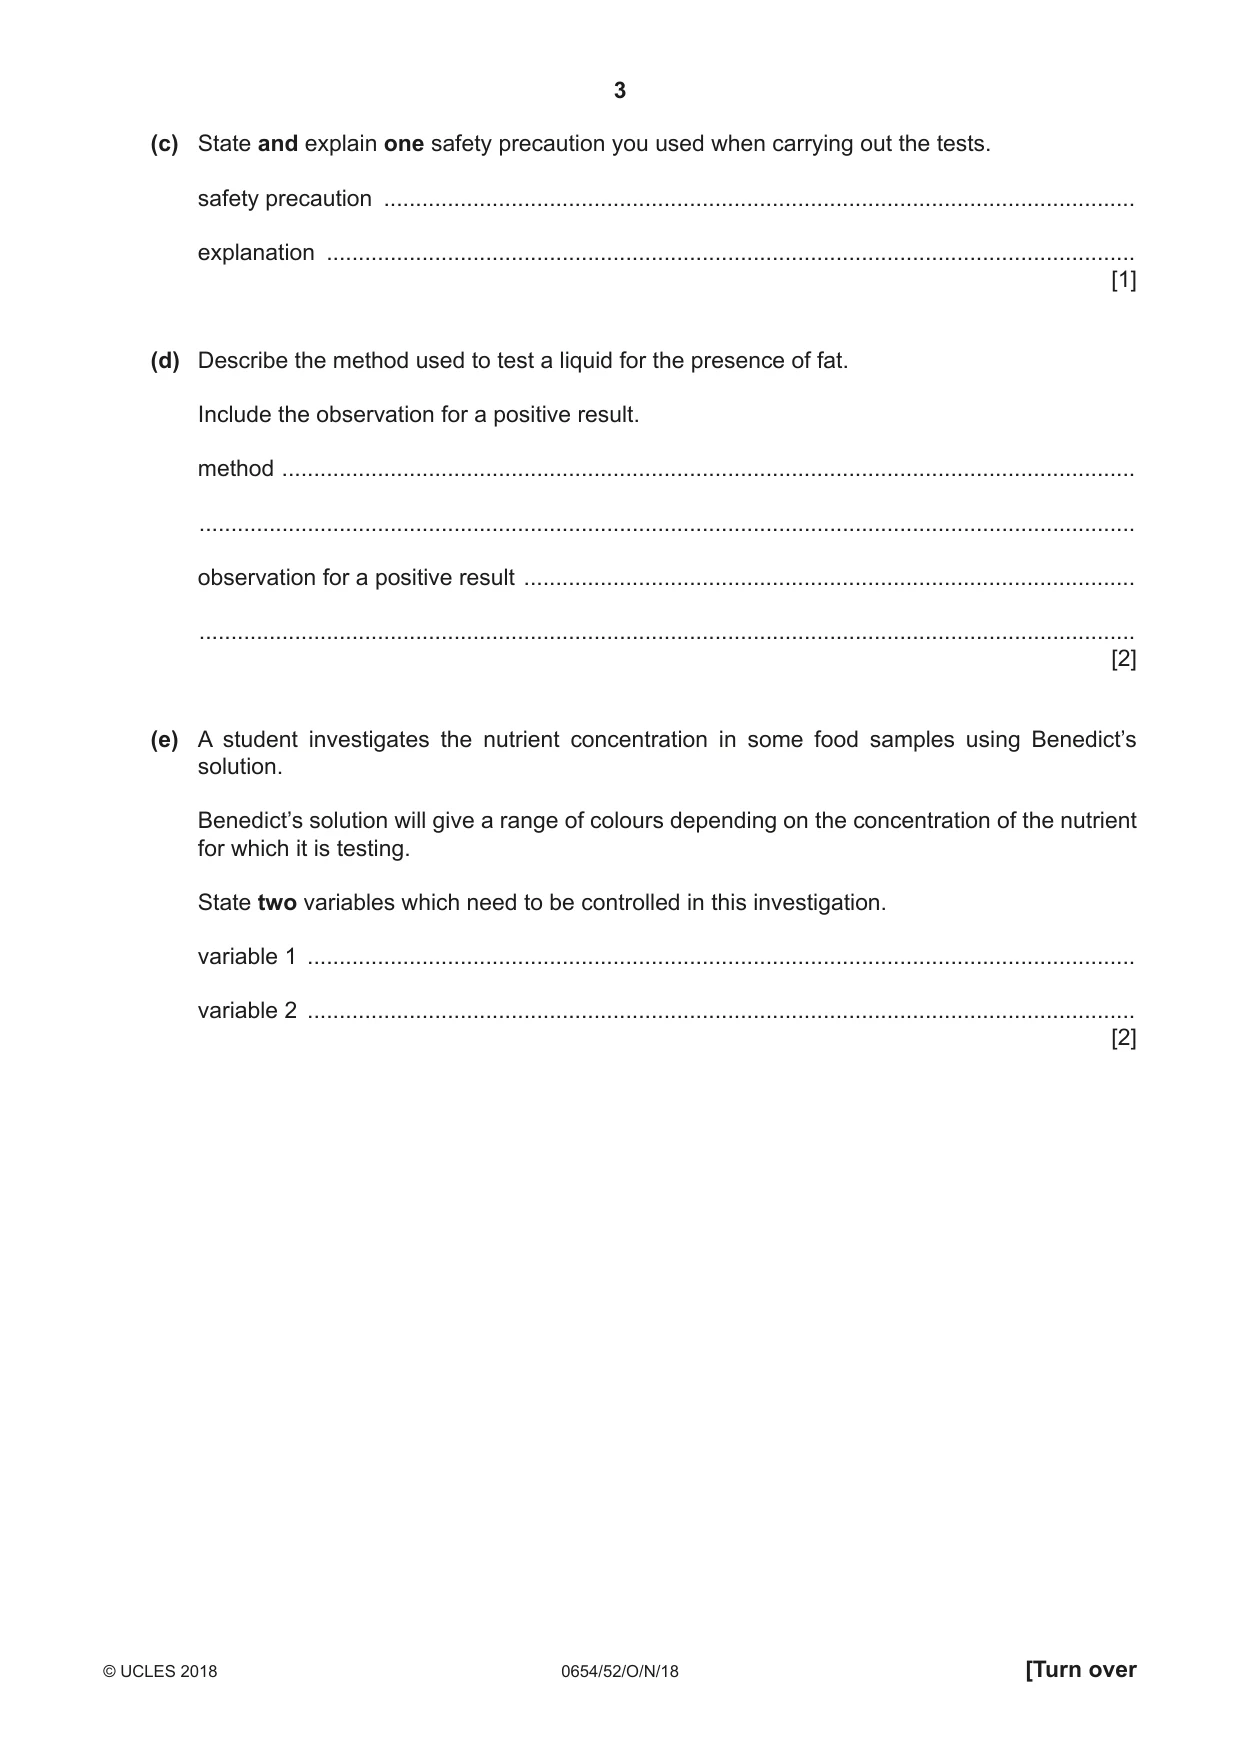
1 You are going to investigate the nutrient content of three solutions A, B and C. You are provided with Benedict’s solution, biuret solution and iodine solution. (a) Procedure • Add about 1 cm depth of solution A to each of three test-tubes. • Add about 1 cm depth of Benedict’s solution to one of these test-tubes containing solution A and place this test-tube in a hot water-bath for at least 3 minutes. You should continue with the rest of this procedure during this time. • Add the same depth of biuret solution to the second test-tube containing solution A. • Add a few drops of iodine solution to the third test-tube containing solution A. (i) Record, in Table 1.1, your observations of the final colours for each of the three test-tubes. [3] Table 1.1 observation with observation with biuret observation with iodine solution Benedict’s solution solution solution A B C (ii) Using clean test-tubes, repeat the procedure in (a) with solution B instead of solution A. Record your observations in Table 1.1. [2] (iii) Using clean test-tubes, repeat the procedure in (a) with solution C instead of solution A. Record your observations in Table 1.1. [2] (b) Use your observations in Table 1.1 to state the nutrients present in each solution. solution A contains ................................................................................................................... solution B contains ................................................................................................................... solution C contains ................................................................................................................... [3] (c) State and explain one safety precaution you used when carrying out the tests. safety precaution ...................................................................................................................... explanation ............................................................................................................................... [1] (d) Describe the method used to test a liquid for the presence of fat. Include the observation for a positive result. method ...................................................................................................................................... ................................................................................................................................................... observation for a positive result ................................................................................................ ................................................................................................................................................... [2] (e) A student investigates the nutrient concentration in some food samples using Benedict’s solution. Benedict’s solution will give a range of colours depending on the concentration of the nutrient for which it is testing. State two variables which need to be controlled in this investigation. variable 1 .................................................................................................................................. variable 2 .................................................................................................................................. [2]
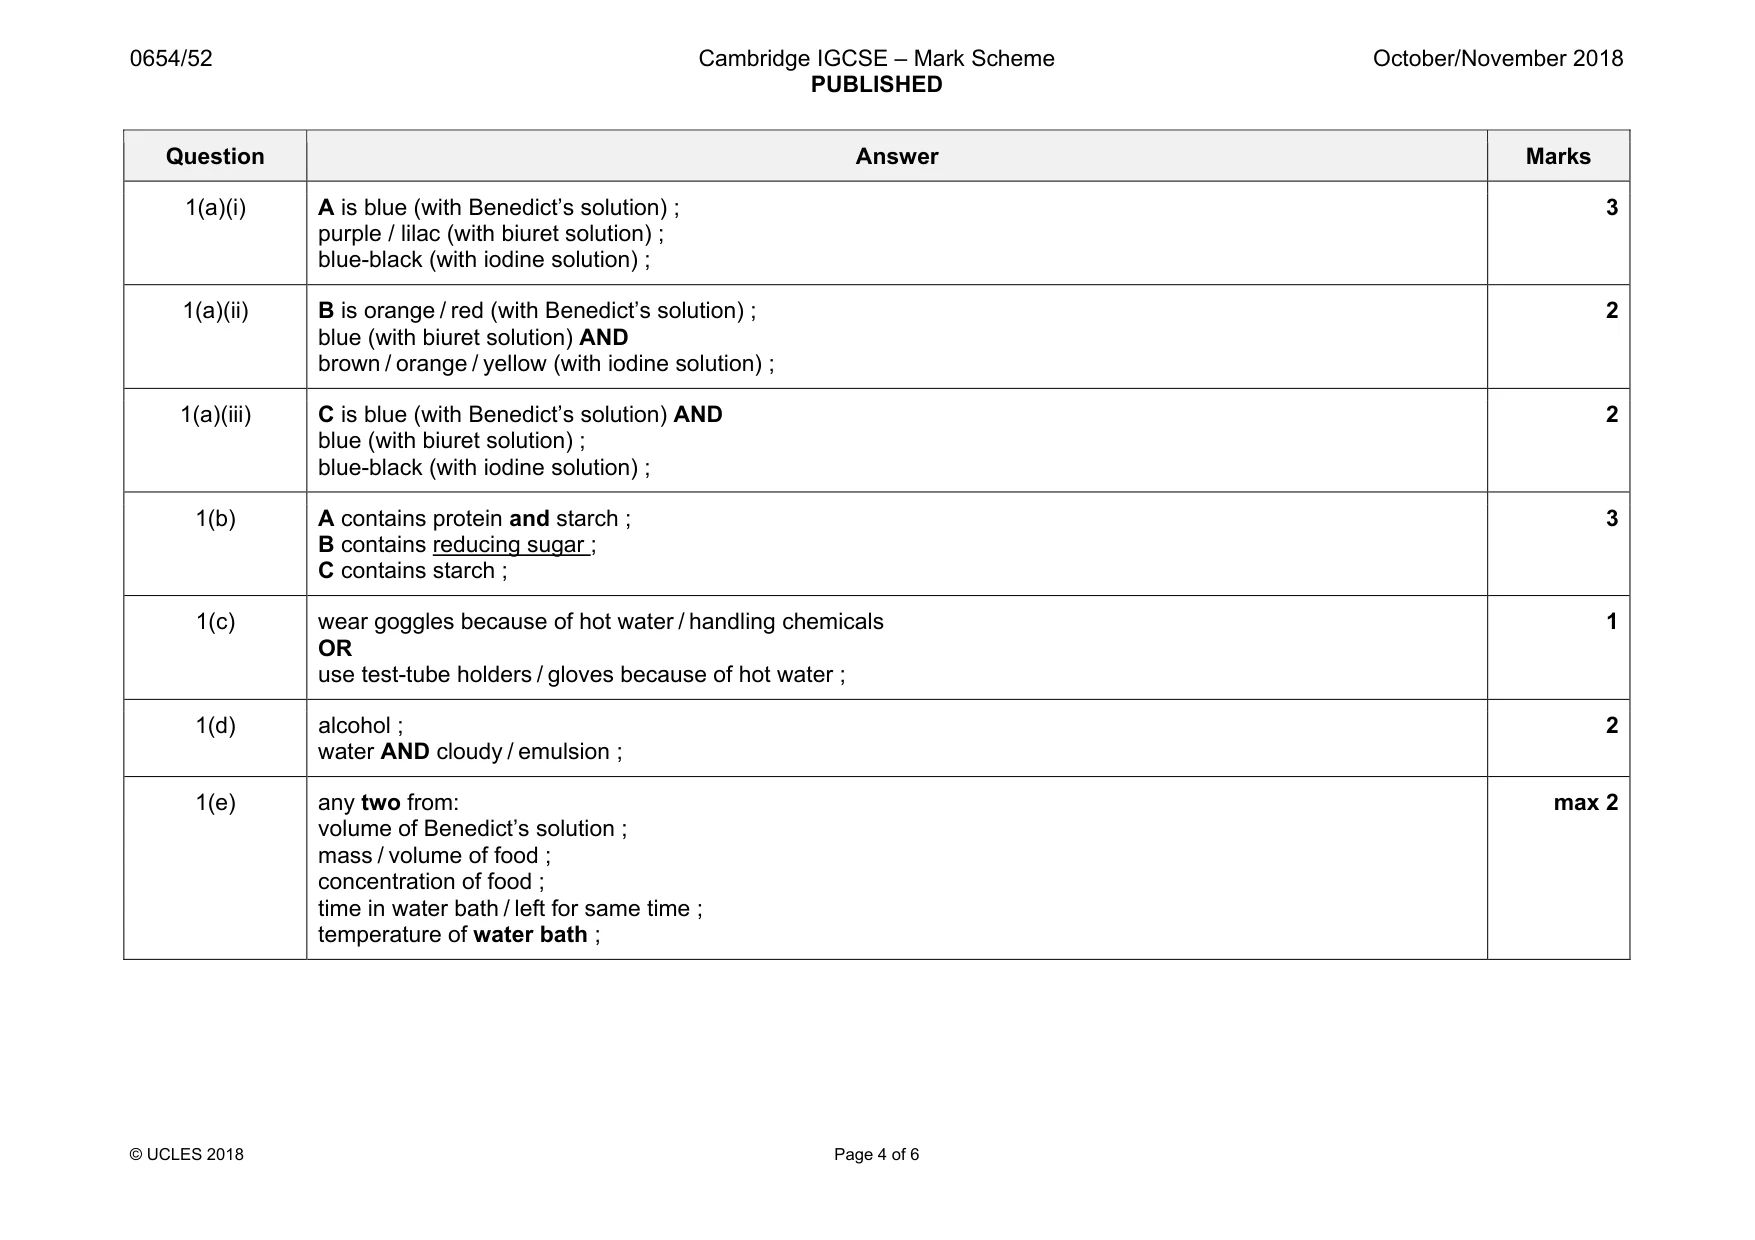
Mark scheme: 1(a)(i) A is blue (with Benedict’s solution) ; purple / lilac (with biuret solution) ; blue-black (with iodine solution) ; 3 1(a)(ii) B is orange / red (with Benedict’s solution) ; blue (with biuret solution) AND brown / orange / yellow (with iodine solution) ; 2 1(a)(iii) C is blue (with Benedict’s solution) AND blue (with biuret solution) ; blue-black (with iodine solution) ; 2 1(b) A contains protein and starch ; B contains reducing sugar ; C contains starch ; 3 1(c) wear goggles because of hot water / handling chemicals OR use test-tube holders / gloves because of hot water ; 1 1(d) alcohol ; water AND cloudy / emulsion ; 2 1(e) any two from: volume of Benedict’s solution ; mass / volume of food ; concentration of food ; time in water bath / left for same time ; temperature of water bath ; max 2
Q2 · Notes for Use in Qualitative Analysis for this question are printed on page 12
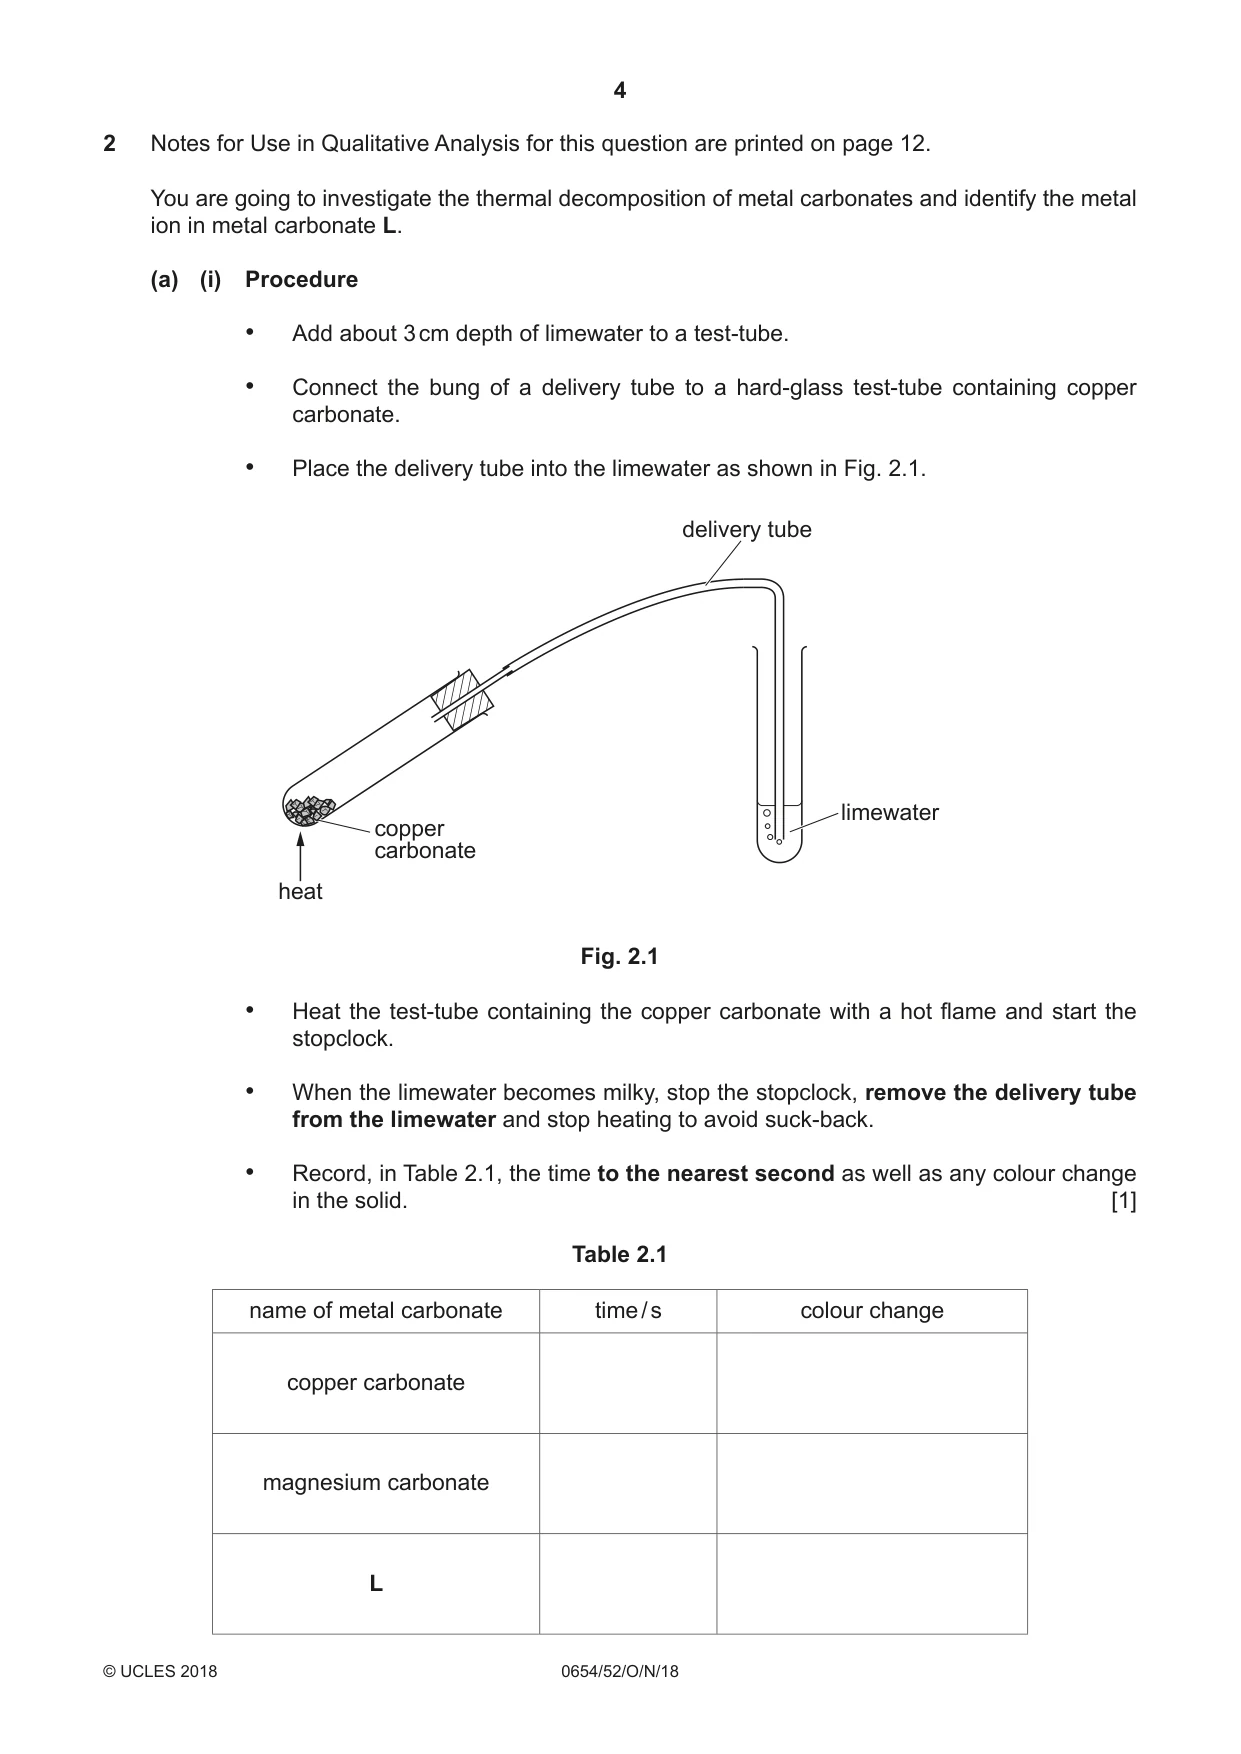
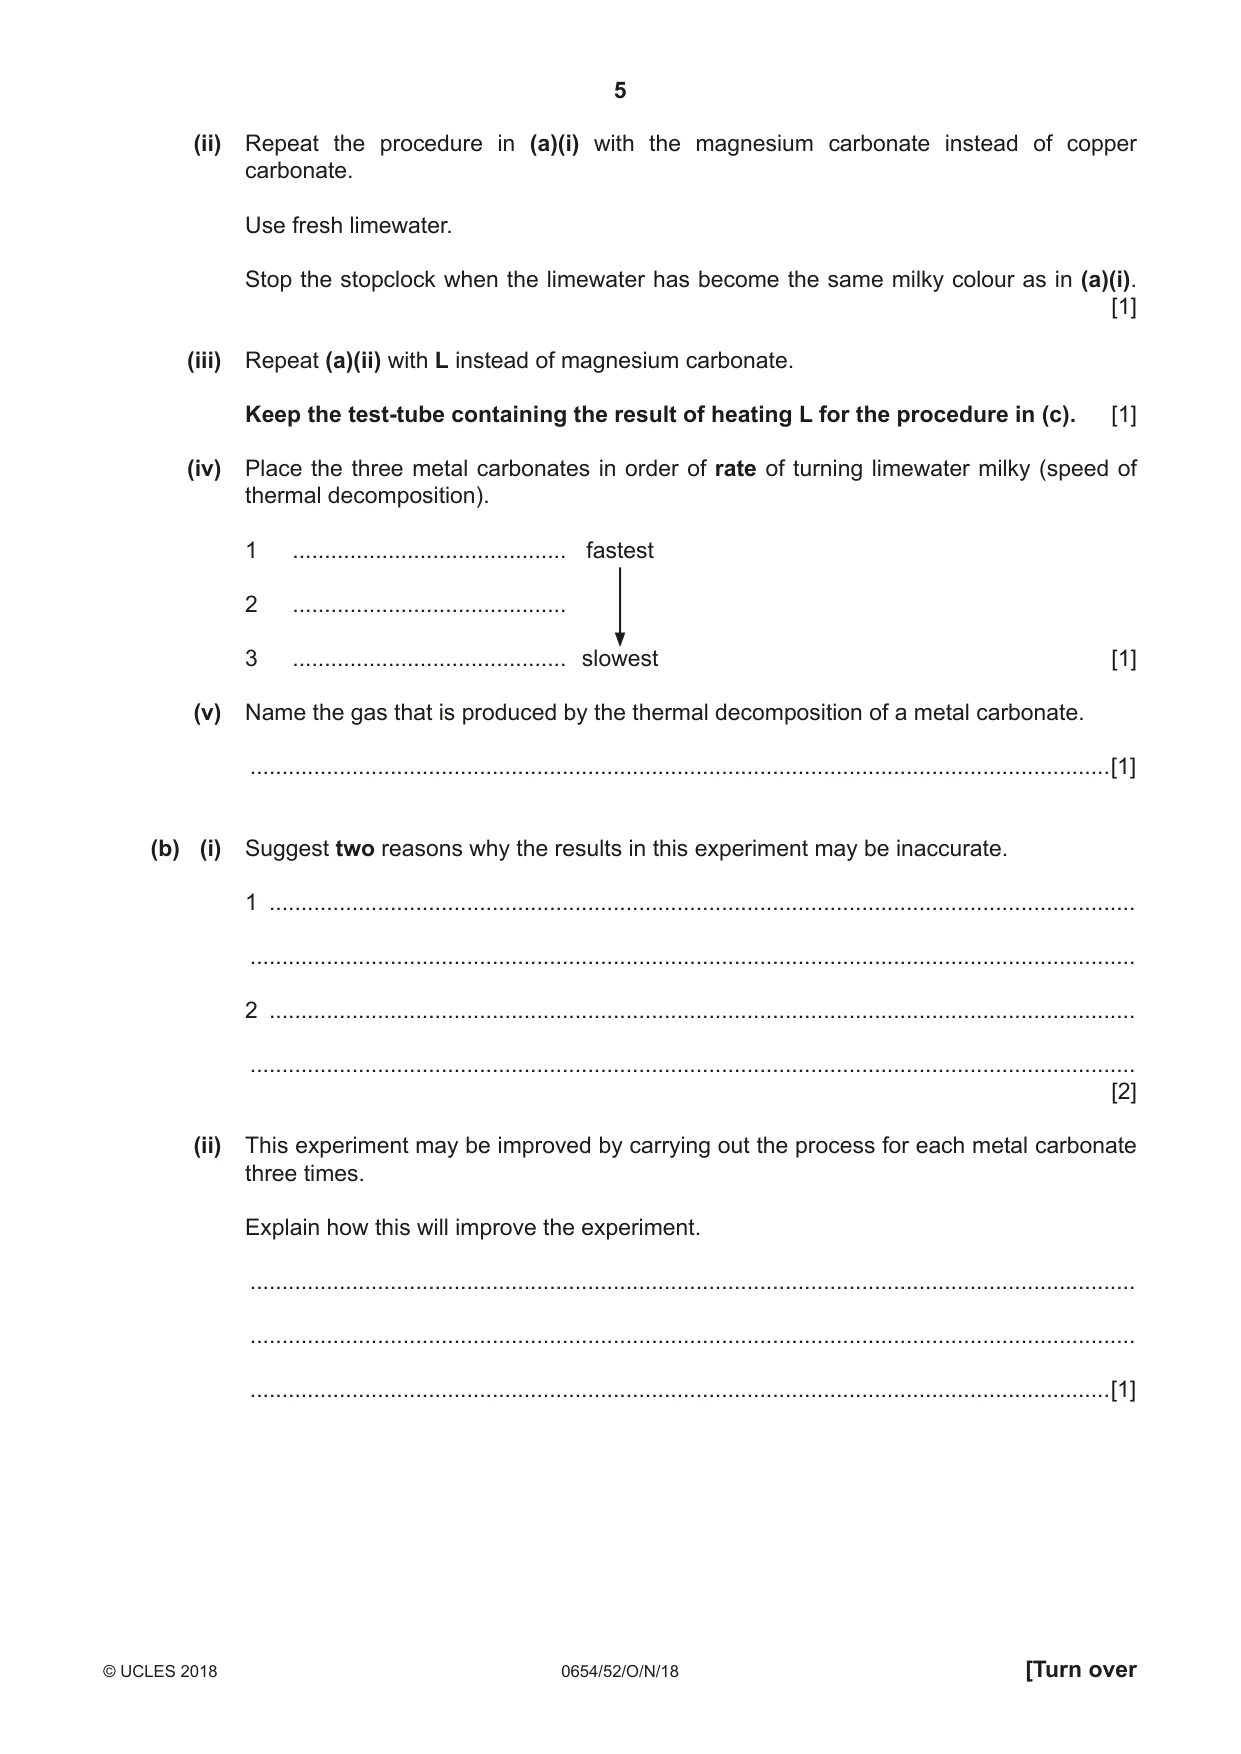
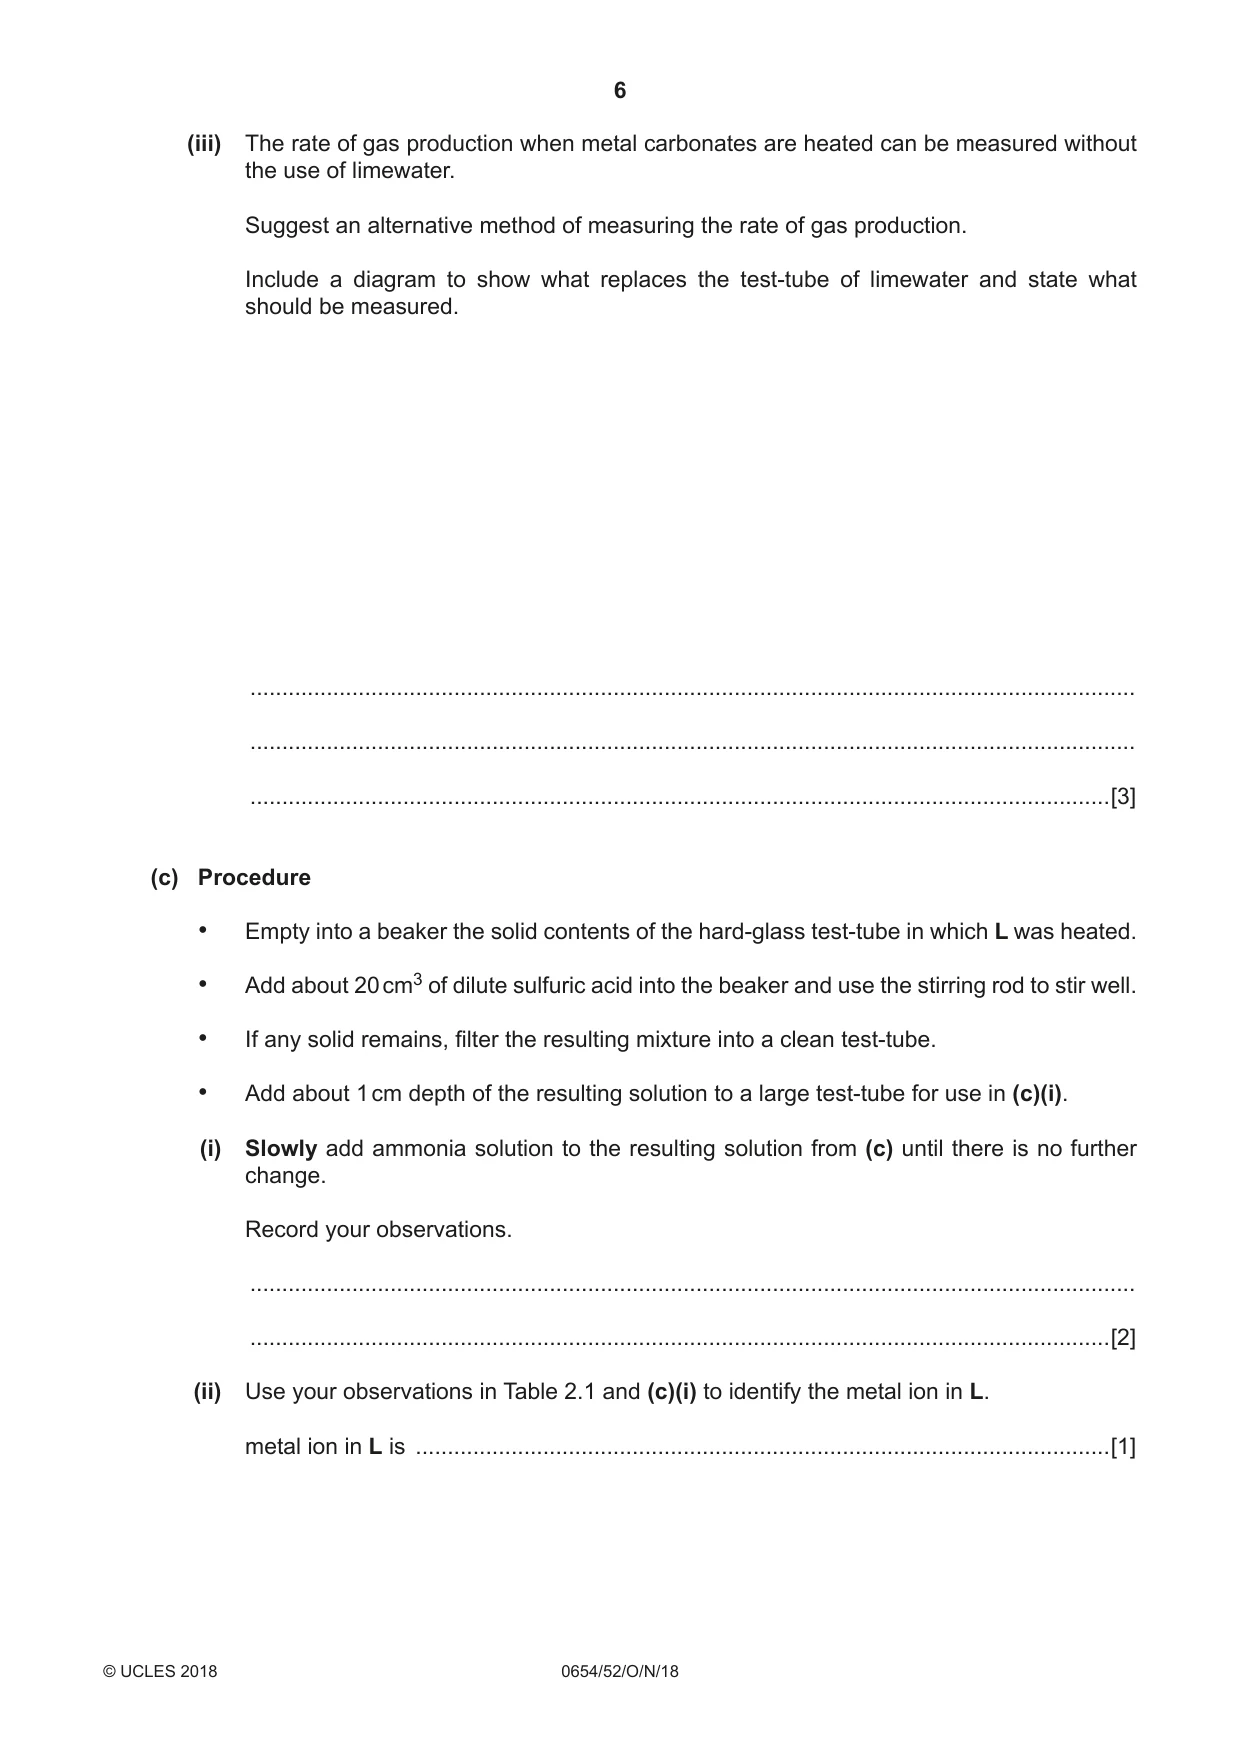
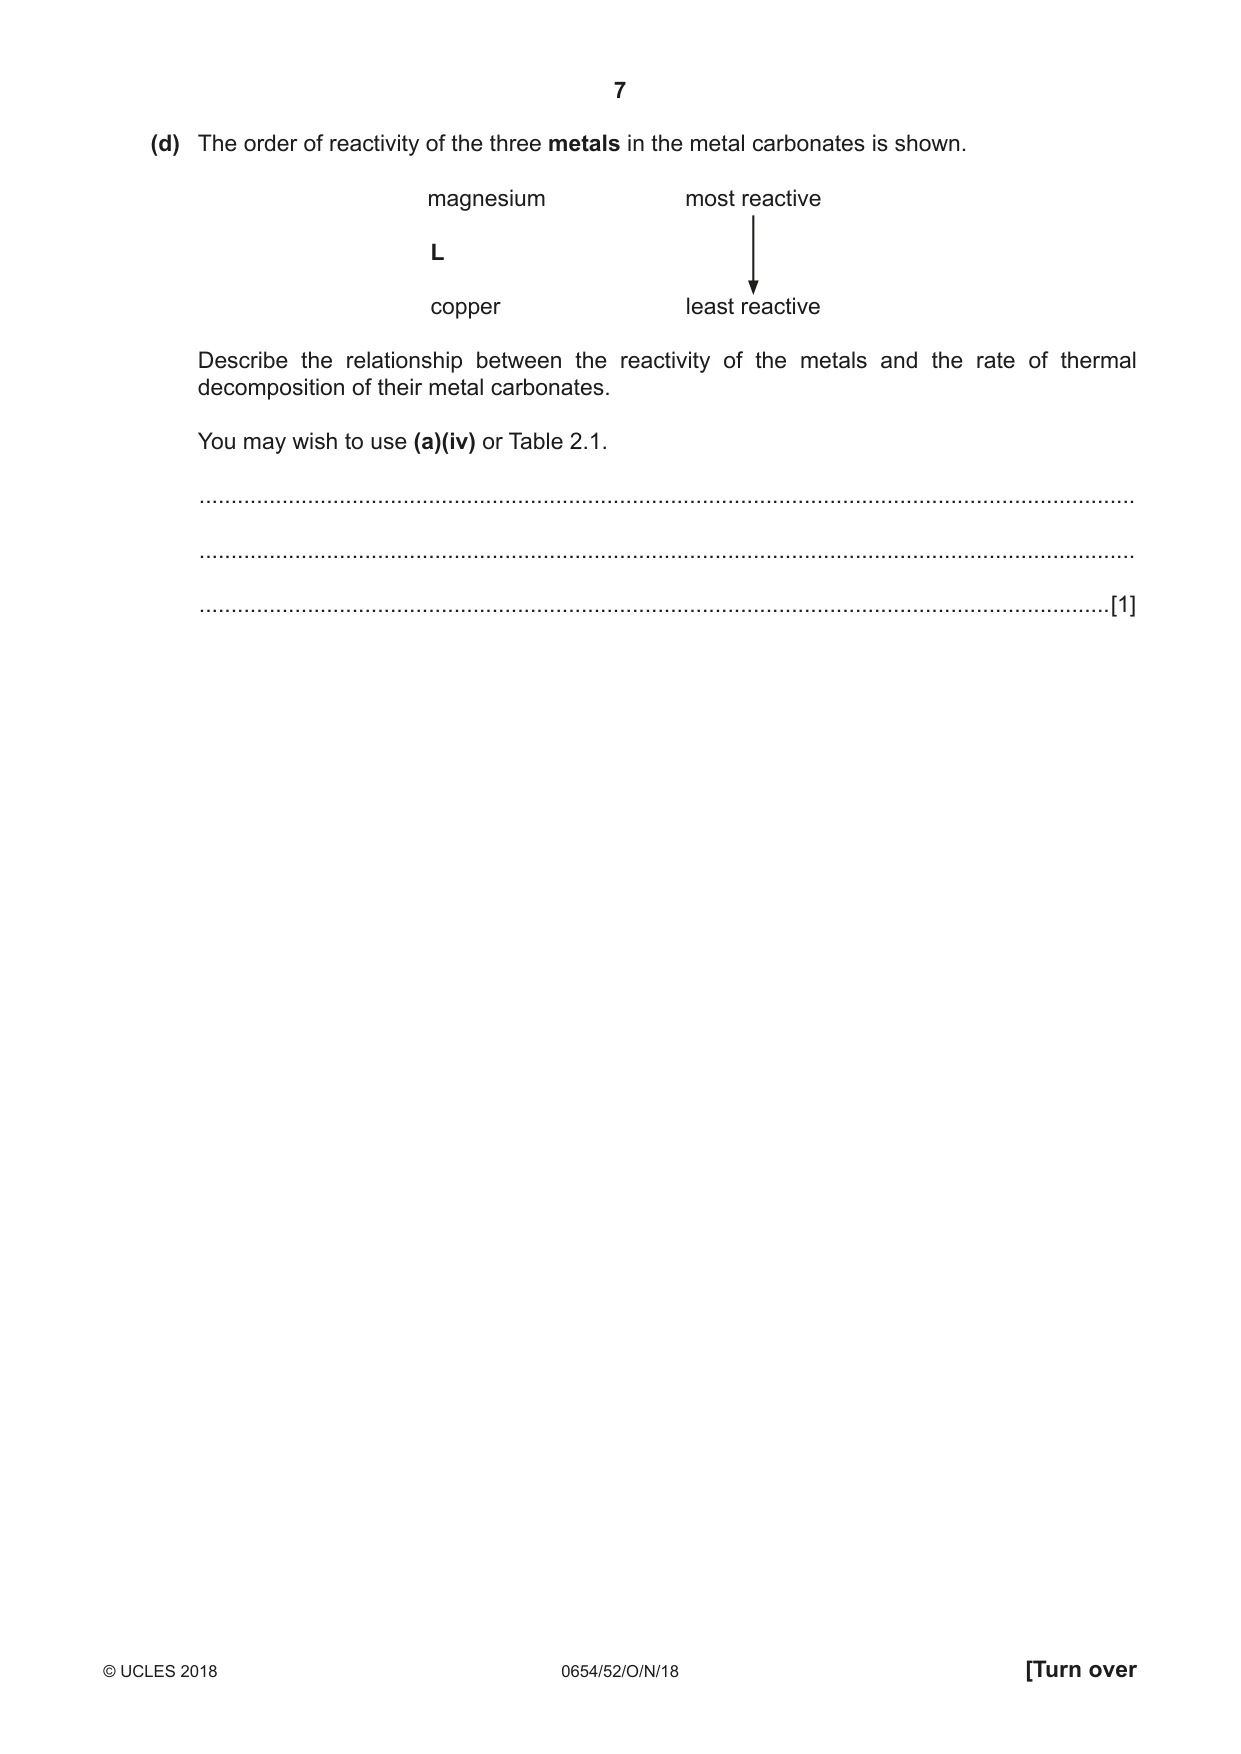
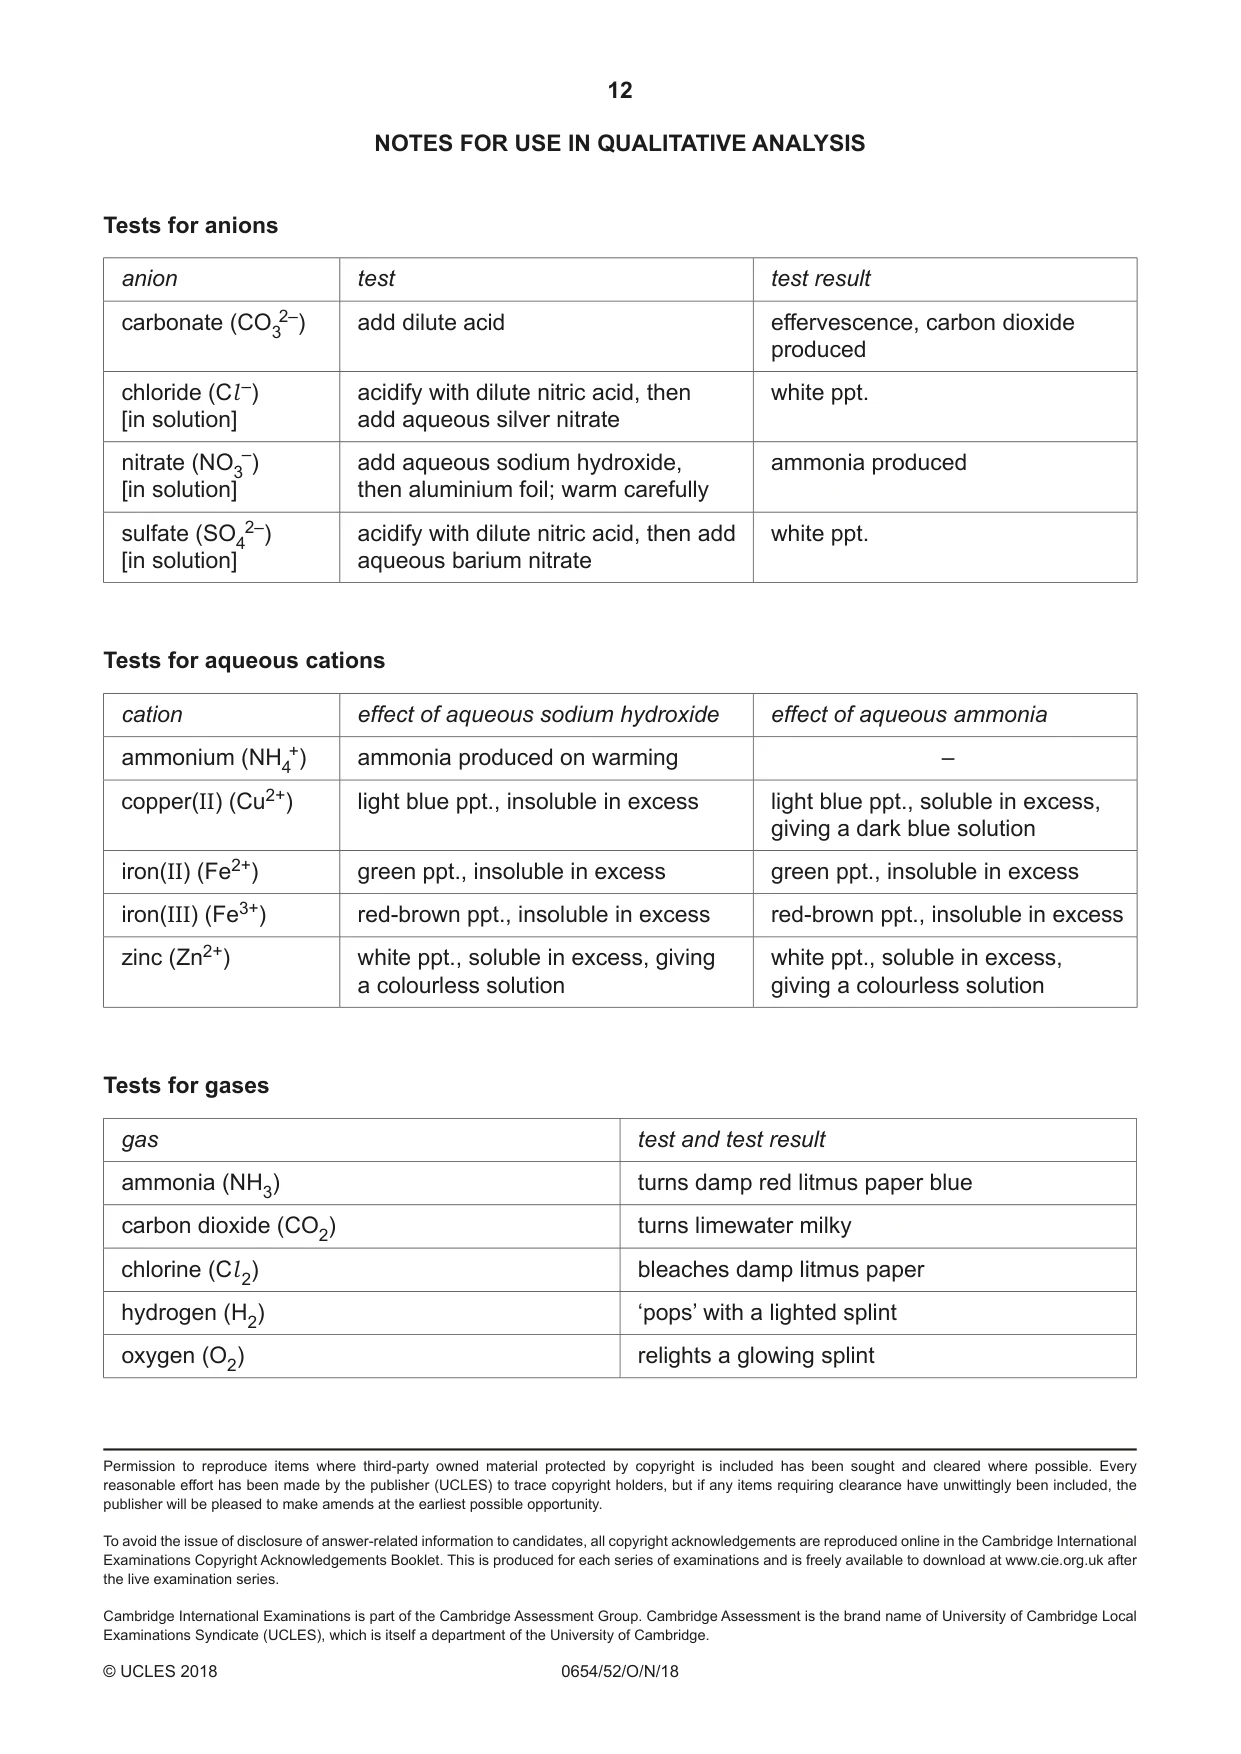
2 Notes for Use in Qualitative Analysis for this question are printed on page 12. You are going to investigate the thermal decomposition of metal carbonates and identify the metal ion in metal carbonate L. (a) (i) Procedure • Add about 3 cm depth of limewater to a test-tube. • Connect the bung of a delivery tube to a hard-glass test-tube containing copper carbonate. • Place the delivery tube into the limewater as shown in Fig. 2.1. delivery tube limewater copper carbonate heat Fig. 2.1 • Heat the test-tube containing the copper carbonate with a hot flame and start the stopclock. • When the limewater becomes milky, stop the stopclock, remove the delivery tube from the limewater and stop heating to avoid suck-back. • Record, in Table 2.1, the time to the nearest second as well as any colour change in the solid. [1] Table 2.1 name of metal carbonate time / s colour change copper carbonate magnesium carbonate L (ii) Repeat the procedure in (a)(i) with the magnesium carbonate instead of copper carbonate. Use fresh limewater. Stop the stopclock when the limewater has become the same milky colour as in (a)(i). [1] (iii) Repeat (a)(ii) with L instead of magnesium carbonate. Keep the test-tube containing the result of heating L for the procedure in (c). [1] (iv) Place the three metal carbonates in order of rate of turning limewater milky (speed of thermal decomposition). 1 ........................................... fastest 2 ........................................... 3 ........................................... slowest [1] (v) Name the gas that is produced by the thermal decomposition of a metal carbonate. .......................................................................................................................................[1] (b) (i) Suggest two reasons why the results in this experiment may be inaccurate. 1 ........................................................................................................................................ ........................................................................................................................................... 2 ........................................................................................................................................ ........................................................................................................................................... [2] (ii) This experiment may be improved by carrying out the process for each metal carbonate three times. Explain how this will improve the experiment. ........................................................................................................................................... ........................................................................................................................................... .......................................................................................................................................[1] (iii) The rate of gas production when metal carbonates are heated can be measured without the use of limewater. Suggest an alternative method of measuring the rate of gas production. Include a diagram to show what replaces the test-tube of limewater and state what should be measured. ........................................................................................................................................... ........................................................................................................................................... .......................................................................................................................................[3] (c) Procedure • Empty into a beaker the solid contents of the hard-glass test-tube in which L was heated. • Add about 20 cm3 of dilute sulfuric acid into the beaker and use the stirring rod to stir well. • If any solid remains, filter the resulting mixture into a clean test-tube. • Add about 1 cm depth of the resulting solution to a large test-tube for use in (c)(i). (i) Slowly add ammonia solution to the resulting solution from (c) until there is no further change. Record your observations. ........................................................................................................................................... .......................................................................................................................................[2] (ii) Use your observations in Table 2.1 and (c)(i) to identify the metal ion in L. metal ion in L is .............................................................................................................[1] (d) The order of reactivity of the three metals in the metal carbonates is shown. magnesium most reactive L copper least reactive Describe the relationship between the reactivity of the metals and the rate of thermal decomposition of their metal carbonates. You may wish to use (a)(iv) or Table 2.1. ................................................................................................................................................... ................................................................................................................................................... ...............................................................................................................................................[1]
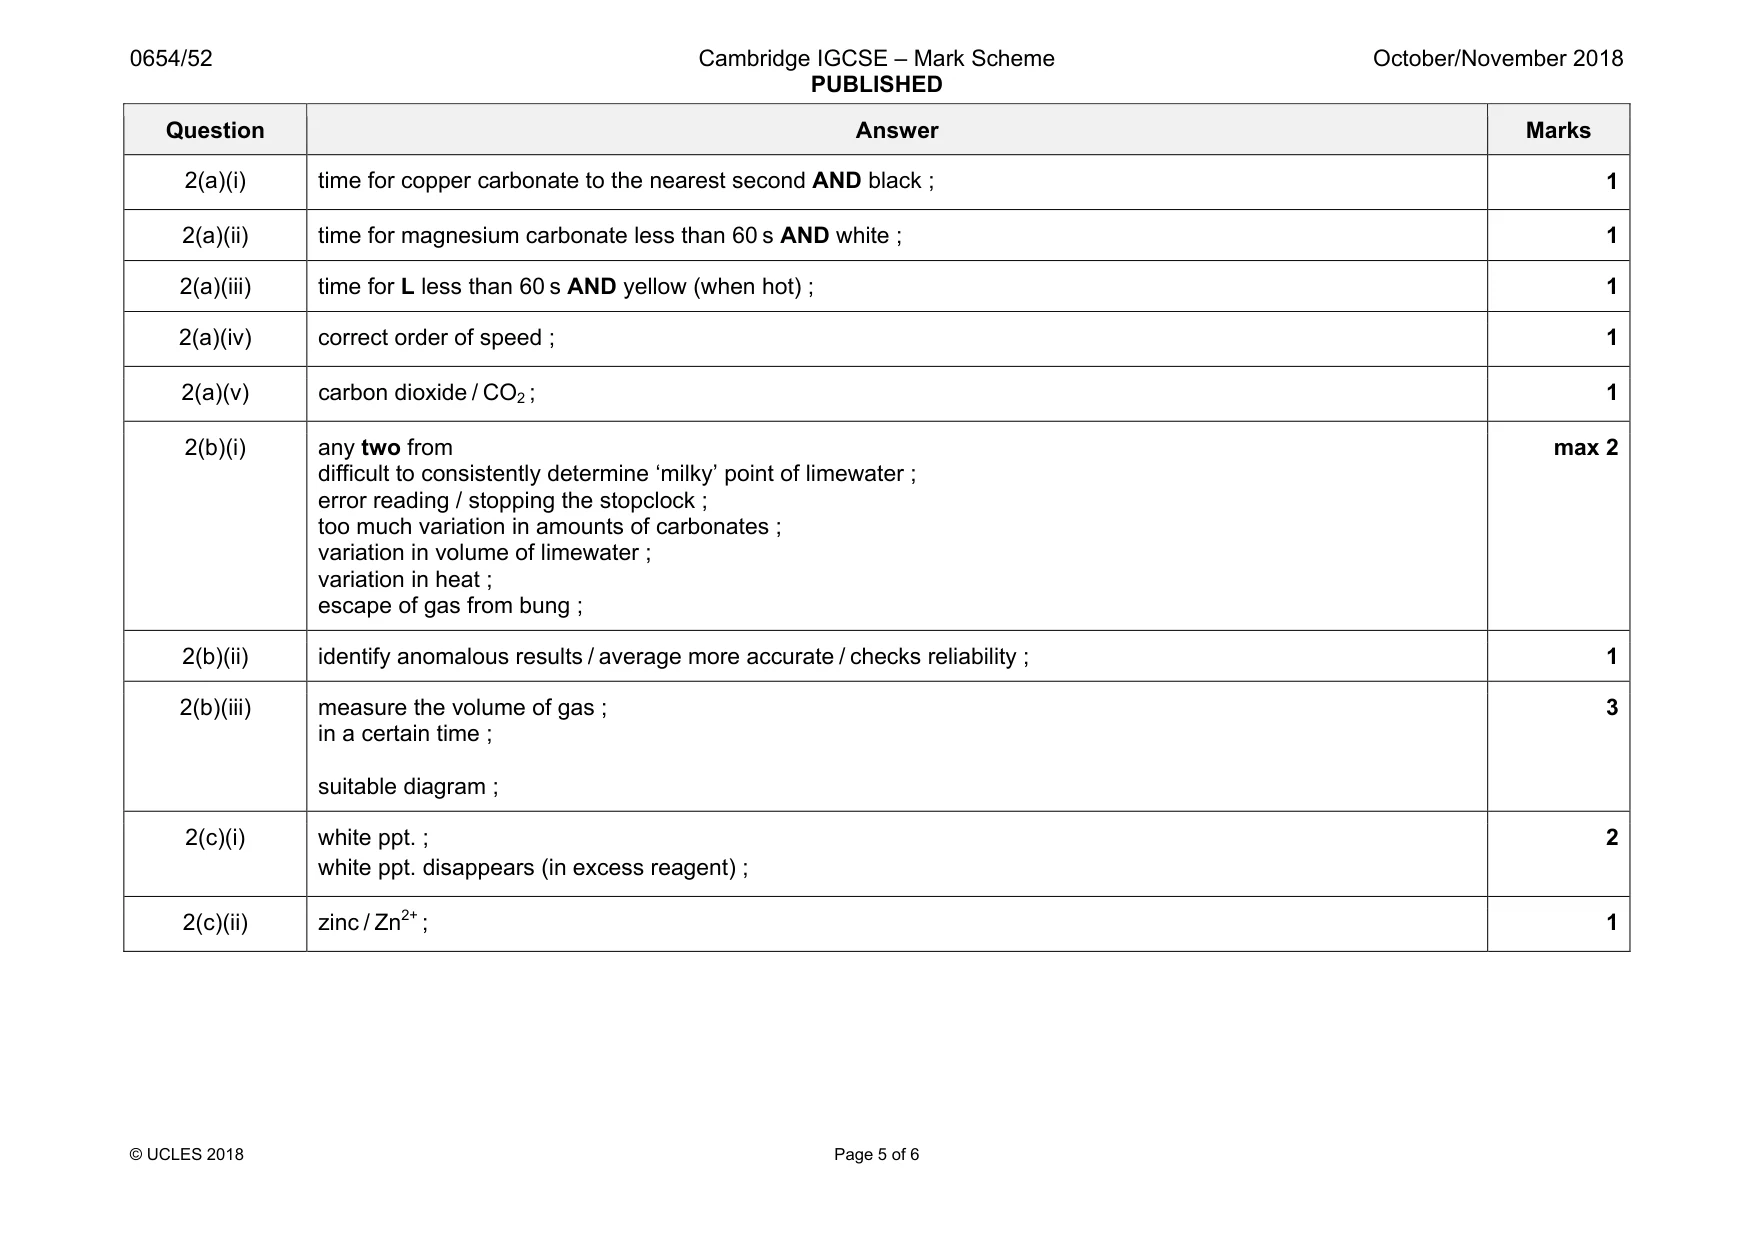
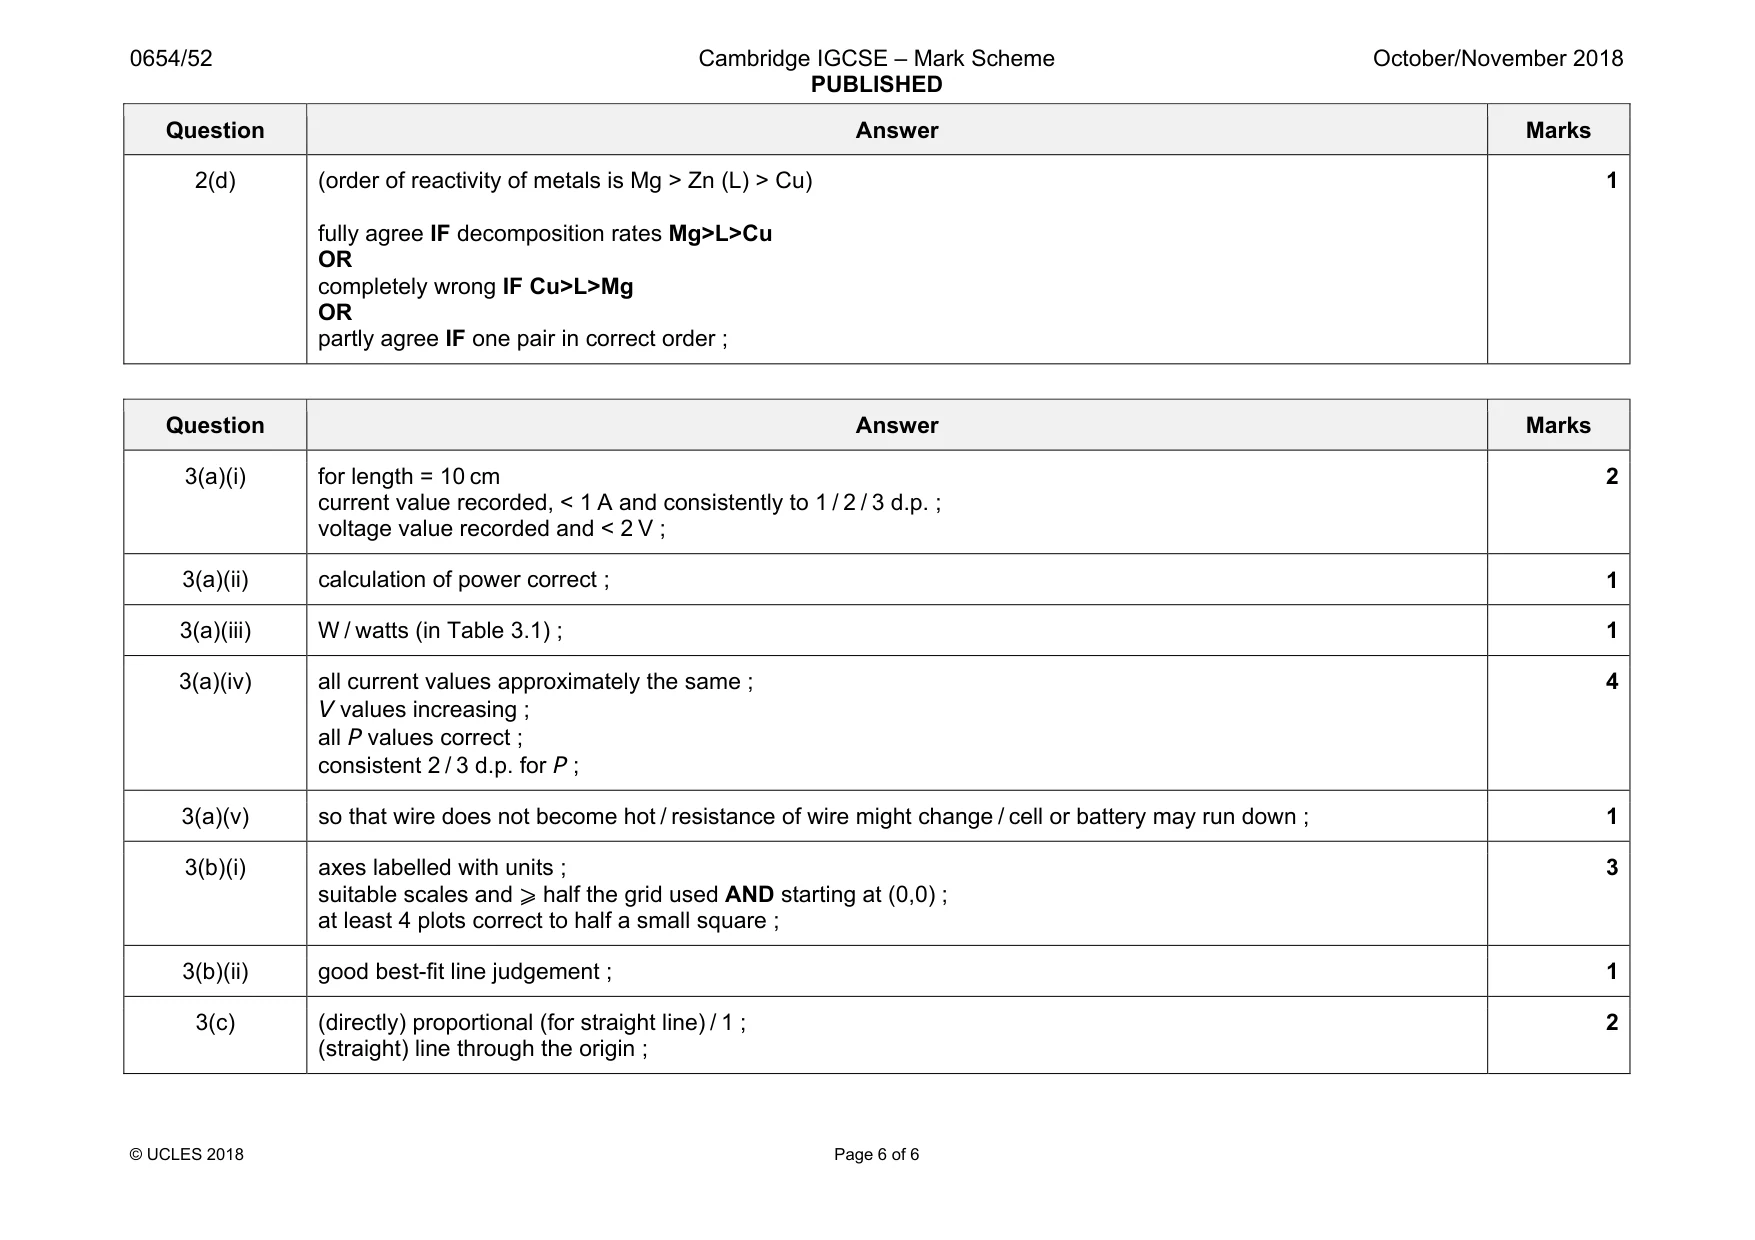
Mark scheme: 2(a)(i) time for copper carbonate to the nearest second AND black ; 1 2(a)(ii) time for magnesium carbonate less than 60 s AND white ; 1 2(a)(iii) time for L less than 60 s AND yellow (when hot) ; 1 2(a)(iv) correct order of speed ; 1 2(a)(v) carbon dioxide / CO2 ; 1 2(b)(i) any two from difficult to consistently determine ‘milky’ point of limewater ; error reading / stopping the stopclock ; too much variation in amounts of carbonates ; variation in volume of limewater ; variation in heat ; escape of gas from bung ; max 2 2(b)(ii) identify anomalous results / average more accurate / checks reliability ; 1 2(b)(iii) measure the volume of gas ; in a certain time ; suitable diagram ; 3 2(c)(i) white ppt. ; white ppt. disappears (in excess reagent) ; 2 2(c)(ii) zinc / Zn2+ ; 1 Question Answer Marks 2(d) (order of reactivity of metals is Mg > Zn (L) > Cu) fully agree IF decomposition rates Mg>L>Cu OR completely wrong IF Cu>L>Mg OR partly agree IF one pair in correct order ; 1
Q3 · You are going to investigate how the power produced in a resistance wire XY depends upon…
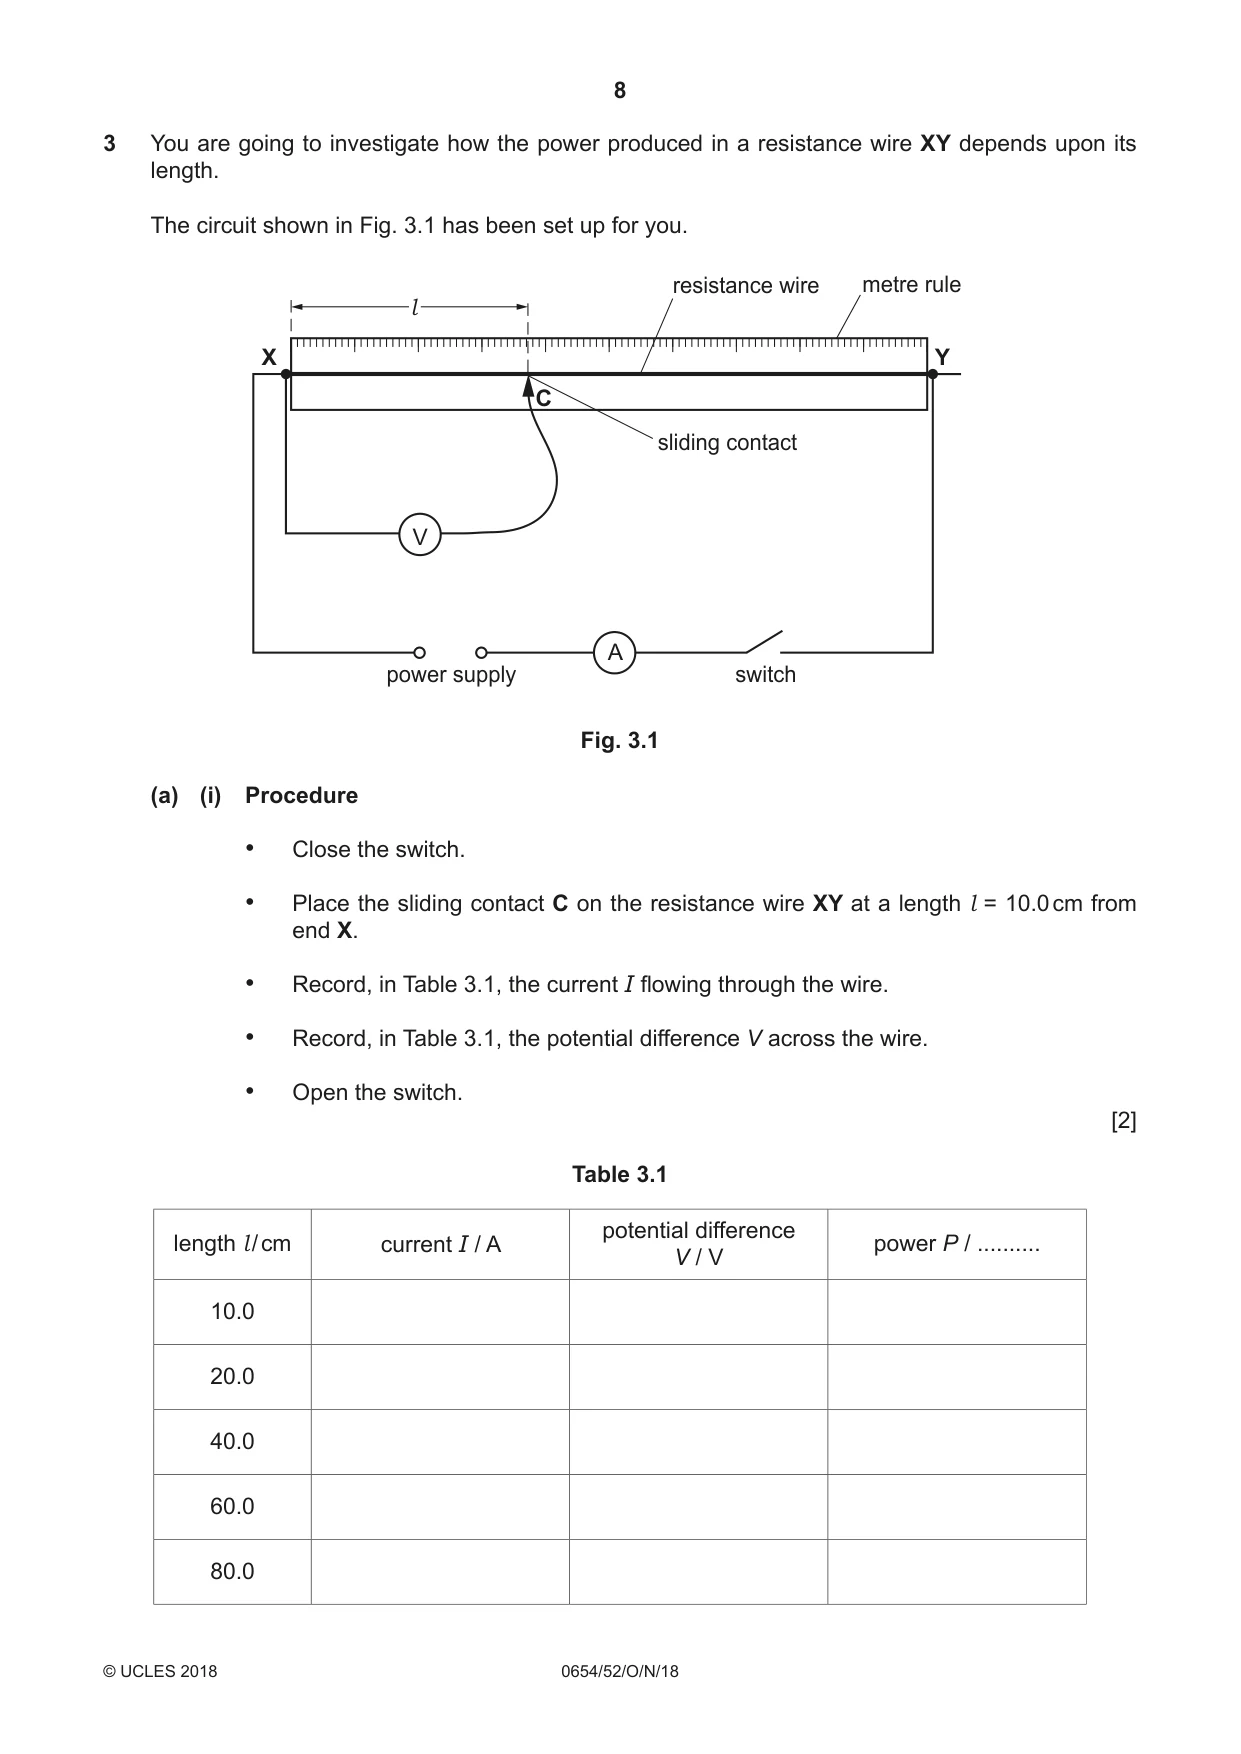
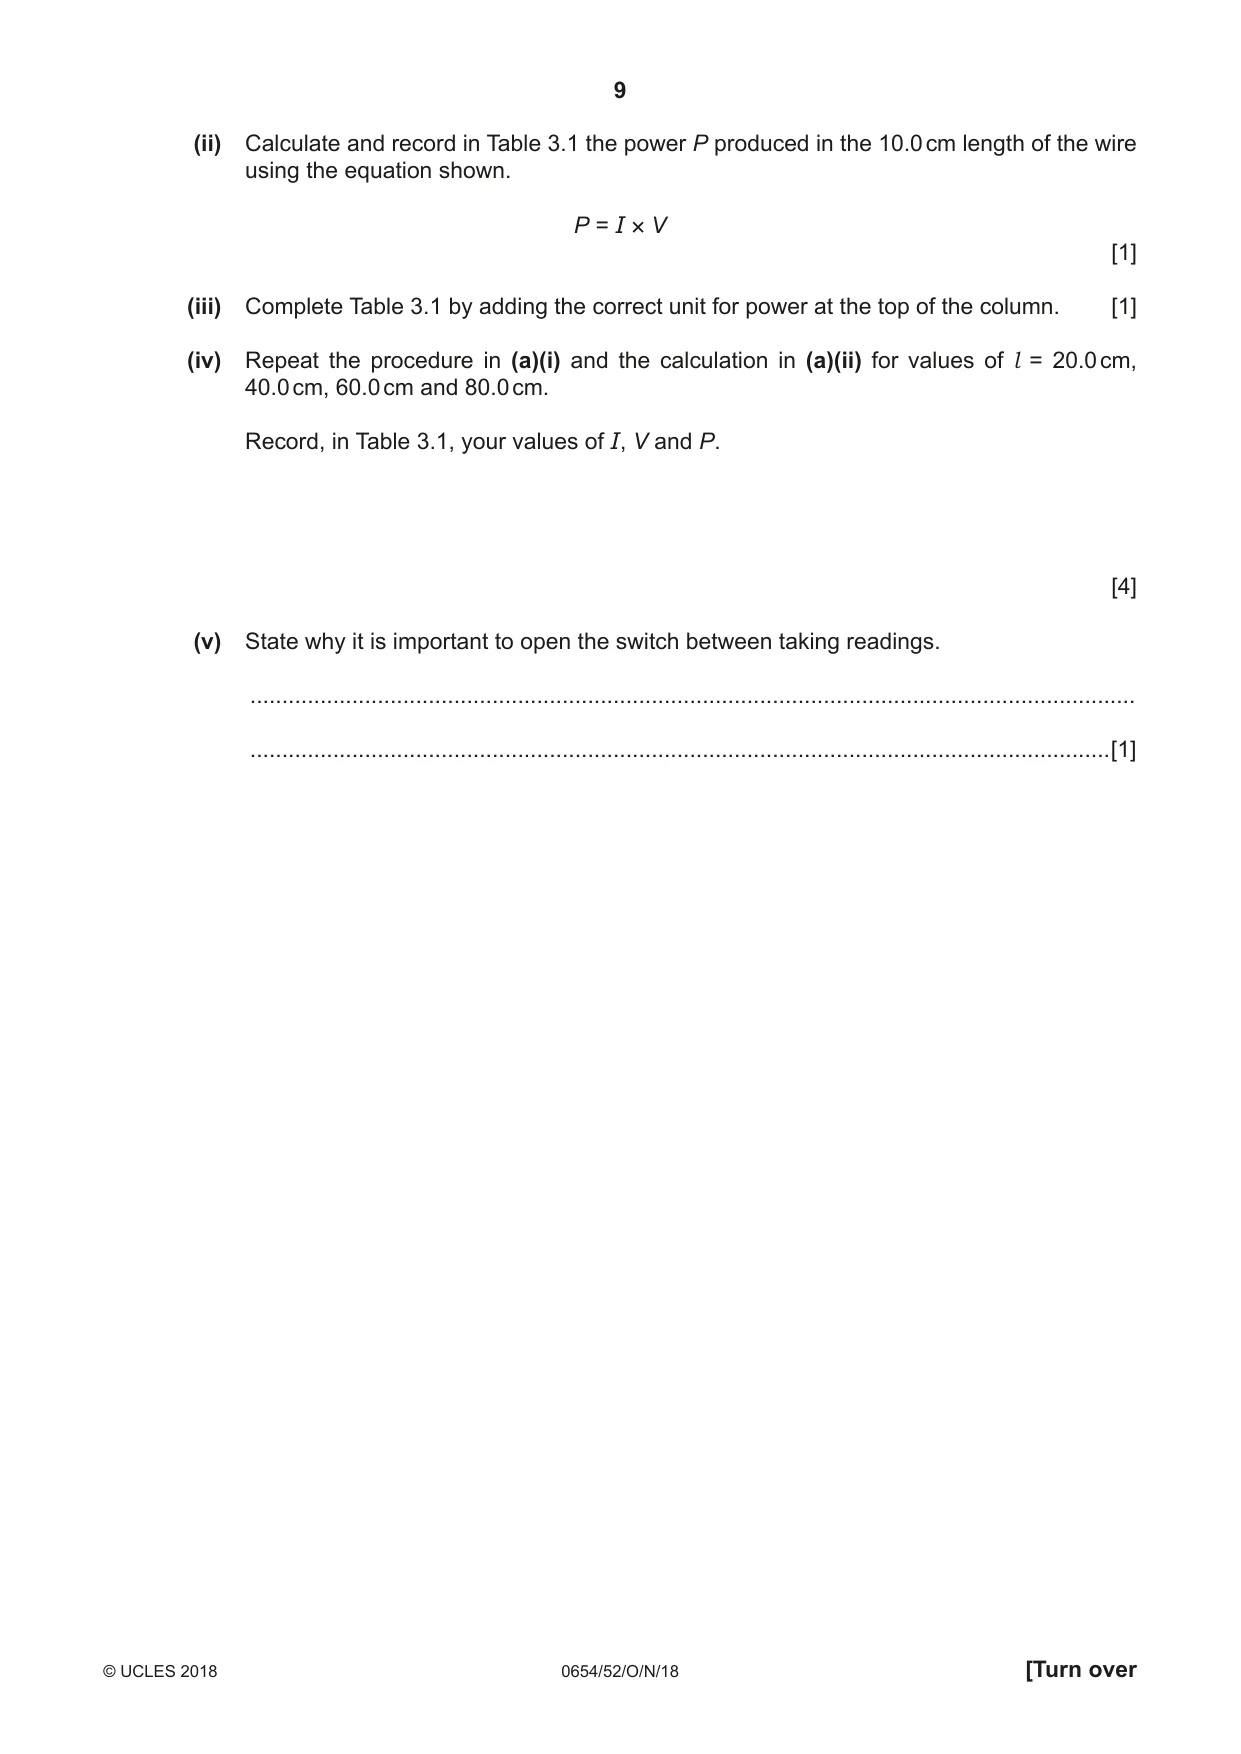
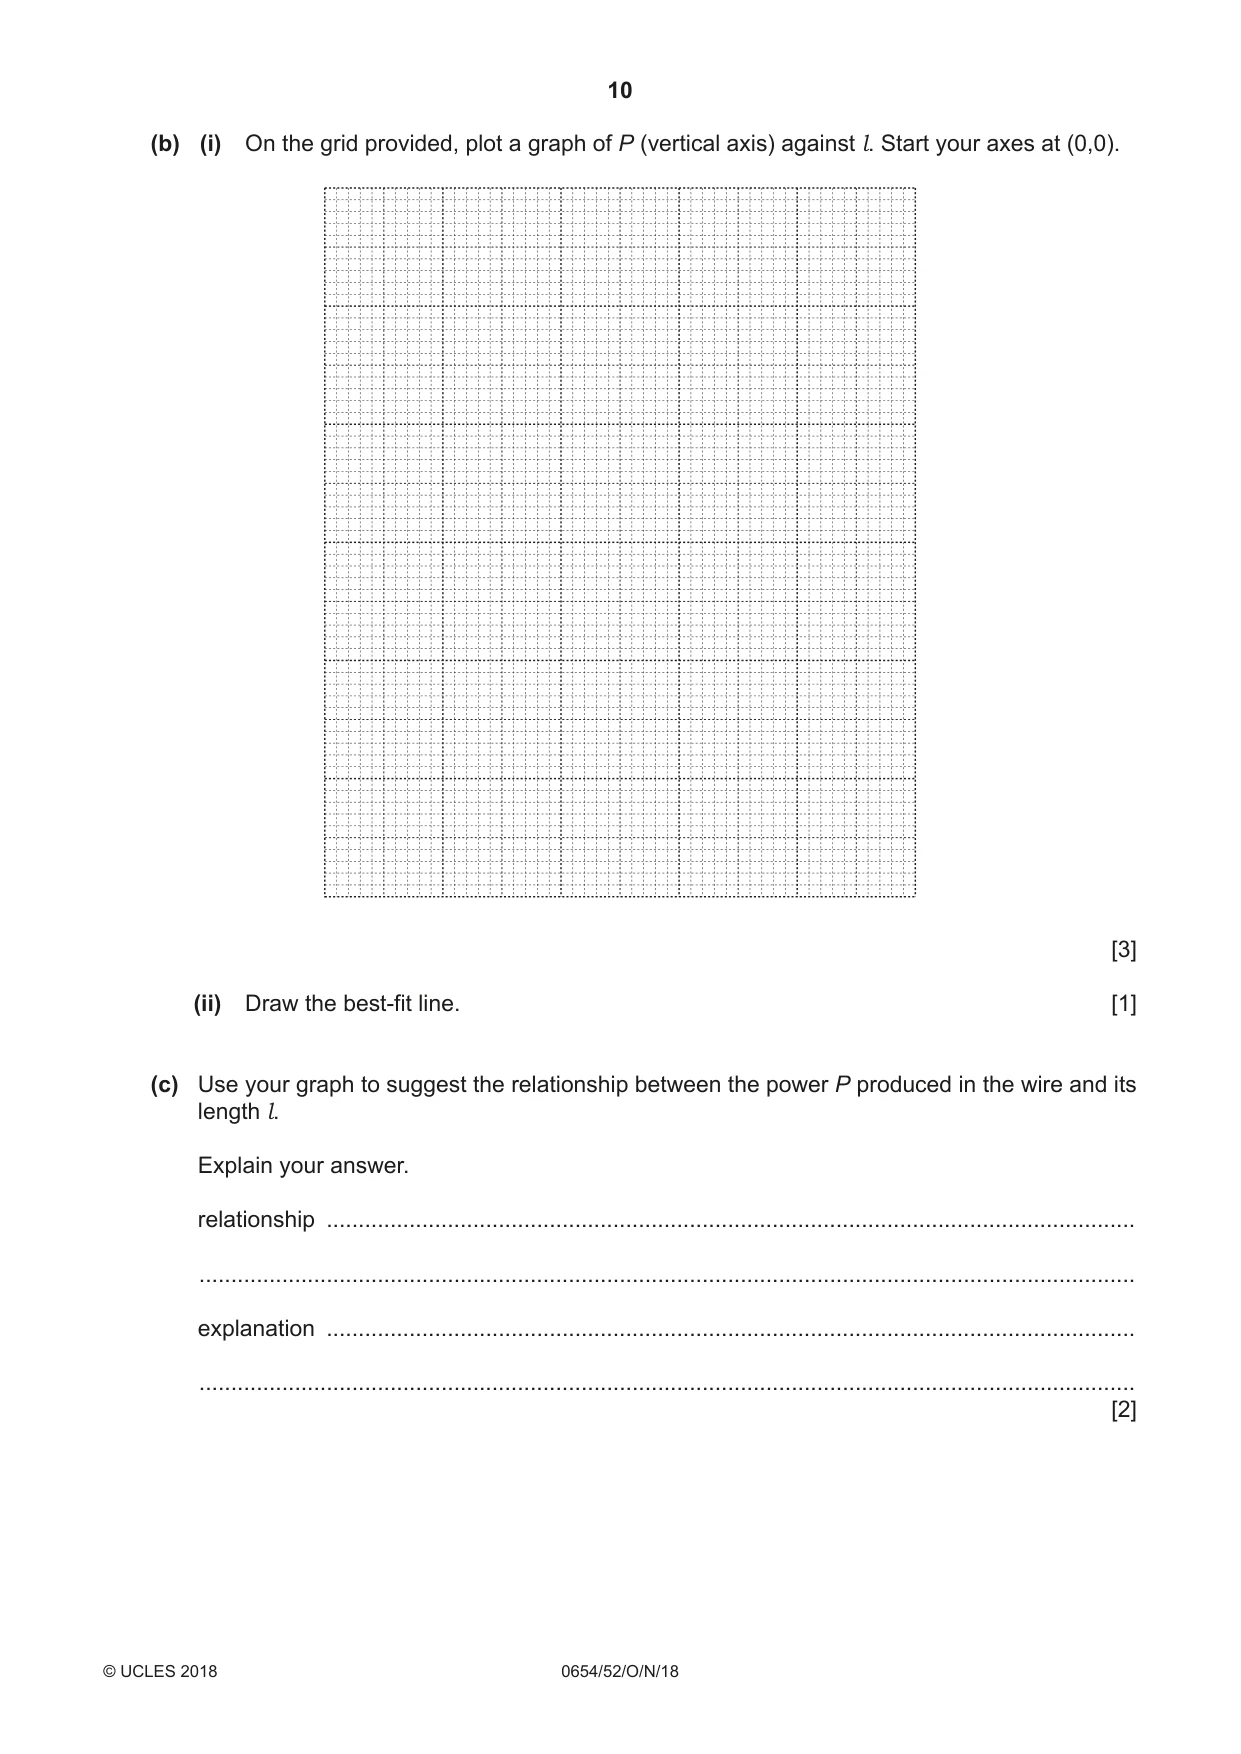
3 You are going to investigate how the power produced in a resistance wire XY depends upon its length. The circuit shown in Fig. 3.1 has been set up for you. resistance wire metre rule l X Y C sliding contact V A power supply switch Fig. 3.1 (a) (i) Procedure • Close the switch. • Place the sliding contact C on the resistance wire XY at a length l = 10.0 cm from end X. • Record, in Table 3.1, the current I flowing through the wire. • Record, in Table 3.1, the potential difference V across the wire. • Open the switch. [2] Table 3.1 potential difference length l / cm current I / A power P / .......... V / V 10.0 20.0 40.0 60.0 80.0 (ii) Calculate and record in Table 3.1 the power P produced in the 10.0 cm length of the wire using the equation shown. P = I × V [1] (iii) Complete Table 3.1 by adding the correct unit for power at the top of the column. [1] (iv) Repeat the procedure in (a)(i) and the calculation in (a)(ii) for values of l = 20.0 cm, 40.0 cm, 60.0 cm and 80.0 cm. Record, in Table 3.1, your values of I, V and P. [4] (v) State why it is important to open the switch between taking readings. ........................................................................................................................................... .......................................................................................................................................[1] (b) (i) On the grid provided, plot a graph of P (vertical axis) against l. Start your axes at (0,0). [3] (ii) Draw the best-fit line. [1] (c) Use your graph to suggest the relationship between the power P produced in the wire and its length l. Explain your answer. relationship ............................................................................................................................... ................................................................................................................................................... explanation ............................................................................................................................... ................................................................................................................................................... [2]
Mark scheme: 3(a)(i) for length = 10 cm current value recorded, < 1 A and consistently to 1 / 2 / 3 d.p. ; voltage value recorded and < 2 V ; 2 3(a)(ii) calculation of power correct ; 1 3(a)(iii) W / watts (in Table 3.1) ; 1 3(a)(iv) all current values approximately the same ; V values increasing ; all P values correct ; consistent 2 / 3 d.p. for P ; 4 3(a)(v) so that wire does not become hot / resistance of wire might change / cell or battery may run down ; 1 3(b)(i) axes labelled with units ; suitable scales and ⩾ half the grid used AND starting at (0,0) ; at least 4 plots correct to half a small square ; 3 3(b)(ii) good best-fit line judgement ; 1 3(c) (directly) proportional (for straight line) / 1 ; (straight) line through the origin ; 2
What was in this paper
The subtopics covered by these 3 questions, and how many questions each got. Open one in a new tab to see every Cambridge question on it.
What you needed in this session
Cambridge’s own grade thresholds for 2018 Oct/Nov, Paper 5 · Variant 2. A higher threshold means an easier paper — the bar moves with how the cohort did.