Cambridge IGCSE Sciences - Co-ordinated (Double) 0654 — 2015 May/June Paper 6 · Variant 3
0654/63/M/J/15 · 60 marks · ≈68 min
The question paper and its mark scheme, free to read here and free to download. This is Cambridge’s own paper, exactly as it was sat.
Question paper20 pages



Mark scheme4 pages
Answers below. Sit the paper first if you are practising.
Paper as text
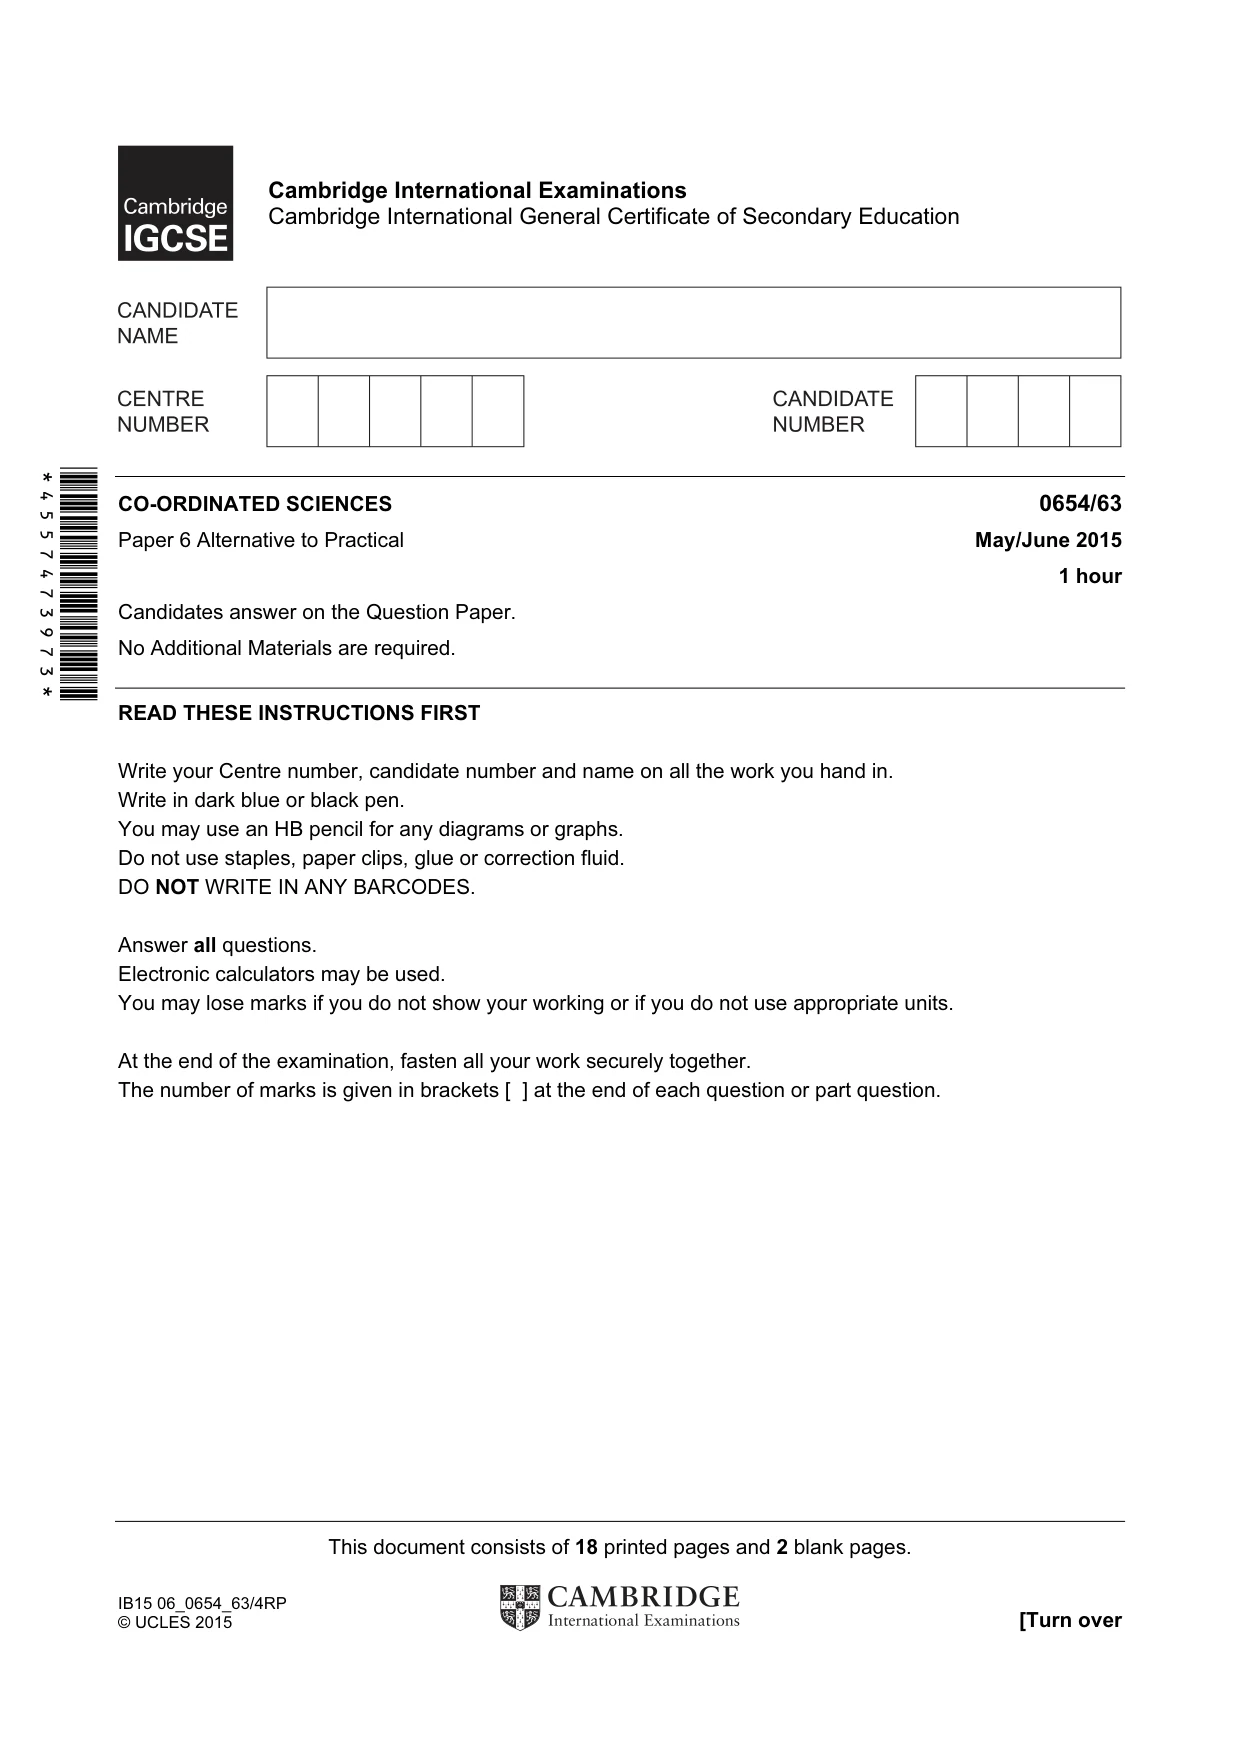
Question paper, page 1
This document consists of 18 printed pages and 2 blank pages. IB15 06_0654_63/4RP © UCLES 2015 [Turn over *4557473973* Cambridge International Examinations Cambridge International General Certificate of Secondary Education CO-ORDINATED SCIENCES 0654/63 Paper 6 Alternative to Practical May/June 2015 1 hour Candidates answer on the Question Paper. No Additional Materials are required. READ THESE INSTRUCTIONS FIRST Write your Centre number, candidate number and name on all the work you hand in. Write in dark blue or black pen. You may use an HB pencil for any diagrams or graphs. Do not use staples, paper clips, glue or correction fluid. DO NOT WRITE IN ANY BARCODES. Answer all questions. Electronic calculators may be used. You may lose marks if you do not show your working or if you do not use appropriate units. At the end of the examination, fasten all your work securely together. The number of marks is given in brackets [ ] at the end of each question or part question.
Question paper, page 2
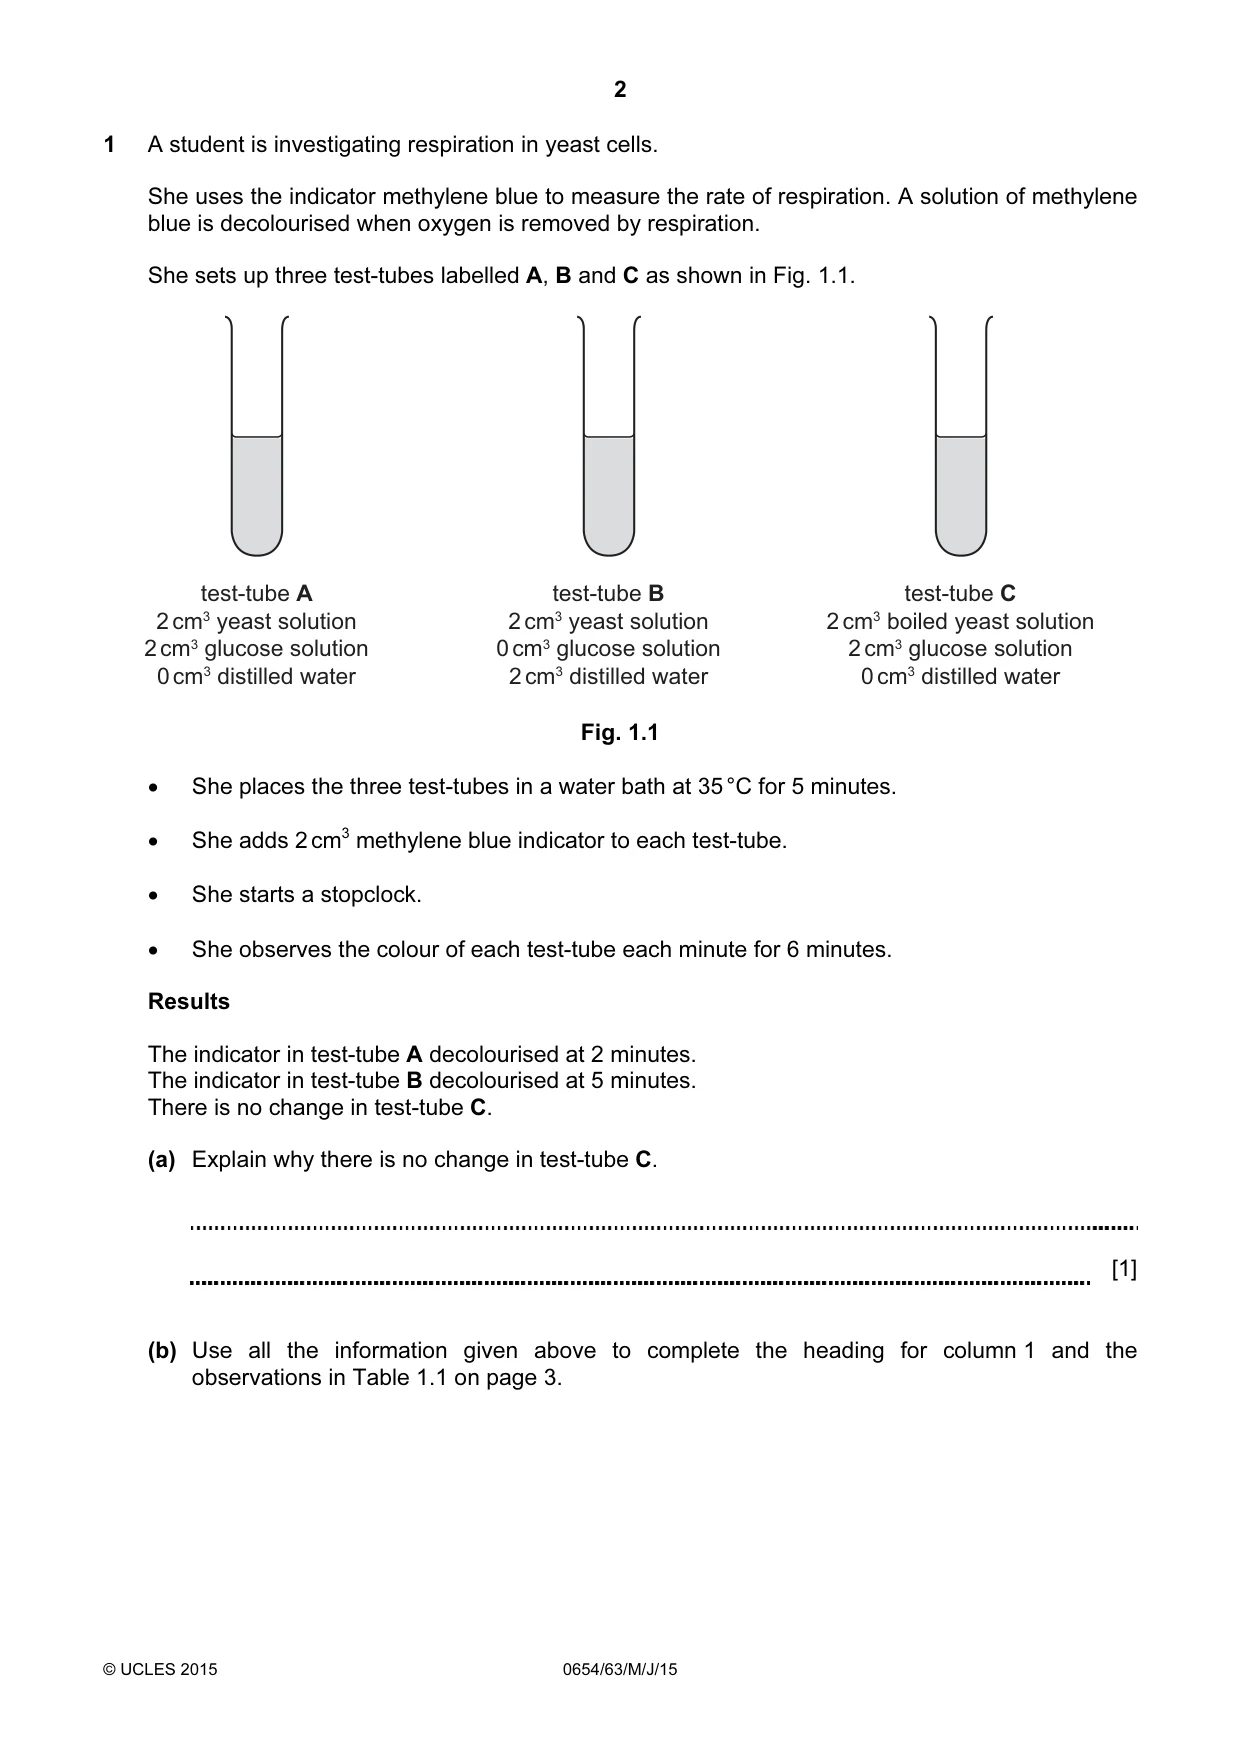
2 © UCLES 2015 0654/63/M/J/15 1 A student is investigating respiration in yeast cells. She uses the indicator methylene blue to measure the rate of respiration. A solution of methylene blue is decolourised when oxygen is removed by respiration. She sets up three test-tubes labelled A, B and C as shown in Fig. 1.1. test-tube A 2 cm3 yeast solution 2 cm3 glucose solution 0 cm3 distilled water test-tube B 2 cm3 yeast solution 0 cm3 glucose solution 2 cm3 distilled water test-tube C 2 cm3 boiled yeast solution 2 cm3 glucose solution 0 cm3 distilled water Fig. 1.1 • She places the three test-tubes in a water bath at 35 °C for 5 minutes. • She adds 2 cm3 methylene blue indicator to each test-tube. • She starts a stopclock. • She observes the colour of each test-tube each minute for 6 minutes. Results The indicator in test-tube A decolourised at 2 minutes. The indicator in test-tube B decolourised at 5 minutes. There is no change in test-tube C. (a) Explain why there is no change in test-tube C. [1] (b) Use all the information given above to complete the heading for column 1 and the observations in Table 1.1 on page 3.
Question paper, page 3
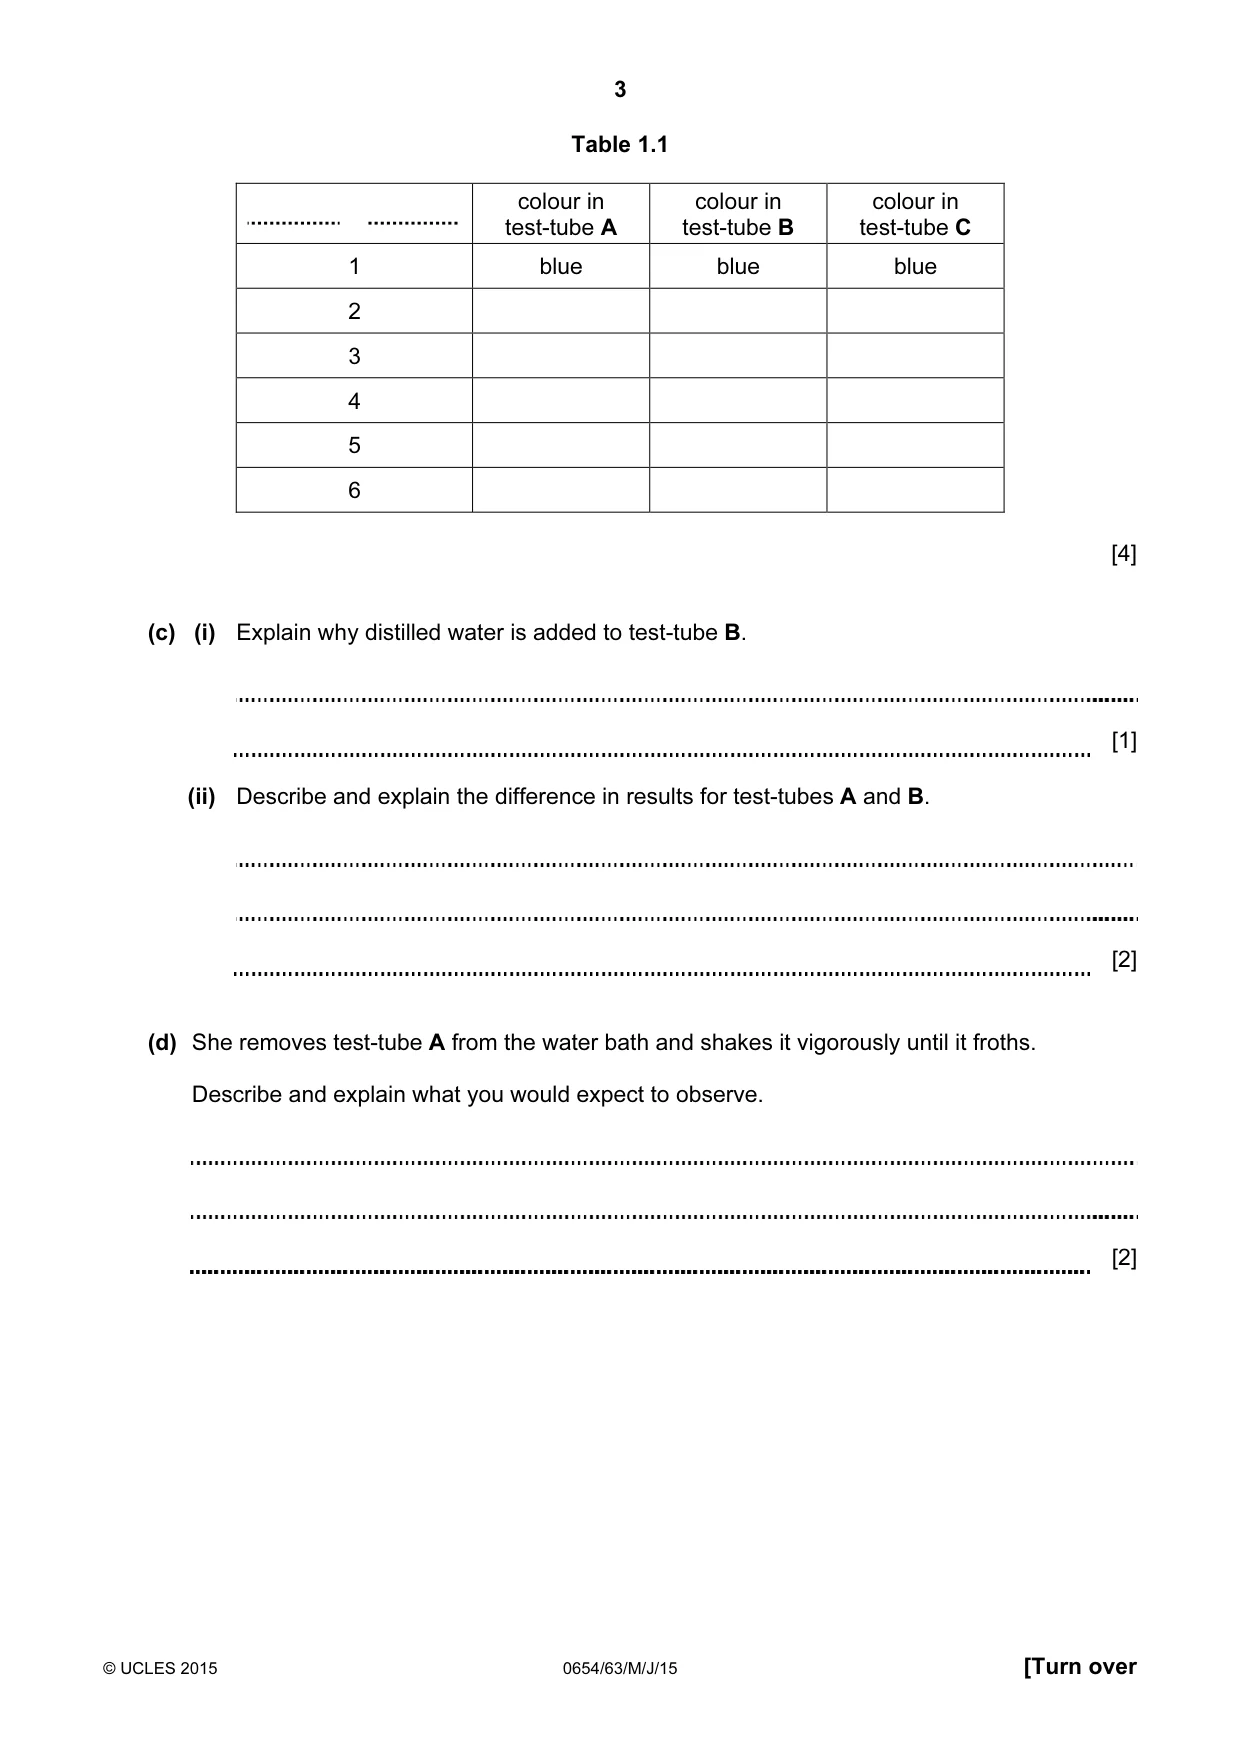
3 © UCLES 2015 0654/63/M/J/15 [Turn over Table 1.1 colour in test-tube A colour in test-tube B colour in test-tube C 1 blue blue blue 2 3 4 5 6 [4] (c) (i) Explain why distilled water is added to test-tube B. [1] (ii) Describe and explain the difference in results for test-tubes A and B. [2] (d) She removes test-tube A from the water bath and shakes it vigorously until it froths. Describe and explain what you would expect to observe. [2]
Question paper, page 4
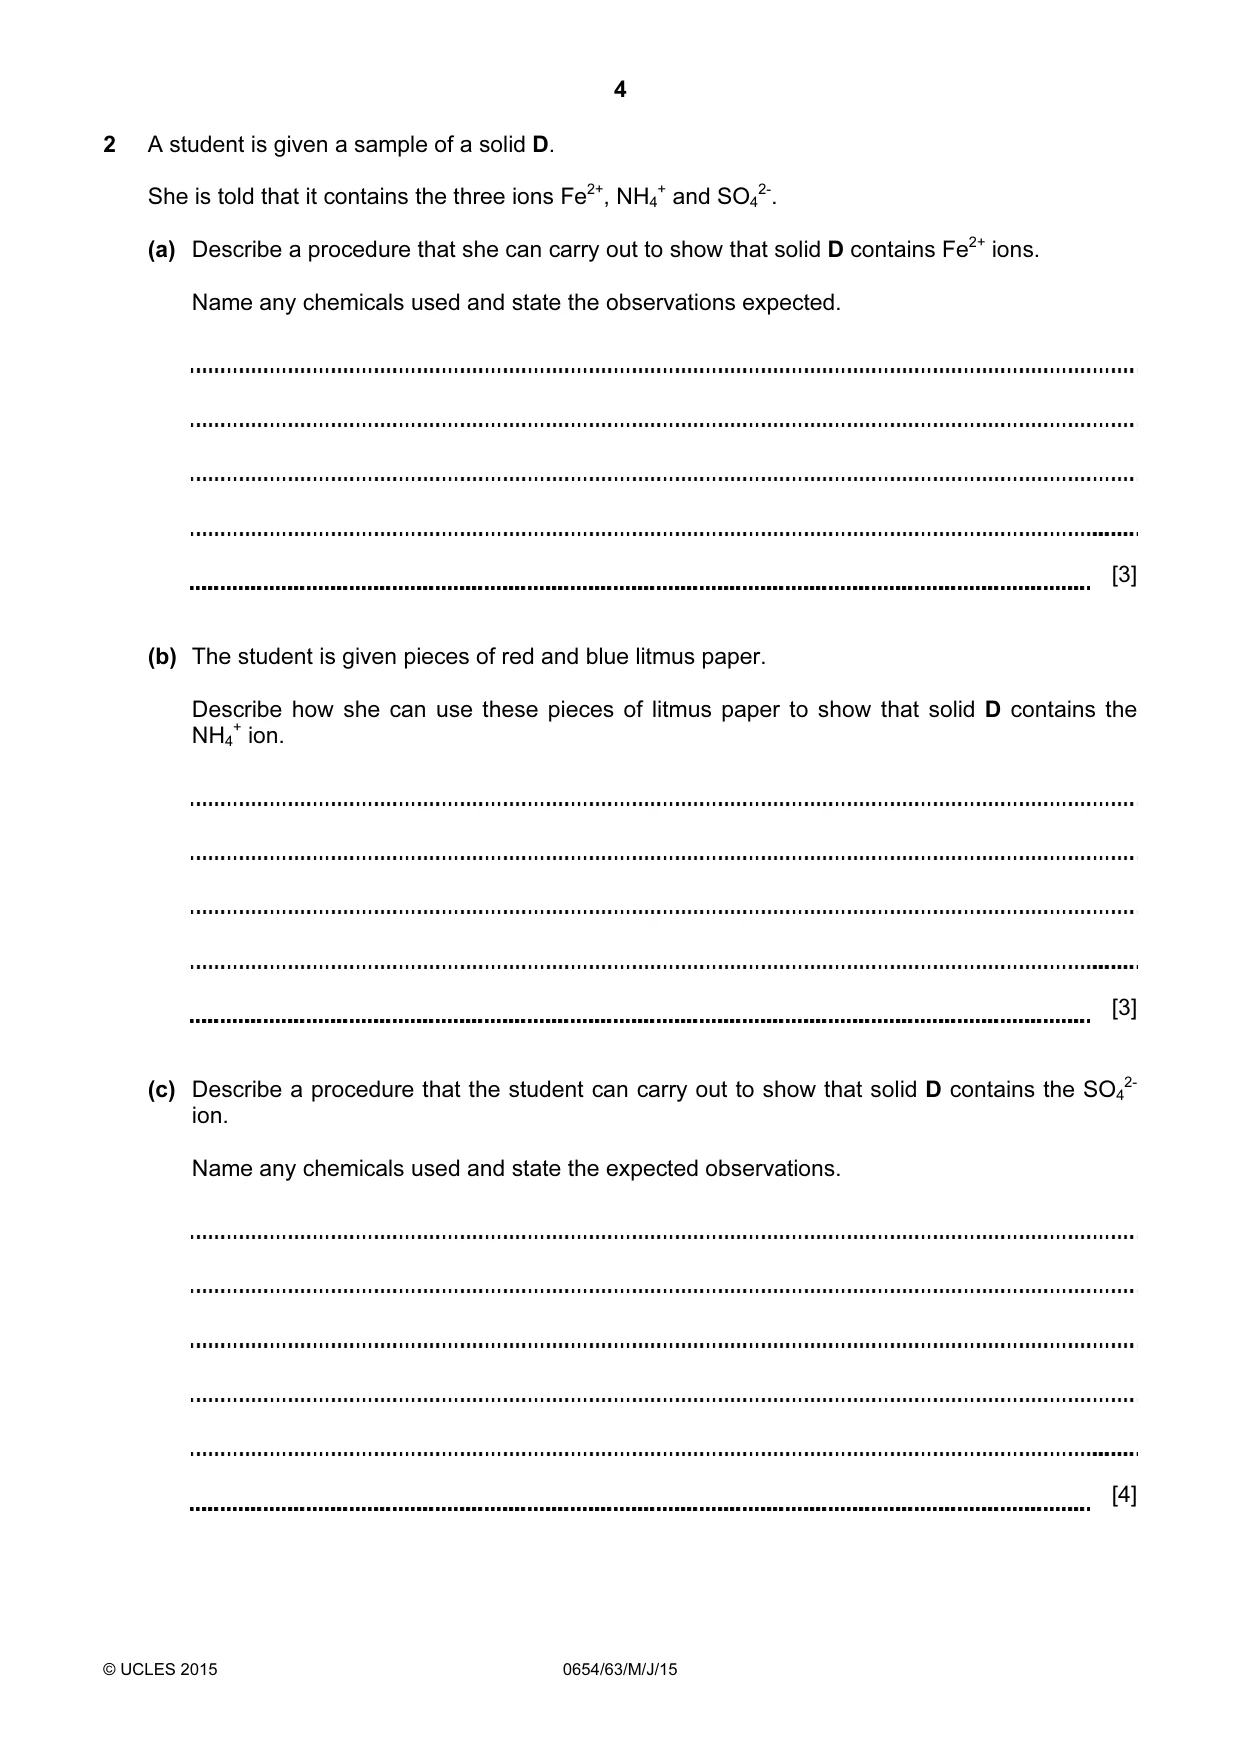
4 © UCLES 2015 0654/63/M/J/15 2 A student is given a sample of a solid D. She is told that it contains the three ions Fe2+, NH4 + and SO4 2-. (a) Describe a procedure that she can carry out to show that solid D contains Fe2+ ions. Name any chemicals used and state the observations expected. [3] (b) The student is given pieces of red and blue litmus paper. Describe how she can use these pieces of litmus paper to show that solid D contains the NH4 + ion. [3] (c) Describe a procedure that the student can carry out to show that solid D contains the SO4 2- ion. Name any chemicals used and state the expected observations. [4]
Question paper, page 5
5 © UCLES 2015 0654/63/M/J/15 [Turn over Please turn over for Question 3.
Question paper, page 6
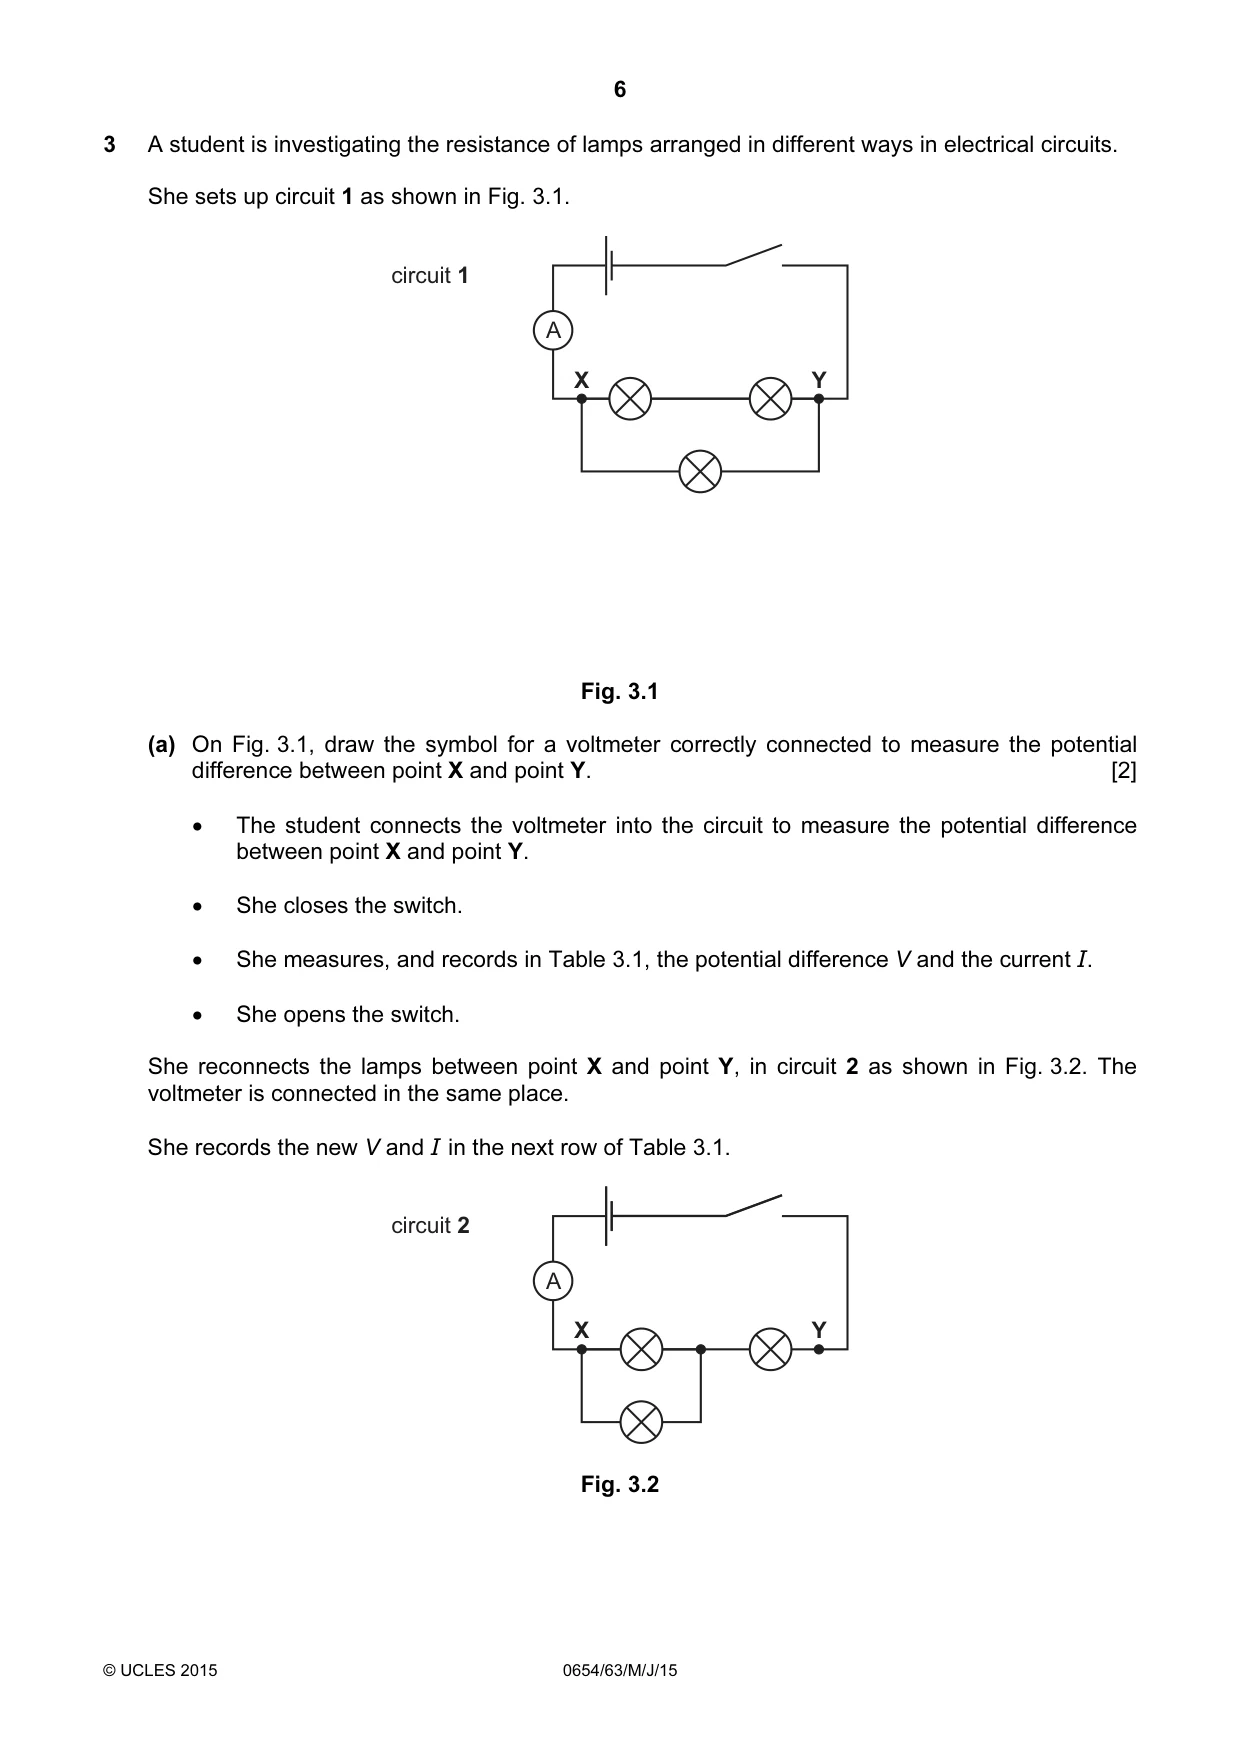
6 © UCLES 2015 0654/63/M/J/15 3 A student is investigating the resistance of lamps arranged in different ways in electrical circuits. She sets up circuit 1 as shown in Fig. 3.1. A X Y circuit 1 Fig. 3.1 (a) On Fig. 3.1, draw the symbol for a voltmeter correctly connected to measure the potential difference between point X and point Y. [2] • The student connects the voltmeter into the circuit to measure the potential difference between point X and point Y. • She closes the switch. • She measures, and records in Table 3.1, the potential difference V and the current I. • She opens the switch. She reconnects the lamps between point X and point Y, in circuit 2 as shown in Fig. 3.2. The voltmeter is connected in the same place. She records the new V and I in the next row of Table 3.1. A X Y circuit 2 Fig. 3.2
Question paper, page 7
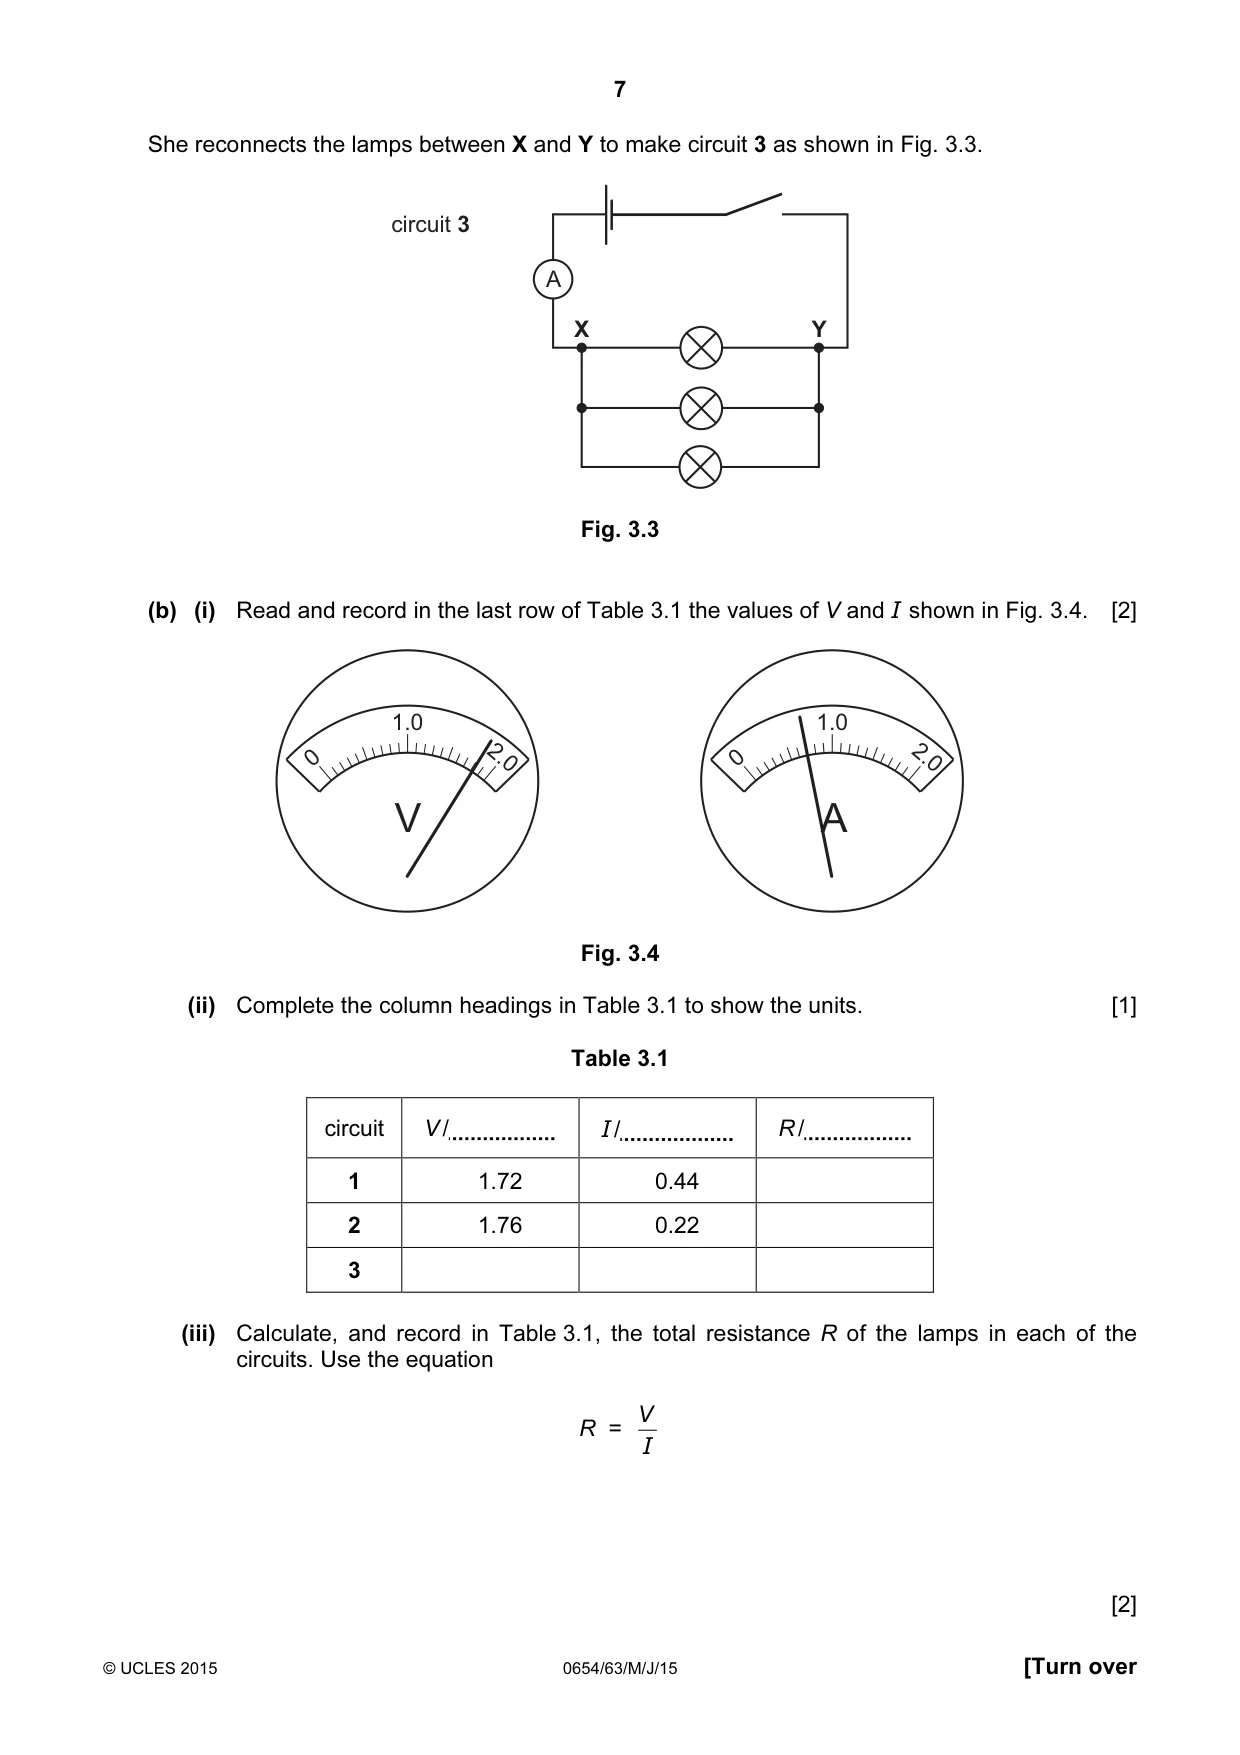
7 © UCLES 2015 0654/63/M/J/15 [Turn over She reconnects the lamps between X and Y to make circuit 3 as shown in Fig. 3.3. A X Y circuit 3 Fig. 3.3 (b) (i) Read and record in the last row of Table 3.1 the values of V and I shown in Fig. 3.4. [2] A 1.0 2.0 0 V 1.0 2.0 0 Fig. 3.4 (ii) Complete the column headings in Table 3.1 to show the units. [1] Table 3.1 circuit V / I / R / 1 1.72 0.44 2 1.76 0.22 3 (iii) Calculate, and record in Table 3.1, the total resistance R of the lamps in each of the circuits. Use the equation R = I V [2]
Question paper, page 8
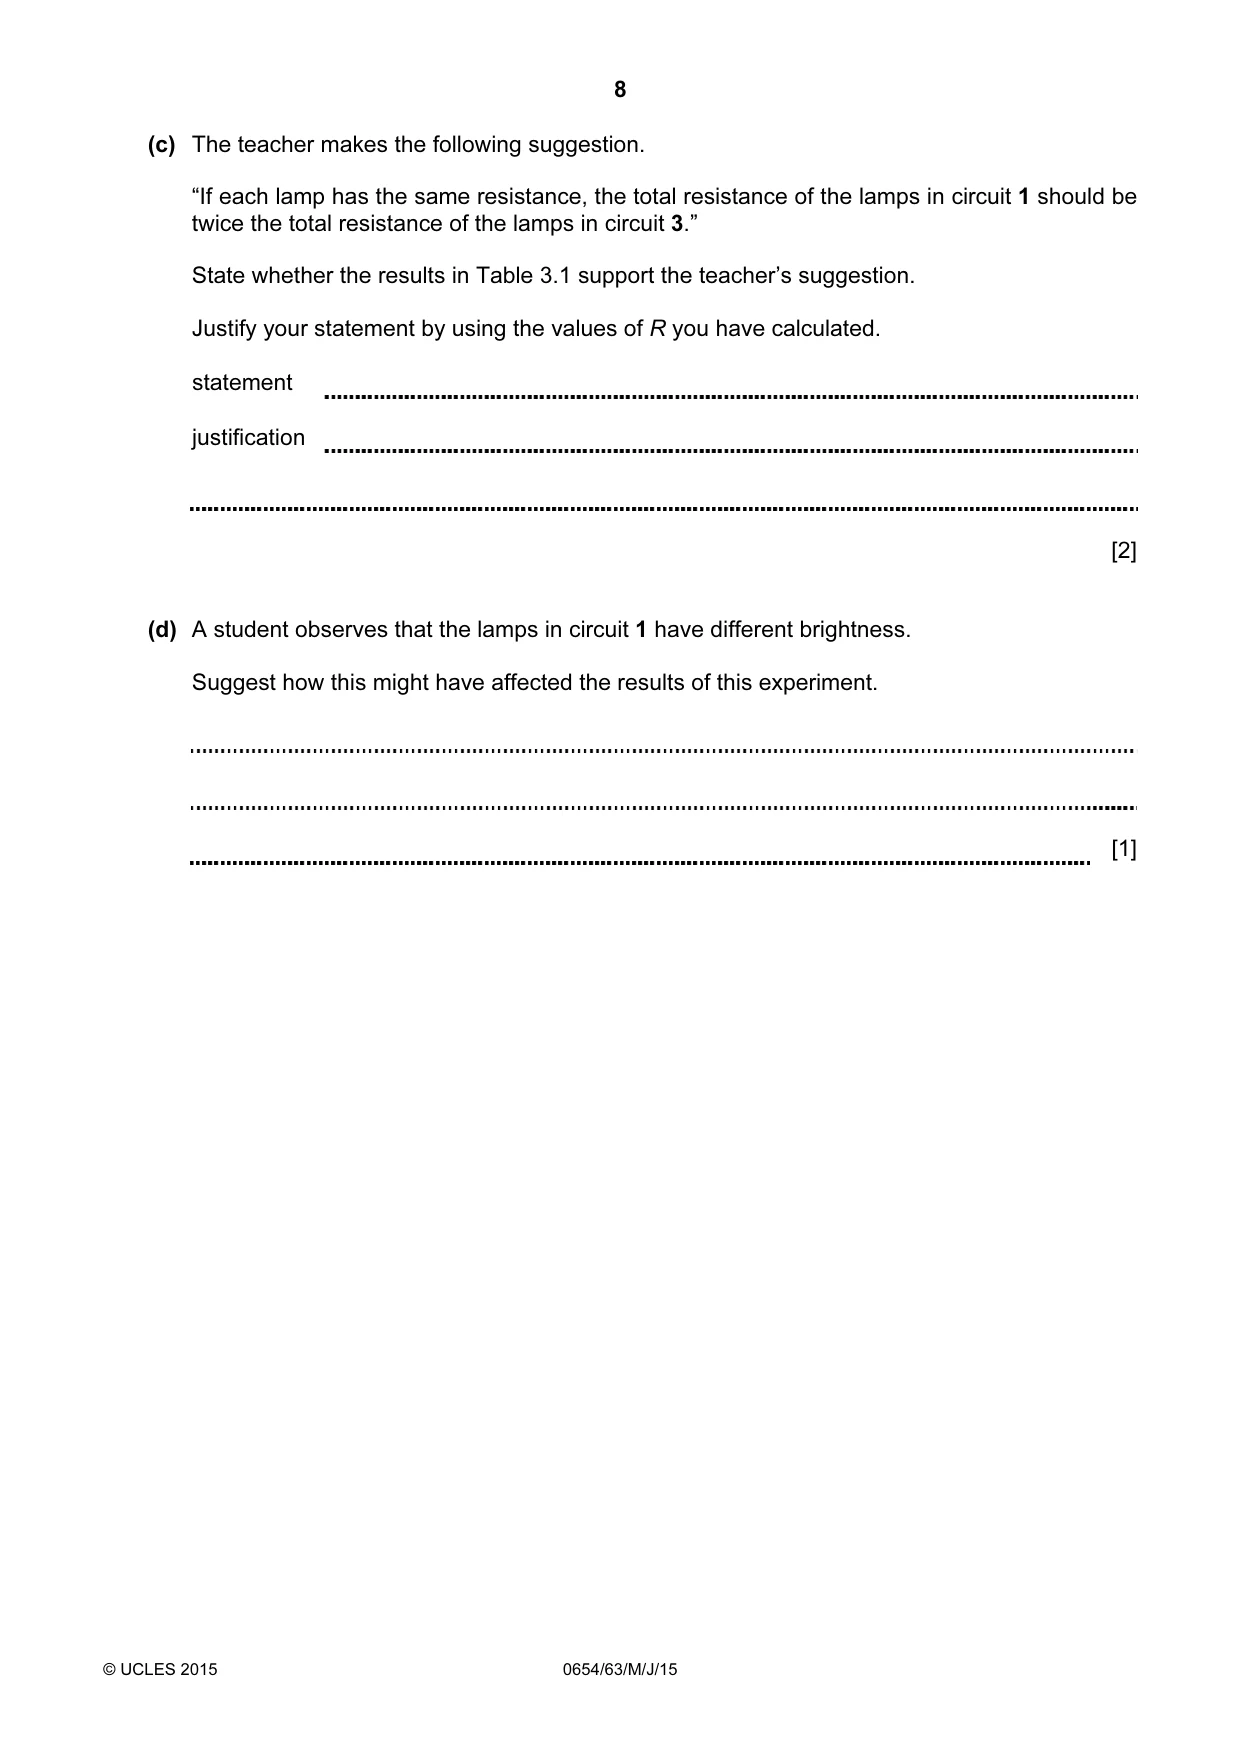
8 © UCLES 2015 0654/63/M/J/15 (c) The teacher makes the following suggestion. “If each lamp has the same resistance, the total resistance of the lamps in circuit 1 should be twice the total resistance of the lamps in circuit 3.” State whether the results in Table 3.1 support the teacher’s suggestion. Justify your statement by using the values of R you have calculated. statement justification [2] (d) A student observes that the lamps in circuit 1 have different brightness. Suggest how this might have affected the results of this experiment. [1]
Question paper, page 9
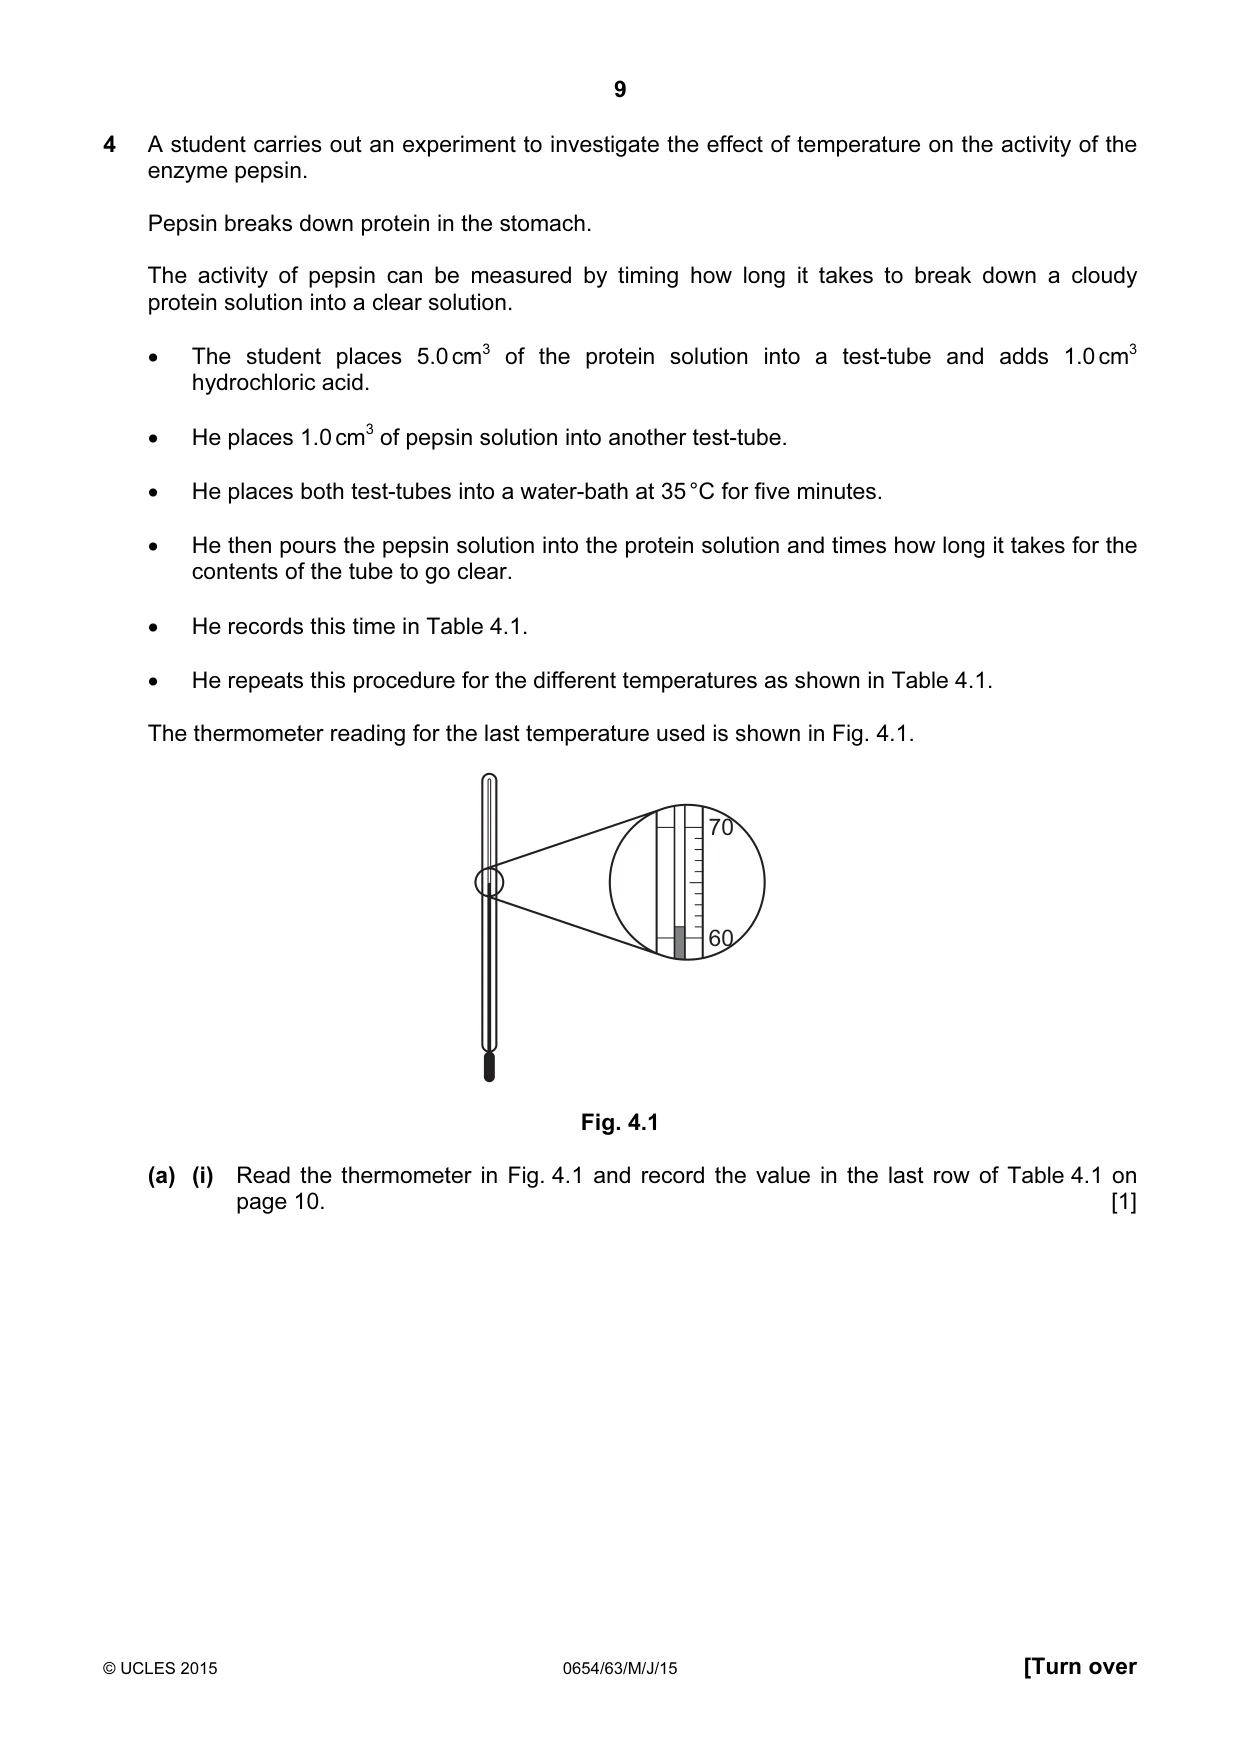
9 © UCLES 2015 0654/63/M/J/15 [Turn over 4 A student carries out an experiment to investigate the effect of temperature on the activity of the enzyme pepsin. Pepsin breaks down protein in the stomach. The activity of pepsin can be measured by timing how long it takes to break down a cloudy protein solution into a clear solution. • The student places 5.0 cm3 of the protein solution into a test-tube and adds 1.0 cm3 hydrochloric acid. • He places 1.0 cm3 of pepsin solution into another test-tube. • He places both test-tubes into a water-bath at 35 °C for five minutes. • He then pours the pepsin solution into the protein solution and times how long it takes for the contents of the tube to go clear. • He records this time in Table 4.1. • He repeats this procedure for the different temperatures as shown in Table 4.1. The thermometer reading for the last temperature used is shown in Fig. 4.1. 70 60 Fig. 4.1 (a) (i) Read the thermometer in Fig. 4.1 and record the value in the last row of Table 4.1 on page 10. [1]
Question paper, page 10
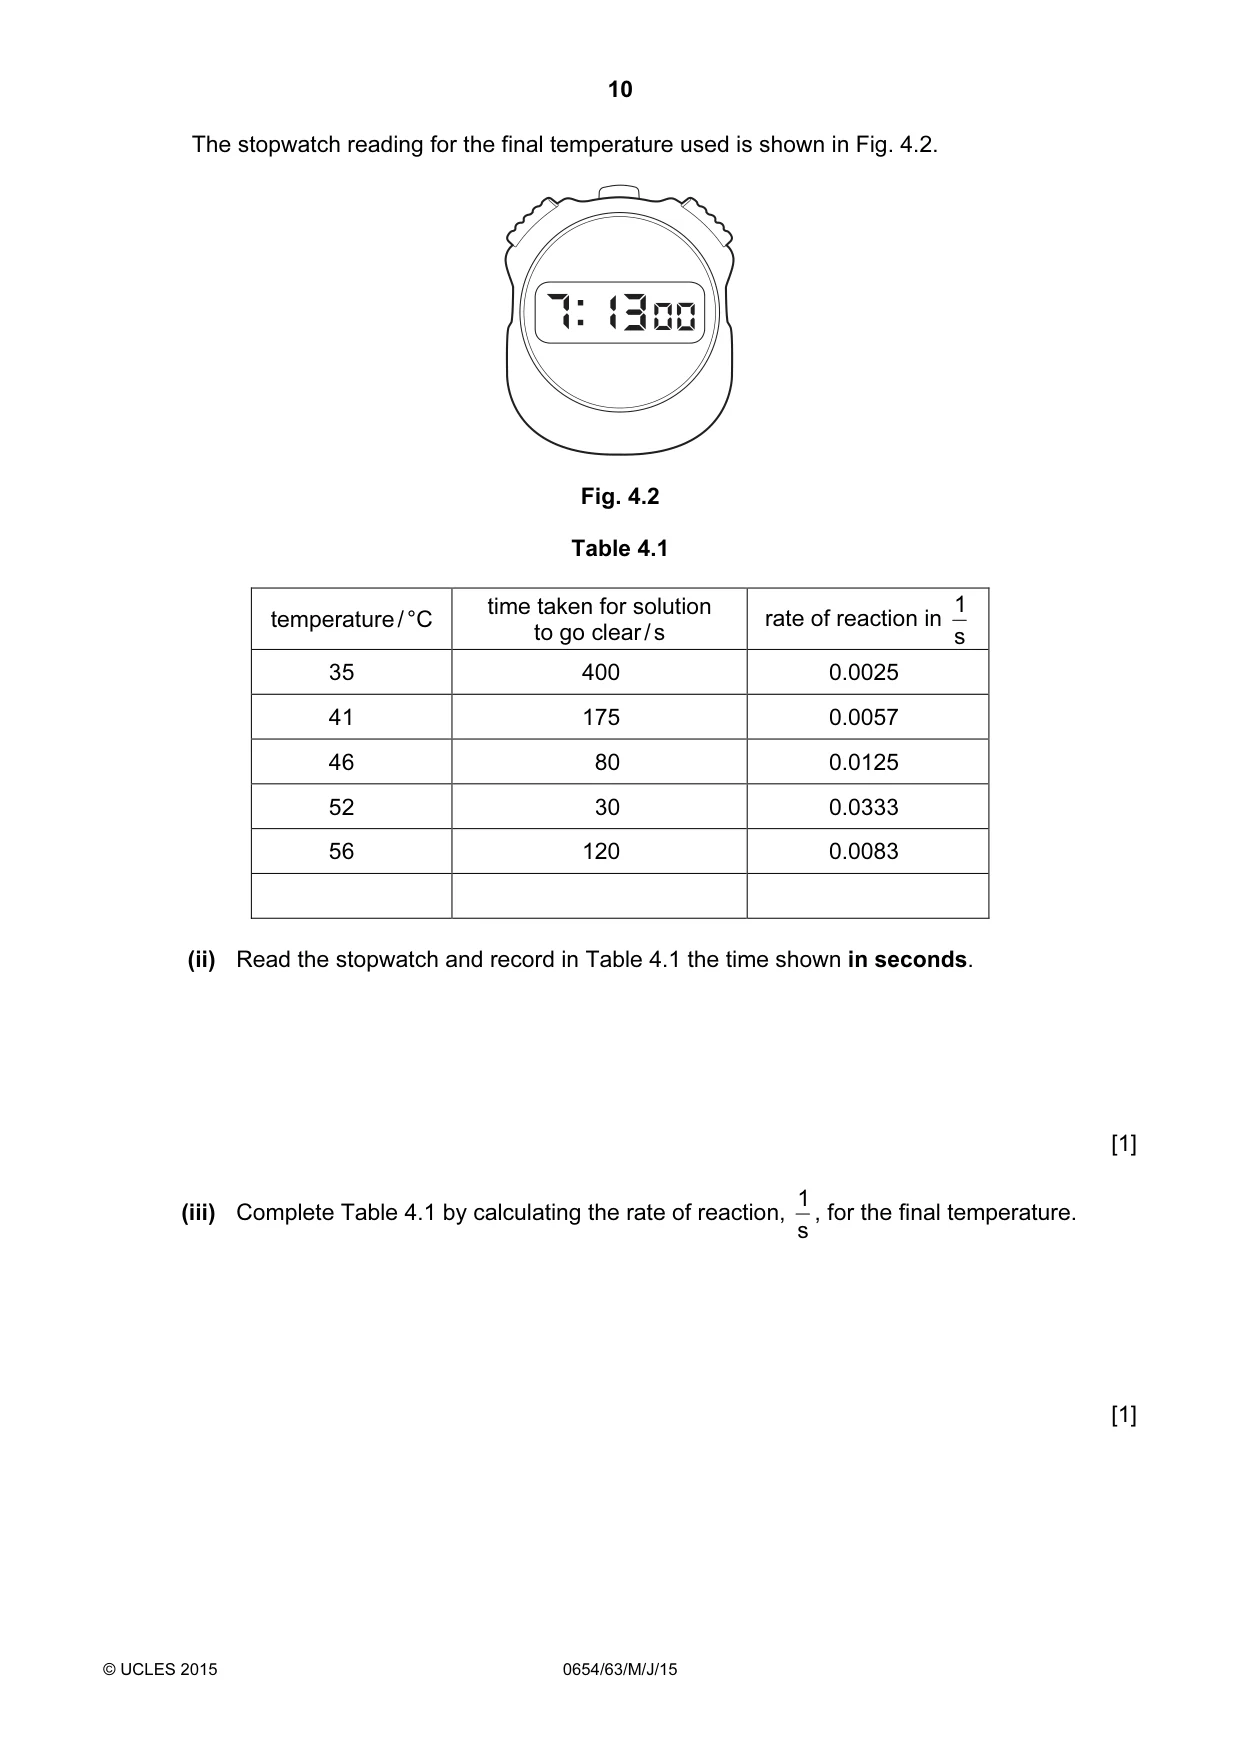
10 © UCLES 2015 0654/63/M/J/15 The stopwatch reading for the final temperature used is shown in Fig. 4.2. Fig. 4.2 Table 4.1 temperature / °C time taken for solution to go clear / s rate of reaction in s 1 35 400 0.0025 41 175 0.0057 46 80 0.0125 52 30 0.0333 56 120 0.0083 (ii) Read the stopwatch and record in Table 4.1 the time shown in seconds. [1] (iii) Complete Table 4.1 by calculating the rate of reaction, s 1 , for the final temperature. [1]
Question paper, page 11
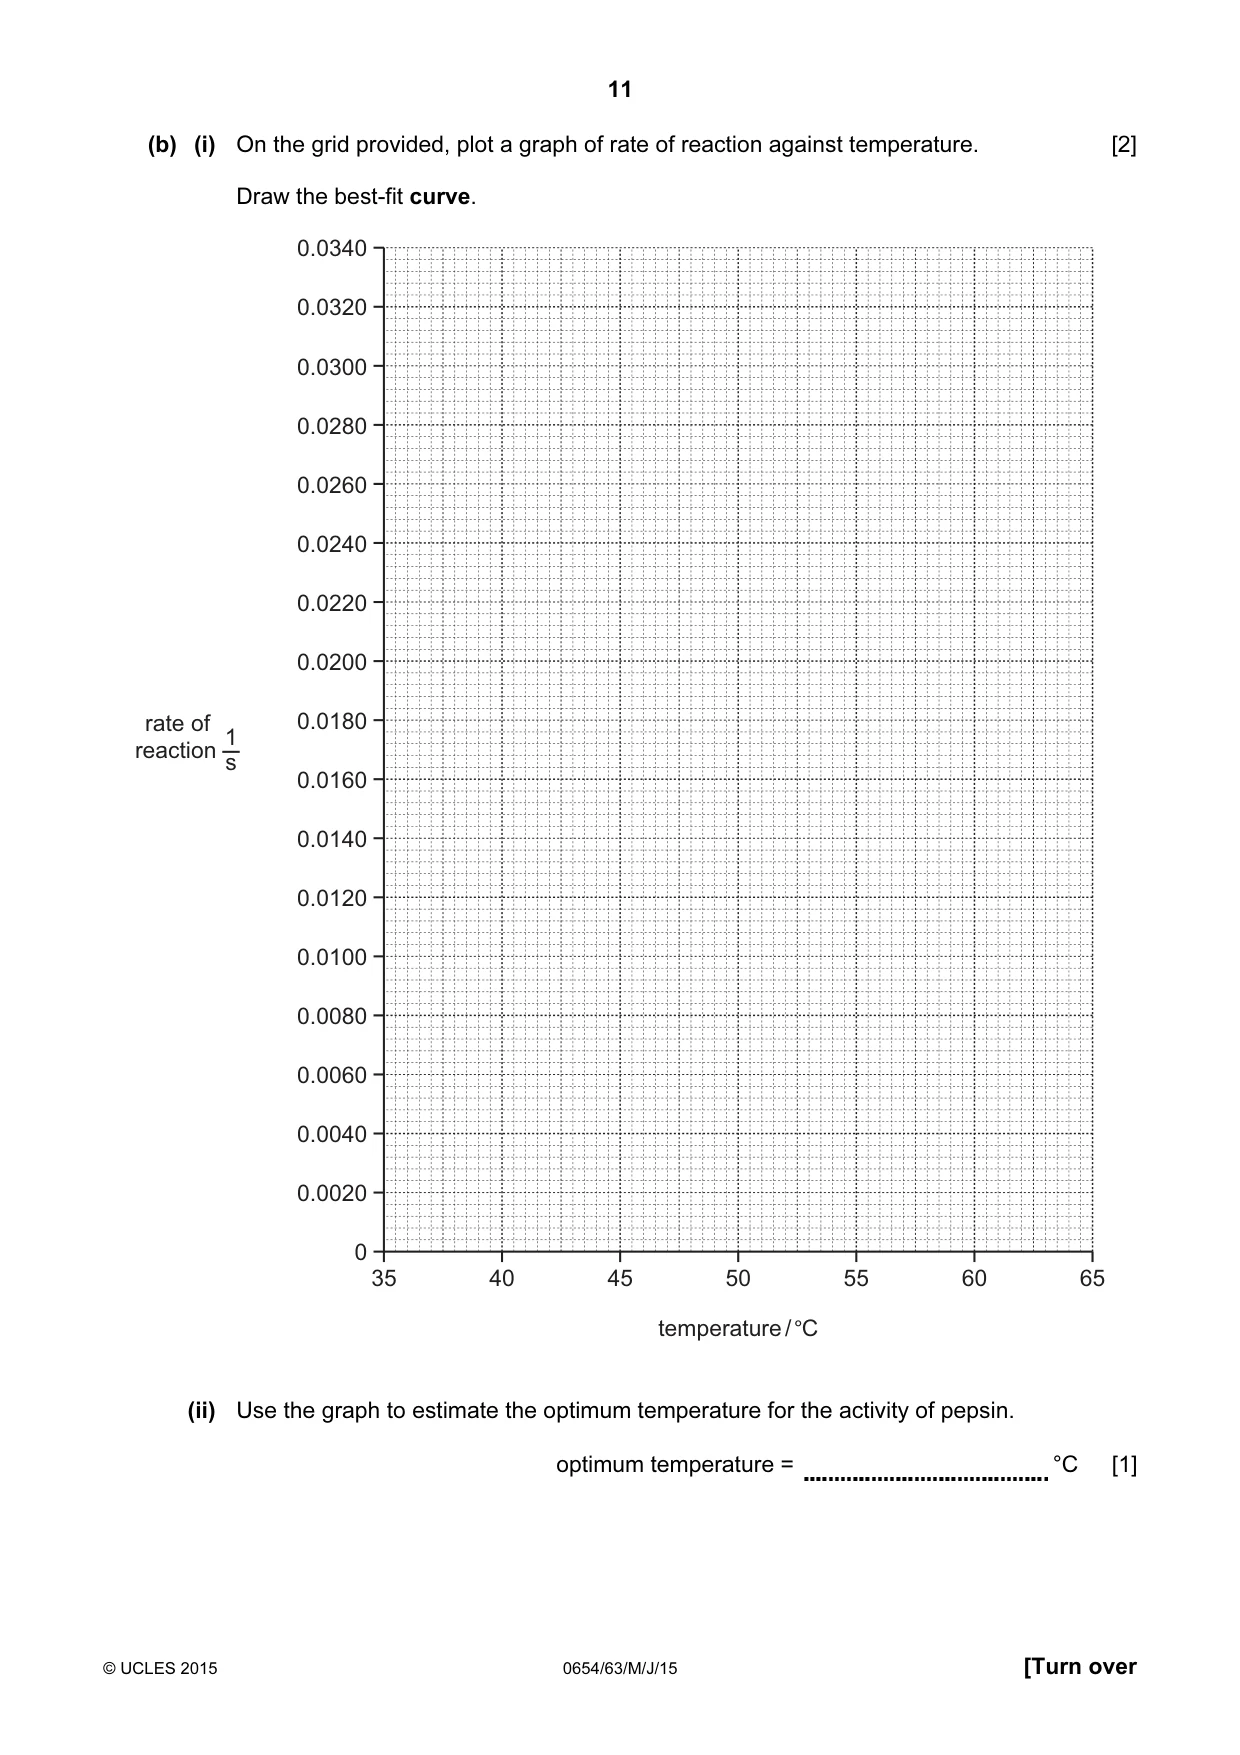
11 © UCLES 2015 0654/63/M/J/15 [Turn over (b) (i) On the grid provided, plot a graph of rate of reaction against temperature. [2] Draw the best-fit curve. rate of reaction 35 40 45 50 temperature / °C 55 60 65 0.0340 0.0320 0.0300 0.0280 0.0260 0.0240 0.0220 0.0200 0.0180 0.0160 0.0140 0.0120 0.0100 0.0080 0.0060 0.0040 0.0020 0 1 s (ii) Use the graph to estimate the optimum temperature for the activity of pepsin. optimum temperature = °C [1]
Question paper, page 12
12 © UCLES 2015 0654/63/M/J/15 (iii) Explain why you cannot be sure that this is an accurate optimum temperature. [1] (c) Describe an experiment to show that acid is required for pepsin to break down protein. [3]
Question paper, page 13
13 © UCLES 2015 0654/63/M/J/15 [Turn over Please turn over for Question 5.
Question paper, page 14
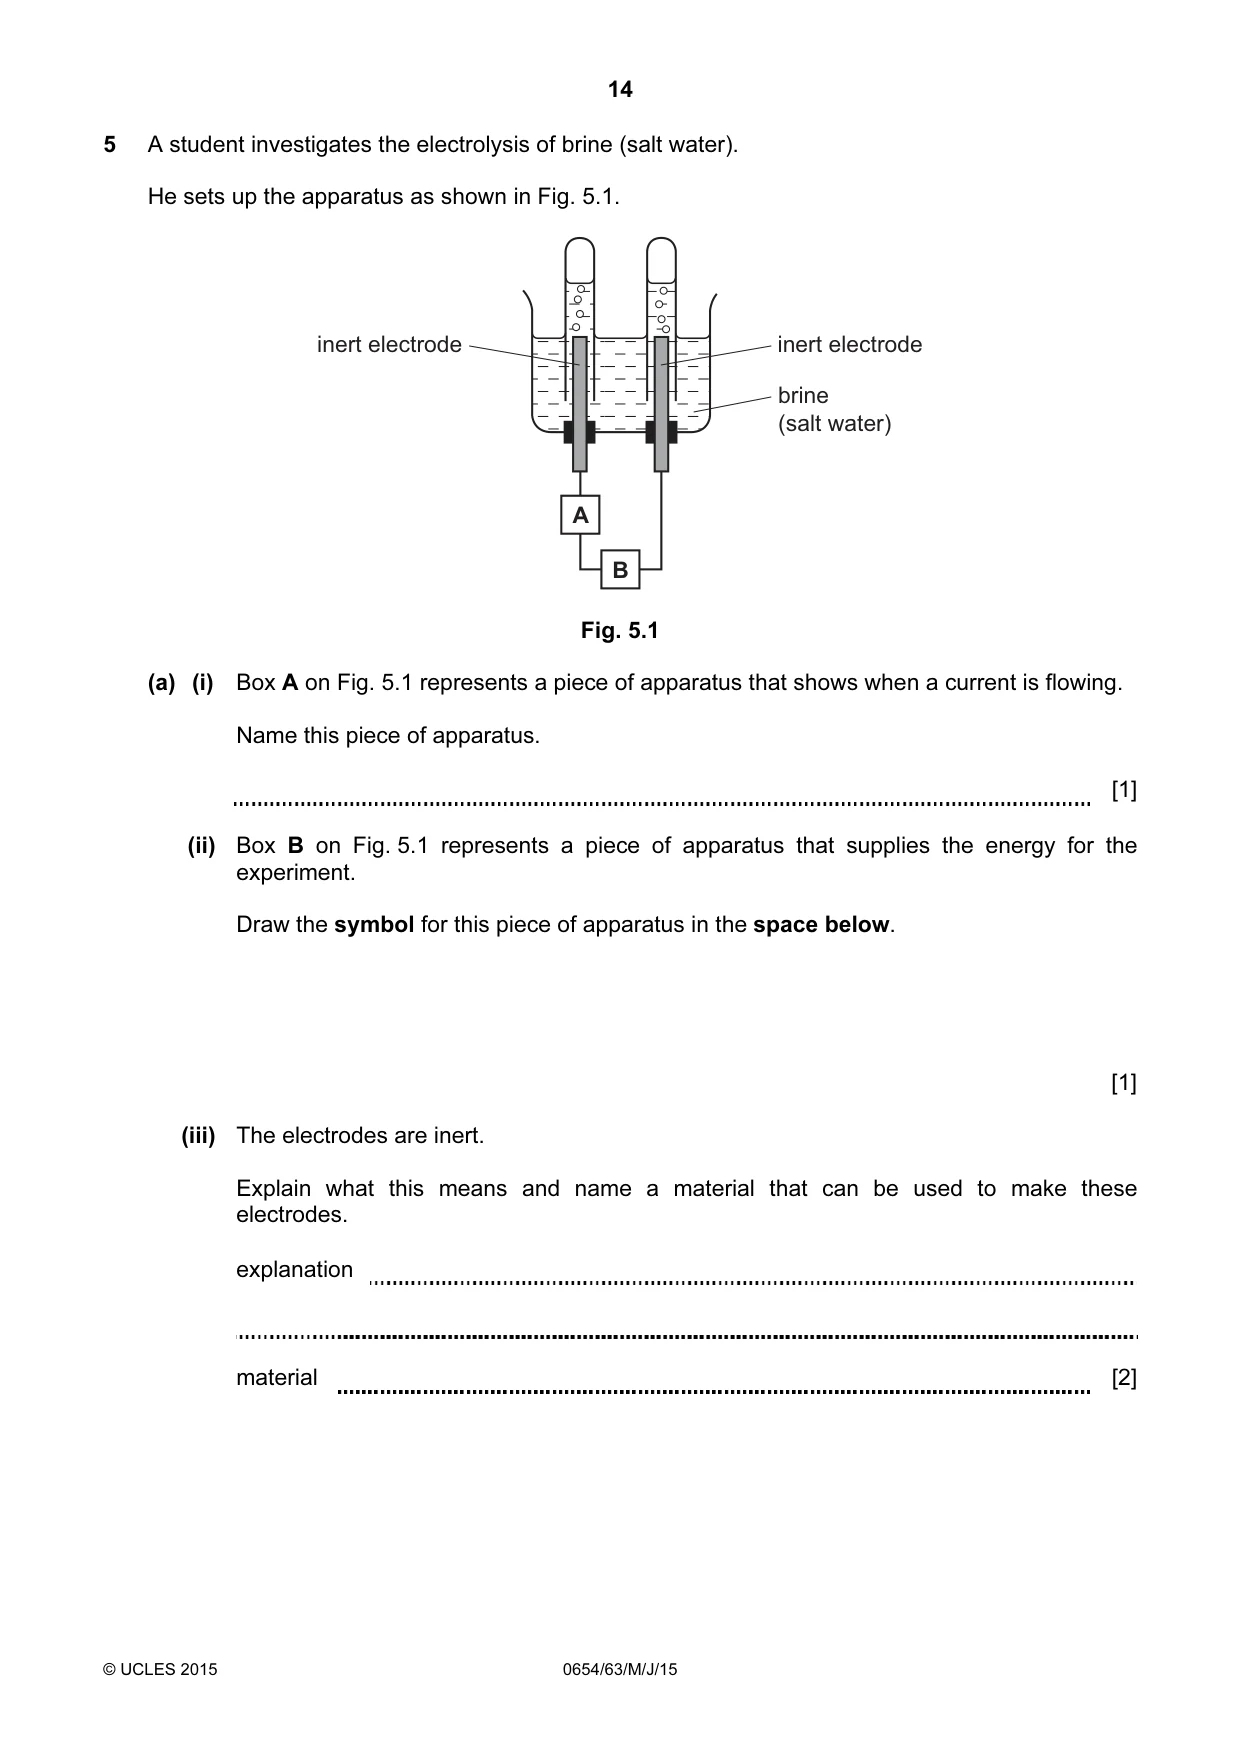
14 © UCLES 2015 0654/63/M/J/15 5 A student investigates the electrolysis of brine (salt water). He sets up the apparatus as shown in Fig. 5.1. B A inert electrode inert electrode brine (salt water) Fig. 5.1 (a) (i) Box A on Fig. 5.1 represents a piece of apparatus that shows when a current is flowing. Name this piece of apparatus. [1] (ii) Box B on Fig. 5.1 represents a piece of apparatus that supplies the energy for the experiment. Draw the symbol for this piece of apparatus in the space below. [1] (iii) The electrodes are inert. Explain what this means and name a material that can be used to make these electrodes. explanation material [2]
Question paper, page 15
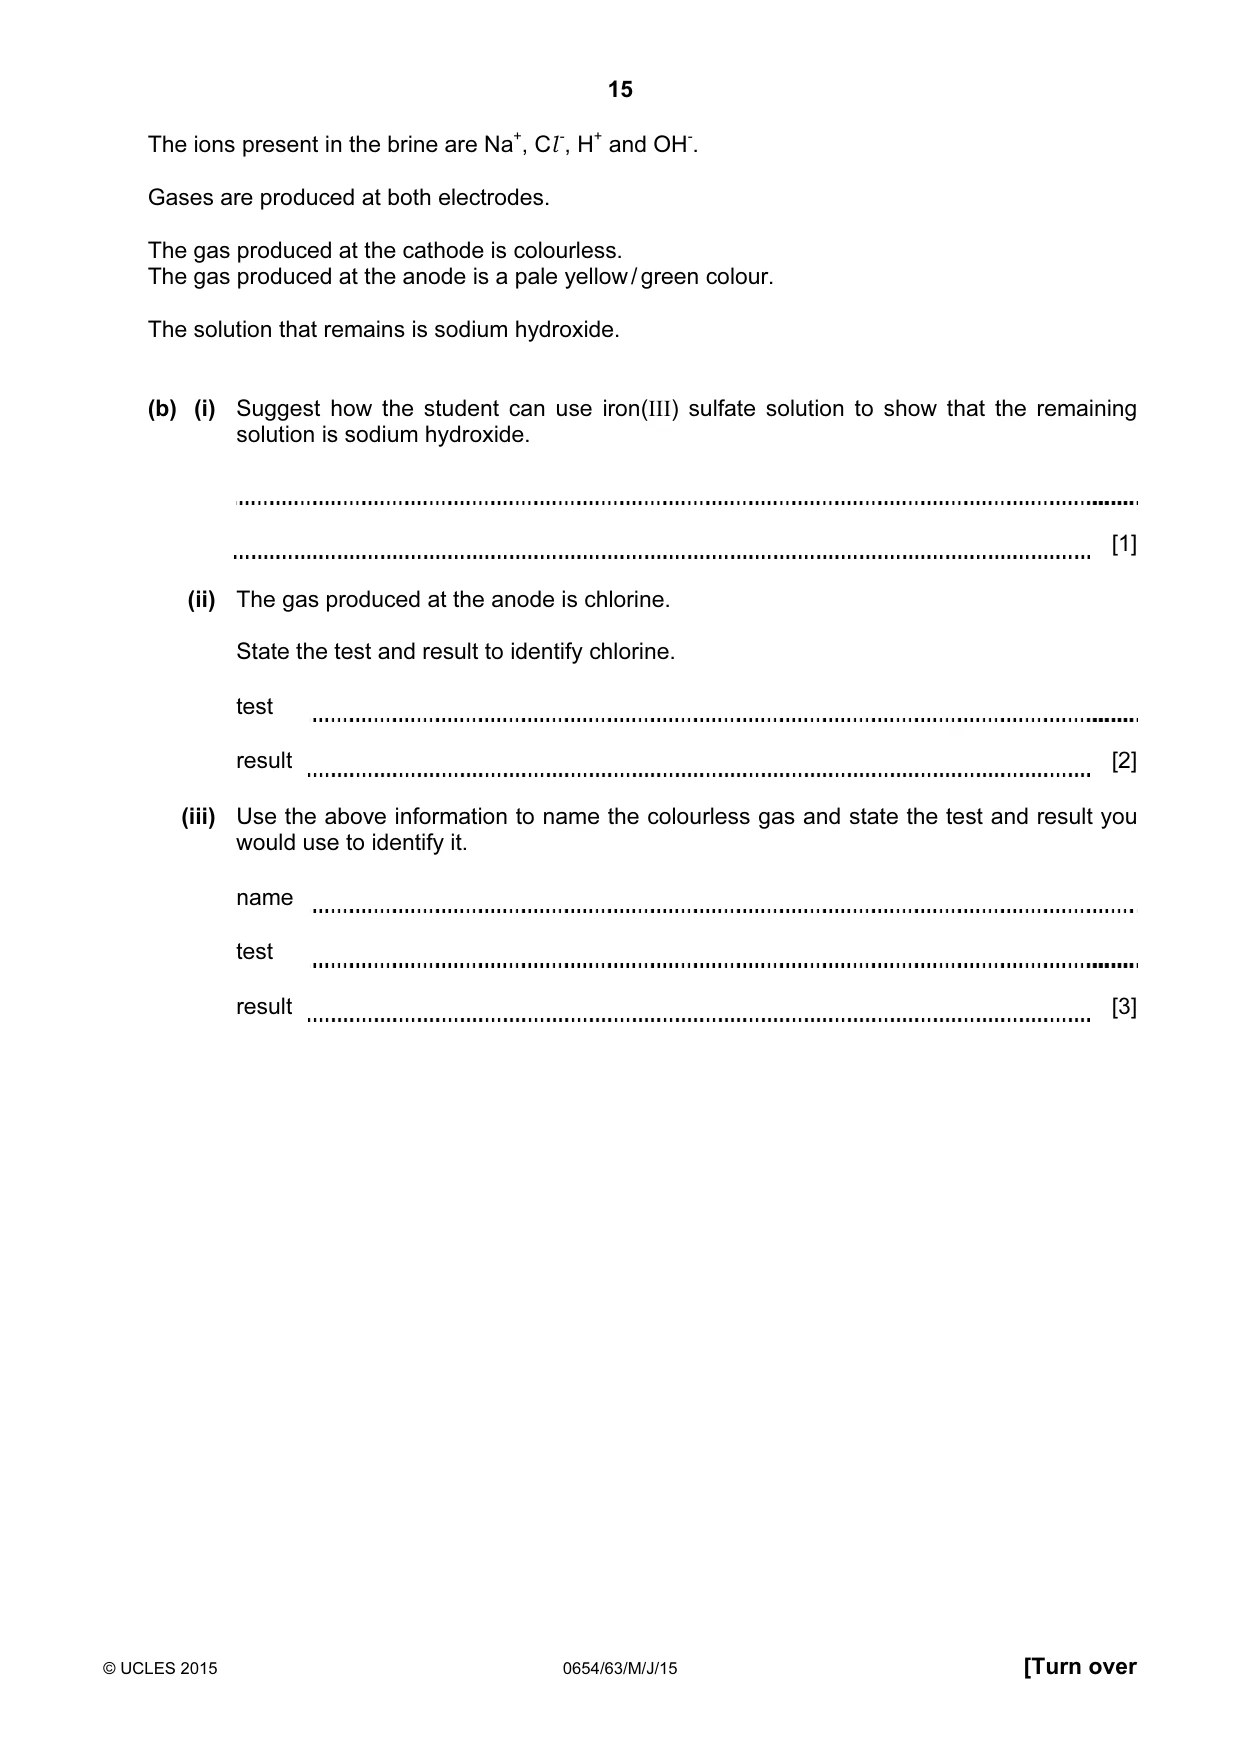
15 © UCLES 2015 0654/63/M/J/15 [Turn over The ions present in the brine are Na+, Cl -, H+ and OH-. Gases are produced at both electrodes. The gas produced at the cathode is colourless. The gas produced at the anode is a pale yellow / green colour. The solution that remains is sodium hydroxide. (b) (i) Suggest how the student can use iron(III) sulfate solution to show that the remaining solution is sodium hydroxide. [1] (ii) The gas produced at the anode is chlorine. State the test and result to identify chlorine. test result [2] (iii) Use the above information to name the colourless gas and state the test and result you would use to identify it. name test result [3]
Question paper, page 16
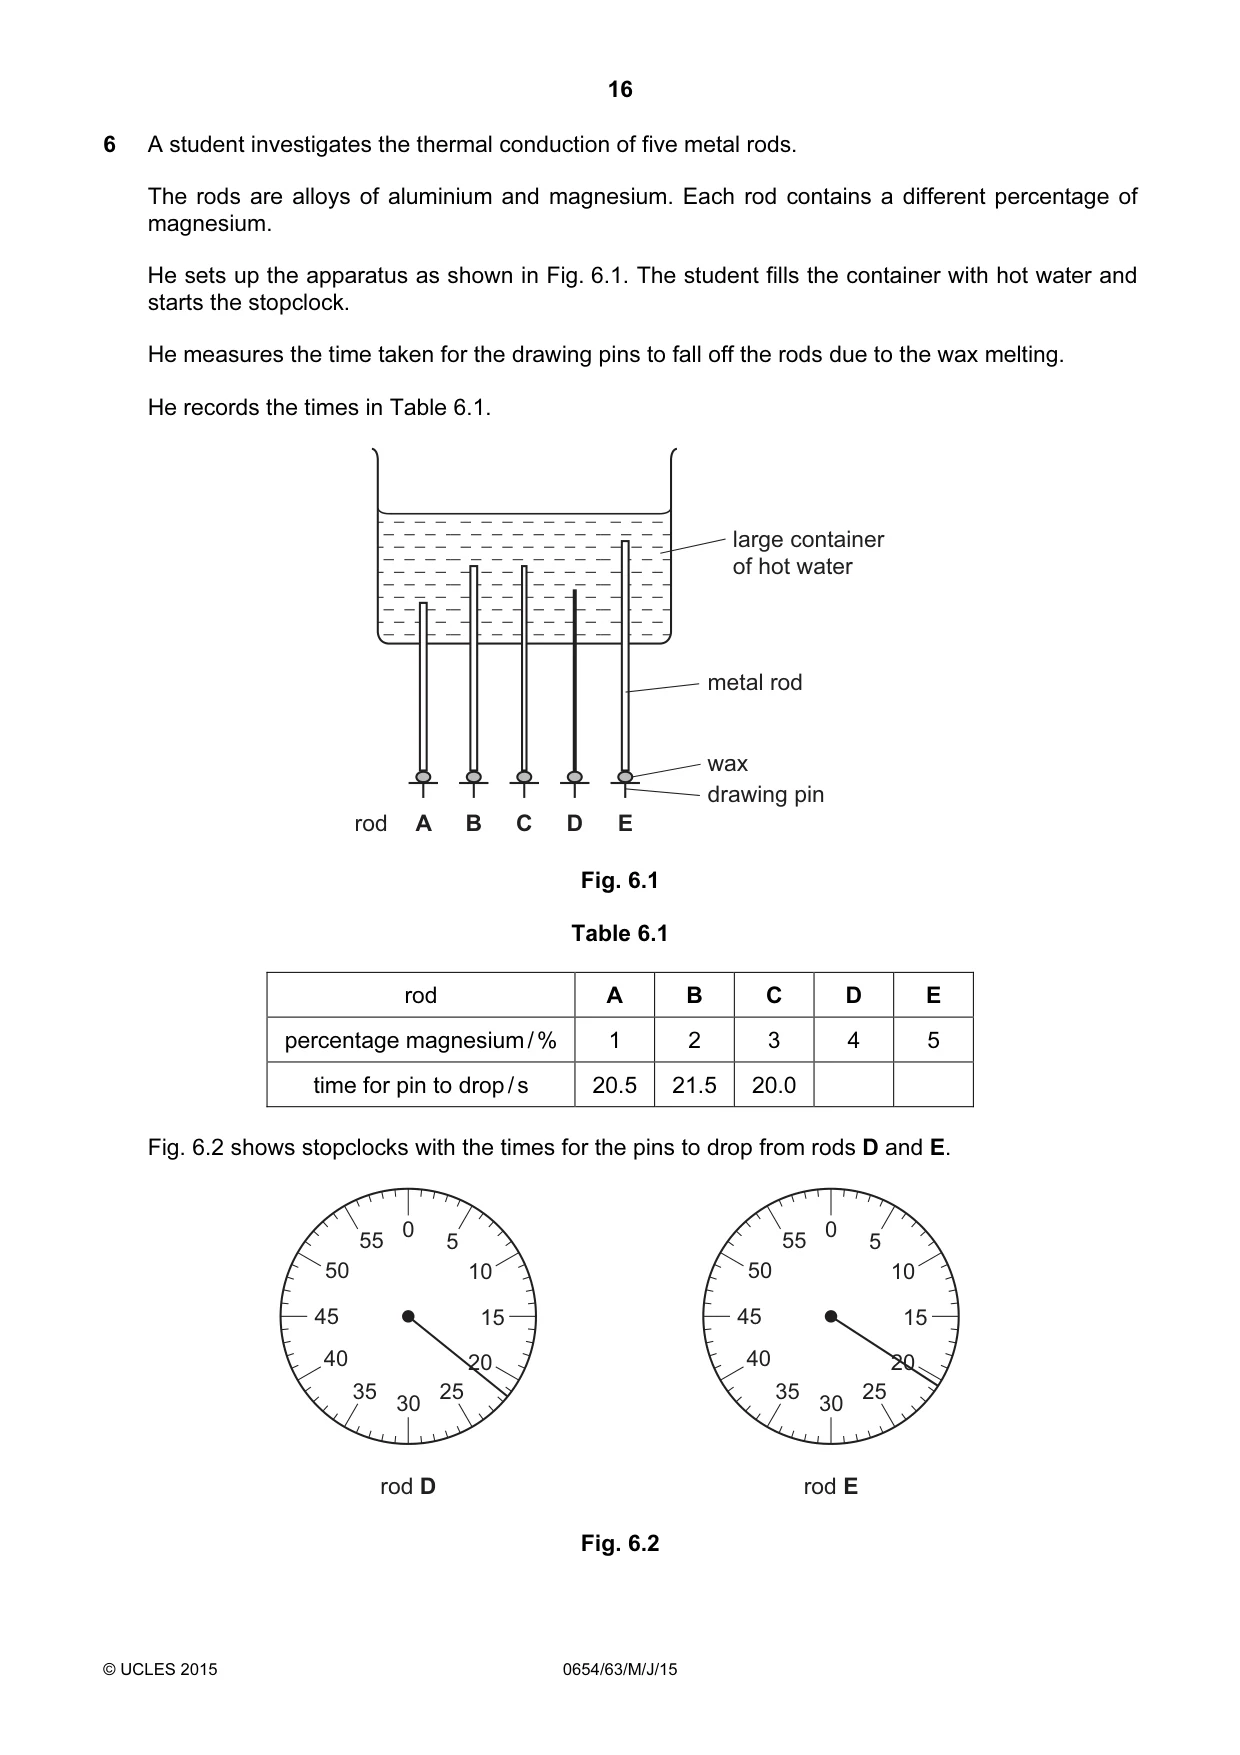
16 © UCLES 2015 0654/63/M/J/15 6 A student investigates the thermal conduction of five metal rods. The rods are alloys of aluminium and magnesium. Each rod contains a different percentage of magnesium. He sets up the apparatus as shown in Fig. 6.1. The student fills the container with hot water and starts the stopclock. He measures the time taken for the drawing pins to fall off the rods due to the wax melting. He records the times in Table 6.1. A rod B C D E large container of hot water metal rod wax drawing pin Fig. 6.1 Table 6.1 rod A B C D E percentage magnesium / % 1 2 3 4 5 time for pin to drop / s 20.5 21.5 20.0 Fig. 6.2 shows stopclocks with the times for the pins to drop from rods D and E. 5 0 10 15 20 40 25 35 30 45 50 55 rod D 5 0 10 15 20 40 25 35 30 45 50 55 rod E Fig. 6.2
Question paper, page 17
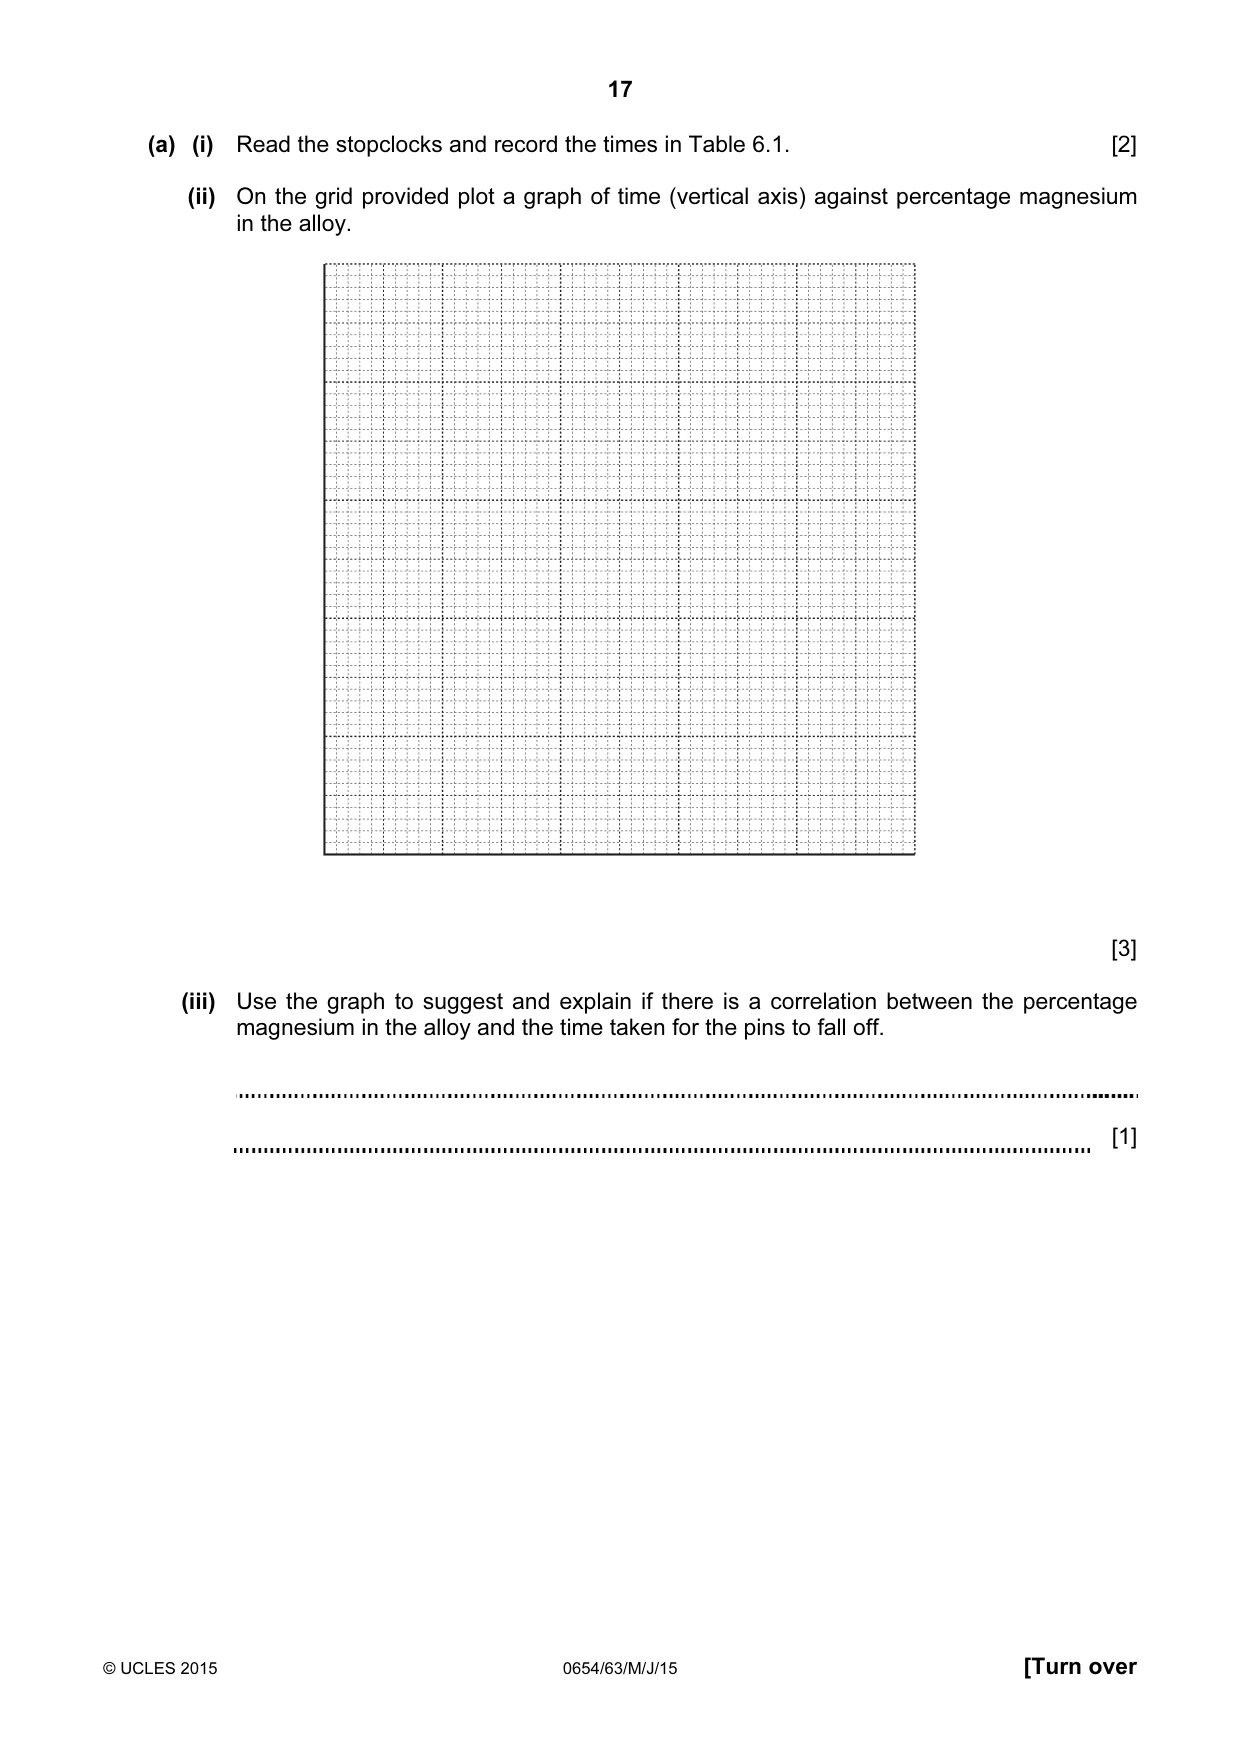
17 © UCLES 2015 0654/63/M/J/15 [Turn over (a) (i) Read the stopclocks and record the times in Table 6.1. [2] (ii) On the grid provided plot a graph of time (vertical axis) against percentage magnesium in the alloy. [3] (iii) Use the graph to suggest and explain if there is a correlation between the percentage magnesium in the alloy and the time taken for the pins to fall off. [1]
Question paper, page 18
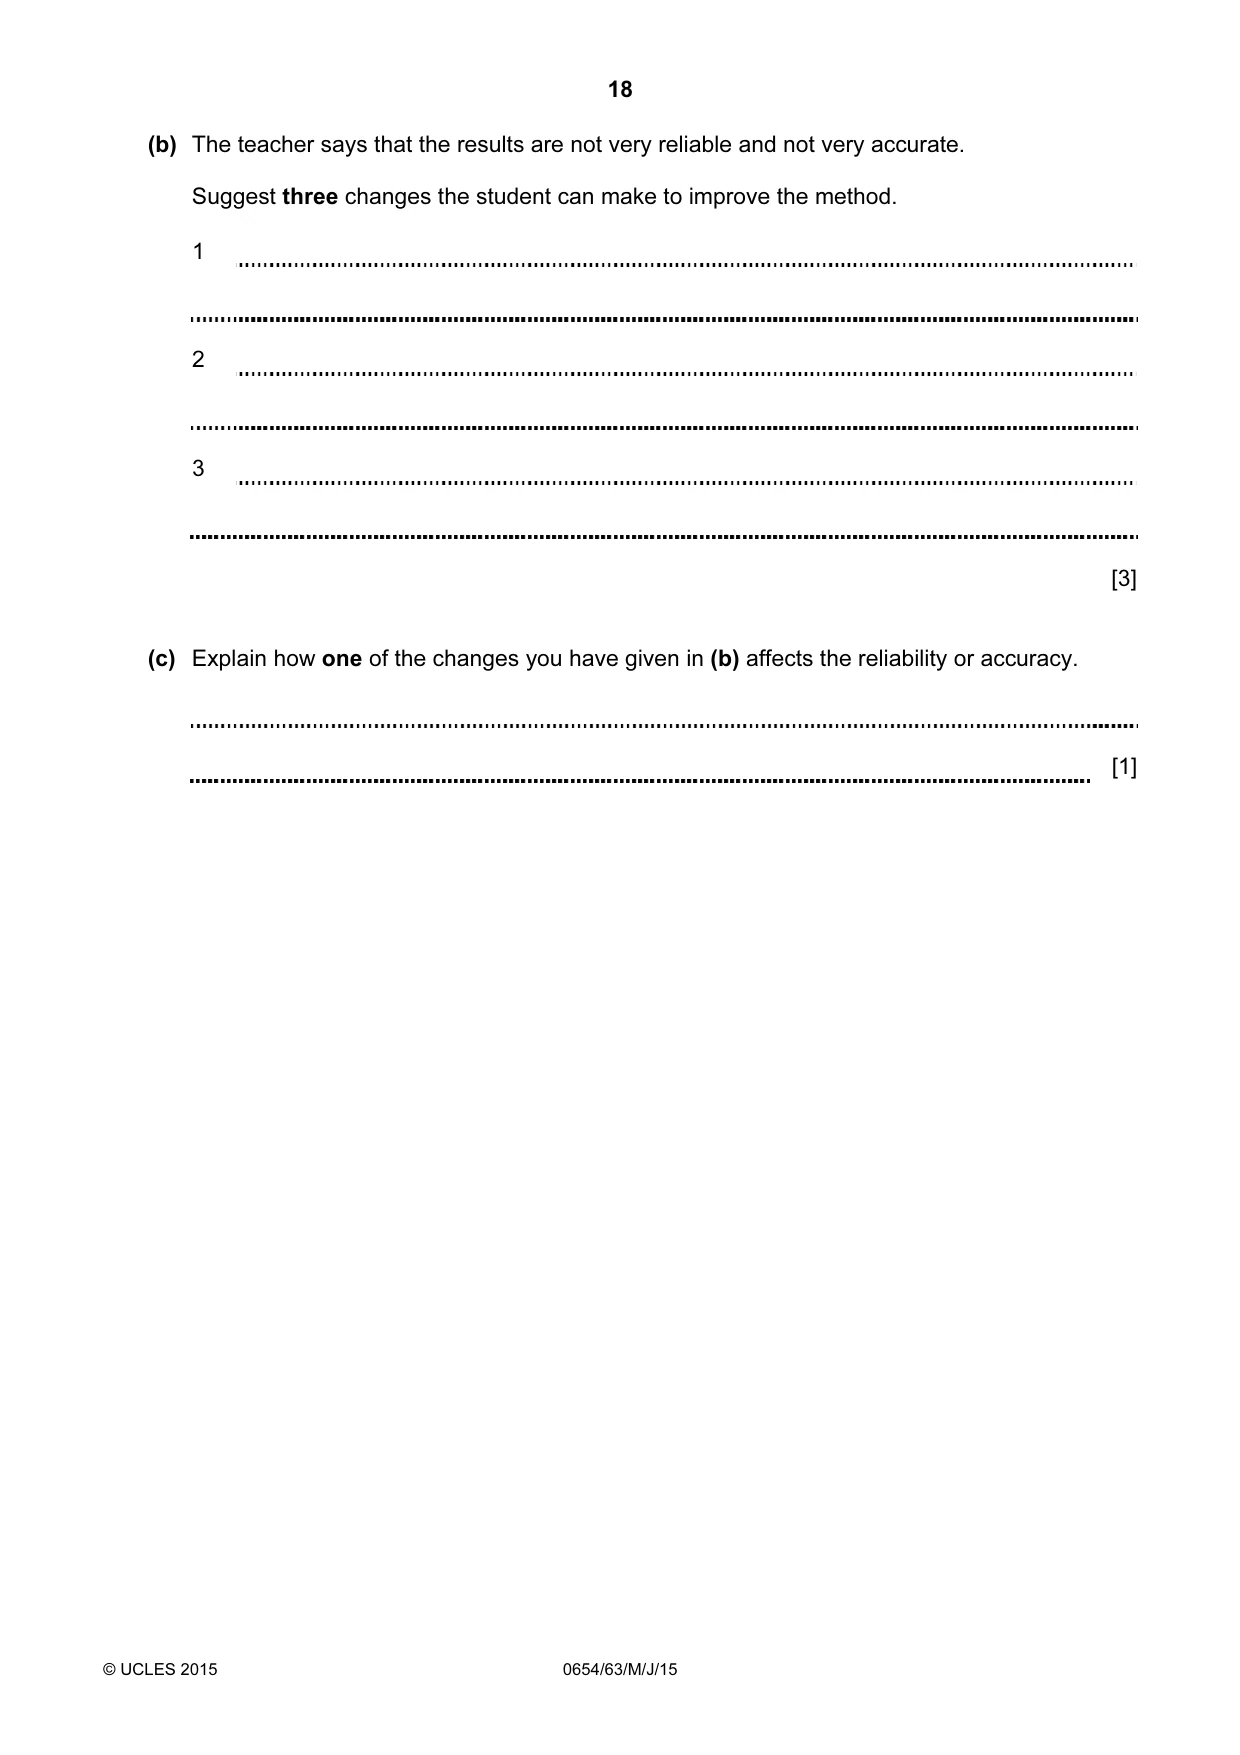
18 © UCLES 2015 0654/63/M/J/15 (b) The teacher says that the results are not very reliable and not very accurate. Suggest three changes the student can make to improve the method. 1 2 3 [3] (c) Explain how one of the changes you have given in (b) affects the reliability or accuracy. [1]
Question paper, page 19
19 © UCLES 2015 0654/63/M/J/15 BLANK PAGE
Question paper, page 20
20 Permission to reproduce items where third-party owned material protected by copyright is included has been sought and cleared where possible. Every reasonable effort has been made by the publisher (UCLES) to trace copyright holders, but if any items requiring clearance have unwittingly been included, the publisher will be pleased to make amends at the earliest possible opportunity. To avoid the issue of disclosure of answer-related information to candidates, all copyright acknowledgements are reproduced online in the Cambridge International Examinations Copyright Acknowledgements Booklet. This is produced for each series of examinations and is freely available to download at www.cie.org.uk after the live examination series. Cambridge International Examinations is part of the Cambridge Assessment Group. Cambridge Assessment is the brand name of University of Cambridge Local Examinations Syndicate (UCLES), which is itself a department of the University of Cambridge. © UCLES 2015 0654/63/M/J/15 BLANK PAGE
Mark scheme, page 1
® IGCSE is the registered trademark of Cambridge International Examinations. CAMBRIDGE INTERNATIONAL EXAMINATIONS Cambridge International General Certificate of Secondary Education MARK SCHEME for the May/June 2015 series 0654 CO-ORDINATED SCIENCES 0654/63 Paper 6 (Alternative to Practical), maximum raw mark 60 This mark scheme is published as an aid to teachers and candidates, to indicate the requirements of the examination. It shows the basis on which Examiners were instructed to award marks. It does not indicate the details of the discussions that took place at an Examiners’ meeting before marking began, which would have considered the acceptability of alternative answers. Mark schemes should be read in conjunction with the question paper and the Principal Examiner Report for Teachers. Cambridge will not enter into discussions about these mark schemes. Cambridge is publishing the mark schemes for the May/June 2015 series for most Cambridge IGCSE®, Cambridge International A and AS Level components and some Cambridge O Level components.
Mark scheme, page 2
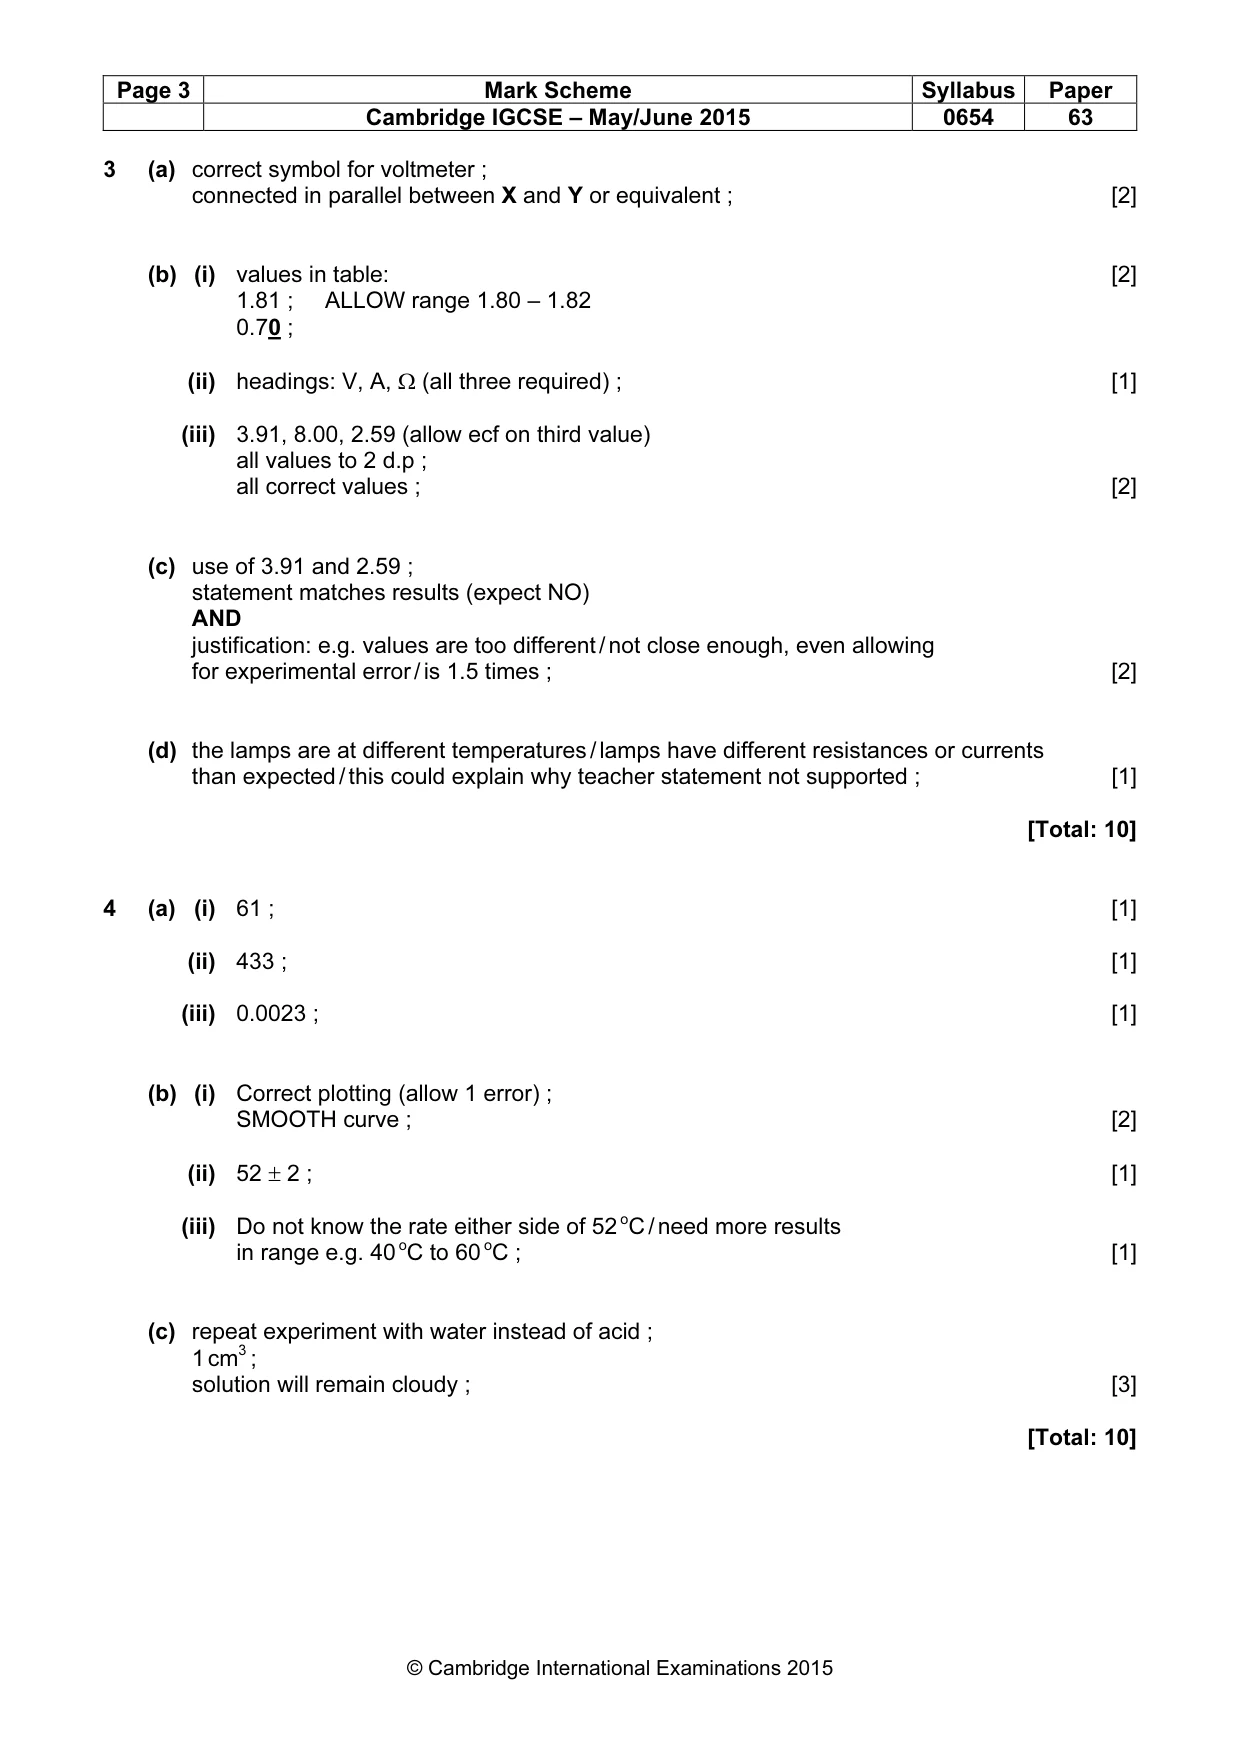
Page 2 Mark Scheme Syllabus Paper Cambridge IGCSE – May/June 2015 0654 63 © Cambridge International Examinations 2015 1 (a) yeast dead / (enzyme) no longer active / denatured ; [1] (b) time / mins colour in tube A colour in tube B colour in tube C 1 blue blue blue 2 colourless blue blue 3 colourless blue blue 4 colourless blue blue 5 colourless colourless blue 6 colourless colourless blue time / mins ; A correct ; B correct ; C correct ; ALLOW decolourised IGNORE transparent [4] (c) (i) constant volume / concentration ; [1] (ii) A changes quicker / changes first / respires faster ; (more) glucose / substrate available in A ; [2] M2 dependent on times being considered (d) (colour changes back to) blue ; methylene blue oxidised / reacts with oxygen / oxygen introduced ; oxygen from air above solution ; [max2] [Total: 10] 2 (a) make a solution in water ; add (aqueous) sodium hydroxide / (aqueous) ammonia ; green (gelatinous) ppt / solid ; [3] (b) add sodium hydroxide (solution) and heat ; damp ; (red) litmus turns blue ; [3] (c) make a solution in water ; add hydrochloric / nitric acid ; add barium chloride / nitrate (solution) ; white ppt ; [4] [Total: 10]
Mark scheme, page 3
Page 3 Mark Scheme Syllabus Paper Cambridge IGCSE – May/June 2015 0654 63 © Cambridge International Examinations 2015 3 (a) correct symbol for voltmeter ; connected in parallel between X and Y or equivalent ; [2] (b) (i) values in table: [2] 1.81 ; ALLOW range 1.80 – 1.82 0.70 ; (ii) headings: V, A, Ω (all three required) ; [1] (iii) 3.91, 8.00, 2.59 (allow ecf on third value) all values to 2 d.p ; all correct values ; [2] (c) use of 3.91 and 2.59 ; statement matches results (expect NO) AND justification: e.g. values are too different / not close enough, even allowing for experimental error / is 1.5 times ; [2] (d) the lamps are at different temperatures / lamps have different resistances or currents than expected / this could explain why teacher statement not supported ; [1] [Total: 10] 4 (a) (i) 61 ; [1] (ii) 433 ; [1] (iii) 0.0023 ; [1] (b) (i) Correct plotting (allow 1 error) ; SMOOTH curve ; [2] (ii) 52 ± 2 ; [1] (iii) Do not know the rate either side of 52 oC / need more results in range e.g. 40 oC to 60 oC ; [1] (c) repeat experiment with water instead of acid ; 1 cm3 ; solution will remain cloudy ; [3] [Total: 10]
Mark scheme, page 4
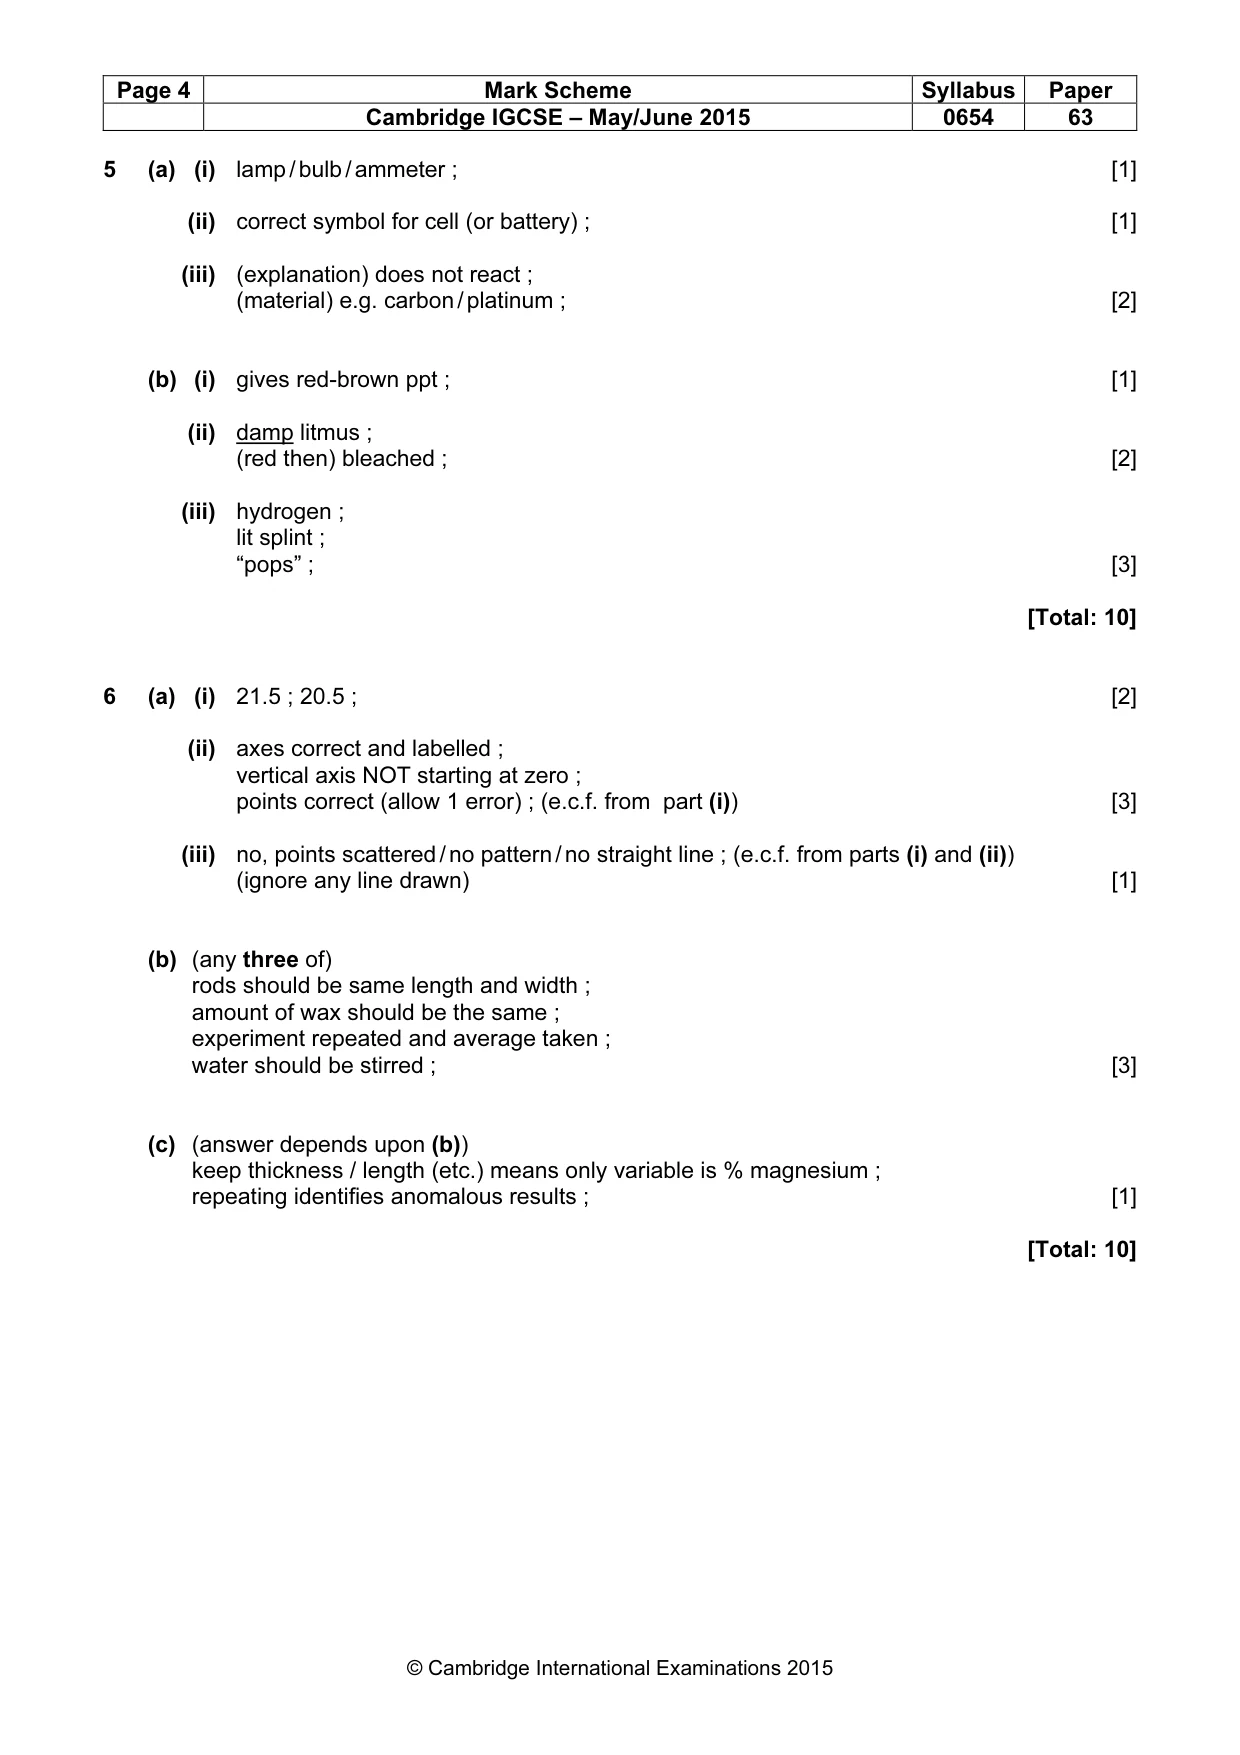
Page 4 Mark Scheme Syllabus Paper Cambridge IGCSE – May/June 2015 0654 63 © Cambridge International Examinations 2015 5 (a) (i) lamp / bulb / ammeter ; [1] (ii) correct symbol for cell (or battery) ; [1] (iii) (explanation) does not react ; (material) e.g. carbon / platinum ; [2] (b) (i) gives red-brown ppt ; [1] (ii) damp litmus ; (red then) bleached ; [2] (iii) hydrogen ; lit splint ; “pops” ; [3] [Total: 10] 6 (a) (i) 21.5 ; 20.5 ; [2] (ii) axes correct and labelled ; vertical axis NOT starting at zero ; points correct (allow 1 error) ; (e.c.f. from part (i)) [3] (iii) no, points scattered / no pattern / no straight line ; (e.c.f. from parts (i) and (ii)) (ignore any line drawn) [1] (b) (any three of) rods should be same length and width ; amount of wax should be the same ; experiment repeated and average taken ; water should be stirred ; [3] (c) (answer depends upon (b)) keep thickness / length (etc.) means only variable is % magnesium ; repeating identifies anomalous results ; [1] [Total: 10]
What you needed in this session
Cambridge’s own grade thresholds for 2015 May/June, Paper 6 · Variant 3. A higher threshold means an easier paper — the bar moves with how the cohort did.