Cambridge IGCSE Sciences - Co-ordinated (Double) 0654 — 2013 Oct/Nov Paper 6 · Variant 3
0654/63/O/N/13
The question paper and its mark scheme, free to read here and free to download. This is Cambridge’s own paper, exactly as it was sat.
Question paper20 pages


Mark scheme5 pages
Answers below. Sit the paper first if you are practising.
Paper as text
Question paper, page 1
This document consists of 20 printed pages. IB13 11_0654_63/6RP © UCLES 2013 [Turn over *5991904820* UNIVERSITY OF CAMBRIDGE INTERNATIONAL EXAMINATIONS International General Certificate of Secondary Education CO-ORDINATED SCIENCES 0654/63 Paper 6 Alternative to Practical October/November 2013 1 hour Candidates answer on the Question Paper. No Additional Materials are required. READ THESE INSTRUCTIONS FIRST Write your Centre number, candidate number and name on all the work you hand in. Write in dark blue or black pen. You may use a pencil for any diagrams or graphs. Do not use staples, paper clips, glue or correction fluid. DO NOT WRITE IN ANY BARCODES. Answer all questions. Electronic calculators may be used. You may lose marks if you do not show your working or if you do not use appropriate units. At the end of the examination, fasten all your work securely together. The number of marks is given in brackets [ ] at the end of each question or part question.
Question paper, page 2
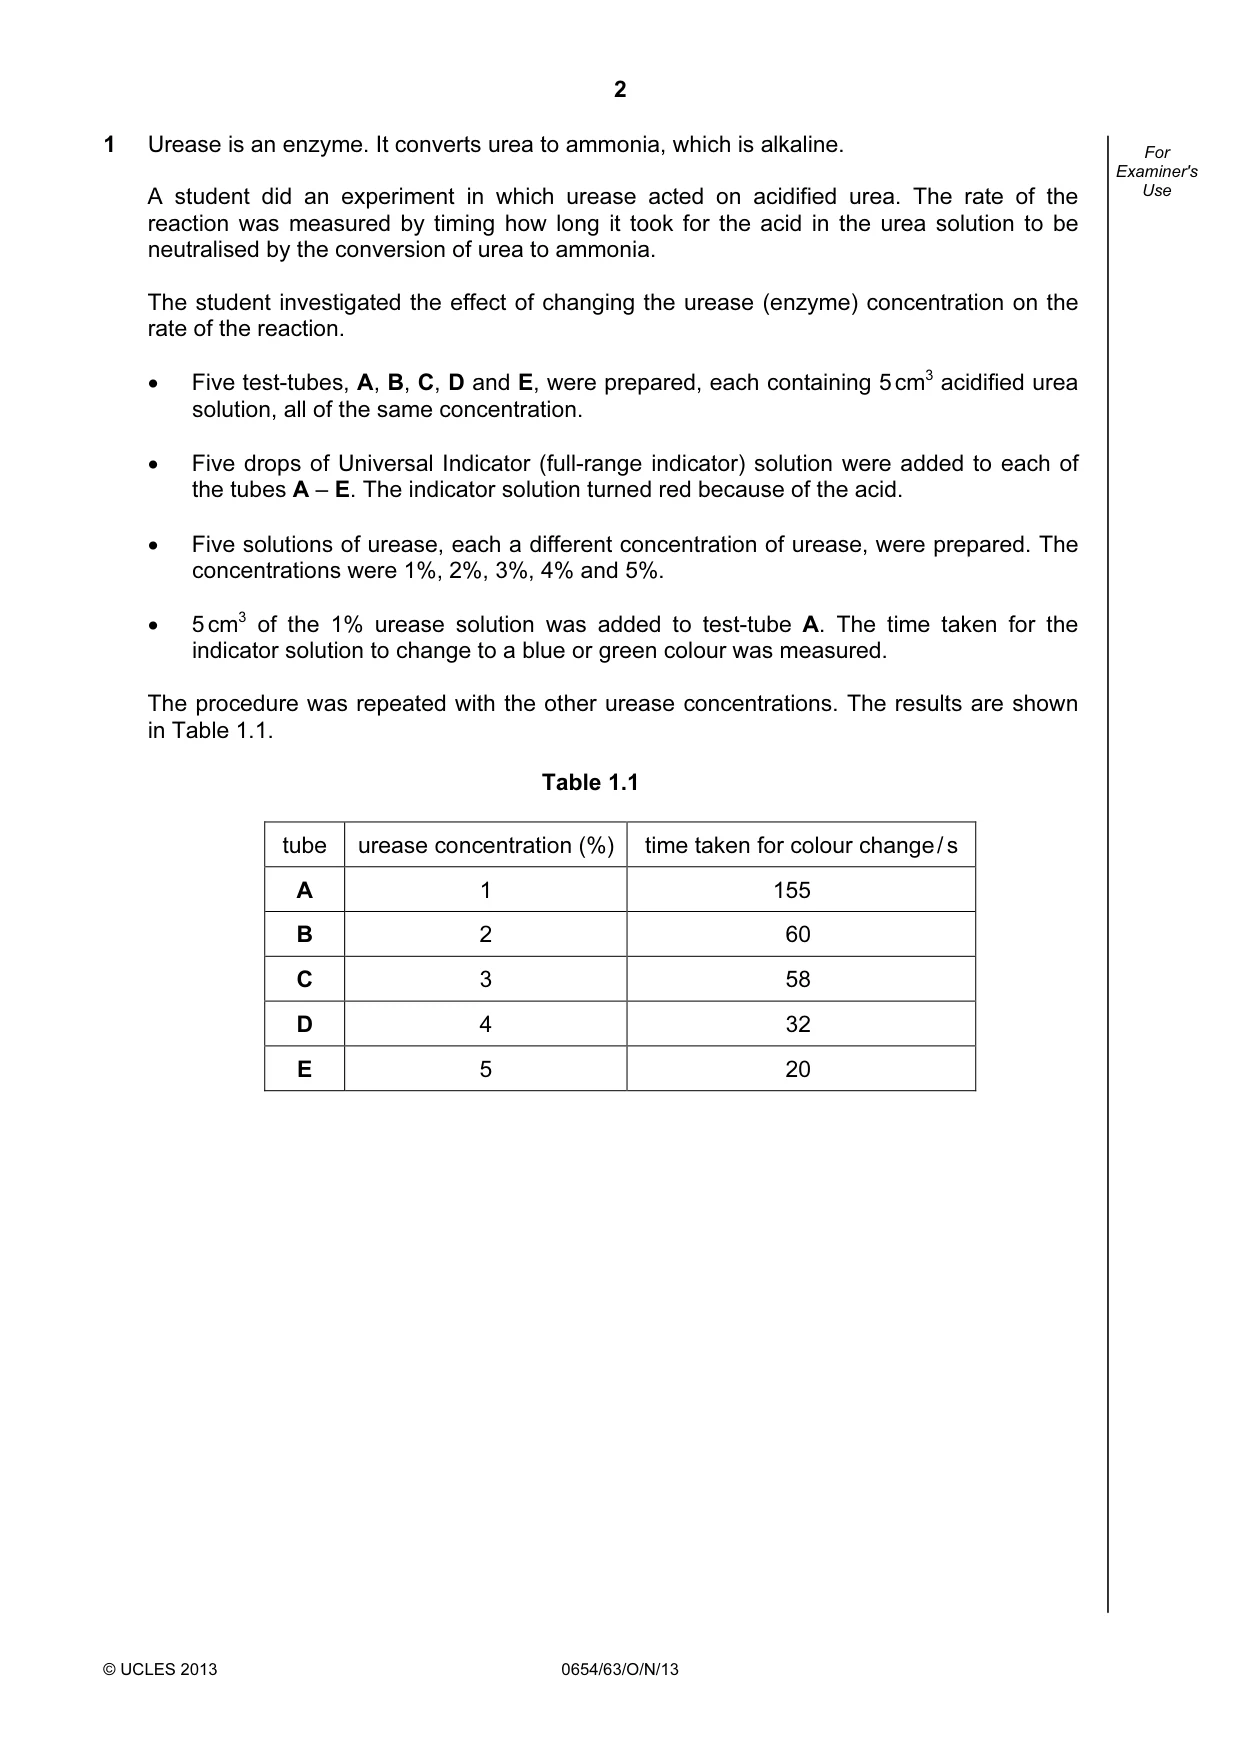
2 © UCLES 2013 0654/63/O/N/13 For Examiner's Use 1 Urease is an enzyme. It converts urea to ammonia, which is alkaline. A student did an experiment in which urease acted on acidified urea. The rate of the reaction was measured by timing how long it took for the acid in the urea solution to be neutralised by the conversion of urea to ammonia. The student investigated the effect of changing the urease (enzyme) concentration on the rate of the reaction. • Five test-tubes, A, B, C, D and E, were prepared, each containing 5 cm3 acidified urea solution, all of the same concentration. • Five drops of Universal Indicator (full-range indicator) solution were added to each of the tubes A – E. The indicator solution turned red because of the acid. • Five solutions of urease, each a different concentration of urease, were prepared. The concentrations were 1%, 2%, 3%, 4% and 5%. • 5 cm3 of the 1% urease solution was added to test-tube A. The time taken for the indicator solution to change to a blue or green colour was measured. The procedure was repeated with the other urease concentrations. The results are shown in Table 1.1. Table 1.1 tube urease concentration (%) time taken for colour change / s A 1 155 B 2 60 C 3 58 D 4 32 E 5 20
Question paper, page 3
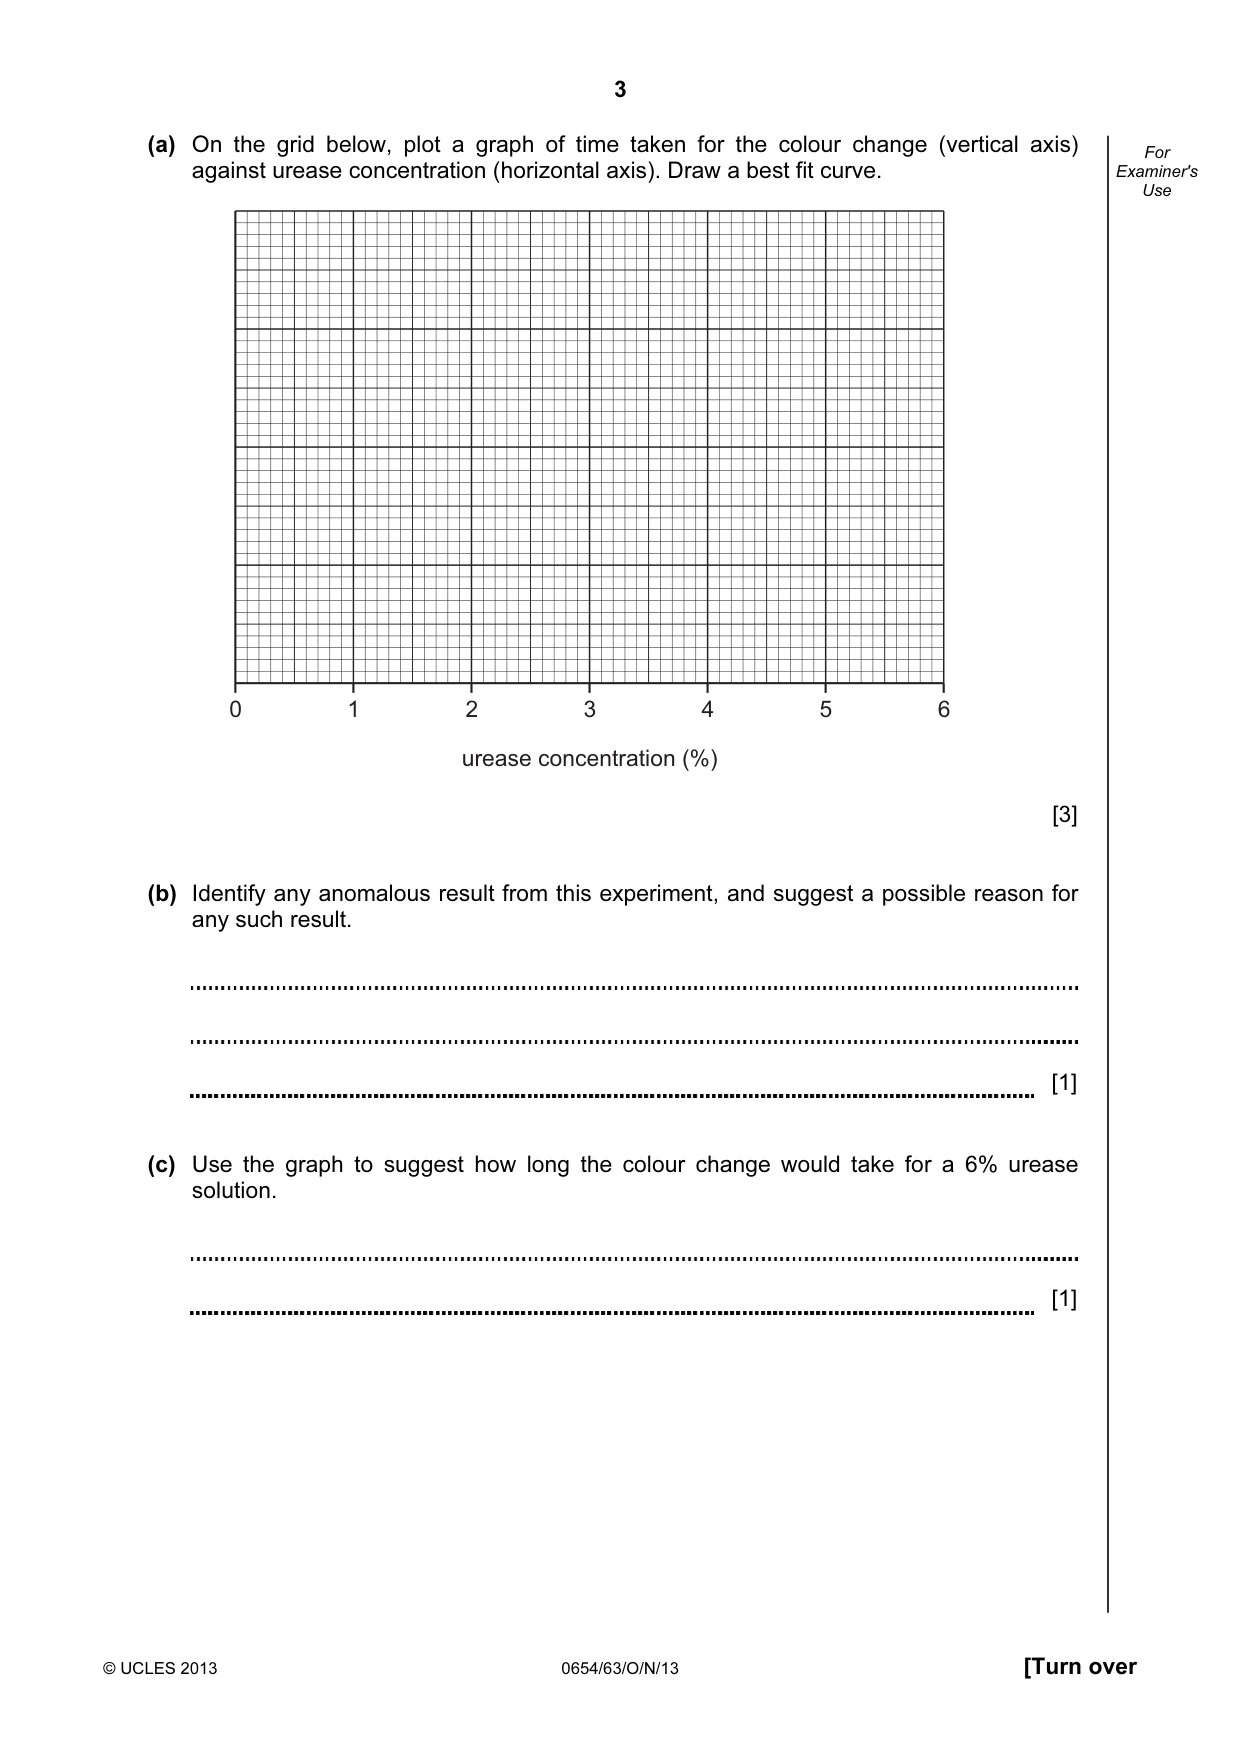
3 © UCLES 2013 0654/63/O/N/13 [Turn over For Examiner's Use (a) On the grid below, plot a graph of time taken for the colour change (vertical axis) against urease concentration (horizontal axis). Draw a best fit curve. urease concentration (%) 0 1 2 3 4 5 6 [3] (b) Identify any anomalous result from this experiment, and suggest a possible reason for any such result. [1] (c) Use the graph to suggest how long the colour change would take for a 6% urease solution. [1]
Question paper, page 4
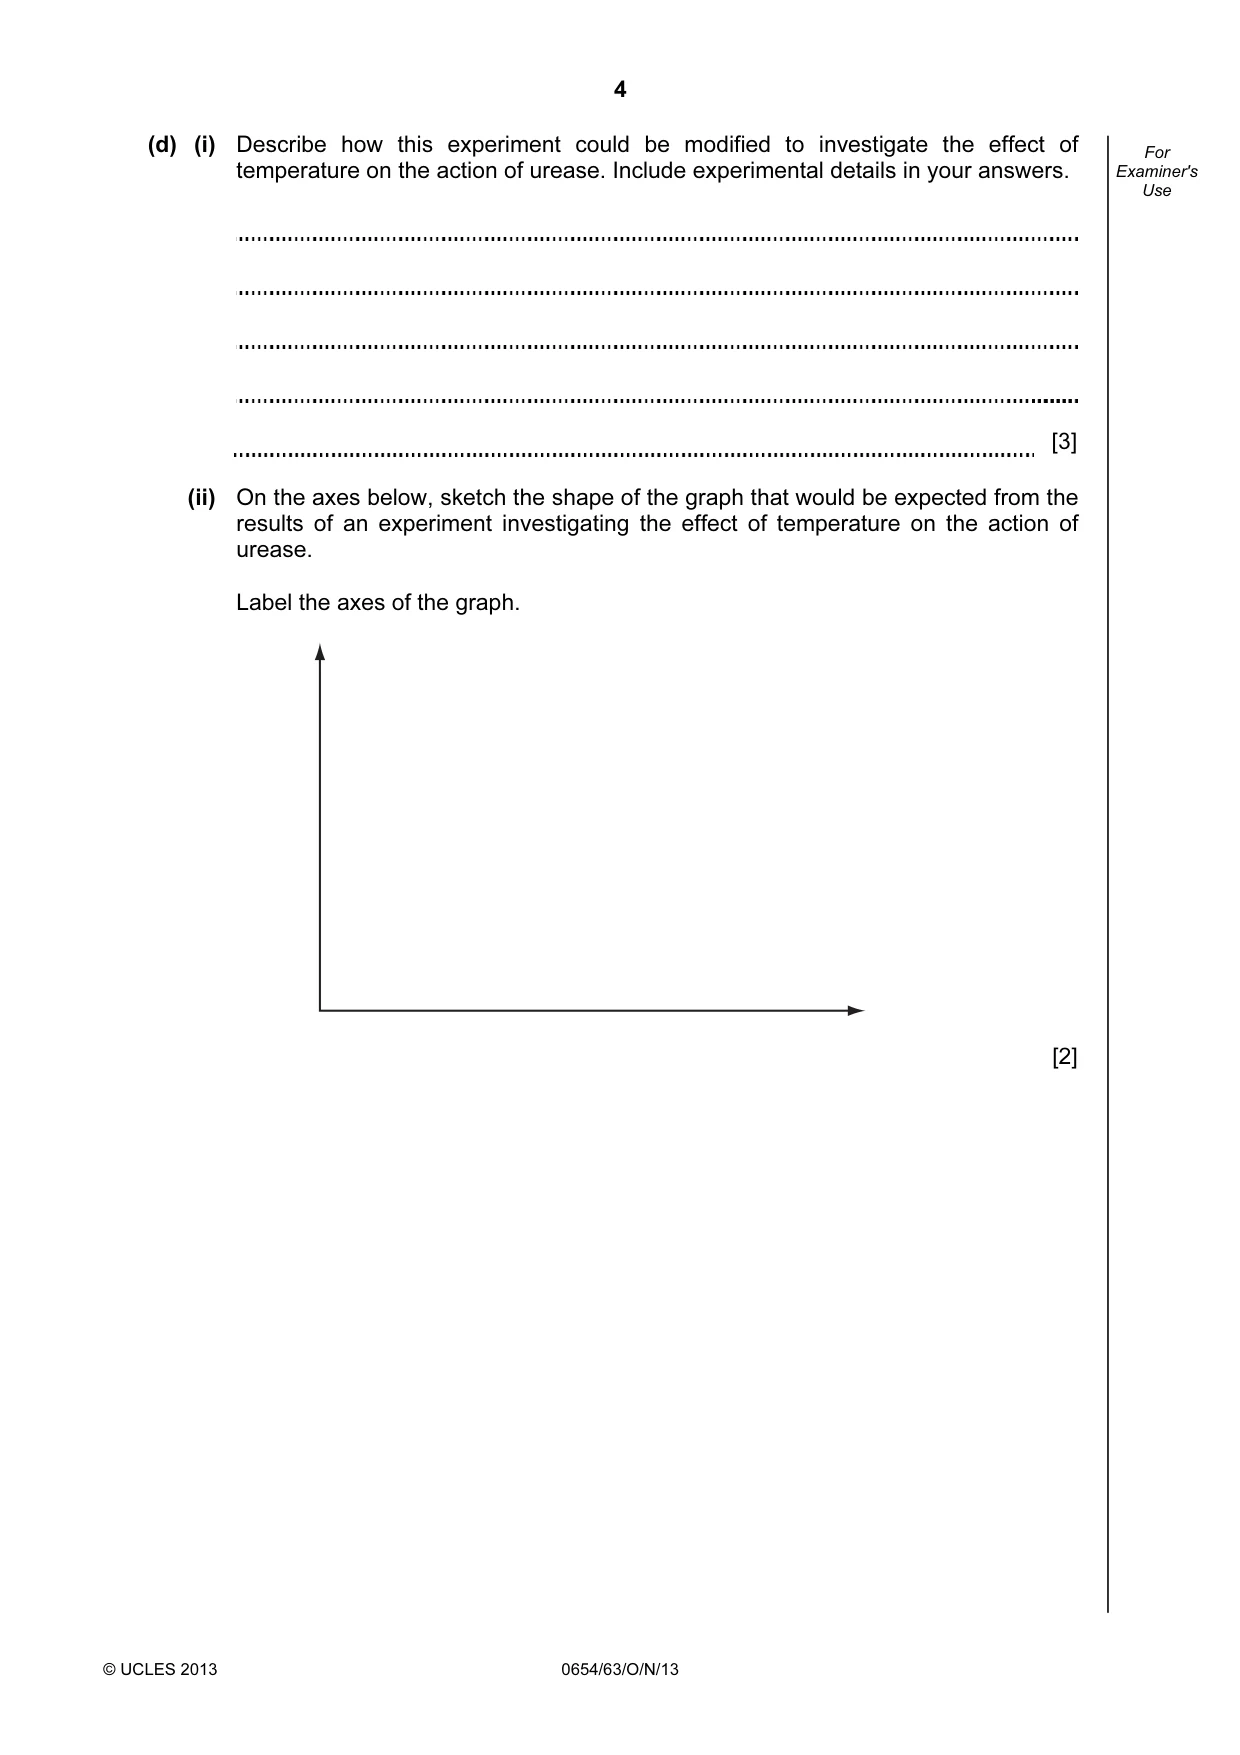
4 © UCLES 2013 0654/63/O/N/13 For Examiner's Use (d) (i) Describe how this experiment could be modified to investigate the effect of temperature on the action of urease. Include experimental details in your answers. [3] (ii) On the axes below, sketch the shape of the graph that would be expected from the results of an experiment investigating the effect of temperature on the action of urease. Label the axes of the graph. [2]
Question paper, page 5
5 © UCLES 2013 0654/63/O/N/13 [Turn over Please turn over for Question 2.
Question paper, page 6
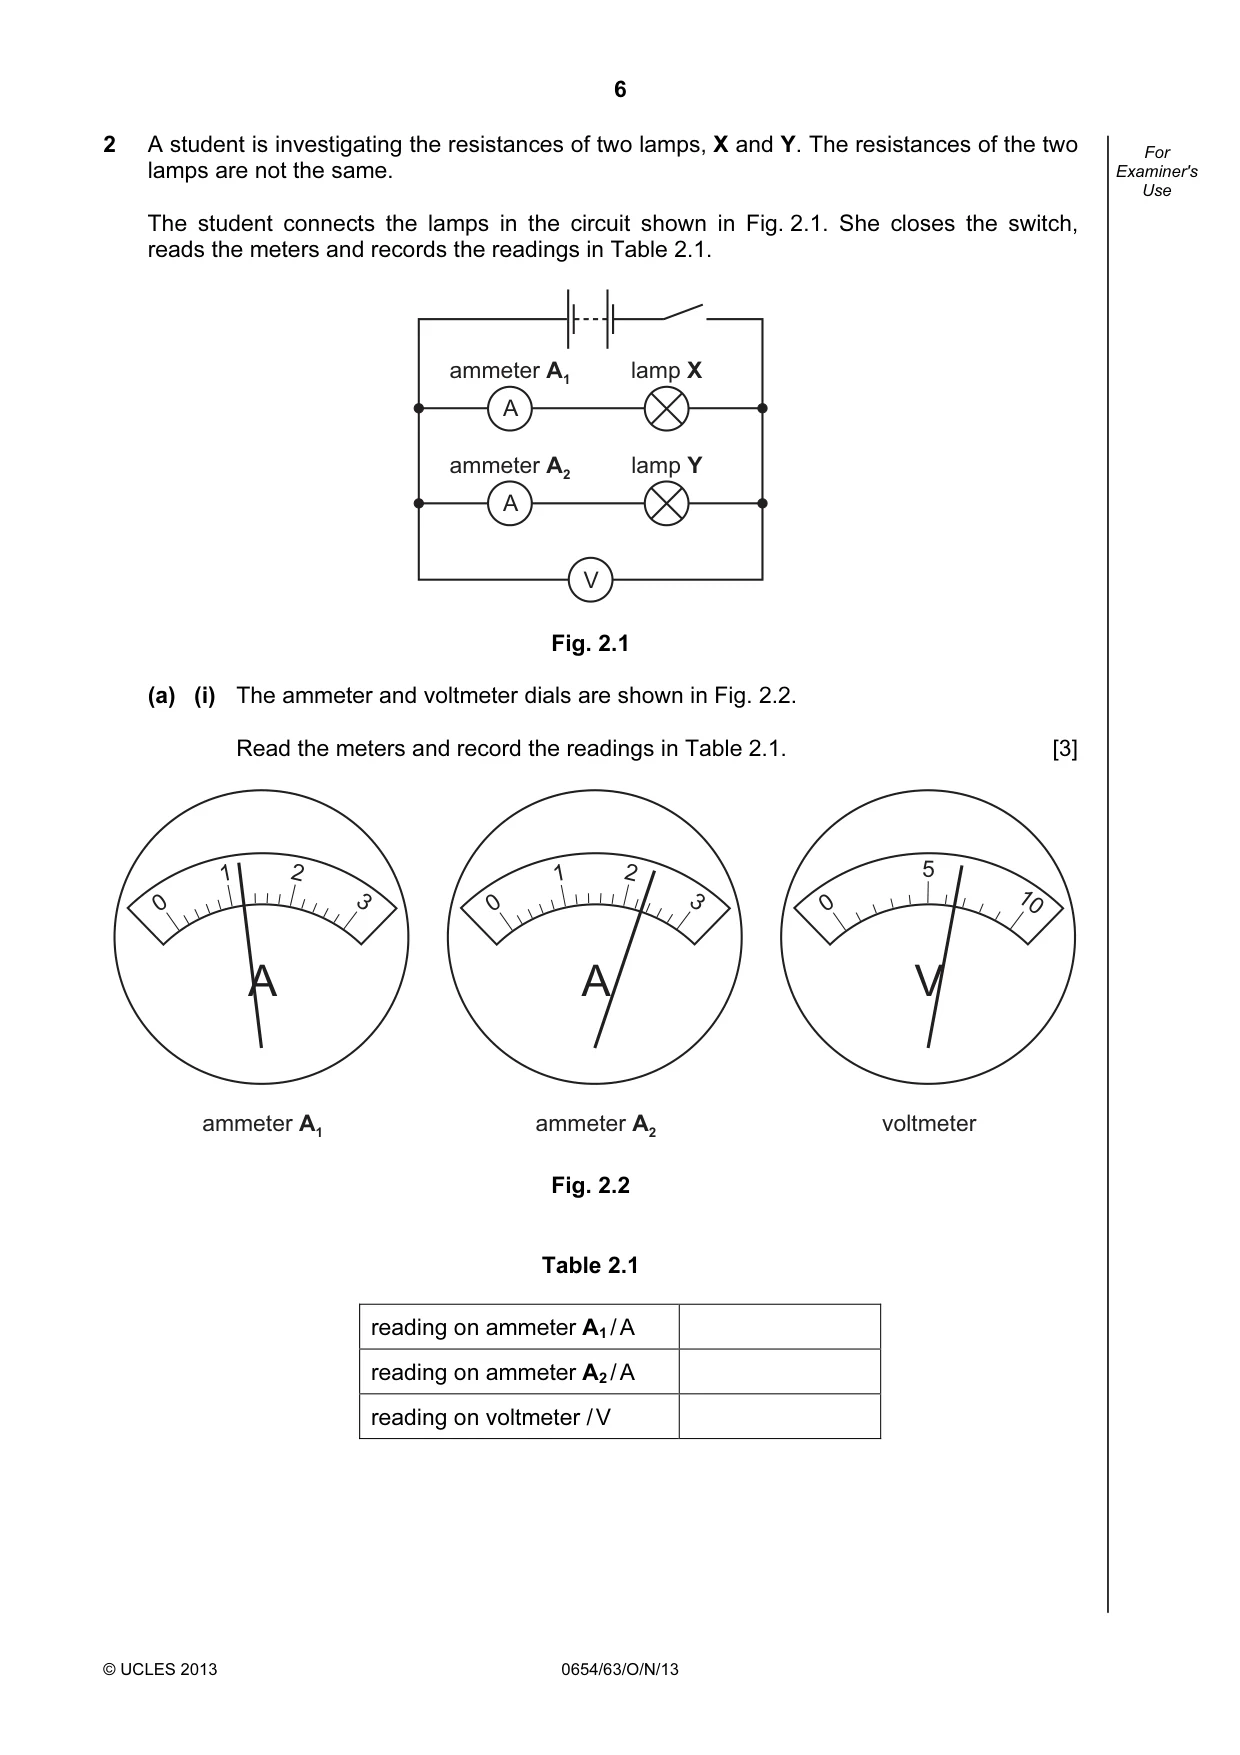
6 © UCLES 2013 0654/63/O/N/13 For Examiner's Use 2 A student is investigating the resistances of two lamps, X and Y. The resistances of the two lamps are not the same. The student connects the lamps in the circuit shown in Fig. 2.1. She closes the switch, reads the meters and records the readings in Table 2.1. V A A lamp X lamp Y ammeter A1 ammeter A2 Fig. 2.1 (a) (i) The ammeter and voltmeter dials are shown in Fig. 2.2. Read the meters and record the readings in Table 2.1. [3] A A 0 1 2 3 0 1 2 3 V ammeter A1 ammeter A2 voltmeter 0 5 10 Fig. 2.2 Table 2.1 reading on ammeter A1 / A reading on ammeter A2 / A reading on voltmeter / V
Question paper, page 7
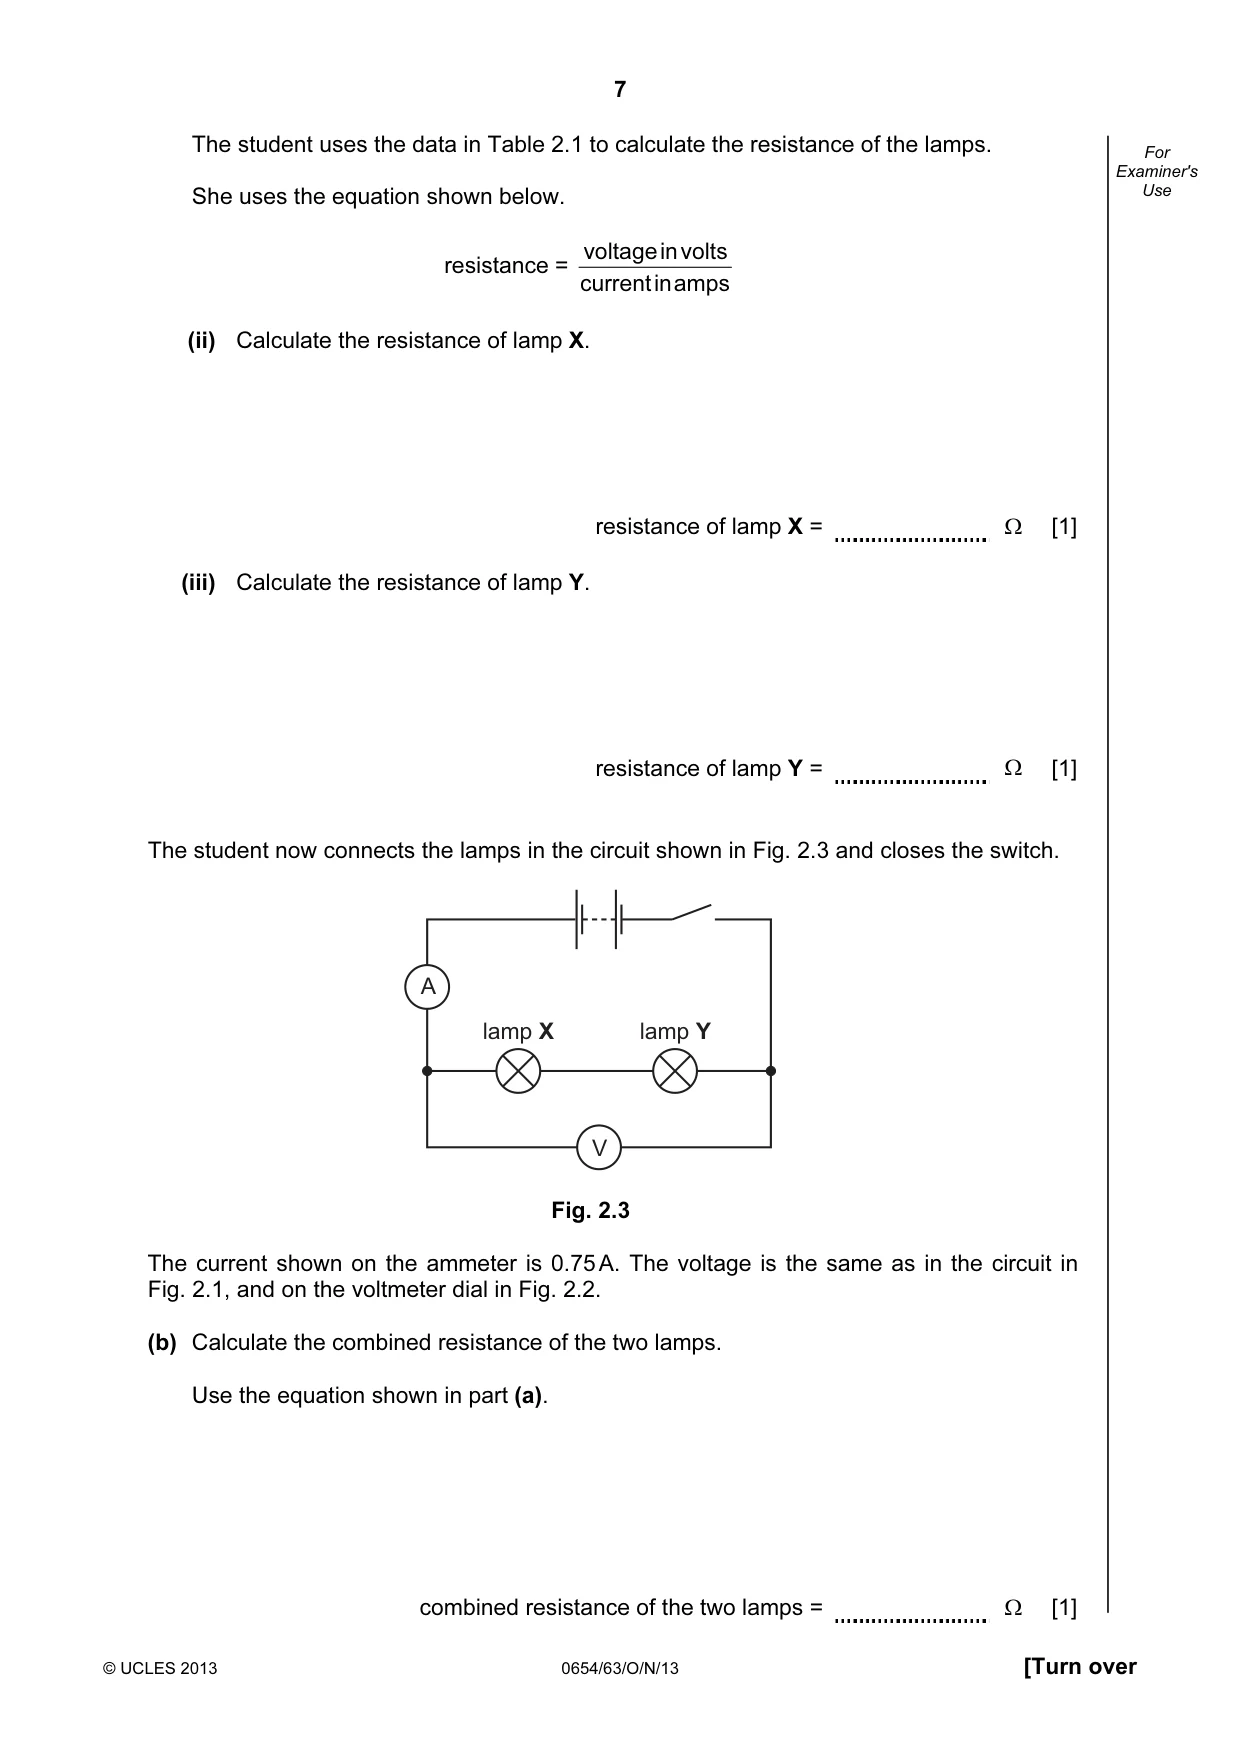
7 © UCLES 2013 0654/63/O/N/13 [Turn over For Examiner's Use The student uses the data in Table 2.1 to calculate the resistance of the lamps. She uses the equation shown below. resistance = amps in current volts in voltage (ii) Calculate the resistance of lamp X. resistance of lamp X = Ω [1] (iii) Calculate the resistance of lamp Y. resistance of lamp Y = Ω [1] The student now connects the lamps in the circuit shown in Fig. 2.3 and closes the switch. V A lamp Y lamp X Fig. 2.3 The current shown on the ammeter is 0.75 A. The voltage is the same as in the circuit in Fig. 2.1, and on the voltmeter dial in Fig. 2.2. (b) Calculate the combined resistance of the two lamps. Use the equation shown in part (a). combined resistance of the two lamps = Ω [1]
Question paper, page 8
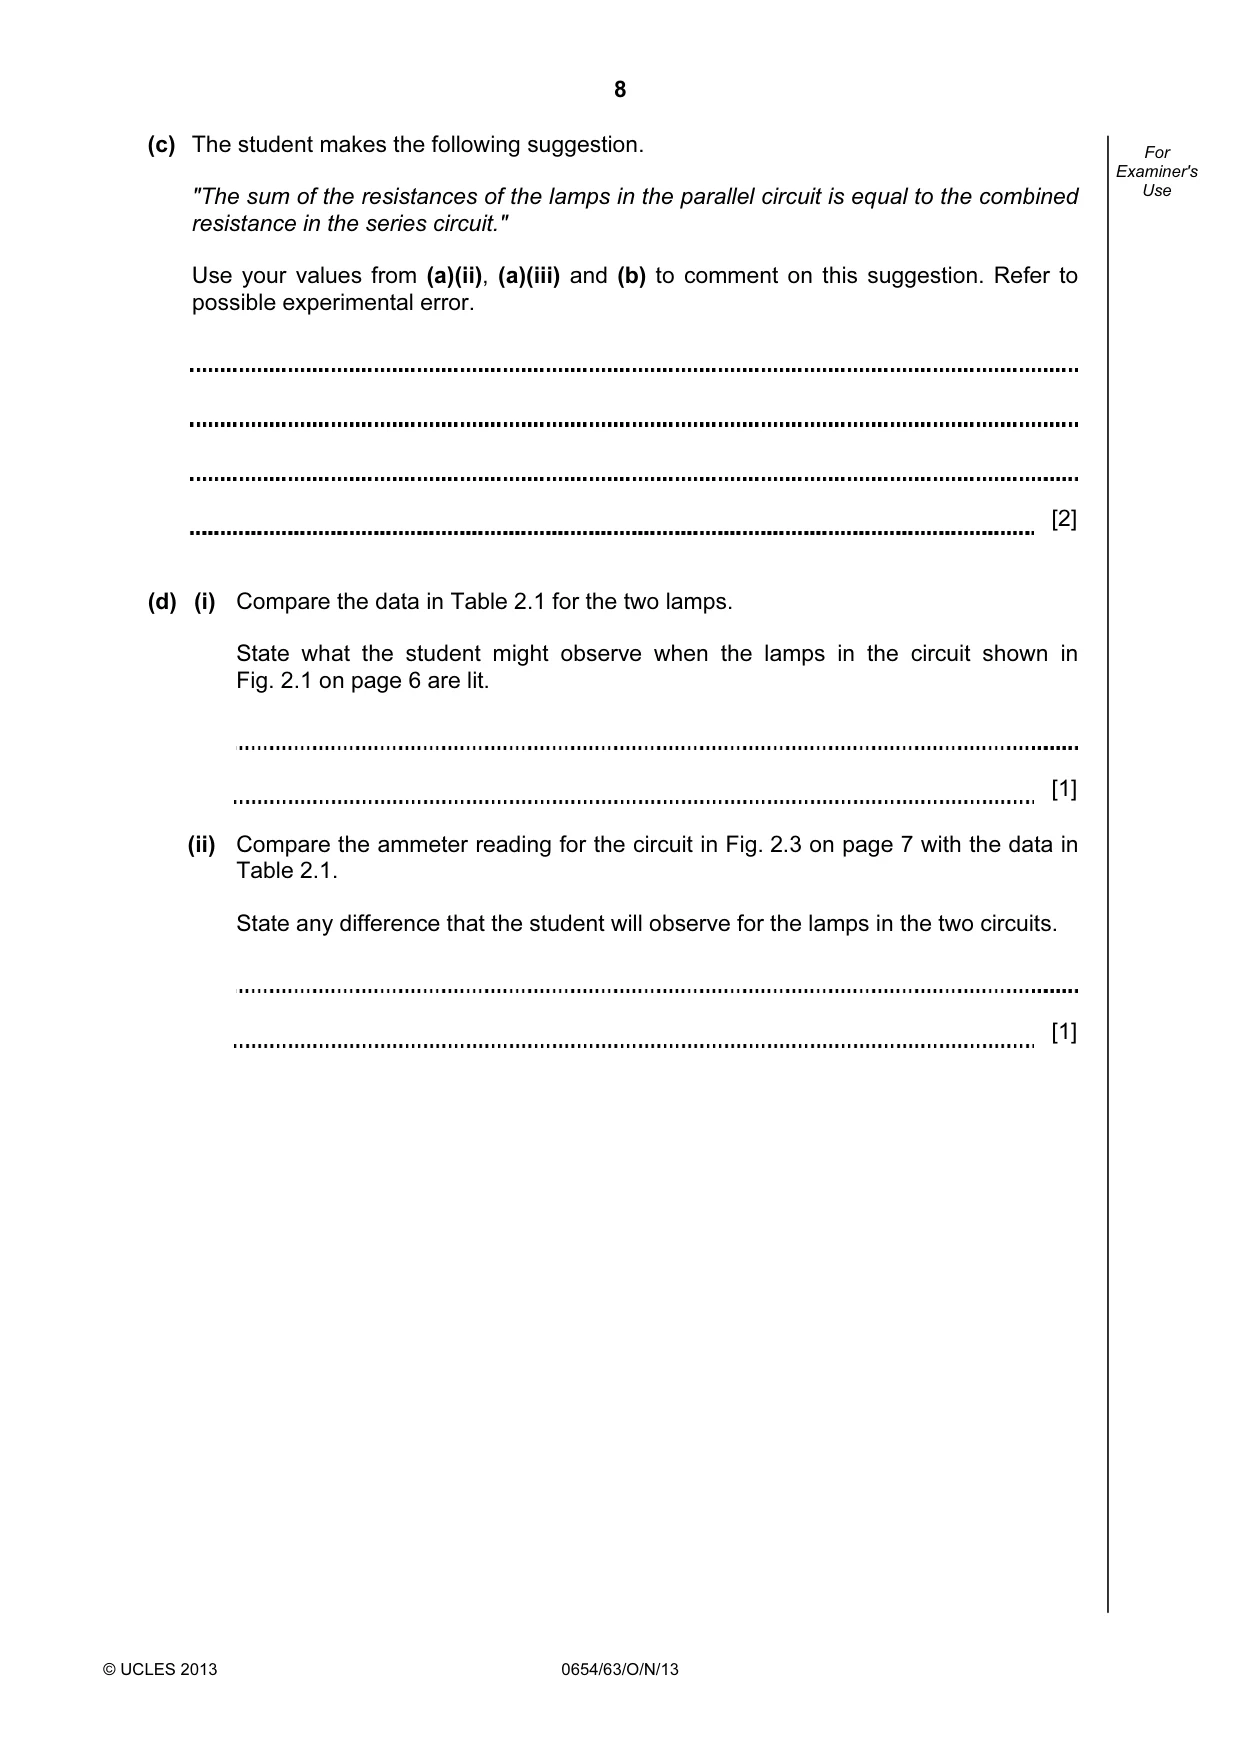
8 © UCLES 2013 0654/63/O/N/13 For Examiner's Use (c) The student makes the following suggestion. "The sum of the resistances of the lamps in the parallel circuit is equal to the combined resistance in the series circuit." Use your values from (a)(ii), (a)(iii) and (b) to comment on this suggestion. Refer to possible experimental error. [2] (d) (i) Compare the data in Table 2.1 for the two lamps. State what the student might observe when the lamps in the circuit shown in Fig. 2.1 on page 6 are lit. [1] (ii) Compare the ammeter reading for the circuit in Fig. 2.3 on page 7 with the data in Table 2.1. State any difference that the student will observe for the lamps in the two circuits. [1]
Question paper, page 9
9 © UCLES 2013 0654/63/O/N/13 [Turn over Please turn over for Question 3.
Question paper, page 10
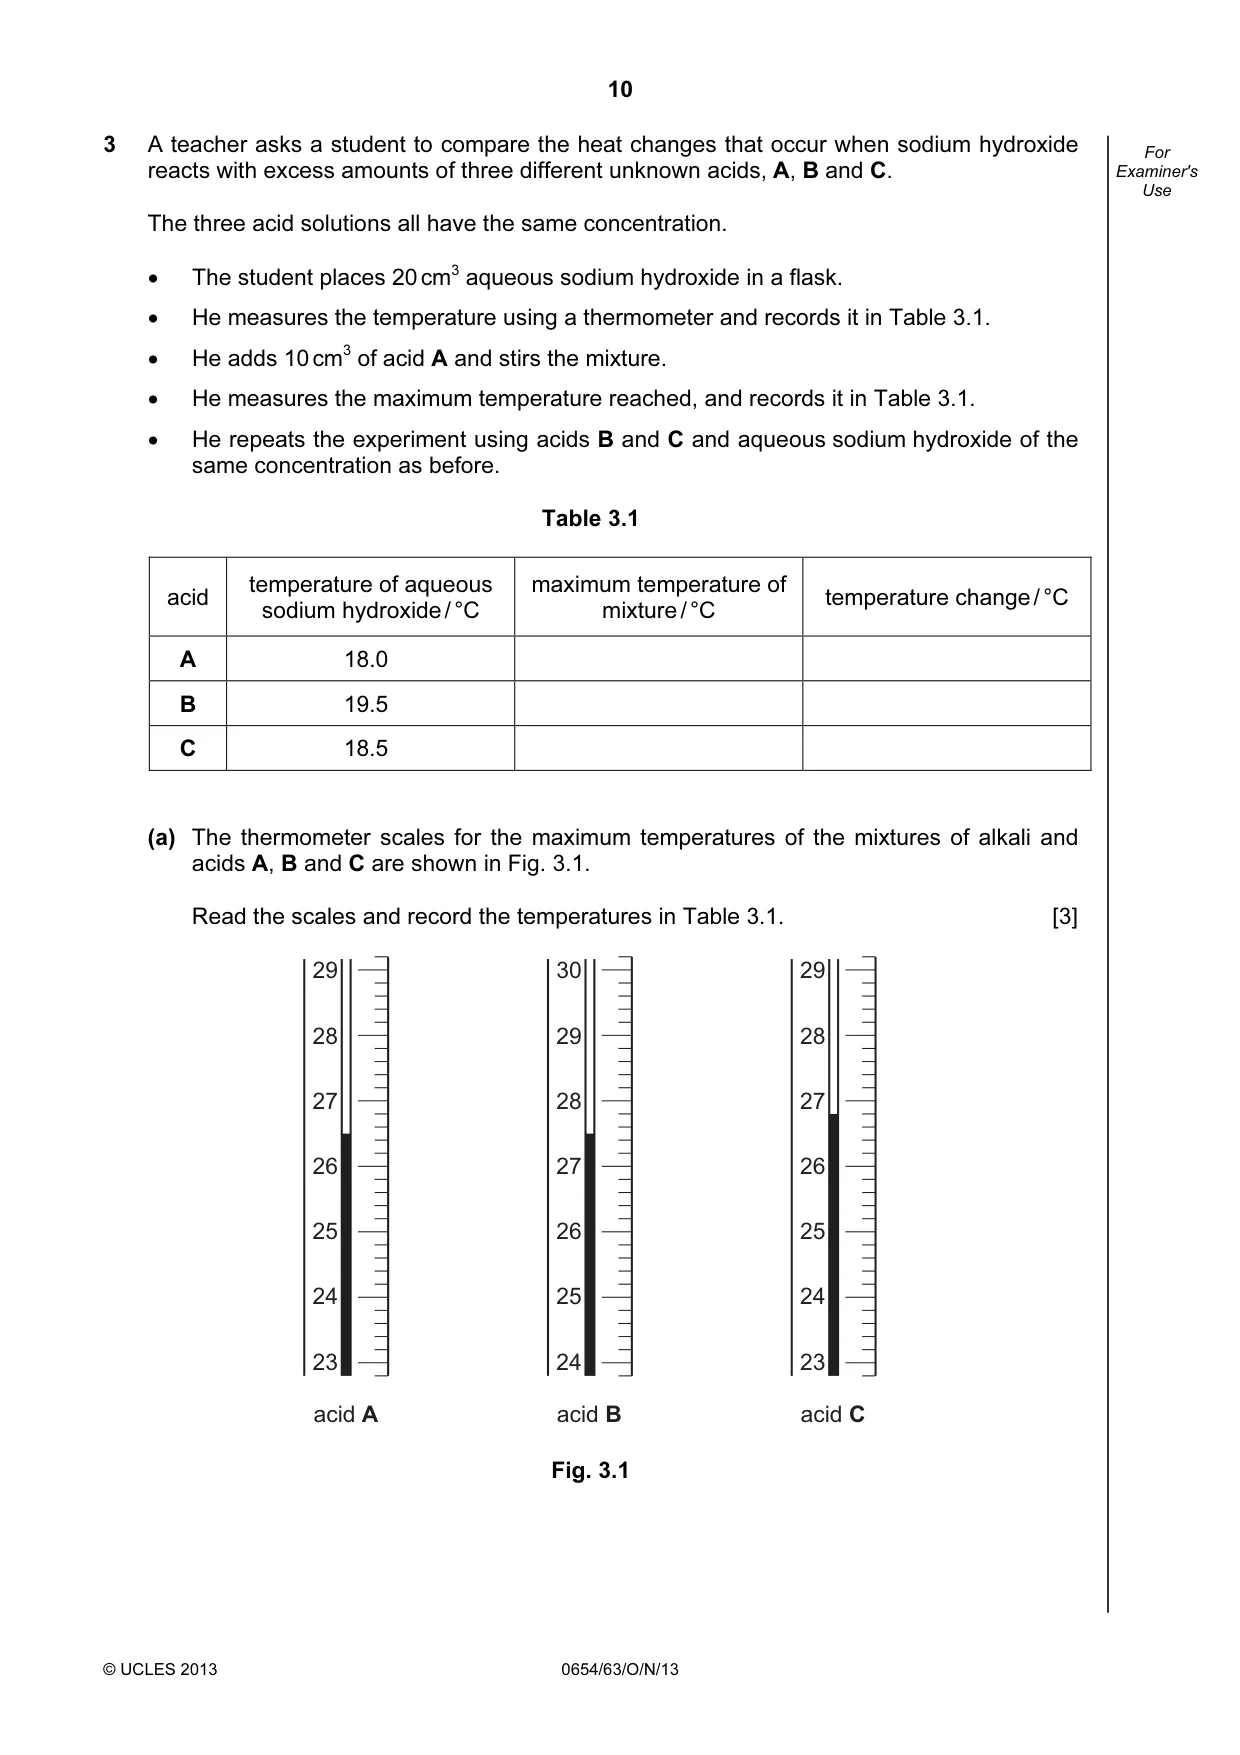
10 © UCLES 2013 0654/63/O/N/13 For Examiner's Use 3 A teacher asks a student to compare the heat changes that occur when sodium hydroxide reacts with excess amounts of three different unknown acids, A, B and C. The three acid solutions all have the same concentration. • The student places 20 cm3 aqueous sodium hydroxide in a flask. • He measures the temperature using a thermometer and records it in Table 3.1. • He adds 10 cm3 of acid A and stirs the mixture. • He measures the maximum temperature reached, and records it in Table 3.1. • He repeats the experiment using acids B and C and aqueous sodium hydroxide of the same concentration as before. Table 3.1 acid temperature of aqueous sodium hydroxide / °C maximum temperature of mixture / °C temperature change / °C A 18.0 B 19.5 C 18.5 (a) The thermometer scales for the maximum temperatures of the mixtures of alkali and acids A, B and C are shown in Fig. 3.1. Read the scales and record the temperatures in Table 3.1. [3] 29 28 27 26 25 24 23 acid C 30 29 28 27 26 25 24 acid B 29 28 27 26 25 24 23 acid A Fig. 3.1
Question paper, page 11
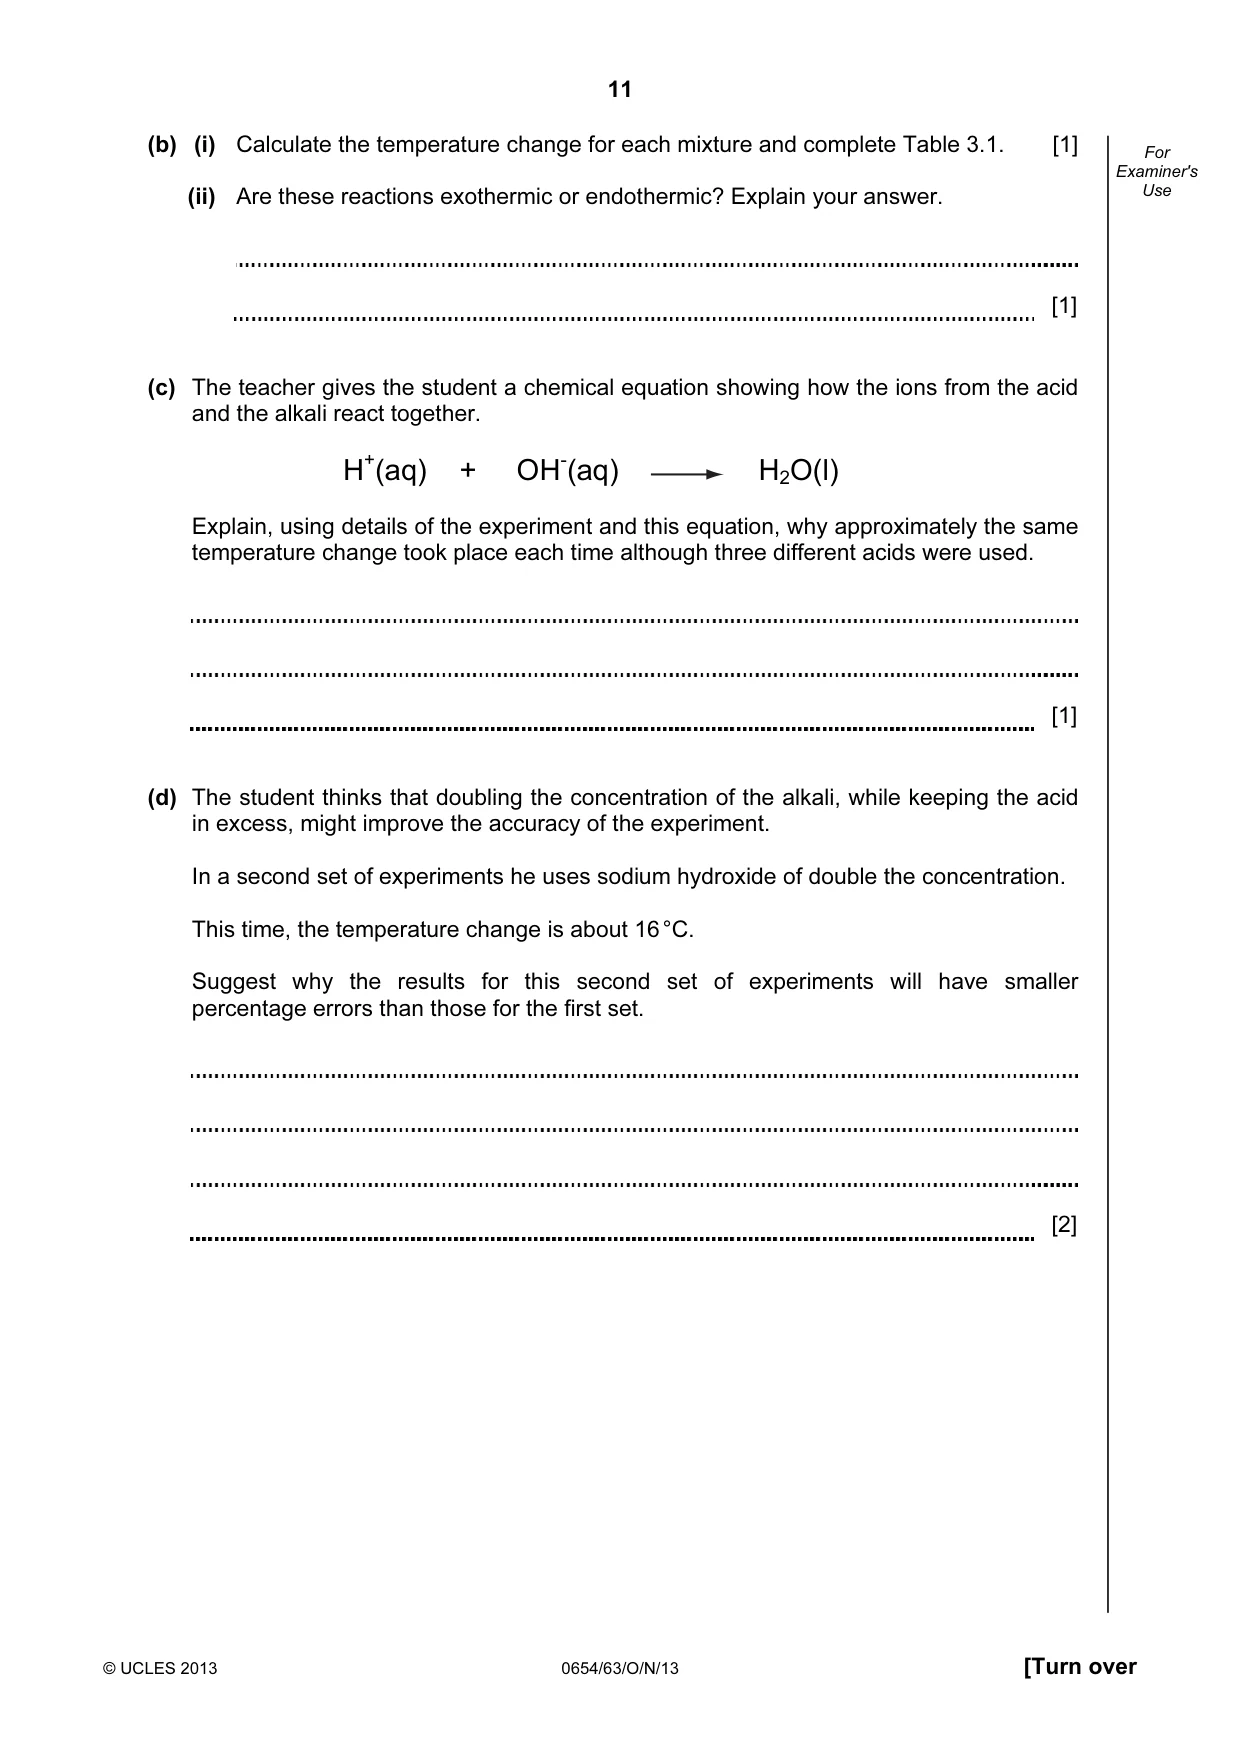
11 © UCLES 2013 0654/63/O/N/13 [Turn over For Examiner's Use (b) (i) Calculate the temperature change for each mixture and complete Table 3.1. [1] (ii) Are these reactions exothermic or endothermic? Explain your answer. [1] (c) The teacher gives the student a chemical equation showing how the ions from the acid and the alkali react together. H+(aq) + OH-(aq) H2O(l) Explain, using details of the experiment and this equation, why approximately the same temperature change took place each time although three different acids were used. [1] (d) The student thinks that doubling the concentration of the alkali, while keeping the acid in excess, might improve the accuracy of the experiment. In a second set of experiments he uses sodium hydroxide of double the concentration. This time, the temperature change is about 16 °C. Suggest why the results for this second set of experiments will have smaller percentage errors than those for the first set. [2]
Question paper, page 12
12 © UCLES 2013 0654/63/O/N/13 For Examiner's Use (e) The teacher asks the student to find out which of the three acids A, B and C is hydrochloric acid. The student adds a few drops of a test solution to samples of the three acids. He observes a reaction and concludes that acid A is hydrochloric acid. Name the test solution and state the observation that the student makes. name of test solution observation [2]
Question paper, page 13
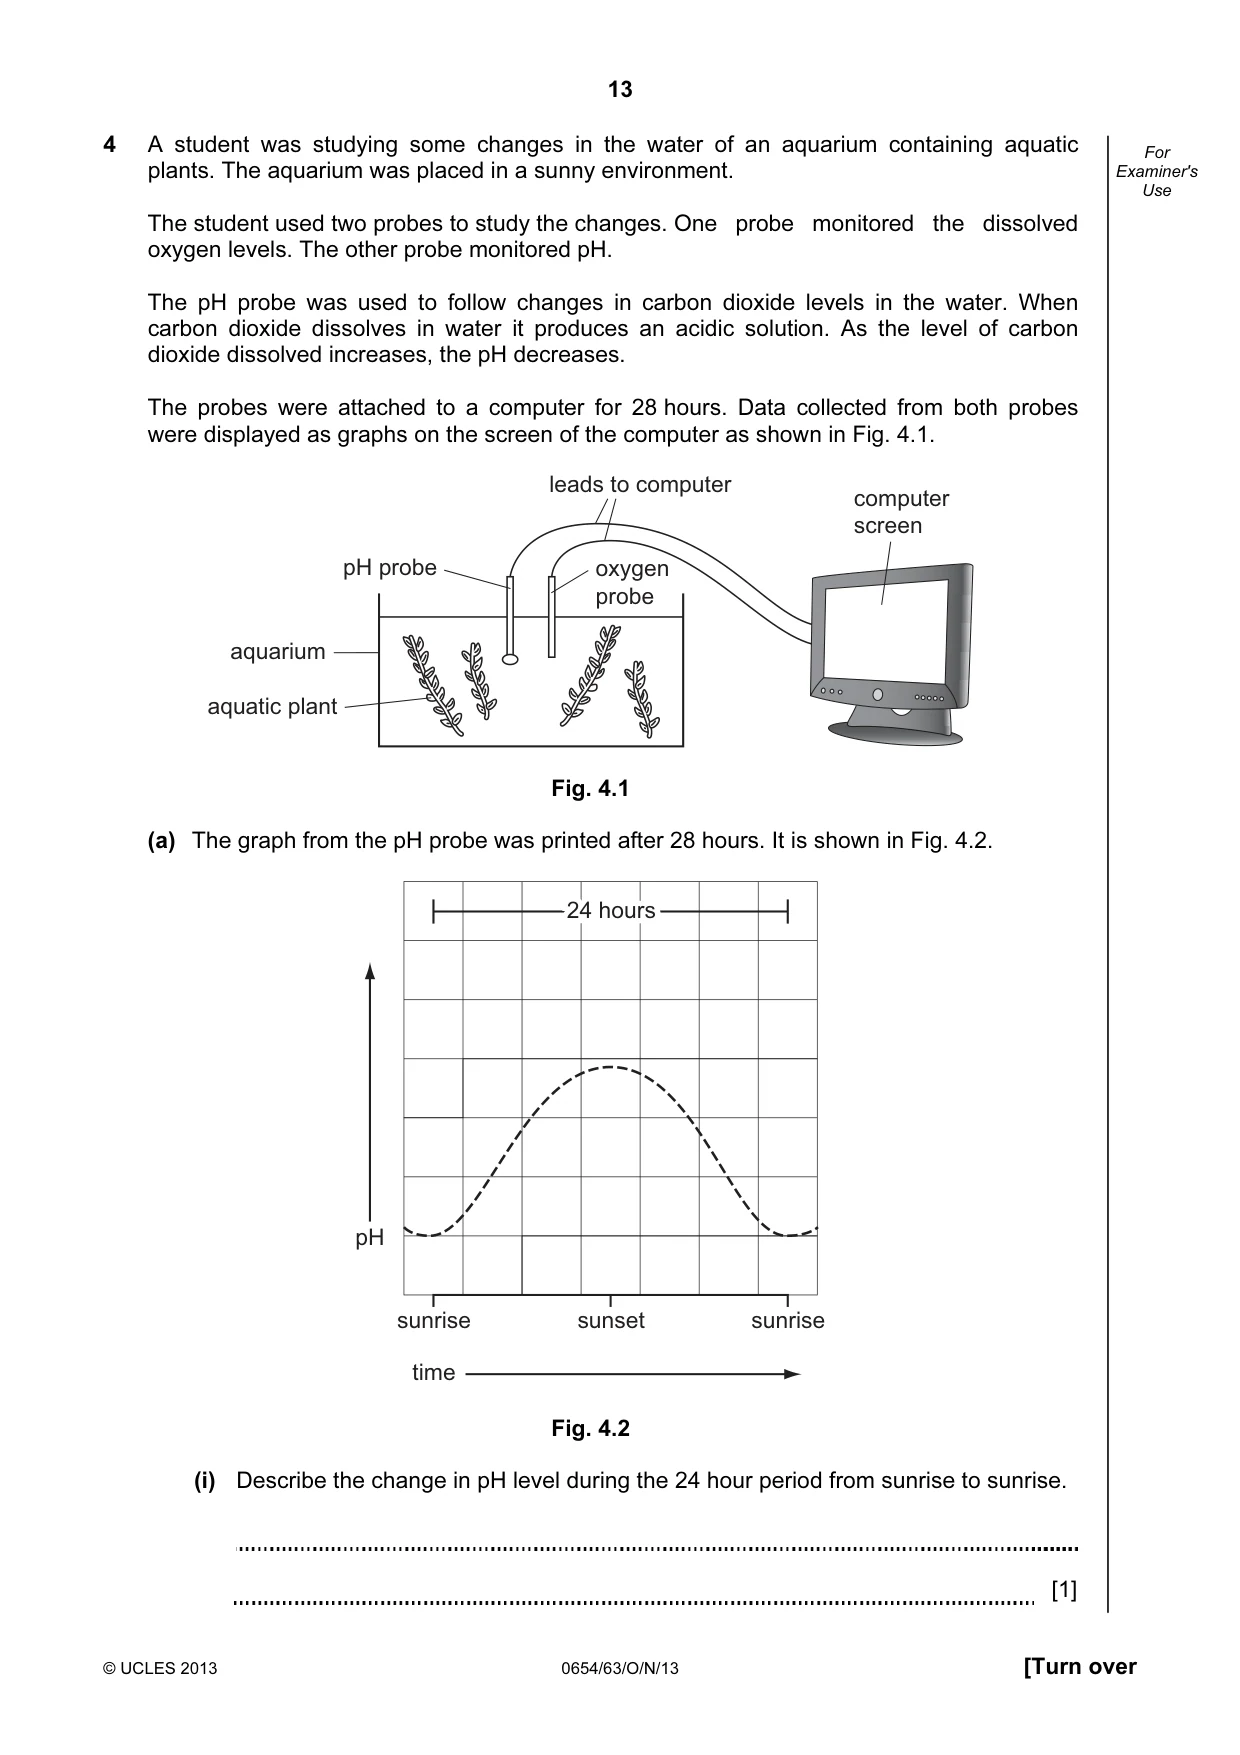
13 © UCLES 2013 0654/63/O/N/13 [Turn over For Examiner's Use 4 A student was studying some changes in the water of an aquarium containing aquatic plants. The aquarium was placed in a sunny environment. The student used two probes to study the changes. One probe monitored the dissolved oxygen levels. The other probe monitored pH. The pH probe was used to follow changes in carbon dioxide levels in the water. When carbon dioxide dissolves in water it produces an acidic solution. As the level of carbon dioxide dissolved increases, the pH decreases. The probes were attached to a computer for 28 hours. Data collected from both probes were displayed as graphs on the screen of the computer as shown in Fig. 4.1. computer screen oxygen probe leads to computer pH probe aquarium aquatic plant Fig. 4.1 (a) The graph from the pH probe was printed after 28 hours. It is shown in Fig. 4.2. sunrise time sunset sunrise pH 24 hours 24 hours 24 hours Fig. 4.2 (i) Describe the change in pH level during the 24 hour period from sunrise to sunrise. [1]
Question paper, page 14
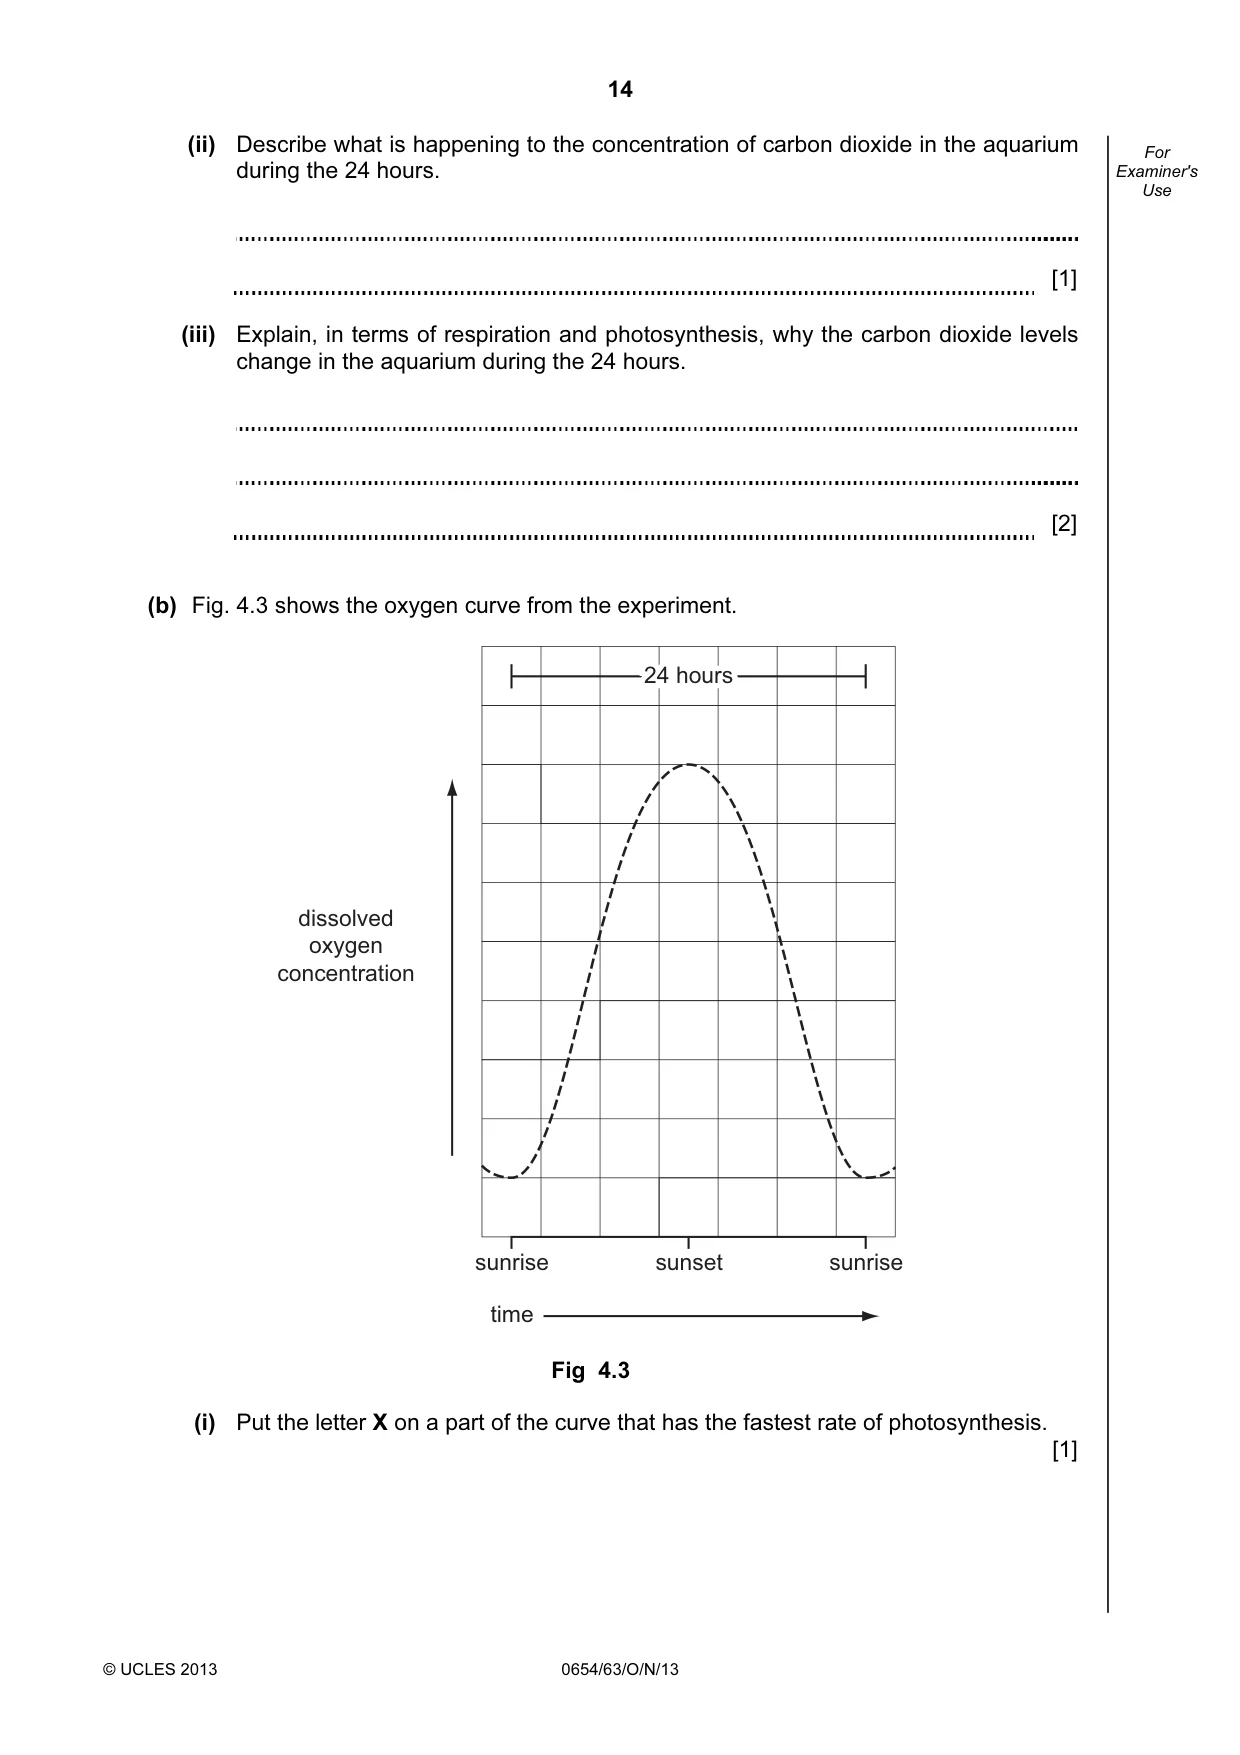
14 © UCLES 2013 0654/63/O/N/13 For Examiner's Use (ii) Describe what is happening to the concentration of carbon dioxide in the aquarium during the 24 hours. [1] (iii) Explain, in terms of respiration and photosynthesis, why the carbon dioxide levels change in the aquarium during the 24 hours. [2] (b) Fig. 4.3 shows the oxygen curve from the experiment. sunrise time sunset sunrise dissolved oxygen concentration 24 hours 24 hours 24 hours Fig 4.3 (i) Put the letter X on a part of the curve that has the fastest rate of photosynthesis. [1]
Question paper, page 15
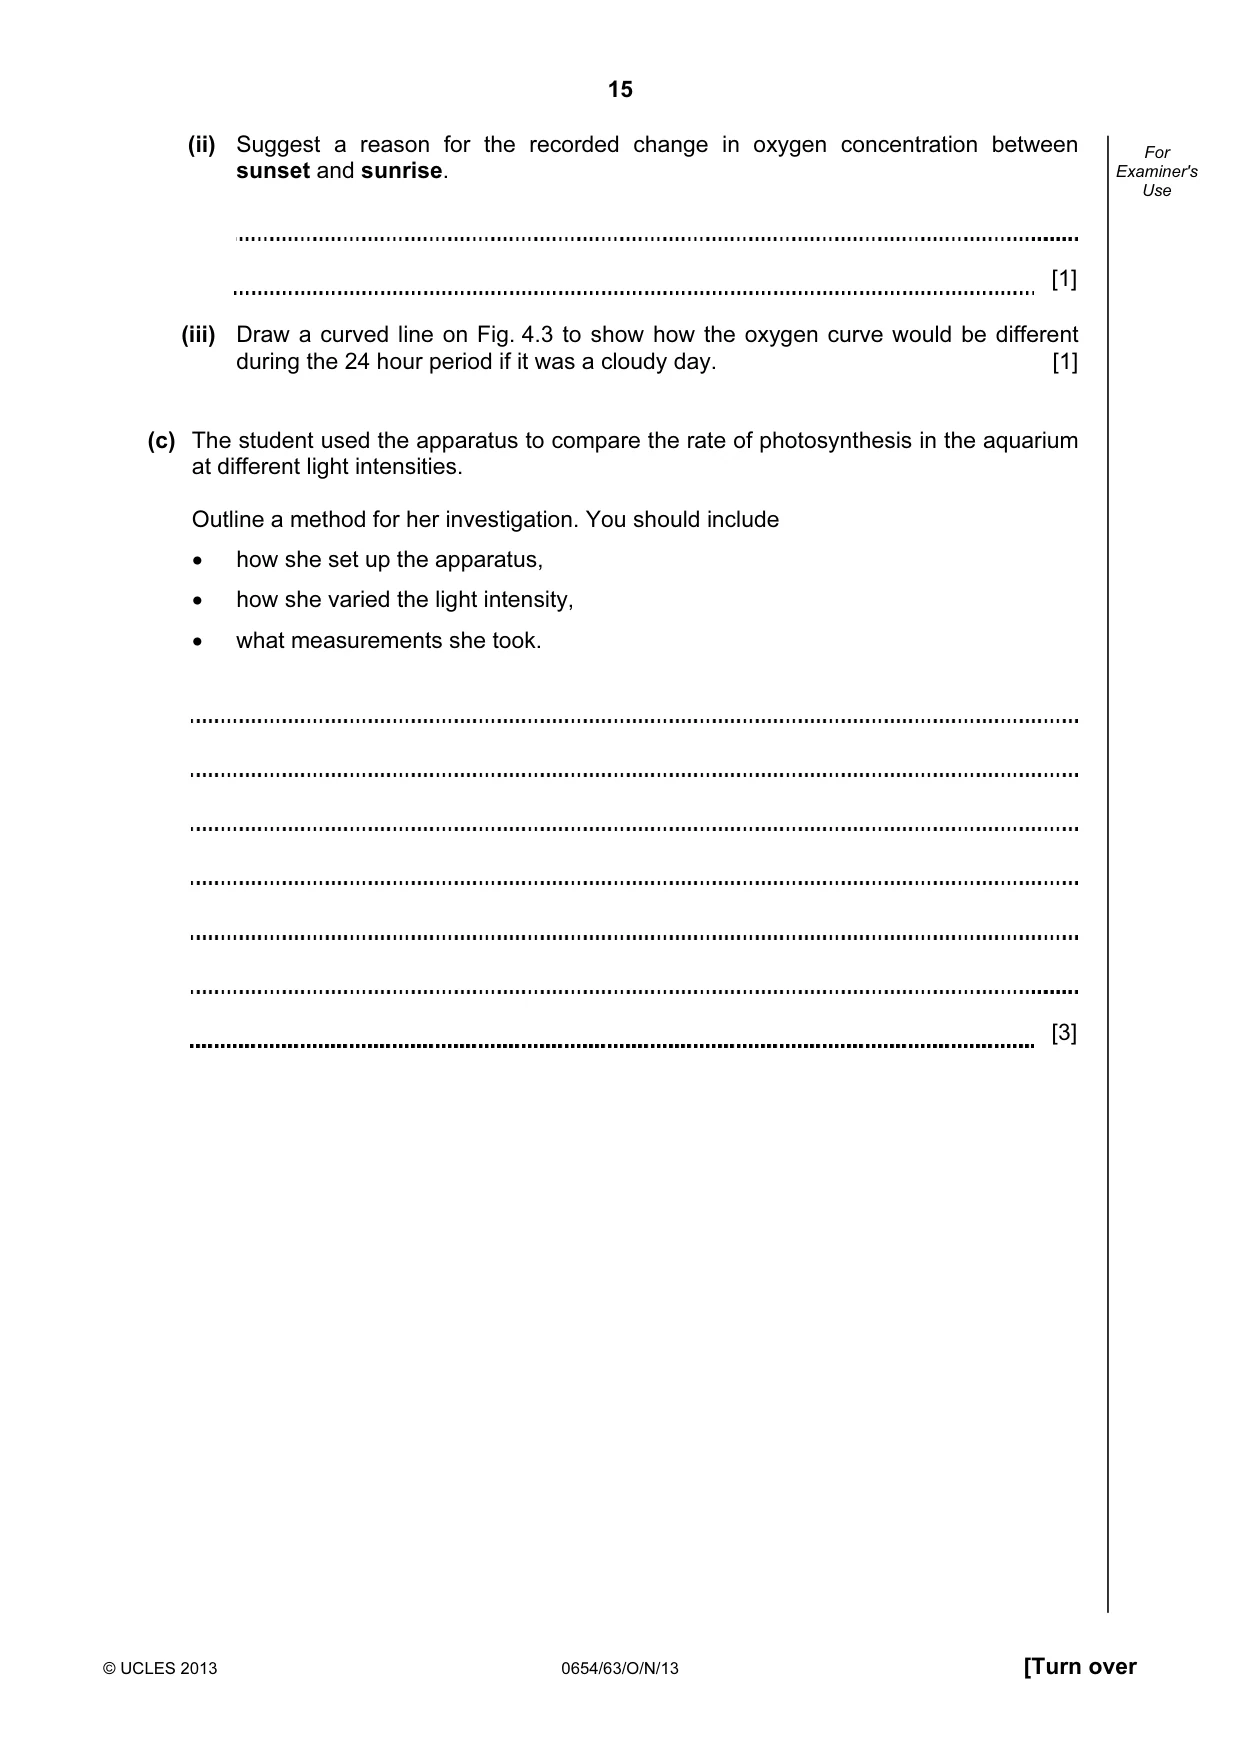
15 © UCLES 2013 0654/63/O/N/13 [Turn over For Examiner's Use (ii) Suggest a reason for the recorded change in oxygen concentration between sunset and sunrise. [1] (iii) Draw a curved line on Fig. 4.3 to show how the oxygen curve would be different during the 24 hour period if it was a cloudy day. [1] (c) The student used the apparatus to compare the rate of photosynthesis in the aquarium at different light intensities. Outline a method for her investigation. You should include • how she set up the apparatus, • how she varied the light intensity, • what measurements she took. [3]
Question paper, page 16
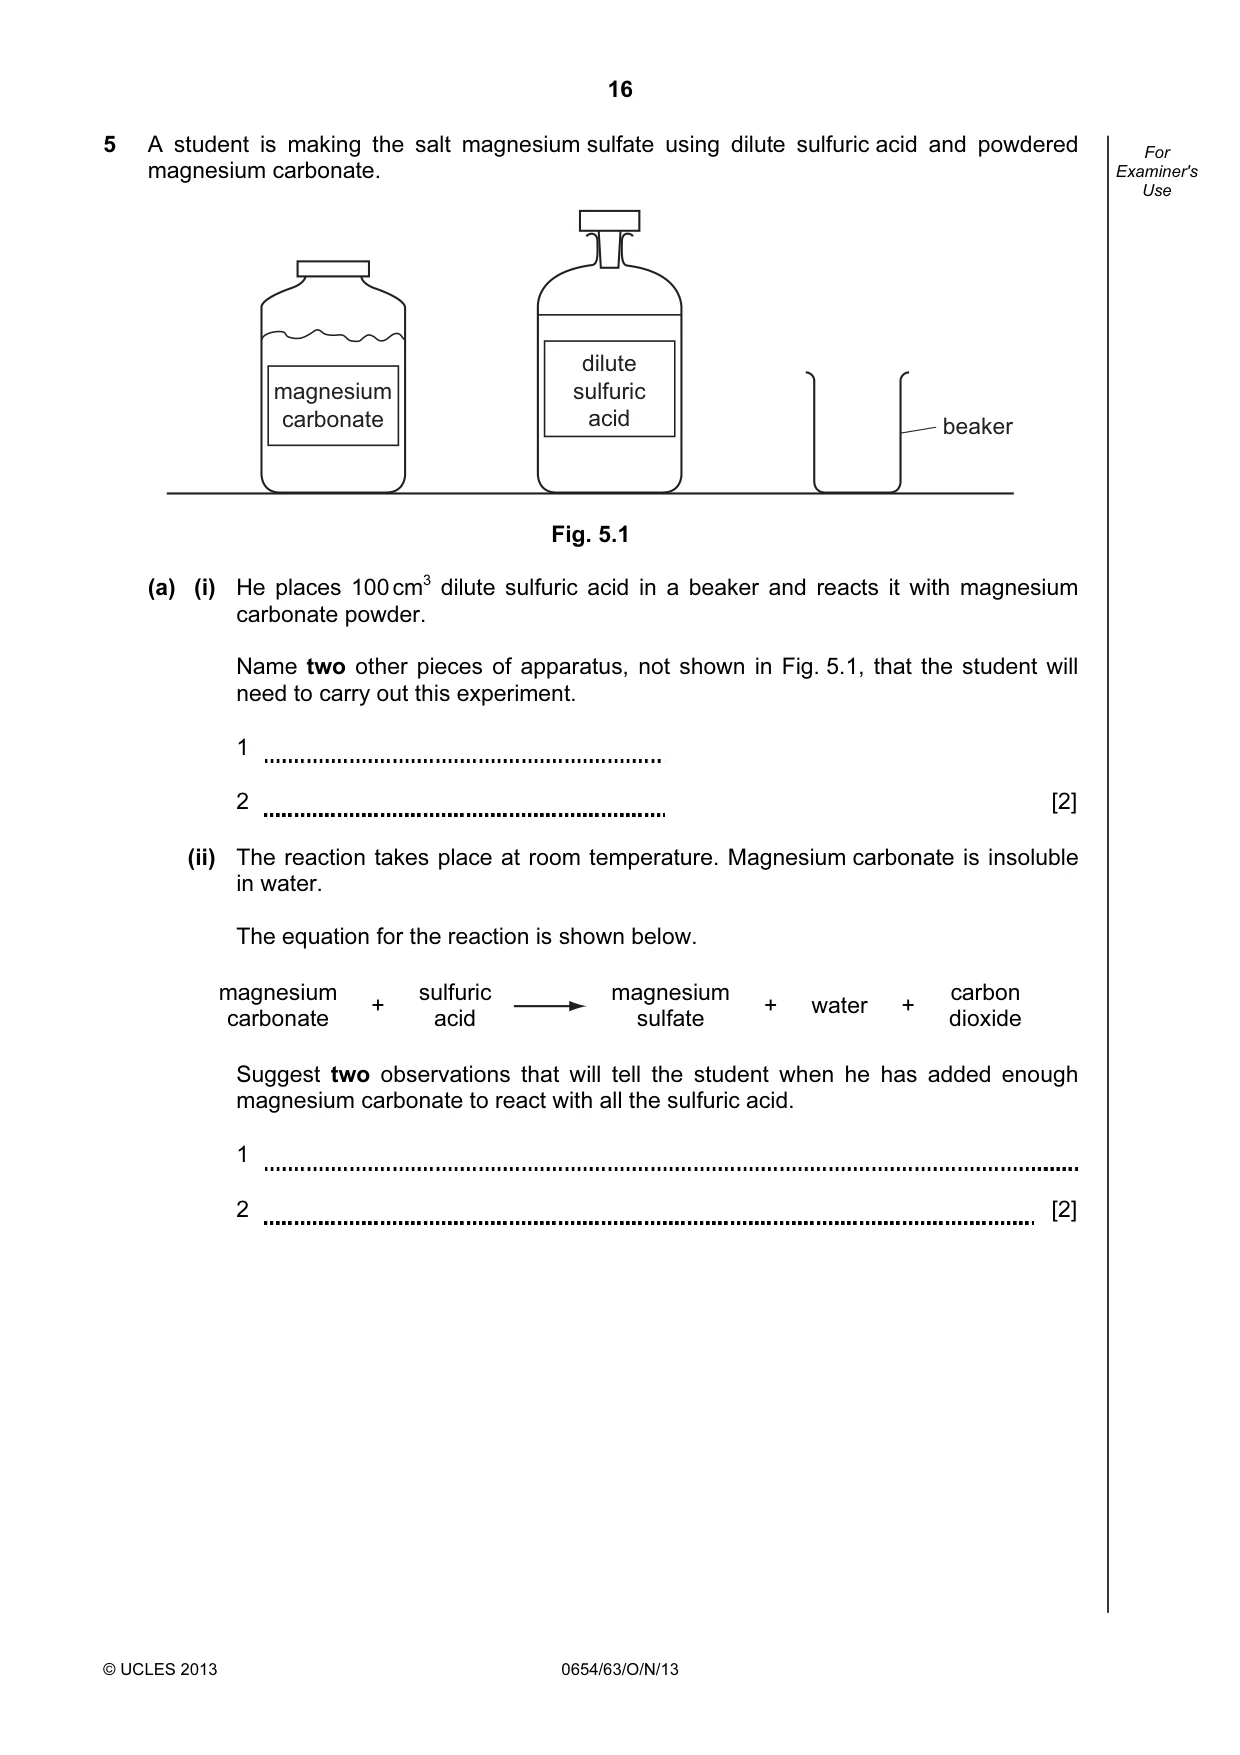
16 © UCLES 2013 0654/63/O/N/13 For Examiner's Use 5 A student is making the salt magnesium sulfate using dilute sulfuric acid and powdered magnesium carbonate. magnesium carbonate dilute sulfuric acid beaker Fig. 5.1 (a) (i) He places 100 cm3 dilute sulfuric acid in a beaker and reacts it with magnesium carbonate powder. Name two other pieces of apparatus, not shown in Fig. 5.1, that the student will need to carry out this experiment. 1 2 [2] (ii) The reaction takes place at room temperature. Magnesium carbonate is insoluble in water. The equation for the reaction is shown below. magnesium carbonate + sulfuric acid magnesium sulfate + water + carbon dioxide Suggest two observations that will tell the student when he has added enough magnesium carbonate to react with all the sulfuric acid. 1 2 [2]
Question paper, page 17
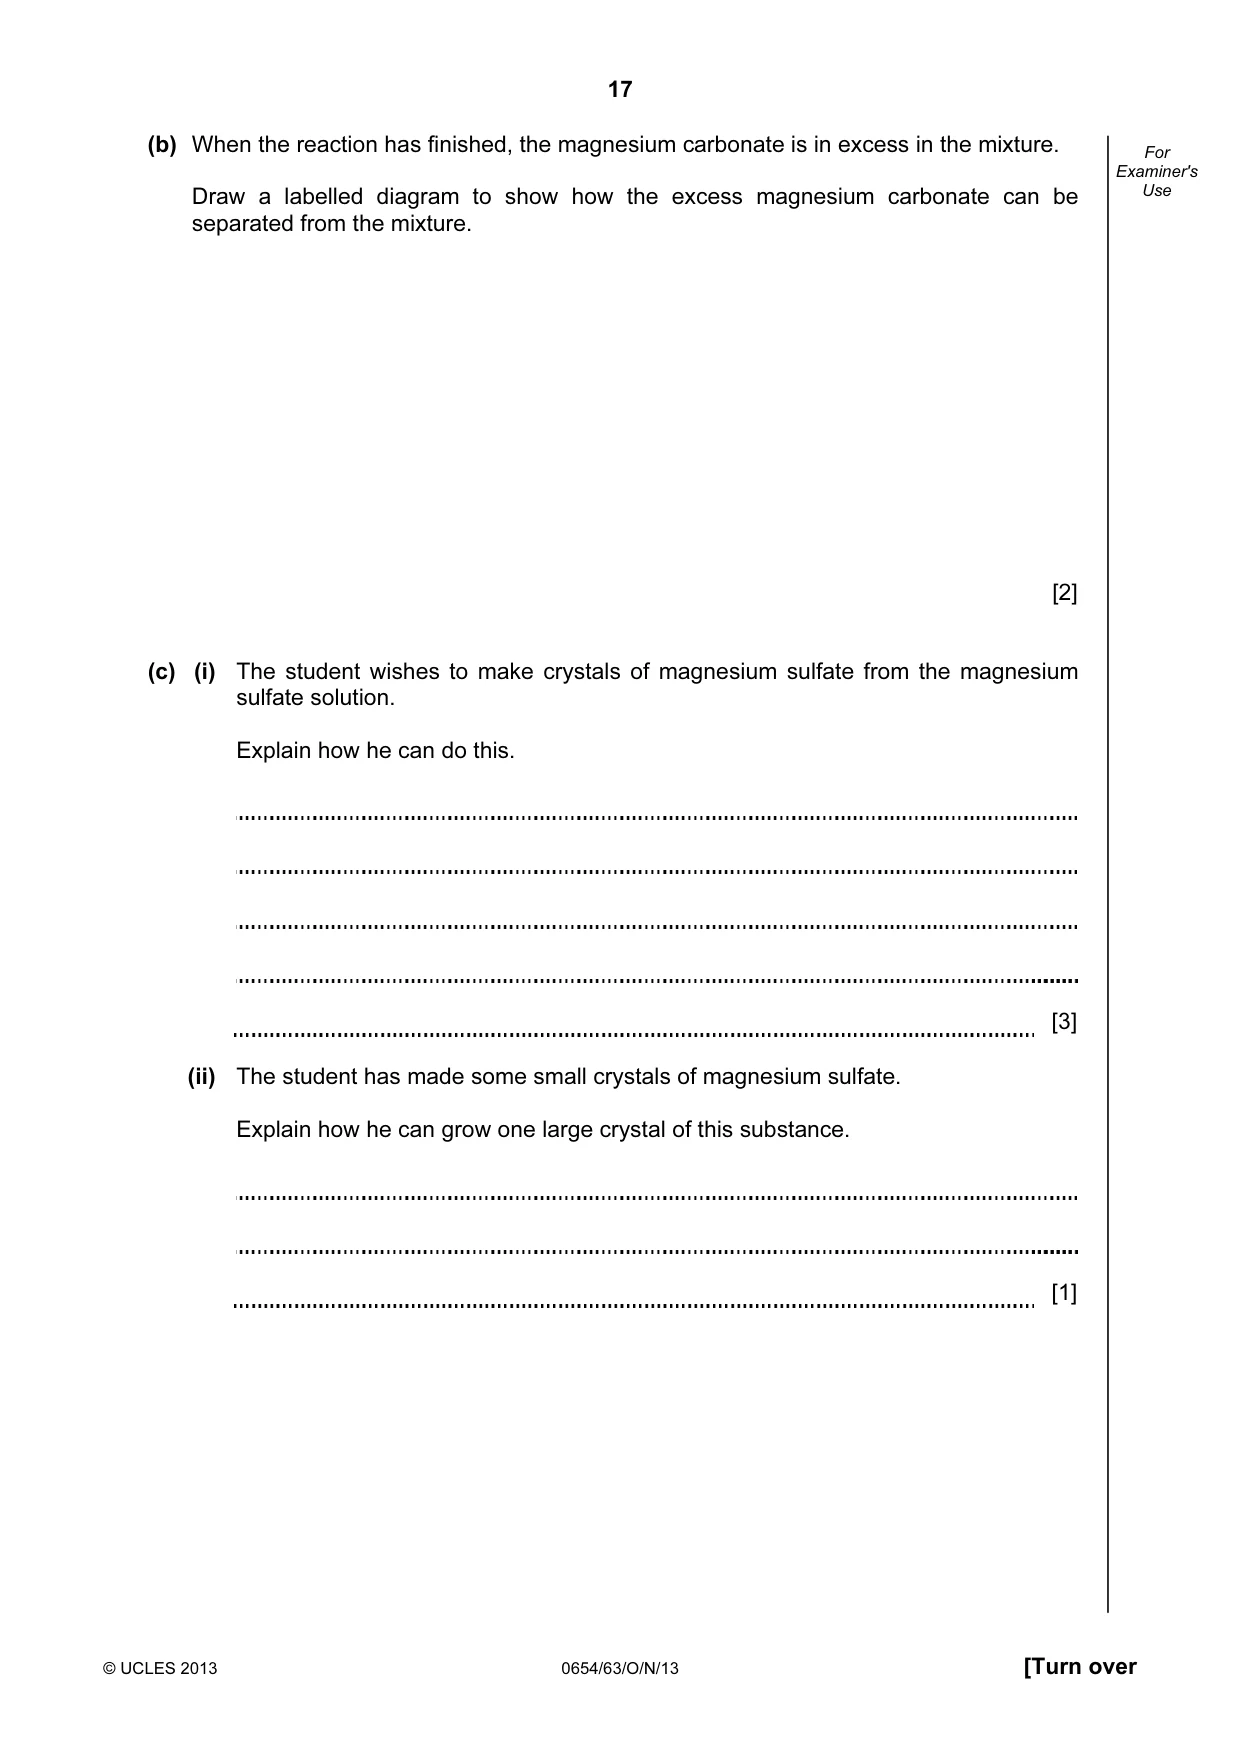
17 © UCLES 2013 0654/63/O/N/13 [Turn over For Examiner's Use (b) When the reaction has finished, the magnesium carbonate is in excess in the mixture. Draw a labelled diagram to show how the excess magnesium carbonate can be separated from the mixture. [2] (c) (i) The student wishes to make crystals of magnesium sulfate from the magnesium sulfate solution. Explain how he can do this. [3] (ii) The student has made some small crystals of magnesium sulfate. Explain how he can grow one large crystal of this substance. [1]
Question paper, page 18
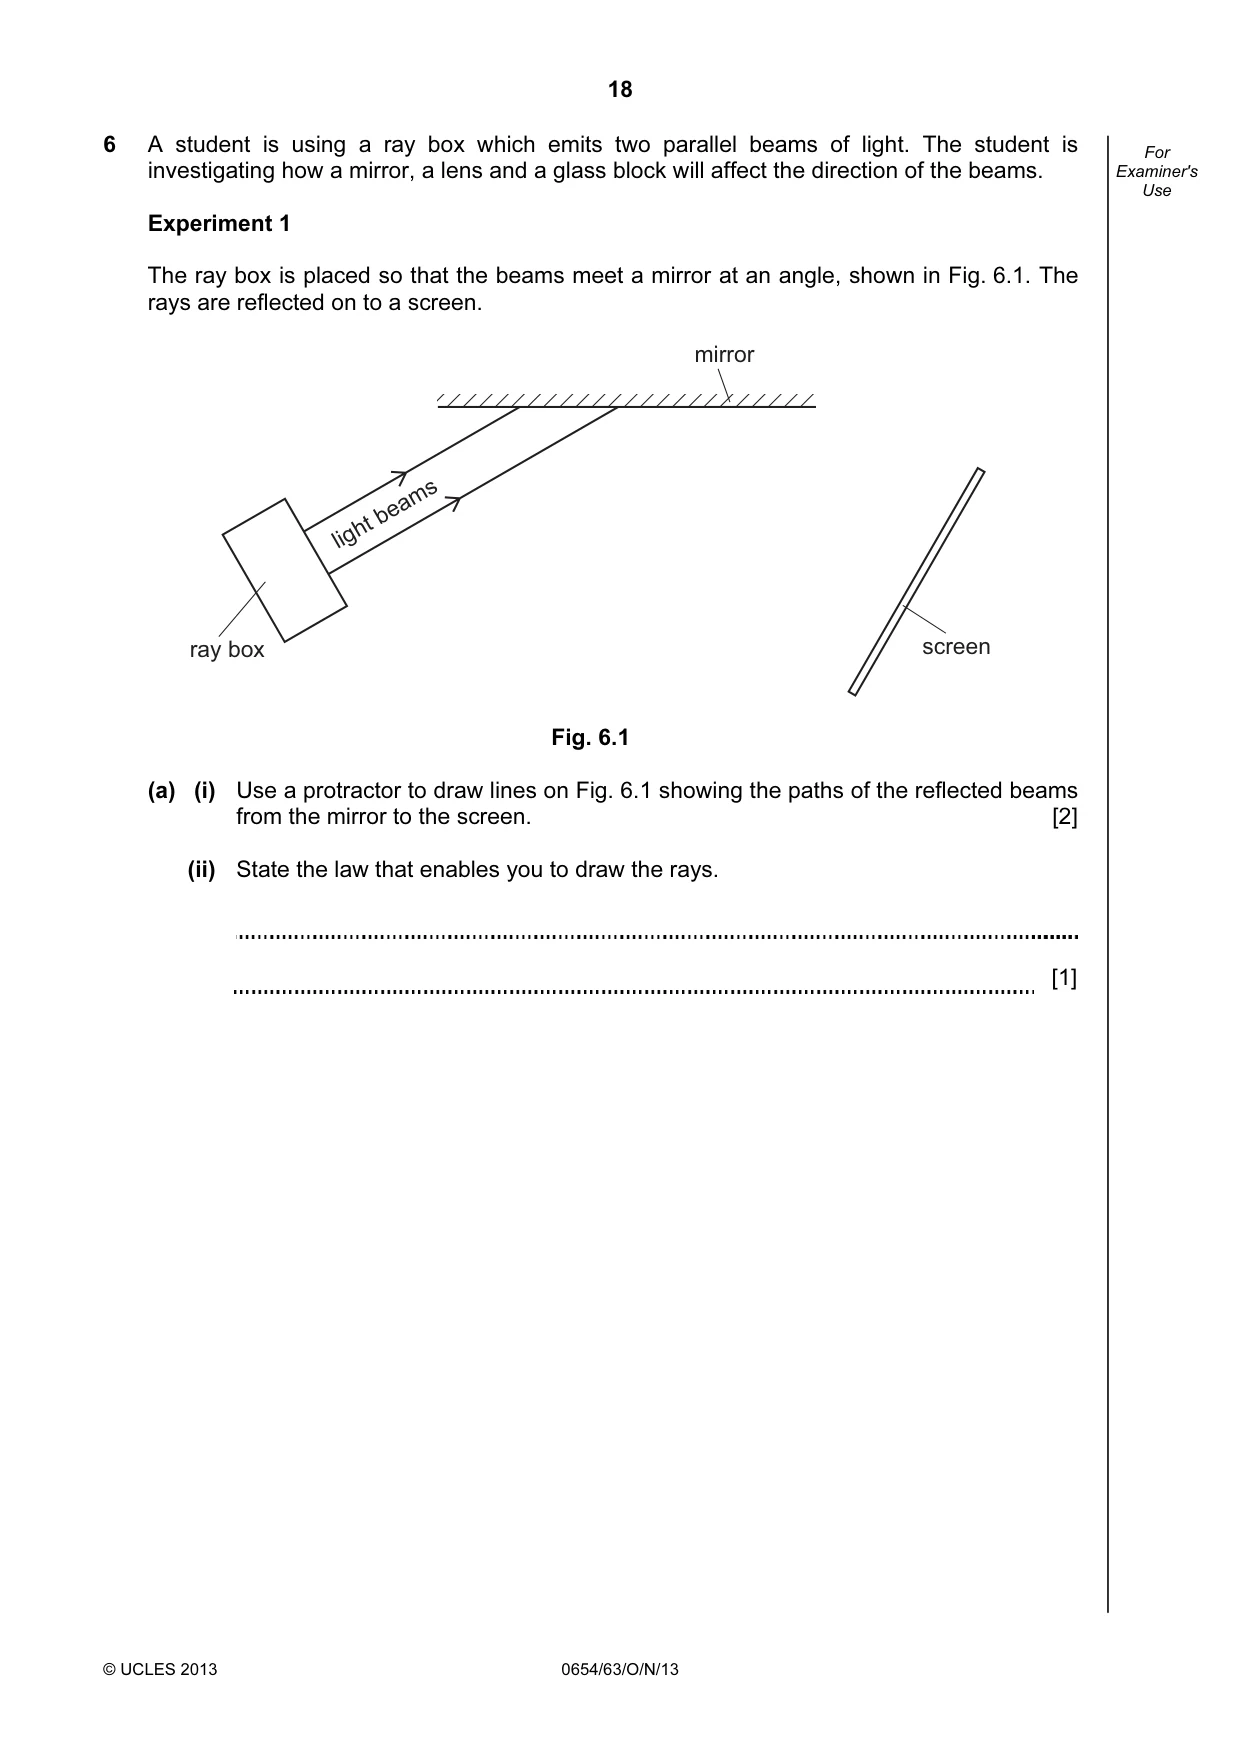
18 © UCLES 2013 0654/63/O/N/13 For Examiner's Use 6 A student is using a ray box which emits two parallel beams of light. The student is investigating how a mirror, a lens and a glass block will affect the direction of the beams. Experiment 1 The ray box is placed so that the beams meet a mirror at an angle, shown in Fig. 6.1. The rays are reflected on to a screen. screen ray box light beams mirror Fig. 6.1 (a) (i) Use a protractor to draw lines on Fig. 6.1 showing the paths of the reflected beams from the mirror to the screen. [2] (ii) State the law that enables you to draw the rays. [1]
Question paper, page 19
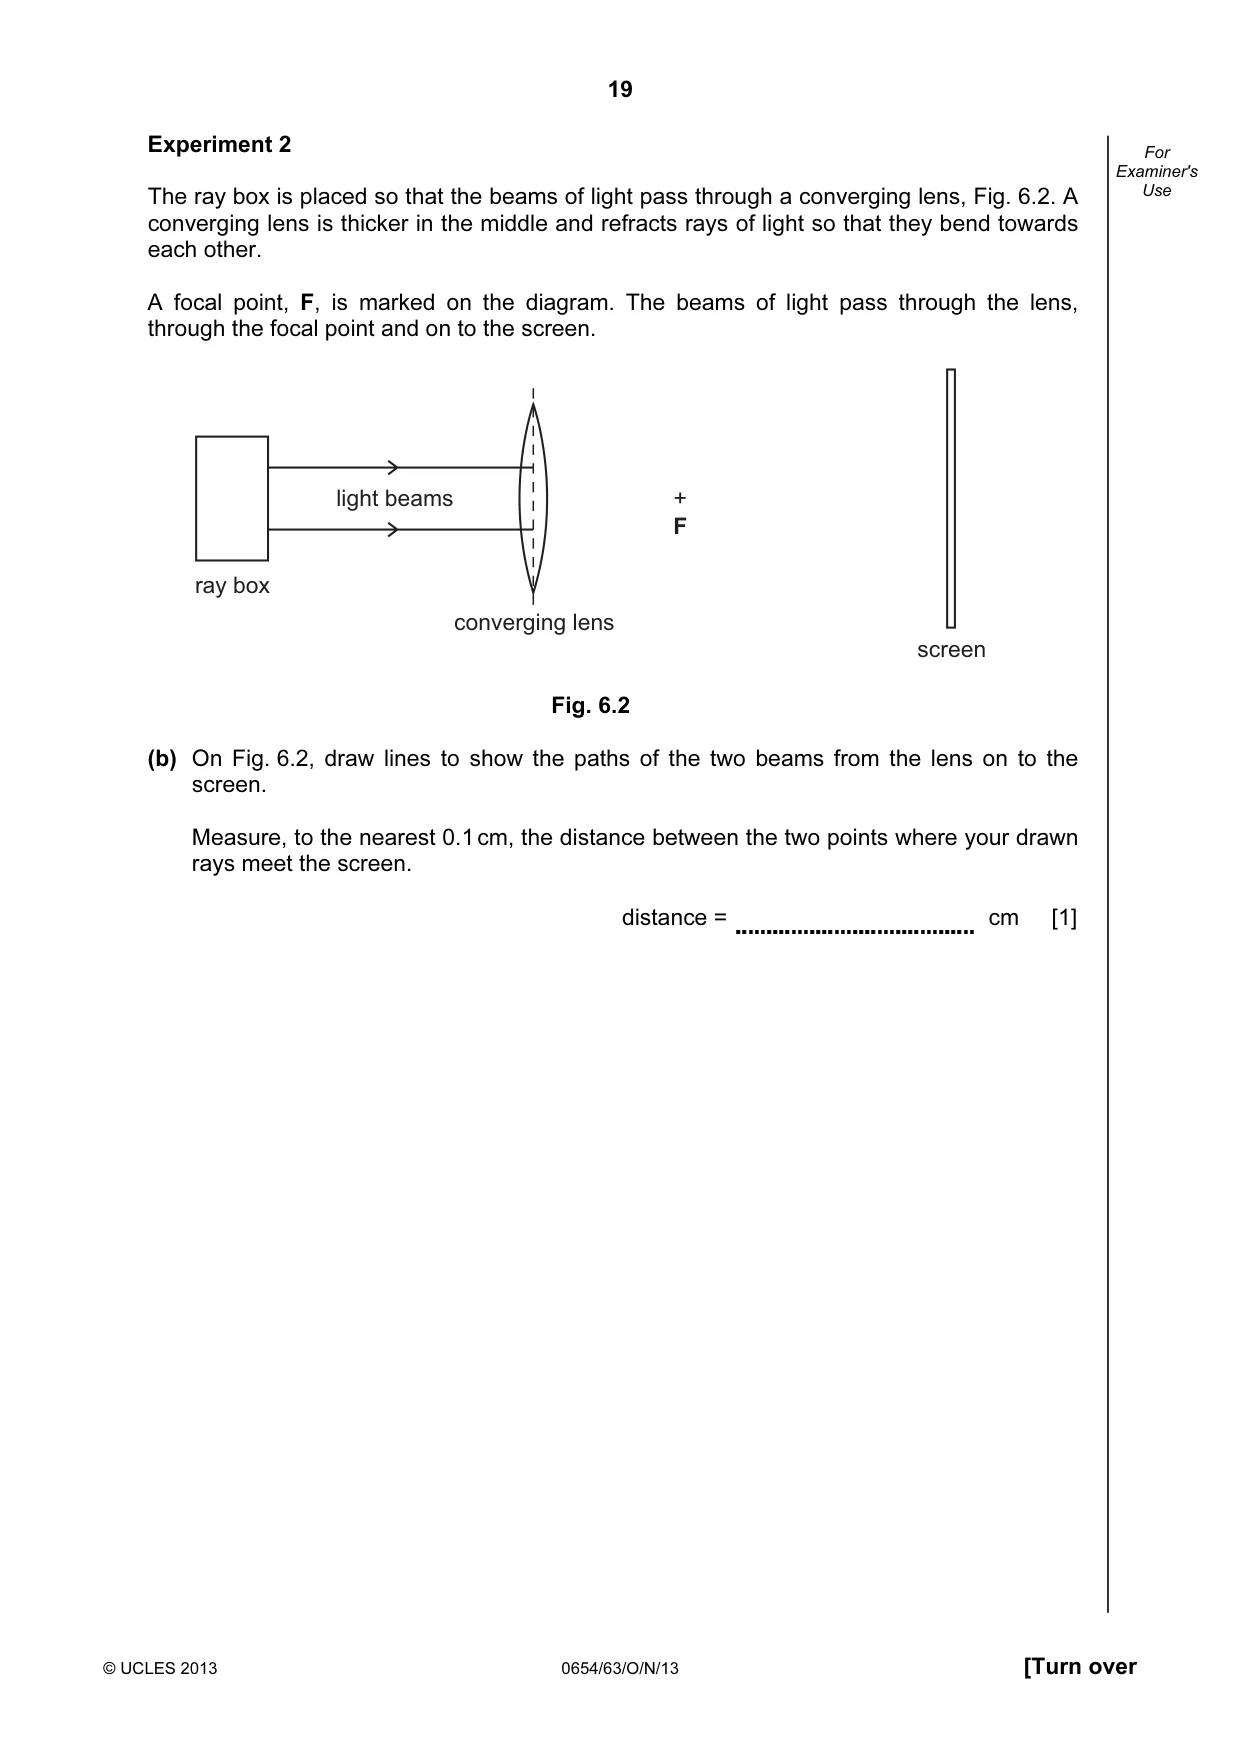
19 © UCLES 2013 0654/63/O/N/13 [Turn over For Examiner's Use Experiment 2 The ray box is placed so that the beams of light pass through a converging lens, Fig. 6.2. A converging lens is thicker in the middle and refracts rays of light so that they bend towards each other. A focal point, F, is marked on the diagram. The beams of light pass through the lens, through the focal point and on to the screen. + F light beams ray box converging lens screen Fig. 6.2 (b) On Fig. 6.2, draw lines to show the paths of the two beams from the lens on to the screen. Measure, to the nearest 0.1 cm, the distance between the two points where your drawn rays meet the screen. distance = cm [1]
Question paper, page 20
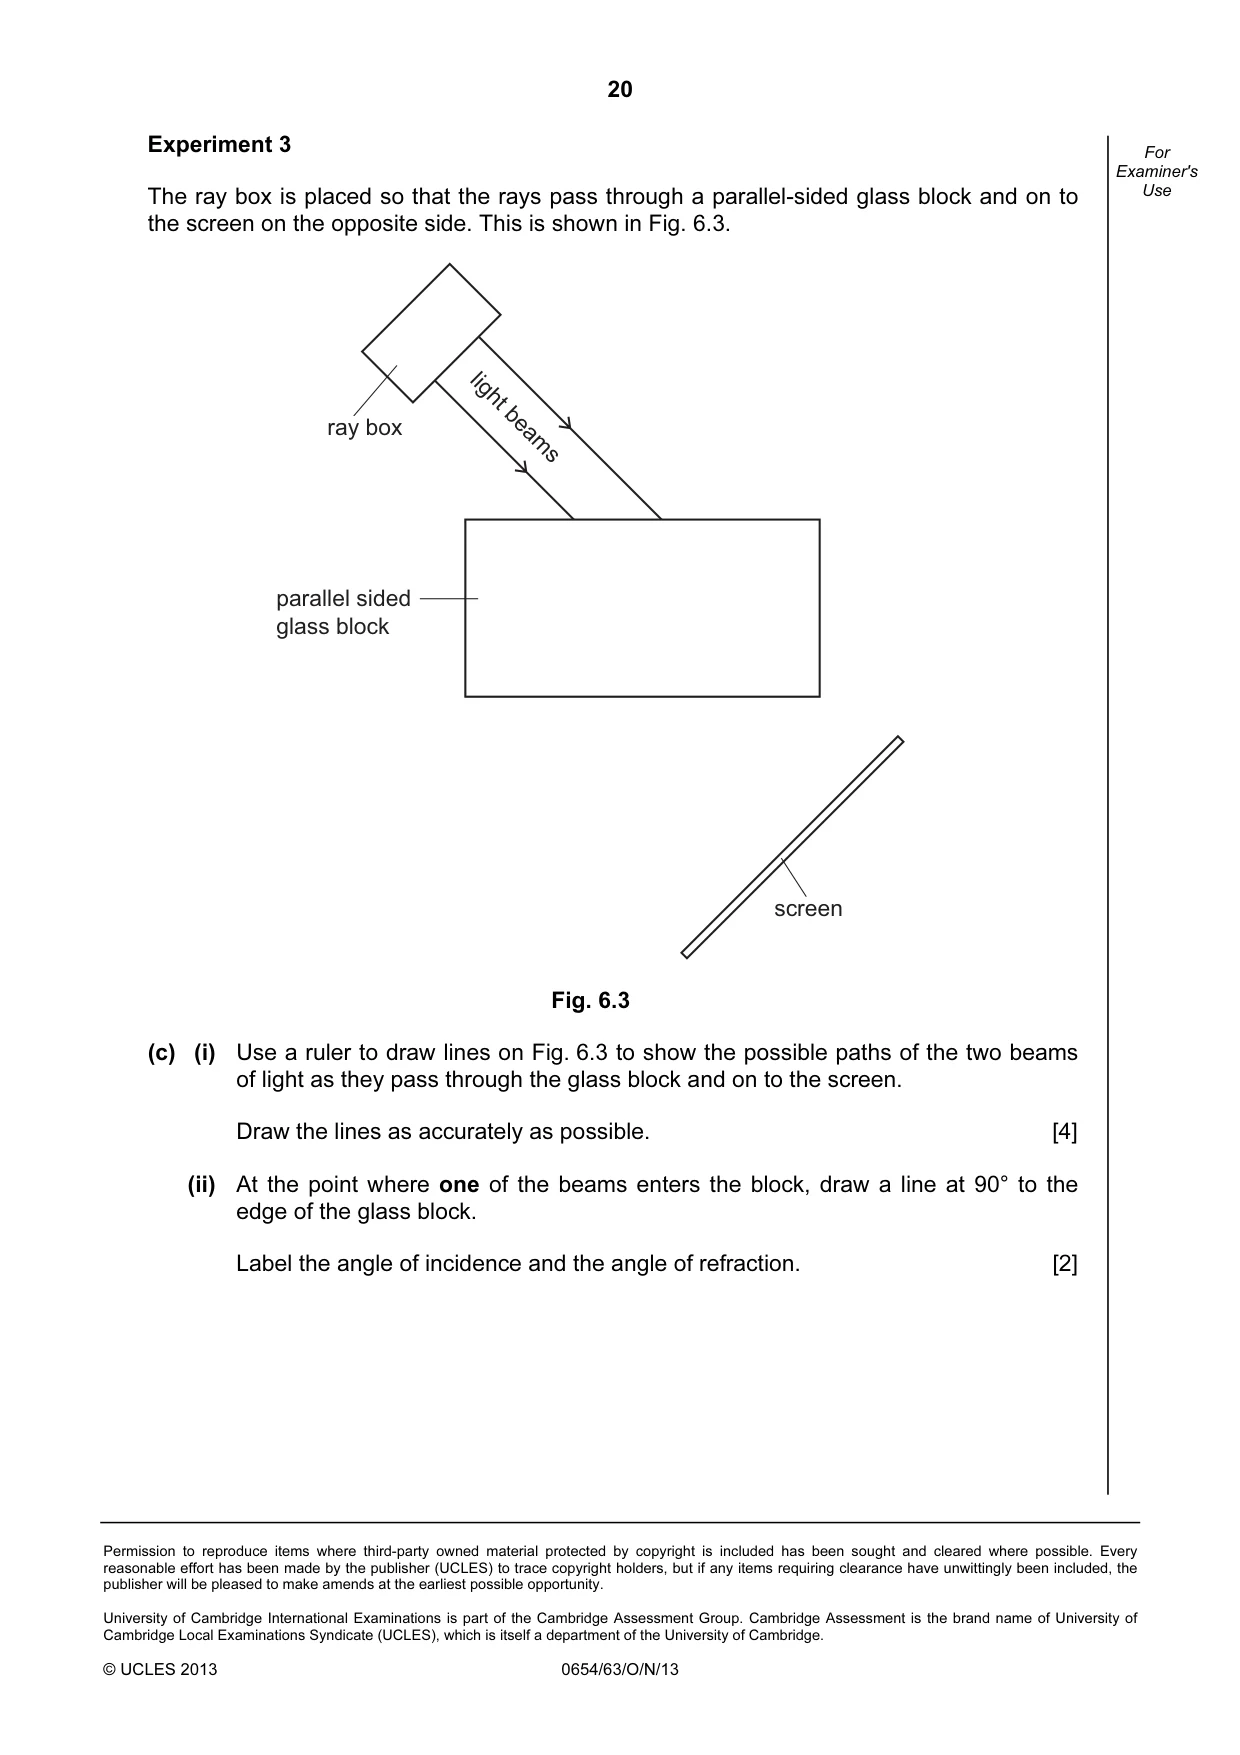
20 Permission to reproduce items where third-party owned material protected by copyright is included has been sought and cleared where possible. Every reasonable effort has been made by the publisher (UCLES) to trace copyright holders, but if any items requiring clearance have unwittingly been included, the publisher will be pleased to make amends at the earliest possible opportunity. University of Cambridge International Examinations is part of the Cambridge Assessment Group. Cambridge Assessment is the brand name of University of Cambridge Local Examinations Syndicate (UCLES), which is itself a department of the University of Cambridge. © UCLES 2013 0654/63/O/N/13 For Examiner's Use Experiment 3 The ray box is placed so that the rays pass through a parallel-sided glass block and on to the screen on the opposite side. This is shown in Fig. 6.3. light beams ray box screen parallel sided glass block Fig. 6.3 (c) (i) Use a ruler to draw lines on Fig. 6.3 to show the possible paths of the two beams of light as they pass through the glass block and on to the screen. Draw the lines as accurately as possible. [4] (ii) At the point where one of the beams enters the block, draw a line at 90° to the edge of the glass block. Label the angle of incidence and the angle of refraction. [2]
Mark scheme, page 1
CAMBRIDGE INTERNATIONAL EXAMINATIONS International General Certificate of Secondary Education MARK SCHEME for the October/November 2013 series 0654 CO-ORDINATED SCIENCES 0654/63 Paper 6 (Alternative to Practical), maximum raw mark 60 This mark scheme is published as an aid to teachers and candidates, to indicate the requirements of the examination. It shows the basis on which Examiners were instructed to award marks. It does not indicate the details of the discussions that took place at an Examiners’ meeting before marking began, which would have considered the acceptability of alternative answers. Mark schemes should be read in conjunction with the question paper and the Principal Examiner Report for Teachers. Cambridge will not enter into discussions about these mark schemes. Cambridge is publishing the mark schemes for the October/November 2013 series for most IGCSE, GCE Advanced Level and Advanced Subsidiary Level components and some Ordinary Level components.
Mark scheme, page 2
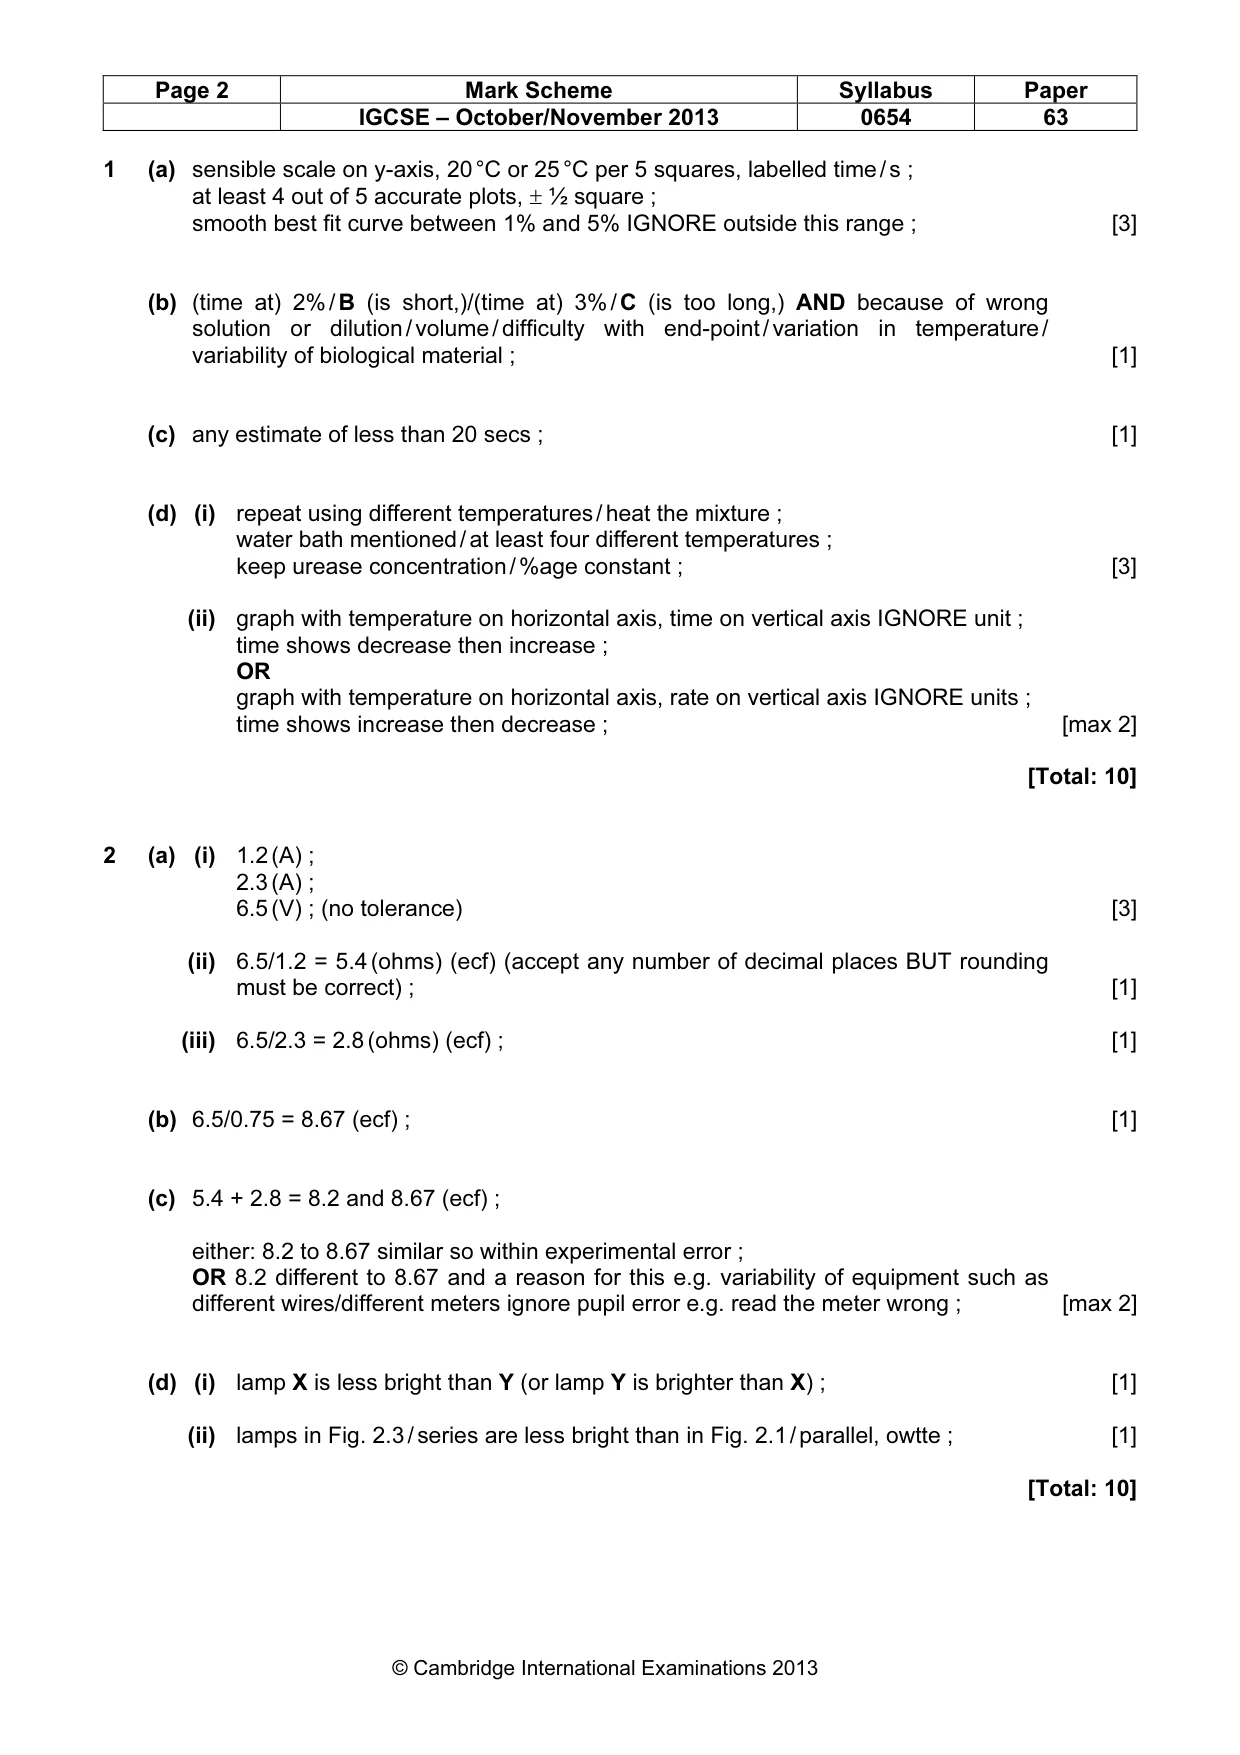
Page 2 Mark Scheme Syllabus Paper IGCSE – October/November 2013 0654 63 © Cambridge International Examinations 2013 1 (a) sensible scale on y-axis, 20 °C or 25 °C per 5 squares, labelled time / s ; at least 4 out of 5 accurate plots, ± ½ square ; smooth best fit curve between 1% and 5% IGNORE outside this range ; [3] (b) (time at) 2% / B (is short,)/(time at) 3% / C (is too long,) AND because of wrong solution or dilution / volume / difficulty with end-point / variation in temperature / variability of biological material ; [1] (c) any estimate of less than 20 secs ; [1] (d) (i) repeat using different temperatures / heat the mixture ; water bath mentioned / at least four different temperatures ; keep urease concentration / %age constant ; [3] (ii) graph with temperature on horizontal axis, time on vertical axis IGNORE unit ; time shows decrease then increase ; OR graph with temperature on horizontal axis, rate on vertical axis IGNORE units ; time shows increase then decrease ; [max 2] [Total: 10] 2 (a) (i) 1.2 (A) ; 2.3 (A) ; 6.5 (V) ; (no tolerance) [3] (ii) 6.5/1.2 = 5.4 (ohms) (ecf) (accept any number of decimal places BUT rounding must be correct) ; [1] (iii) 6.5/2.3 = 2.8 (ohms) (ecf) ; [1] (b) 6.5/0.75 = 8.67 (ecf) ; [1] (c) 5.4 + 2.8 = 8.2 and 8.67 (ecf) ; either: 8.2 to 8.67 similar so within experimental error ; OR 8.2 different to 8.67 and a reason for this e.g. variability of equipment such as different wires/different meters ignore pupil error e.g. read the meter wrong ; [max 2] (d) (i) lamp X is less bright than Y (or lamp Y is brighter than X) ; [1] (ii) lamps in Fig. 2.3 / series are less bright than in Fig. 2.1 / parallel, owtte ; [1] [Total: 10]
Mark scheme, page 3
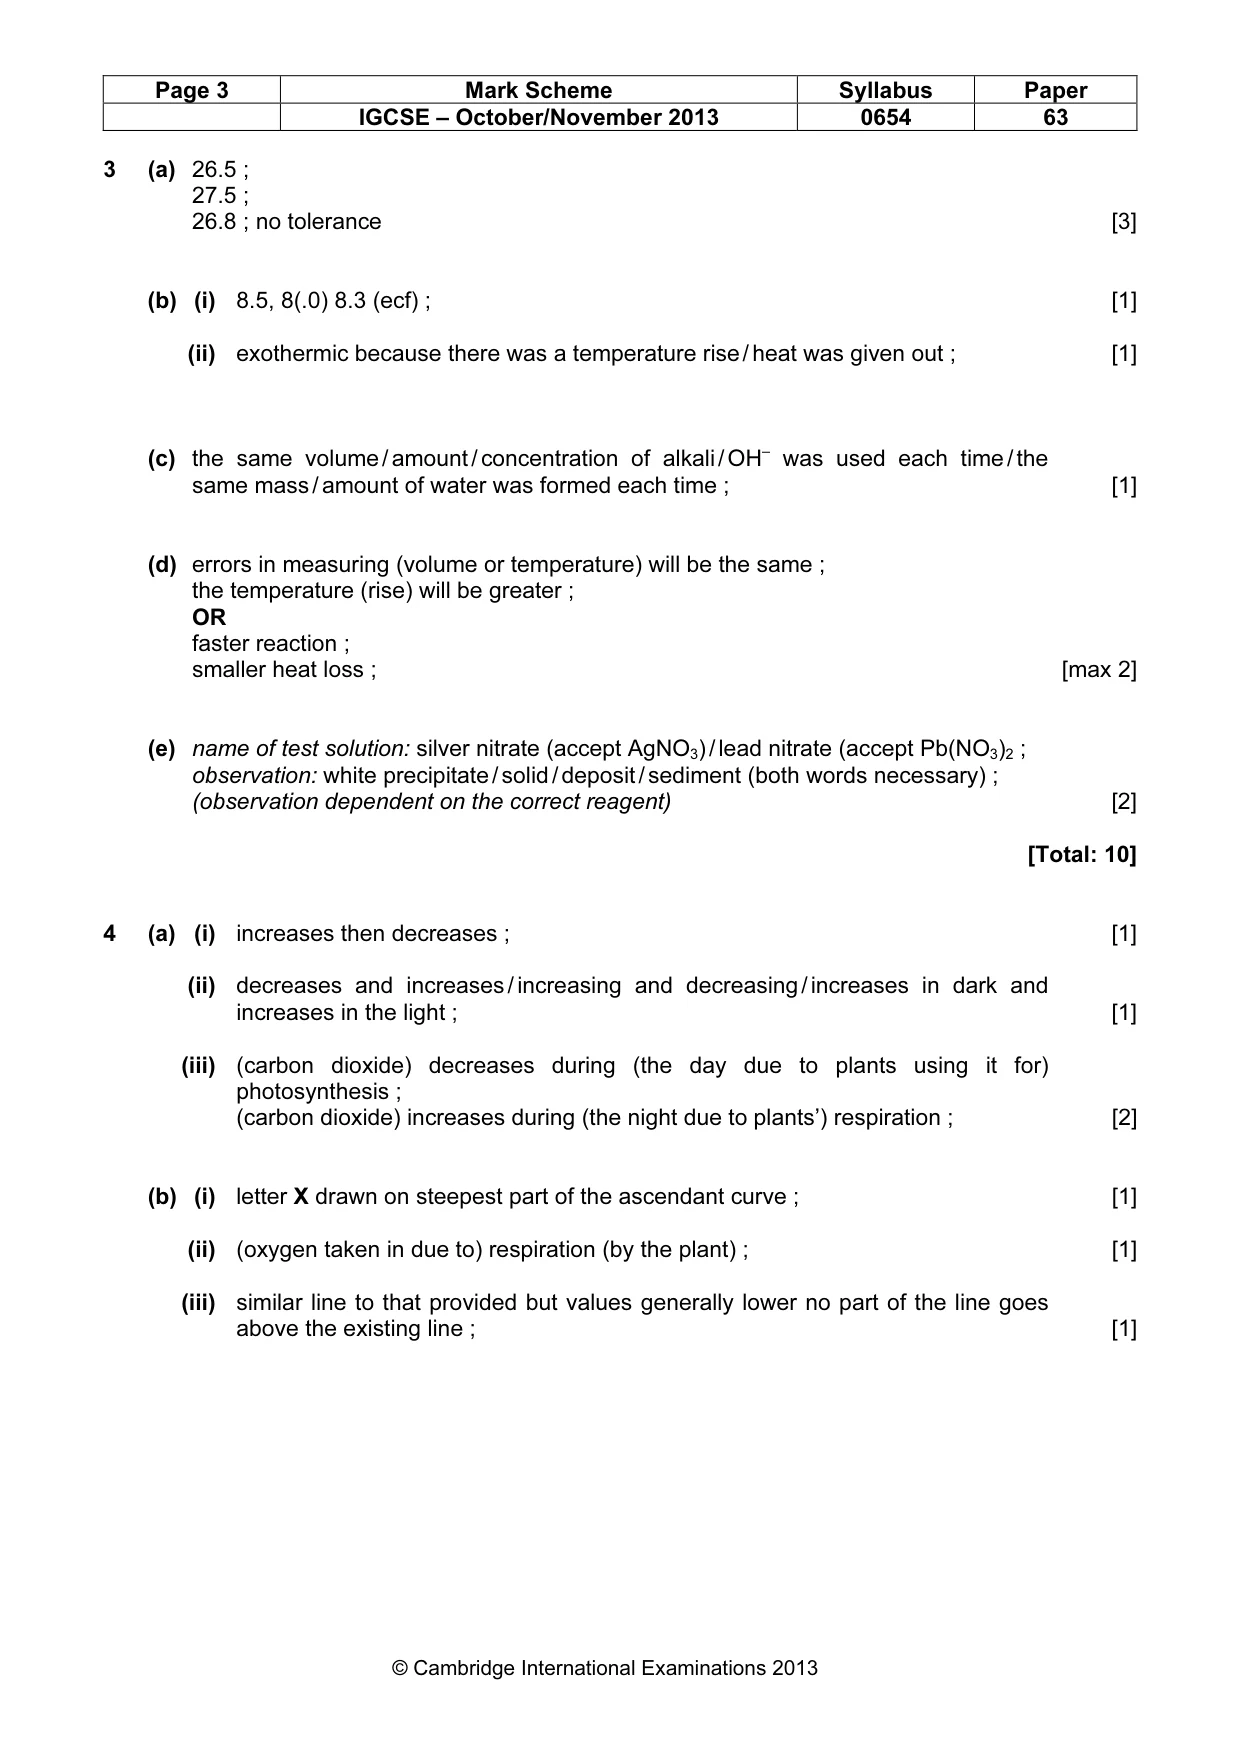
Page 3 Mark Scheme Syllabus Paper IGCSE – October/November 2013 0654 63 © Cambridge International Examinations 2013 3 (a) 26.5 ; 27.5 ; 26.8 ; no tolerance [3] (b) (i) 8.5, 8(.0) 8.3 (ecf) ; [1] (ii) exothermic because there was a temperature rise / heat was given out ; [1] (c) the same volume / amount / concentration of alkali / OH– was used each time / the same mass / amount of water was formed each time ; [1] (d) errors in measuring (volume or temperature) will be the same ; the temperature (rise) will be greater ; OR faster reaction ; smaller heat loss ; [max 2] (e) name of test solution: silver nitrate (accept AgNO3) / lead nitrate (accept Pb(NO3)2 ; observation: white precipitate / solid / deposit / sediment (both words necessary) ; (observation dependent on the correct reagent) [2] [Total: 10] 4 (a) (i) increases then decreases ; [1] (ii) decreases and increases / increasing and decreasing / increases in dark and increases in the light ; [1] (iii) (carbon dioxide) decreases during (the day due to plants using it for) photosynthesis ; (carbon dioxide) increases during (the night due to plants’) respiration ; [2] (b) (i) letter X drawn on steepest part of the ascendant curve ; [1] (ii) (oxygen taken in due to) respiration (by the plant) ; [1] (iii) similar line to that provided but values generally lower no part of the line goes above the existing line ; [1]
Mark scheme, page 4
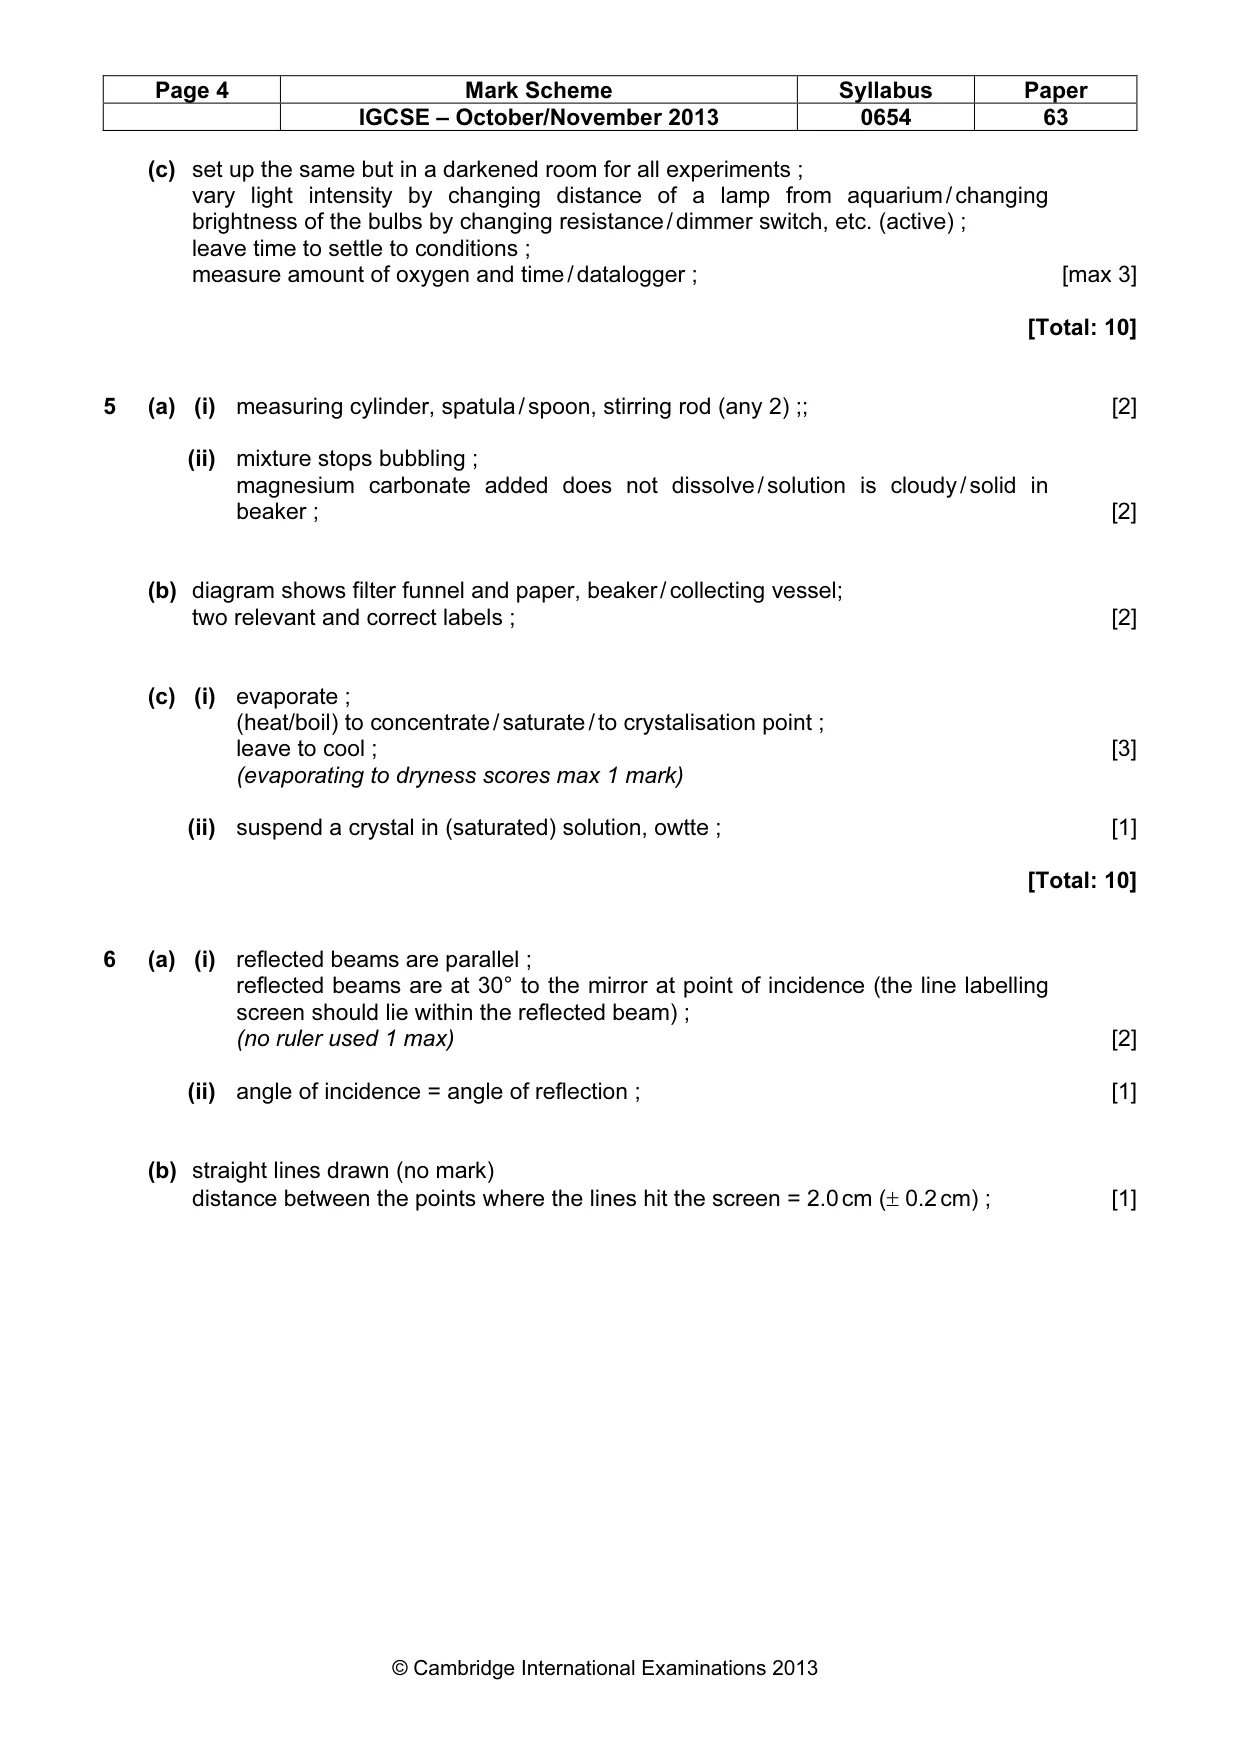
Page 4 Mark Scheme Syllabus Paper IGCSE – October/November 2013 0654 63 © Cambridge International Examinations 2013 (c) set up the same but in a darkened room for all experiments ; vary light intensity by changing distance of a lamp from aquarium / changing brightness of the bulbs by changing resistance / dimmer switch, etc. (active) ; leave time to settle to conditions ; measure amount of oxygen and time / datalogger ; [max 3] [Total: 10] 5 (a) (i) measuring cylinder, spatula / spoon, stirring rod (any 2) ;; [2] (ii) mixture stops bubbling ; magnesium carbonate added does not dissolve / solution is cloudy / solid in beaker ; [2] (b) diagram shows filter funnel and paper, beaker / collecting vessel; two relevant and correct labels ; [2] (c) (i) evaporate ; (heat/boil) to concentrate / saturate / to crystalisation point ; leave to cool ; [3] (evaporating to dryness scores max 1 mark) (ii) suspend a crystal in (saturated) solution, owtte ; [1] [Total: 10] 6 (a) (i) reflected beams are parallel ; reflected beams are at 30° to the mirror at point of incidence (the line labelling screen should lie within the reflected beam) ; (no ruler used 1 max) [2] (ii) angle of incidence = angle of reflection ; [1] (b) straight lines drawn (no mark) distance between the points where the lines hit the screen = 2.0 cm (± 0.2 cm) ; [1]
Mark scheme, page 5
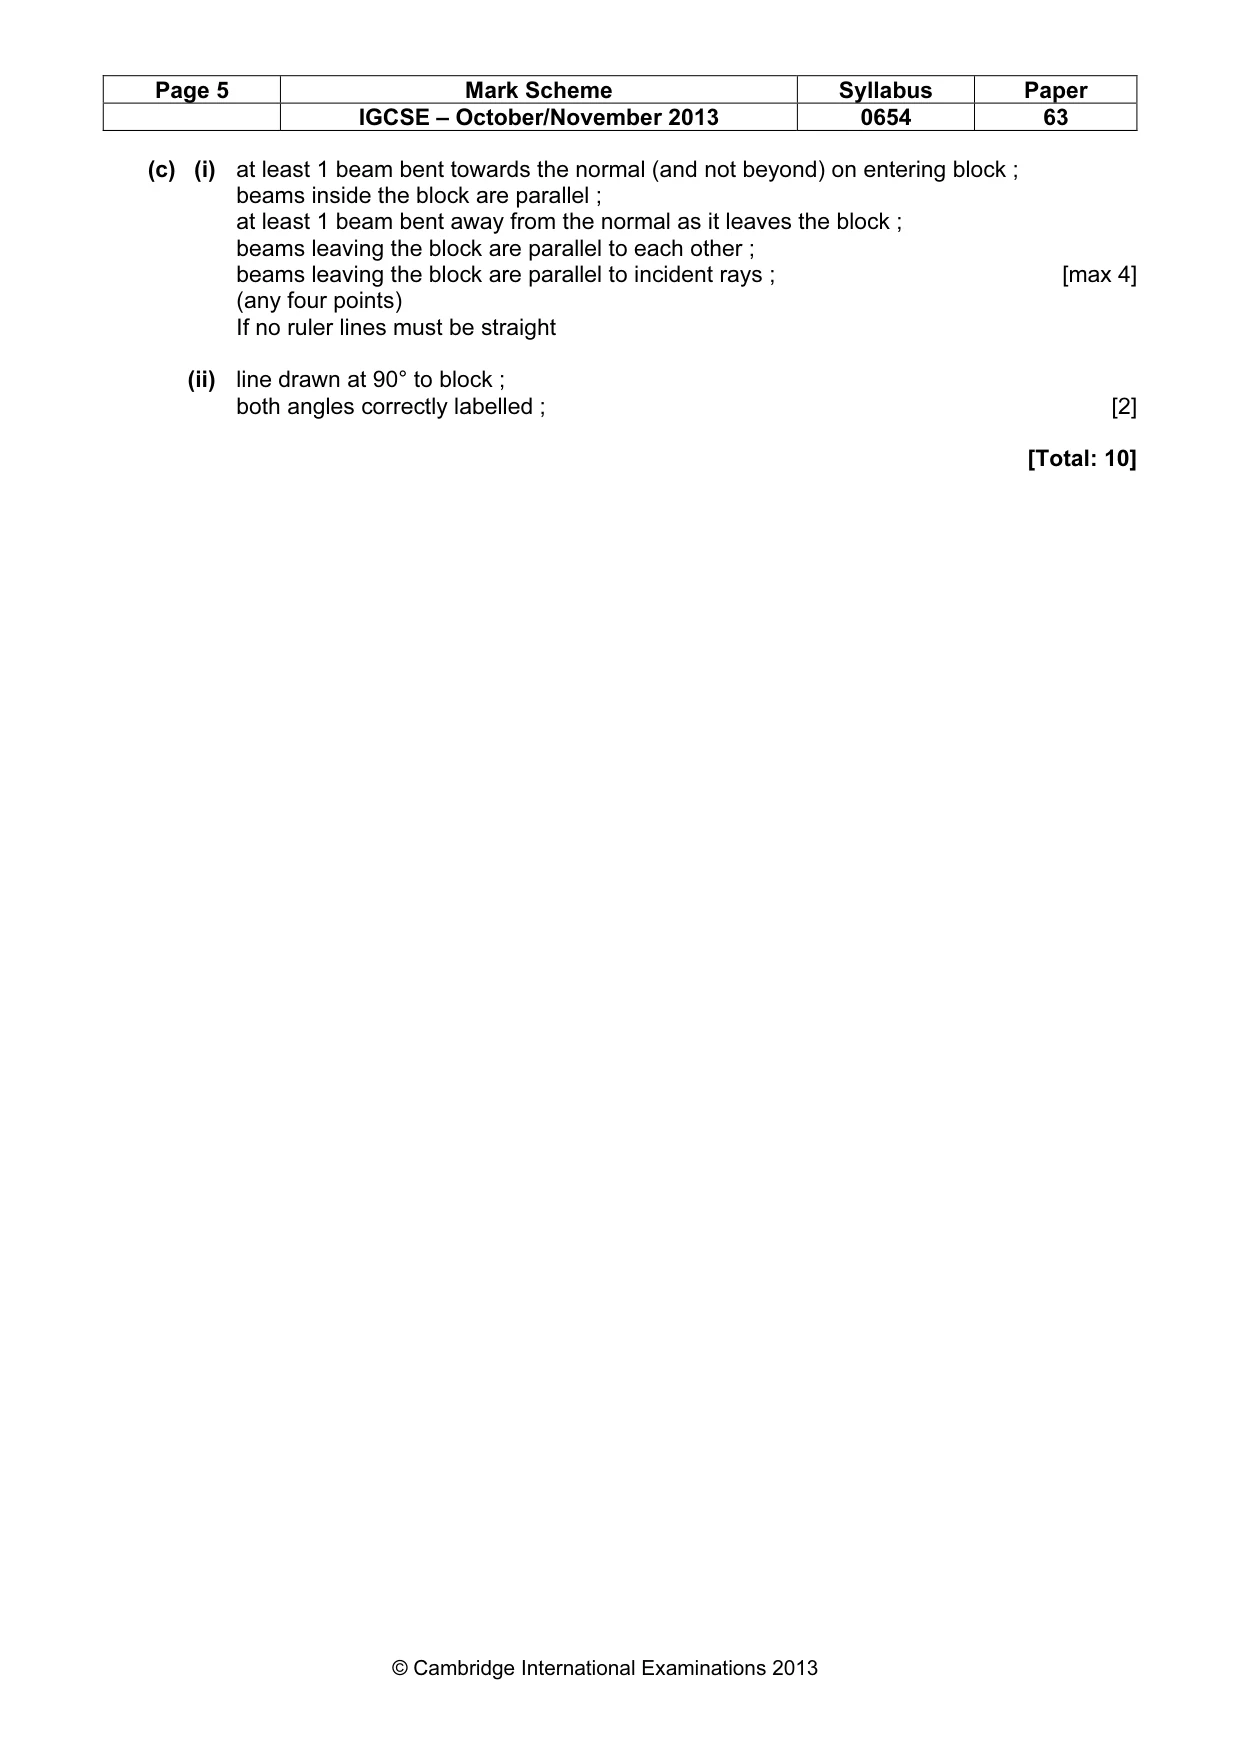
Page 5 Mark Scheme Syllabus Paper IGCSE – October/November 2013 0654 63 © Cambridge International Examinations 2013 (c) (i) at least 1 beam bent towards the normal (and not beyond) on entering block ; beams inside the block are parallel ; at least 1 beam bent away from the normal as it leaves the block ; beams leaving the block are parallel to each other ; beams leaving the block are parallel to incident rays ; [max 4] (any four points) If no ruler lines must be straight (ii) line drawn at 90° to block ; both angles correctly labelled ; [2] [Total: 10]