Cambridge IGCSE Science - Combined 0653 — 2025 May/June Paper 5 · Variant 2
0653/52/M/J/25 · 4 questions · 40 marks · 75 min
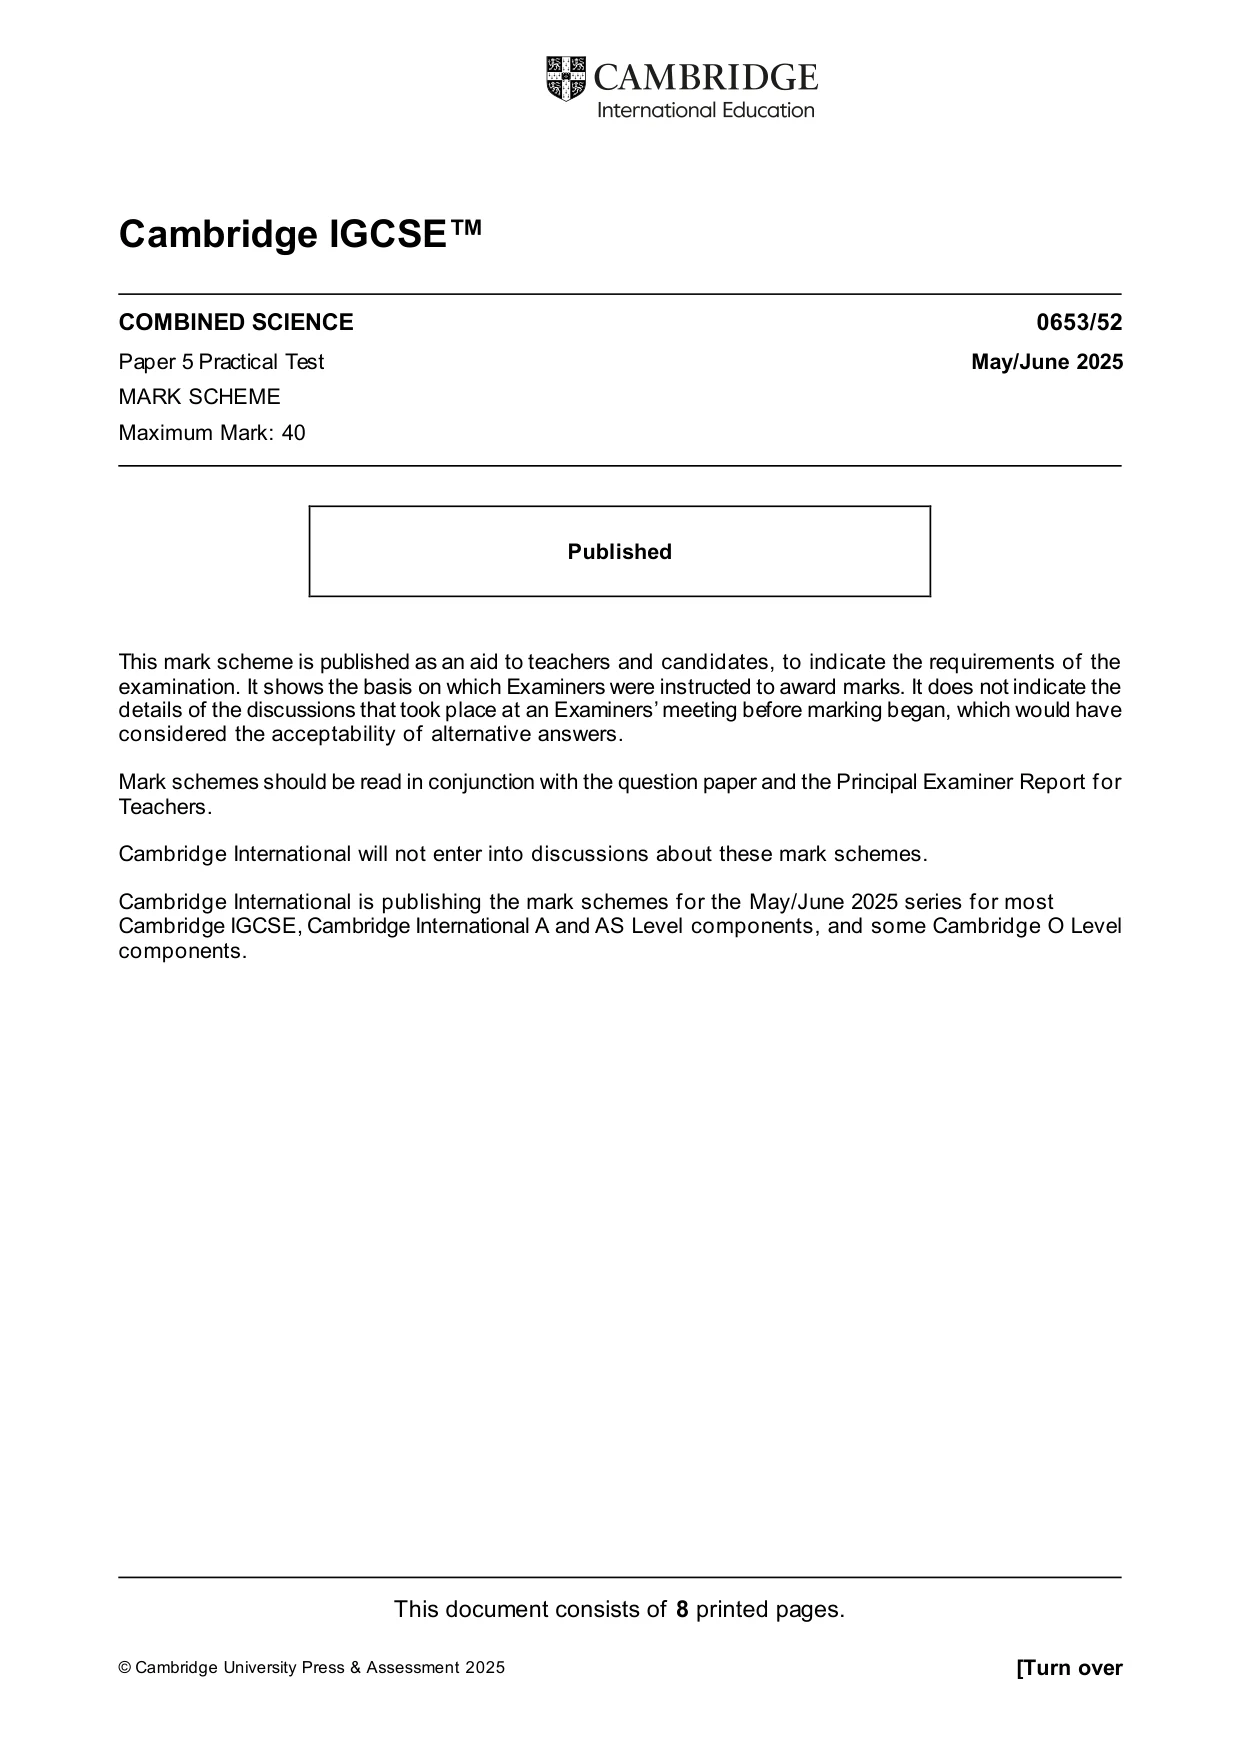
The question paper and its mark scheme, free to read here and free to download. This is Cambridge’s own paper, exactly as it was sat.
Question paper16 pages



Mark scheme8 pages
Answers below. Sit the paper first if you are practising.
Questions as text
Q1 · You are going to investigate a root vegetable
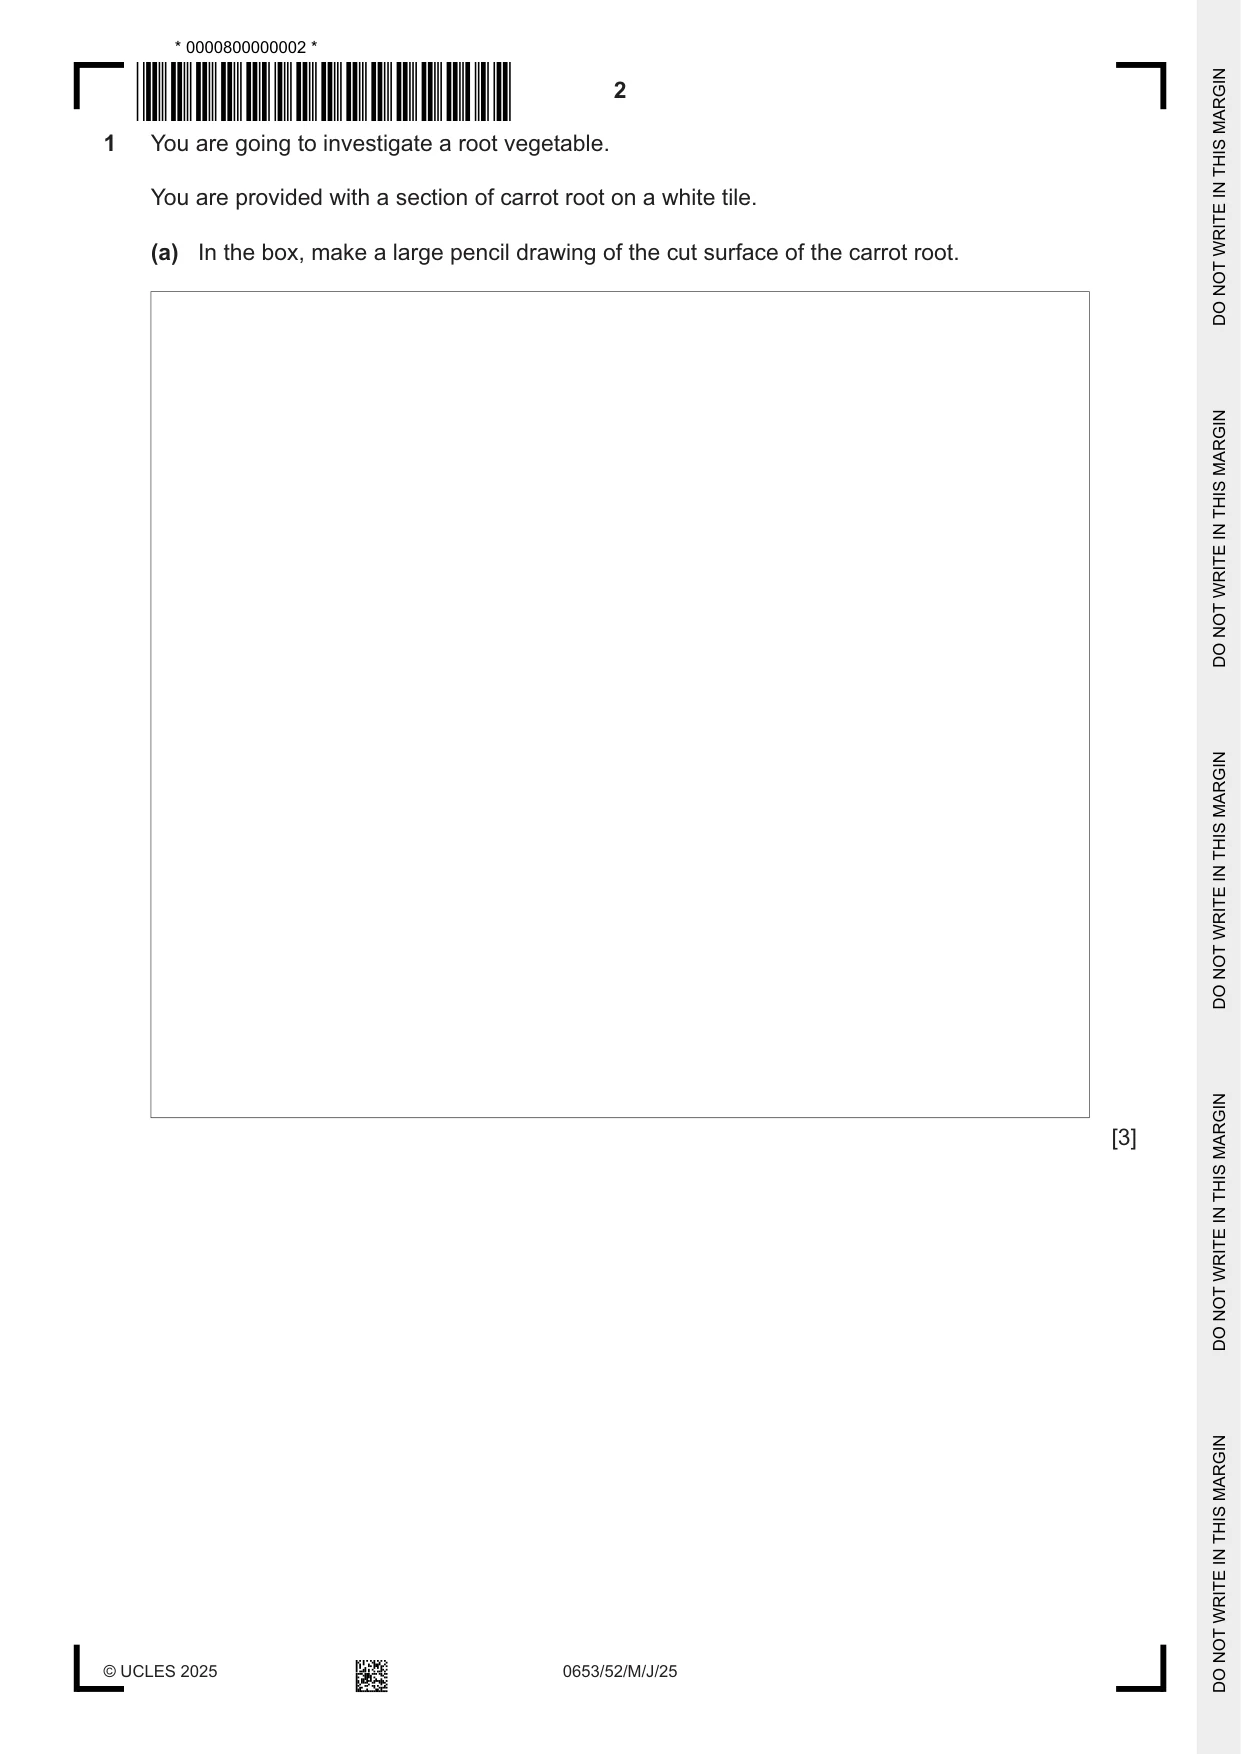
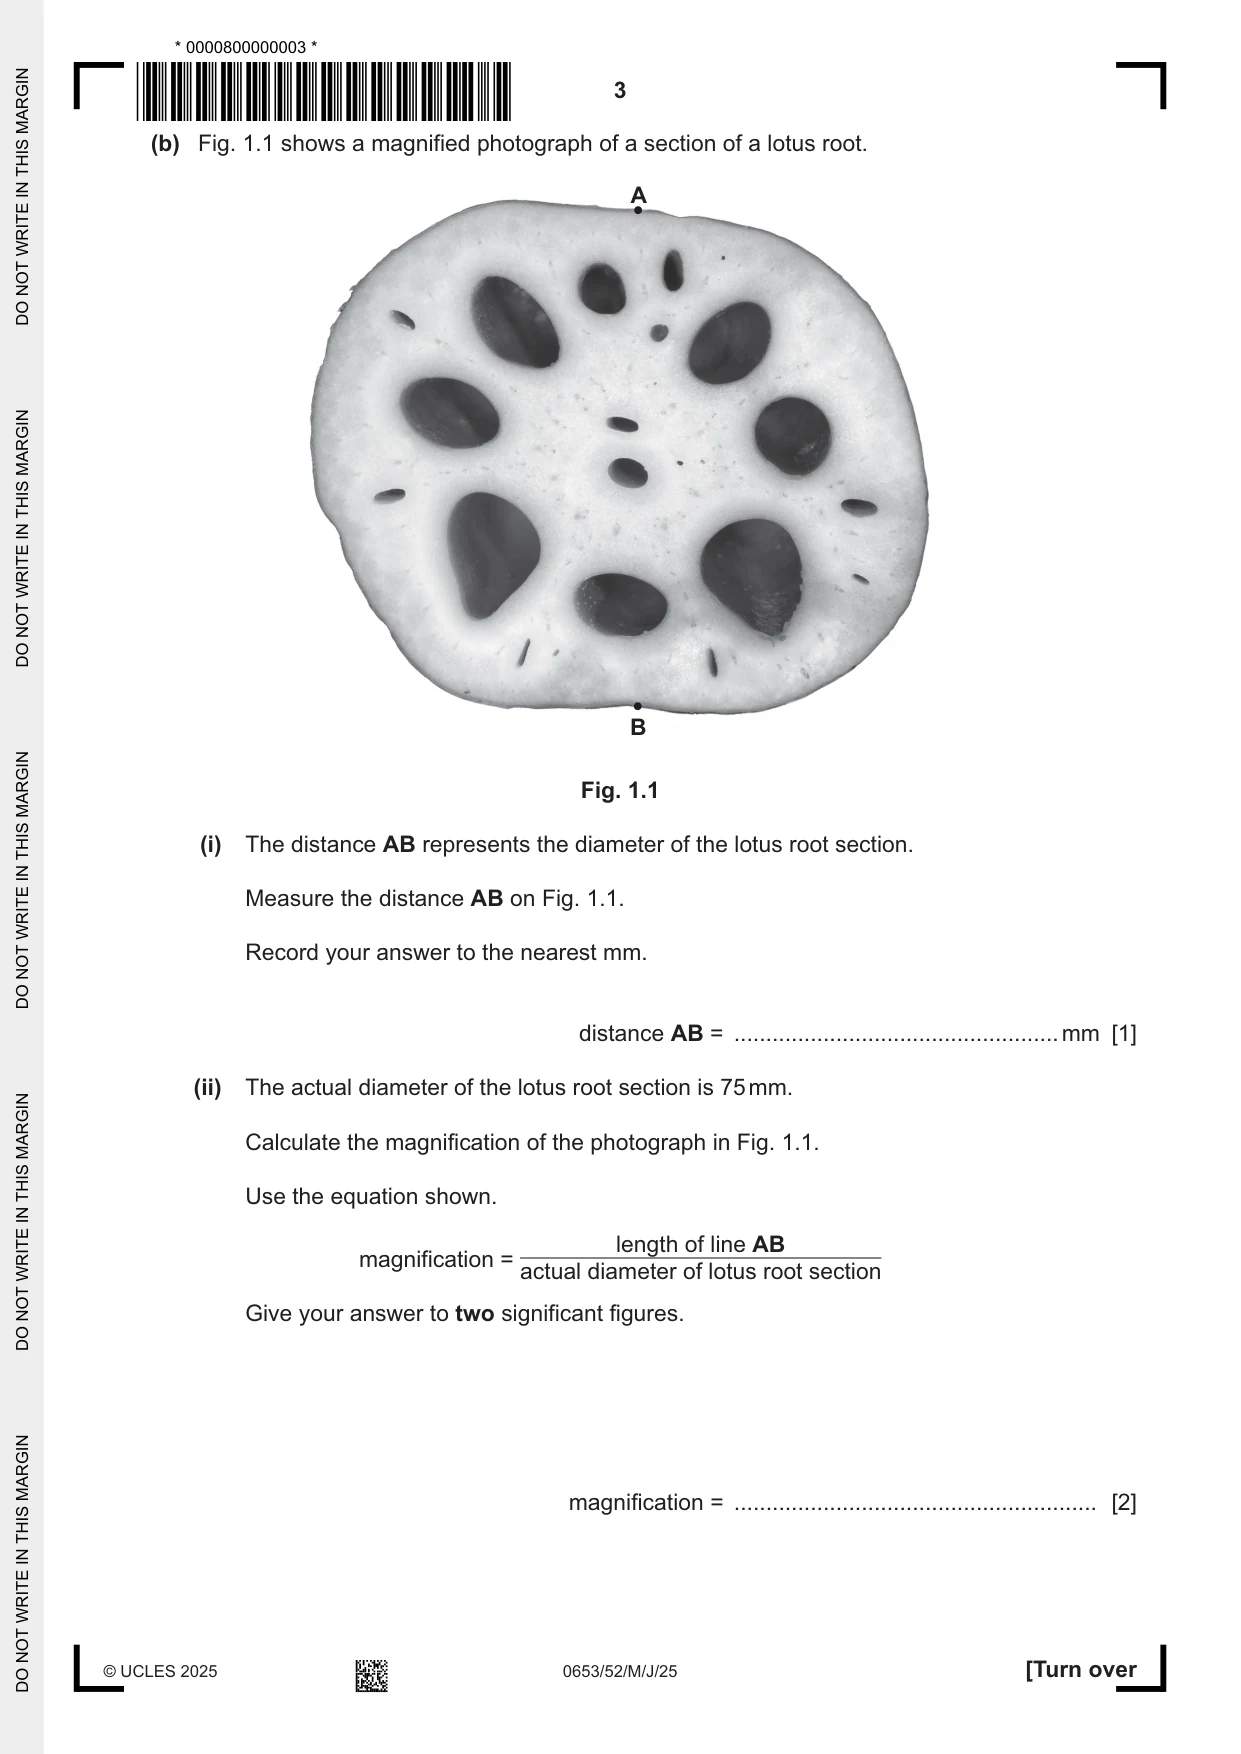
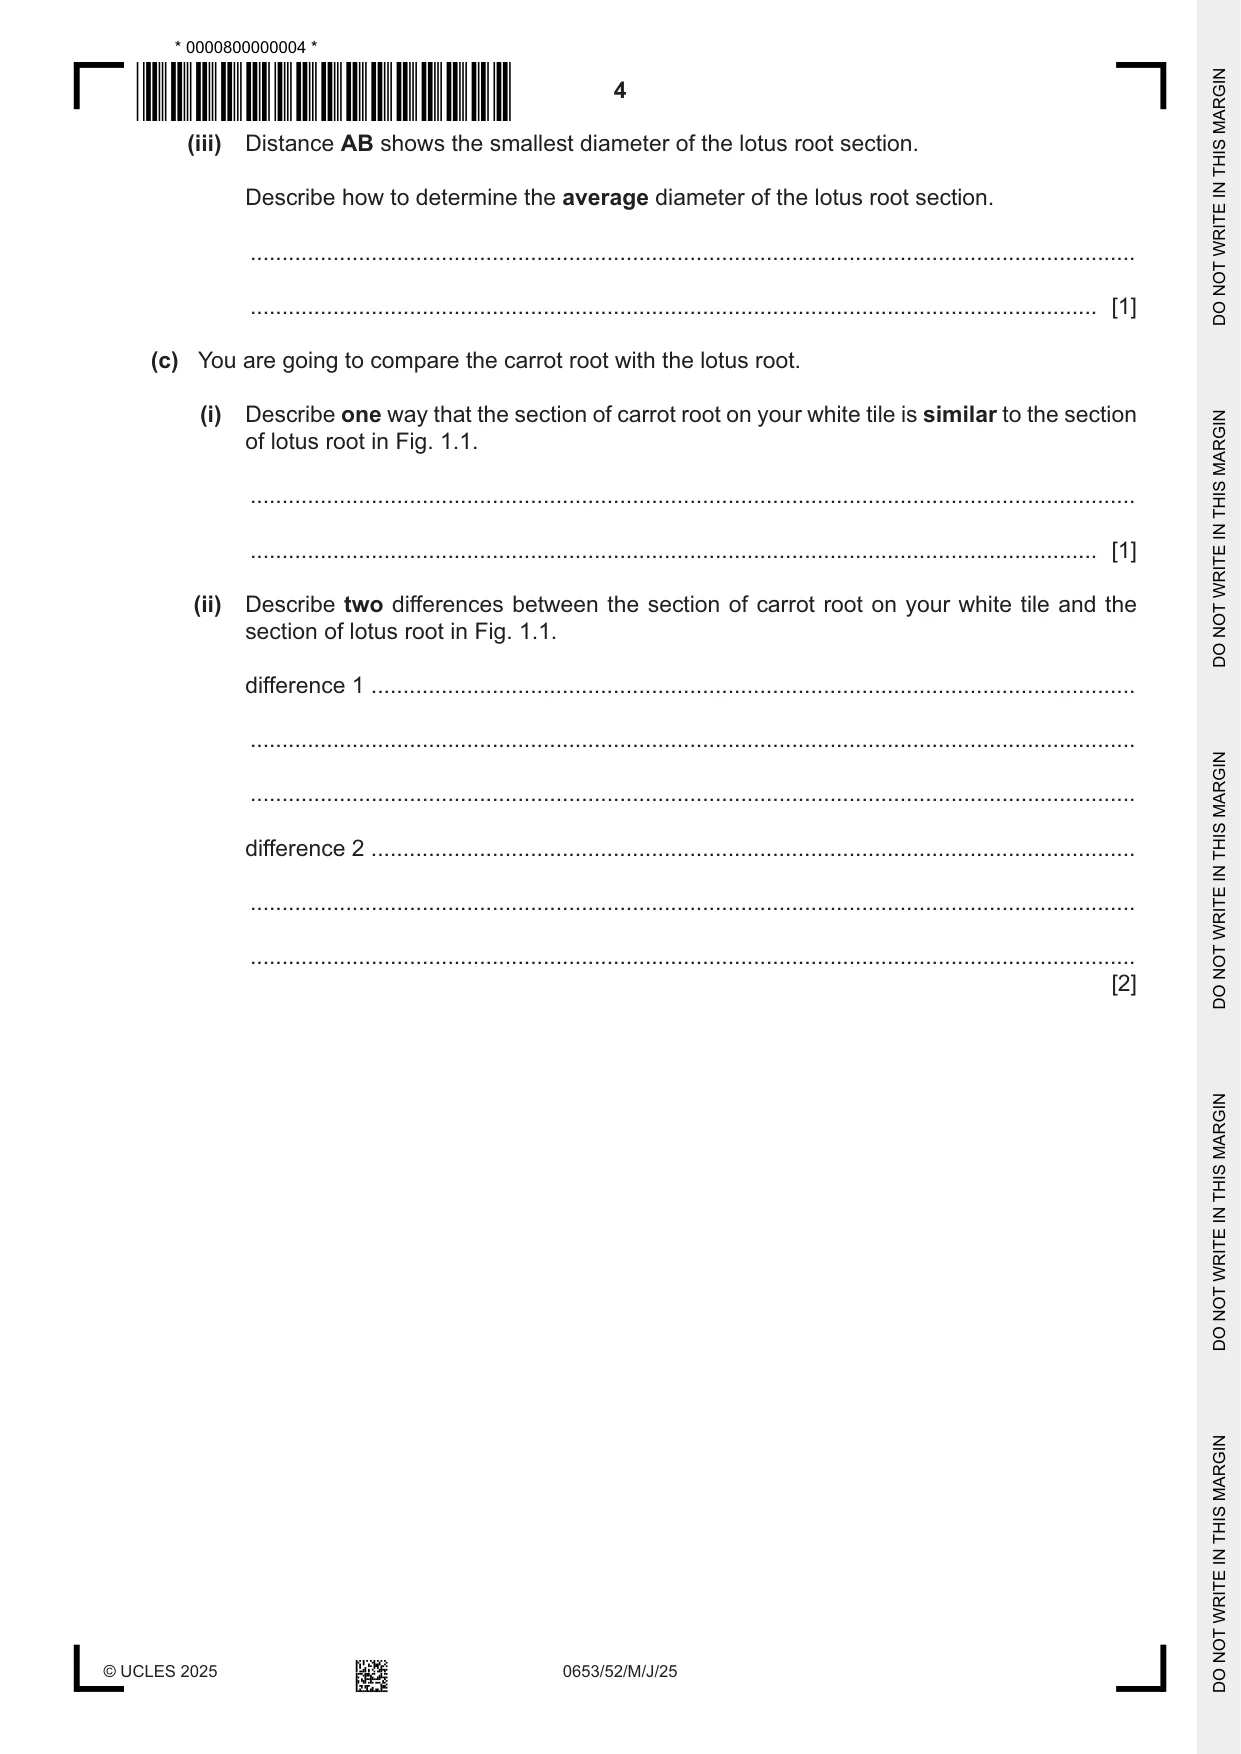
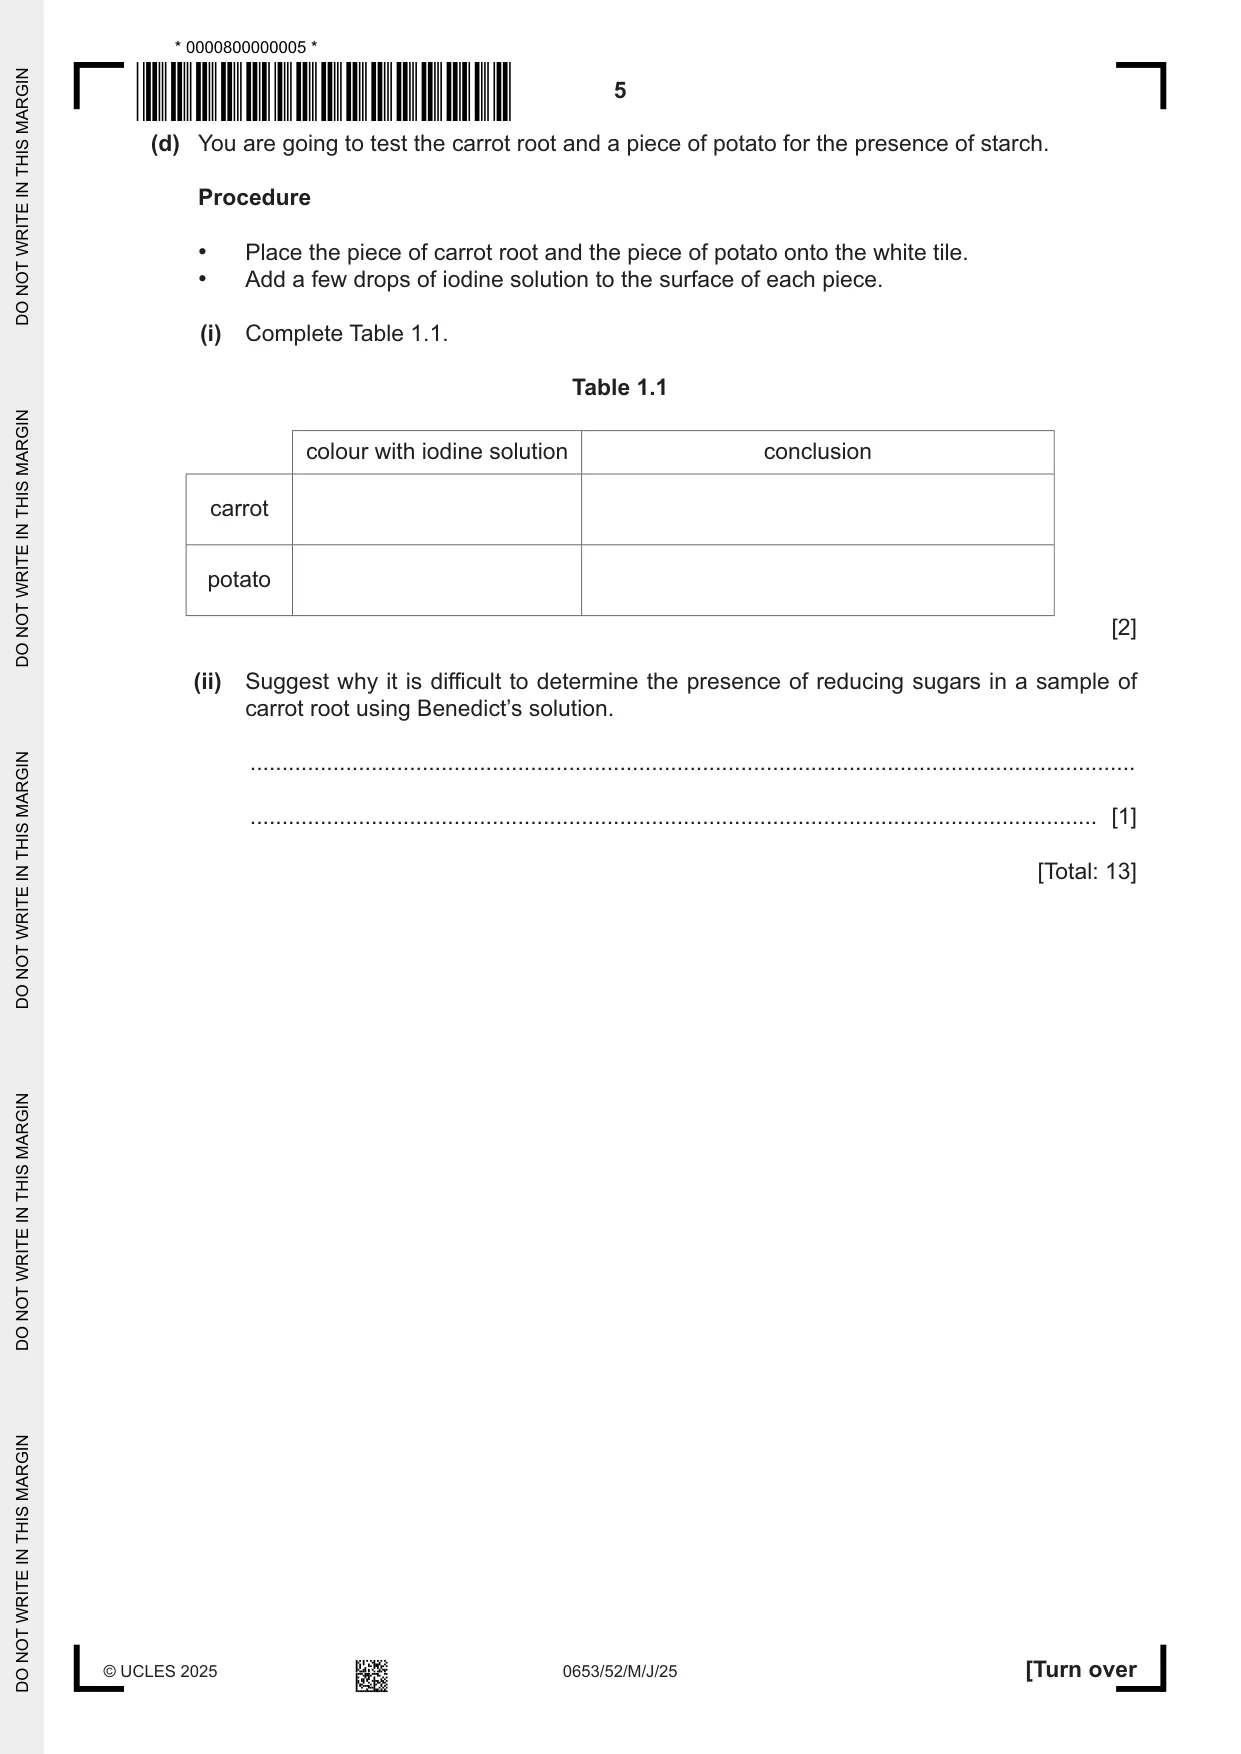
1 You are going to investigate a root vegetable. You are provided with a section of carrot root on a white tile. (a) In the box, make a large pencil drawing of the cut surface of the carrot root. [3] (b) Fig. 1.1 shows a magnified photograph of a section of a lotus root. A B Fig. 1.1 (i) The distance AB represents the diameter of the lotus root section. Measure the distance AB on Fig. 1.1. Record your answer to the nearest mm. distance AB = ................................................... mm [1] (ii) The actual diameter of the lotus root section is 75 mm. Calculate the magnification of the photograph in Fig. 1.1. Use the equation shown. length of line AB magnification = actual diameter of lotus root section Give your answer to two significant figures. magnification = ......................................................... [2] (iii) Distance AB shows the smallest diameter of the lotus root section. Describe how to determine the average diameter of the lotus root section. ........................................................................................................................................... ..................................................................................................................................... [1] (c) You are going to compare the carrot root with the lotus root. (i) Describe one way that the section of carrot root on your white tile is similar to the section of lotus root in Fig. 1.1. ........................................................................................................................................... ..................................................................................................................................... [1] (ii) Describe two differences between the section of carrot root on your white tile and the section of lotus root in Fig. 1.1. difference 1 ........................................................................................................................ ........................................................................................................................................... ........................................................................................................................................... difference 2 ........................................................................................................................ ........................................................................................................................................... ........................................................................................................................................... [2] (d) You are going to test the carrot root and a piece of potato for the presence of starch. Procedure • Place the piece of carrot root and the piece of potato onto the white tile. • Add a few drops of iodine solution to the surface of each piece. (i) Complete Table 1.1. Table 1.1 colour with iodine solution conclusion carrot potato [2] (ii) Suggest why it is difficult to determine the presence of reducing sugars in a sample of carrot root using Benedict’s solution. ........................................................................................................................................... ..................................................................................................................................... [1] [Total: 13]
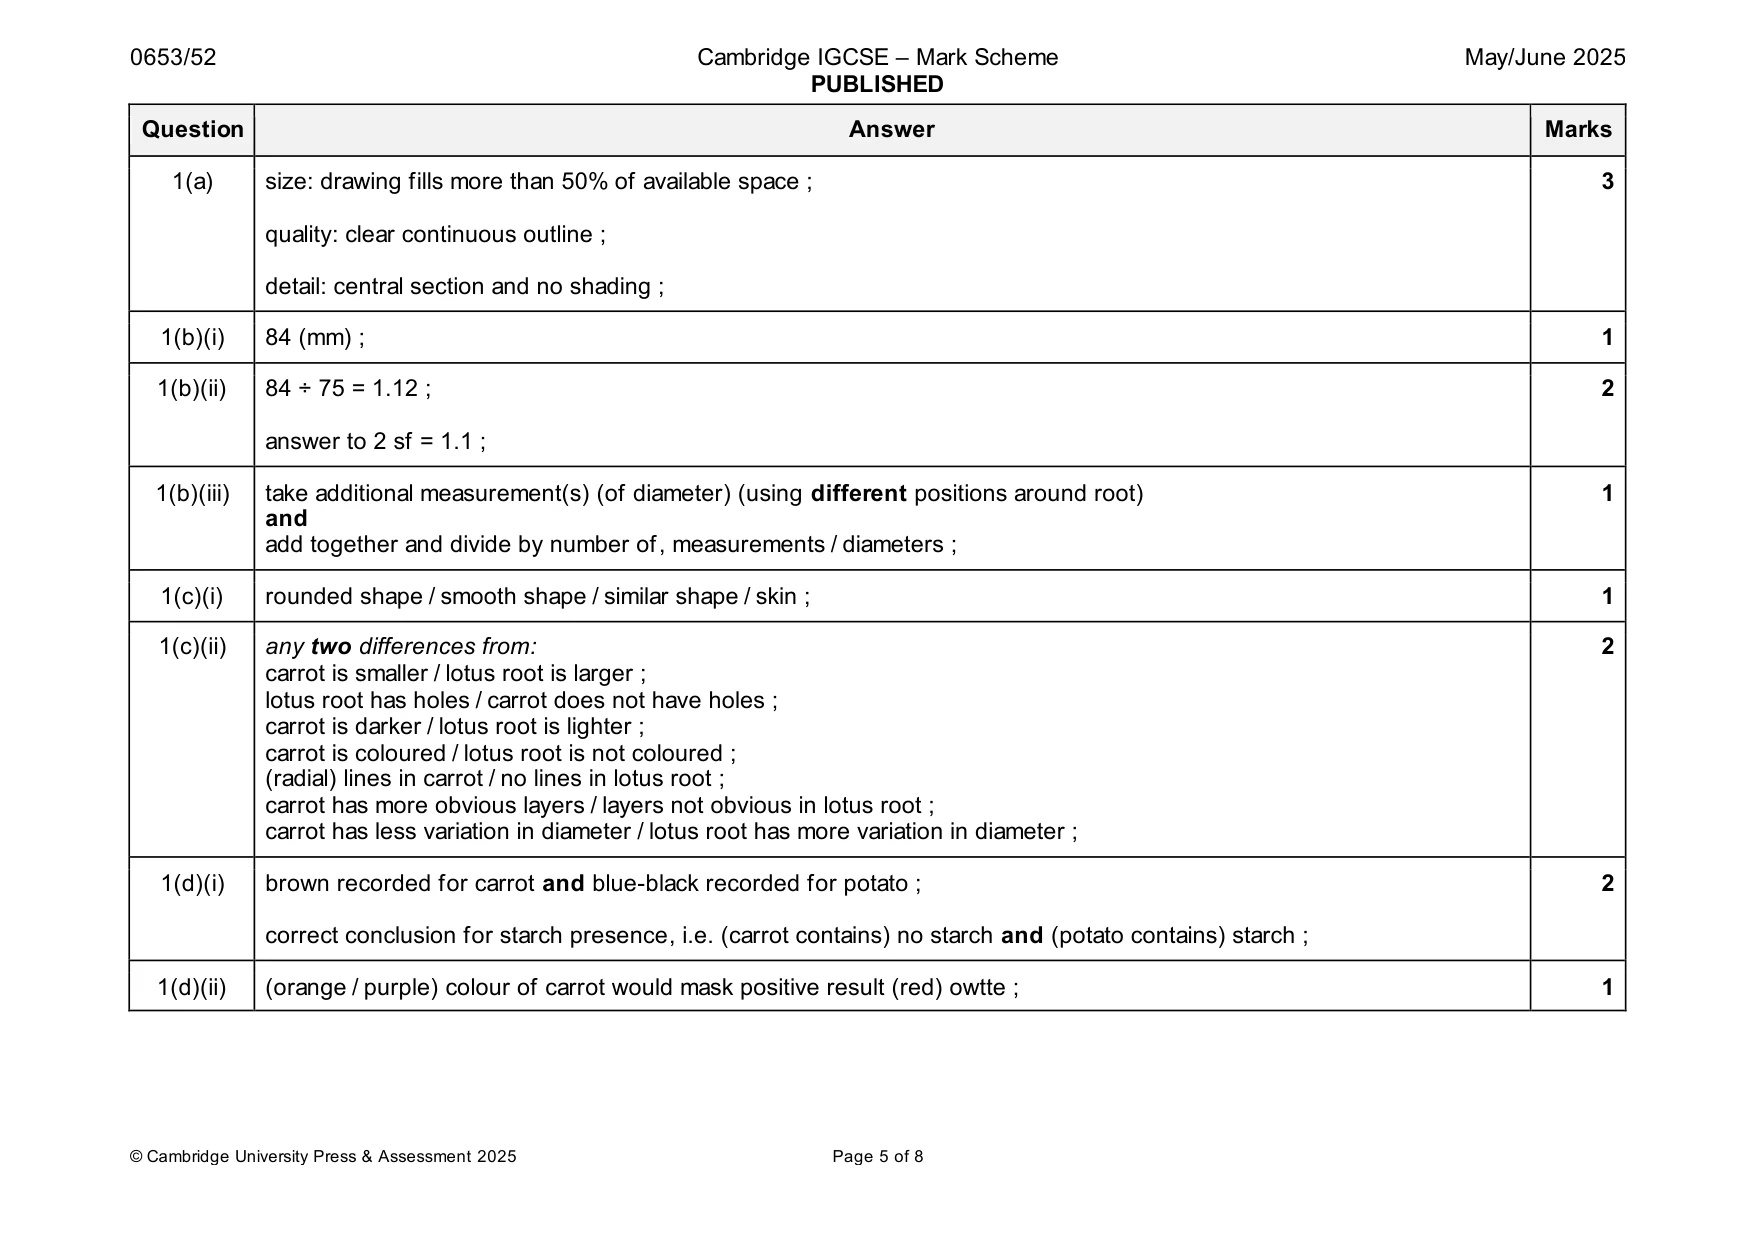
Mark scheme: Question Answer Marks 1(a) size: drawing fills more than 50% of available space ; 3 quality: clear continuous outline ; detail: central section and no shading ; 1(b)(i) 84 (mm) ; 1 1(b)(ii) 84 ÷ 75 = 1.12 ; 2 answer to 2 sf = 1.1 ; 1(b)(iii) take additional measurement(s) (of diameter) (using different positions around root) 1 and add together and divide by number of, measurements / diameters ; 1(c)(i) rounded shape / smooth shape / similar shape / skin ; 1 1(c)(ii) any two differences from: 2 carrot is smaller / lotus root is larger ; lotus root has holes / carrot does not have holes ; carrot is darker / lotus root is lighter ; carrot is coloured / lotus root is not coloured ; (radial) lines in carrot / no lines in lotus root ; carrot has more obvious layers / layers not obvious in lotus root ; carrot has less variation in diameter / lotus root has more variation in diameter ; 1(d)(i) brown recorded for carrot and blue-black recorded for potato ; 2 correct conclusion for starch presence, i.e. (carrot contains) no starch and (potato contains) starch ; 1(d)(ii) (orange / purple) colour of carrot would mask positive result (red) owtte ; 1
Q2 · You are going to investigate the reaction between aluminium and aqueous copper(II)…
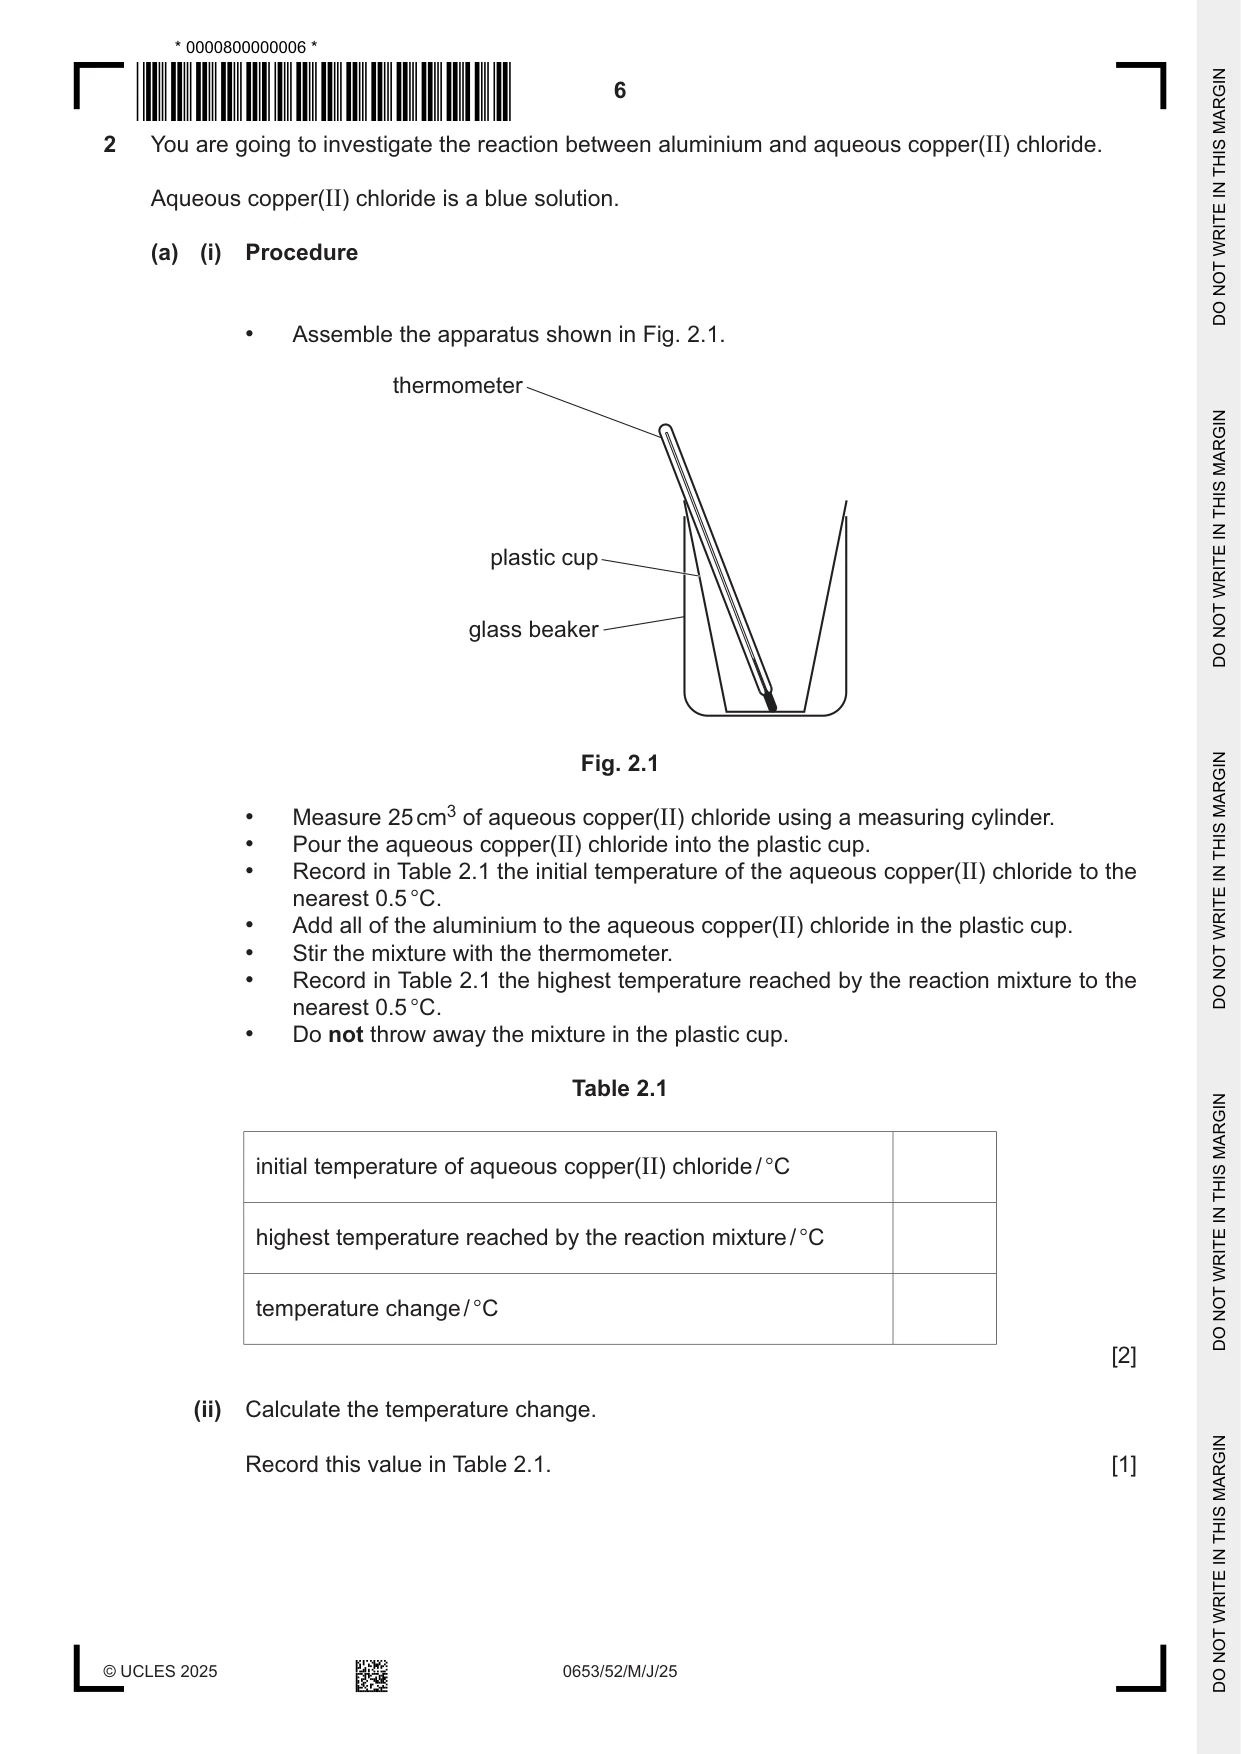
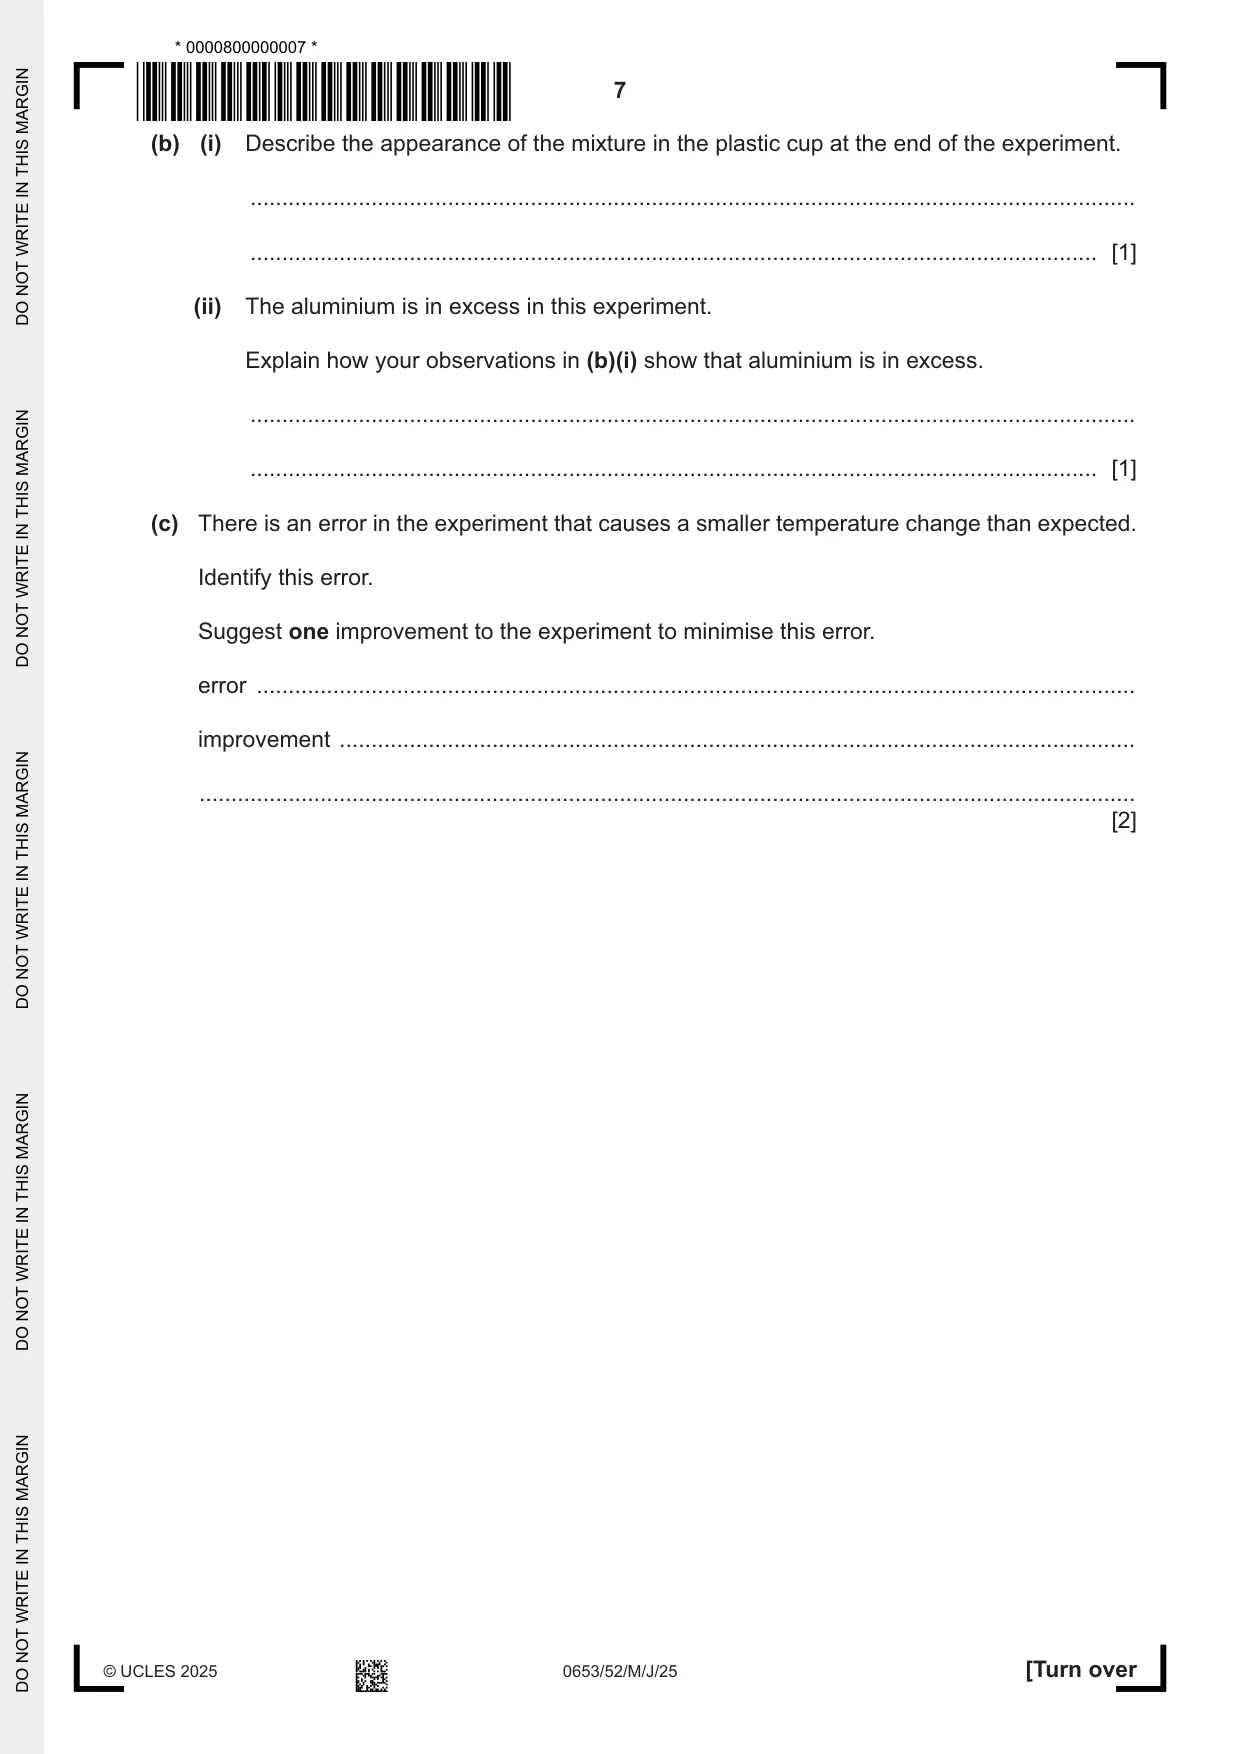
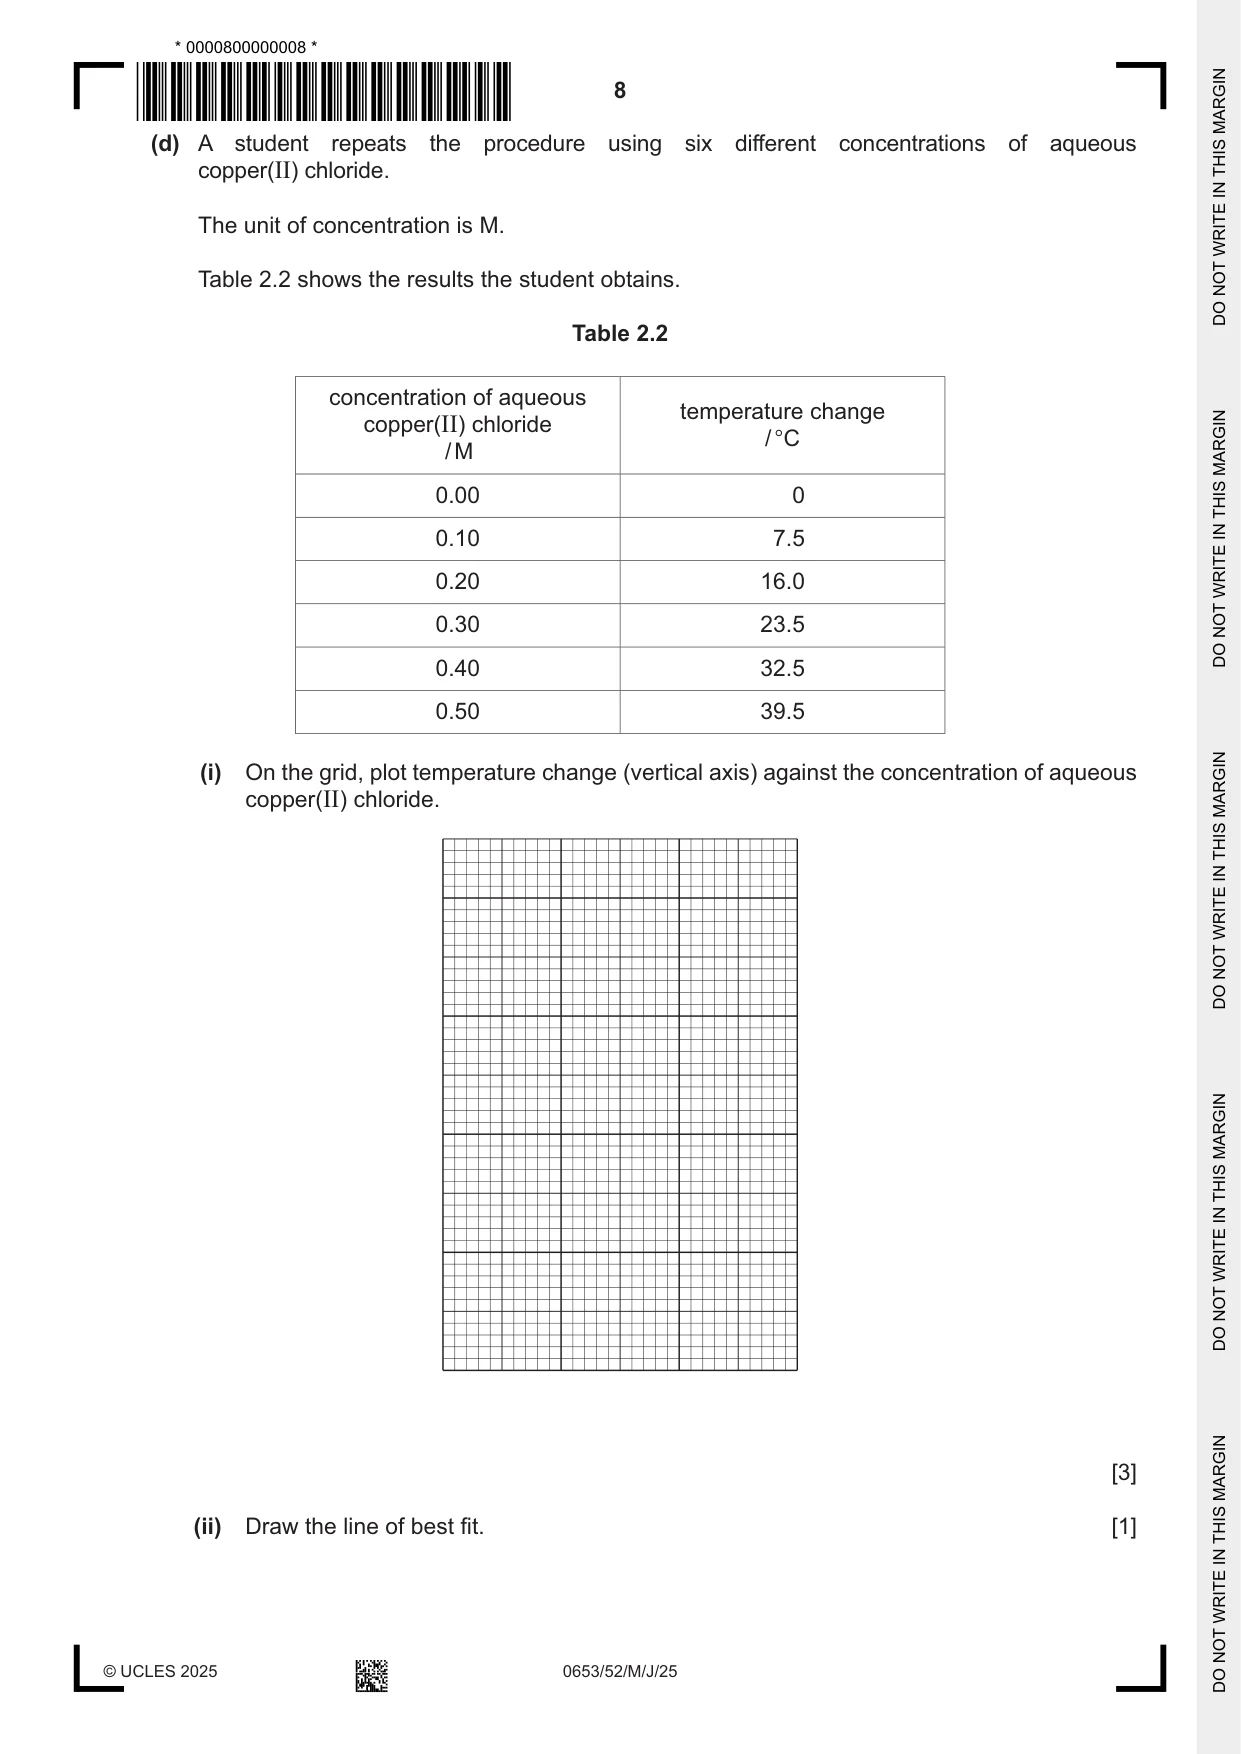
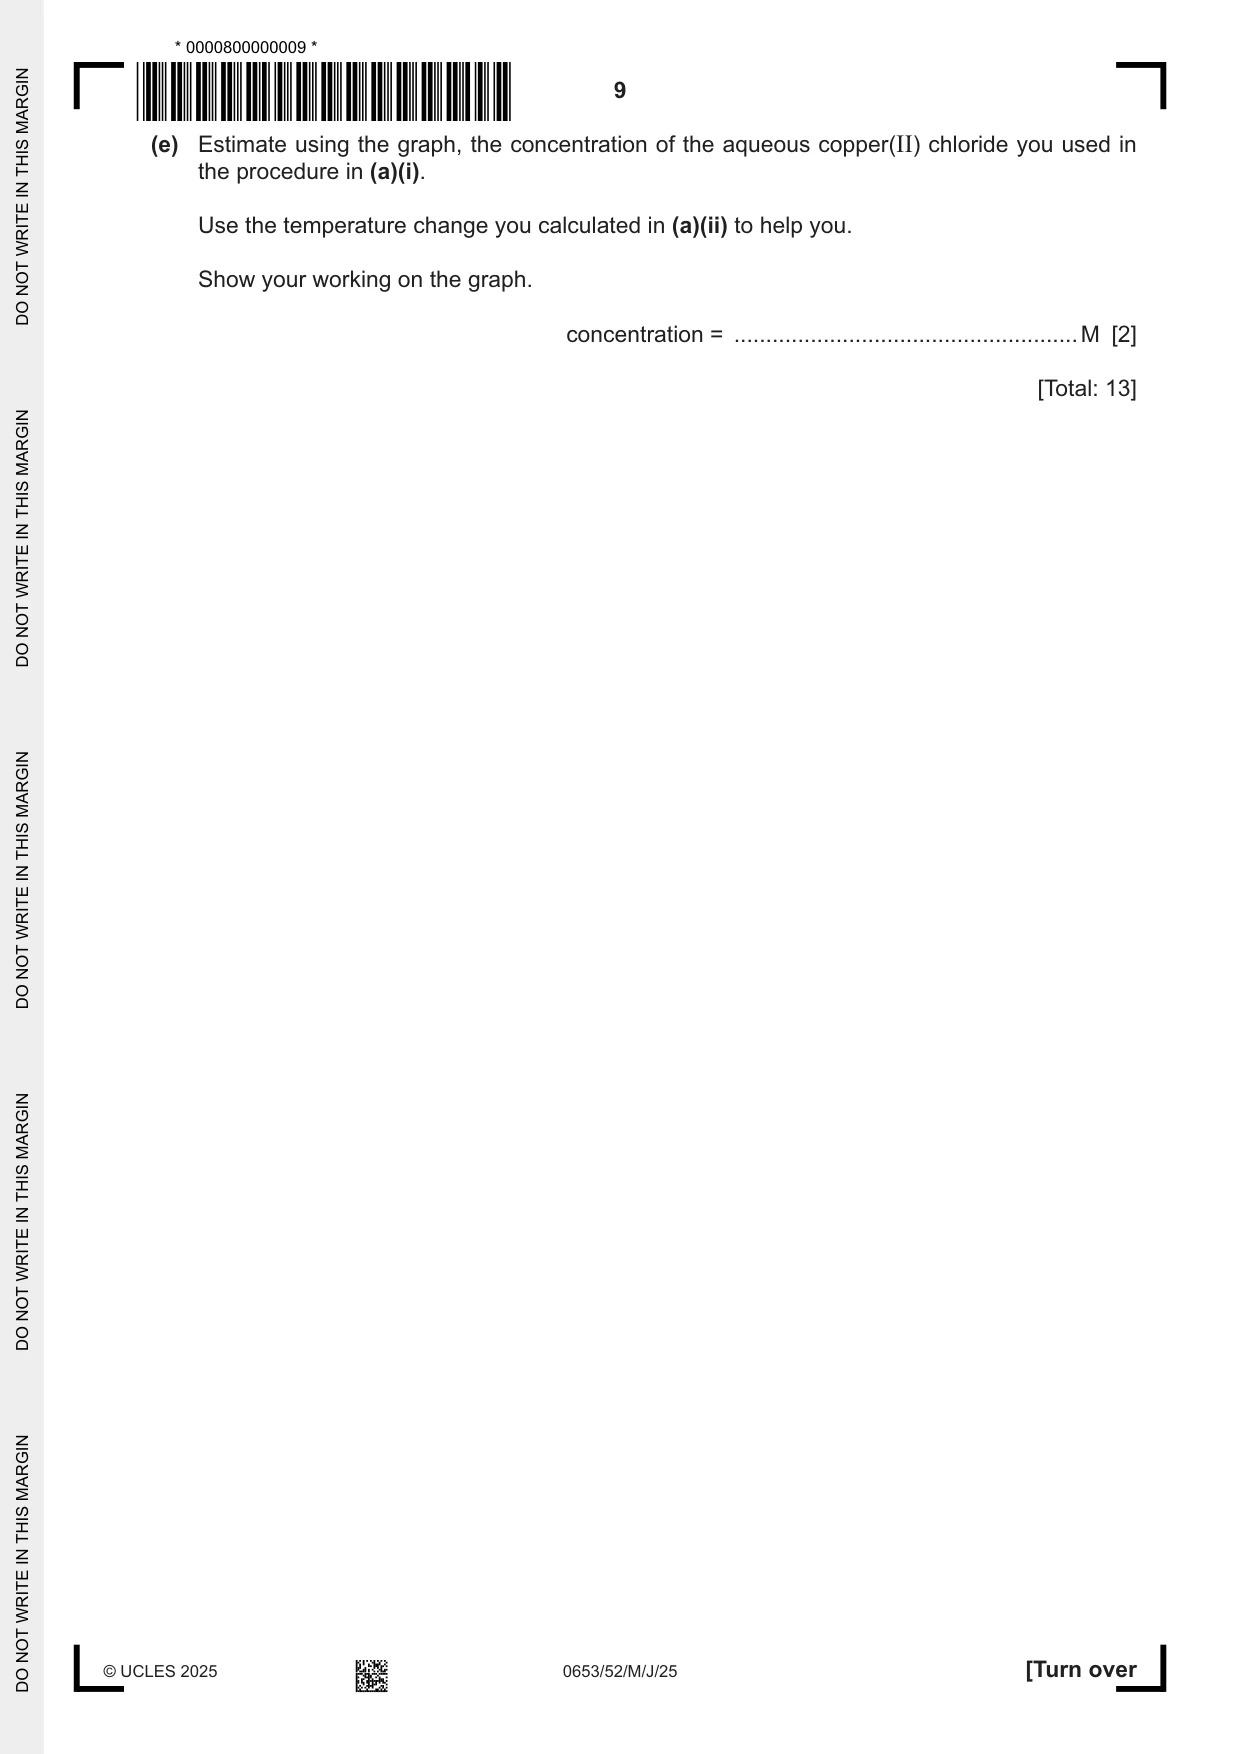
2 You are going to investigate the reaction between aluminium and aqueous copper(II) chloride. Aqueous copper(II) chloride is a blue solution. (a) (i) Procedure • Assemble the apparatus shown in Fig. 2.1. thermometer plastic cup glass beaker Fig. 2.1 • Measure 25 cm3 of aqueous copper(II) chloride using a measuring cylinder. • Pour the aqueous copper(II) chloride into the plastic cup. • Record in Table 2.1 the initial temperature of the aqueous copper(II) chloride to the nearest 0.5 °C. • Add all of the aluminium to the aqueous copper(II) chloride in the plastic cup. • Stir the mixture with the thermometer. • Record in Table 2.1 the highest temperature reached by the reaction mixture to the nearest 0.5 °C. • Do not throw away the mixture in the plastic cup. Table 2.1 initial temperature of aqueous copper(II) chloride / °C highest temperature reached by the reaction mixture / °C temperature change / °C [2] (ii) Calculate the temperature change. Record this value in Table 2.1. [1] (b) (i) Describe the appearance of the mixture in the plastic cup at the end of the experiment. ........................................................................................................................................... ..................................................................................................................................... [1] (ii) The aluminium is in excess in this experiment. Explain how your observations in (b)(i) show that aluminium is in excess. ........................................................................................................................................... ..................................................................................................................................... [1] (c) There is an error in the experiment that causes a smaller temperature change than expected. Identify this error. Suggest one improvement to the experiment to minimise this error. error .......................................................................................................................................... improvement ............................................................................................................................. ................................................................................................................................................... [2] (d) A student repeats the procedure using six different concentrations of aqueous copper(II) chloride. The unit of concentration is M. Table 2.2 shows the results the student obtains. Table 2.2 concentration of aqueous temperature change copper(II) chloride / °C / M 0.00 0 0.10 7.5 0.20 16.0 0.30 23.5 0.40 32.5 0.50 39.5 (i) On the grid, plot temperature change (vertical axis) against the concentration of aqueous copper(II) chloride. [3] (ii) Draw the line of best fit. [1] (e) Estimate using the graph, the concentration of the aqueous copper(II) chloride you used in the procedure in (a)(i). Use the temperature change you calculated in (a)(ii) to help you. Show your working on the graph. concentration = ...................................................... M [2] [Total: 13]
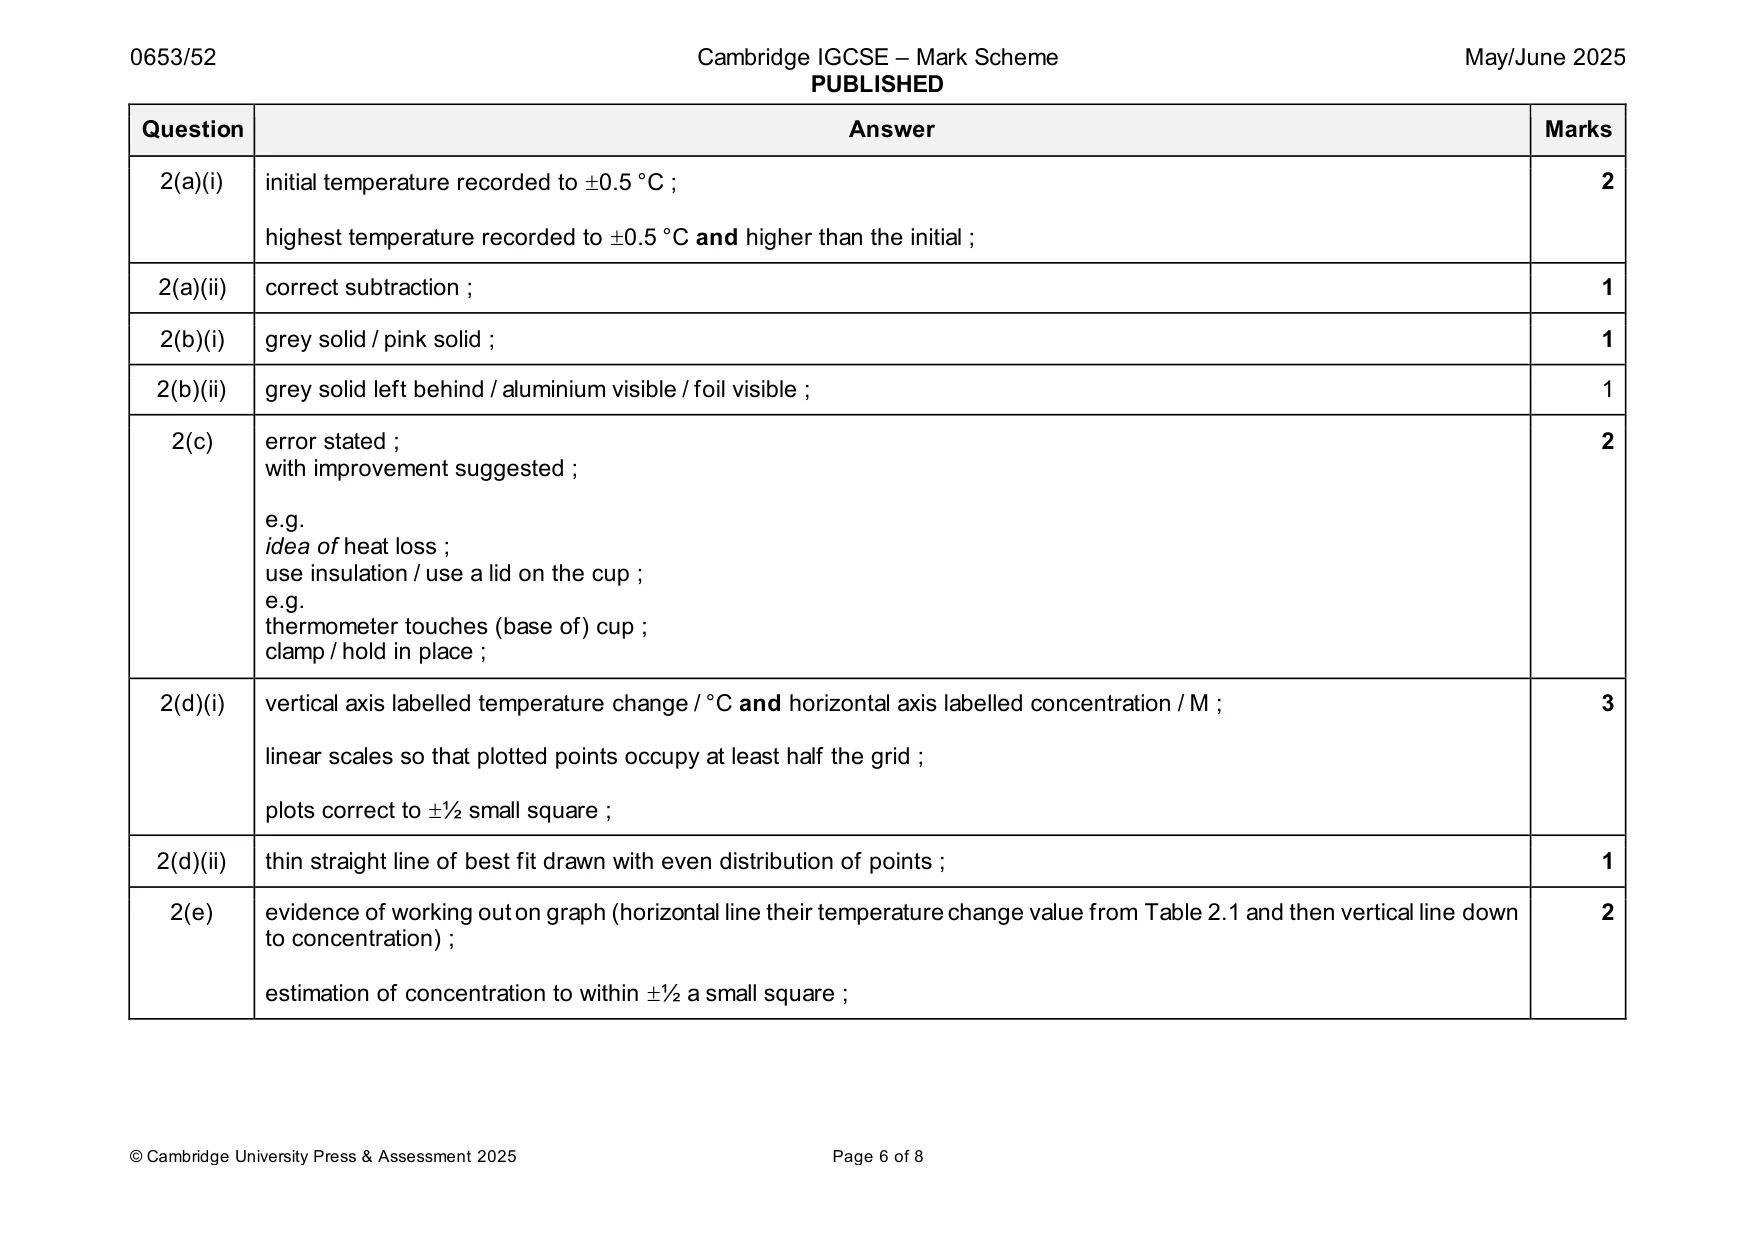
Mark scheme: 2(a)(i) initial temperature recorded to 0.5 °C ; 2 highest temperature recorded to 0.5 °C and higher than the initial ; 2(a)(ii) correct subtraction ; 1 2(b)(i) grey solid / pink solid ; 1 2(b)(ii) grey solid left behind / aluminium visible / foil visible ; 1 2(c) error stated ; 2 with improvement suggested ; e.g. idea of heat loss ; use insulation / use a lid on the cup ; e.g. thermometer touches (base of) cup ; clamp / hold in place ; 2(d)(i) vertical axis labelled temperature change / °C and horizontal axis labelled concentration / M ; 3 linear scales so that plotted points occupy at least half the grid ; plots correct to ½ small square ; 2(d)(ii) thin straight line of best fit drawn with even distribution of points ; 1 2(e) evidence of working out on graph (horizontal line their temperature change value from Table 2.1 and then vertical line down 2 to concentration) ; estimation of concentration to within ½ a small square ;
Q3 · You are going to investigate the behaviour of resistors in a series circuit
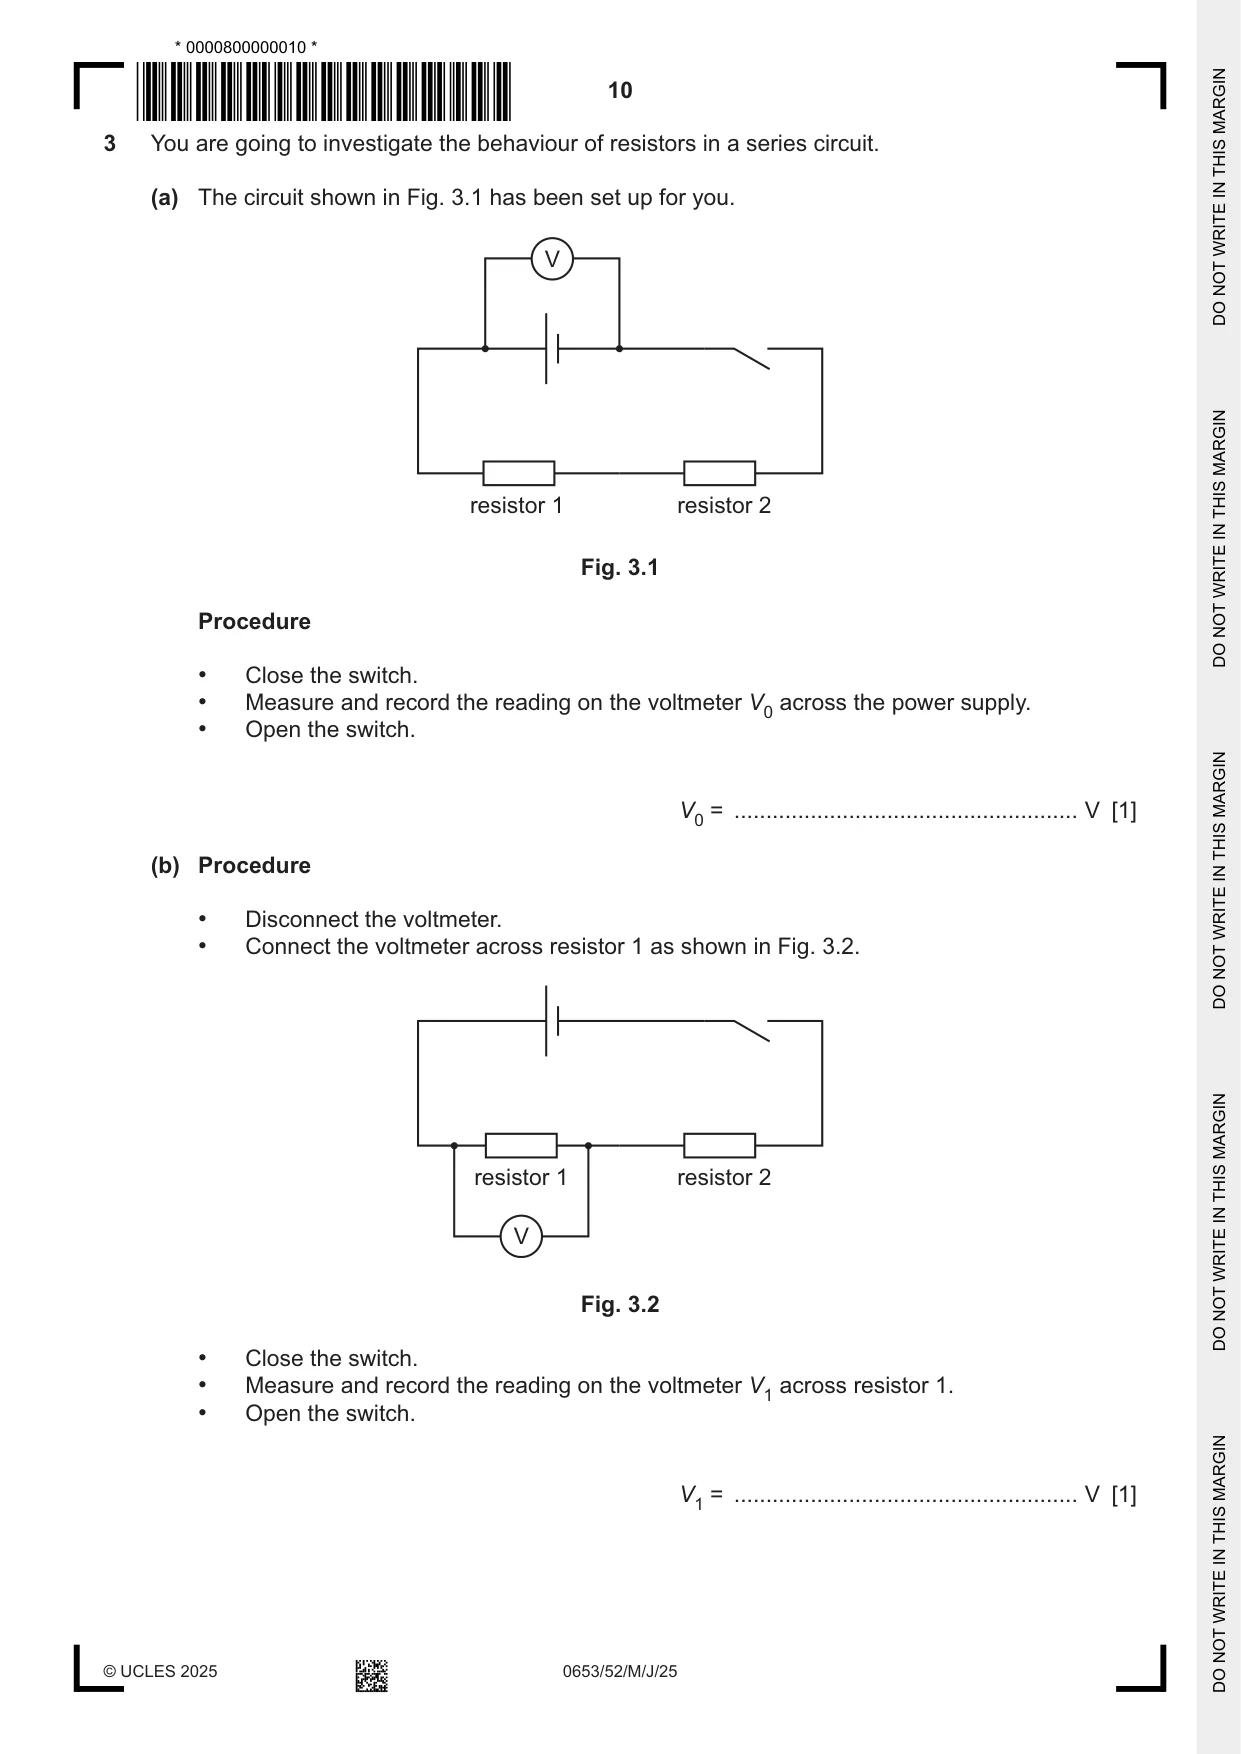
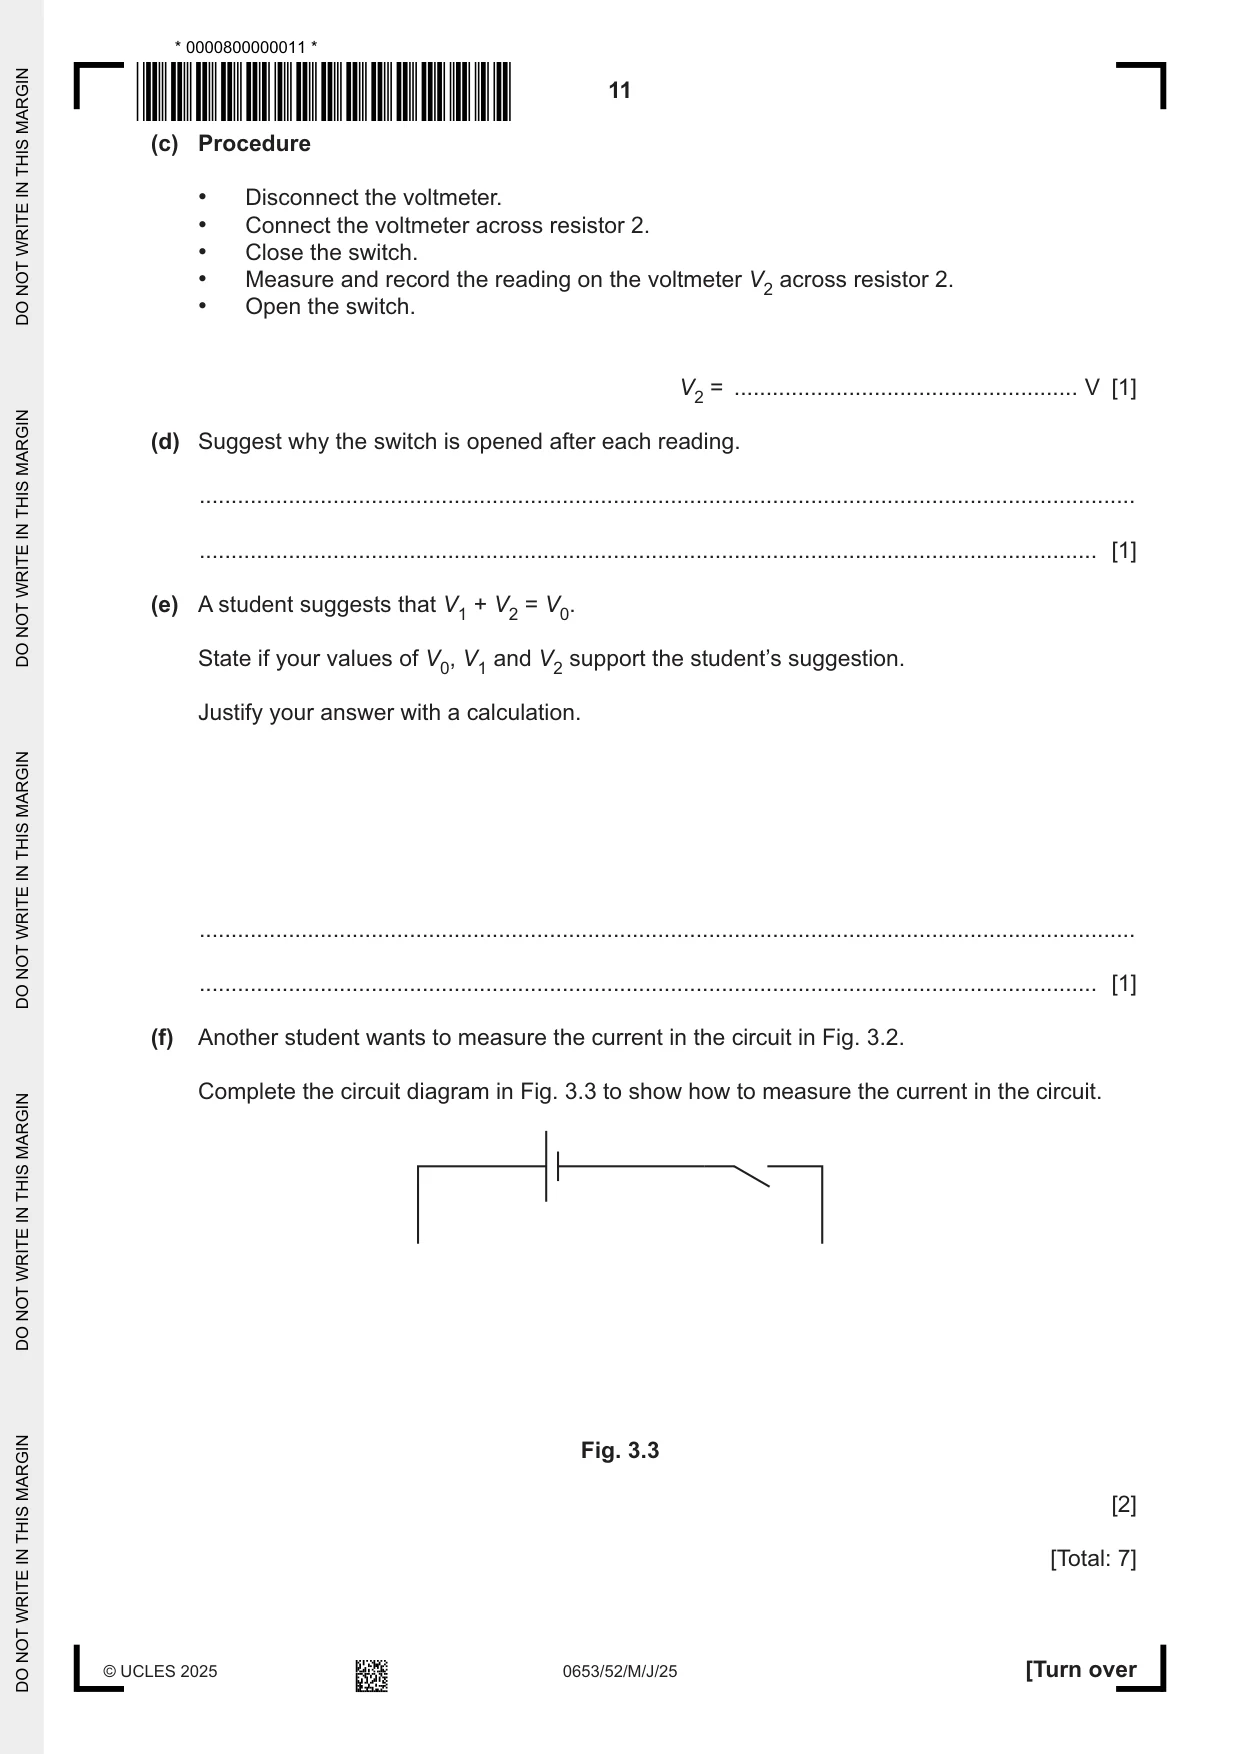
3 You are going to investigate the behaviour of resistors in a series circuit. (a) The circuit shown in Fig. 3.1 has been set up for you. V resistor 1 resistor 2 Fig. 3.1 Procedure • Close the switch. • Measure and record the reading on the voltmeter V0 across the power supply. • Open the switch. V0 = ...................................................... V [1] (b) Procedure • Disconnect the voltmeter. • Connect the voltmeter across resistor 1 as shown in Fig. 3.2. resistor 1 resistor 2 V Fig. 3.2 • Close the switch. • Measure and record the reading on the voltmeter V1 across resistor 1. • Open the switch. V1 = ...................................................... V [1] (c) Procedure • Disconnect the voltmeter. • Connect the voltmeter across resistor 2. • Close the switch. • Measure and record the reading on the voltmeter V2 across resistor 2. • Open the switch. V2 = ...................................................... V [1] (d) Suggest why the switch is opened after each reading. ................................................................................................................................................... ............................................................................................................................................. [1] (e) A student suggests that V1 + V2 = V0. State if your values of V0, V1 and V2 support the student’s suggestion. Justify your answer with a calculation. ................................................................................................................................................... ............................................................................................................................................. [1] (f) Another student wants to measure the current in the circuit in Fig. 3.2. Complete the circuit diagram in Fig. 3.3 to show how to measure the current in the circuit. Fig. 3.3 [2] [Total: 7]
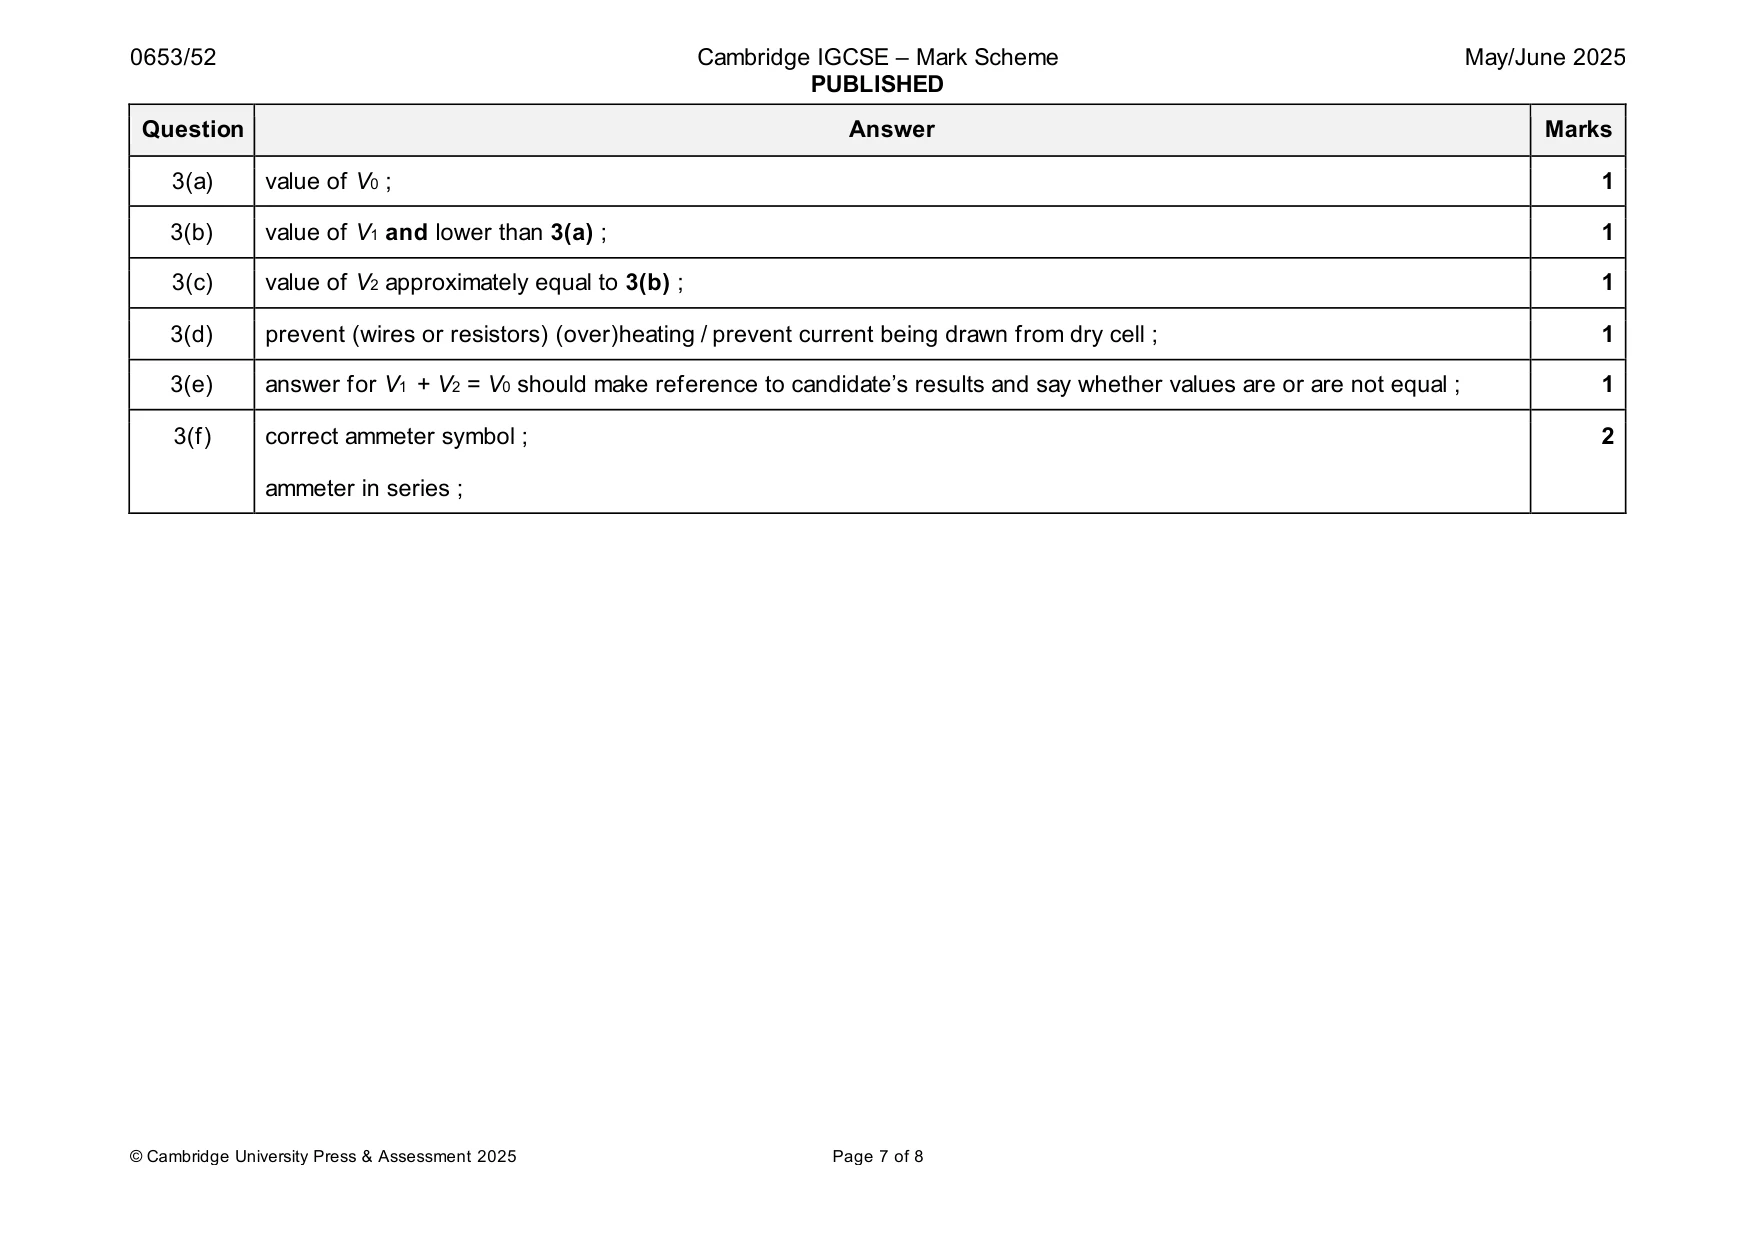
Mark scheme: 3(a) value of V0 ; 1 3(b) value of V1 and lower than 3(a) ; 1 3(c) value of V2 approximately equal to 3(b) ; 1 3(d) prevent (wires or resistors) (over)heating / prevent current being drawn from dry cell ; 1 3(e) answer for V1 + V2 = V0 should make reference to candidate’s results and say whether values are or are not equal ; 1 3(f) correct ammeter symbol ; 2 ammeter in series ;
Q4 · A metal rod placed in a box of sand
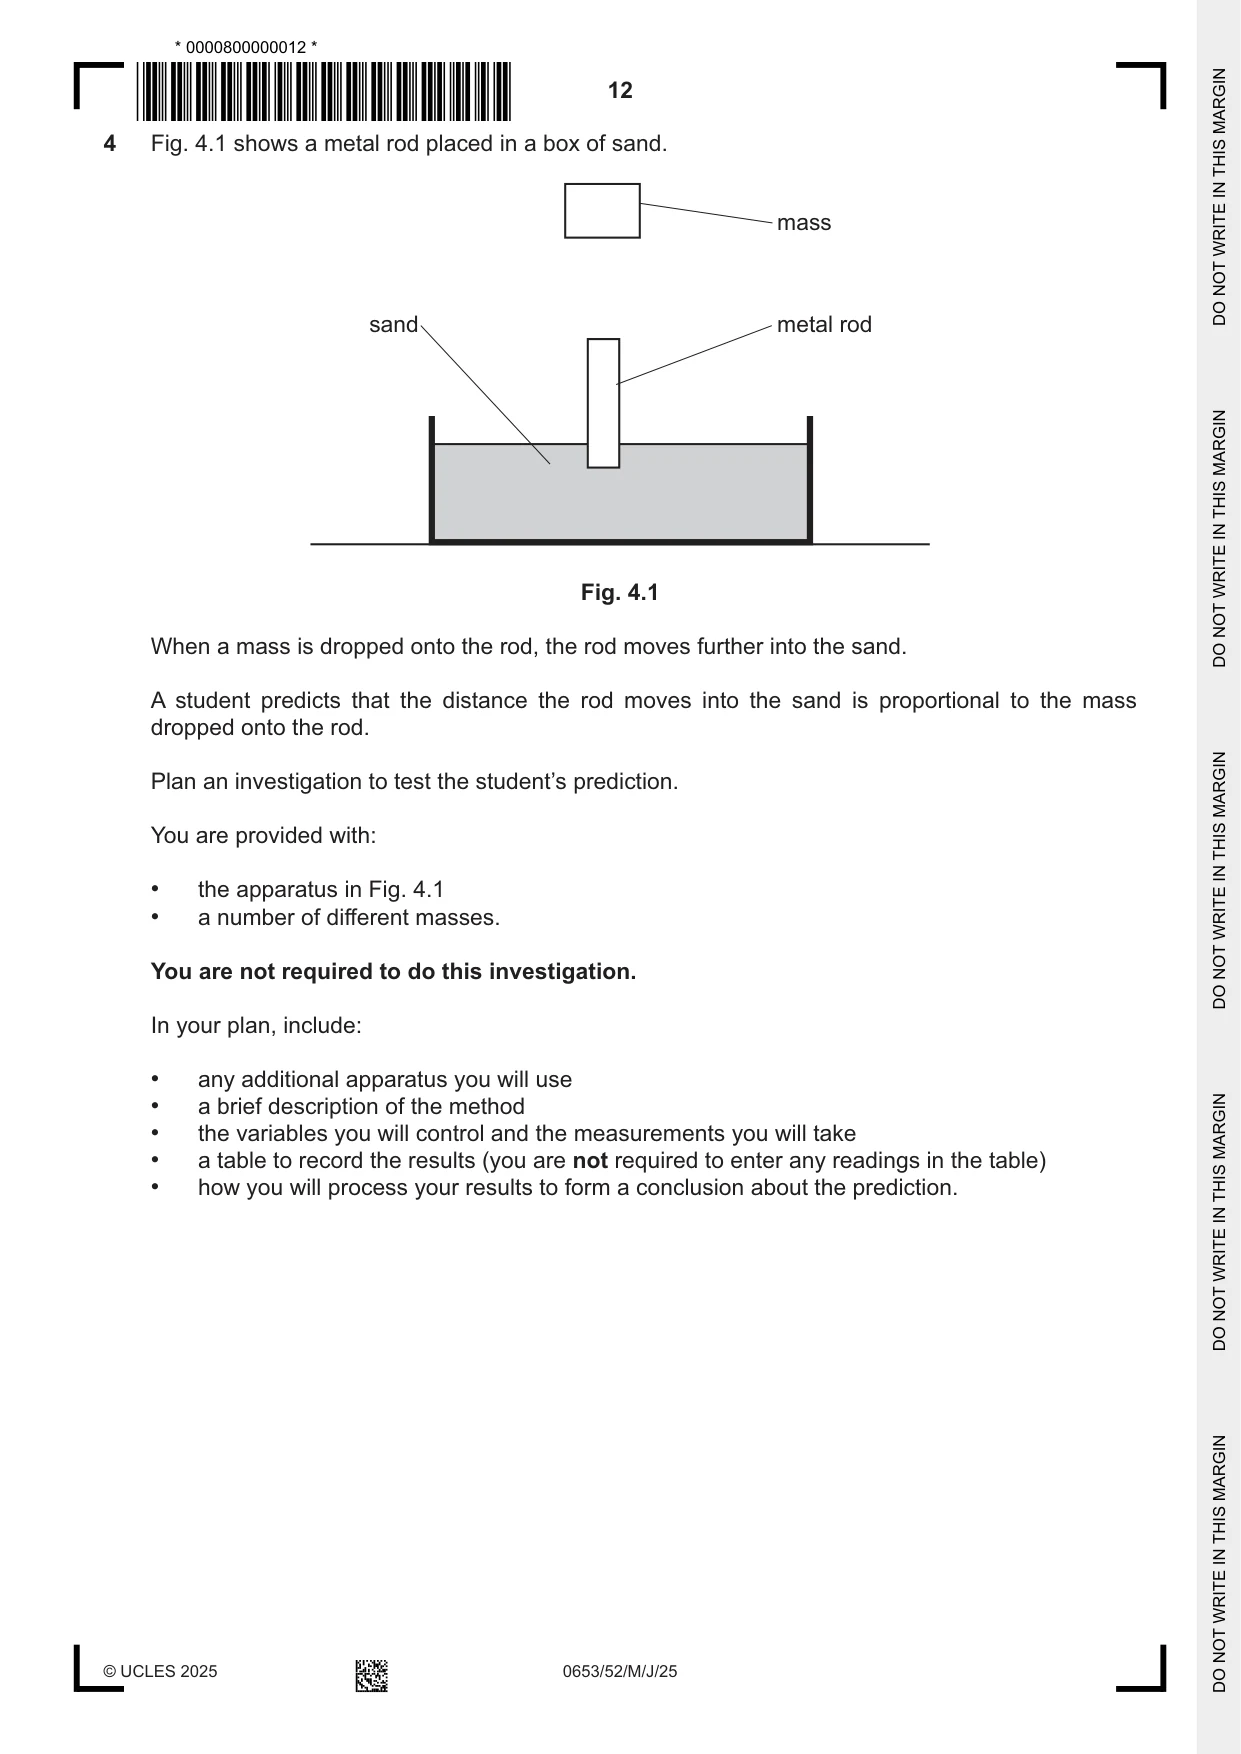
4 Fig. 4.1 shows a metal rod placed in a box of sand. mass sand metal rod Fig. 4.1 When a mass is dropped onto the rod, the rod moves further into the sand. A student predicts that the distance the rod moves into the sand is proportional to the mass dropped onto the rod. Plan an investigation to test the student’s prediction. You are provided with: • the apparatus in Fig. 4.1 • a number of different masses. You are not required to do this investigation. In your plan, include: • any additional apparatus you will use • a brief description of the method • the variables you will control and the measurements you will take • a table to record the results (you are not required to enter any readings in the table) • how you will process your results to form a conclusion about the prediction. .......................................................................................................................................................... .......................................................................................................................................................... .......................................................................................................................................................... .......................................................................................................................................................... .......................................................................................................................................................... .......................................................................................................................................................... .......................................................................................................................................................... .......................................................................................................................................................... .......................................................................................................................................................... .......................................................................................................................................................... .......................................................................................................................................................... .......................................................................................................................................................... .......................................................................................................................................................... .................................................................................................................................................... [7]
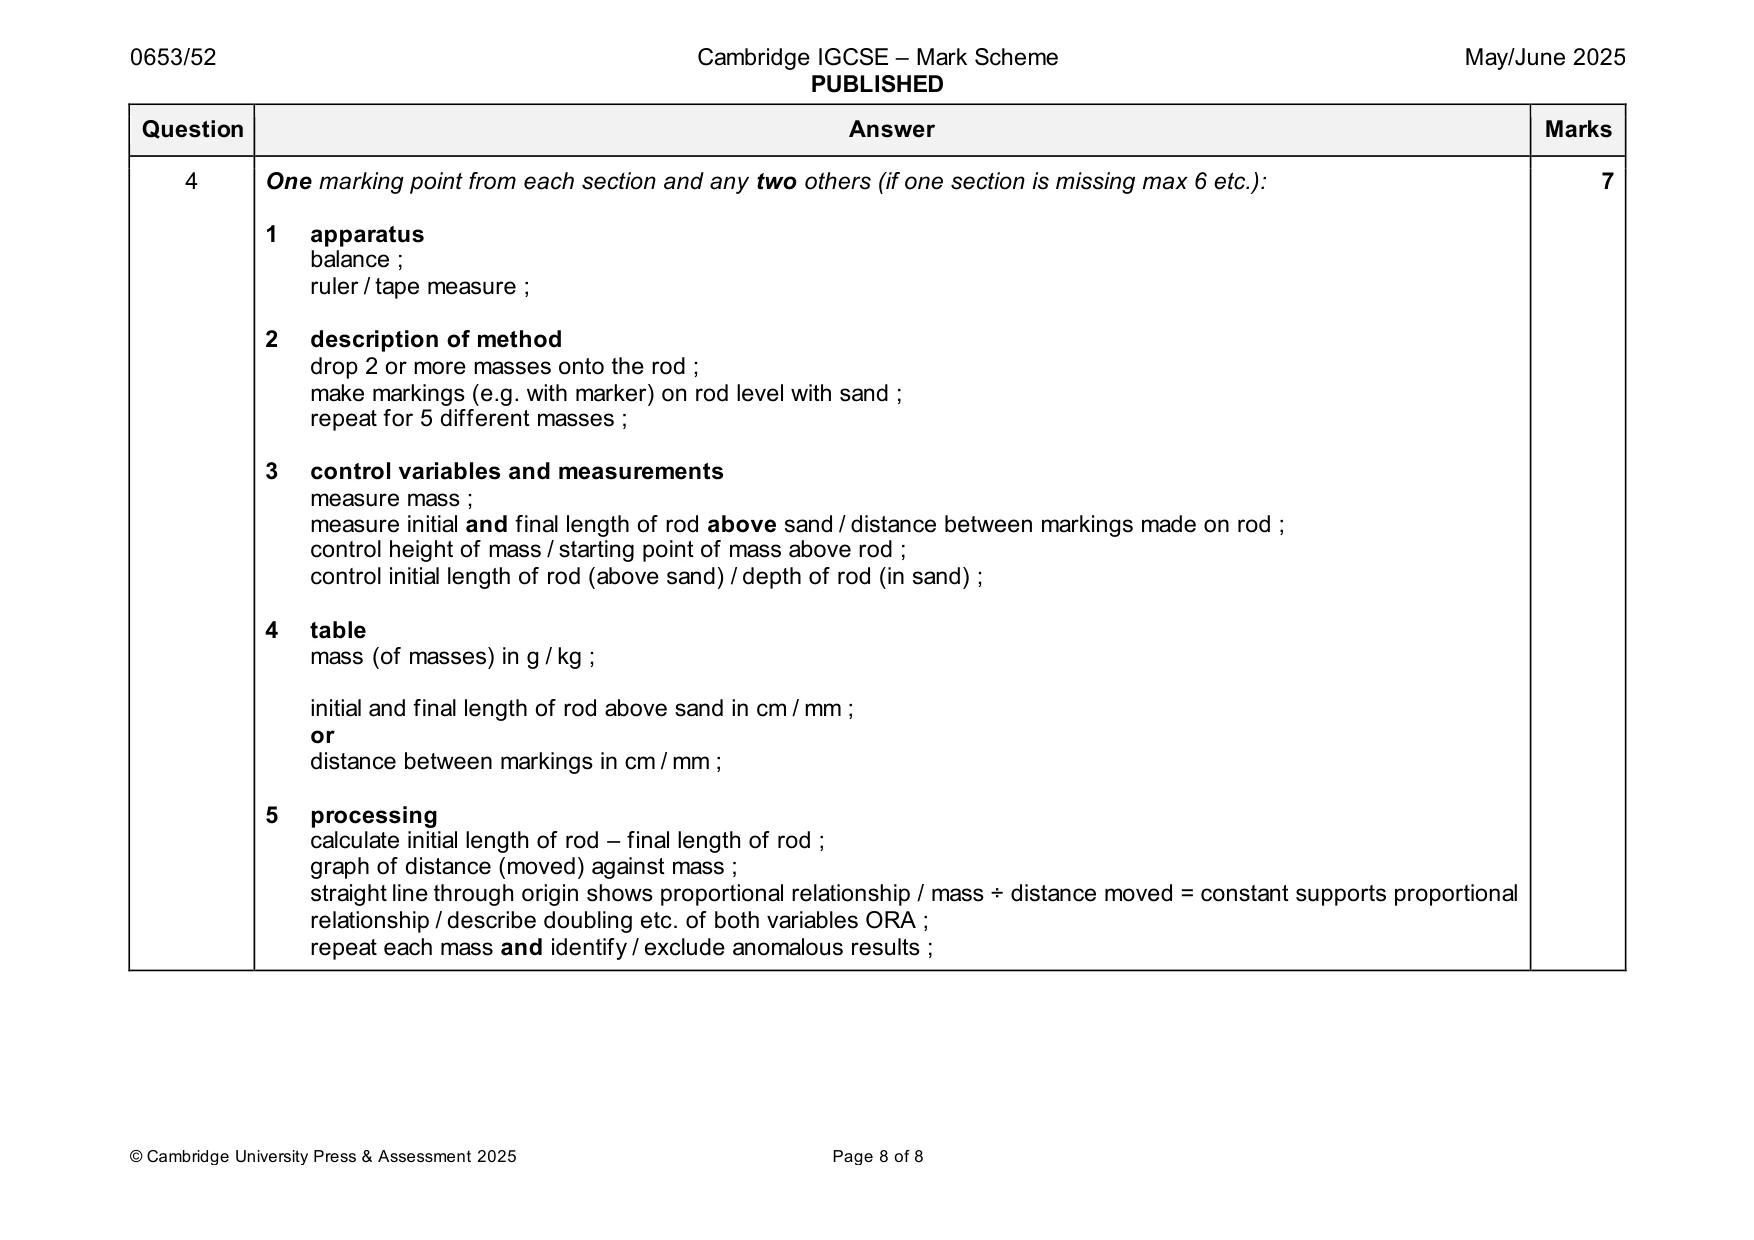
Mark scheme: 4 One marking point from each section and any two others (if one section is missing max 6 etc.): 7 1 apparatus balance ; ruler / tape measure ; 2 description of method drop 2 or more masses onto the rod ; make markings (e.g. with marker) on rod level with sand ; repeat for 5 different masses ; 3 control variables and measurements measure mass ; measure initial and final length of rod above sand / distance between markings made on rod ; control height of mass / starting point of mass above rod ; control initial length of rod (above sand) / depth of rod (in sand) ; 4 table mass (of masses) in g / kg ; initial and final length of rod above sand in cm / mm ; or distance between markings in cm / mm ; 5 processing calculate initial length of rod – final length of rod ; graph of distance (moved) against mass ; straight line through origin shows proportional relationship / mass ÷ distance moved = constant supports proportional relationship / describe doubling etc. of both variables ORA ; repeat each mass and identify / exclude anomalous results ;
What was in this paper
The subtopics covered by these 4 questions, and how many questions each got. Open one in a new tab to see every Cambridge question on it.
What you needed in this session
Cambridge’s own grade thresholds for 2025 May/June, Paper 5 · Variant 2. A higher threshold means an easier paper — the bar moves with how the cohort did.