Cambridge IGCSE Science - Combined 0653 — 2022 Feb/March Paper 6 · Variant 2
0653/62/F/M/22 · 4 questions · 40 marks · ≈45 min
The question paper and its mark scheme, free to read here and free to download. This is Cambridge’s own paper, exactly as it was sat.
Question paper12 pages
Mark scheme8 pages
Answers below. Sit the paper first if you are practising.
Questions as text
Q1 · A student investigates the rate of an enzyme-catalysed reaction
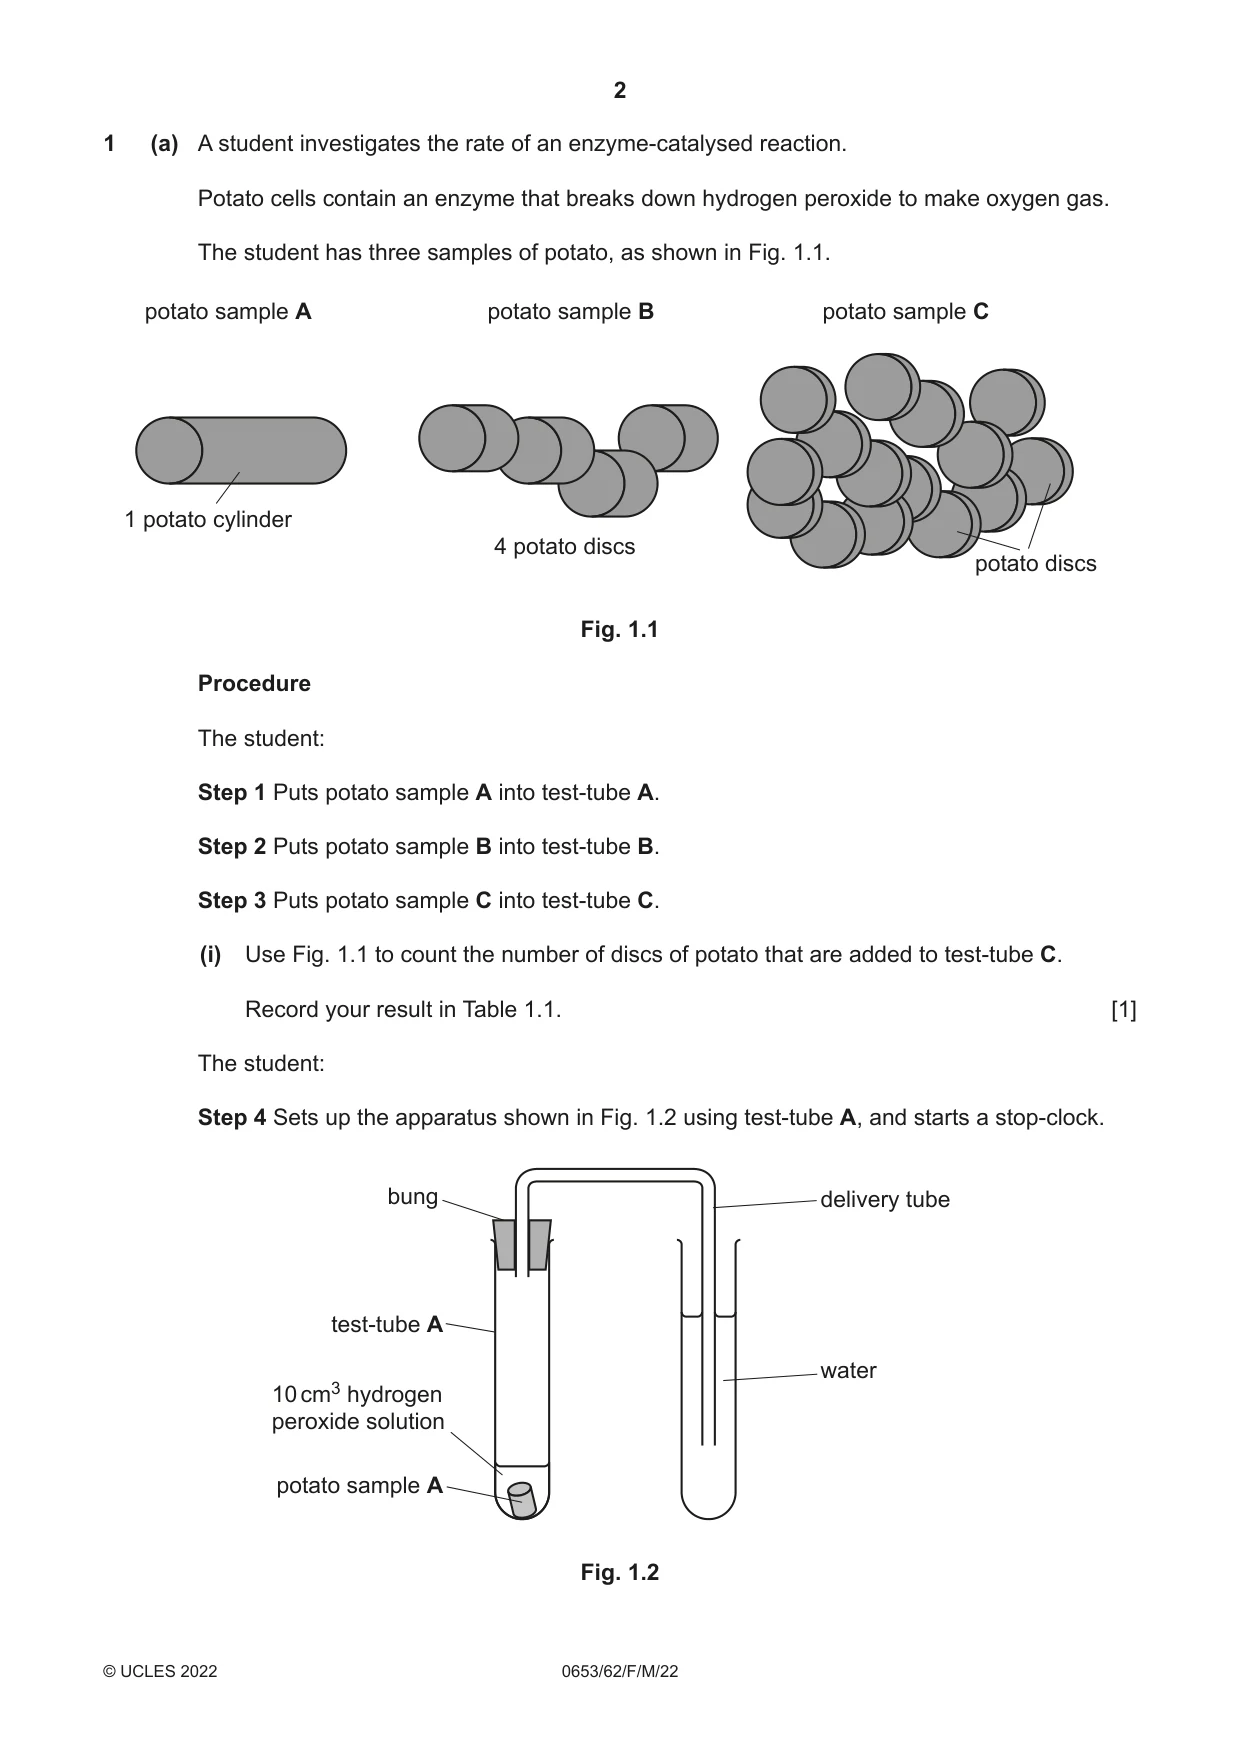
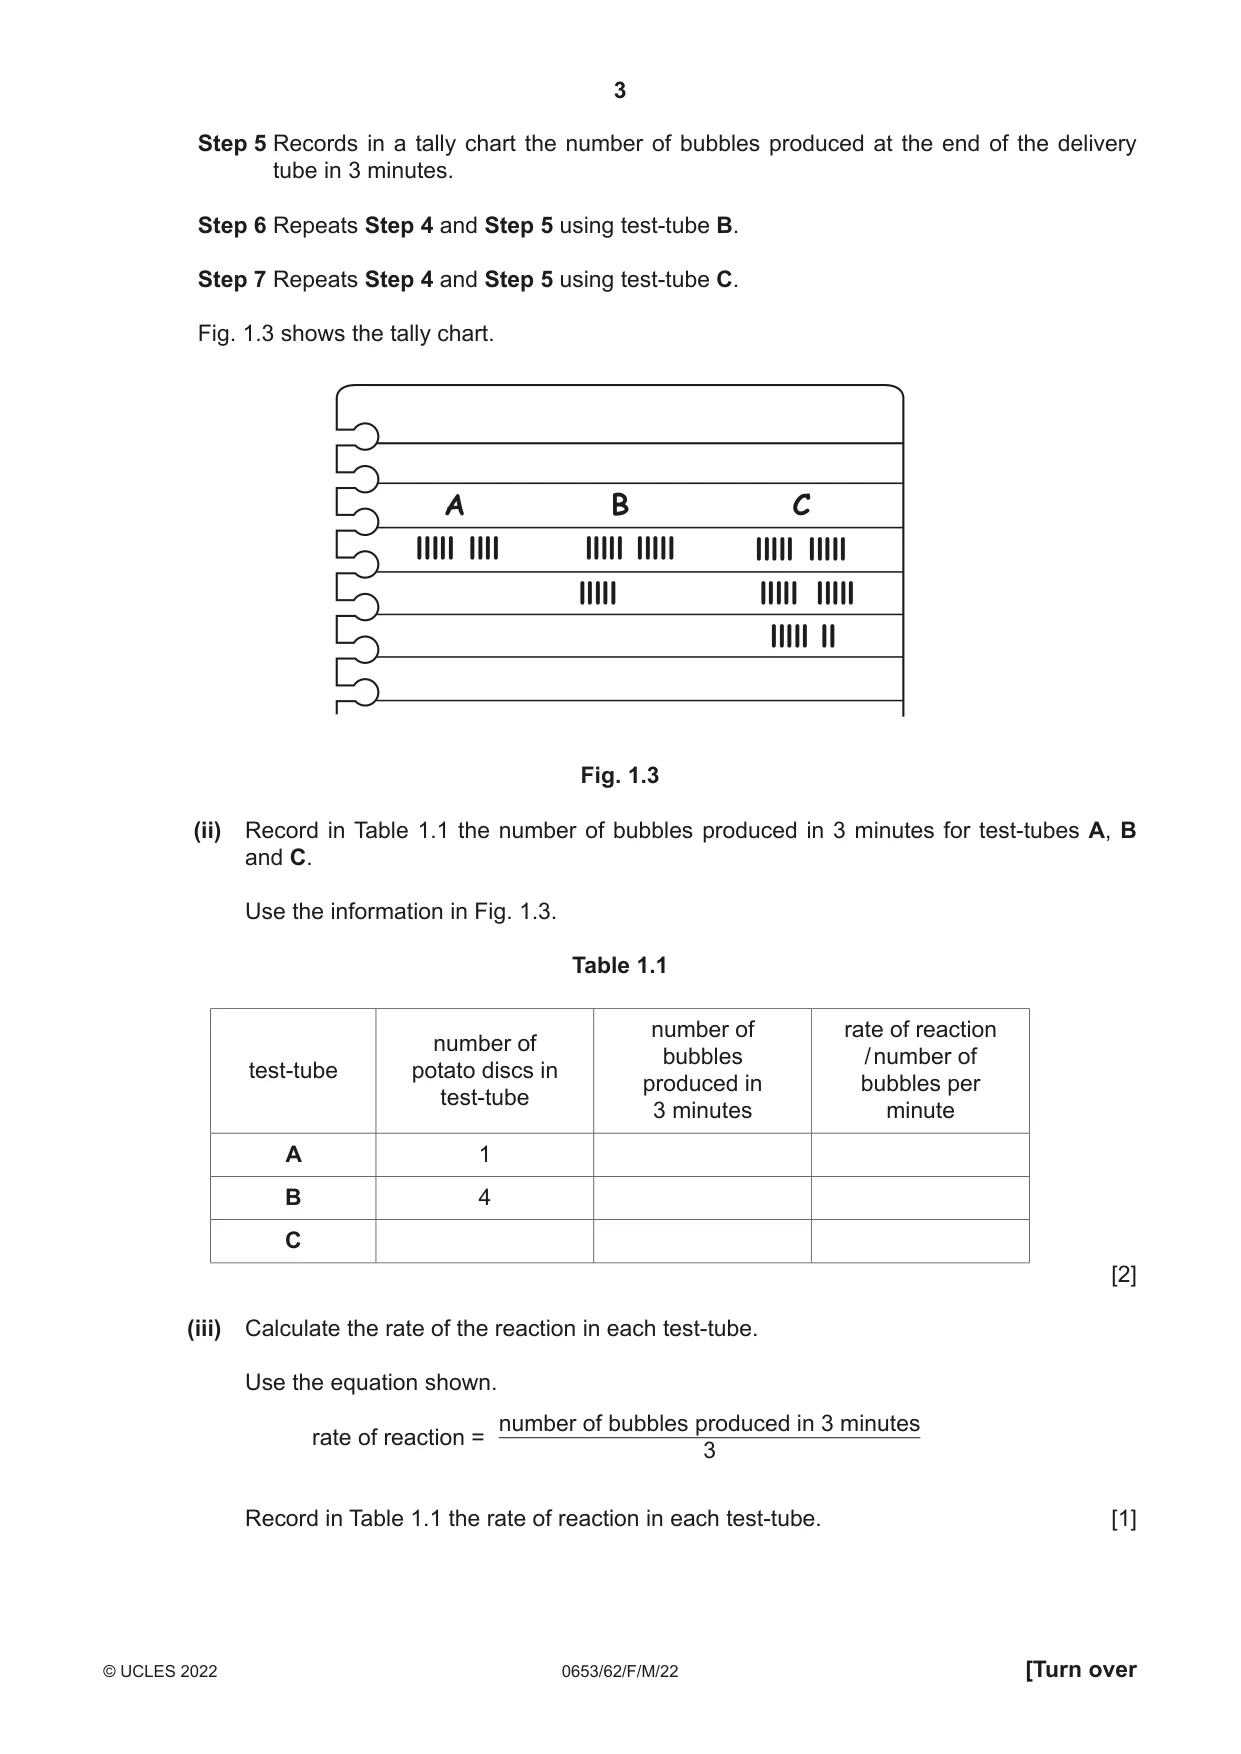
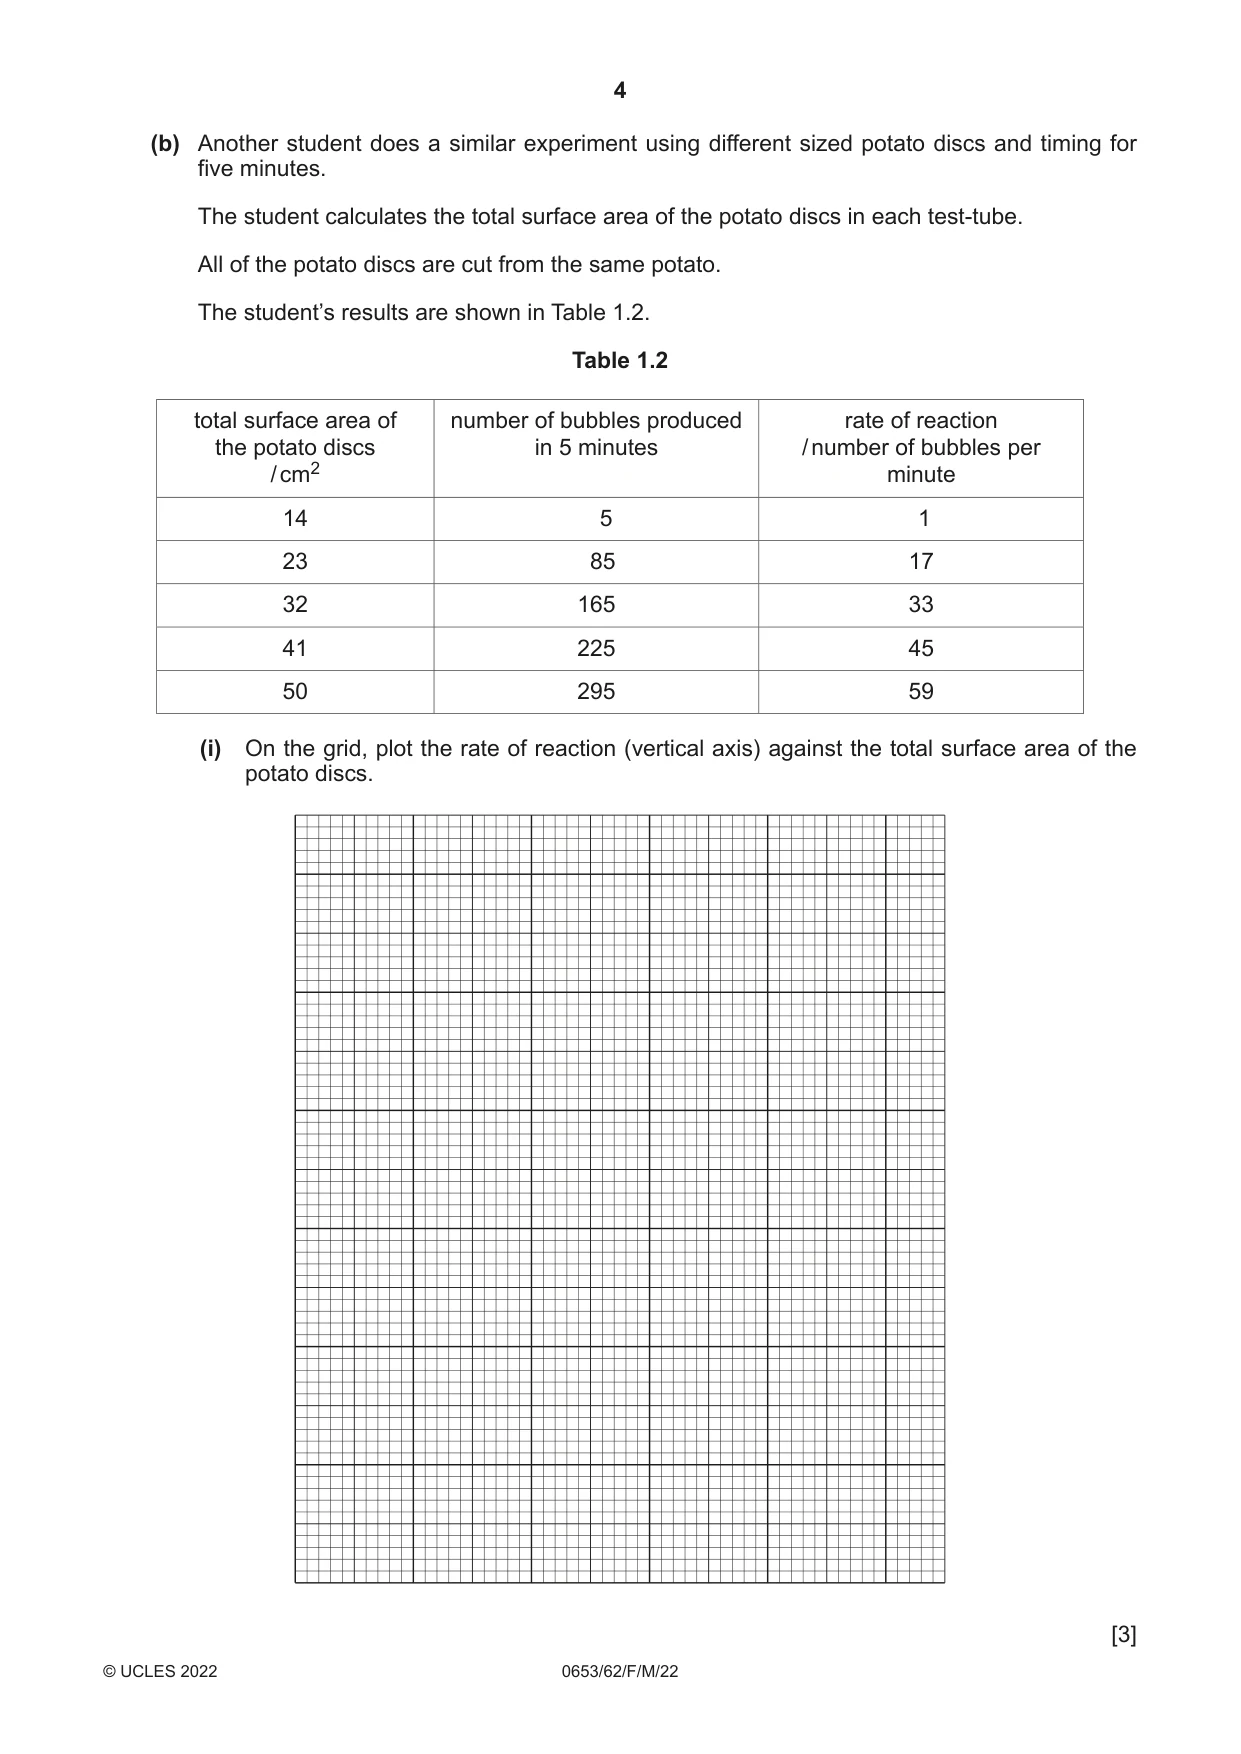
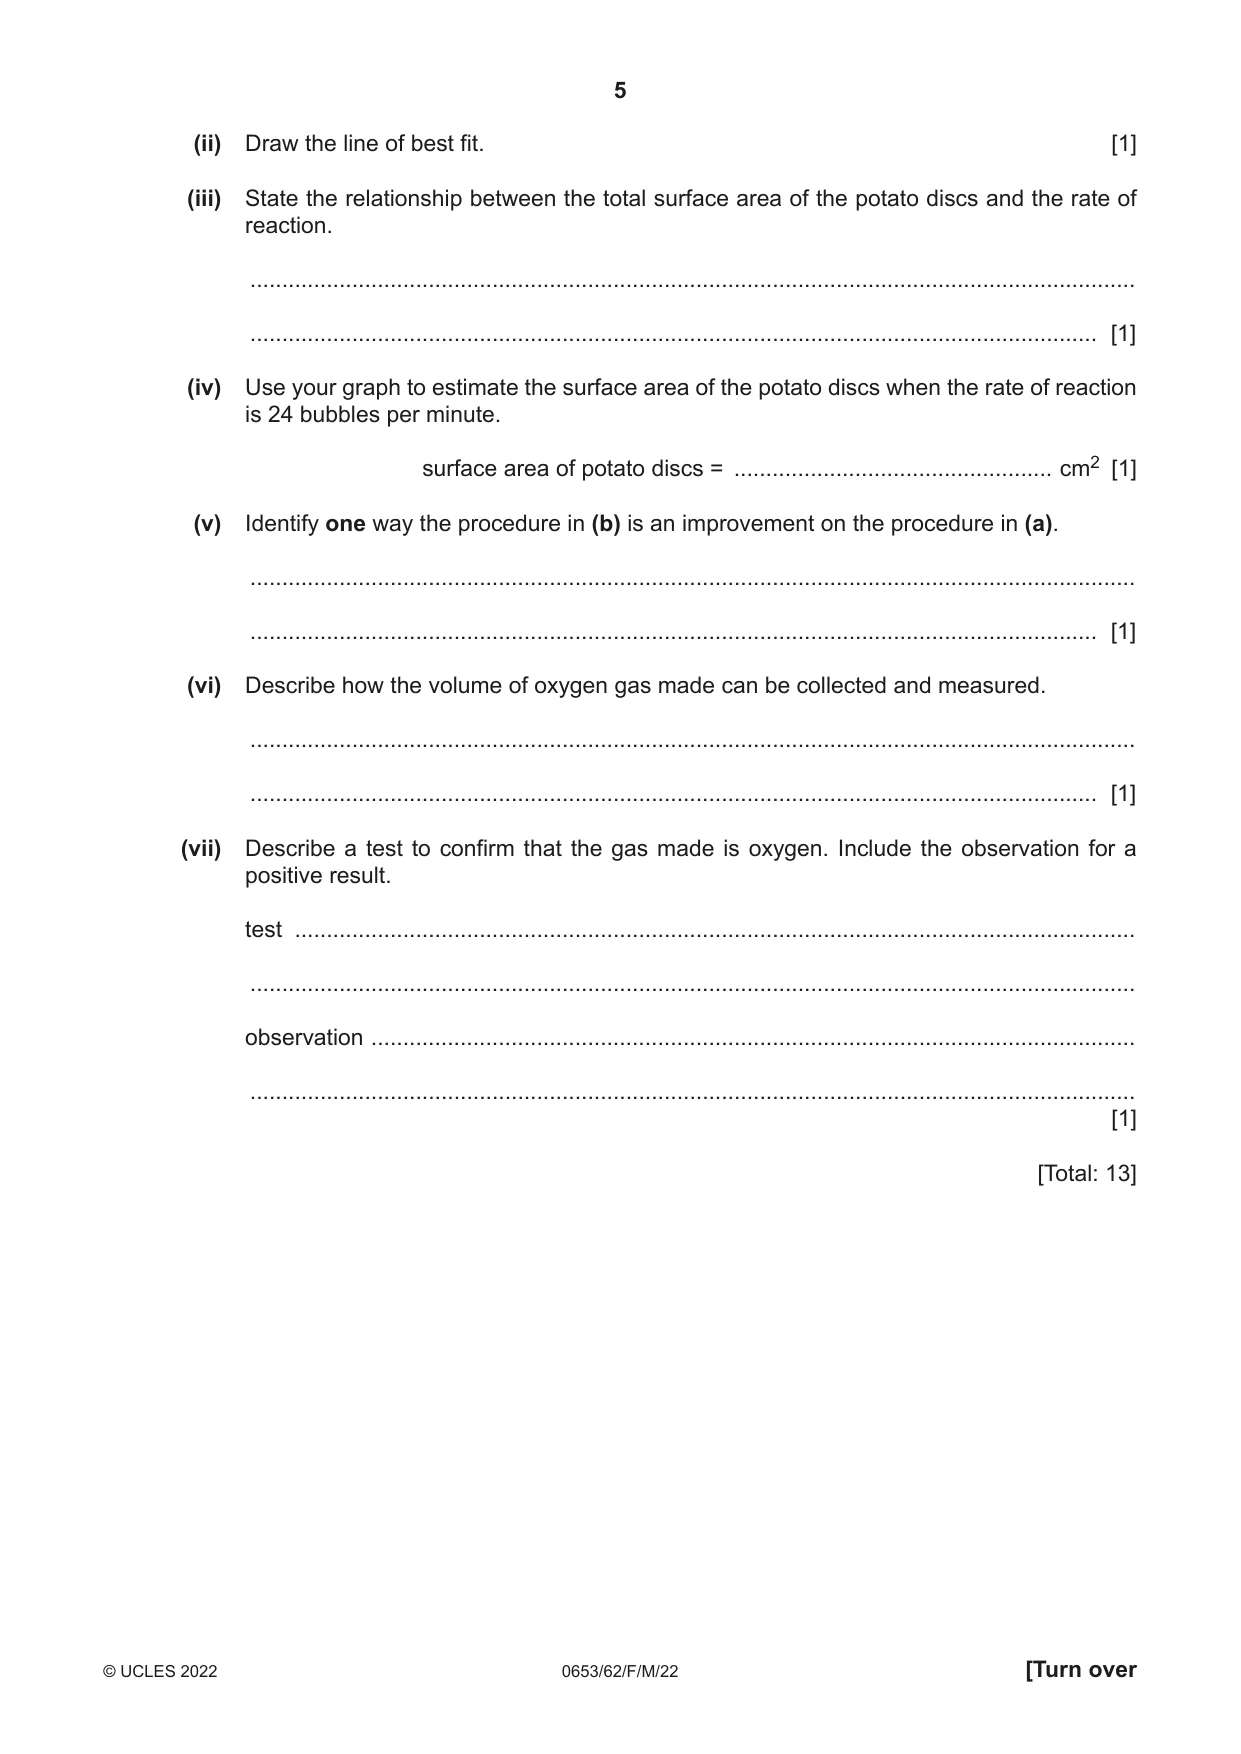
1 (a) A student investigates the rate of an enzyme-catalysed reaction. Potato cells contain an enzyme that breaks down hydrogen peroxide to make oxygen gas. The student has three samples of potato, as shown in Fig. 1.1. potato sample A potato sample B potato sample C 1 potato cylinder 4 potato discs potato discs Fig. 1.1 Procedure The student: Step 1 Puts potato sample A into test-tube A. Step 2 Puts potato sample B into test-tube B. Step 3 Puts potato sample C into test-tube C. (i) Use Fig. 1.1 to count the number of discs of potato that are added to test-tube C. Record your result in Table 1.1. [1] The student: Step 4 Sets up the apparatus shown in Fig. 1.2 using test-tube A, and starts a stop-clock. bung delivery tube test-tube A water 10 cm3 hydrogen peroxide solution potato sample A Fig. 1.2 Step 5 Records in a tally chart the number of bubbles produced at the end of the delivery tube in 3 minutes. Step 6 Repeats Step 4 and Step 5 using test-tube B. Step 7 Repeats Step 4 and Step 5 using test-tube C. Fig. 1.3 shows the tally chart. A B C lllll llll lllll lllll lllll lllll lllll lllll lllll lllll ll Fig. 1.3 (ii) Record in Table 1.1 the number of bubbles produced in 3 minutes for test-tubes A, B and C. Use the information in Fig. 1.3. Table 1.1 number of rate of reaction number of bubbles / number of test-tube potato discs in produced in bubbles per test-tube 3 minutes minute A 1 B 4 C [2] (iii) Calculate the rate of the reaction in each test-tube. Use the equation shown. number of bubbles produced in 3 minutes rate of reaction = 3 Record in Table 1.1 the rate of reaction in each test-tube. [1] (b) Another student does a similar experiment using different sized potato discs and timing for five minutes. The student calculates the total surface area of the potato discs in each test-tube. All of the potato discs are cut from the same potato. The student’s results are shown in Table 1.2. Table 1.2 total surface area of number of bubbles produced rate of reaction the potato discs in 5 minutes / number of bubbles per / cm2 minute 14 5 1 23 85 17 32 165 33 41 225 45 50 295 59 (i) On the grid, plot the rate of reaction (vertical axis) against the total surface area of the potato discs. [3] (ii) Draw the line of best fit. [1] (iii) State the relationship between the total surface area of the potato discs and the rate of reaction. ........................................................................................................................................... ..................................................................................................................................... [1] (iv) Use your graph to estimate the surface area of the potato discs when the rate of reaction is 24 bubbles per minute. surface area of potato discs = .................................................. cm2 [1] (v) Identify one way the procedure in (b) is an improvement on the procedure in (a). ........................................................................................................................................... ..................................................................................................................................... [1] (vi) Describe how the volume of oxygen gas made can be collected and measured. ........................................................................................................................................... ..................................................................................................................................... [1] (vii) Describe a test to confirm that the gas made is oxygen. Include the observation for a positive result. test .................................................................................................................................... ........................................................................................................................................... observation ........................................................................................................................ ........................................................................................................................................... [1] [Total: 13]
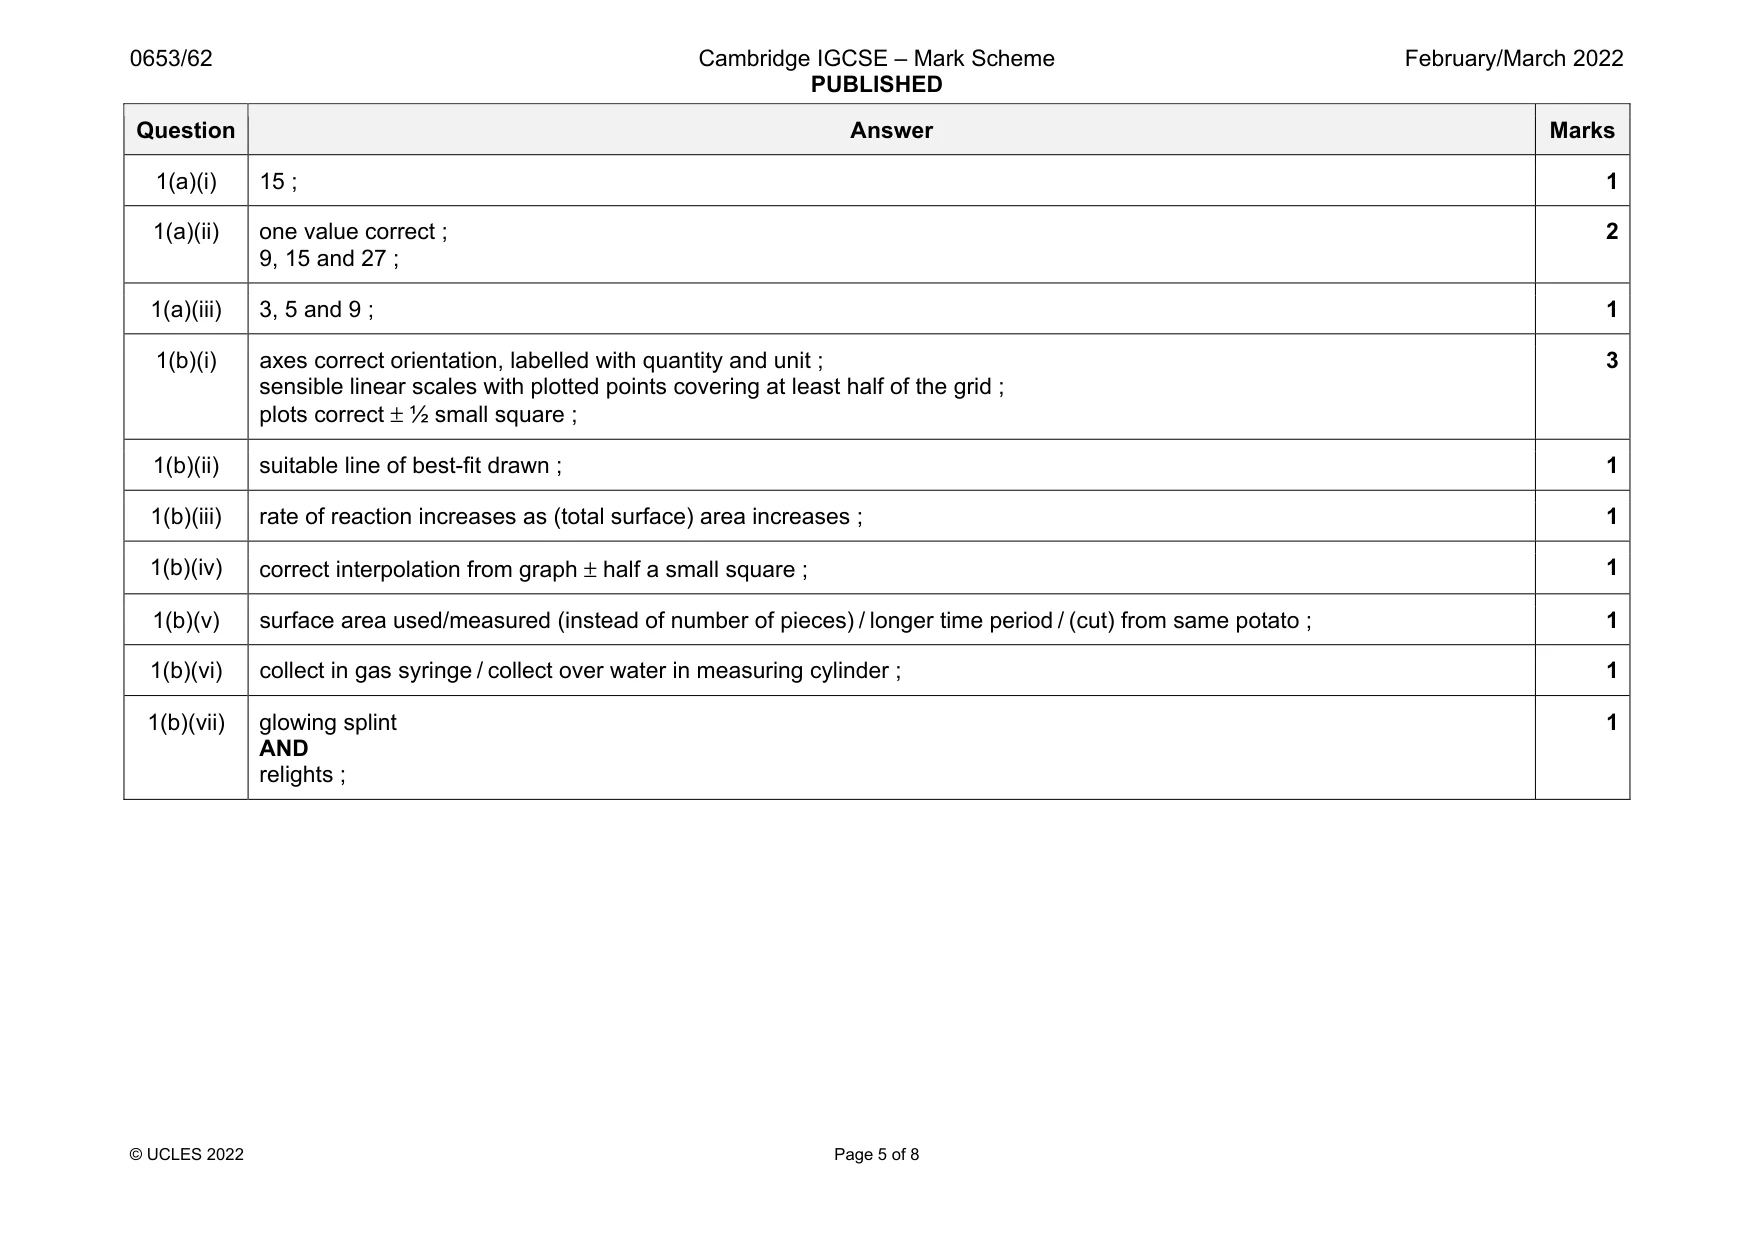
Mark scheme: 1(a)(i) 15 ; 1 1(a)(ii) one value correct ; 9, 15 and 27 ; 2 1(a)(iii) 3, 5 and 9 ; 1 1(b)(i) axes correct orientation, labelled with quantity and unit ; sensible linear scales with plotted points covering at least half of the grid ; plots correct ± ½ small square ; 3 1(b)(ii) suitable line of best-fit drawn ; 1 1(b)(iii) rate of reaction increases as (total surface) area increases ; 1 1(b)(iv) correct interpolation from graph ± half a small square ; 1 1(b)(v) surface area used/measured (instead of number of pieces) / longer time period / (cut) from same potato ; 1 1(b)(vi) collect in gas syringe / collect over water in measuring cylinder ; 1 1(b)(vii) glowing splint AND relights ; 1
Q2 · A student investigates some properties of solid H
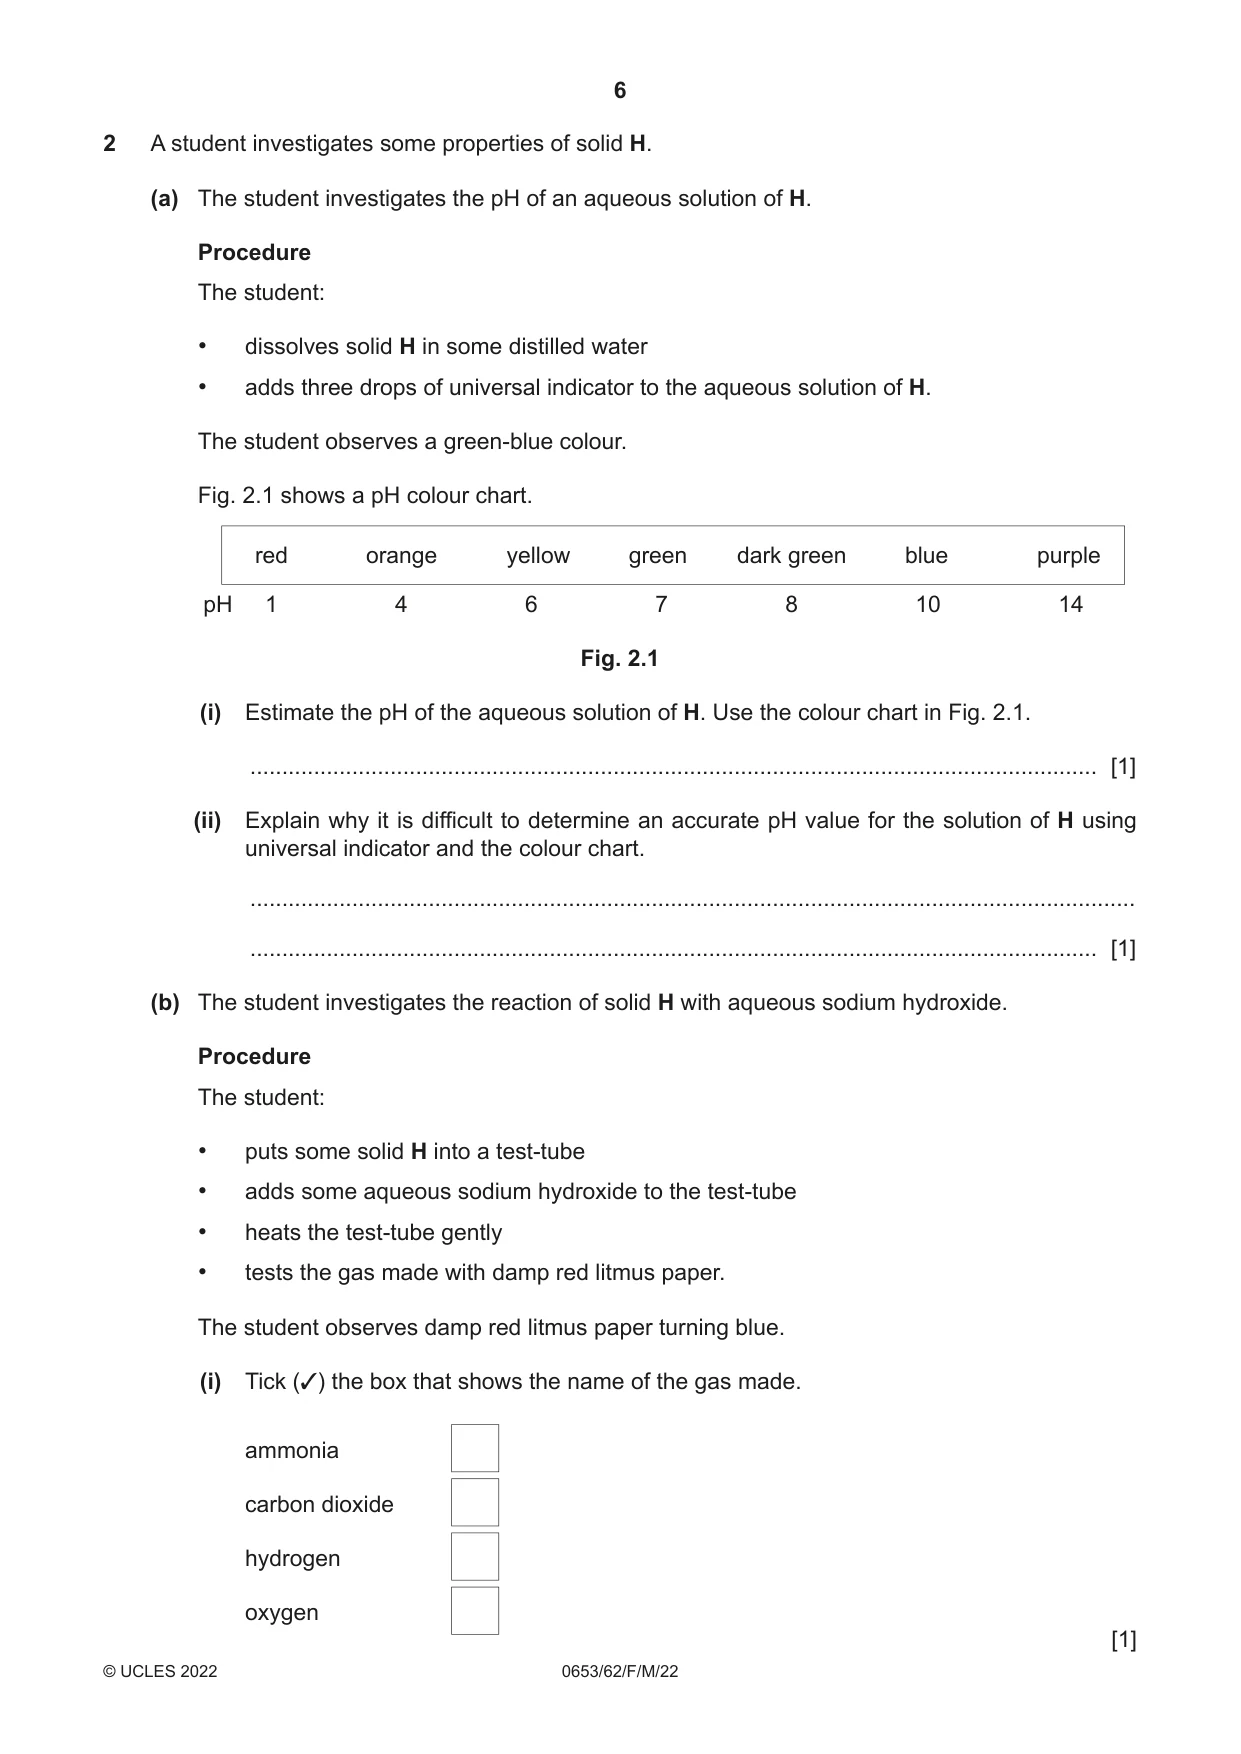
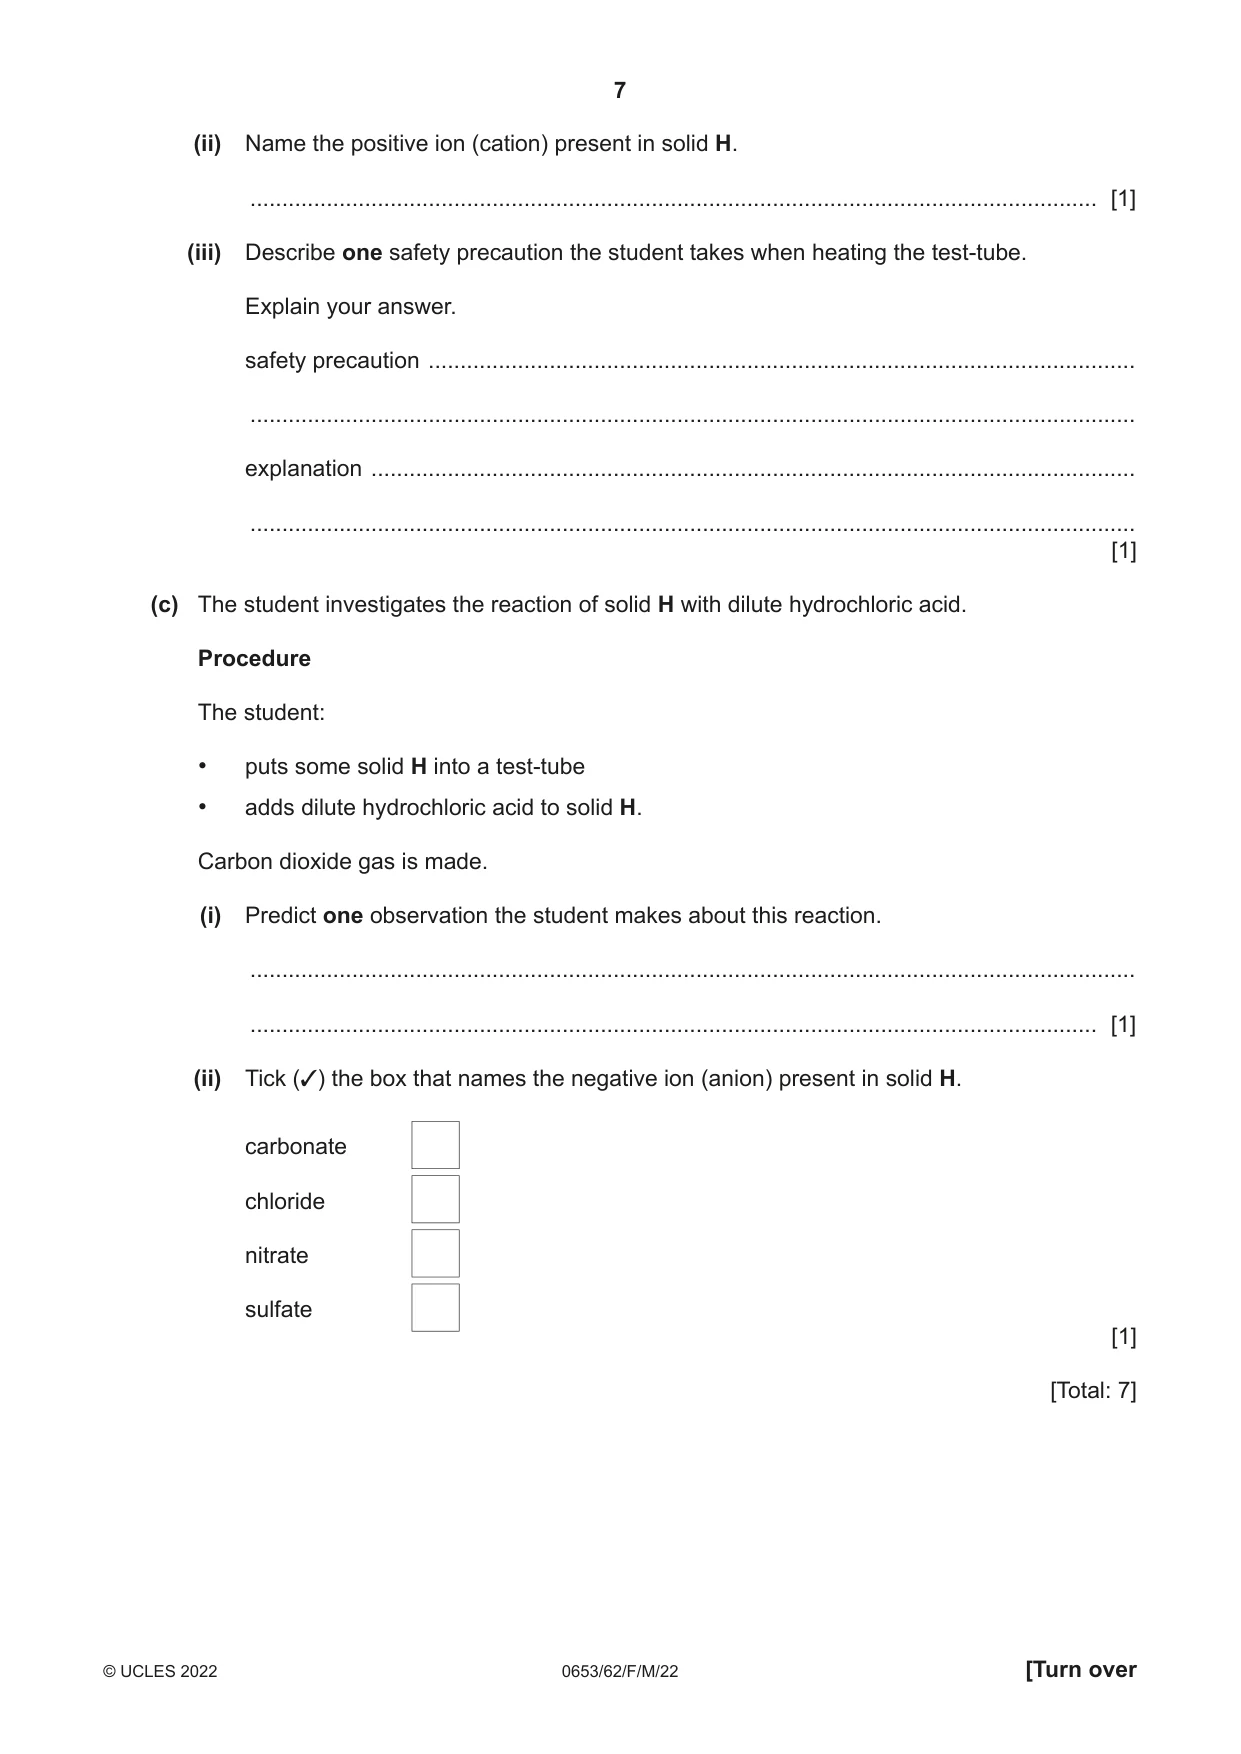
2 A student investigates some properties of solid H. (a) The student investigates the pH of an aqueous solution of H. Procedure The student: • dissolves solid H in some distilled water • adds three drops of universal indicator to the aqueous solution of H. The student observes a green-blue colour. Fig. 2.1 shows a pH colour chart. red orange yellow green dark green blue purple pH 1 4 6 7 8 10 14 Fig. 2.1 (i) Estimate the pH of the aqueous solution of H. Use the colour chart in Fig. 2.1. ..................................................................................................................................... [1] (ii) Explain why it is difficult to determine an accurate pH value for the solution of H using universal indicator and the colour chart. ........................................................................................................................................... ..................................................................................................................................... [1] (b) The student investigates the reaction of solid H with aqueous sodium hydroxide. Procedure The student: • puts some solid H into a test-tube • adds some aqueous sodium hydroxide to the test-tube • heats the test-tube gently • tests the gas made with damp red litmus paper. The student observes damp red litmus paper turning blue. (i) Tick (3) the box that shows the name of the gas made. ammonia carbon dioxide hydrogen oxygen [1] (ii) Name the positive ion (cation) present in solid H. ..................................................................................................................................... [1] (iii) Describe one safety precaution the student takes when heating the test-tube. Explain your answer. safety precaution ............................................................................................................... ........................................................................................................................................... explanation ........................................................................................................................ ........................................................................................................................................... [1] (c) The student investigates the reaction of solid H with dilute hydrochloric acid. Procedure The student: • puts some solid H into a test-tube • adds dilute hydrochloric acid to solid H. Carbon dioxide gas is made. (i) Predict one observation the student makes about this reaction. ........................................................................................................................................... ..................................................................................................................................... [1] (ii) Tick (3) the box that names the negative ion (anion) present in solid H. carbonate chloride nitrate sulfate [1] [Total: 7]
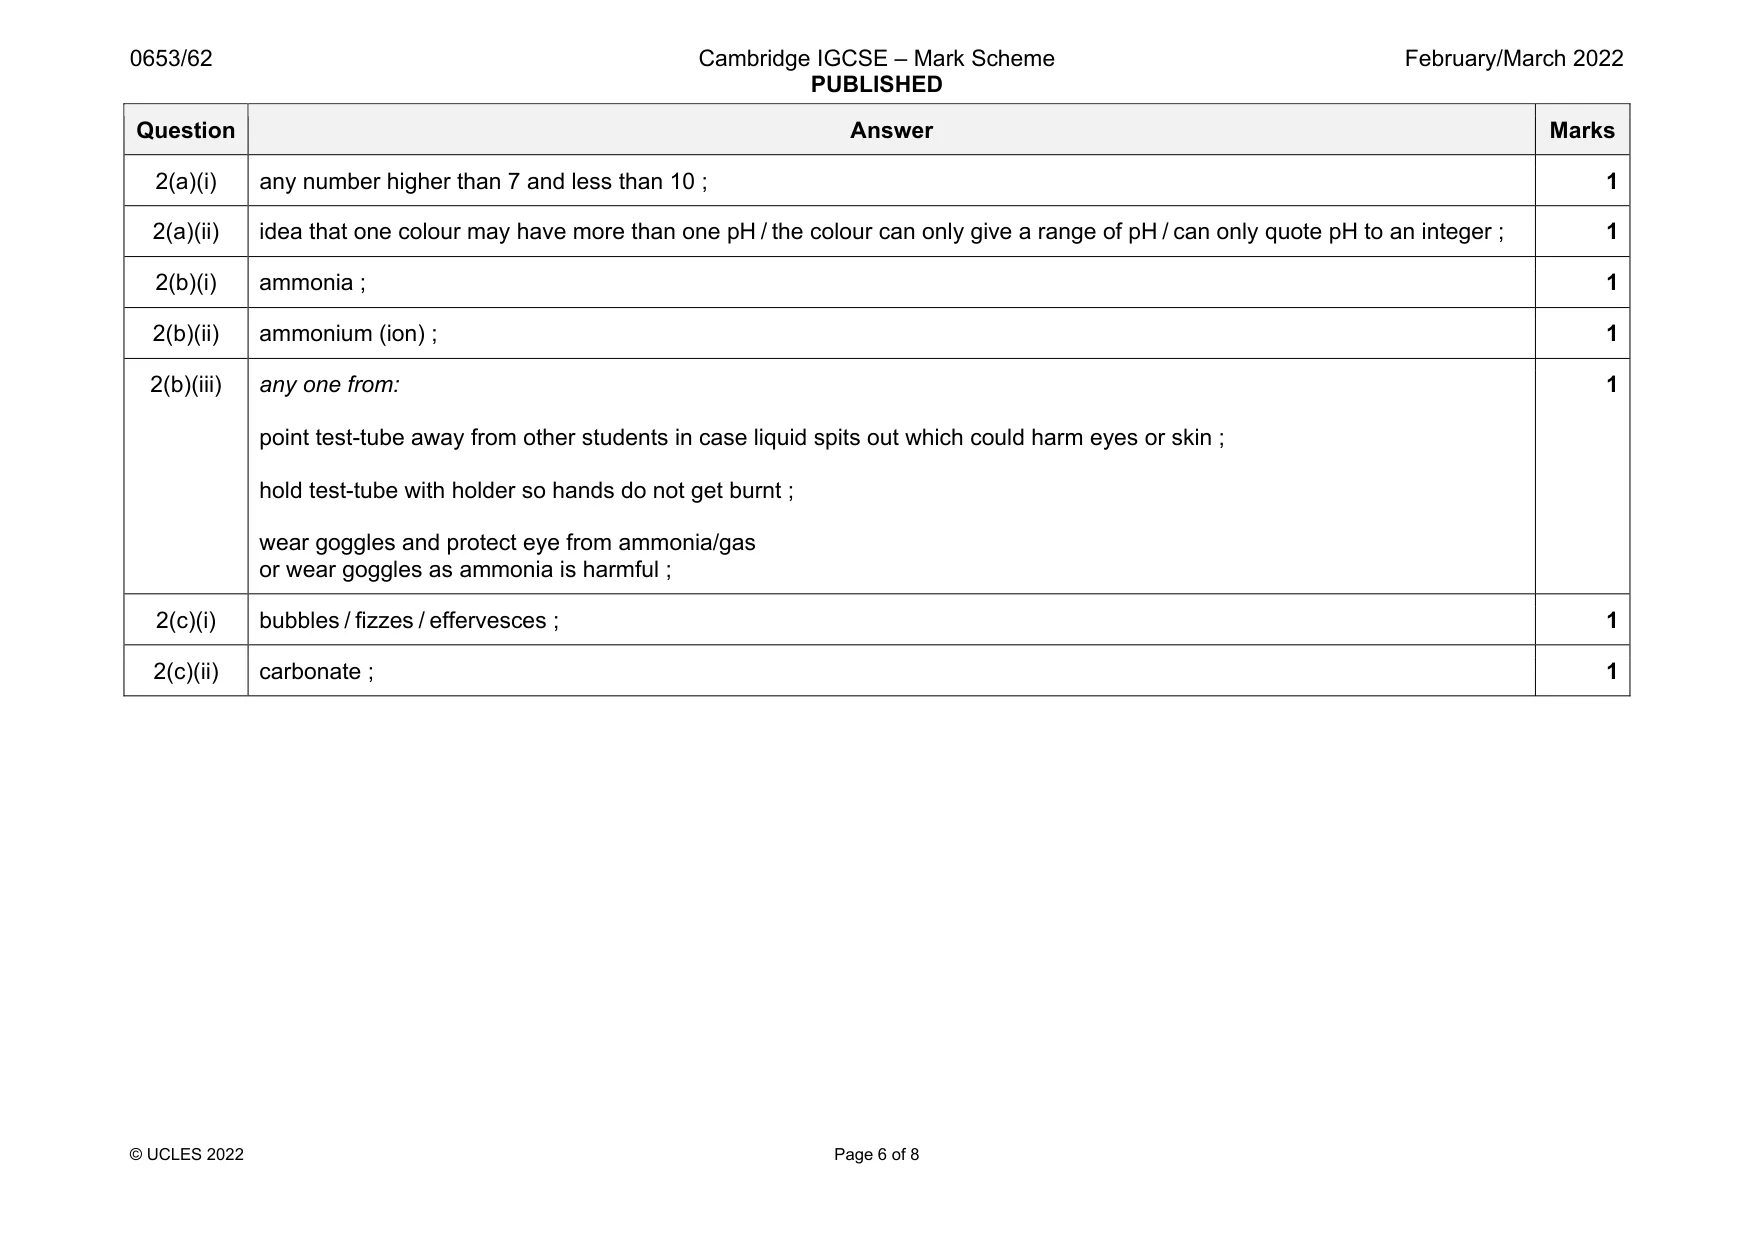
Mark scheme: 2(a)(i) any number higher than 7 and less than 10 ; 1 2(a)(ii) idea that one colour may have more than one pH / the colour can only give a range of pH / can only quote pH to an integer ; 1 2(b)(i) ammonia ; 1 2(b)(ii) ammonium (ion) ; 1 2(b)(iii) any one from: point test-tube away from other students in case liquid spits out which could harm eyes or skin ; hold test-tube with holder so hands do not get burnt ; wear goggles and protect eye from ammonia/gas or wear goggles as ammonia is harmful ; 1 2(c)(i) bubbles / fizzes / effervesces ; 1 2(c)(ii) carbonate ; 1
Q3 · Magnesium carbonate is a white solid that decomposes when heated
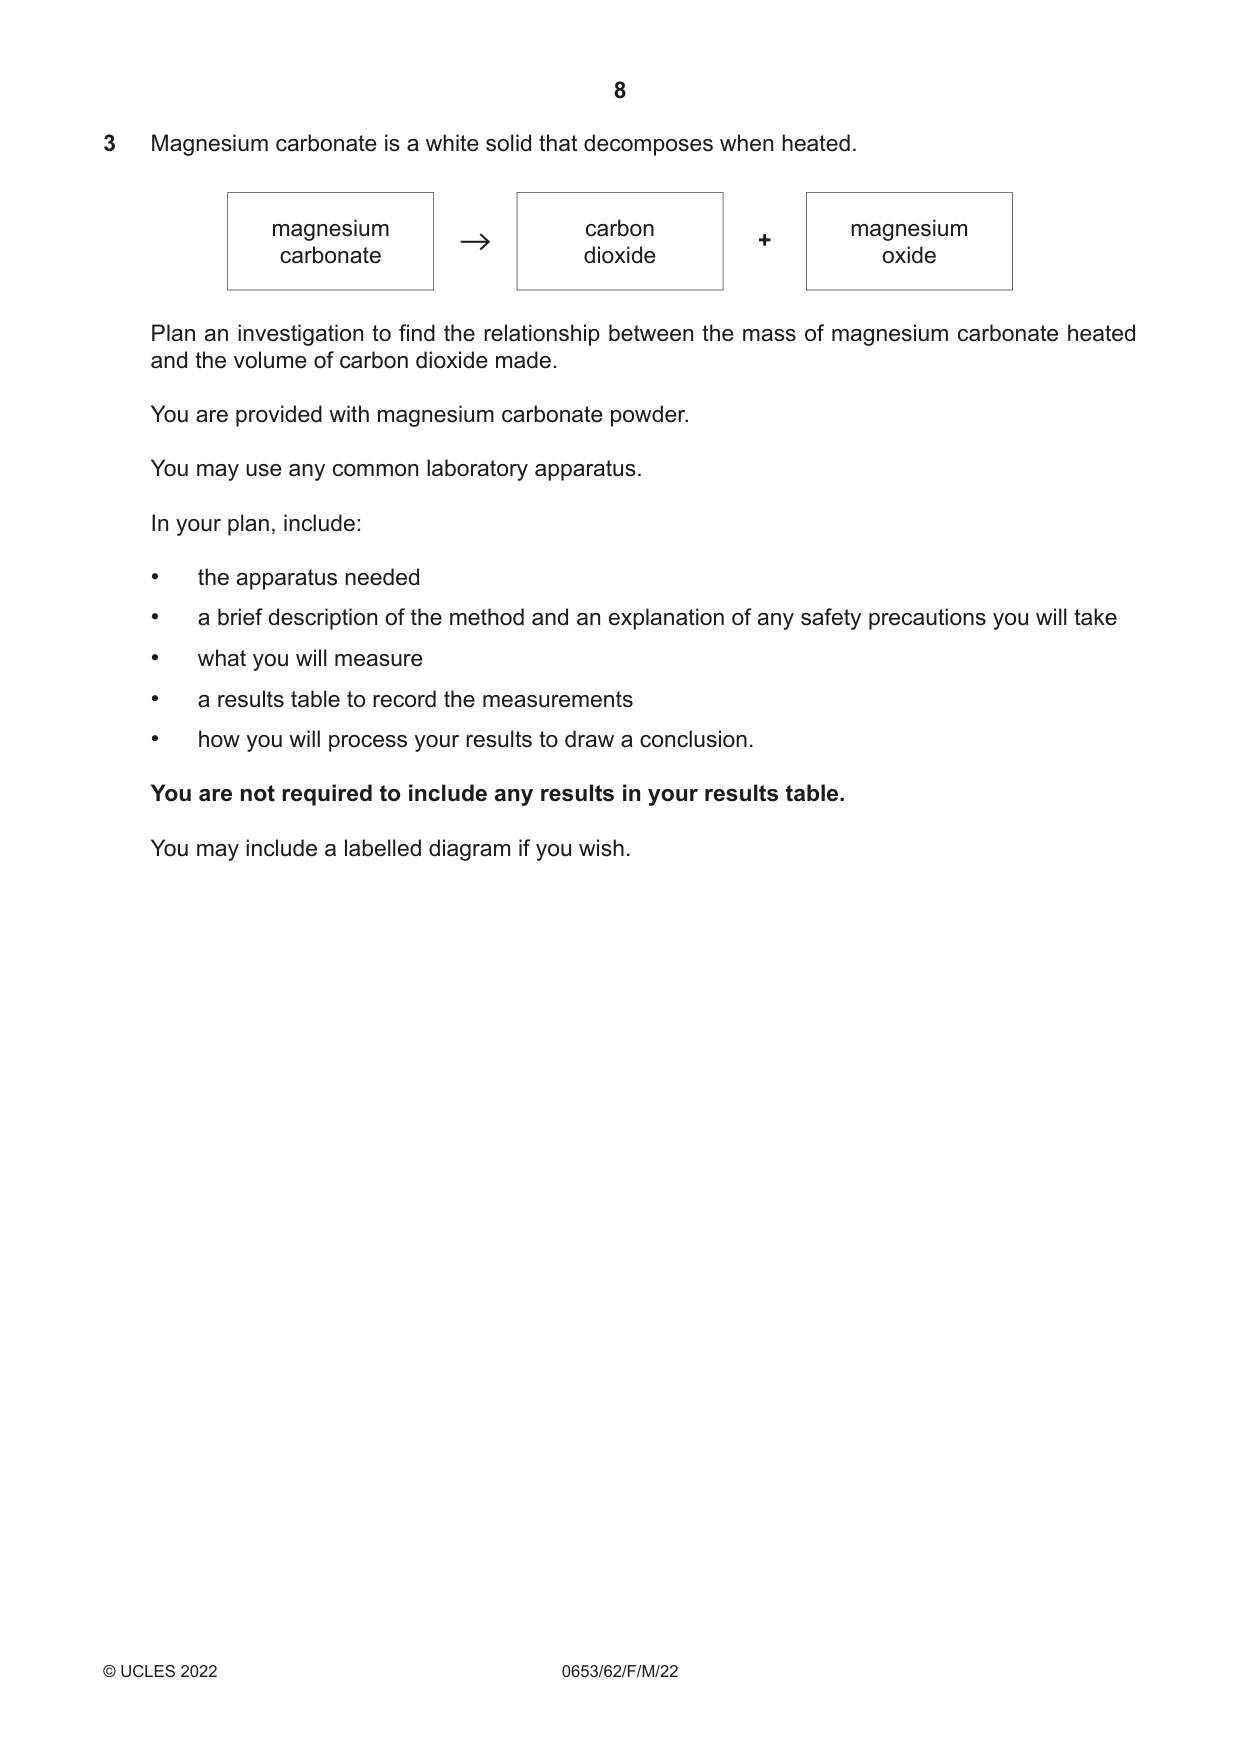
3 Magnesium carbonate is a white solid that decomposes when heated. magnesium carbon magnesium + carbonate dioxide oxide Plan an investigation to find the relationship between the mass of magnesium carbonate heated and the volume of carbon dioxide made. You are provided with magnesium carbonate powder. You may use any common laboratory apparatus. In your plan, include: • the apparatus needed • a brief description of the method and an explanation of any safety precautions you will take • what you will measure • a results table to record the measurements • how you will process your results to draw a conclusion. You are not required to include any results in your results table. You may include a labelled diagram if you wish. .......................................................................................................................................................... .......................................................................................................................................................... .......................................................................................................................................................... .......................................................................................................................................................... .......................................................................................................................................................... .......................................................................................................................................................... .......................................................................................................................................................... .......................................................................................................................................................... .......................................................................................................................................................... .......................................................................................................................................................... .......................................................................................................................................................... .......................................................................................................................................................... .......................................................................................................................................................... .................................................................................................................................................... [7]
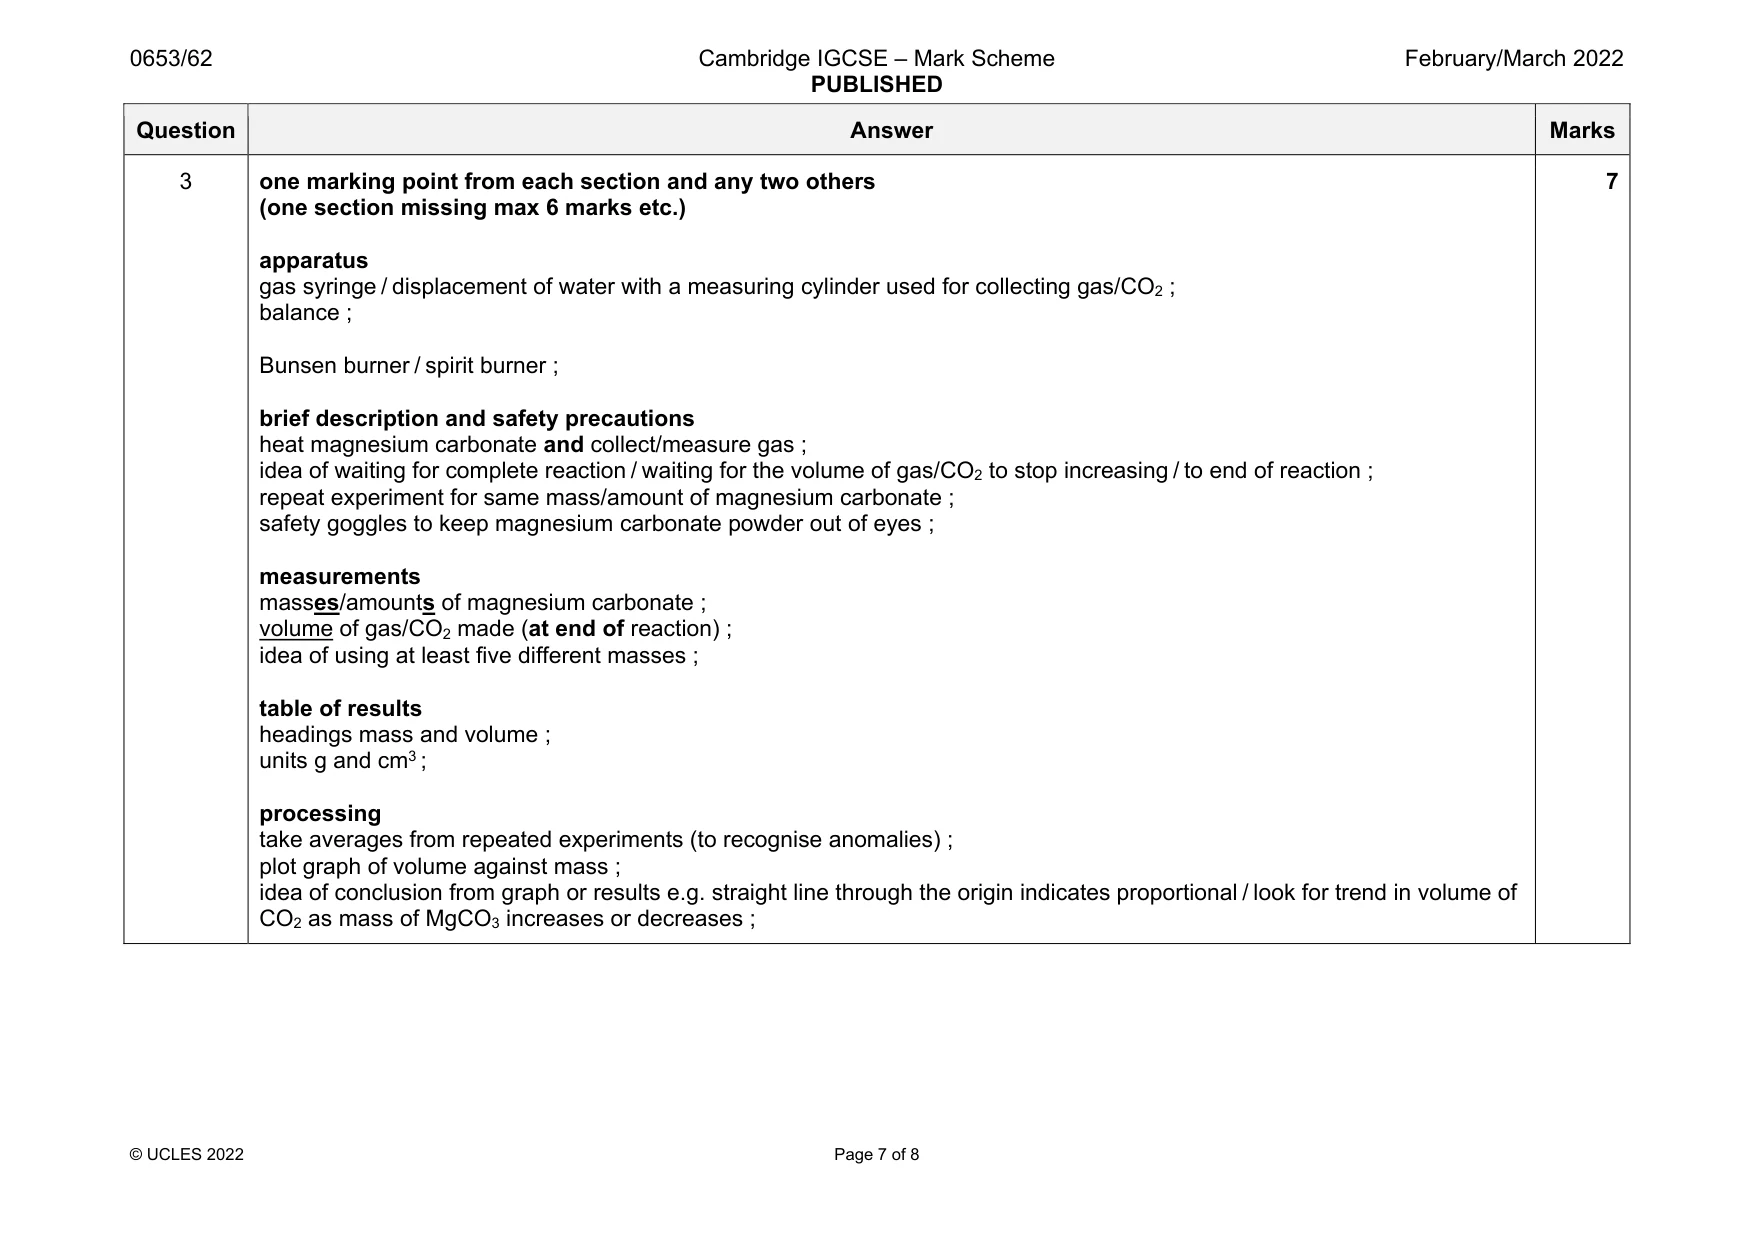
Mark scheme: 3 one marking point from each section and any two others (one section missing max 6 marks etc.) apparatus gas syringe / displacement of water with a measuring cylinder used for collecting gas/CO2 ; balance ; Bunsen burner / spirit burner ; brief description and safety precautions heat magnesium carbonate and collect/measure gas ; idea of waiting for complete reaction / waiting for the volume of gas/CO2 to stop increasing / to end of reaction ; repeat experiment for same mass/amount of magnesium carbonate ; safety goggles to keep magnesium carbonate powder out of eyes ; measurements masses/amounts of magnesium carbonate ; volume of gas/CO2 made (at end of reaction) ; idea of using at least five different masses ; table of results headings mass and volume ; units g and cm3 ; processing take averages from repeated experiments (to recognise anomalies) ; plot graph of volume against mass ; idea of conclusion from graph or results e.g. straight line through the origin indicates proportional / look for trend in volume of CO2 as mass of MgCO3 increases or decreases ; 7
Q4 · A student calculates the work done when a metal block slides down a ramp
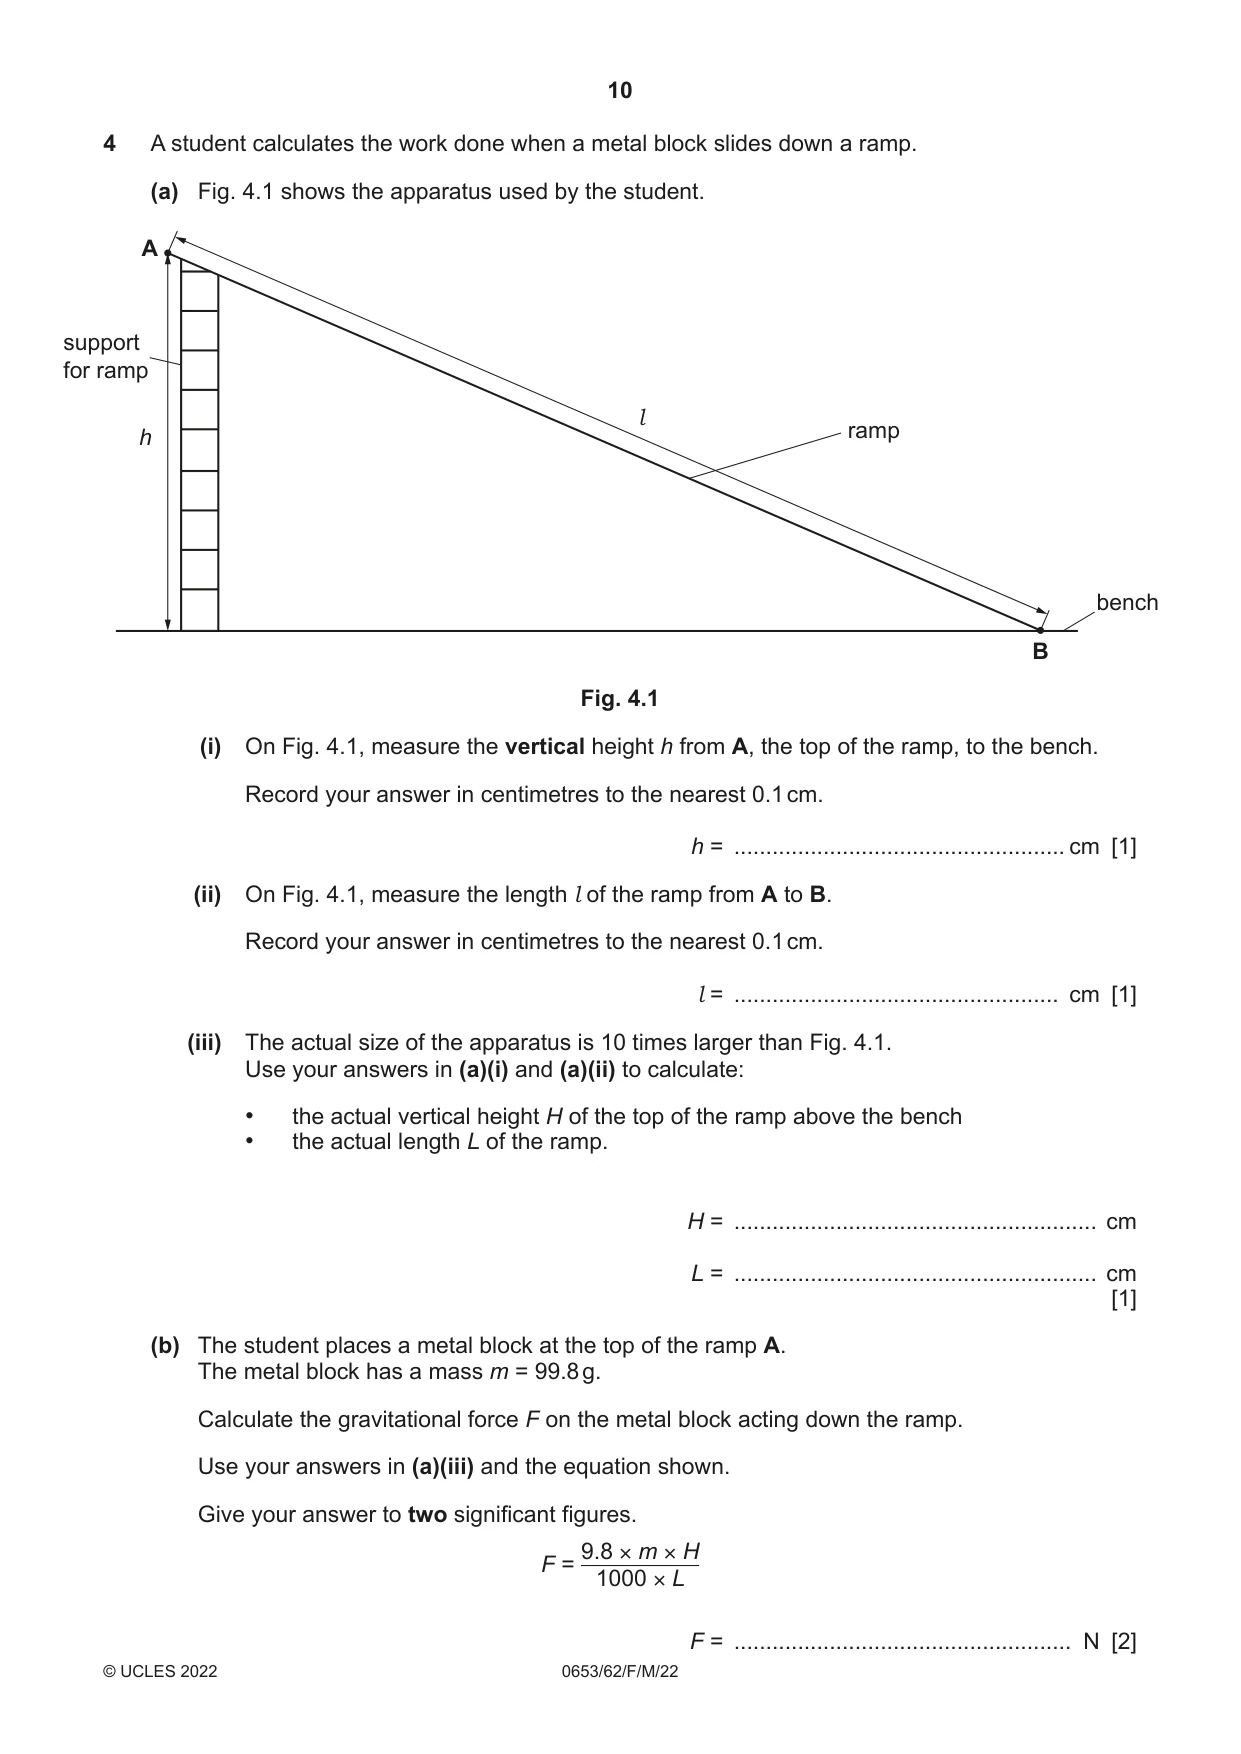
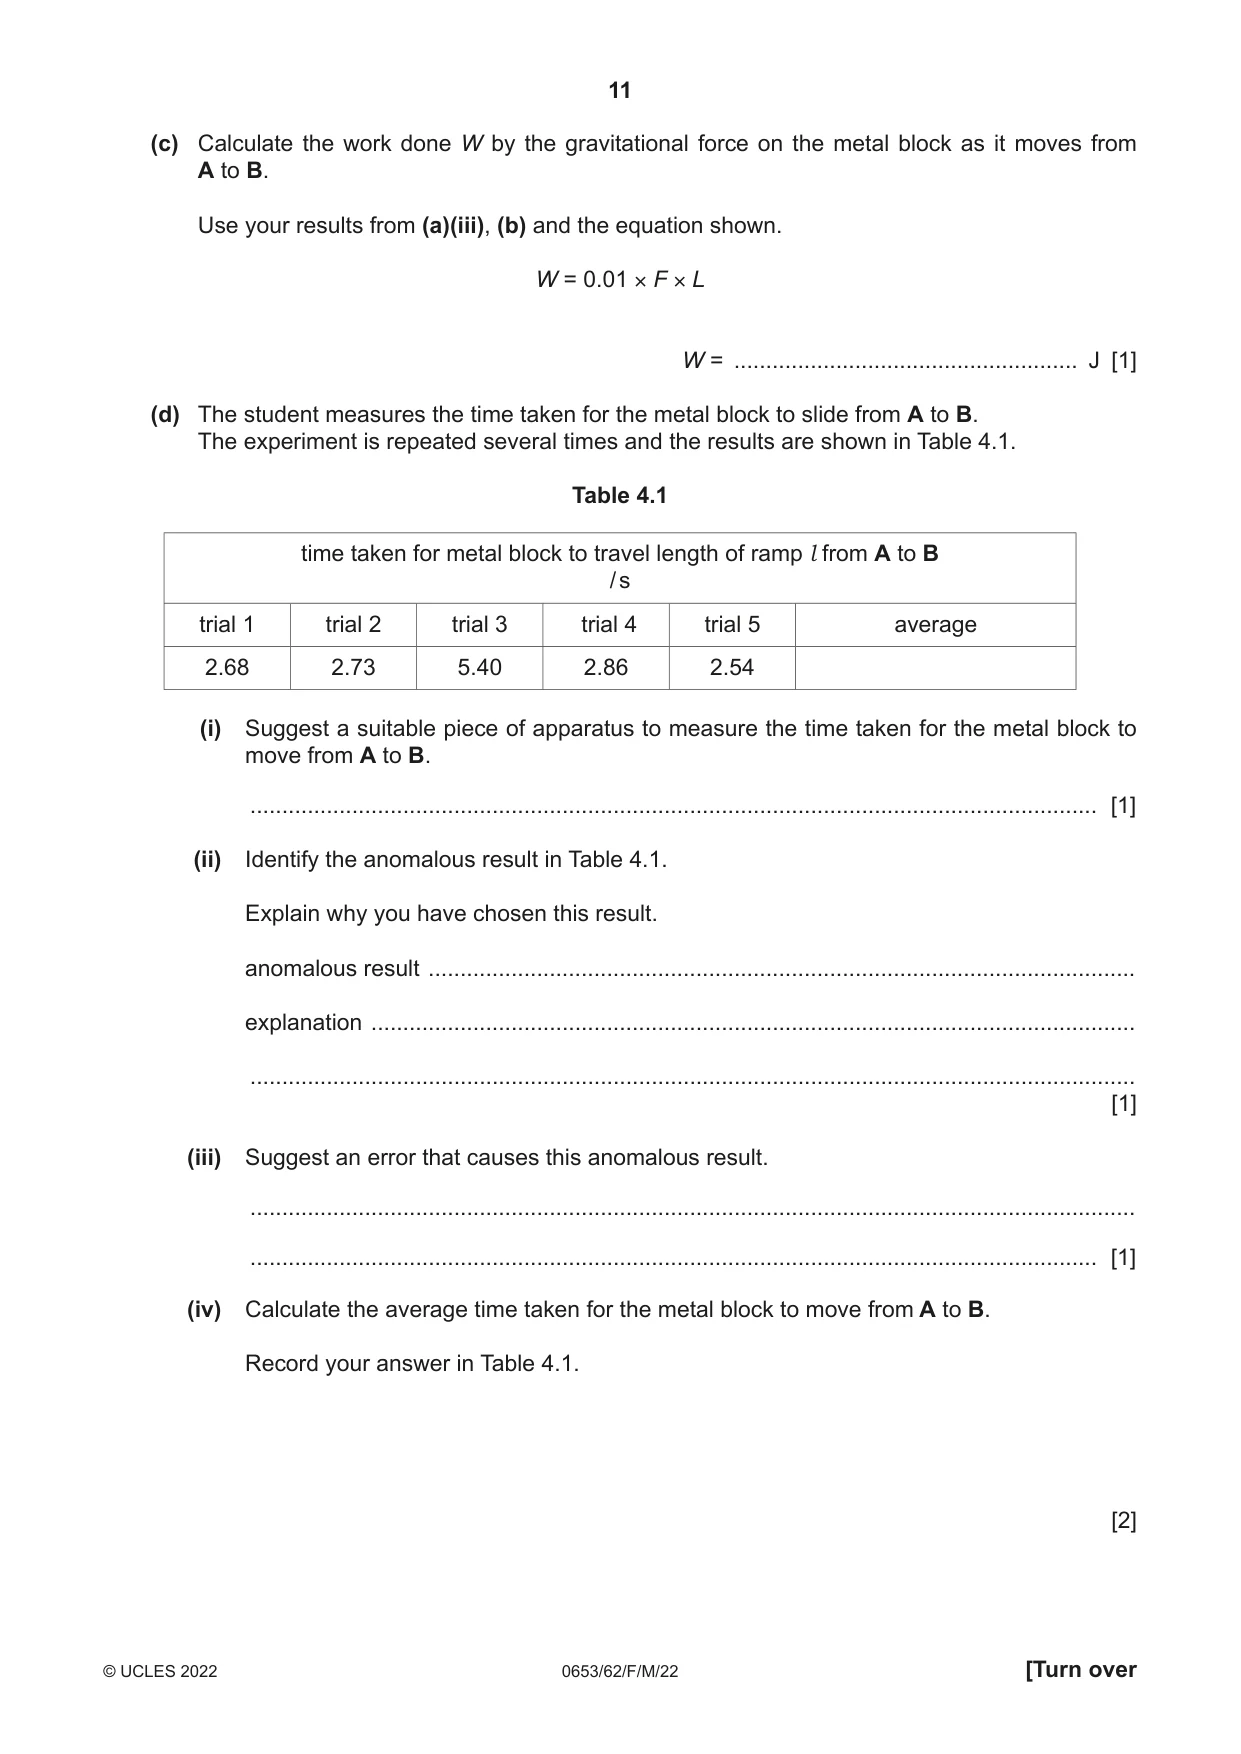
4 A student calculates the work done when a metal block slides down a ramp. (a) Fig. 4.1 shows the apparatus used by the student. A support for ramp l ramp h bench B Fig. 4.1 (i) On Fig. 4.1, measure the vertical height h from A, the top of the ramp, to the bench. Record your answer in centimetres to the nearest 0.1 cm. h = .................................................... cm [1] (ii) On Fig. 4.1, measure the length l of the ramp from A to B. Record your answer in centimetres to the nearest 0.1 cm. l = ................................................... cm [1] (iii) The actual size of the apparatus is 10 times larger than Fig. 4.1. Use your answers in (a)(i) and (a)(ii) to calculate: • the actual vertical height H of the top of the ramp above the bench • the actual length L of the ramp. H = ......................................................... cm L = ......................................................... cm [1] (b) The student places a metal block at the top of the ramp A. The metal block has a mass m = 99.8 g. Calculate the gravitational force F on the metal block acting down the ramp. Use your answers in (a)(iii) and the equation shown. Give your answer to two significant figures. 9.8 × m × H F = 1000 × L F = ..................................................... N [2] (c) Calculate the work done W by the gravitational force on the metal block as it moves from A to B. Use your results from (a)(iii), (b) and the equation shown. W = 0.01 × F × L W = ...................................................... J [1] (d) The student measures the time taken for the metal block to slide from A to B. The experiment is repeated several times and the results are shown in Table 4.1. Table 4.1 time taken for metal block to travel length of ramp l from A to B / s trial 1 trial 2 trial 3 trial 4 trial 5 average 2.68 2.73 5.40 2.86 2.54 (i) Suggest a suitable piece of apparatus to measure the time taken for the metal block to move from A to B. ..................................................................................................................................... [1] (ii) Identify the anomalous result in Table 4.1. Explain why you have chosen this result. anomalous result ............................................................................................................... explanation ........................................................................................................................ ........................................................................................................................................... [1] (iii) Suggest an error that causes this anomalous result. ........................................................................................................................................... ..................................................................................................................................... [1] (iv) Calculate the average time taken for the metal block to move from A to B. Record your answer in Table 4.1. [2] (e) A student says that measuring the time taken is inaccurate. Suggest one practical improvement to increase the accuracy of the measurement of the time taken. You can assume that all readings are taken avoiding line of sight (parallax) errors. Explain your answer. suggestion ................................................................................................................................ explanation ............................................................................................................................... ................................................................................................................................................... ................................................................................................................................................... [2] [Total: 13]
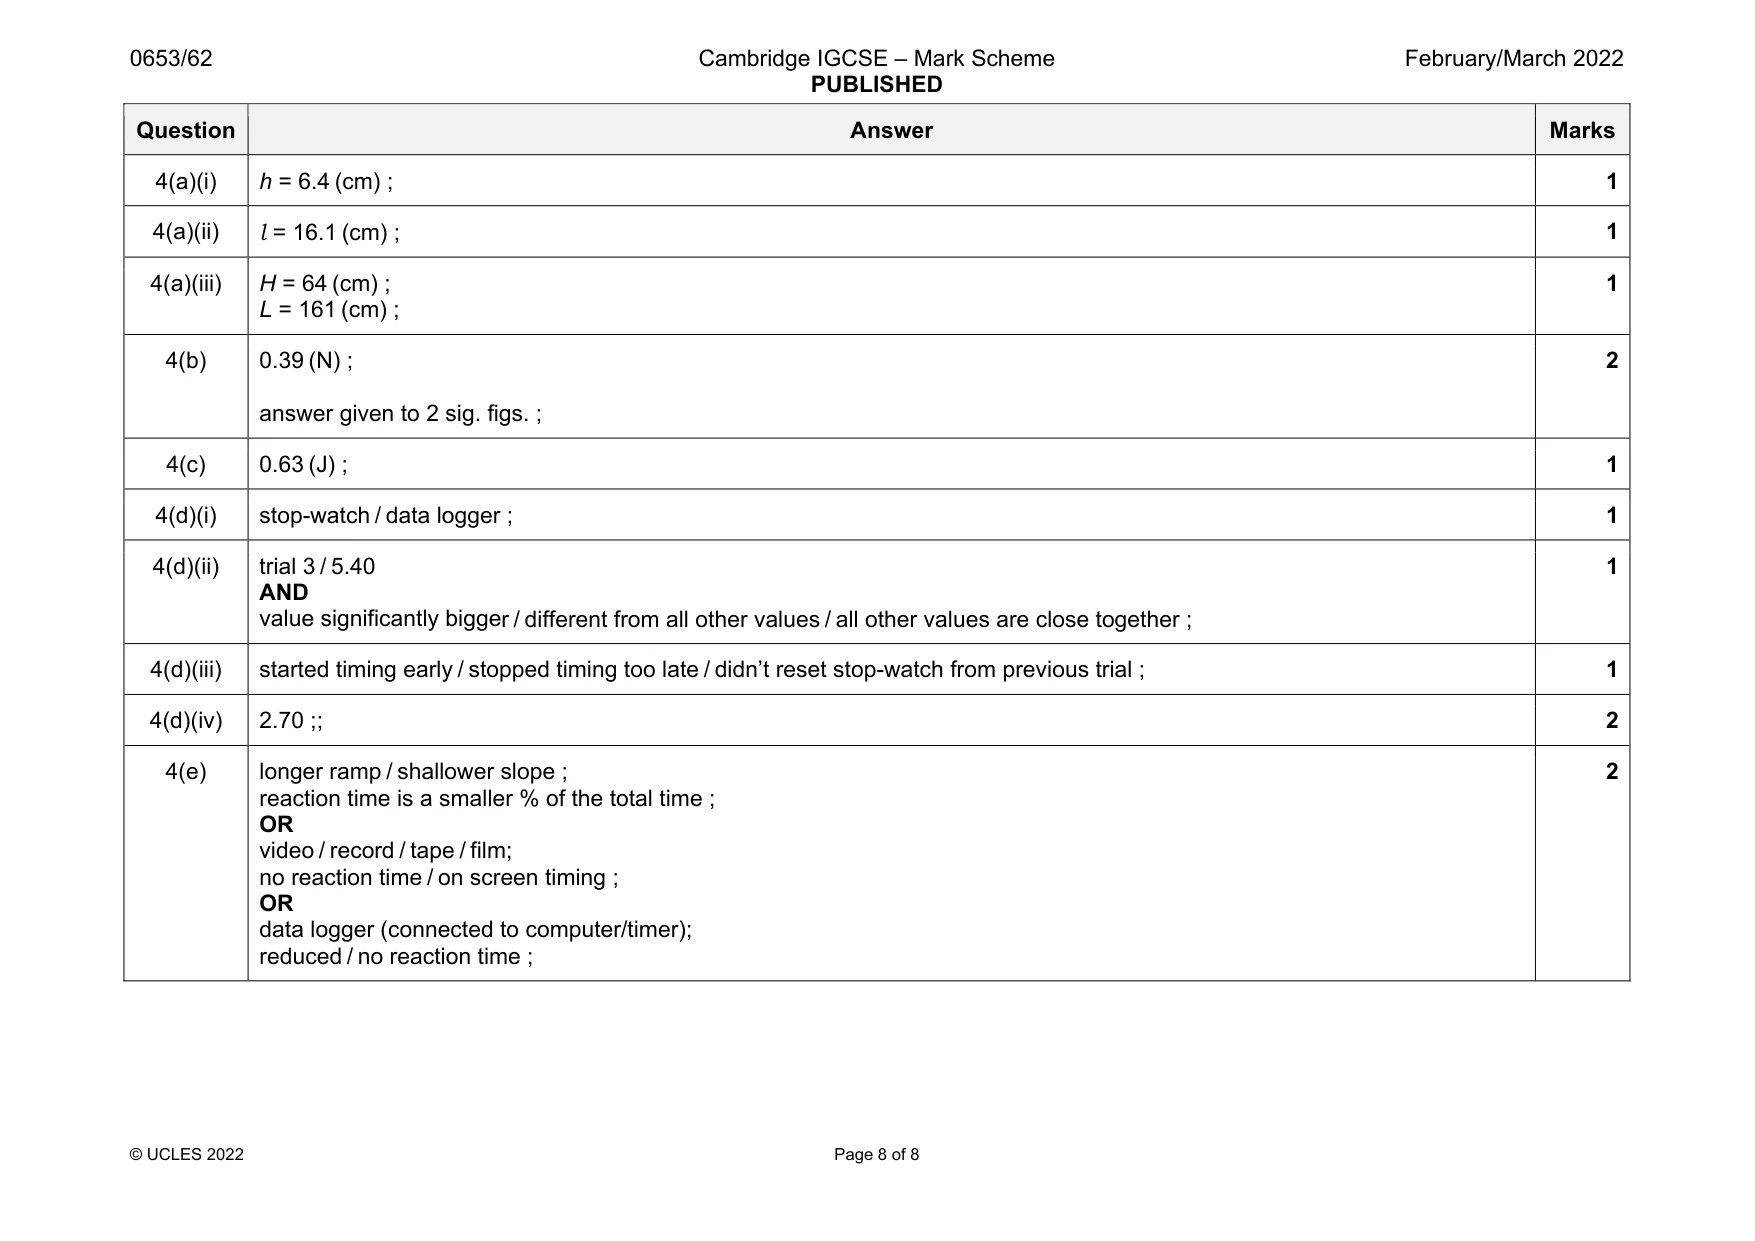
Mark scheme: 4(a)(i) h = 6.4 (cm) ; 1 4(a)(ii) l = 16.1 (cm) ; 1 4(a)(iii) H = 64 (cm) ; L = 161 (cm) ; 1 4(b) 0.39 (N) ; answer given to 2 sig. figs. ; 2 4(c) 0.63 (J) ; 1 4(d)(i) stop-watch / data logger ; 1 4(d)(ii) trial 3 / 5.40 AND value significantly bigger / different from all other values / all other values are close together ; 1 4(d)(iii) started timing early / stopped timing too late / didn’t reset stop-watch from previous trial ; 1 4(d)(iv) 2.70 ;; 2 4(e) longer ramp / shallower slope ; reaction time is a smaller % of the total time ; OR video / record / tape / film; no reaction time / on screen timing ; OR data logger (connected to computer/timer); reduced / no reaction time ; 2
What was in this paper
The subtopics covered by these 4 questions, and how many questions each got. Open one in a new tab to see every Cambridge question on it.
What you needed in this session
Cambridge’s own grade thresholds for 2022 Feb/March, Paper 6 · Variant 2. A higher threshold means an easier paper — the bar moves with how the cohort did.