Cambridge IGCSE Science - Combined 0653 — 2021 Feb/March Paper 6 · Variant 2
0653/62/F/M/21 · 4 questions · 40 marks · ≈45 min
The question paper and its mark scheme, free to read here and free to download. This is Cambridge’s own paper, exactly as it was sat.
Question paper16 pages



Mark scheme8 pages
Answers below. Sit the paper first if you are practising.
Questions as text
Q1 · A student investigates the rate of respiration in yeast cells
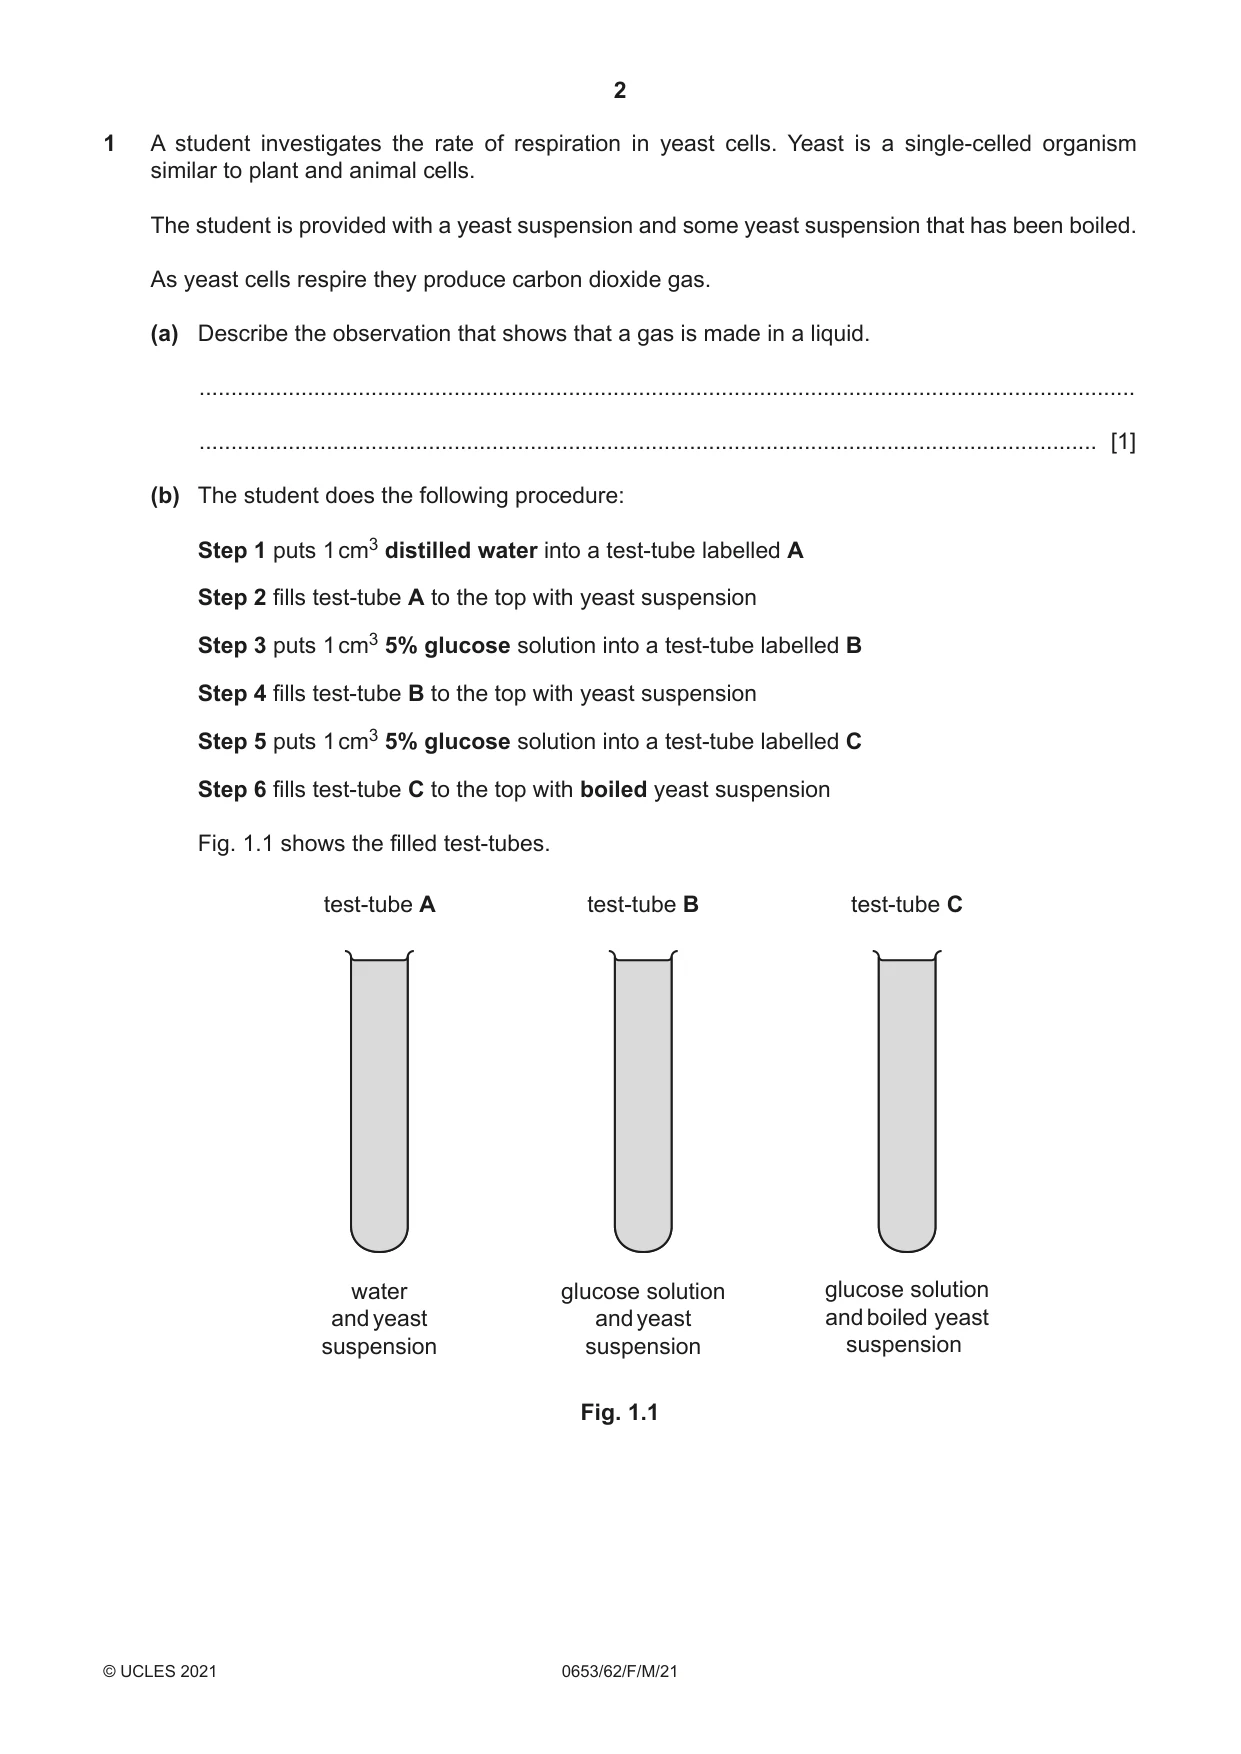
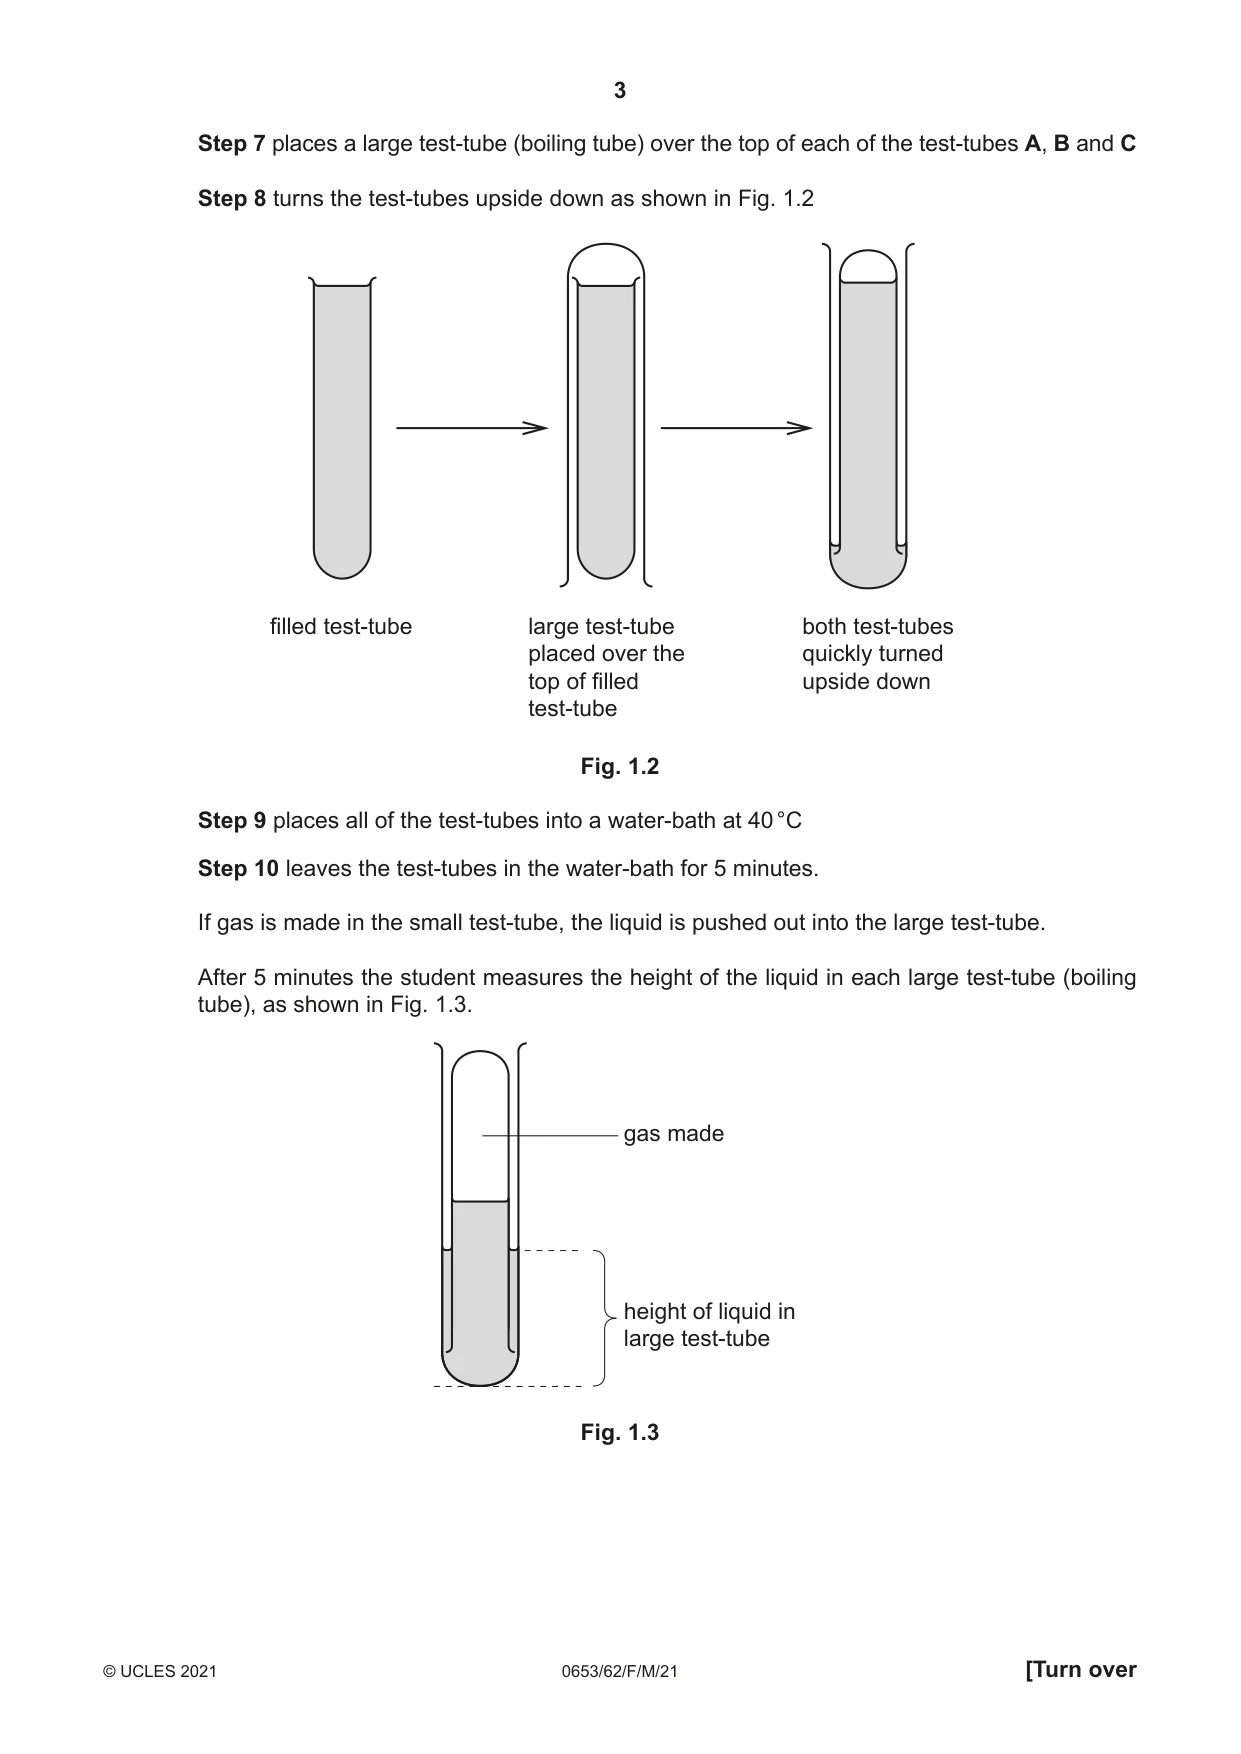
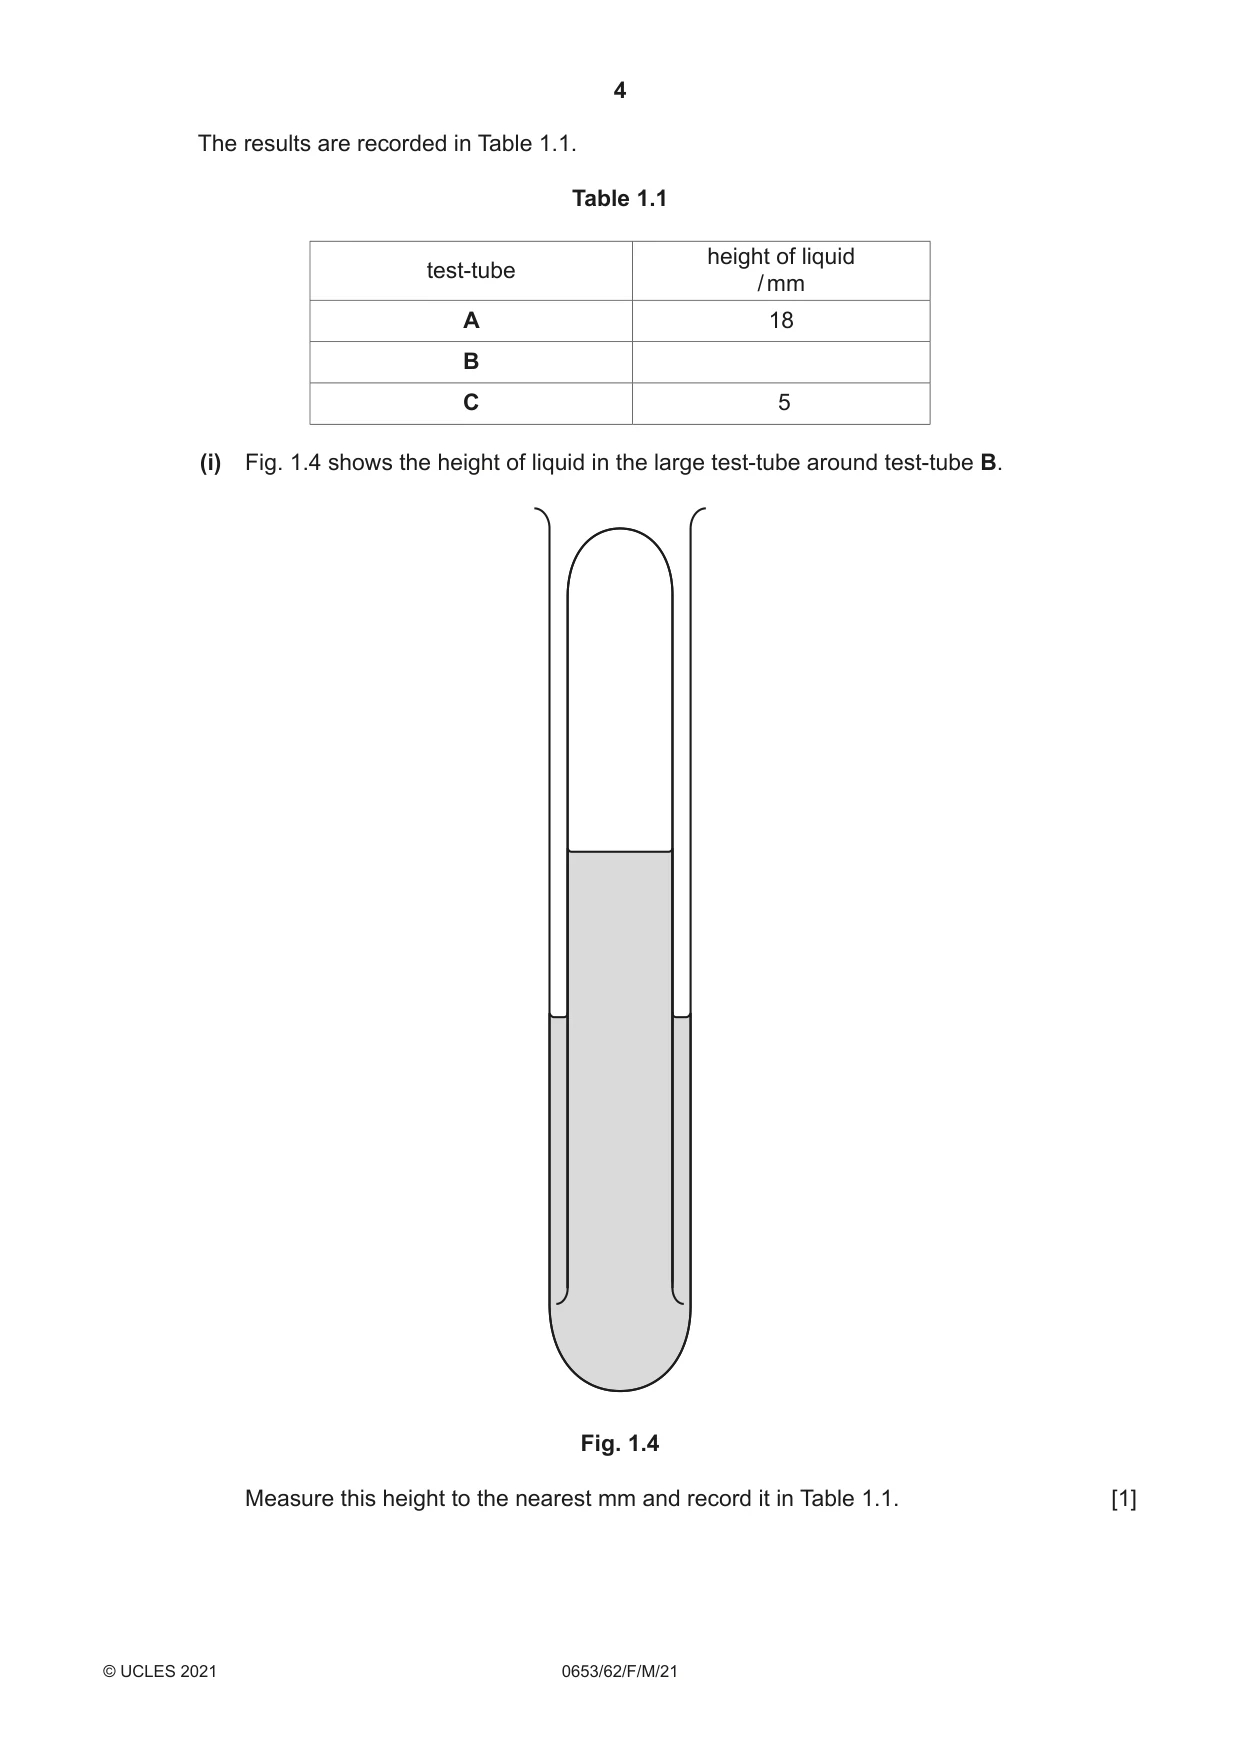
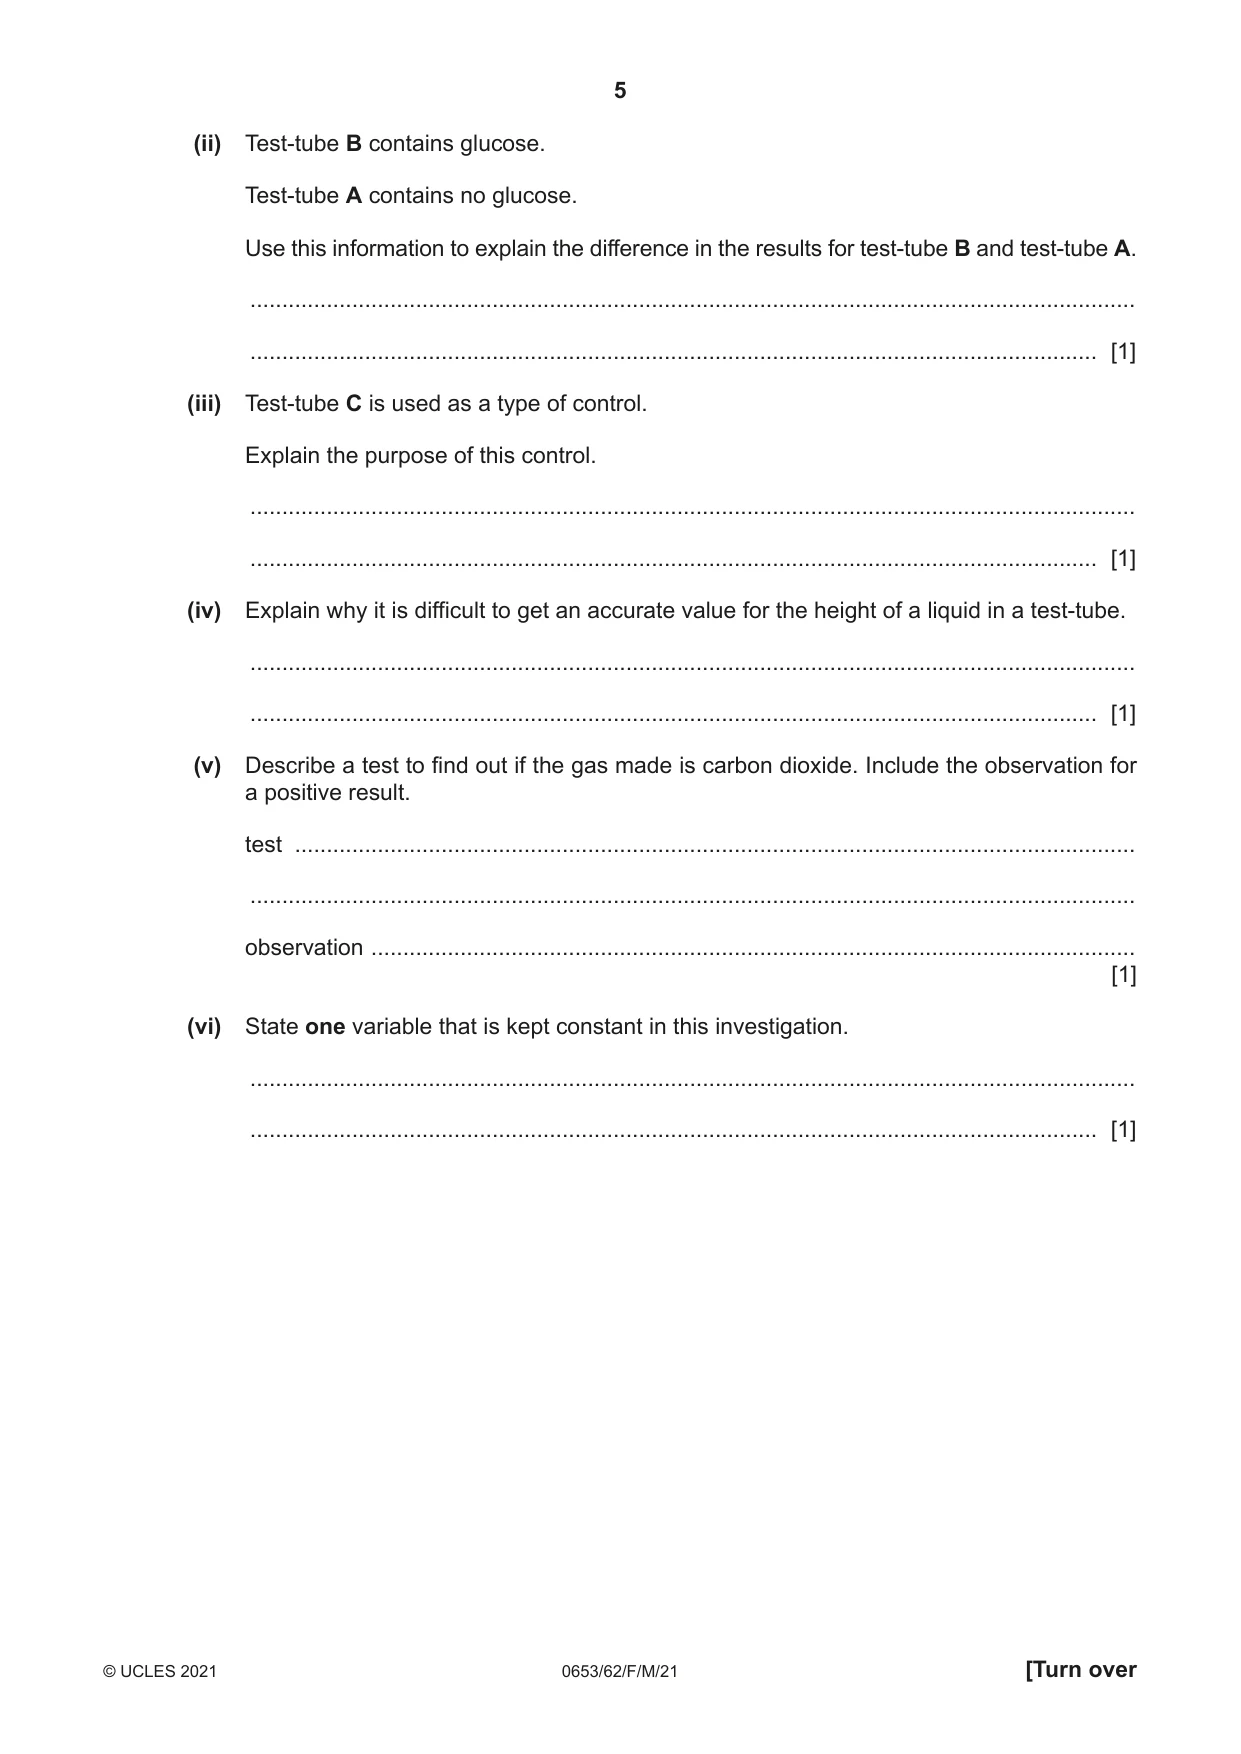
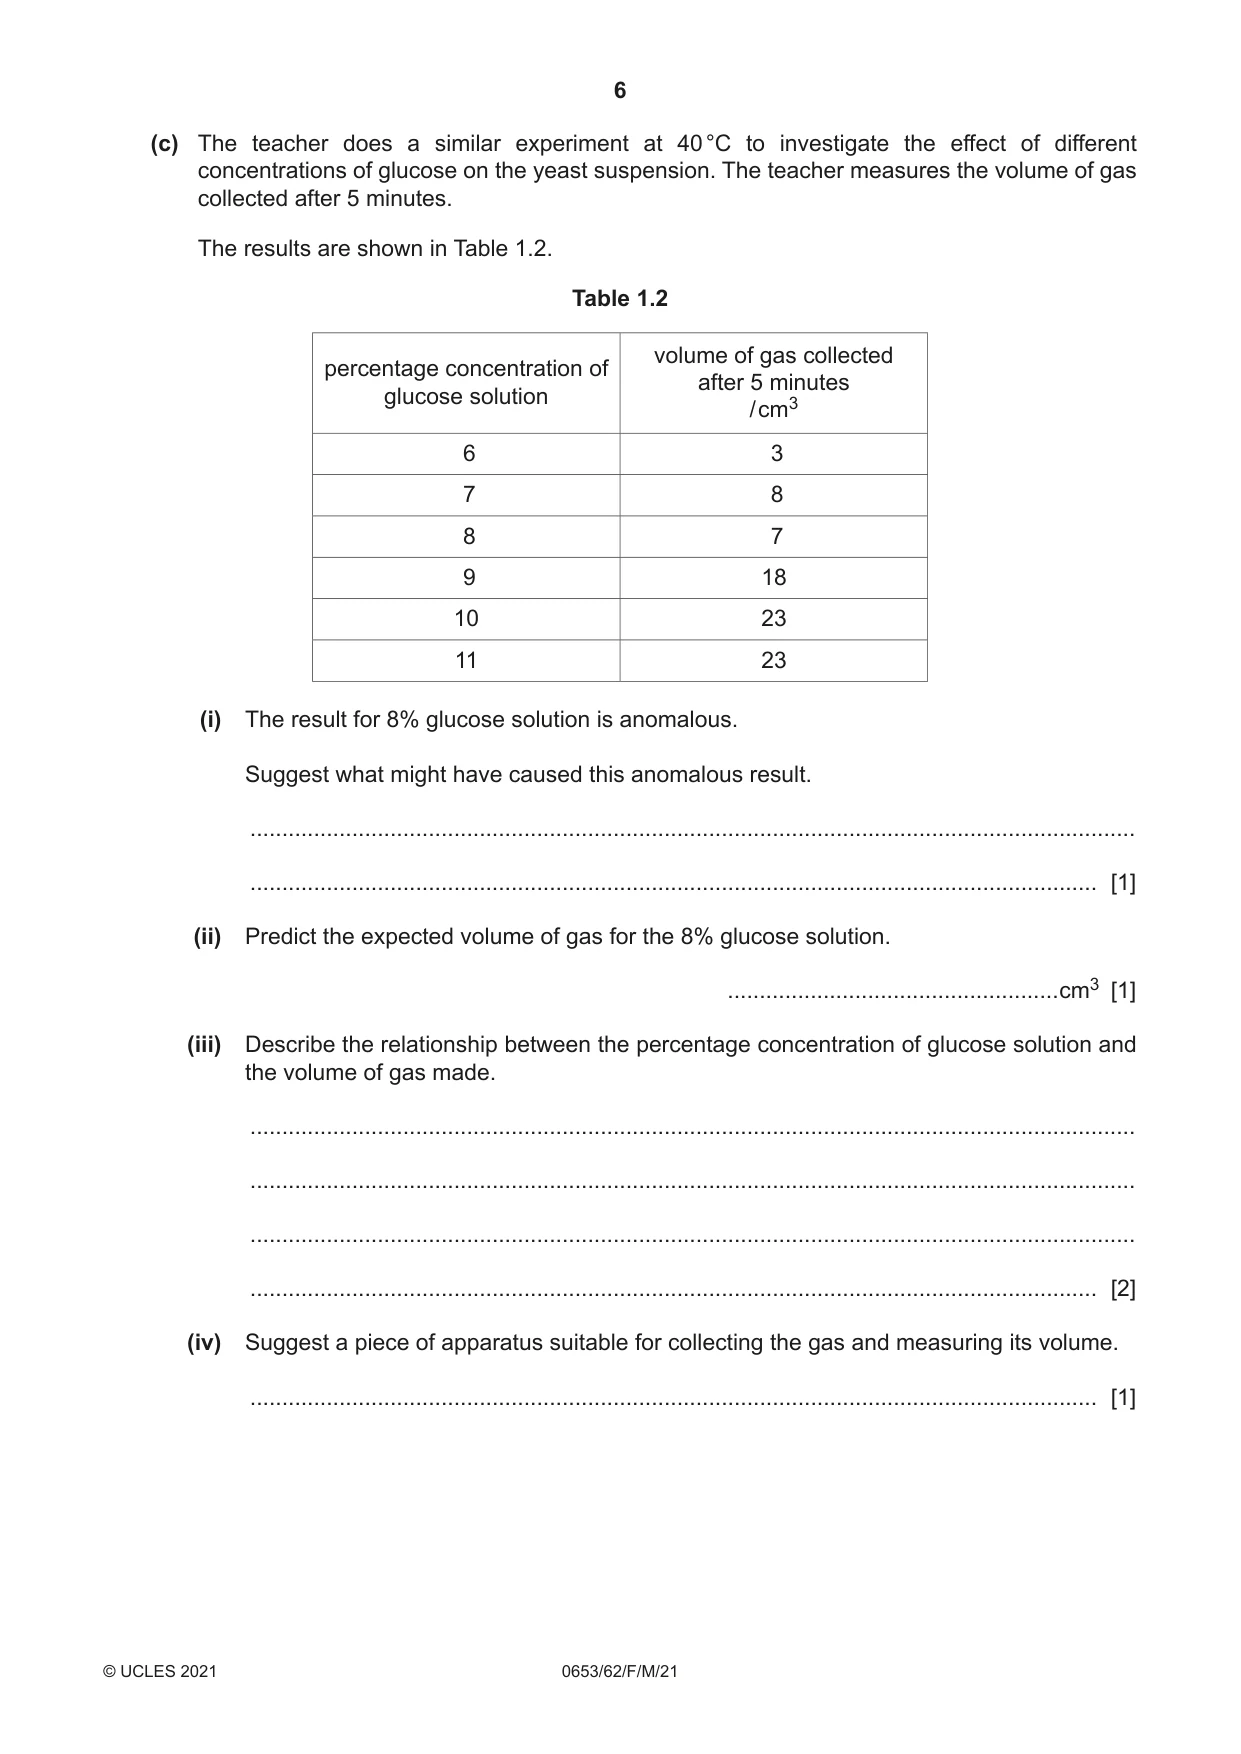
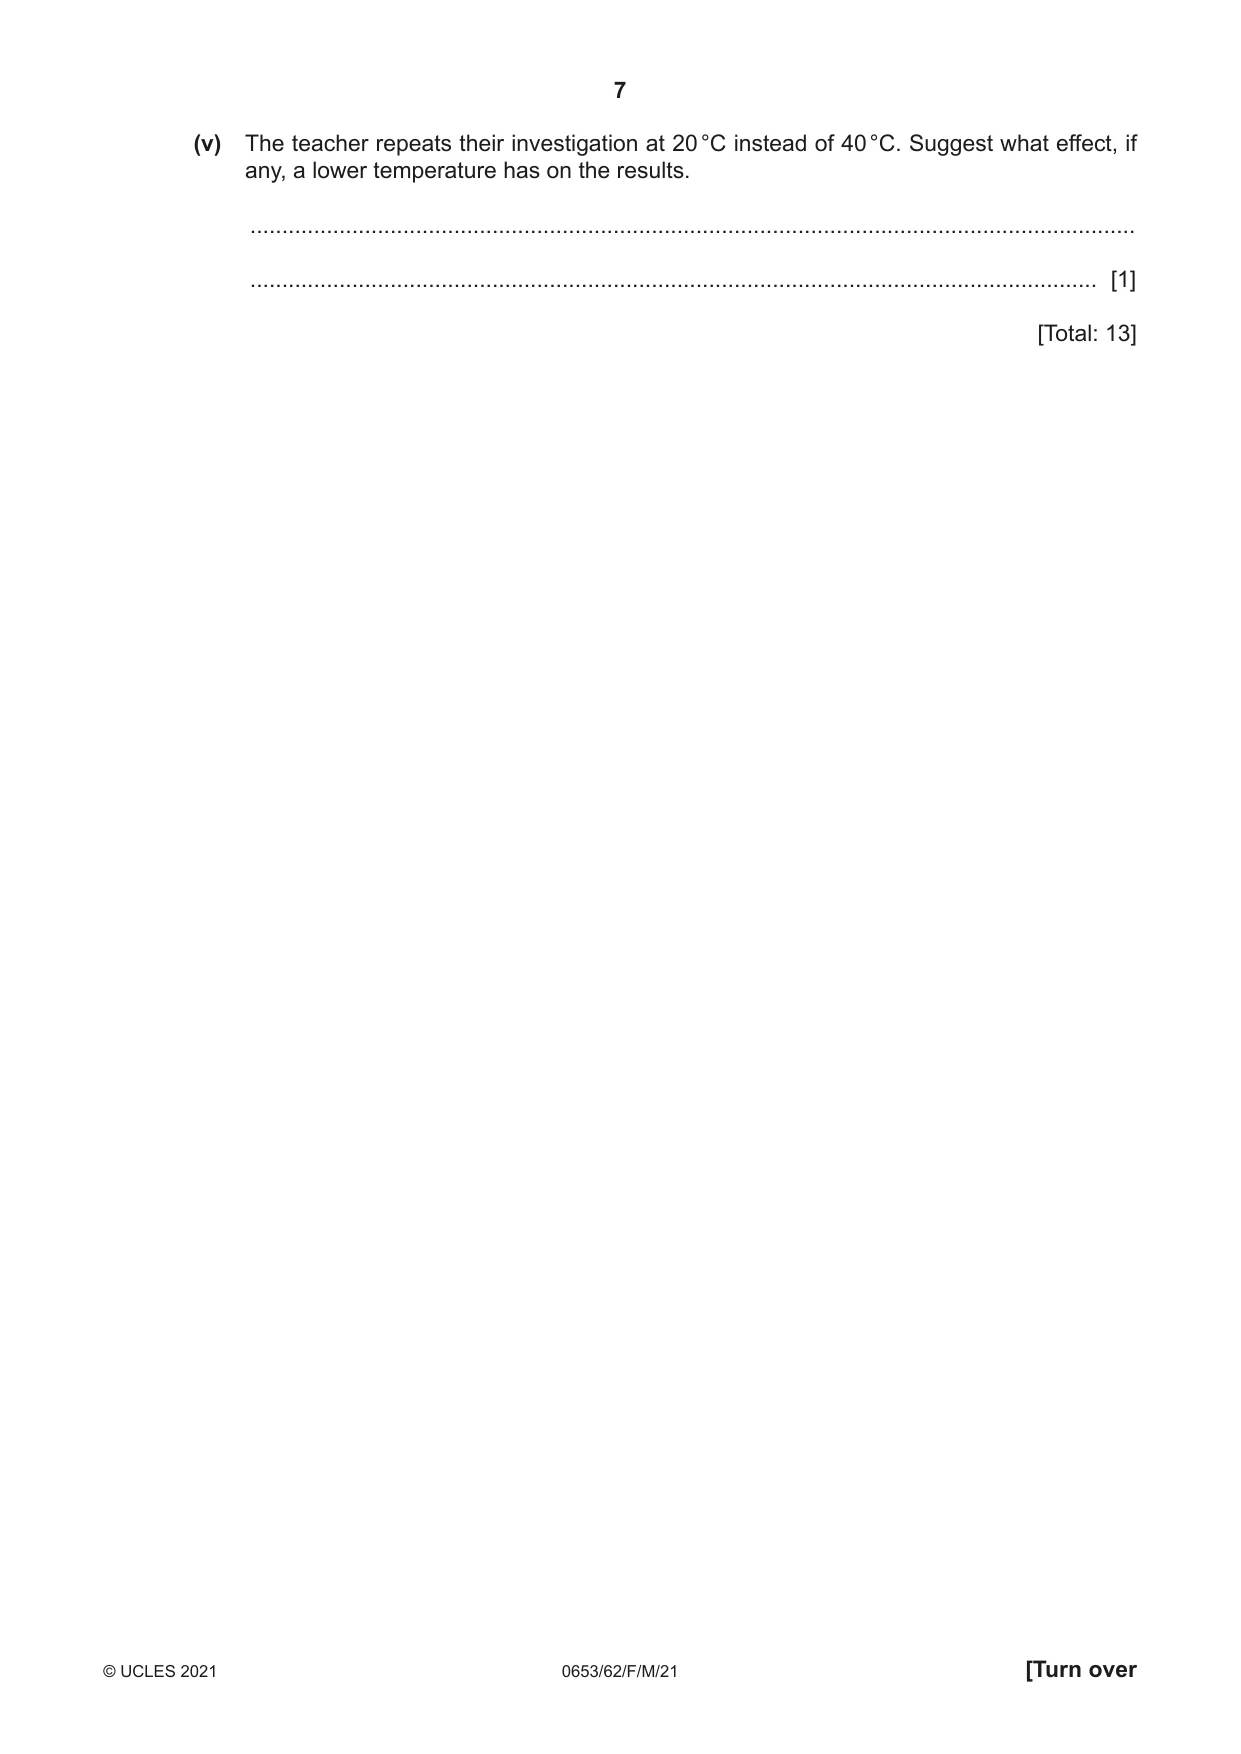
1 A student investigates the rate of respiration in yeast cells. Yeast is a single-celled organism similar to plant and animal cells. The student is provided with a yeast suspension and some yeast suspension that has been boiled. As yeast cells respire they produce carbon dioxide gas. (a) Describe the observation that shows that a gas is made in a liquid. ................................................................................................................................................... ............................................................................................................................................. [1] (b) The student does the following procedure: Step 1 puts 1 cm3 distilled water into a test-tube labelled A Step 2 fills test-tube A to the top with yeast suspension Step 3 puts 1 cm3 5% glucose solution into a test-tube labelled B Step 4 fills test-tube B to the top with yeast suspension Step 5 puts 1 cm3 5% glucose solution into a test-tube labelled C Step 6 fills test-tube C to the top with boiled yeast suspension Fig. 1.1 shows the filled test-tubes. test-tube A test-tube B test-tube C water glucose solution glucose solution and yeast and yeast and boiled yeast suspension suspension suspension Fig. 1.1 Step 7 places a large test-tube (boiling tube) over the top of each of the test-tubes A, B and C Step 8 turns the test-tubes upside down as shown in Fig. 1.2 filled test-tube large test-tube both test-tubes placed over the quickly turned top of filled upside down test-tube Fig. 1.2 Step 9 places all of the test-tubes into a water-bath at 40 °C Step 10 leaves the test-tubes in the water-bath for 5 minutes. If gas is made in the small test-tube, the liquid is pushed out into the large test-tube. After 5 minutes the student measures the height of the liquid in each large test-tube (boiling tube), as shown in Fig. 1.3. gas made height of liquid in large test-tube Fig. 1.3 The results are recorded in Table 1.1. Table 1.1 height of liquid test-tube / mm A 18 B C 5 (i) Fig. 1.4 shows the height of liquid in the large test-tube around test-tube B. Fig. 1.4 Measure this height to the nearest mm and record it in Table 1.1. [1] (ii) Test-tube B contains glucose. Test-tube A contains no glucose. Use this information to explain the difference in the results for test-tube B and test-tube A. ........................................................................................................................................... ..................................................................................................................................... [1] (iii) Test-tube C is used as a type of control. Explain the purpose of this control. ........................................................................................................................................... ..................................................................................................................................... [1] (iv) Explain why it is difficult to get an accurate value for the height of a liquid in a test-tube. ........................................................................................................................................... ..................................................................................................................................... [1] (v) Describe a test to find out if the gas made is carbon dioxide. Include the observation for a positive result. test .................................................................................................................................... ........................................................................................................................................... observation ........................................................................................................................ [1] (vi) State one variable that is kept constant in this investigation. ........................................................................................................................................... ..................................................................................................................................... [1] (c) The teacher does a similar experiment at 40 °C to investigate the effect of different concentrations of glucose on the yeast suspension. The teacher measures the volume of gas collected after 5 minutes. The results are shown in Table 1.2. Table 1.2 volume of gas collected percentage concentration of after 5 minutes glucose solution / cm3 6 3 7 8 8 7 9 18 10 23 11 23 (i) The result for 8% glucose solution is anomalous. Suggest what might have caused this anomalous result. ........................................................................................................................................... ..................................................................................................................................... [1] (ii) Predict the expected volume of gas for the 8% glucose solution. ....................................................cm3 [1] (iii) Describe the relationship between the percentage concentration of glucose solution and the volume of gas made. ........................................................................................................................................... ........................................................................................................................................... ........................................................................................................................................... ..................................................................................................................................... [2] (iv) Suggest a piece of apparatus suitable for collecting the gas and measuring its volume. ..................................................................................................................................... [1] (v) The teacher repeats their investigation at 20 °C instead of 40 °C. Suggest what effect, if any, a lower temperature has on the results. ........................................................................................................................................... ..................................................................................................................................... [1] [Total: 13]
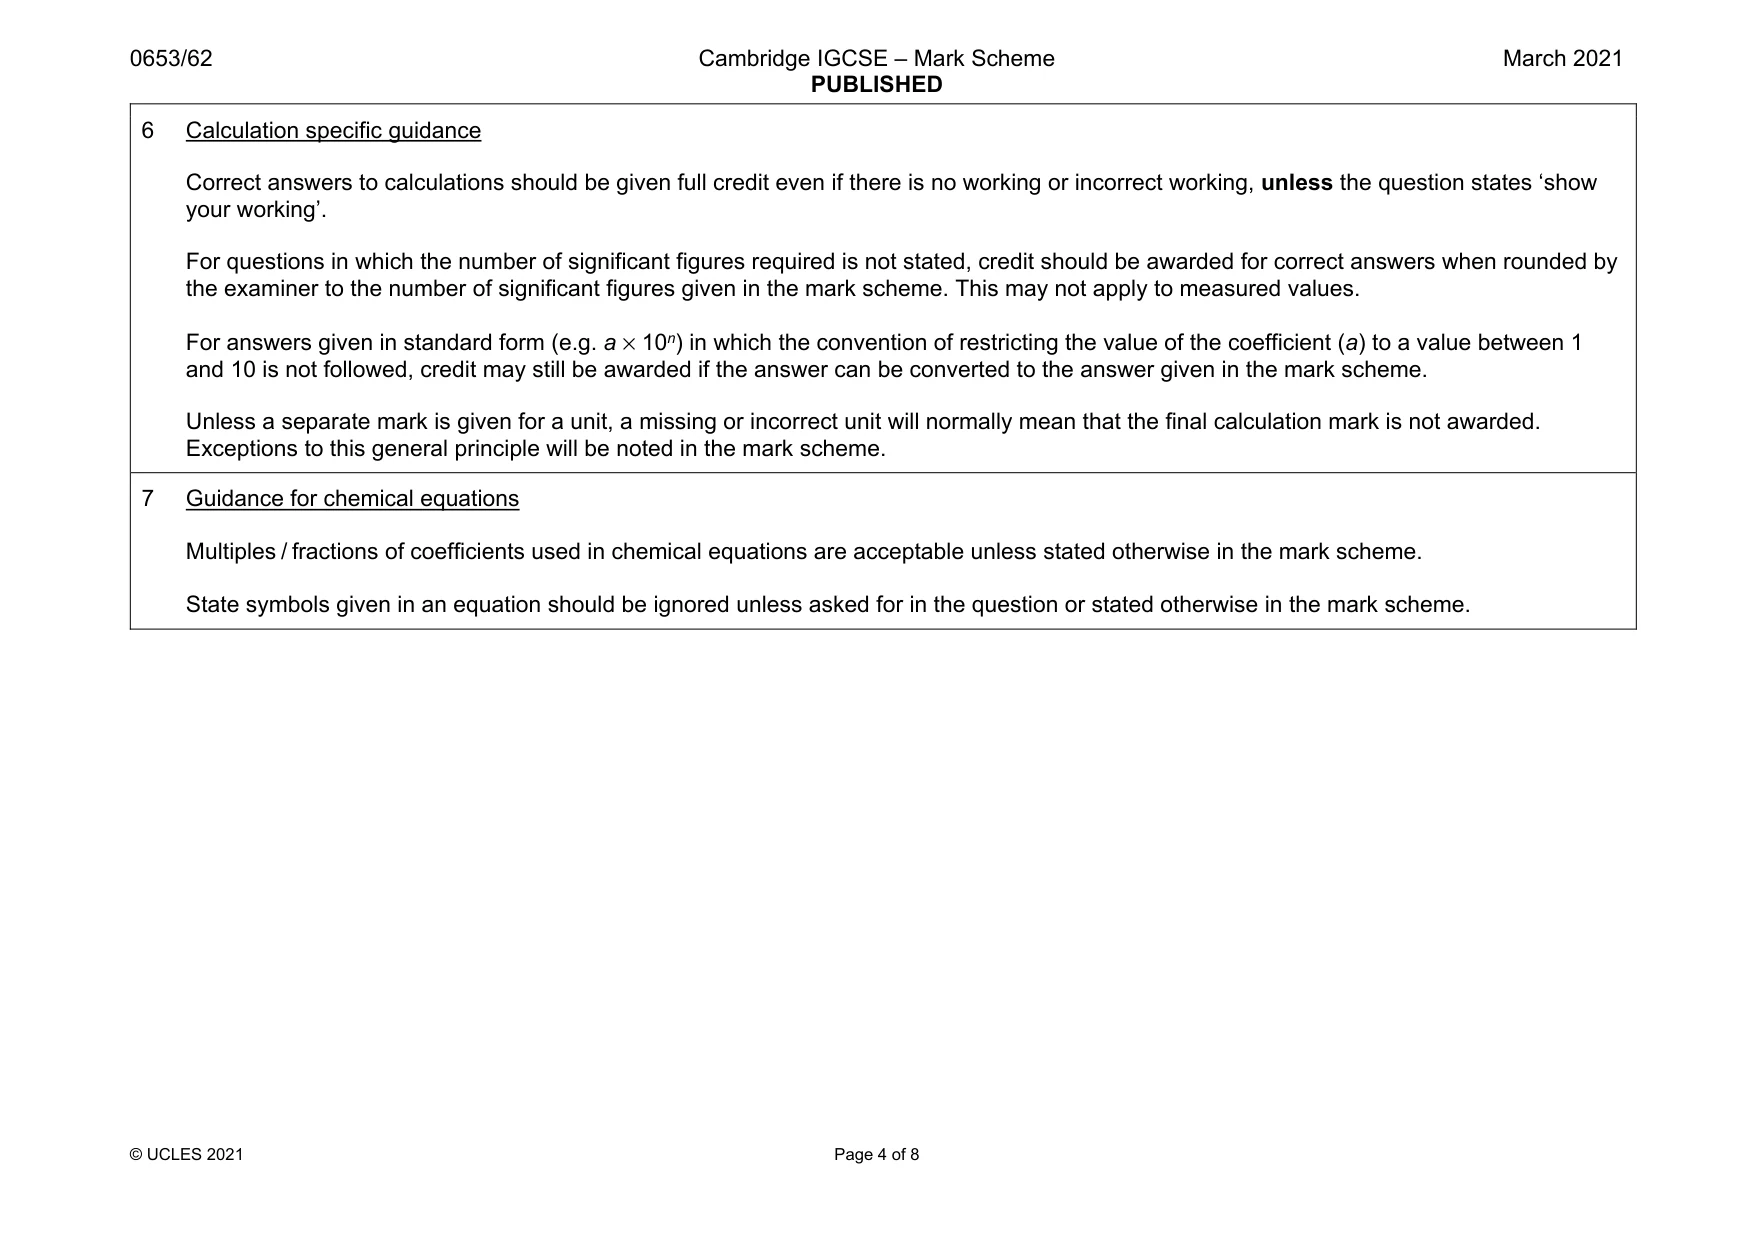
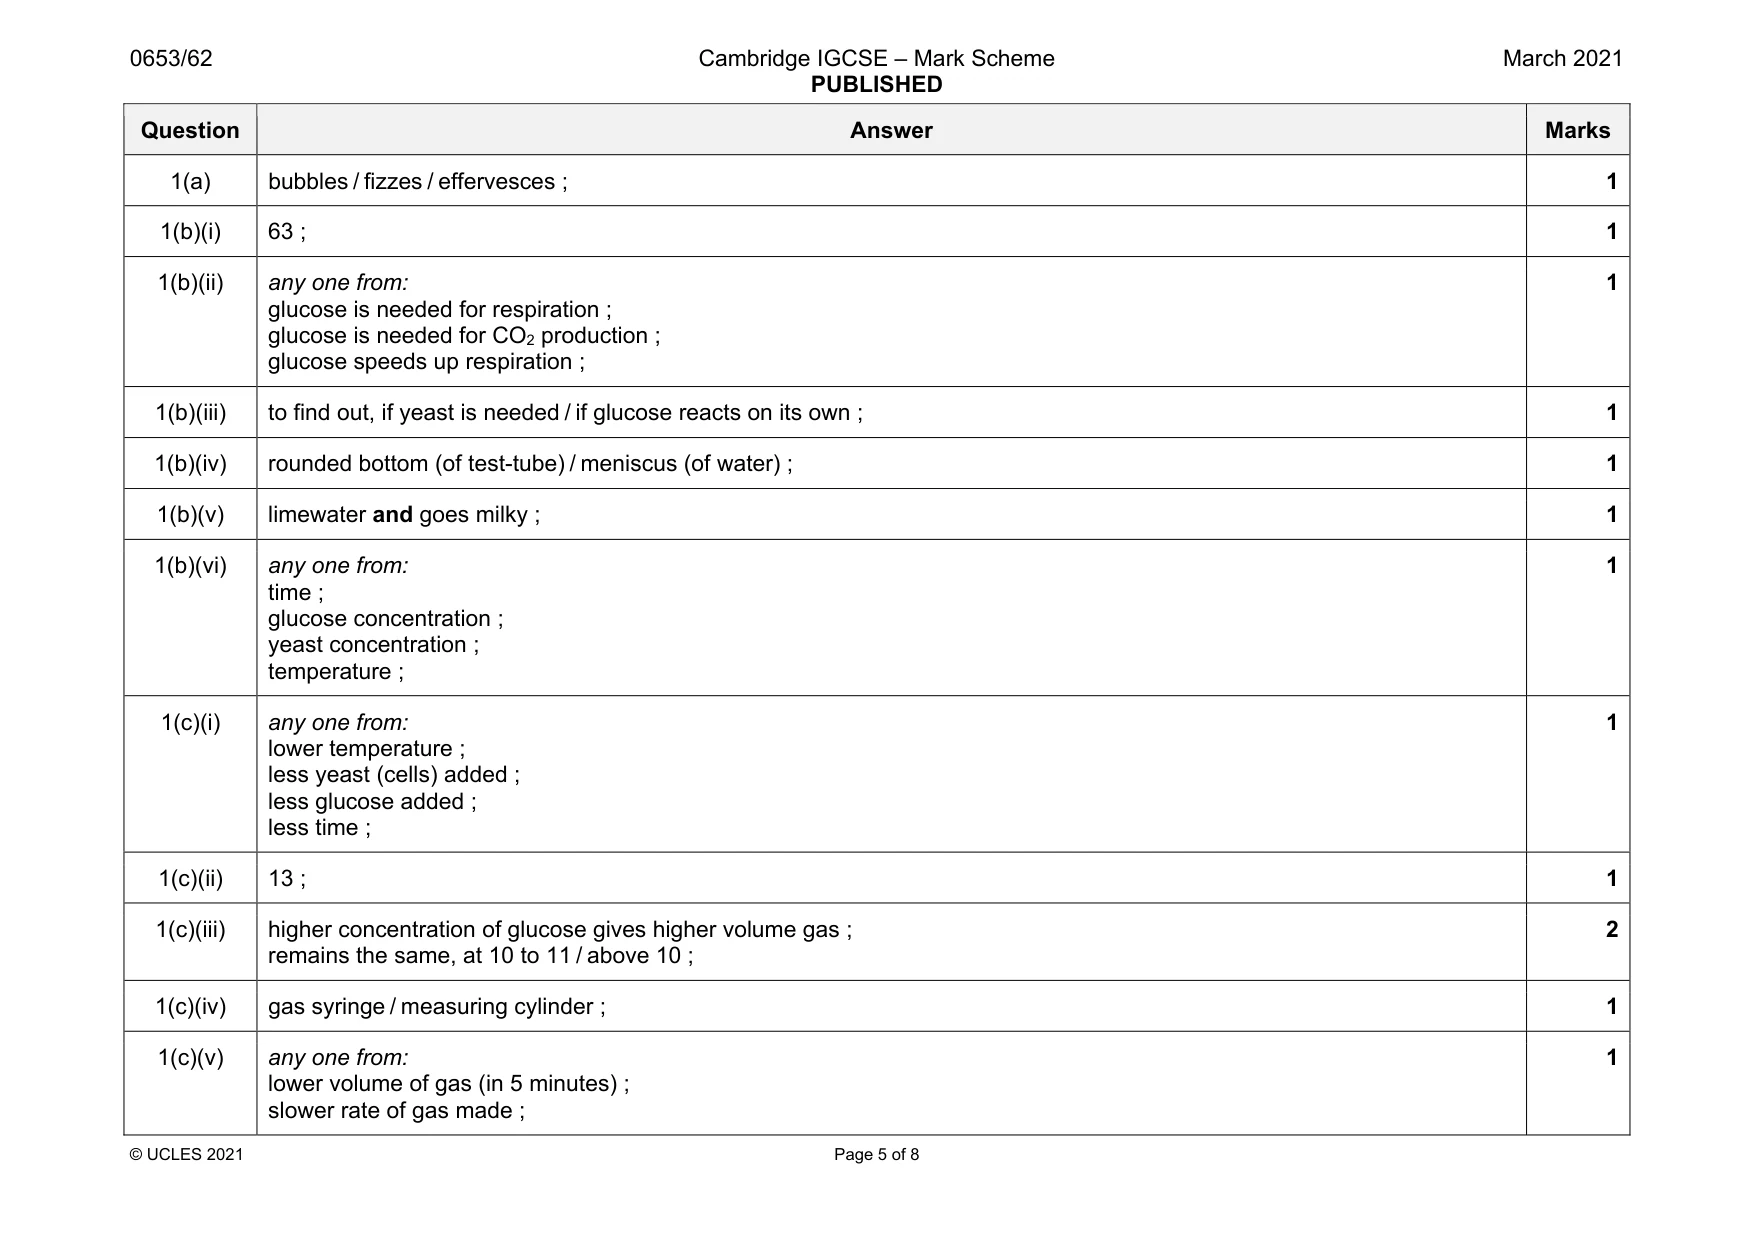
Mark scheme: 1(a) bubbles / fizzes / effervesces ; 1 1(b)(i) 63 ; 1 1(b)(ii) any one from: glucose is needed for respiration ; glucose is needed for CO2 production ; glucose speeds up respiration ; 1 1(b)(iii) to find out, if yeast is needed / if glucose reacts on its own ; 1 1(b)(iv) rounded bottom (of test-tube) / meniscus (of water) ; 1 1(b)(v) limewater and goes milky ; 1 1(b)(vi) any one from: time ; glucose concentration ; yeast concentration ; temperature ; 1 1(c)(i) any one from: lower temperature ; less yeast (cells) added ; less glucose added ; less time ; 1 1(c)(ii) 13 ; 1 1(c)(iii) higher concentration of glucose gives higher volume gas ; remains the same, at 10 to 11 / above 10 ; 2 1(c)(iv) gas syringe / measuring cylinder ; 1 1(c)(v) any one from: lower volume of gas (in 5 minutes) ; slower rate of gas made ; 1
Q2 · A student prepares a sample of the insoluble salt barium sulfate by reacting aqueous…
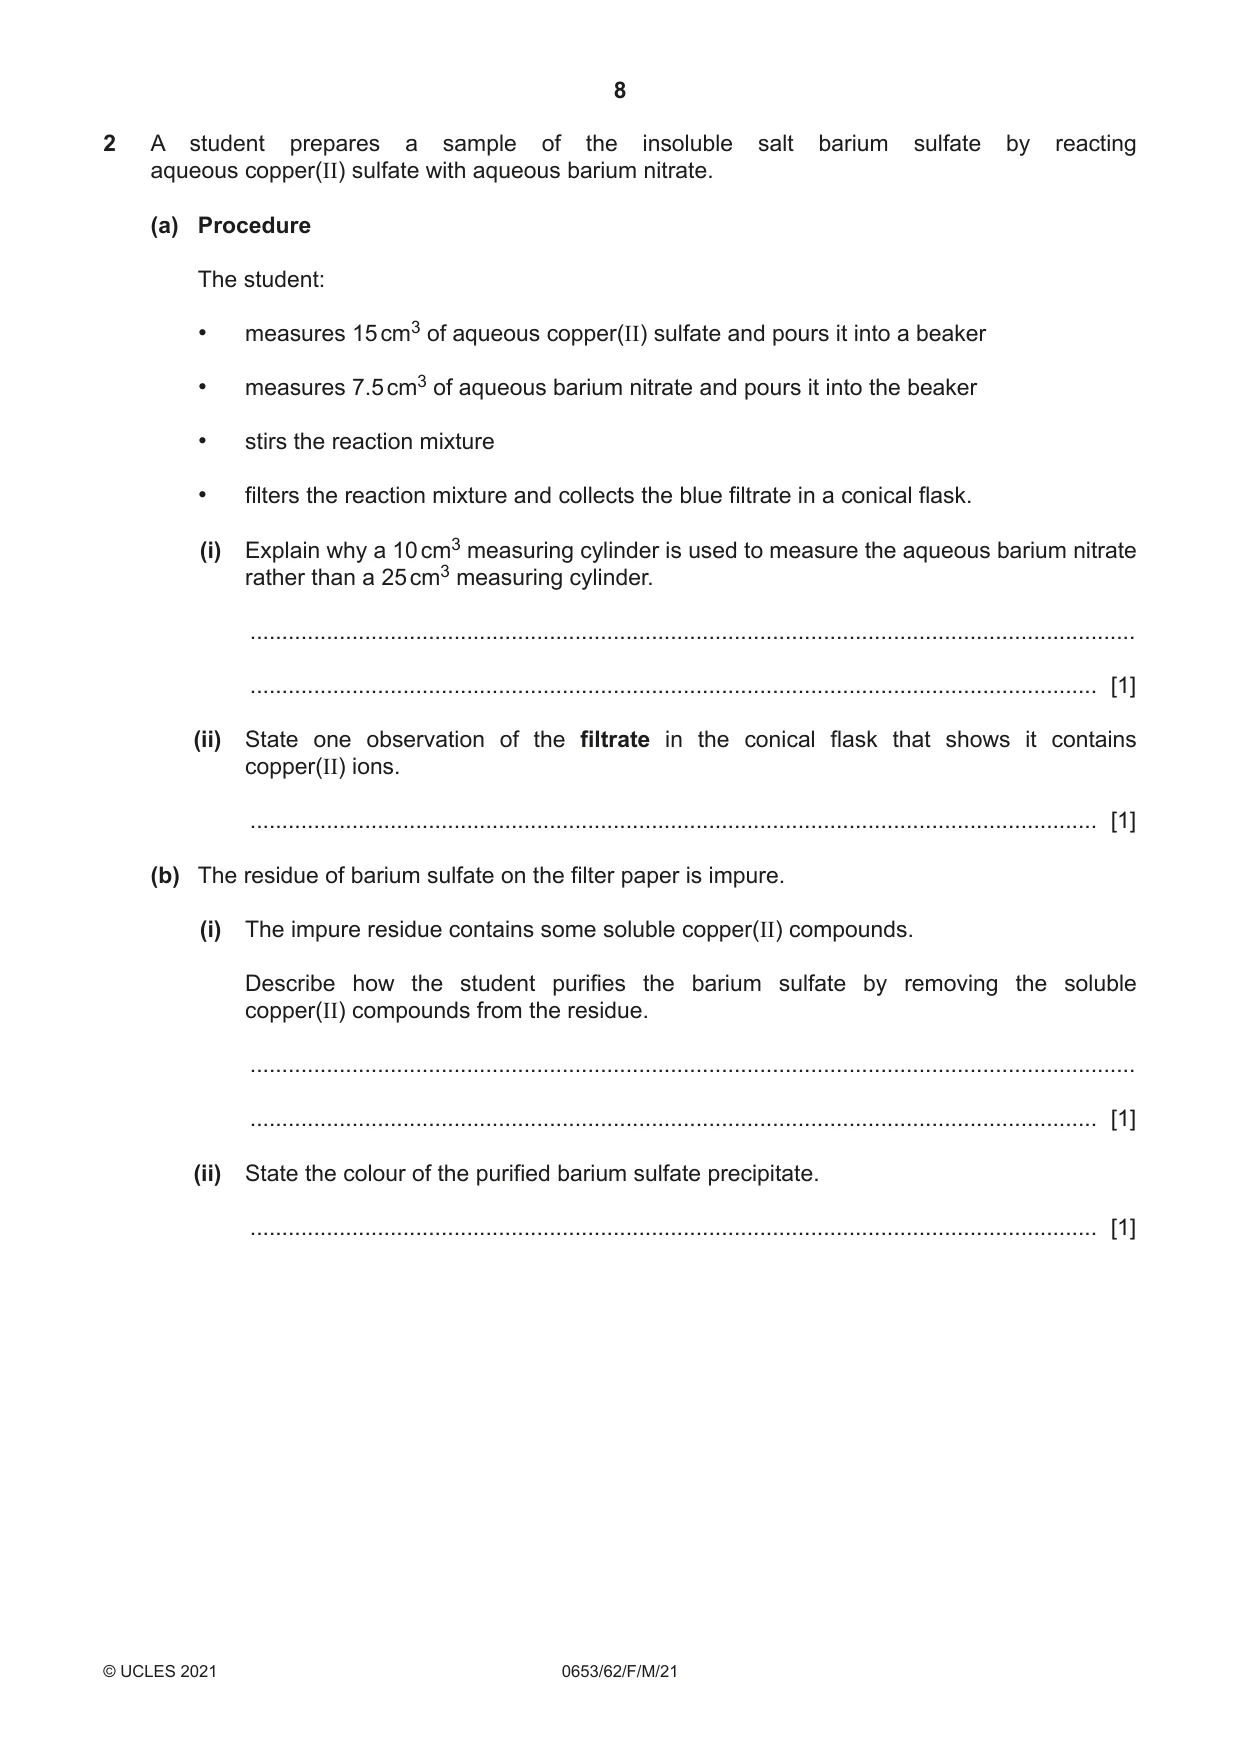
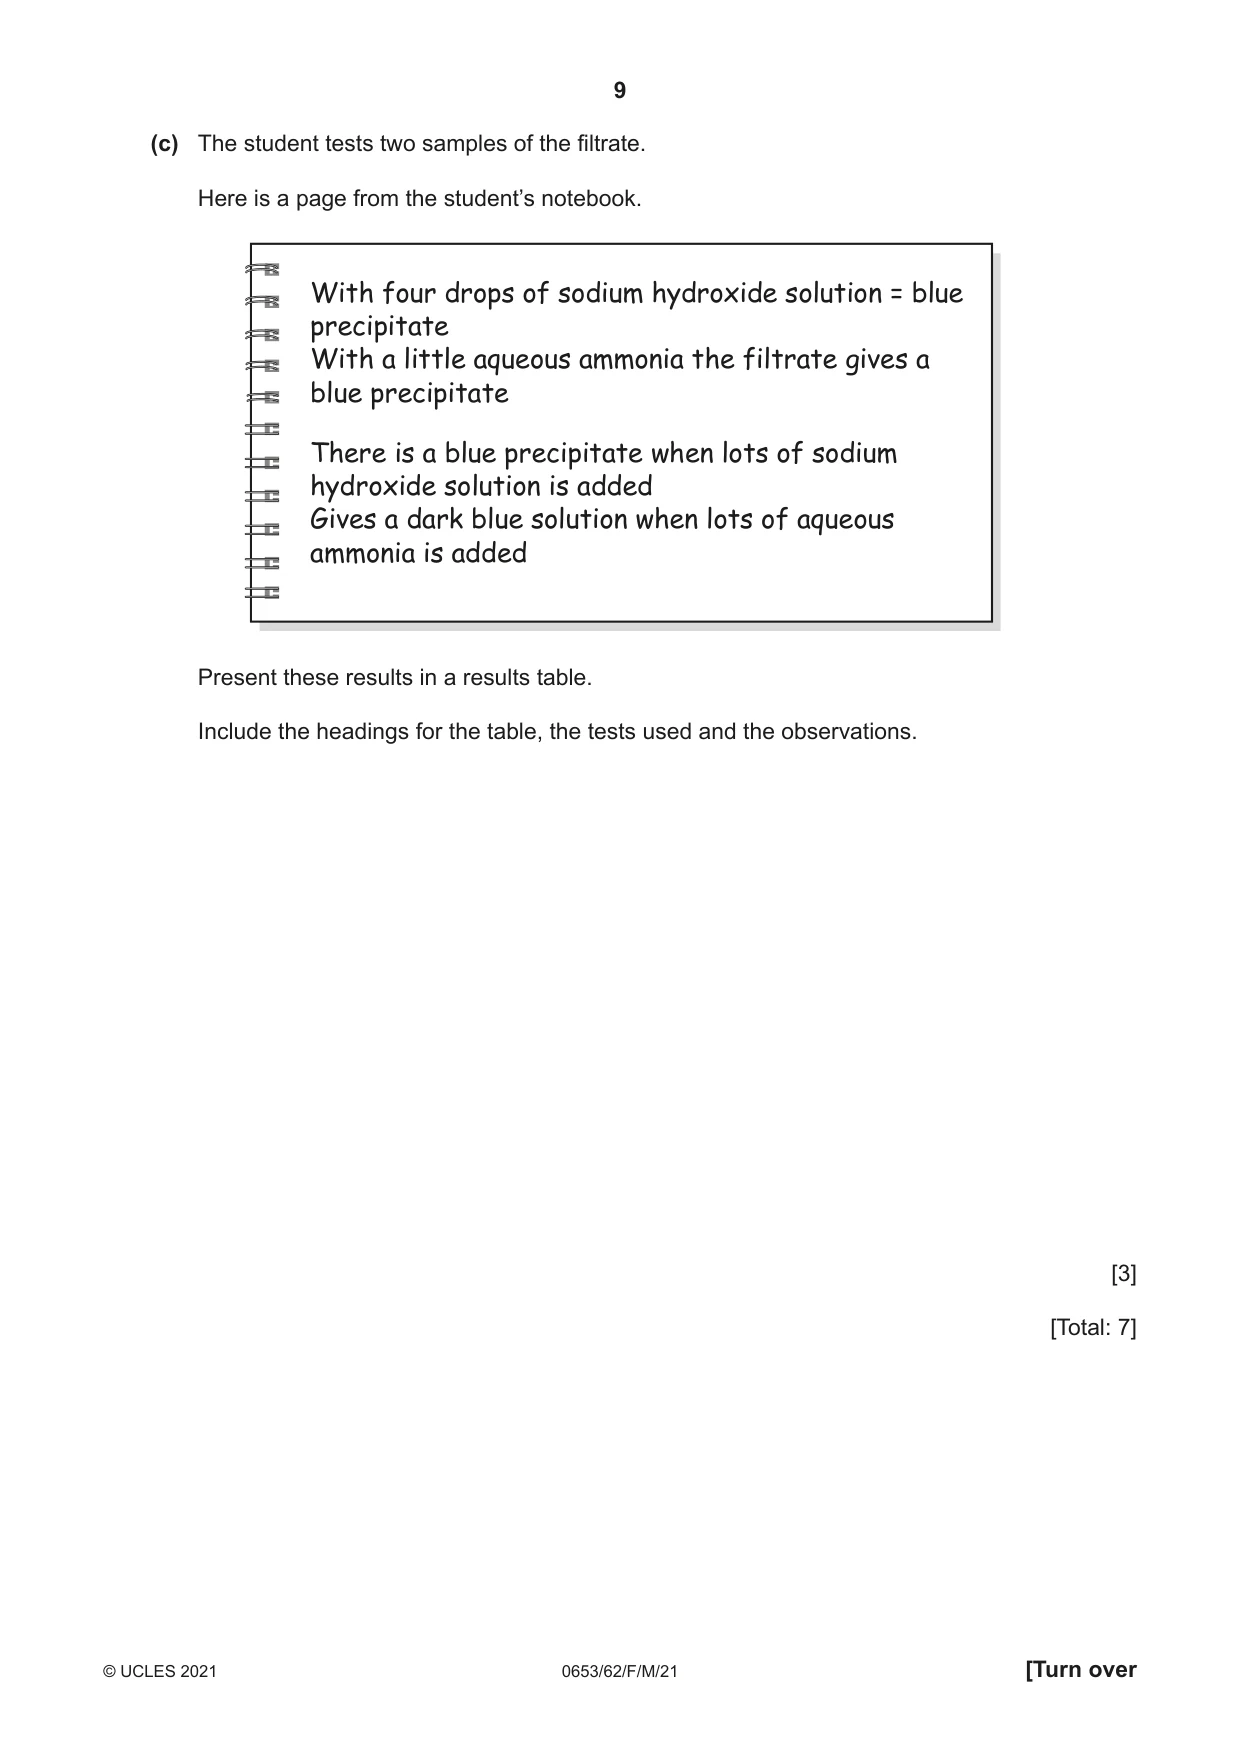
2 A student prepares a sample of the insoluble salt barium sulfate by reacting aqueous copper(II) sulfate with aqueous barium nitrate. (a) Procedure The student: • measures 15 cm3 of aqueous copper(II) sulfate and pours it into a beaker • measures 7.5 cm3 of aqueous barium nitrate and pours it into the beaker • stirs the reaction mixture • filters the reaction mixture and collects the blue filtrate in a conical flask. (i) Explain why a 10 cm3 measuring cylinder is used to measure the aqueous barium nitrate rather than a 25 cm3 measuring cylinder. ........................................................................................................................................... ..................................................................................................................................... [1] (ii) State one observation of the filtrate in the conical flask that shows it contains copper(II) ions. ..................................................................................................................................... [1] (b) The residue of barium sulfate on the filter paper is impure. (i) The impure residue contains some soluble copper(II) compounds. Describe how the student purifies the barium sulfate by removing the soluble copper(II) compounds from the residue. ........................................................................................................................................... ..................................................................................................................................... [1] (ii) State the colour of the purified barium sulfate precipitate. ..................................................................................................................................... [1] (c) The student tests two samples of the filtrate. Here is a page from the student’s notebook. With four drops of sodium hydroxide solution = blue precipitate With a little aqueous ammonia the filtrate gives a blue precipitate There is a blue precipitate when lots of sodium hydroxide solution is added Gives a dark blue solution when lots of aqueous ammonia is added Present these results in a results table. Include the headings for the table, the tests used and the observations. [3] [Total: 7]
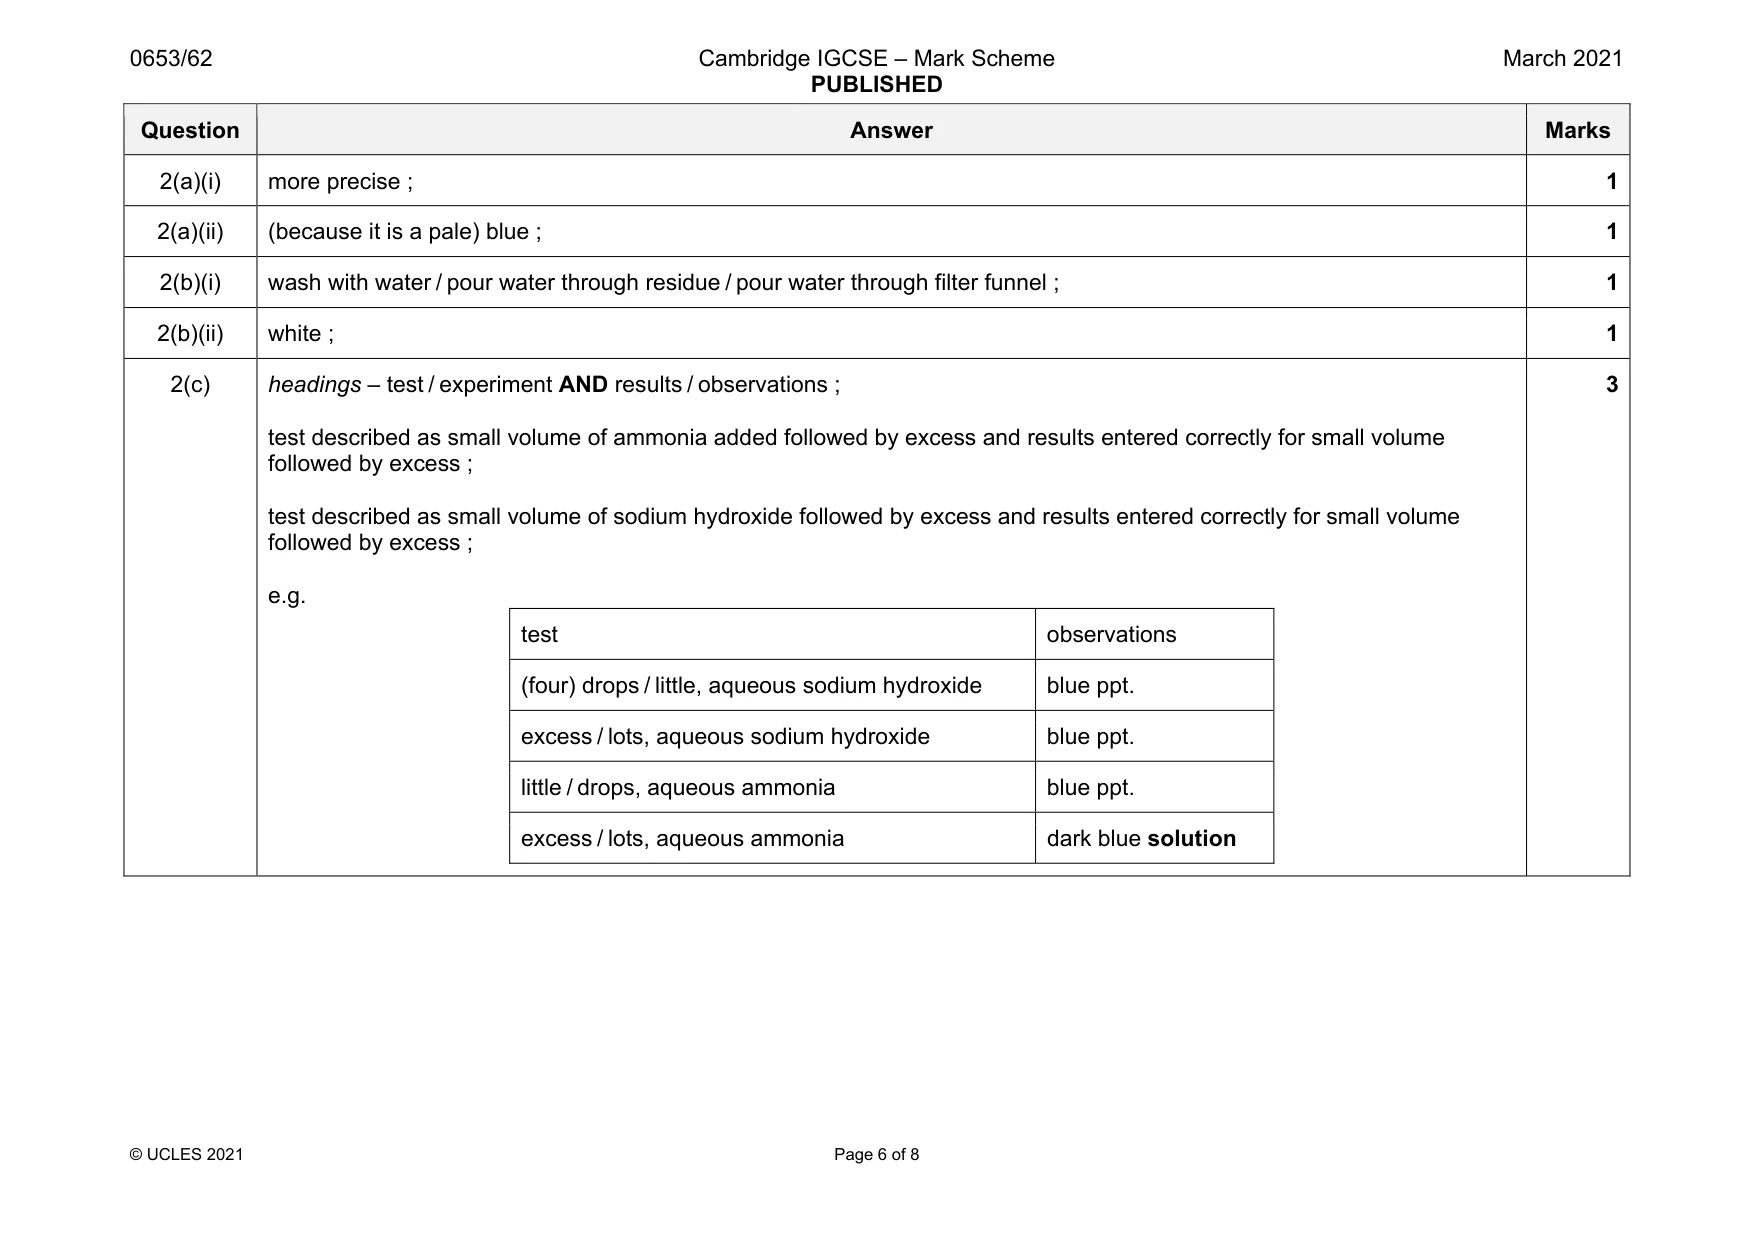
Mark scheme: 2(a)(i) more precise ; 1 2(a)(ii) (because it is a pale) blue ; 1 2(b)(i) wash with water / pour water through residue / pour water through filter funnel ; 1 2(b)(ii) white ; 1 2(c) headings – test / experiment AND results / observations ; test described as small volume of ammonia added followed by excess and results entered correctly for small volume followed by excess ; test described as small volume of sodium hydroxide followed by excess and results entered correctly for small volume followed by excess ; e.g. test observations (four) drops / little, aqueous sodium hydroxide blue ppt. excess / lots, aqueous sodium hydroxide blue ppt. little / drops, aqueous ammonia blue ppt. excess / lots, aqueous ammonia dark blue solution 3
Q3 · Calcium hydroxide is a white solid that is added to acidic soils to increase their pH
3 Calcium hydroxide is a white solid that is added to acidic soils to increase their pH. Calcium hydroxide neutralises acids such as dilute nitric acid to make a salt and water. Plan an investigation to find out how the pH of dilute nitric acid changes as calcium hydroxide is added to the acid. You are provided with: • calcium hydroxide powder • dilute nitric acid • Universal Indicator solution. You may use any common laboratory apparatus in your plan. In your plan, include: • the apparatus needed • a brief description of the method and explain any safety precautions you should take • what you would measure • which variables you would keep constant • how you would process your results to draw a conclusion. You may include a labelled diagram if you wish. You may include a table that can be used to record the results if you wish. .......................................................................................................................................................... .......................................................................................................................................................... .......................................................................................................................................................... .......................................................................................................................................................... .......................................................................................................................................................... .......................................................................................................................................................... .......................................................................................................................................................... .......................................................................................................................................................... .......................................................................................................................................................... .......................................................................................................................................................... .......................................................................................................................................................... .......................................................................................................................................................... .......................................................................................................................................................... .................................................................................................................................................... [7]
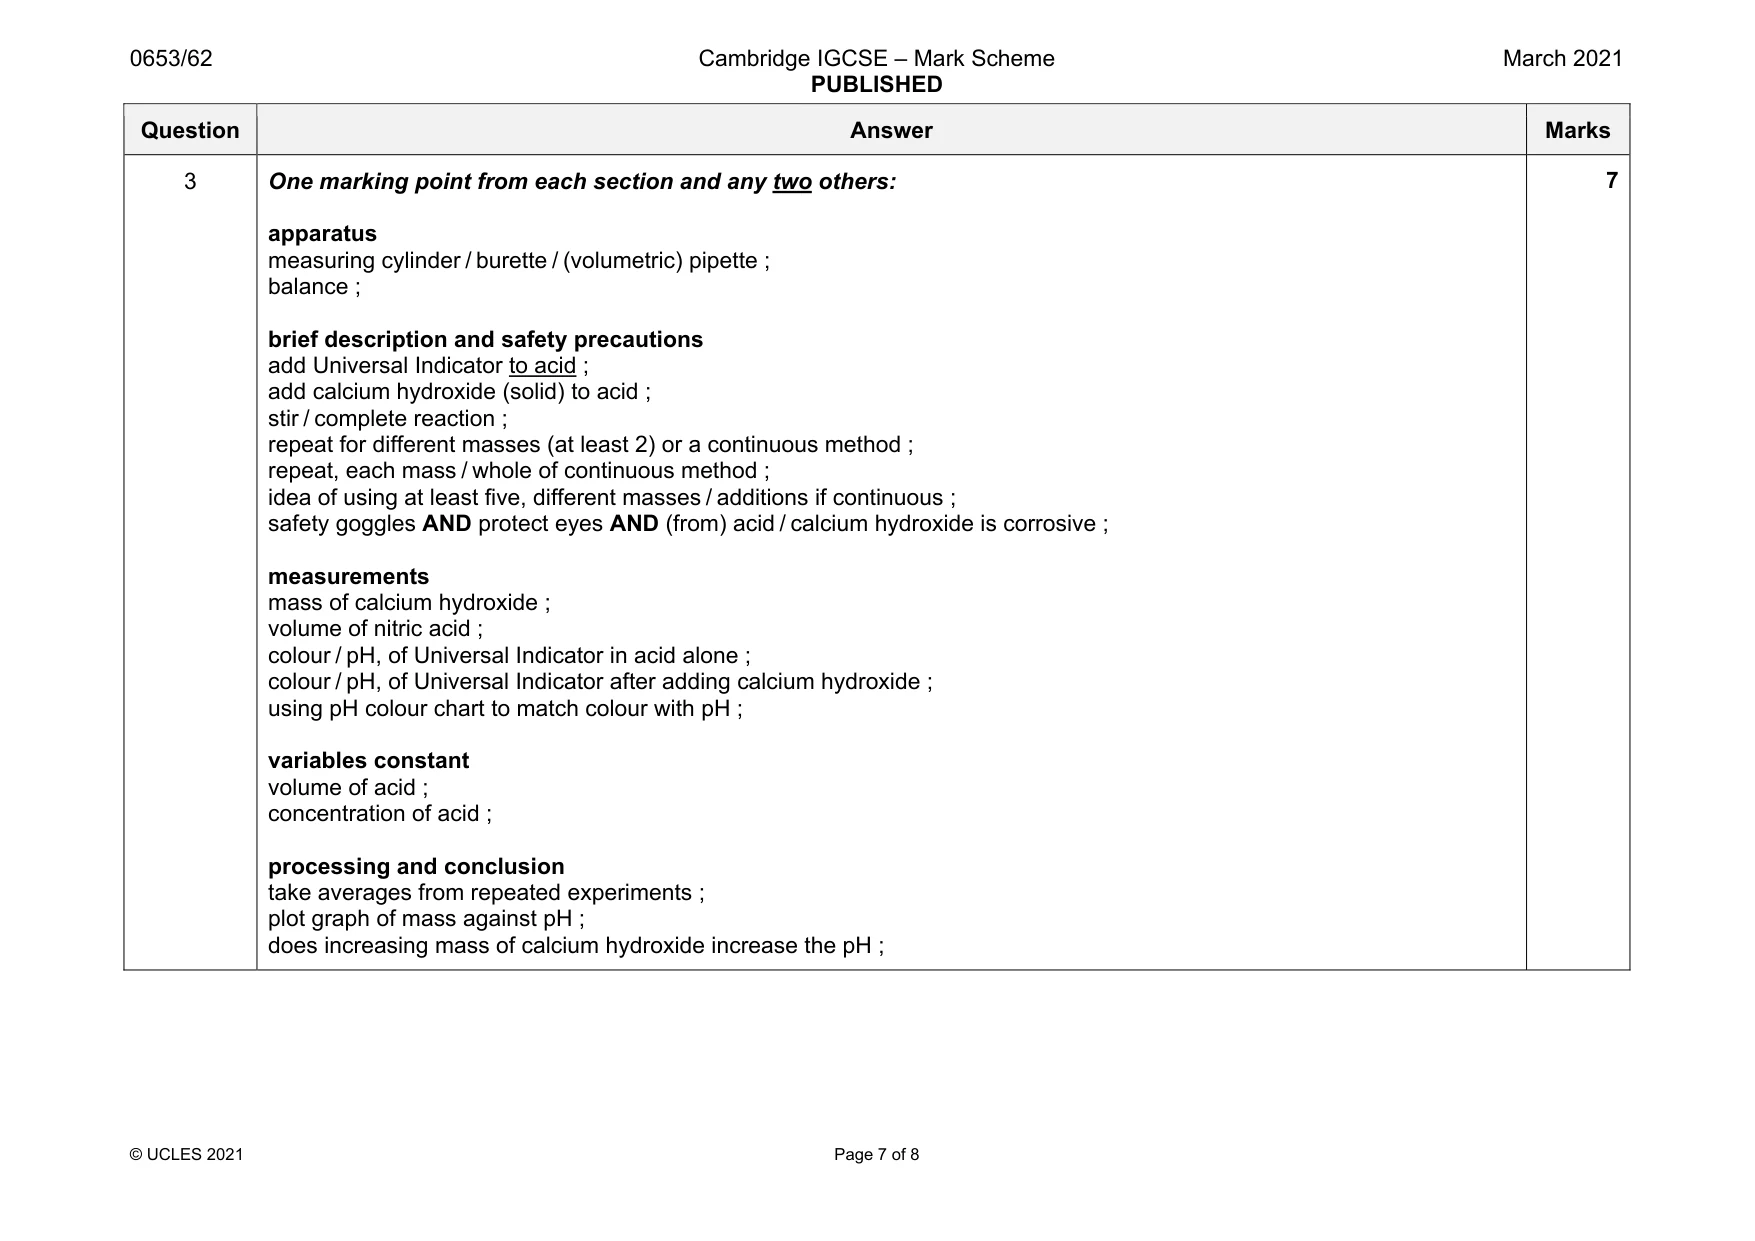
Mark scheme: 3 One marking point from each section and any two others: apparatus measuring cylinder / burette / (volumetric) pipette ; balance ; brief description and safety precautions add Universal Indicator to acid ; add calcium hydroxide (solid) to acid ; stir / complete reaction ; repeat for different masses (at least 2) or a continuous method ; repeat, each mass / whole of continuous method ; idea of using at least five, different masses / additions if continuous ; safety goggles AND protect eyes AND (from) acid / calcium hydroxide is corrosive ; measurements mass of calcium hydroxide ; volume of nitric acid ; colour / pH, of Universal Indicator in acid alone ; colour / pH, of Universal Indicator after adding calcium hydroxide ; using pH colour chart to match colour with pH ; variables constant volume of acid ; concentration of acid ; processing and conclusion take averages from repeated experiments ; plot graph of mass against pH ; does increasing mass of calcium hydroxide increase the pH ;
Q4 · A student investigates the rate at which hot water cools
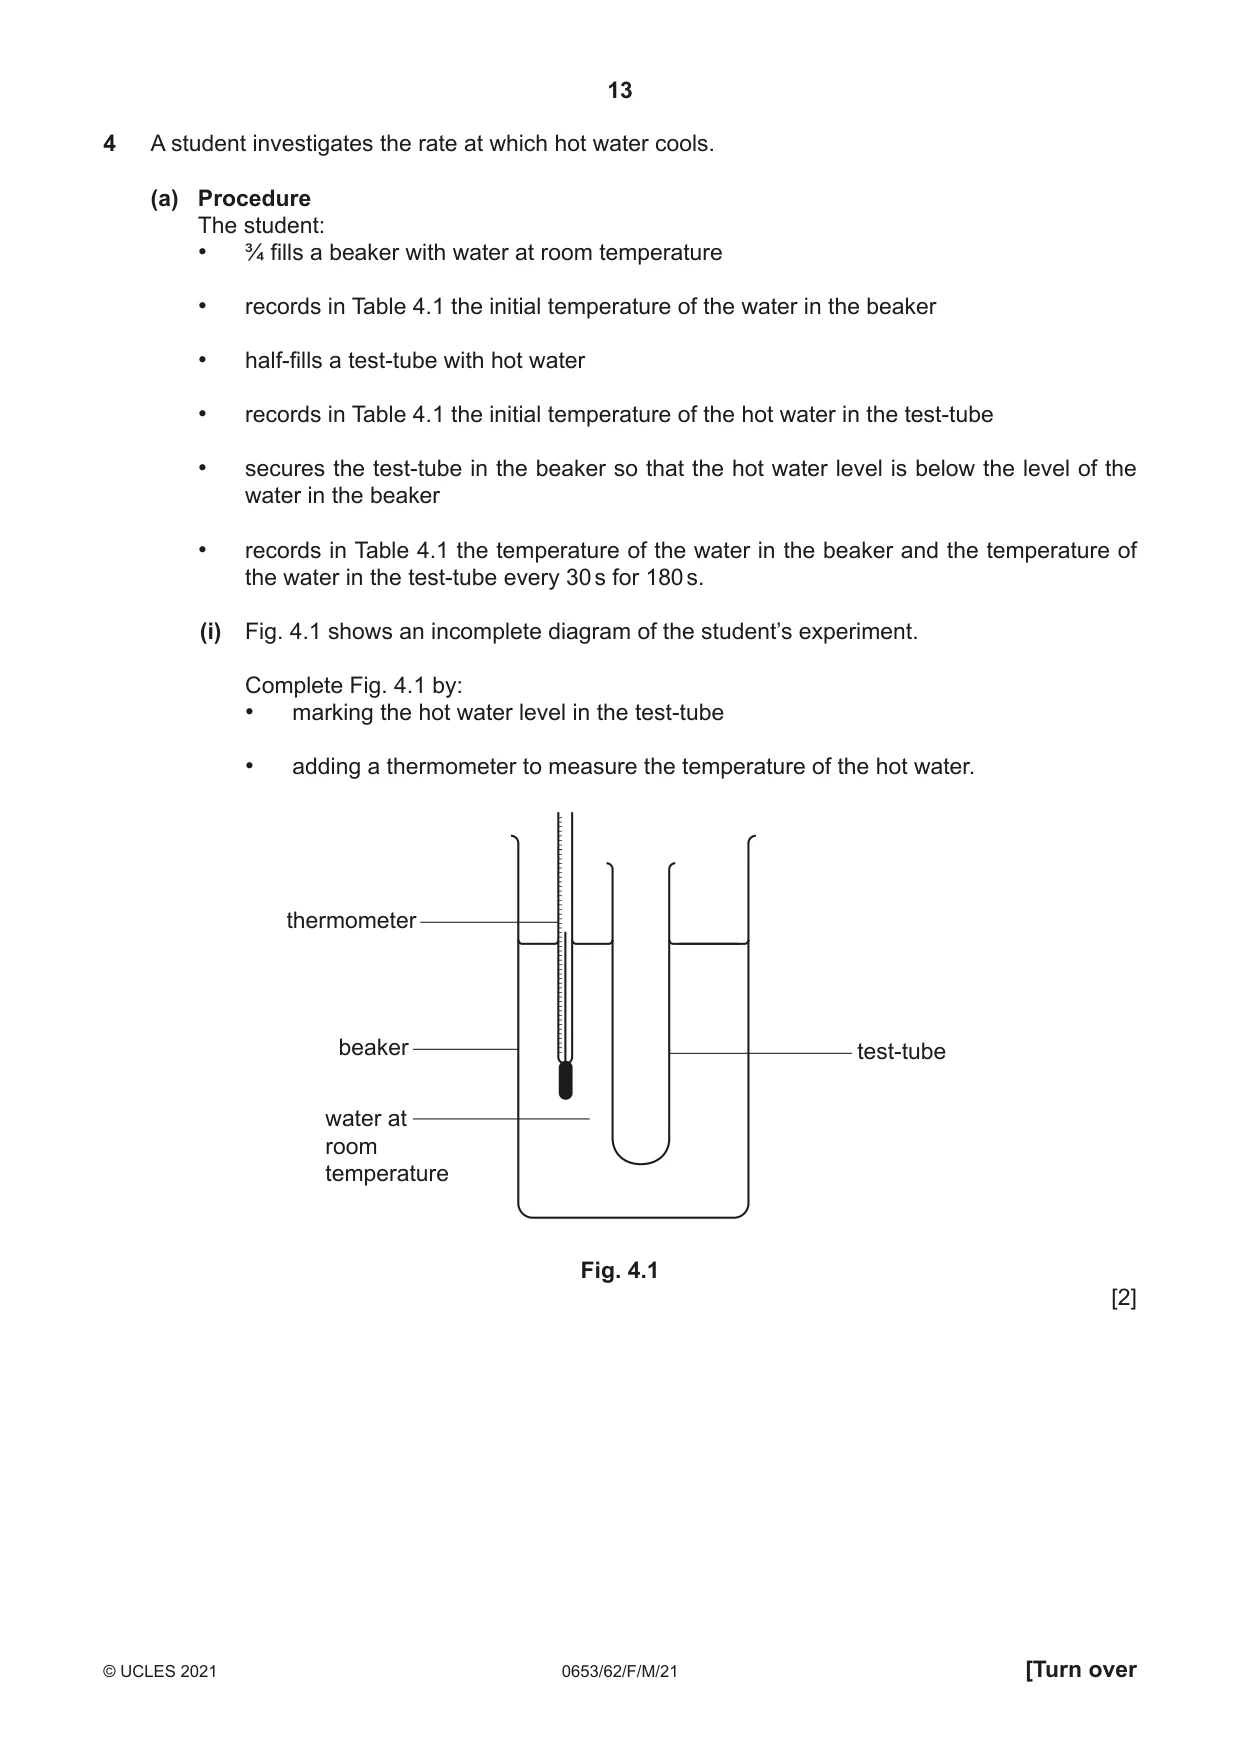
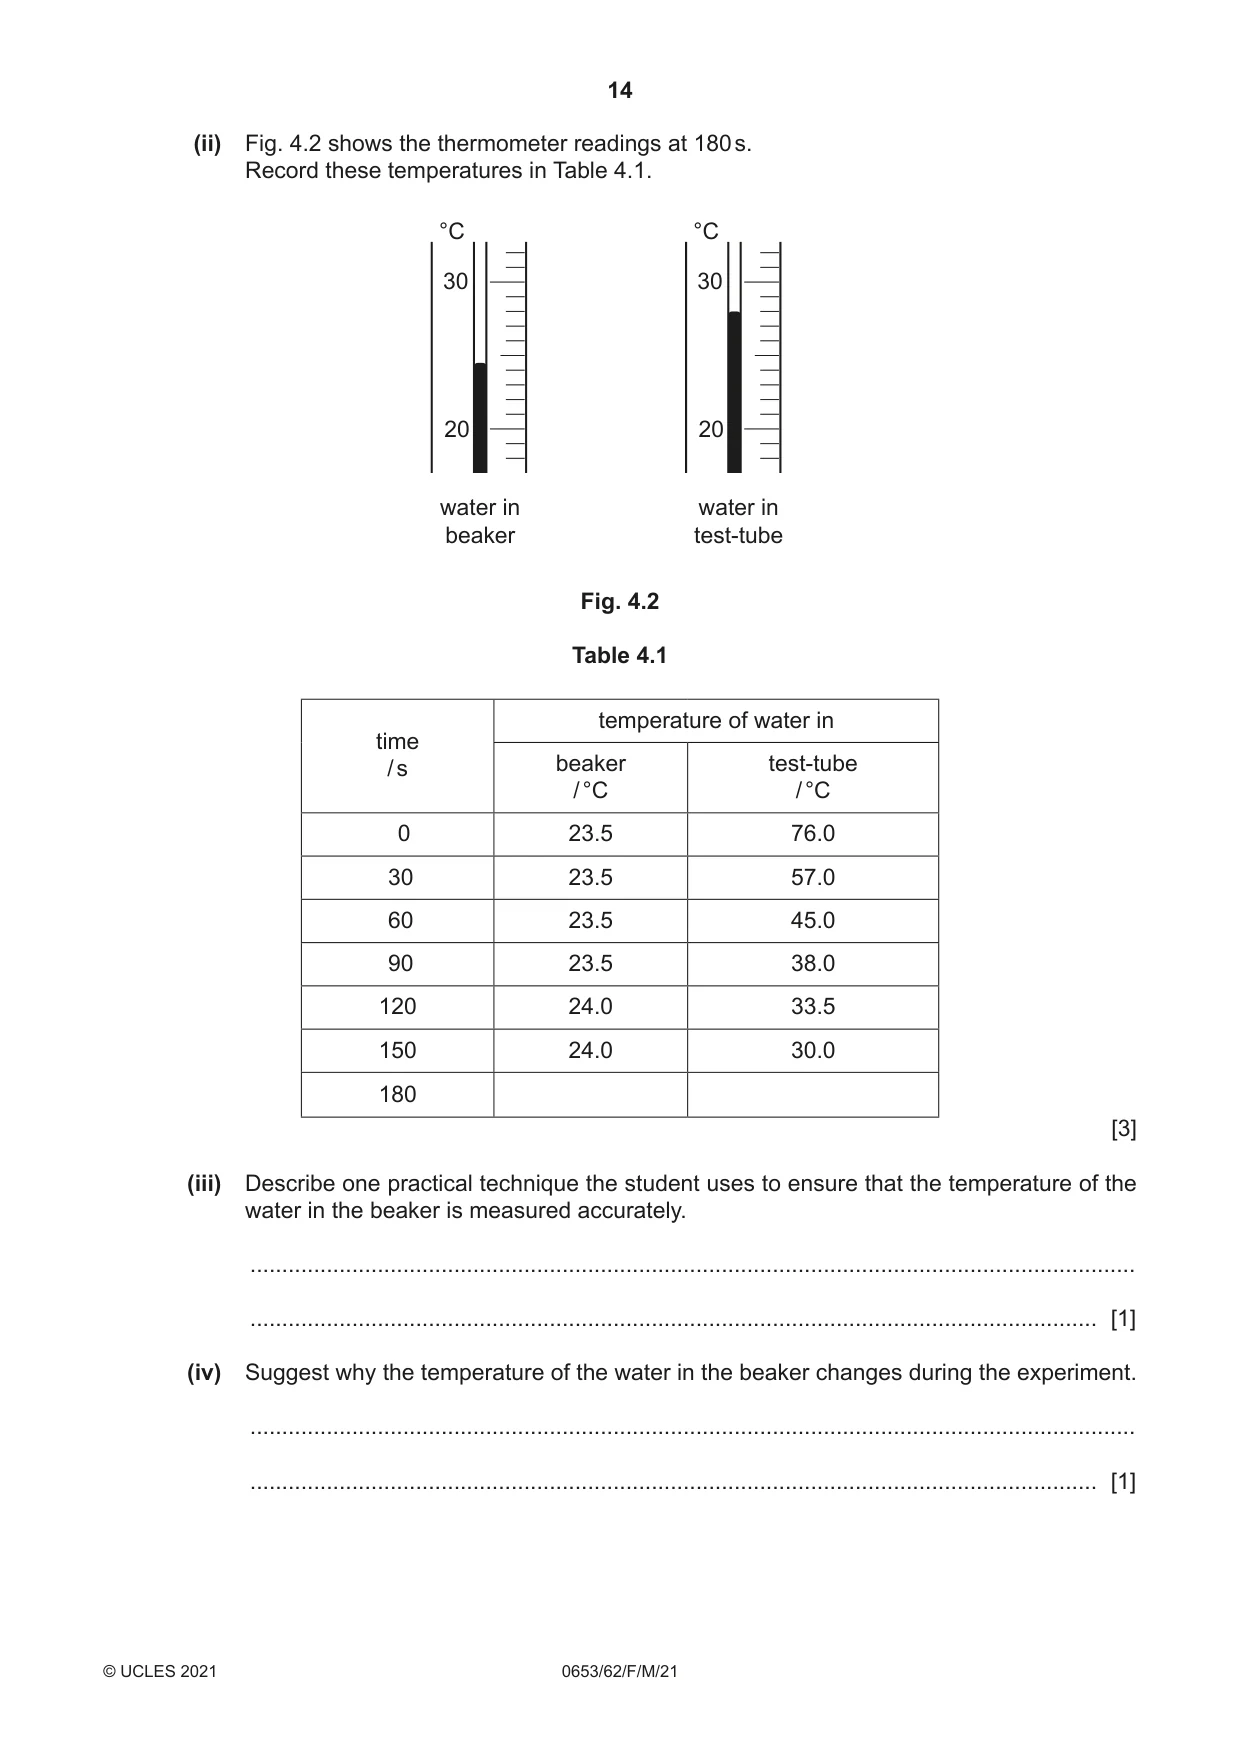
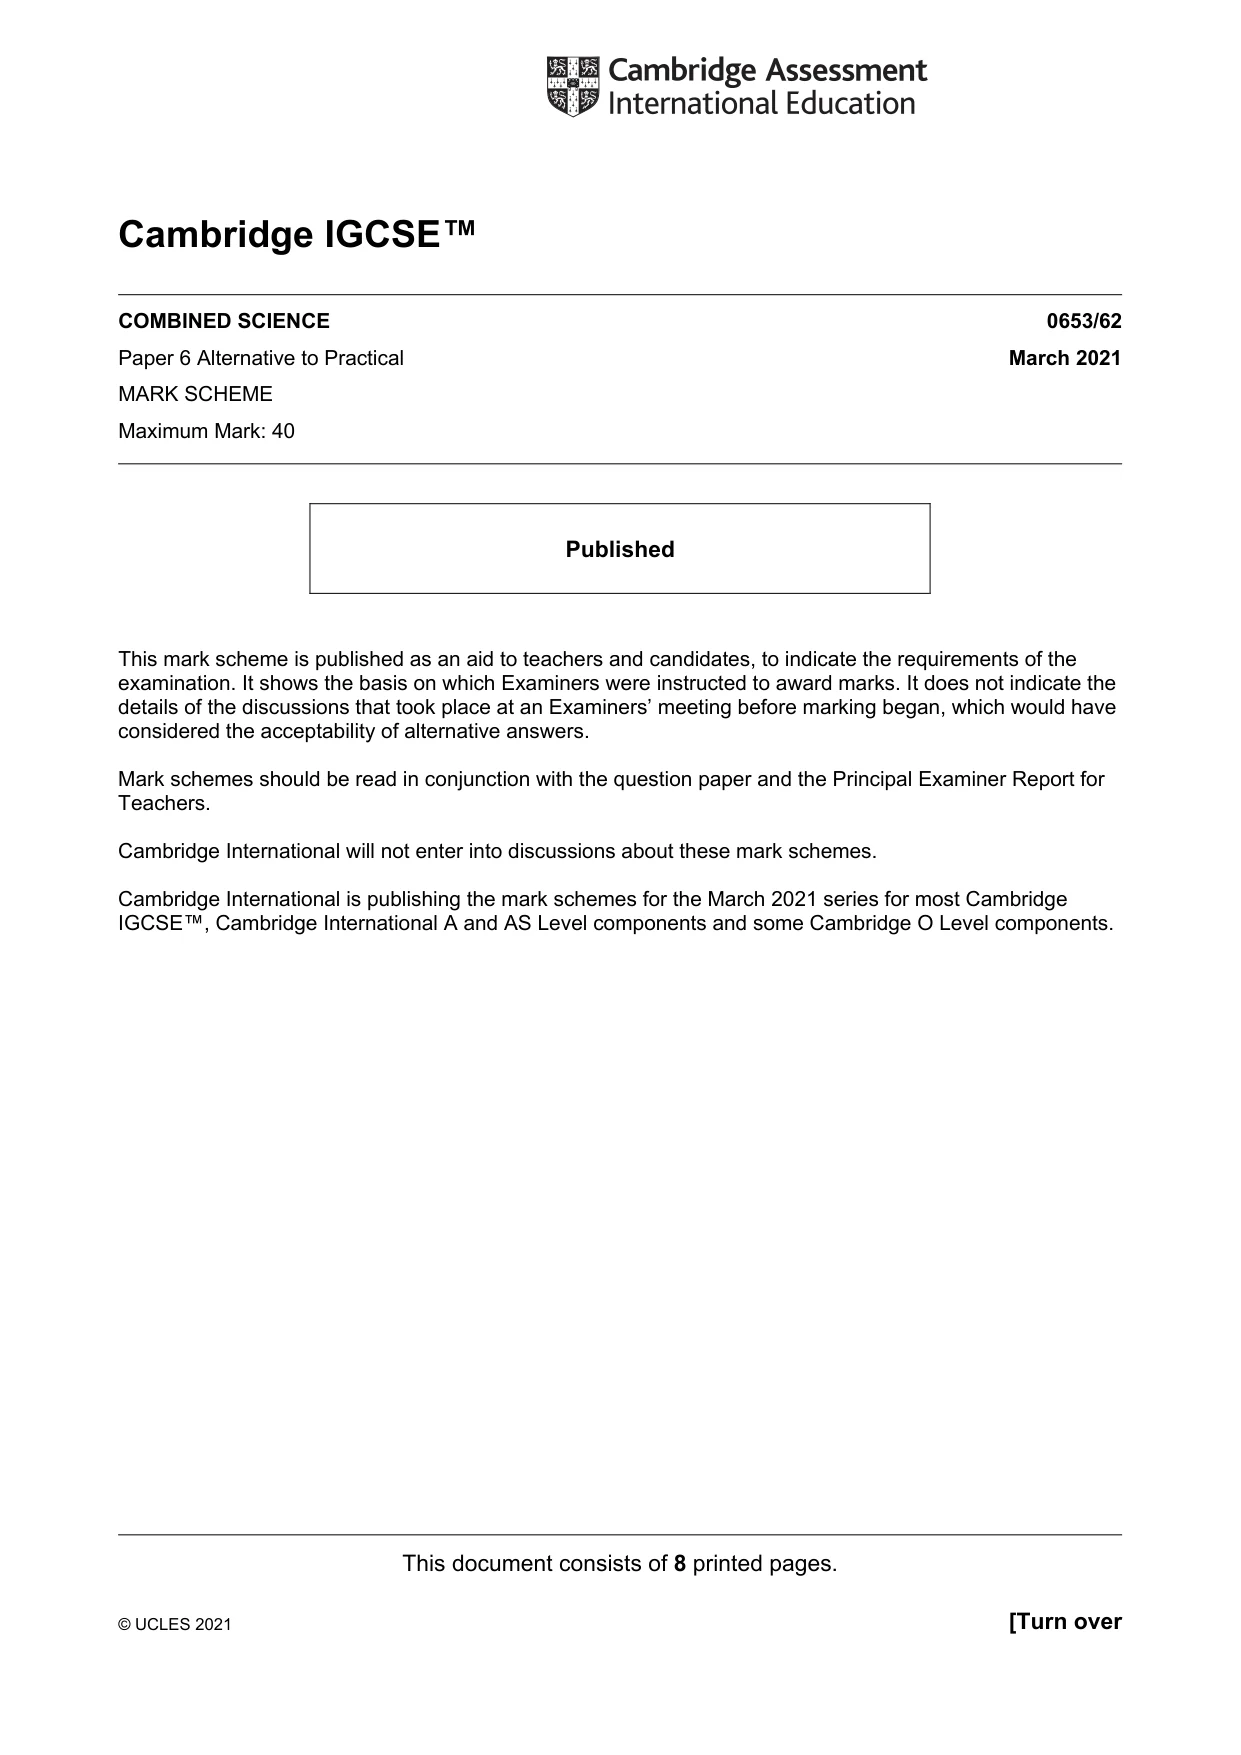
4 A student investigates the rate at which hot water cools. (a) Procedure The student: • ¾ fills a beaker with water at room temperature • records in Table 4.1 the initial temperature of the water in the beaker • half-fills a test-tube with hot water • records in Table 4.1 the initial temperature of the hot water in the test-tube • secures the test-tube in the beaker so that the hot water level is below the level of the water in the beaker • records in Table 4.1 the temperature of the water in the beaker and the temperature of the water in the test-tube every 30 s for 180 s. (i) Fig. 4.1 shows an incomplete diagram of the student’s experiment. Complete Fig. 4.1 by: • marking the hot water level in the test-tube • adding a thermometer to measure the temperature of the hot water. thermometer beaker test-tube water at room temperature Fig. 4.1 [2] (ii) Fig. 4.2 shows the thermometer readings at 180 s. Record these temperatures in Table 4.1. °C °C 30 30 20 20 water in water in beaker test-tube Fig. 4.2 Table 4.1 temperature of water in time / s beaker test-tube / °C / °C 0 23.5 76.0 30 23.5 57.0 60 23.5 45.0 90 23.5 38.0 120 24.0 33.5 150 24.0 30.0 180 [3] (iii) Describe one practical technique the student uses to ensure that the temperature of the water in the beaker is measured accurately. ........................................................................................................................................... ..................................................................................................................................... [1] (iv) Suggest why the temperature of the water in the beaker changes during the experiment. ........................................................................................................................................... ..................................................................................................................................... [1] (b) (i) Plot a graph of the temperature of the hot water in the test-tube (vertical axis) against time using the results in Table 4.1. Do not start the temperature scale at 0 °C. [3] (ii) Draw the best-fit curve. [1] (c) (i) Calculate the rate of cooling of the hot water in the test-tube during the first 30 s. Use the equation shown. temperature at 0 s – temperature at 30 s rate of cooling during first 30 s = 30 Give your answer to two significant figures. rate of cooling = ................................................. °C / s [1] (ii) Describe how the rate of cooling of the hot water in the test-tube changes during the 180 s. ........................................................................................................................................... ..................................................................................................................................... [1] [Total: 13]
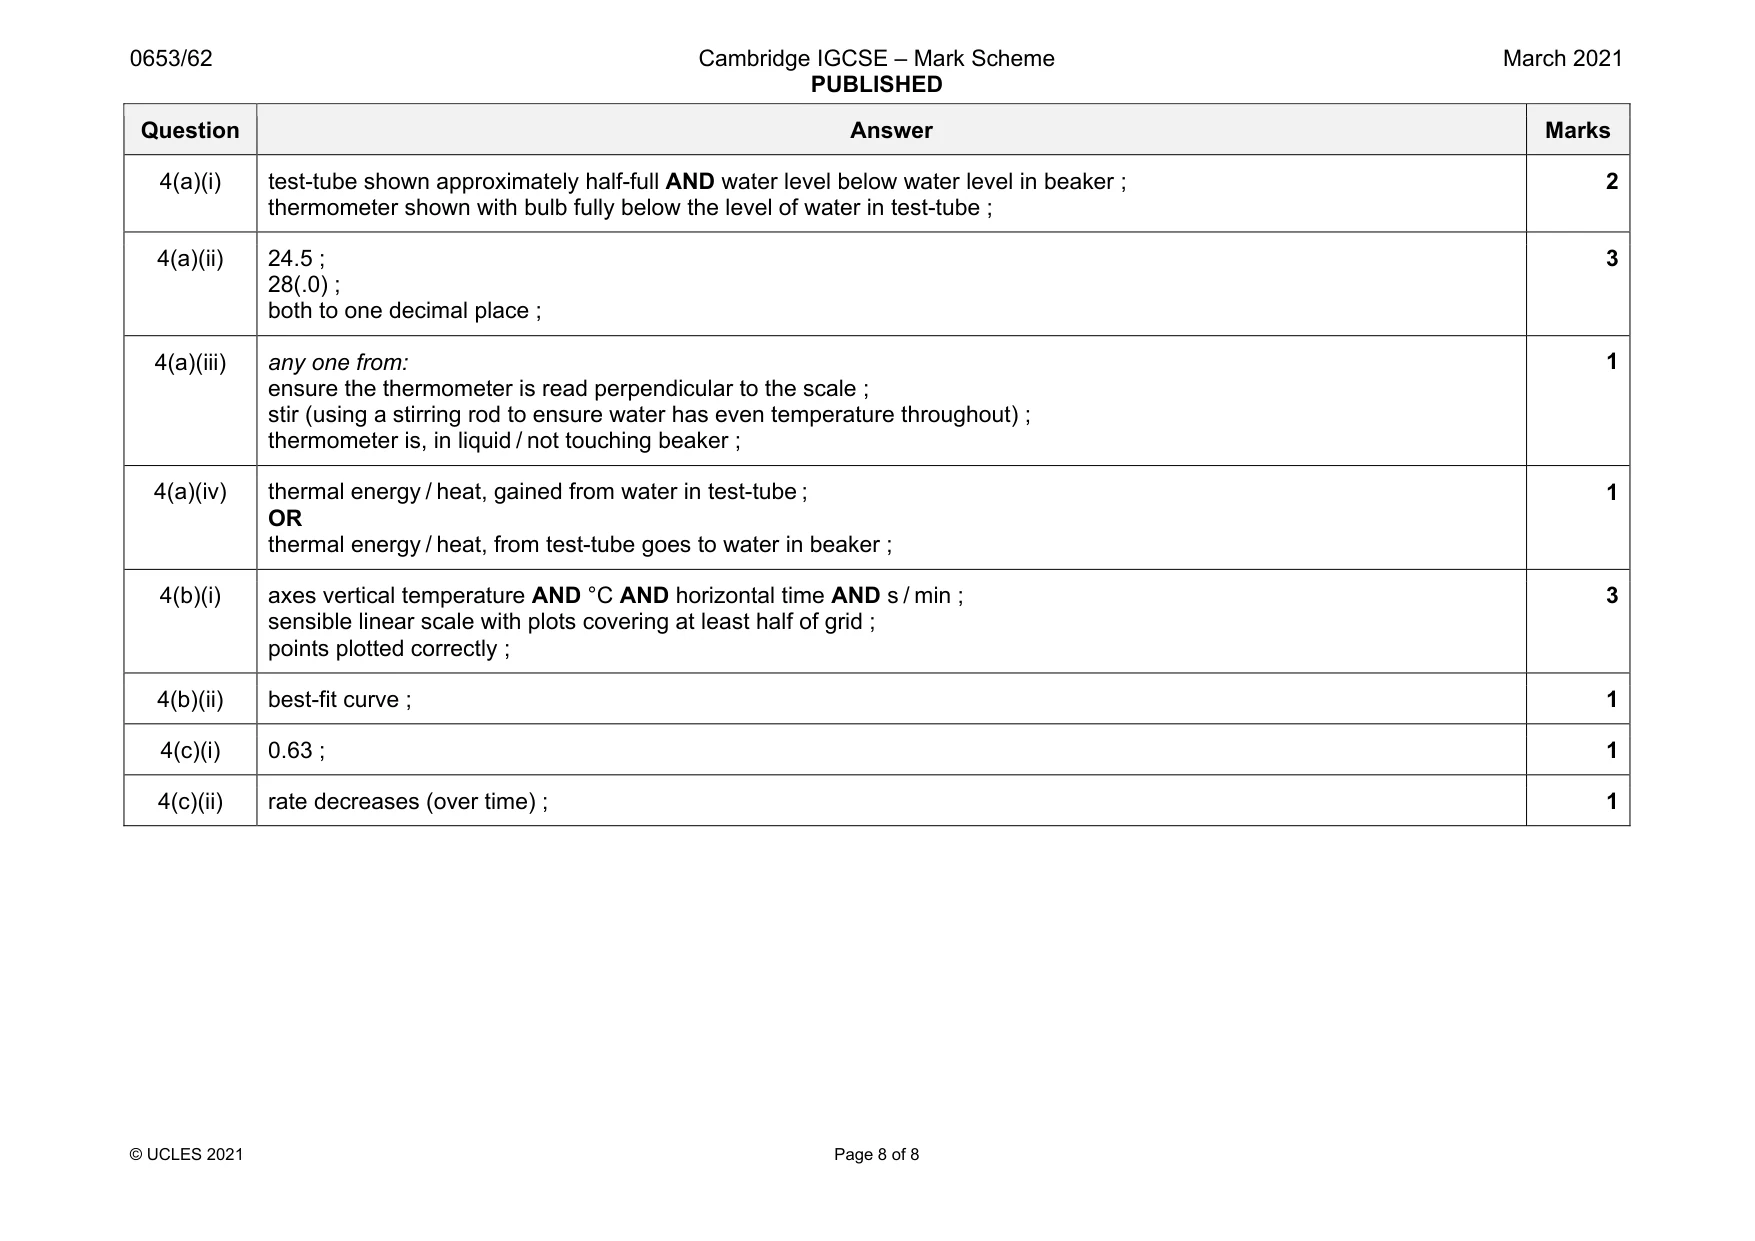
Mark scheme: 4(a)(i) test-tube shown approximately half-full AND water level below water level in beaker ; thermometer shown with bulb fully below the level of water in test-tube ; 2 4(a)(ii) 24.5 ; 28(.0) ; both to one decimal place ; 3 4(a)(iii) any one from: ensure the thermometer is read perpendicular to the scale ; stir (using a stirring rod to ensure water has even temperature throughout) ; thermometer is, in liquid / not touching beaker ; 1 4(a)(iv) thermal energy / heat, gained from water in test-tube ; OR thermal energy / heat, from test-tube goes to water in beaker ; 1 4(b)(i) axes vertical temperature AND °C AND horizontal time AND s / min ; sensible linear scale with plots covering at least half of grid ; points plotted correctly ; 3 4(b)(ii) best-fit curve ; 1 4(c)(i) 0.63 ; 1 4(c)(ii) rate decreases (over time) ; 1
What was in this paper
The subtopics covered by these 4 questions, and how many questions each got. Open one in a new tab to see every Cambridge question on it.
What you needed in this session
Cambridge’s own grade thresholds for 2021 Feb/March, Paper 6 · Variant 2. A higher threshold means an easier paper — the bar moves with how the cohort did.