Cambridge IGCSE Science - Combined 0653 — 2020 May/June Paper 5 · Variant 1
0653/51/M/J/20 · 4 questions · 40 marks · ≈45 min
The question paper and its mark scheme, free to read here and free to download. This is Cambridge’s own paper, exactly as it was sat.
Question paper16 pages


Mark scheme7 pages
Answers below. Sit the paper first if you are practising.
Questions as text
Q1 · You are going to investigate the rate of diffusion in model cells
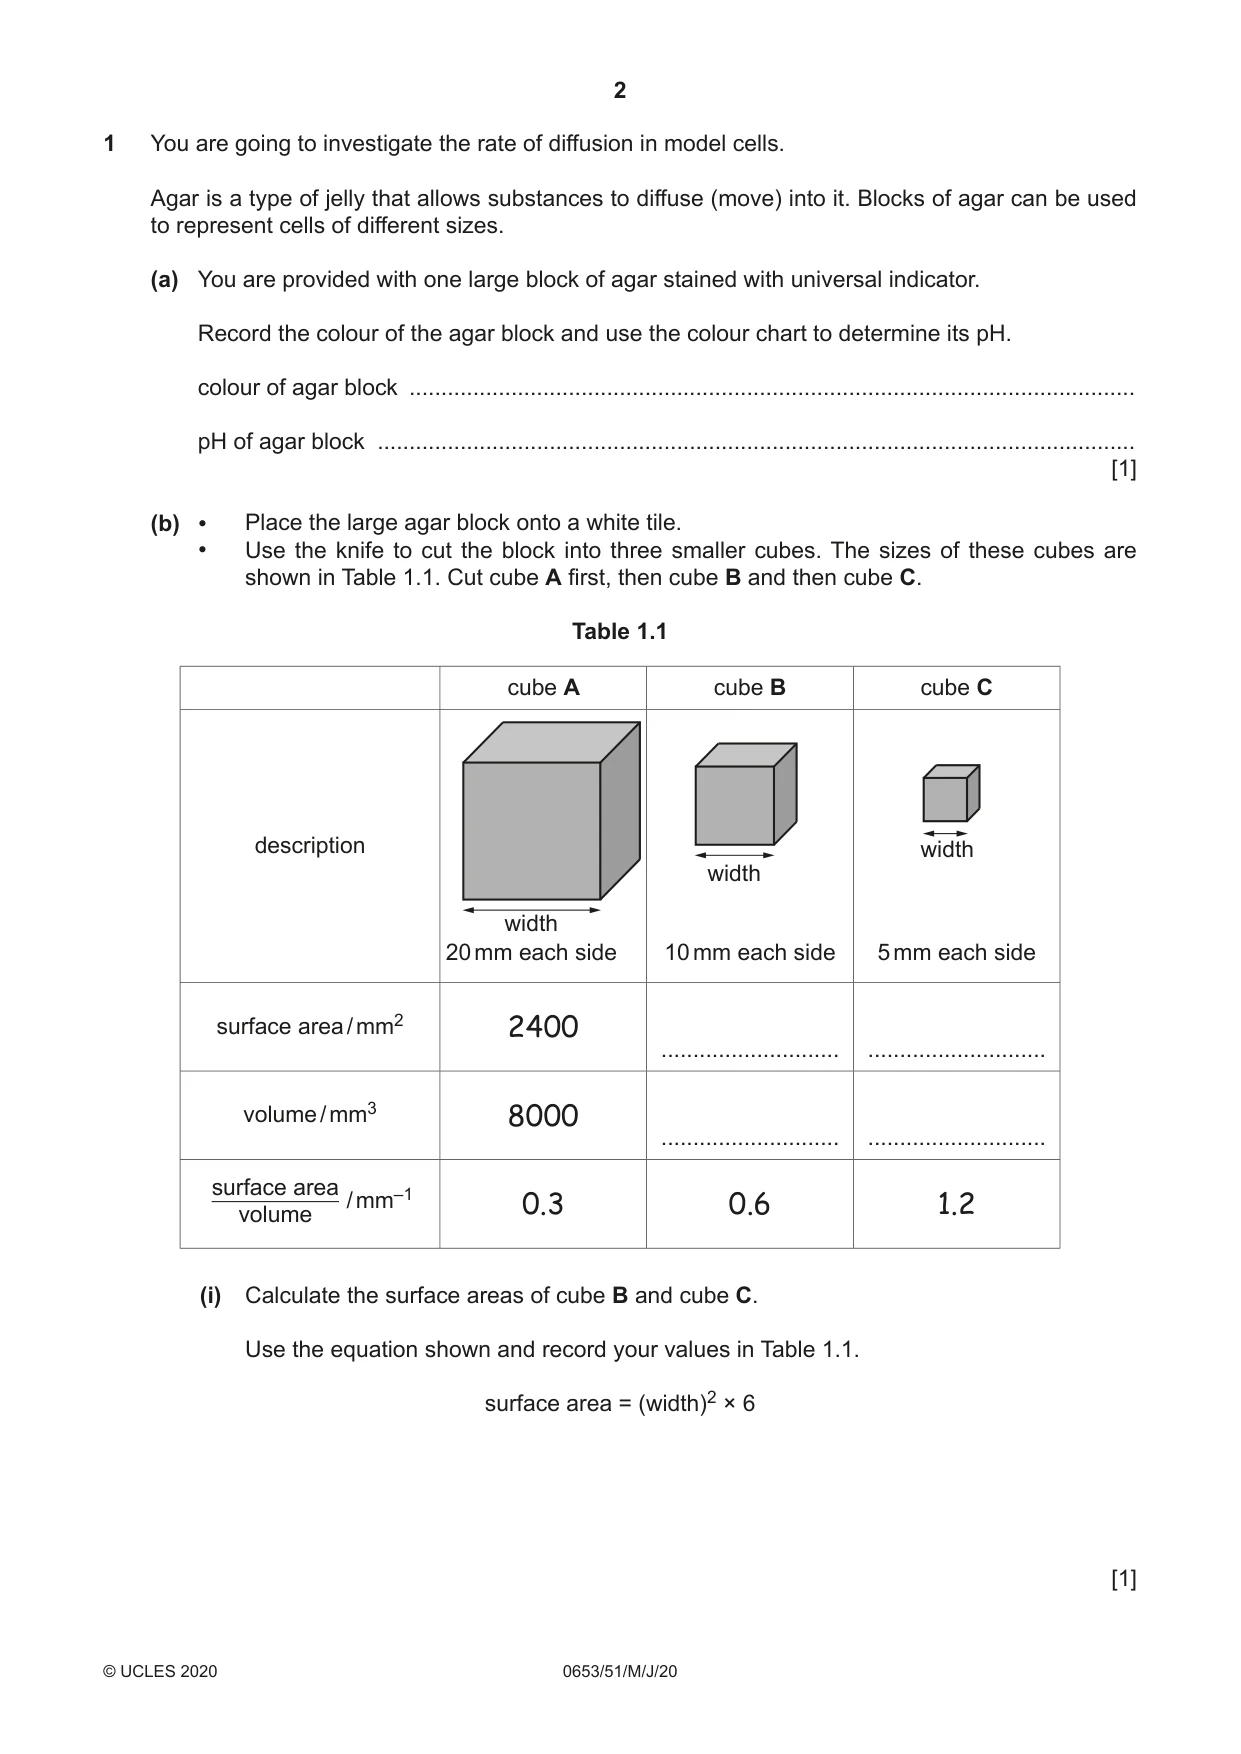
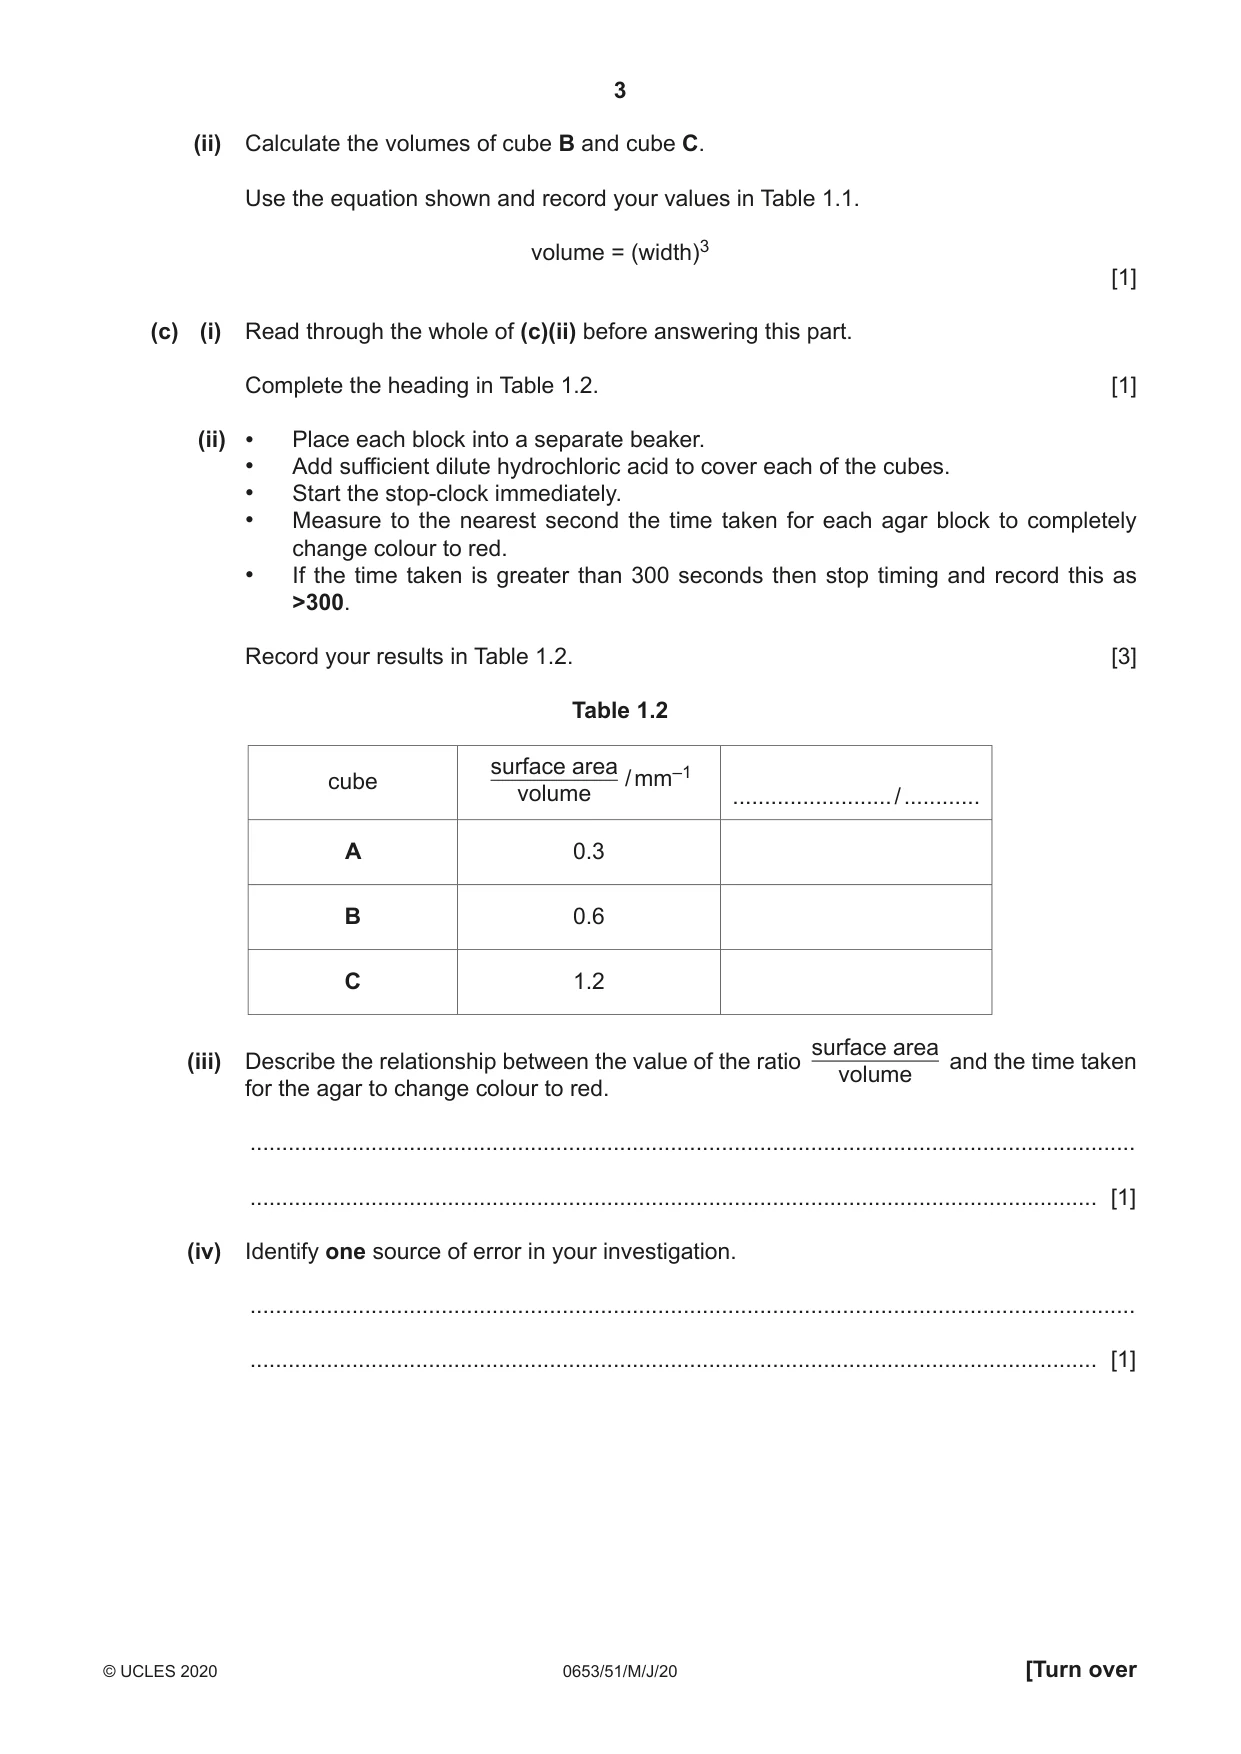
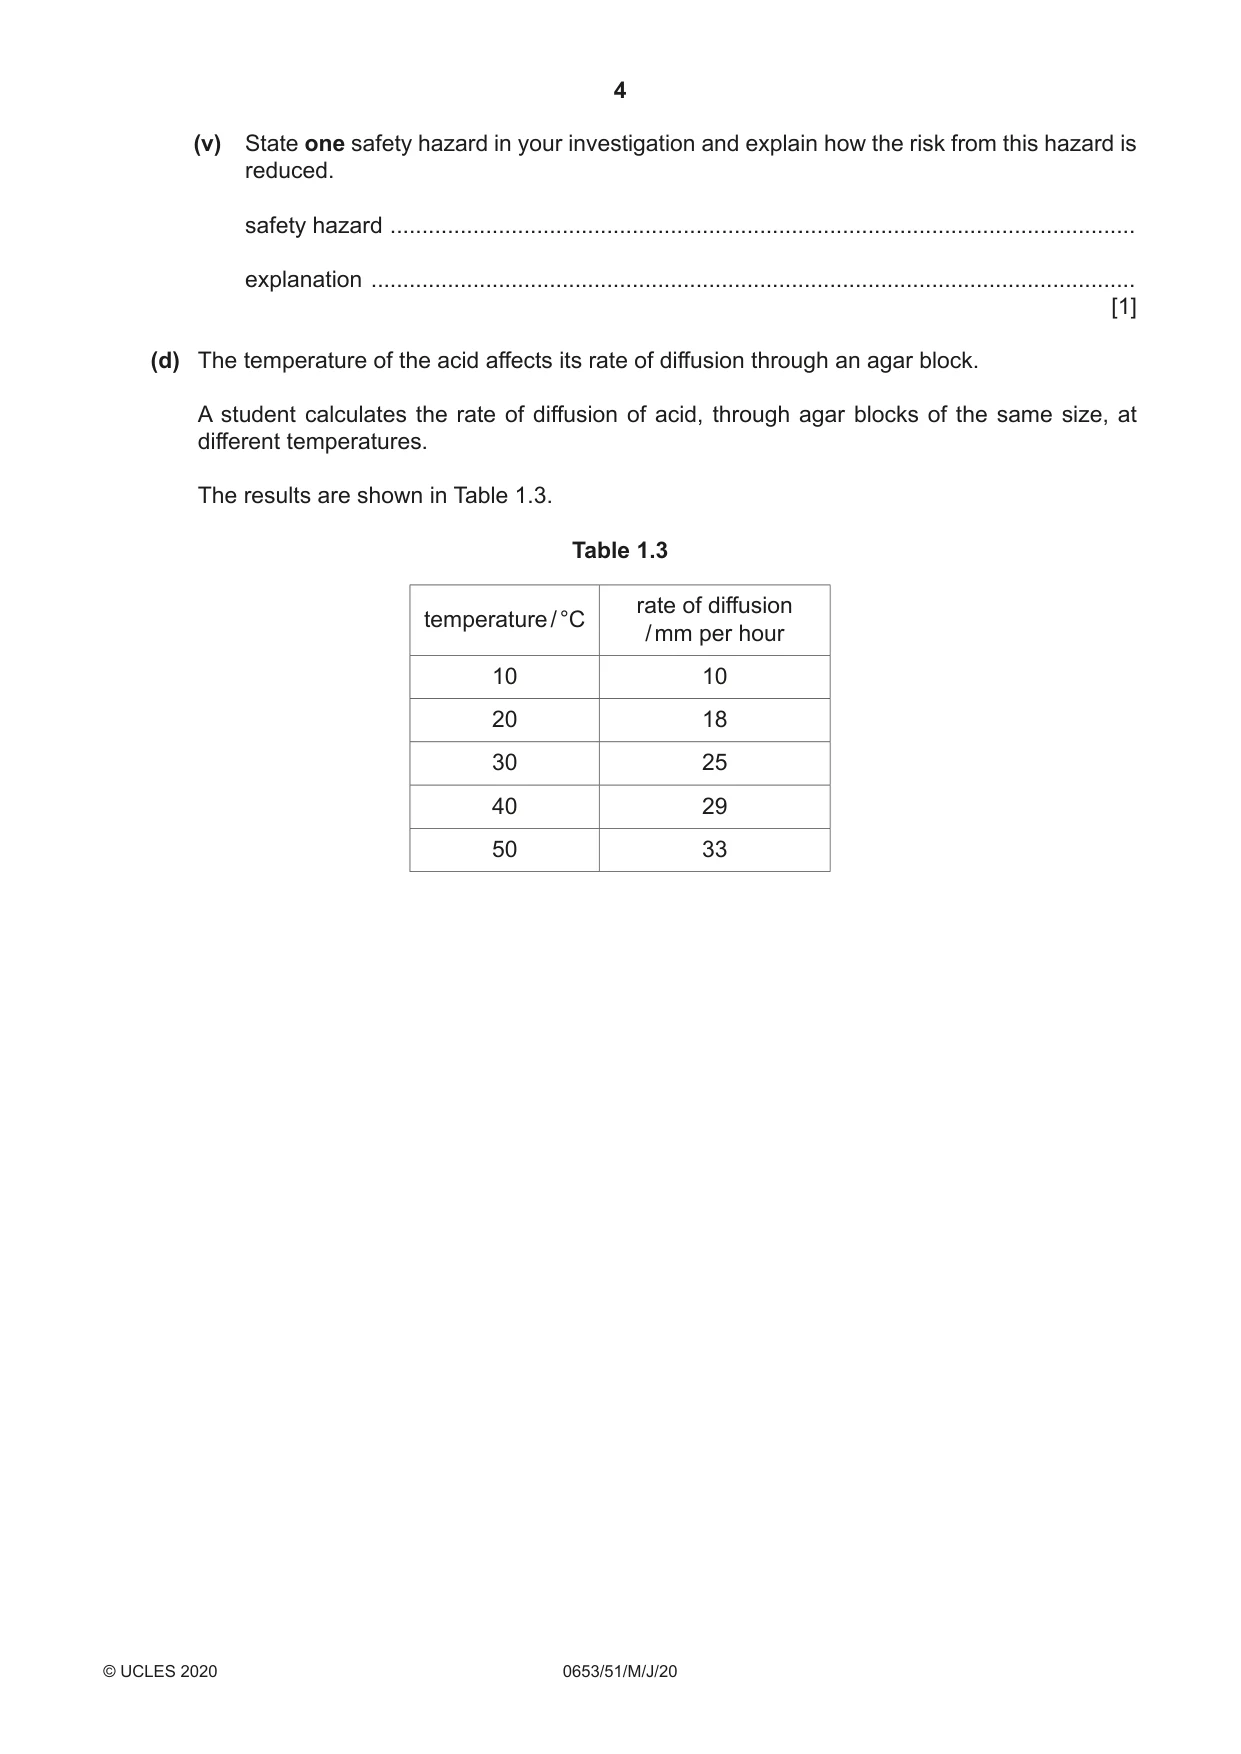
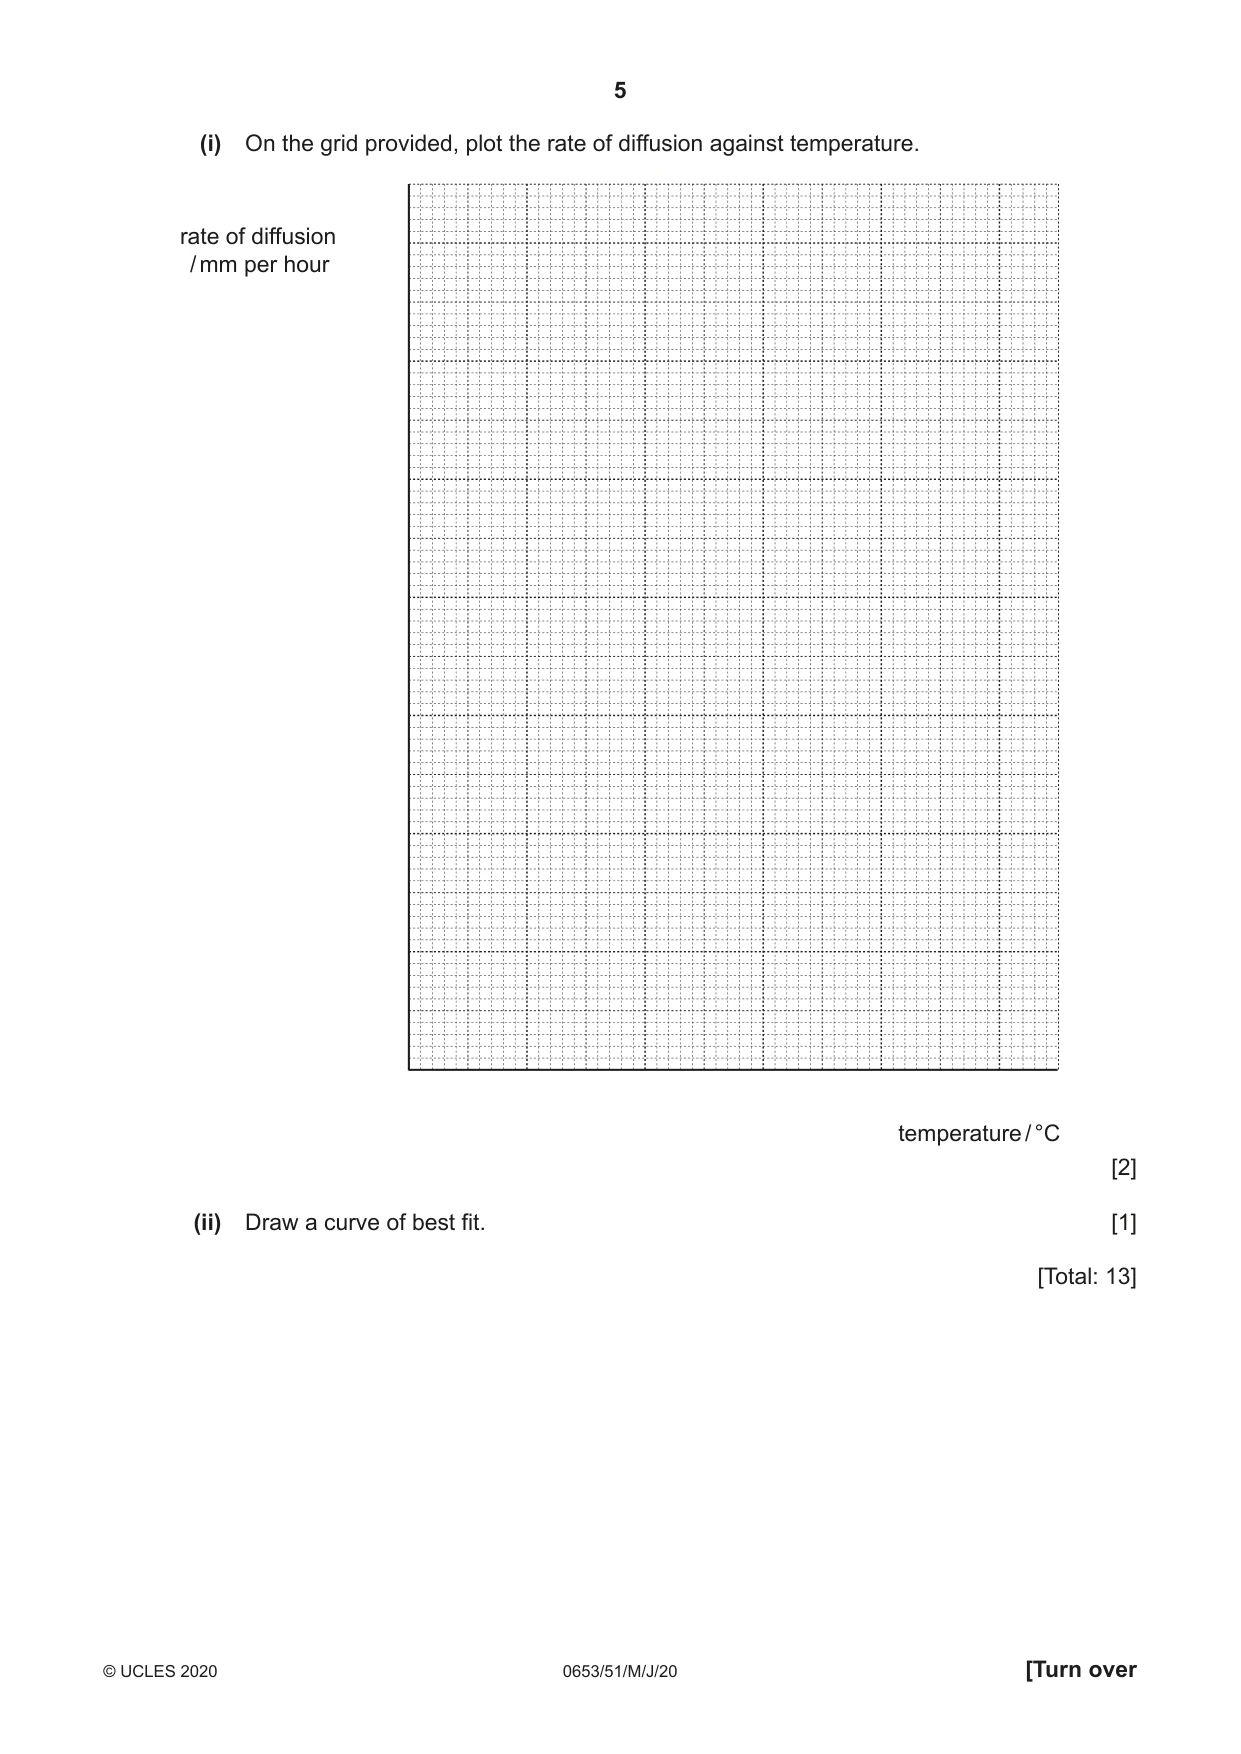
1 You are going to investigate the rate of diffusion in model cells. Agar is a type of jelly that allows substances to diffuse (move) into it. Blocks of agar can be used to represent cells of different sizes. (a) You are provided with one large block of agar stained with universal indicator. Record the colour of the agar block and use the colour chart to determine its pH. colour of agar block .................................................................................................................. pH of agar block ....................................................................................................................... [1] (b) • Place the large agar block onto a white tile. • Use the knife to cut the block into three smaller cubes. The sizes of these cubes are shown in Table 1.1. Cut cube A first, then cube B and then cube C. Table 1.1 cube A cube B cube C description width width width 20 mm each side 10 mm each side 5 mm each side surface area / mm2 2400 ............................ ............................ volume / mm3 8000 ............................ ............................ surface area / mm–1 0.3 0.6 1.2 volume (i) Calculate the surface areas of cube B and cube C. Use the equation shown and record your values in Table 1.1. surface area = (width)2 × 6 [1] (ii) Calculate the volumes of cube B and cube C. Use the equation shown and record your values in Table 1.1. volume = (width)3 [1] (c) (i) Read through the whole of (c)(ii) before answering this part. Complete the heading in Table 1.2. [1] (ii) • Place each block into a separate beaker. • Add sufficient dilute hydrochloric acid to cover each of the cubes. • Start the stop-clock immediately. • Measure to the nearest second the time taken for each agar block to completely change colour to red. • If the time taken is greater than 300 seconds then stop timing and record this as >300. Record your results in Table 1.2. [3] Table 1.2 surface area cube / mm–1 volume ......................... / ............ A 0.3 B 0.6 C 1.2 surface area (iii) Describe the relationship between the value of the ratio and the time taken volume for the agar to change colour to red. ........................................................................................................................................... ..................................................................................................................................... [1] (iv) Identify one source of error in your investigation. ........................................................................................................................................... ..................................................................................................................................... [1] (v) State one safety hazard in your investigation and explain how the risk from this hazard is reduced. safety hazard ..................................................................................................................... explanation ........................................................................................................................ [1] (d) The temperature of the acid affects its rate of diffusion through an agar block. A student calculates the rate of diffusion of acid, through agar blocks of the same size, at different temperatures. The results are shown in Table 1.3. Table 1.3 rate of diffusion temperature / °C / mm per hour 10 10 20 18 30 25 40 29 50 33 (i) On the grid provided, plot the rate of diffusion against temperature. rate of diffusion / mm per hour temperature / °C [2] (ii) Draw a curve of best fit. [1] [Total: 13]
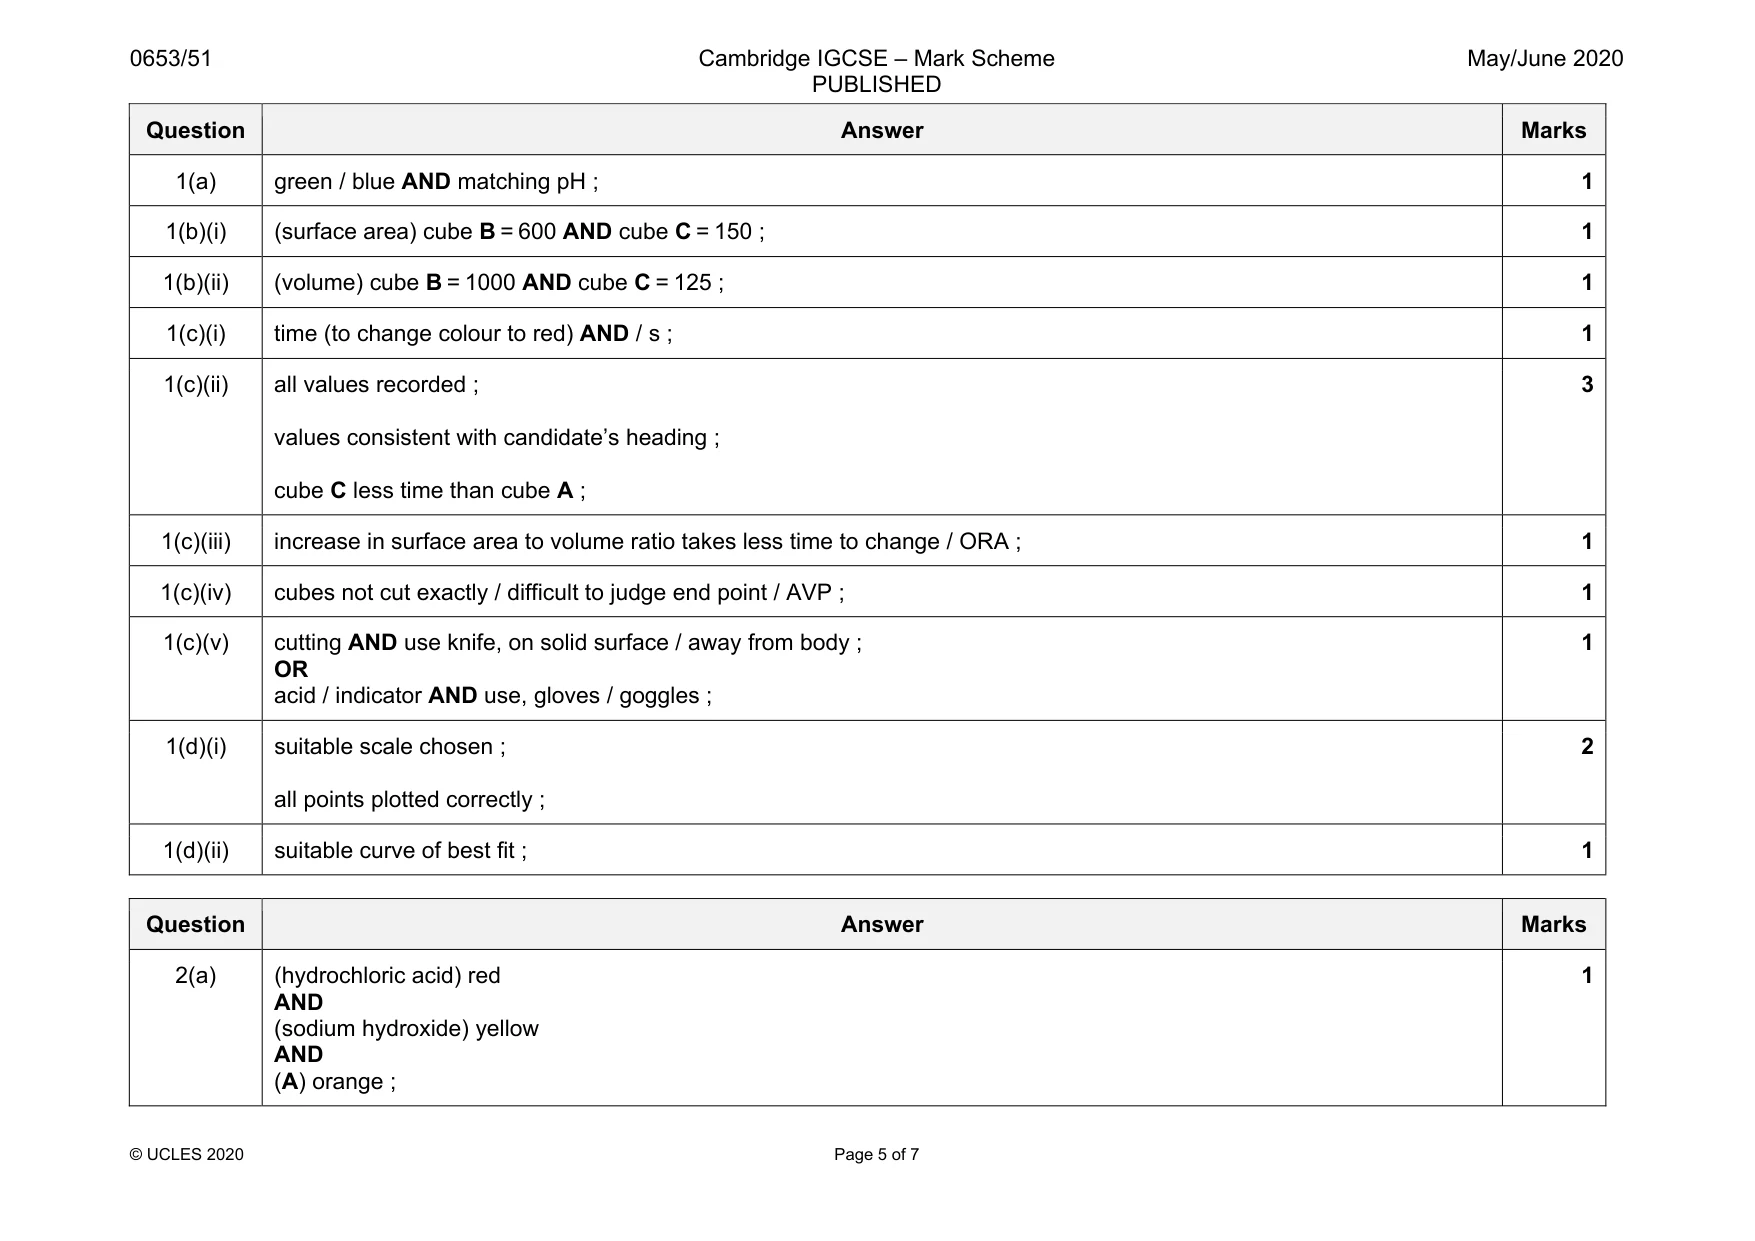
Mark scheme: 1(a) green / blue AND matching pH ; 1 1(b)(i) (surface area) cube B = 600 AND cube C = 150 ; 1 1(b)(ii) (volume) cube B = 1000 AND cube C = 125 ; 1 1(c)(i) time (to change colour to red) AND / s ; 1 1(c)(ii) all values recorded ; values consistent with candidate’s heading ; cube C less time than cube A ; 3 1(c)(iii) increase in surface area to volume ratio takes less time to change / ORA ; 1 1(c)(iv) cubes not cut exactly / difficult to judge end point / AVP ; 1 1(c)(v) cutting AND use knife, on solid surface / away from body ; OR acid / indicator AND use, gloves / goggles ; 1 1(d)(i) suitable scale chosen ; all points plotted correctly ; 2 1(d)(ii) suitable curve of best fit ; 1
Q2 · You are going to investigate the reaction between aqueous sodium hydroxide and dilute…
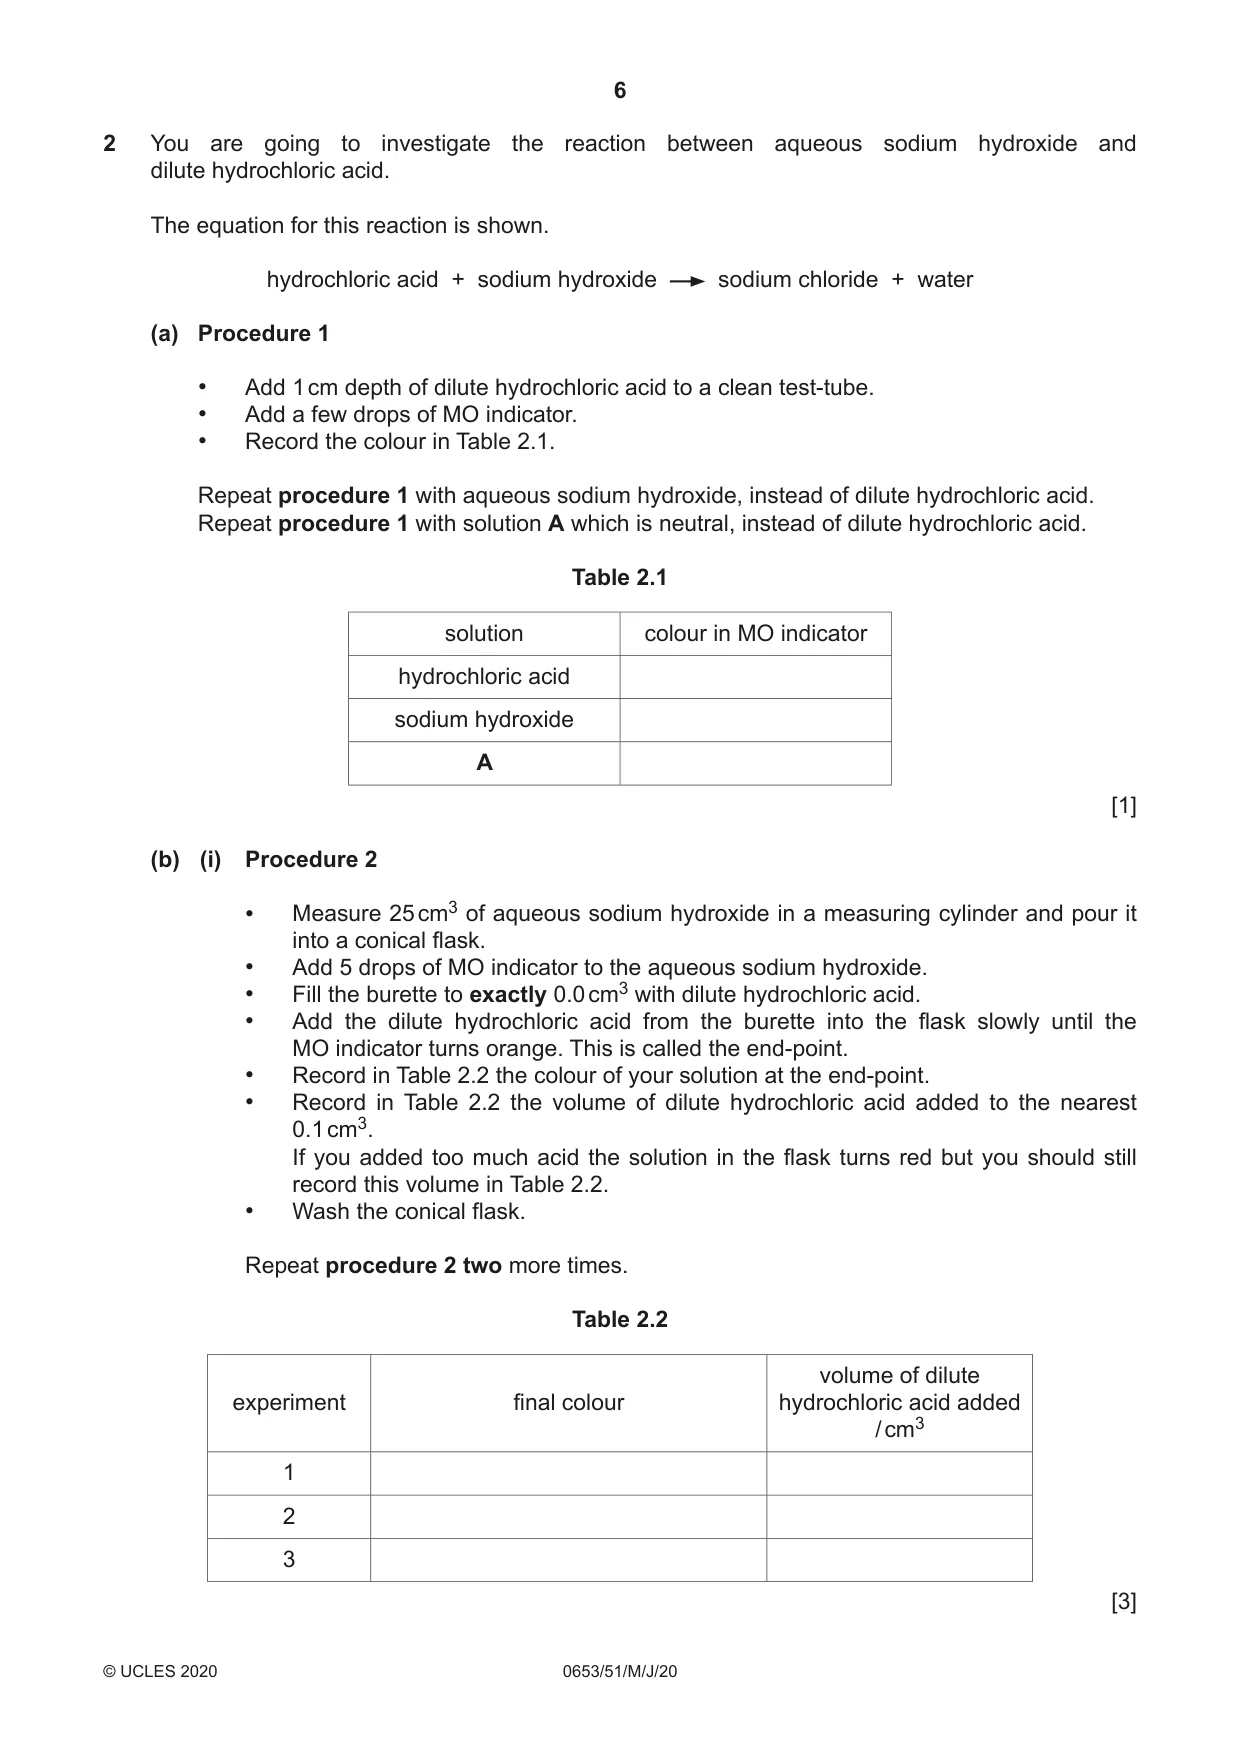
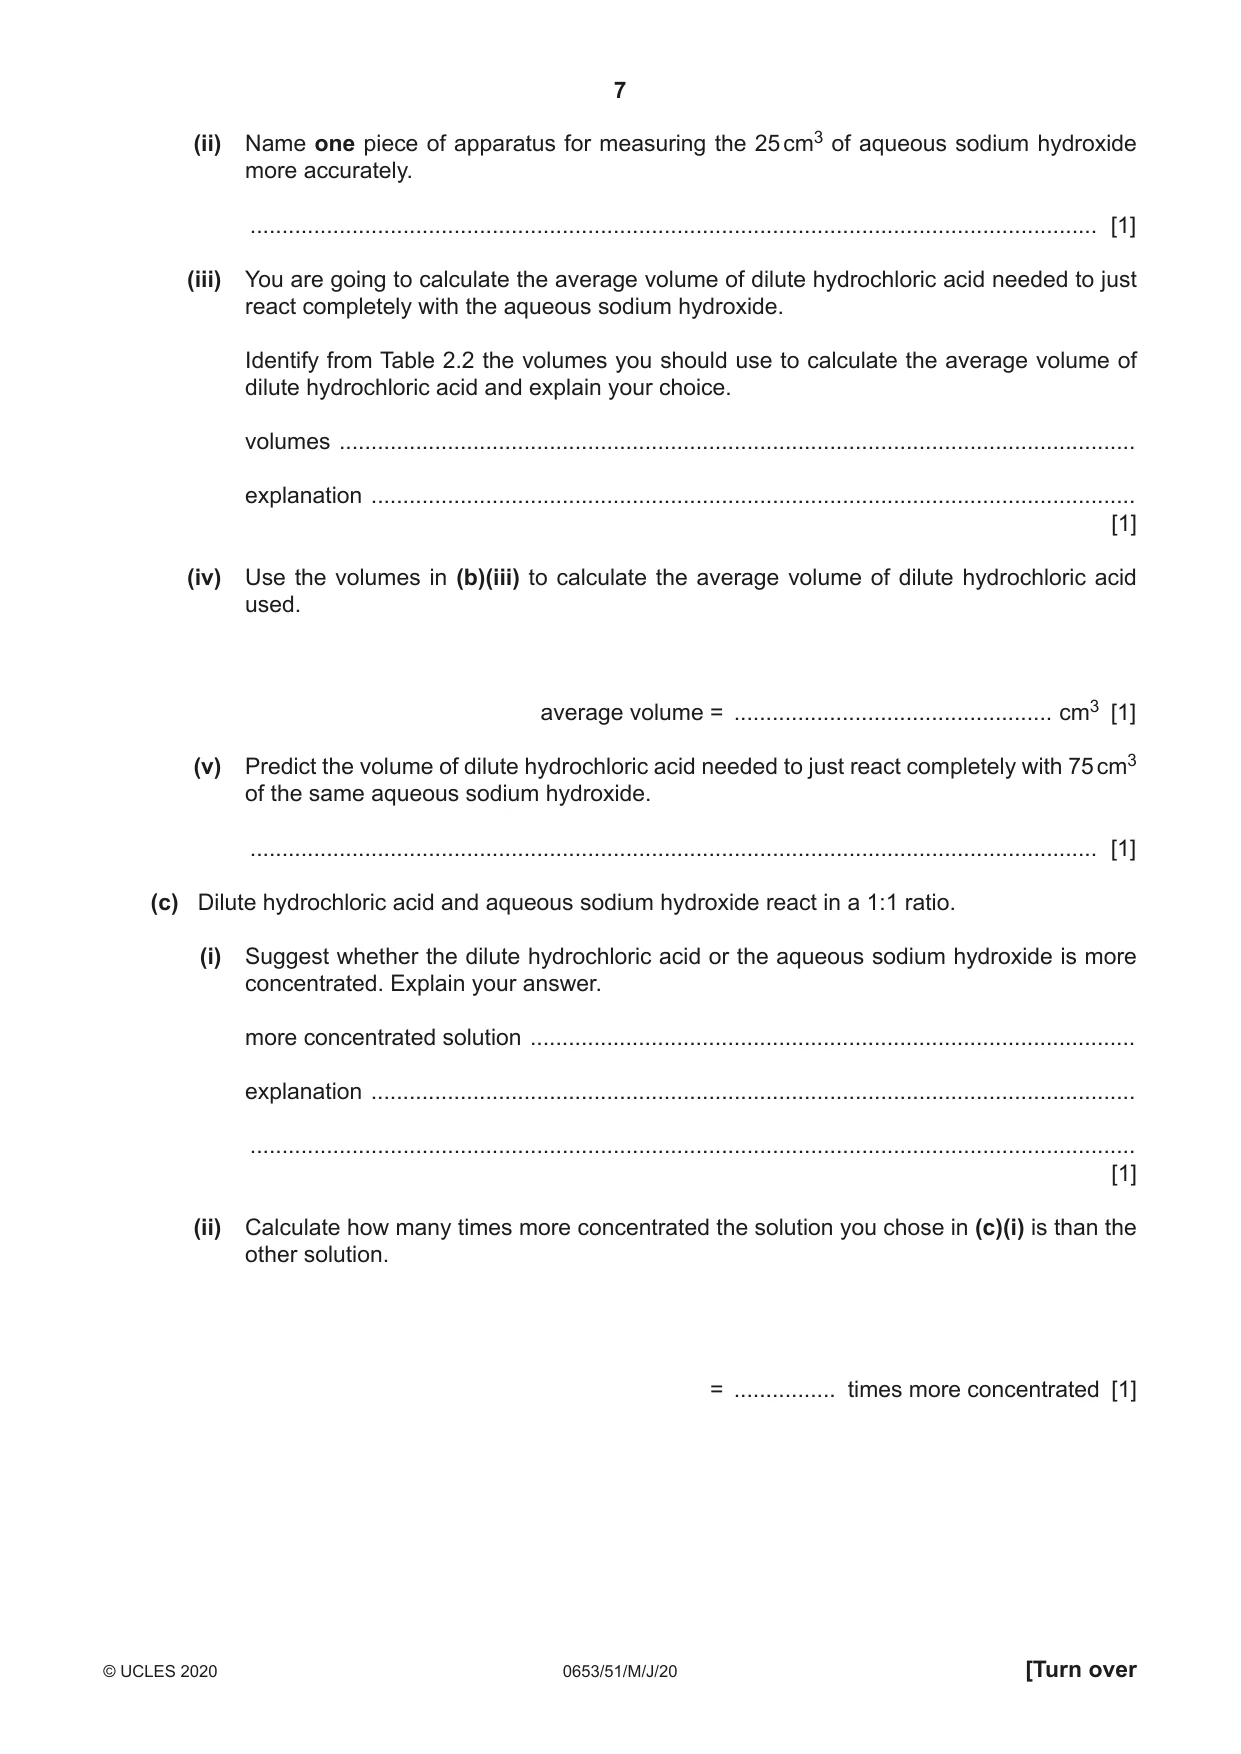
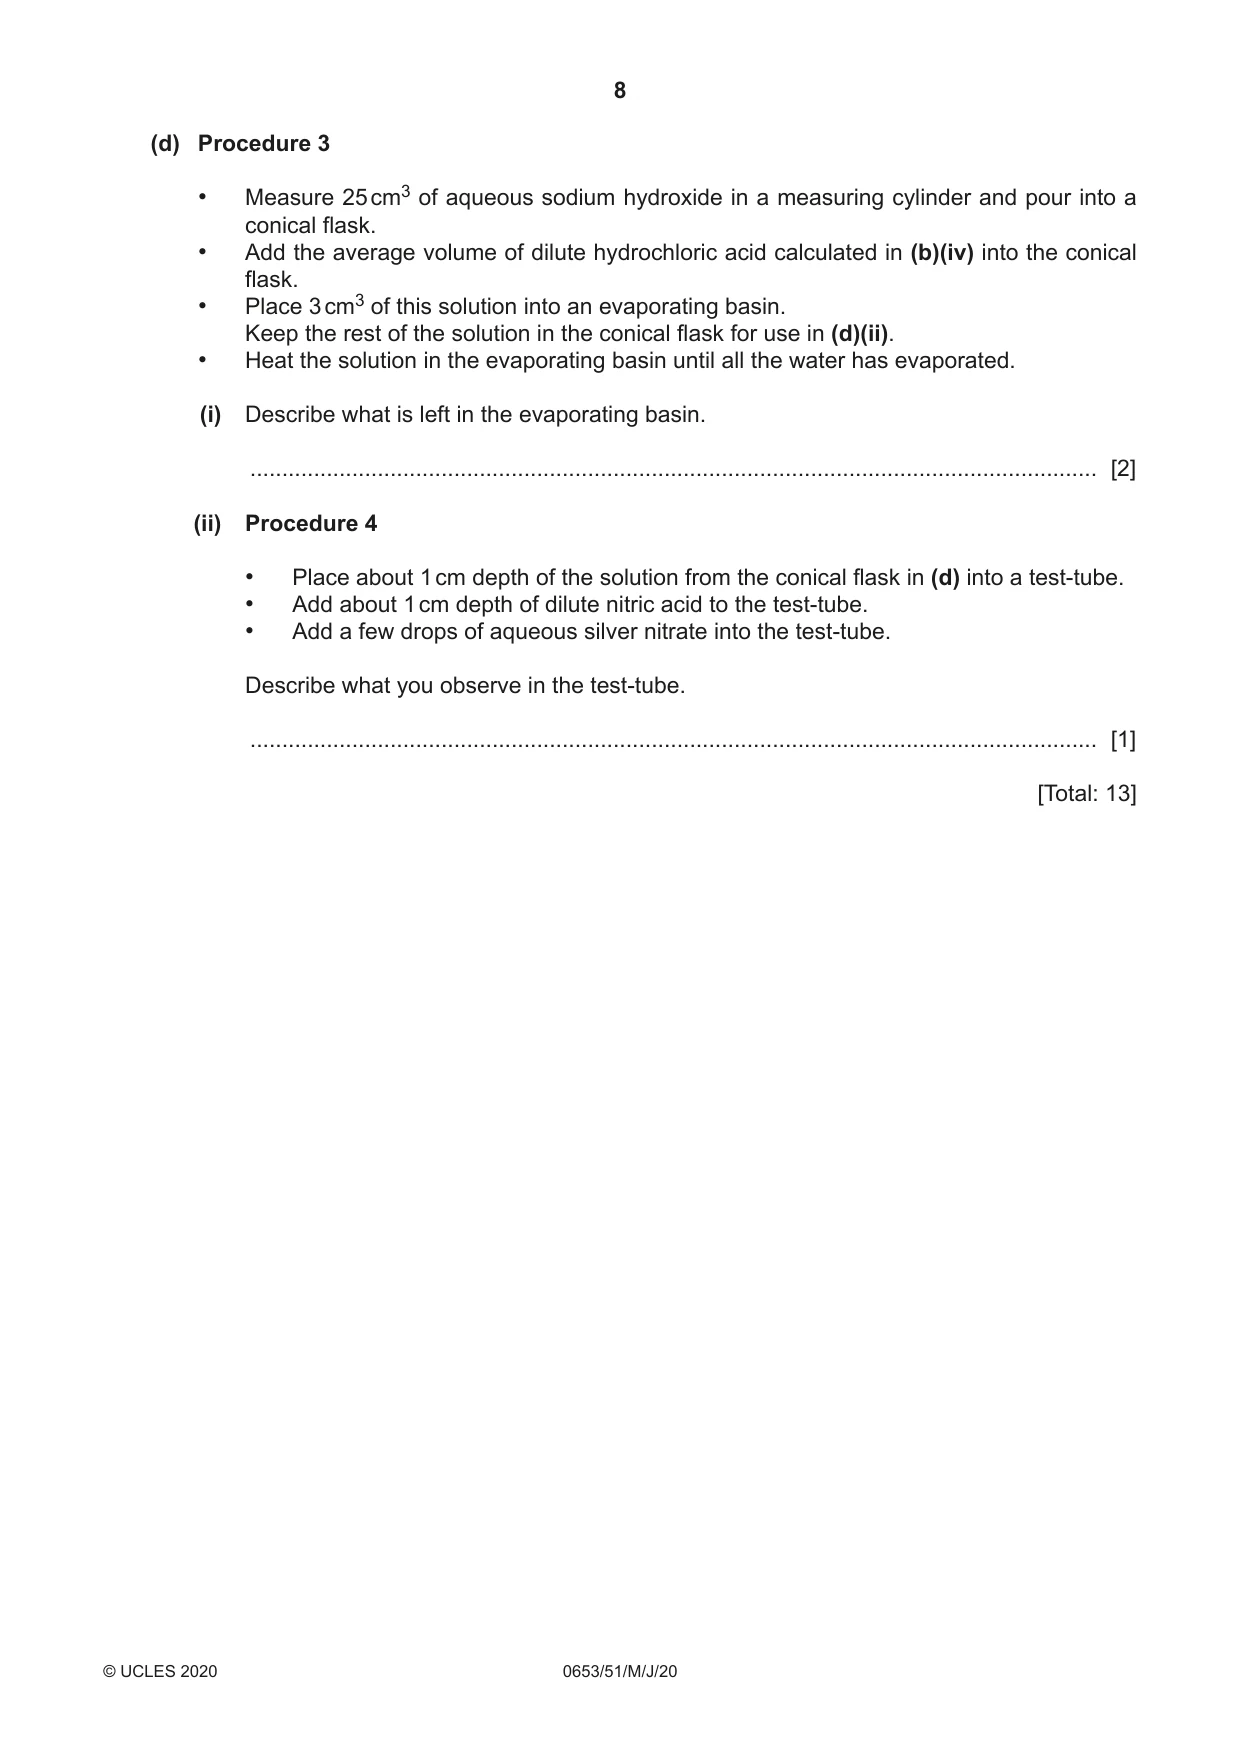
2 You are going to investigate the reaction between aqueous sodium hydroxide and dilute hydrochloric acid. The equation for this reaction is shown. hydrochloric acid + sodium hydroxide sodium chloride + water (a) Procedure 1 • Add 1 cm depth of dilute hydrochloric acid to a clean test-tube. • Add a few drops of MO indicator. • Record the colour in Table 2.1. Repeat procedure 1 with aqueous sodium hydroxide, instead of dilute hydrochloric acid. Repeat procedure 1 with solution A which is neutral, instead of dilute hydrochloric acid. Table 2.1 solution colour in MO indicator hydrochloric acid sodium hydroxide A [1] (b) (i) Procedure 2 • Measure 25 cm3 of aqueous sodium hydroxide in a measuring cylinder and pour it into a conical flask. • Add 5 drops of MO indicator to the aqueous sodium hydroxide. • Fill the burette to exactly 0.0 cm3 with dilute hydrochloric acid. • Add the dilute hydrochloric acid from the burette into the flask slowly until the MO indicator turns orange. This is called the end-point. • Record in Table 2.2 the colour of your solution at the end-point. • Record in Table 2.2 the volume of dilute hydrochloric acid added to the nearest 0.1 cm3. If you added too much acid the solution in the flask turns red but you should still record this volume in Table 2.2. • Wash the conical flask. Repeat procedure 2 two more times. Table 2.2 volume of dilute experiment final colour hydrochloric acid added / cm3 1 2 3 [3] (ii) Name one piece of apparatus for measuring the 25 cm3 of aqueous sodium hydroxide more accurately. ..................................................................................................................................... [1] (iii) You are going to calculate the average volume of dilute hydrochloric acid needed to just react completely with the aqueous sodium hydroxide. Identify from Table 2.2 the volumes you should use to calculate the average volume of dilute hydrochloric acid and explain your choice. volumes ............................................................................................................................. explanation ........................................................................................................................ [1] (iv) Use the volumes in (b)(iii) to calculate the average volume of dilute hydrochloric acid used. average volume = .................................................. cm3 [1] (v) Predict the volume of dilute hydrochloric acid needed to just react completely with 75 cm3 of the same aqueous sodium hydroxide. ..................................................................................................................................... [1] (c) Dilute hydrochloric acid and aqueous sodium hydroxide react in a 1:1 ratio. (i) Suggest whether the dilute hydrochloric acid or the aqueous sodium hydroxide is more concentrated. Explain your answer. more concentrated solution ............................................................................................... explanation ........................................................................................................................ ........................................................................................................................................... [1] (ii) Calculate how many times more concentrated the solution you chose in (c)(i) is than the other solution. = ................ times more concentrated [1] (d) Procedure 3 • Measure 25 cm3 of aqueous sodium hydroxide in a measuring cylinder and pour into a conical flask. • Add the average volume of dilute hydrochloric acid calculated in (b)(iv) into the conical flask. • Place 3 cm3 of this solution into an evaporating basin. Keep the rest of the solution in the conical flask for use in (d)(ii). • Heat the solution in the evaporating basin until all the water has evaporated. (i) Describe what is left in the evaporating basin. ..................................................................................................................................... [2] (ii) Procedure 4 • Place about 1 cm depth of the solution from the conical flask in (d) into a test-tube. • Add about 1 cm depth of dilute nitric acid to the test-tube. • Add a few drops of aqueous silver nitrate into the test-tube. Describe what you observe in the test-tube. ..................................................................................................................................... [1] [Total: 13]
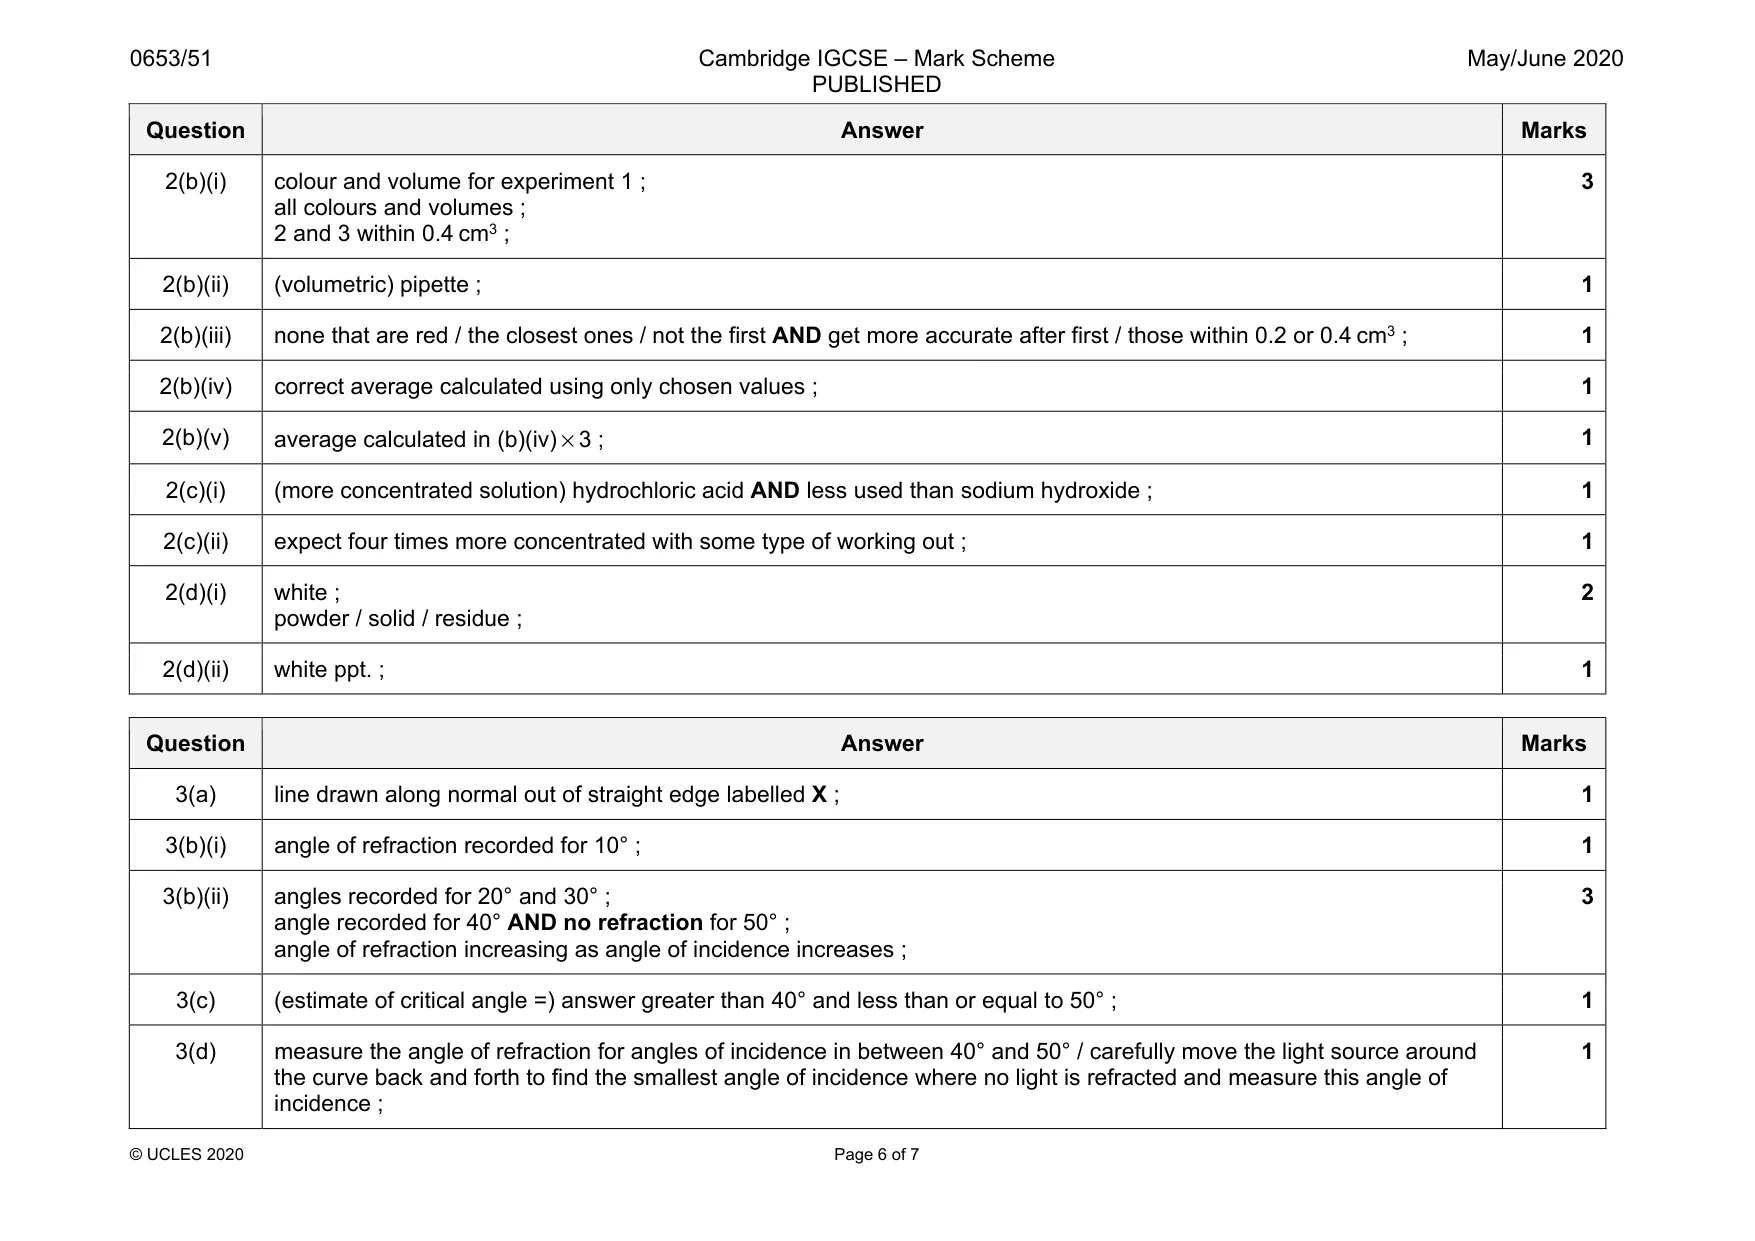
Mark scheme: 2(a) (hydrochloric acid) red AND (sodium hydroxide) yellow AND (A) orange ; Question Answer Marks 2(b)(i) colour and volume for experiment 1 ; all colours and volumes ; 2 and 3 within 0.4 cm3 ; 3 2(b)(ii) (volumetric) pipette ; 1 2(b)(iii) none that are red / the closest ones / not the first AND get more accurate after first / those within 0.2 or 0.4 cm3 ; 1 2(b)(iv) correct average calculated using only chosen values ; 1 2(b)(v) average calculated in (b)(iv) × 3 ; 1 2(c)(i) (more concentrated solution) hydrochloric acid AND less used than sodium hydroxide ; 1 2(c)(ii) expect four times more concentrated with some type of working out ; 1 2(d)(i) white ; powder / solid / residue ; 2 2(d)(ii) white ppt. ; 1
Q3 · You are going to investigate a ray of light travelling from glass into air
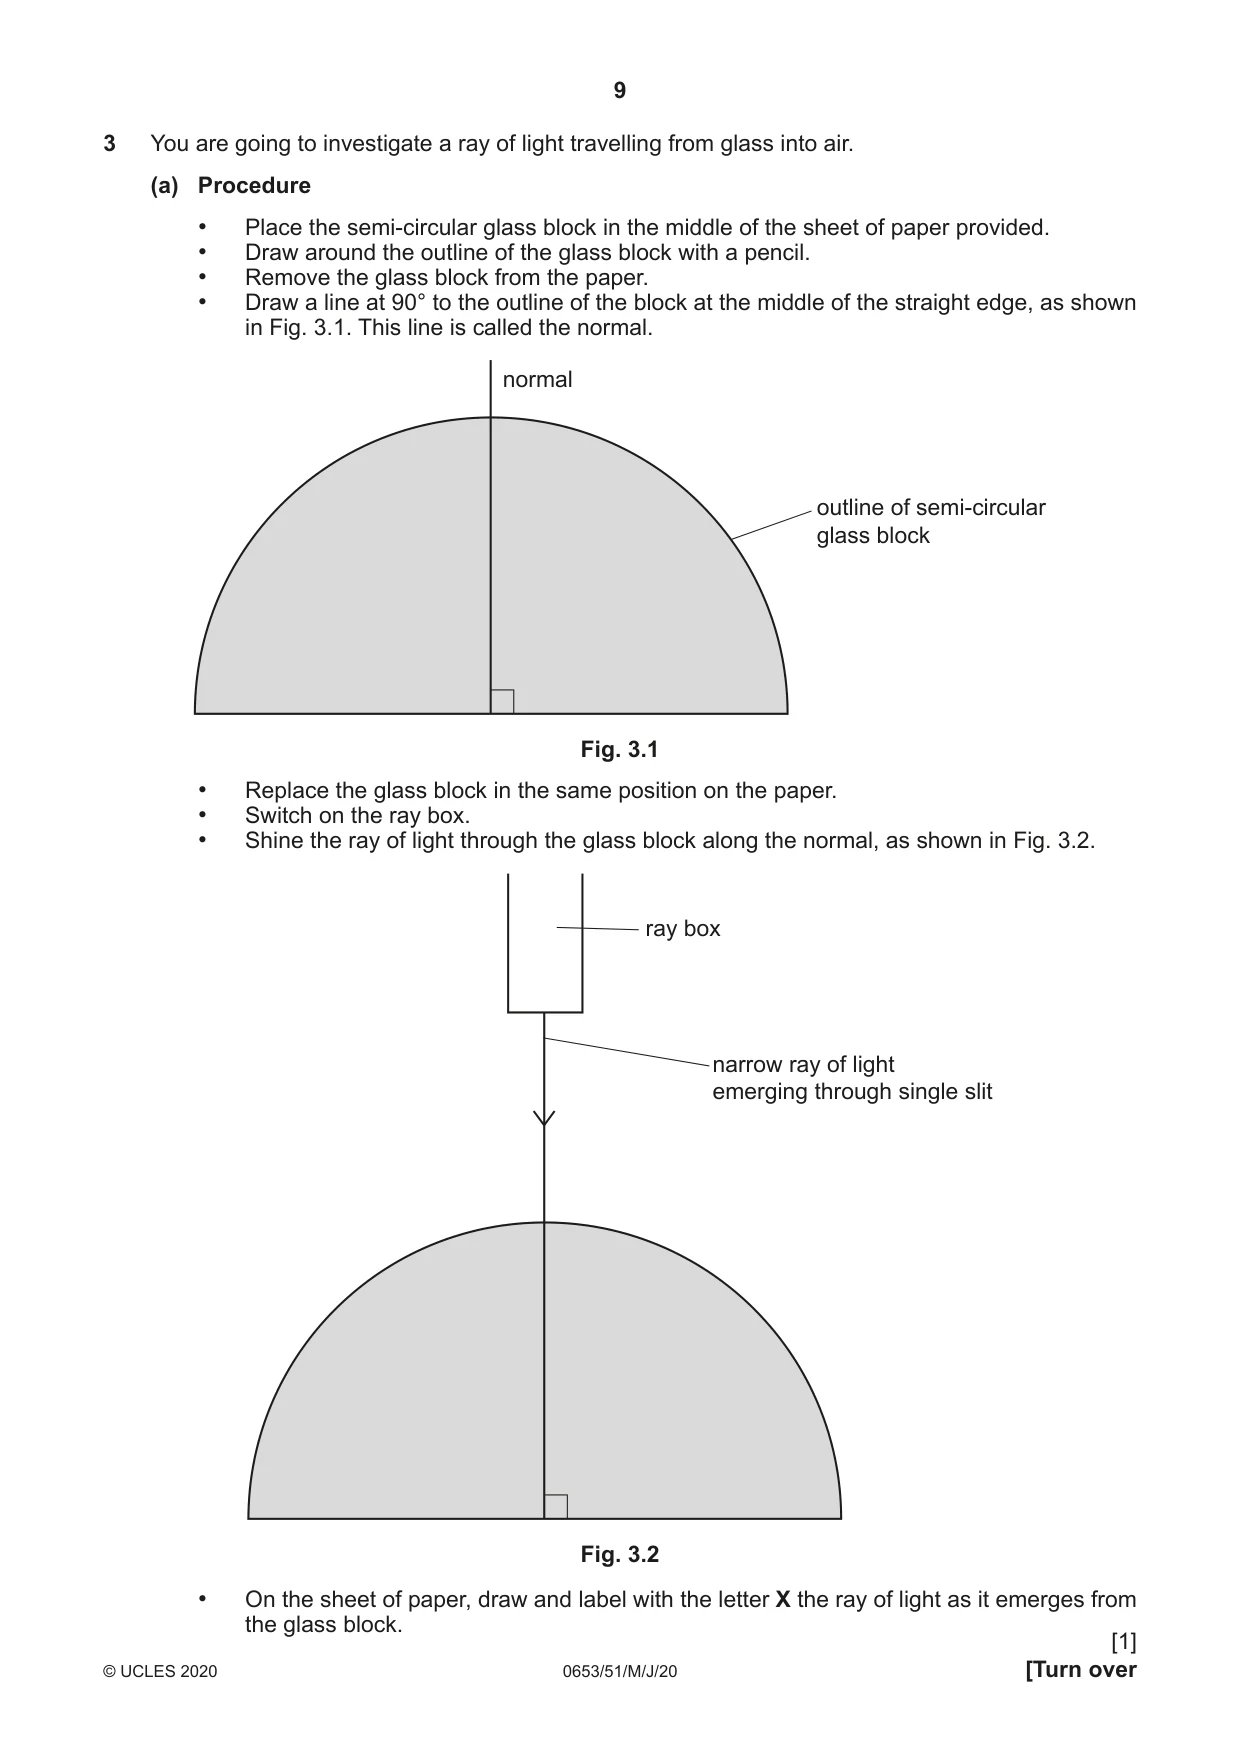
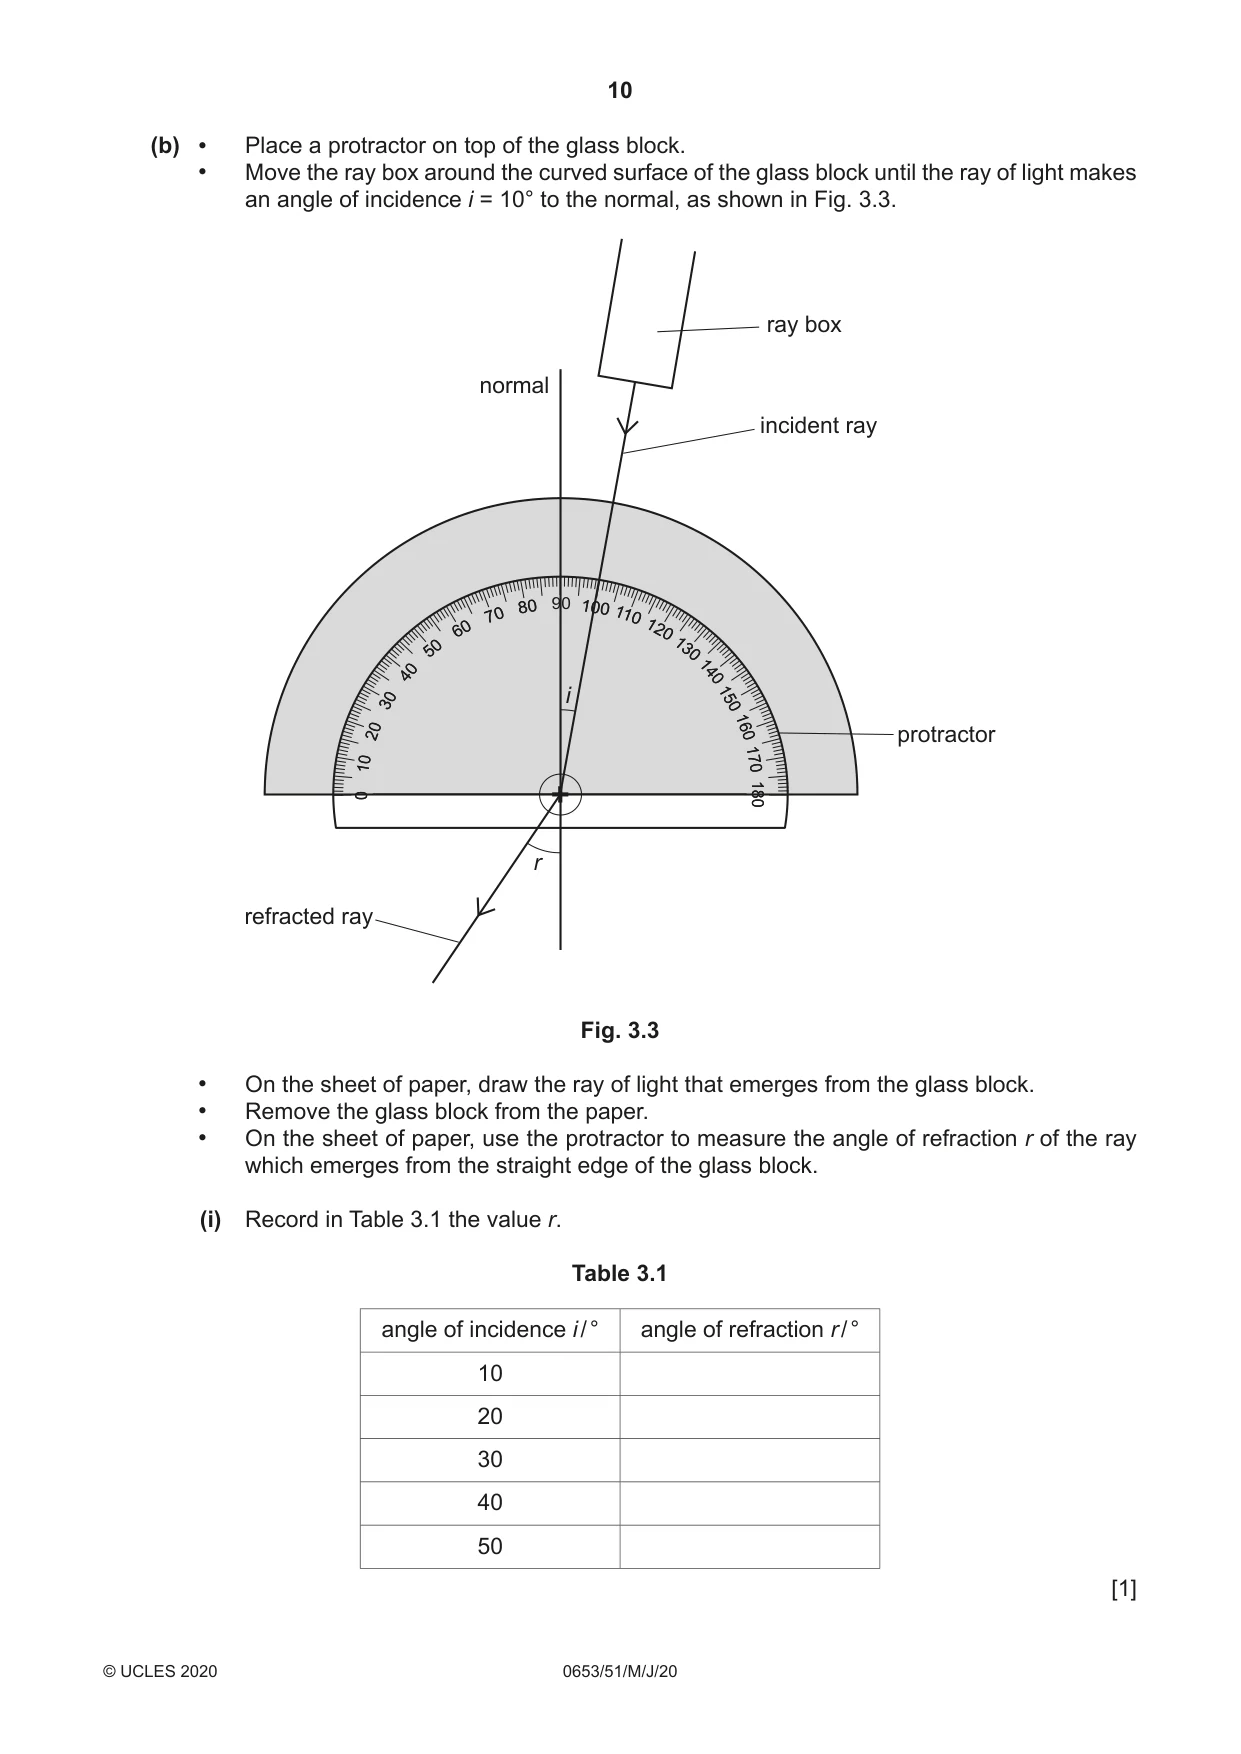
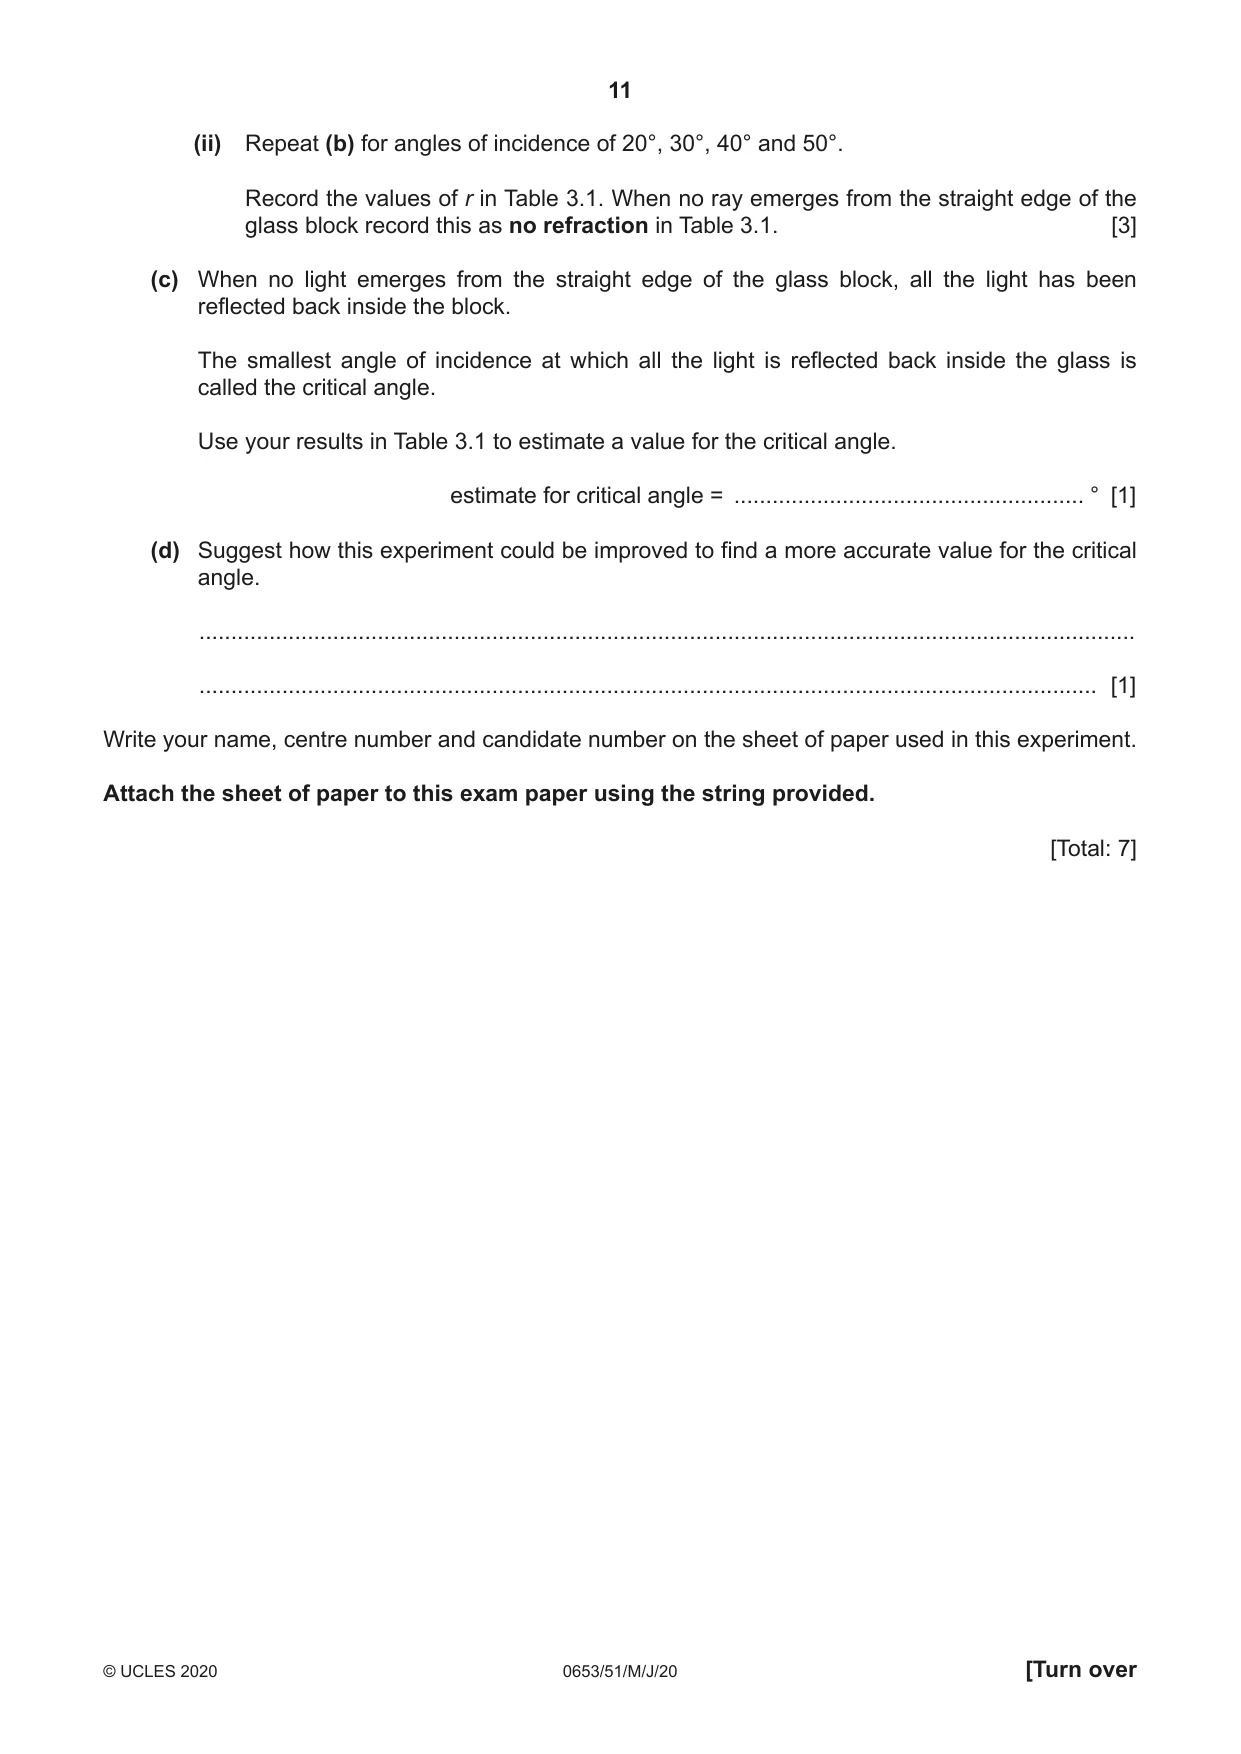
3 You are going to investigate a ray of light travelling from glass into air. (a) Procedure • Place the semi-circular glass block in the middle of the sheet of paper provided. • Draw around the outline of the glass block with a pencil. • Remove the glass block from the paper. • Draw a line at 90° to the outline of the block at the middle of the straight edge, as shown in Fig. 3.1. This line is called the normal. normal outline of semi-circular glass block Fig. 3.1 • Replace the glass block in the same position on the paper. • Switch on the ray box. • Shine the ray of light through the glass block along the normal, as shown in Fig. 3.2. ray box narrow ray of light emerging through single slit Fig. 3.2 • On the sheet of paper, draw and label with the letter X the ray of light as it emerges from the glass block. [1] (b) • Place a protractor on top of the glass block. • Move the ray box around the curved surface of the glass block until the ray of light makes an angle of incidence i = 10° to the normal, as shown in Fig. 3.3. ray box normal incident ray 8080 90 100100 7070 110110 6060 120120 5050 130130 4040 140140 3030 i 150150 2020 160160 protractor 1010 170170 0 180180 r refracted ray Fig. 3.3 • On the sheet of paper, draw the ray of light that emerges from the glass block. • Remove the glass block from the paper. • On the sheet of paper, use the protractor to measure the angle of refraction r of the ray which emerges from the straight edge of the glass block. (i) Record in Table 3.1 the value r. Table 3.1 angle of incidence i / ° angle of refraction r / ° 10 20 30 40 50 [1] (ii) Repeat (b) for angles of incidence of 20°, 30°, 40° and 50°. Record the values of r in Table 3.1. When no ray emerges from the straight edge of the glass block record this as no refraction in Table 3.1. [3] (c) When no light emerges from the straight edge of the glass block, all the light has been reflected back inside the block. The smallest angle of incidence at which all the light is reflected back inside the glass is called the critical angle. Use your results in Table 3.1 to estimate a value for the critical angle. estimate for critical angle = ....................................................... ° [1] (d) Suggest how this experiment could be improved to find a more accurate value for the critical angle. ................................................................................................................................................... ............................................................................................................................................. [1] Write your name, centre number and candidate number on the sheet of paper used in this experiment. Attach the sheet of paper to this exam paper using the string provided. [Total: 7]
Mark scheme: 3(a) line drawn along normal out of straight edge labelled X ; 1 3(b)(i) angle of refraction recorded for 10° ; 1 3(b)(ii) angles recorded for 20° and 30° ; angle recorded for 40° AND no refraction for 50° ; angle of refraction increasing as angle of incidence increases ; 3 3(c) (estimate of critical angle =) answer greater than 40° and less than or equal to 50° ; 1 3(d) measure the angle of refraction for angles of incidence in between 40° and 50° / carefully move the light source around the curve back and forth to find the smallest angle of incidence where no light is refracted and measure this angle of incidence ; 1
Q4 · A student suggests that water waves will travel at different speeds in different depths…
4 A student suggests that water waves will travel at different speeds in different depths of water. Plan an investigation to find out how the speed of water waves varies with the depth of water they are travelling in. You are provided with: • a tank of length 50 cm × width 20 cm × depth 20 cm • a supply of water • a piece of wood that fits the width of the tank and can be dipped into the water to make water waves • any other common laboratory apparatus that you need for the investigation. You are not required to carry out this investigation. In your plan, include: • any additional apparatus • a brief description of the method (you may include a labelled diagram if you wish) • the values for any variables you will change • the variables you will control • the measurements you will make • how you will process your results to draw a conclusion. .......................................................................................................................................................... .......................................................................................................................................................... .......................................................................................................................................................... .......................................................................................................................................................... .......................................................................................................................................................... .......................................................................................................................................................... .......................................................................................................................................................... .......................................................................................................................................................... .......................................................................................................................................................... .......................................................................................................................................................... .......................................................................................................................................................... .......................................................................................................................................................... .................................................................................................................................................... [7]
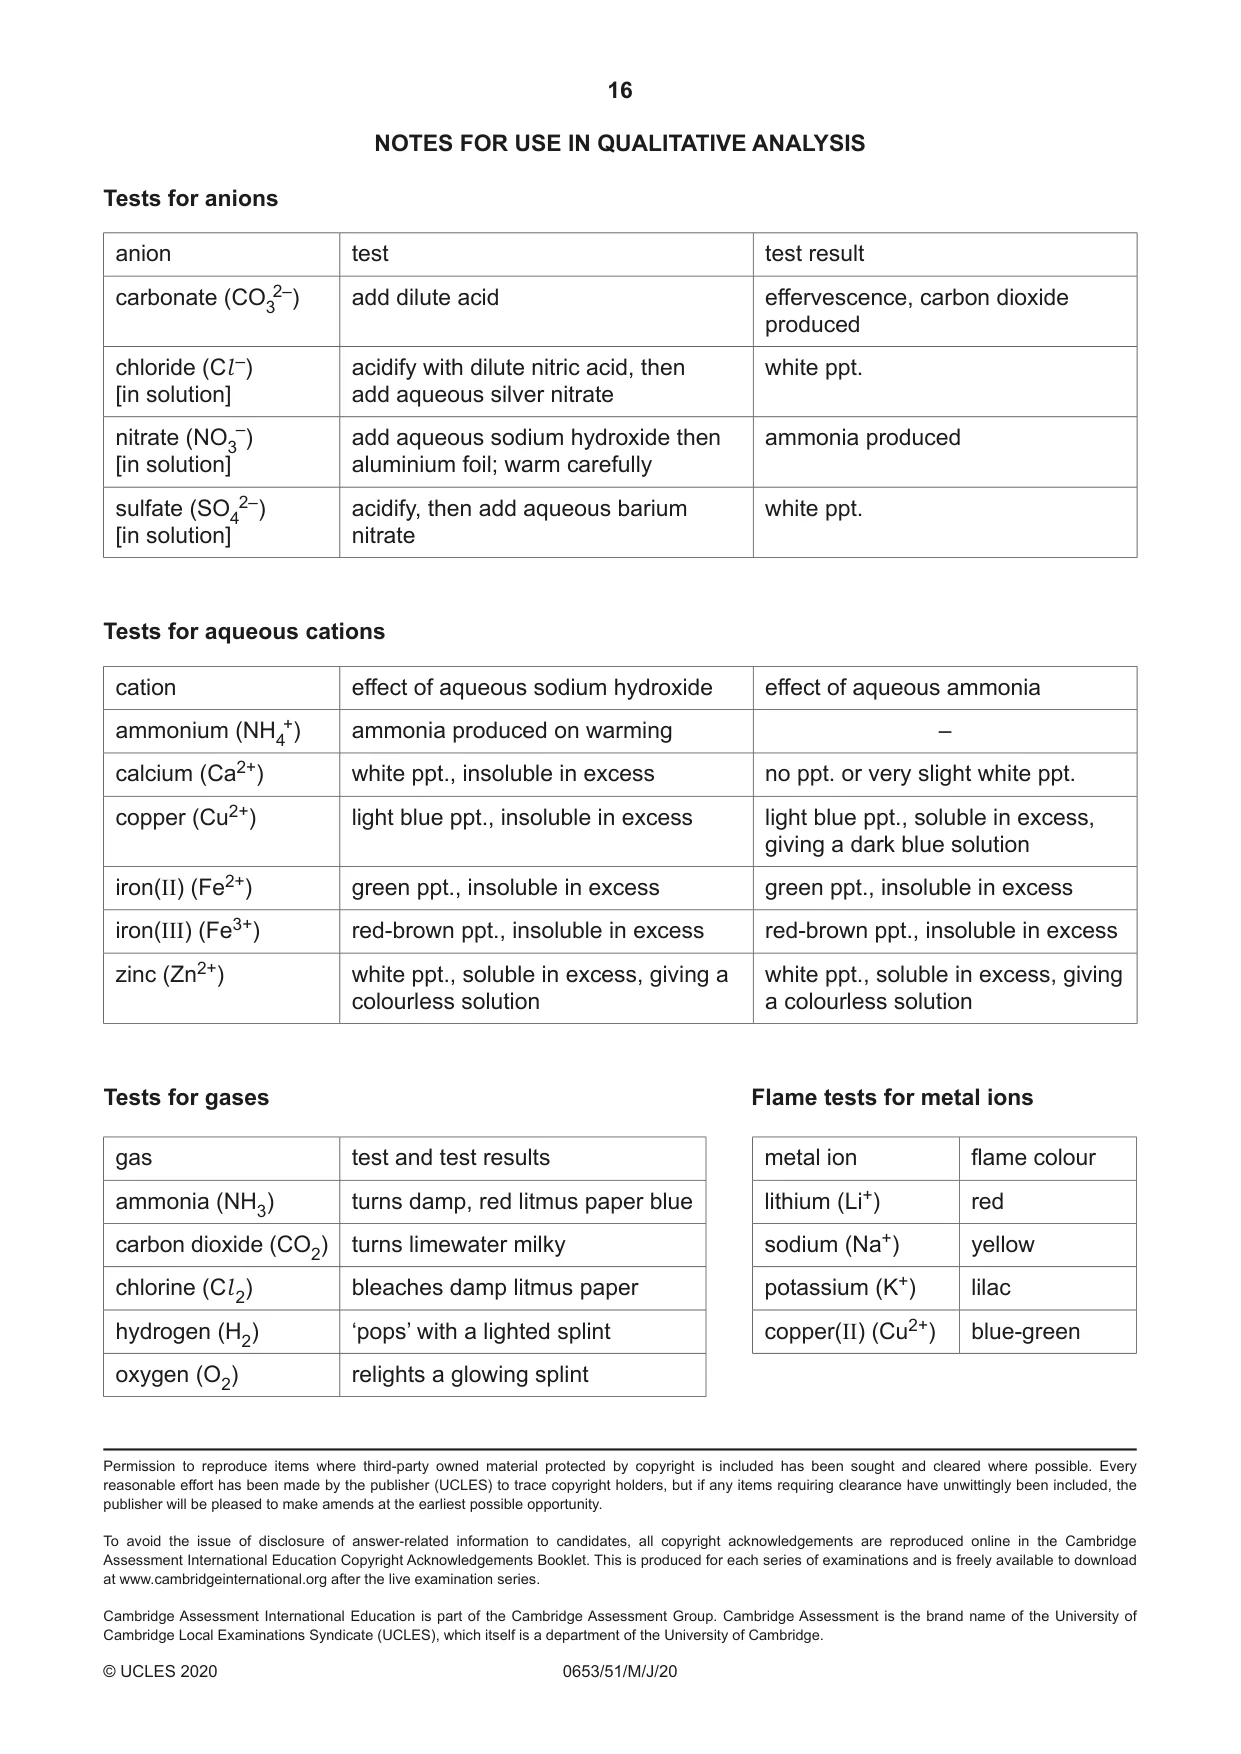
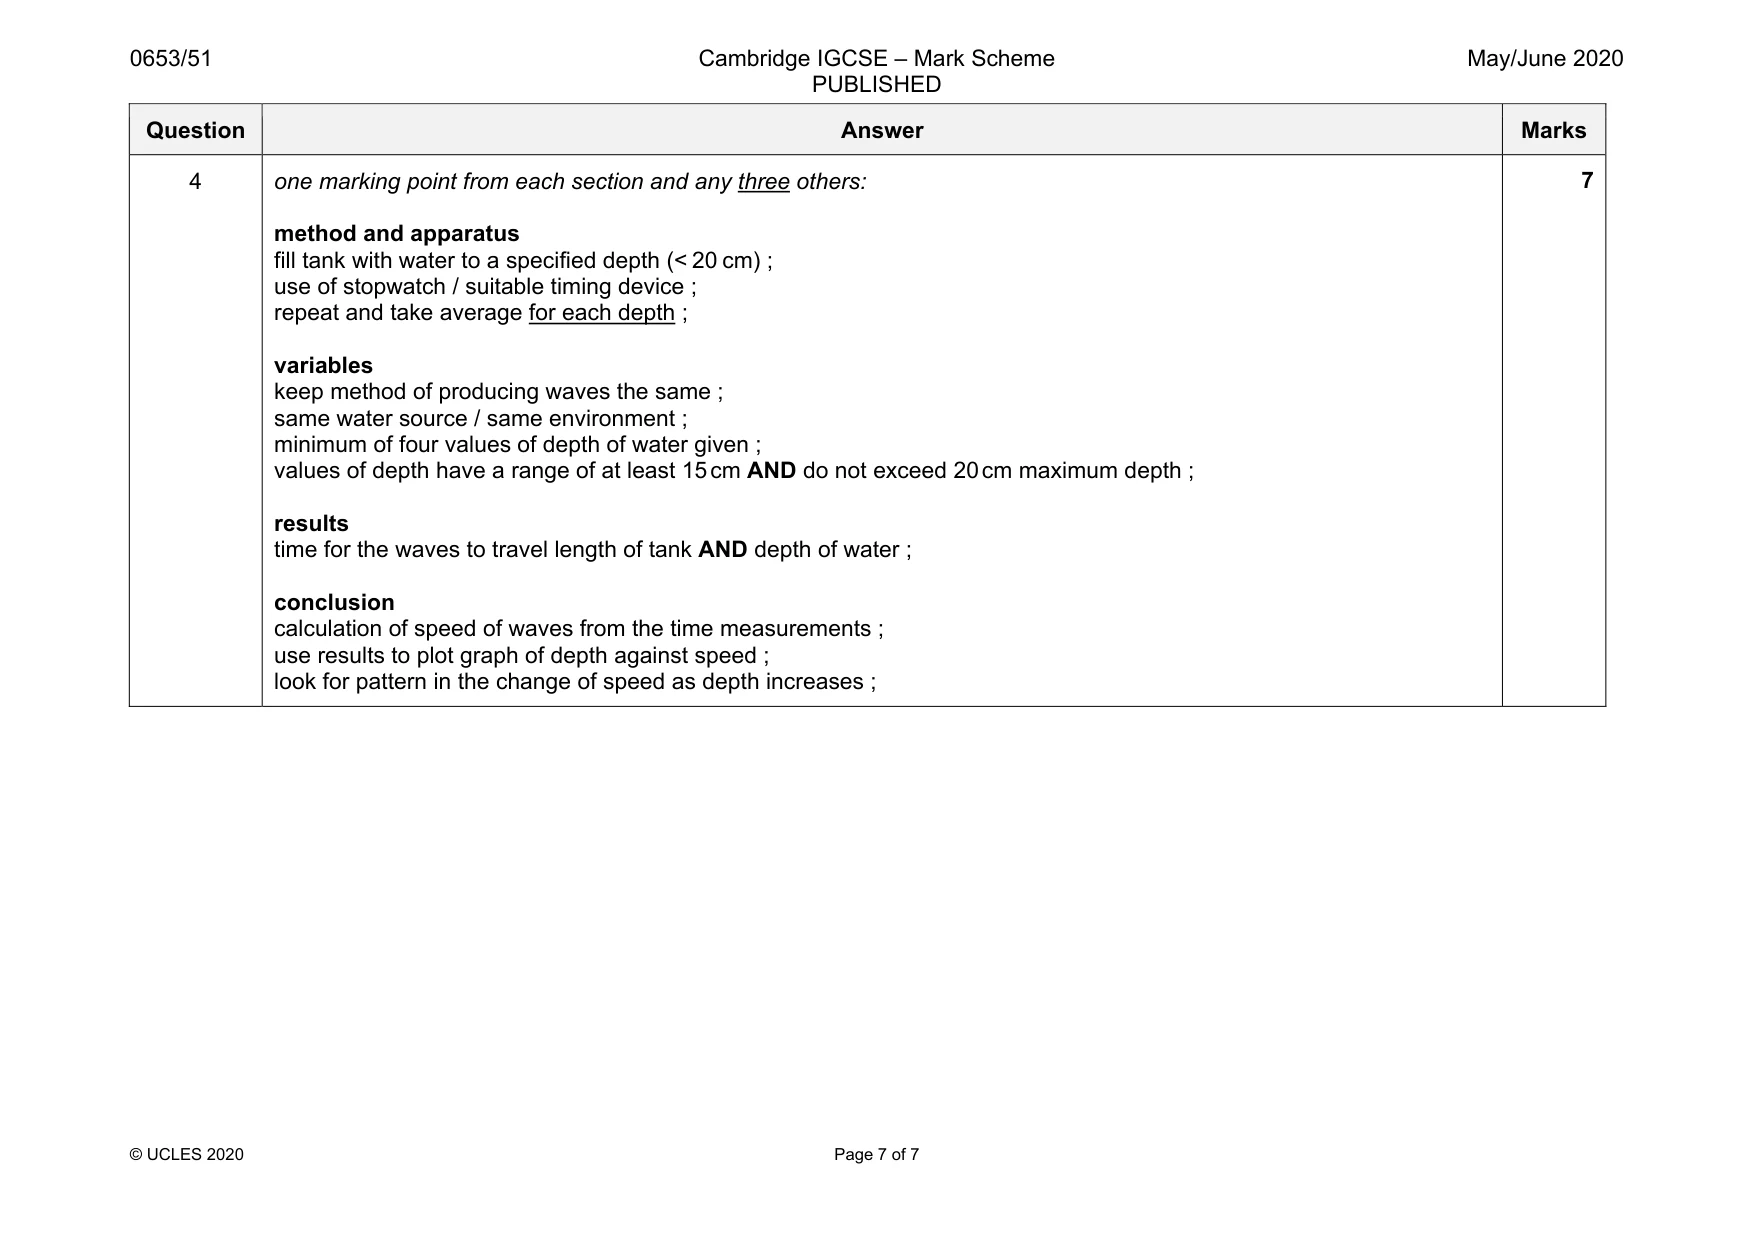
Mark scheme: 4 one marking point from each section and any three others: method and apparatus fill tank with water to a specified depth (< 20 cm) ; use of stopwatch / suitable timing device ; repeat and take average for each depth ; variables keep method of producing waves the same ; same water source / same environment ; minimum of four values of depth of water given ; values of depth have a range of at least 15 cm AND do not exceed 20 cm maximum depth ; results time for the waves to travel length of tank AND depth of water ; conclusion calculation of speed of waves from the time measurements ; use results to plot graph of depth against speed ; look for pattern in the change of speed as depth increases ;
What was in this paper
The subtopics covered by these 4 questions, and how many questions each got. Open one in a new tab to see every Cambridge question on it.