Cambridge IGCSE Science - Combined 0653 — 2020 Feb/March Paper 6 · Variant 2
0653/62/F/M/20 · 4 questions · 40 marks · ≈45 min
The question paper and its mark scheme, free to read here and free to download. This is Cambridge’s own paper, exactly as it was sat.
Question paper12 pages


Mark scheme8 pages
Answers below. Sit the paper first if you are practising.
Questions as text
Q1 · A student investigates the differences between two types of bean, A and B
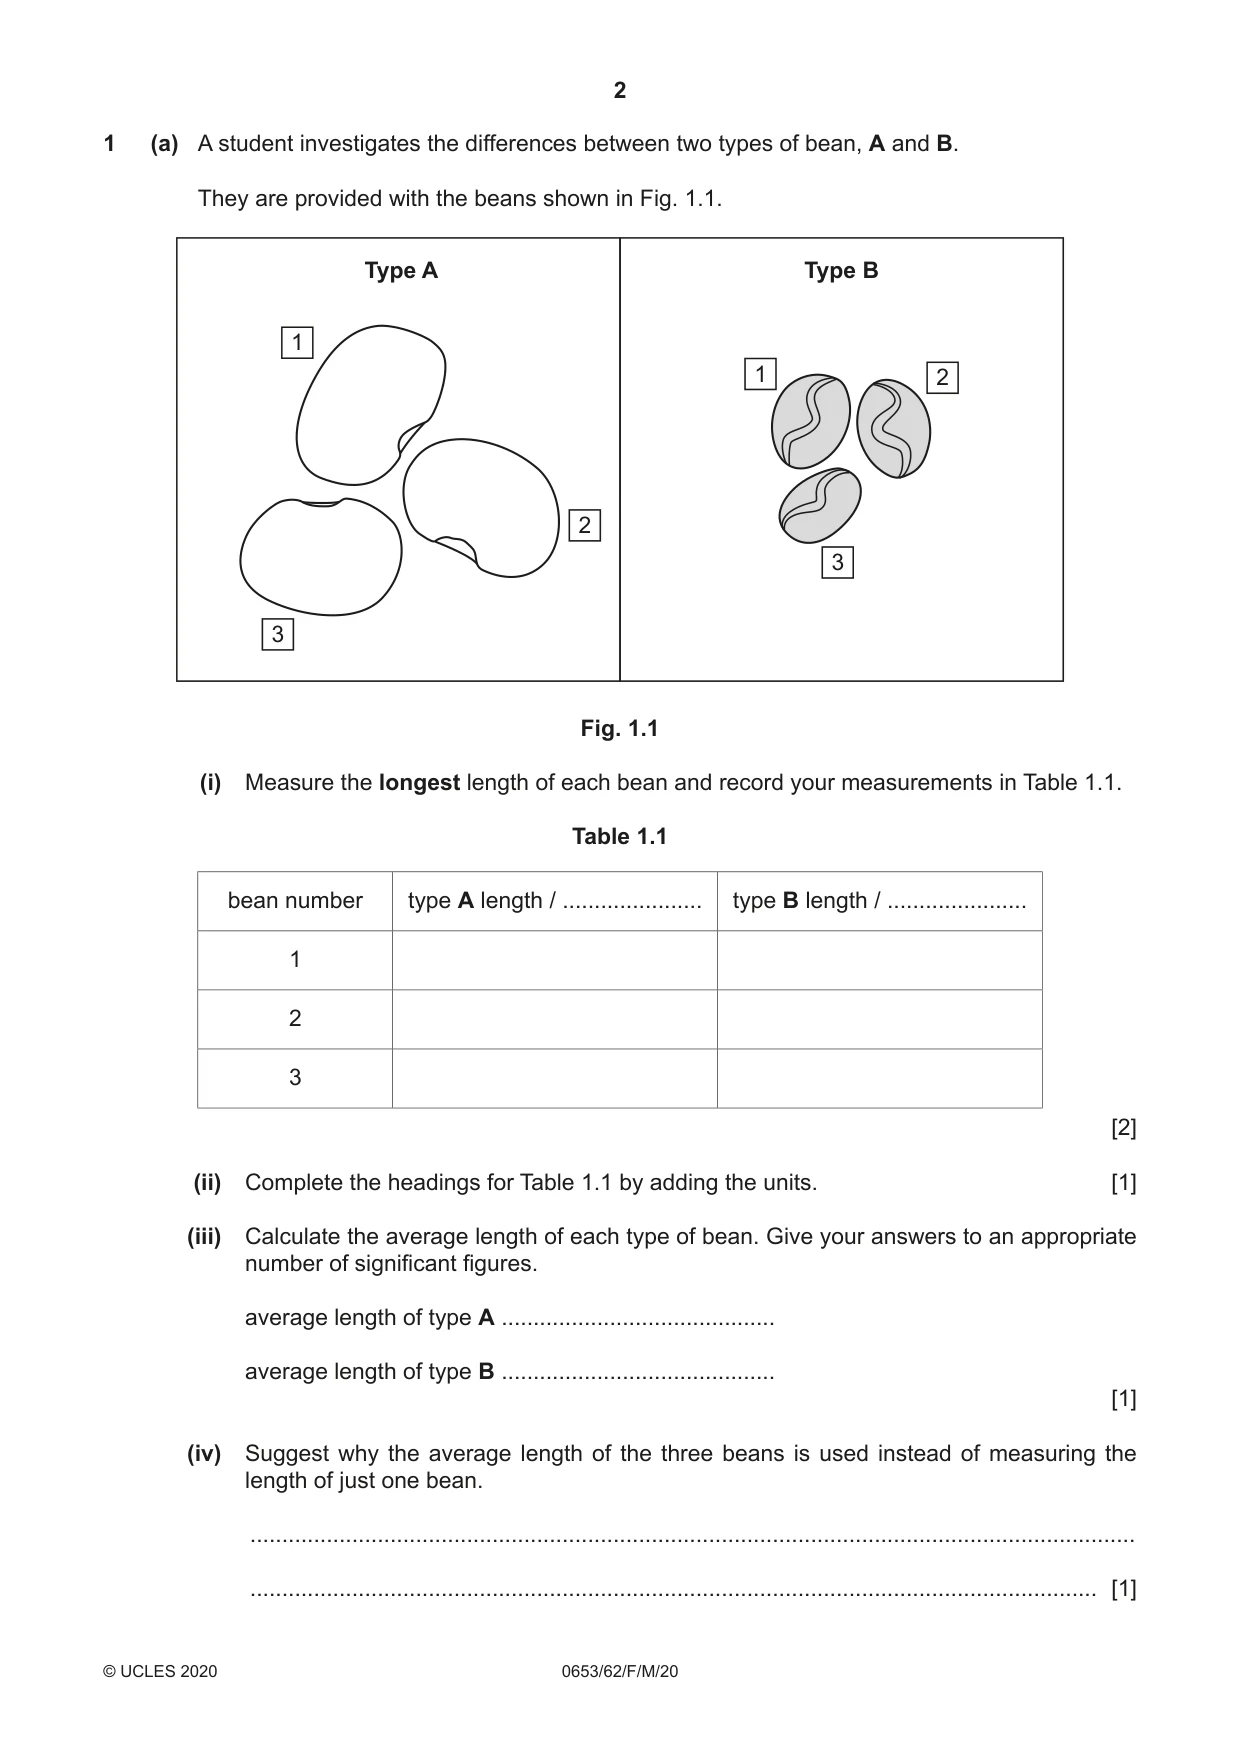
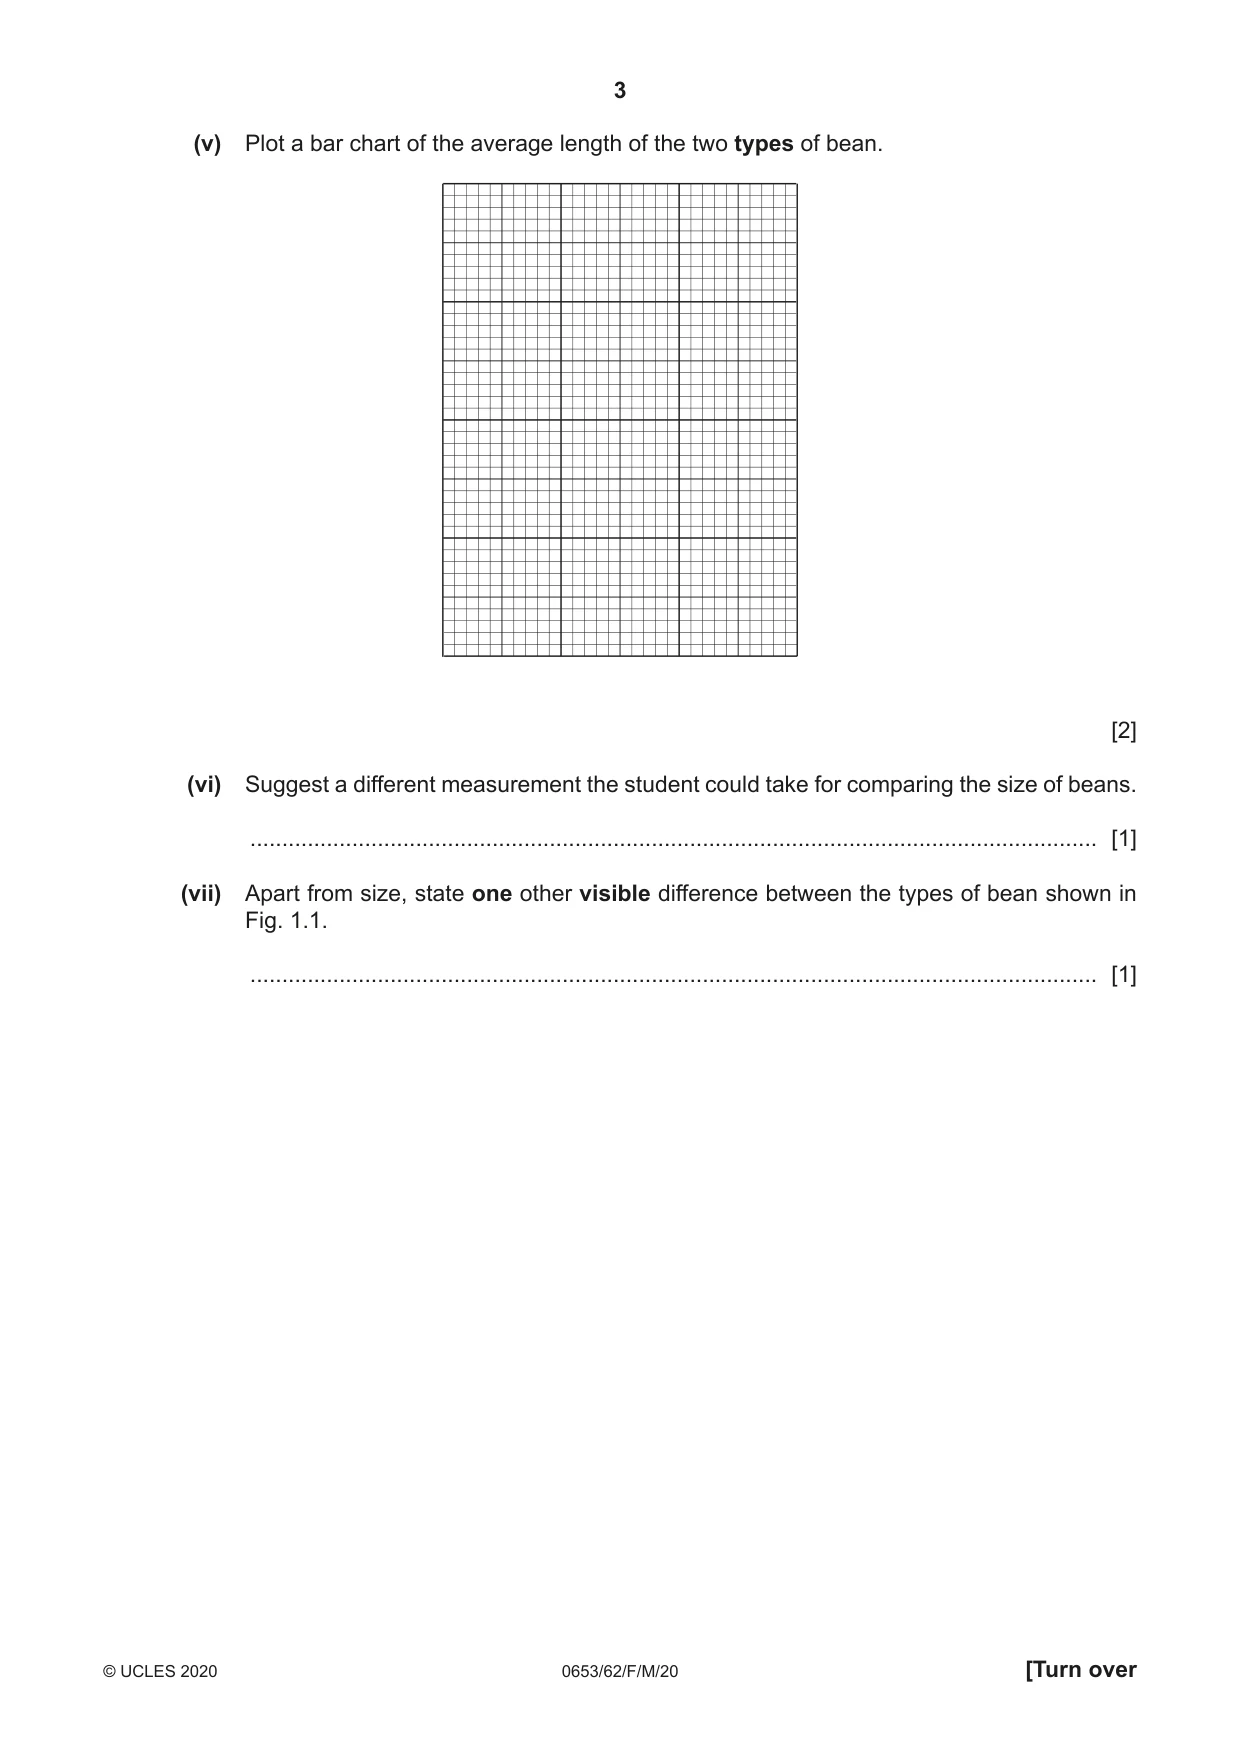
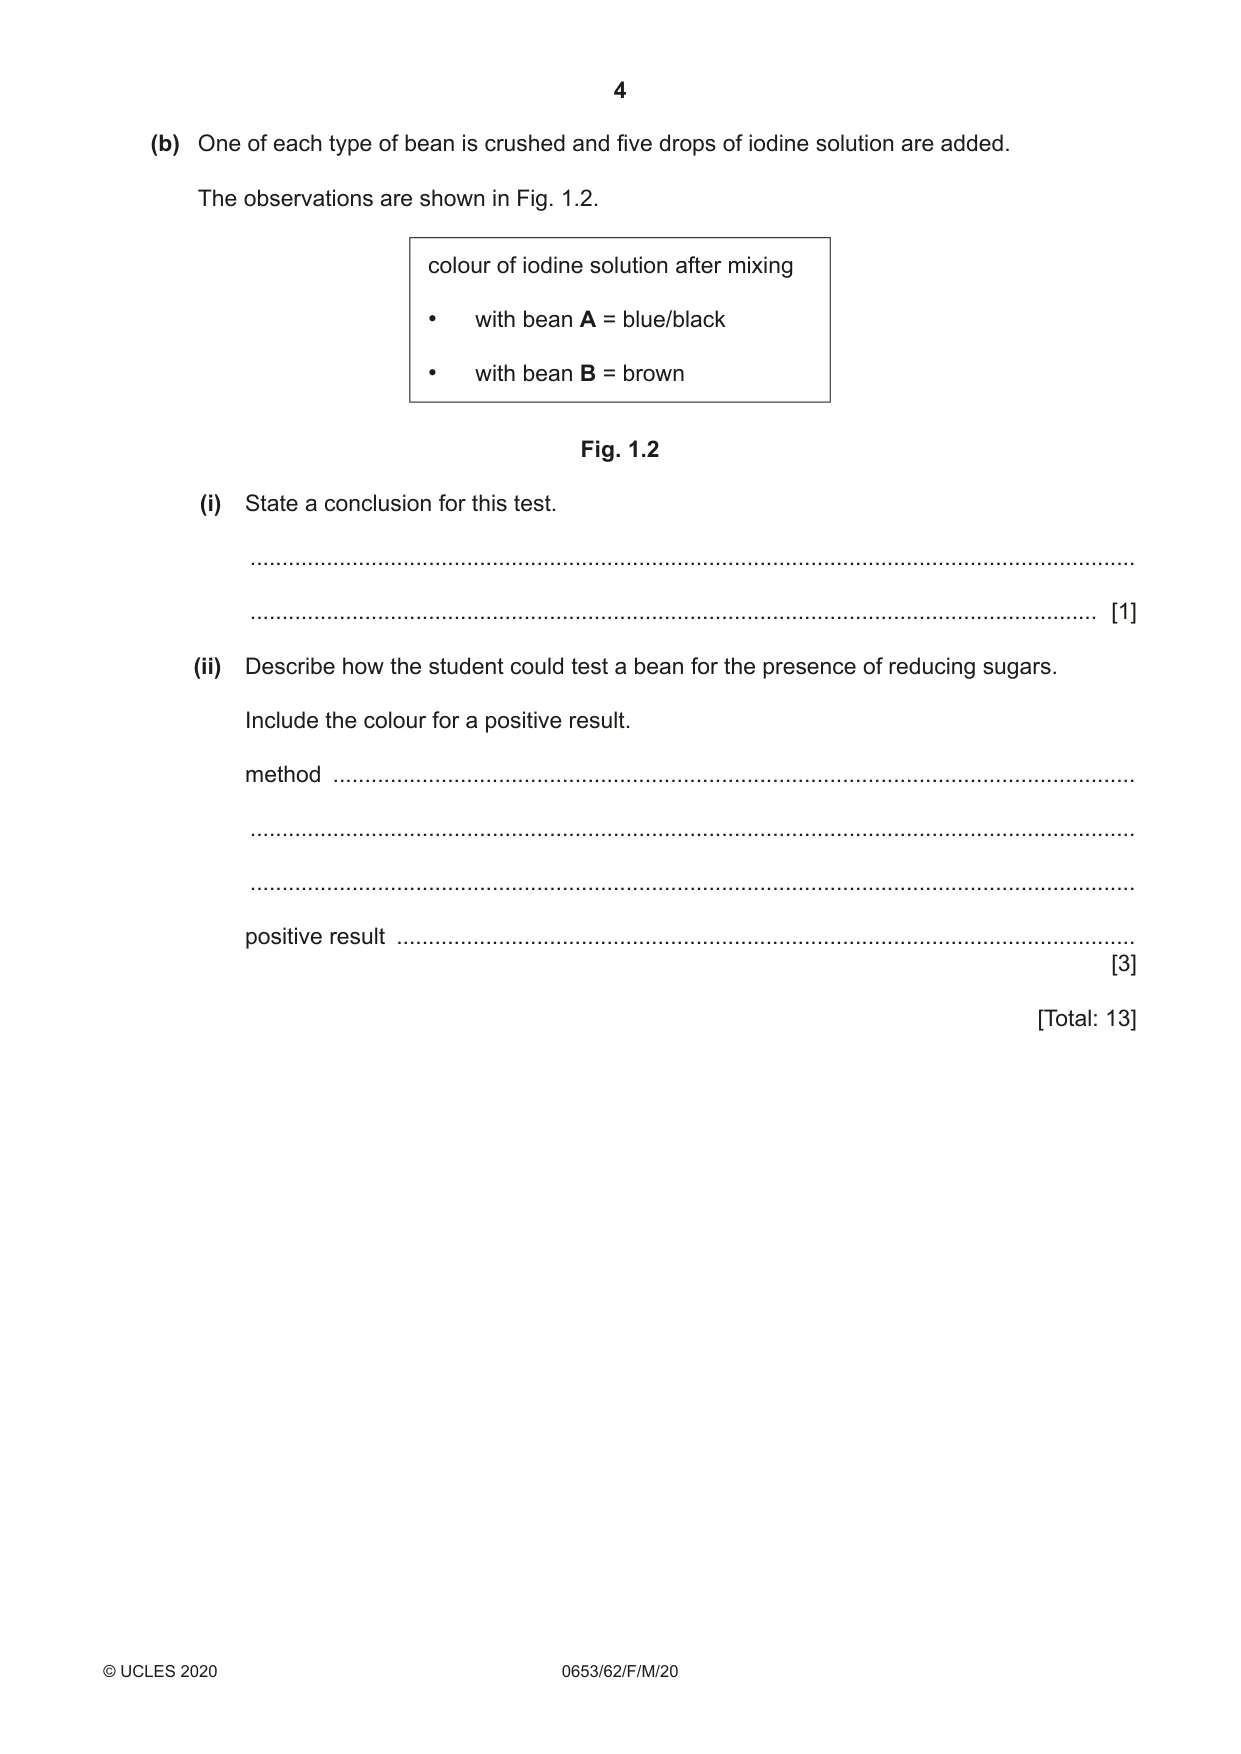
1 (a) A student investigates the differences between two types of bean, A and B. They are provided with the beans shown in Fig. 1.1. Type A Type B 1 1 2 2 3 3 Fig. 1.1 (i) Measure the longest length of each bean and record your measurements in Table 1.1. Table 1.1 bean number type A length / ...................... type B length / ...................... 1 2 3 [2] (ii) Complete the headings for Table 1.1 by adding the units. [1] (iii) Calculate the average length of each type of bean. Give your answers to an appropriate number of significant figures. average length of type A ........................................... average length of type B ........................................... [1] (iv) Suggest why the average length of the three beans is used instead of measuring the length of just one bean. ........................................................................................................................................... ..................................................................................................................................... [1] (v) Plot a bar chart of the average length of the two types of bean. [2] (vi) Suggest a different measurement the student could take for comparing the size of beans. ..................................................................................................................................... [1] (vii) Apart from size, state one other visible difference between the types of bean shown in Fig. 1.1. ..................................................................................................................................... [1] (b) One of each type of bean is crushed and five drops of iodine solution are added. The observations are shown in Fig. 1.2. colour of iodine solution after mixing • with bean A = blue/black • with bean B = brown Fig. 1.2 (i) State a conclusion for this test. ........................................................................................................................................... ..................................................................................................................................... [1] (ii) Describe how the student could test a bean for the presence of reducing sugars. Include the colour for a positive result. method .............................................................................................................................. ........................................................................................................................................... ........................................................................................................................................... positive result .................................................................................................................... [3] [Total: 13]
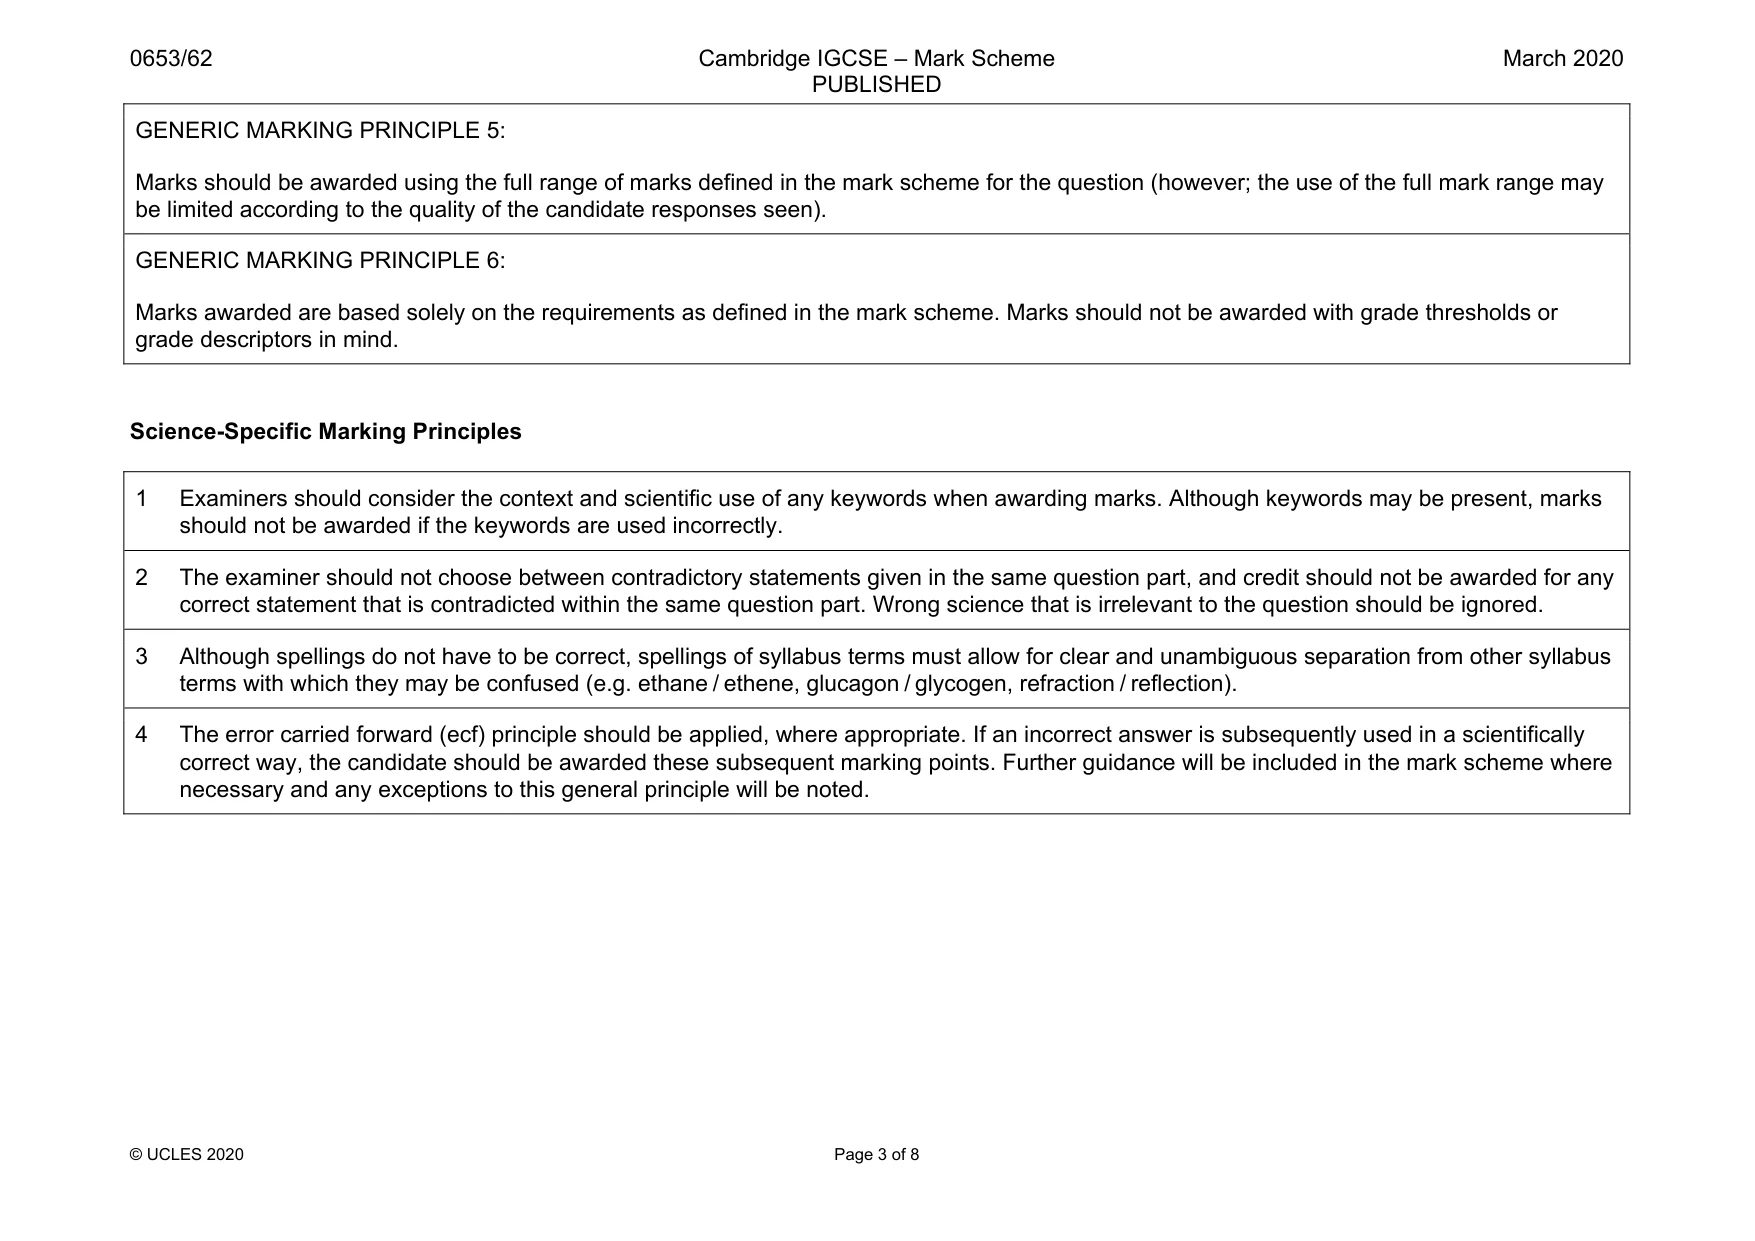
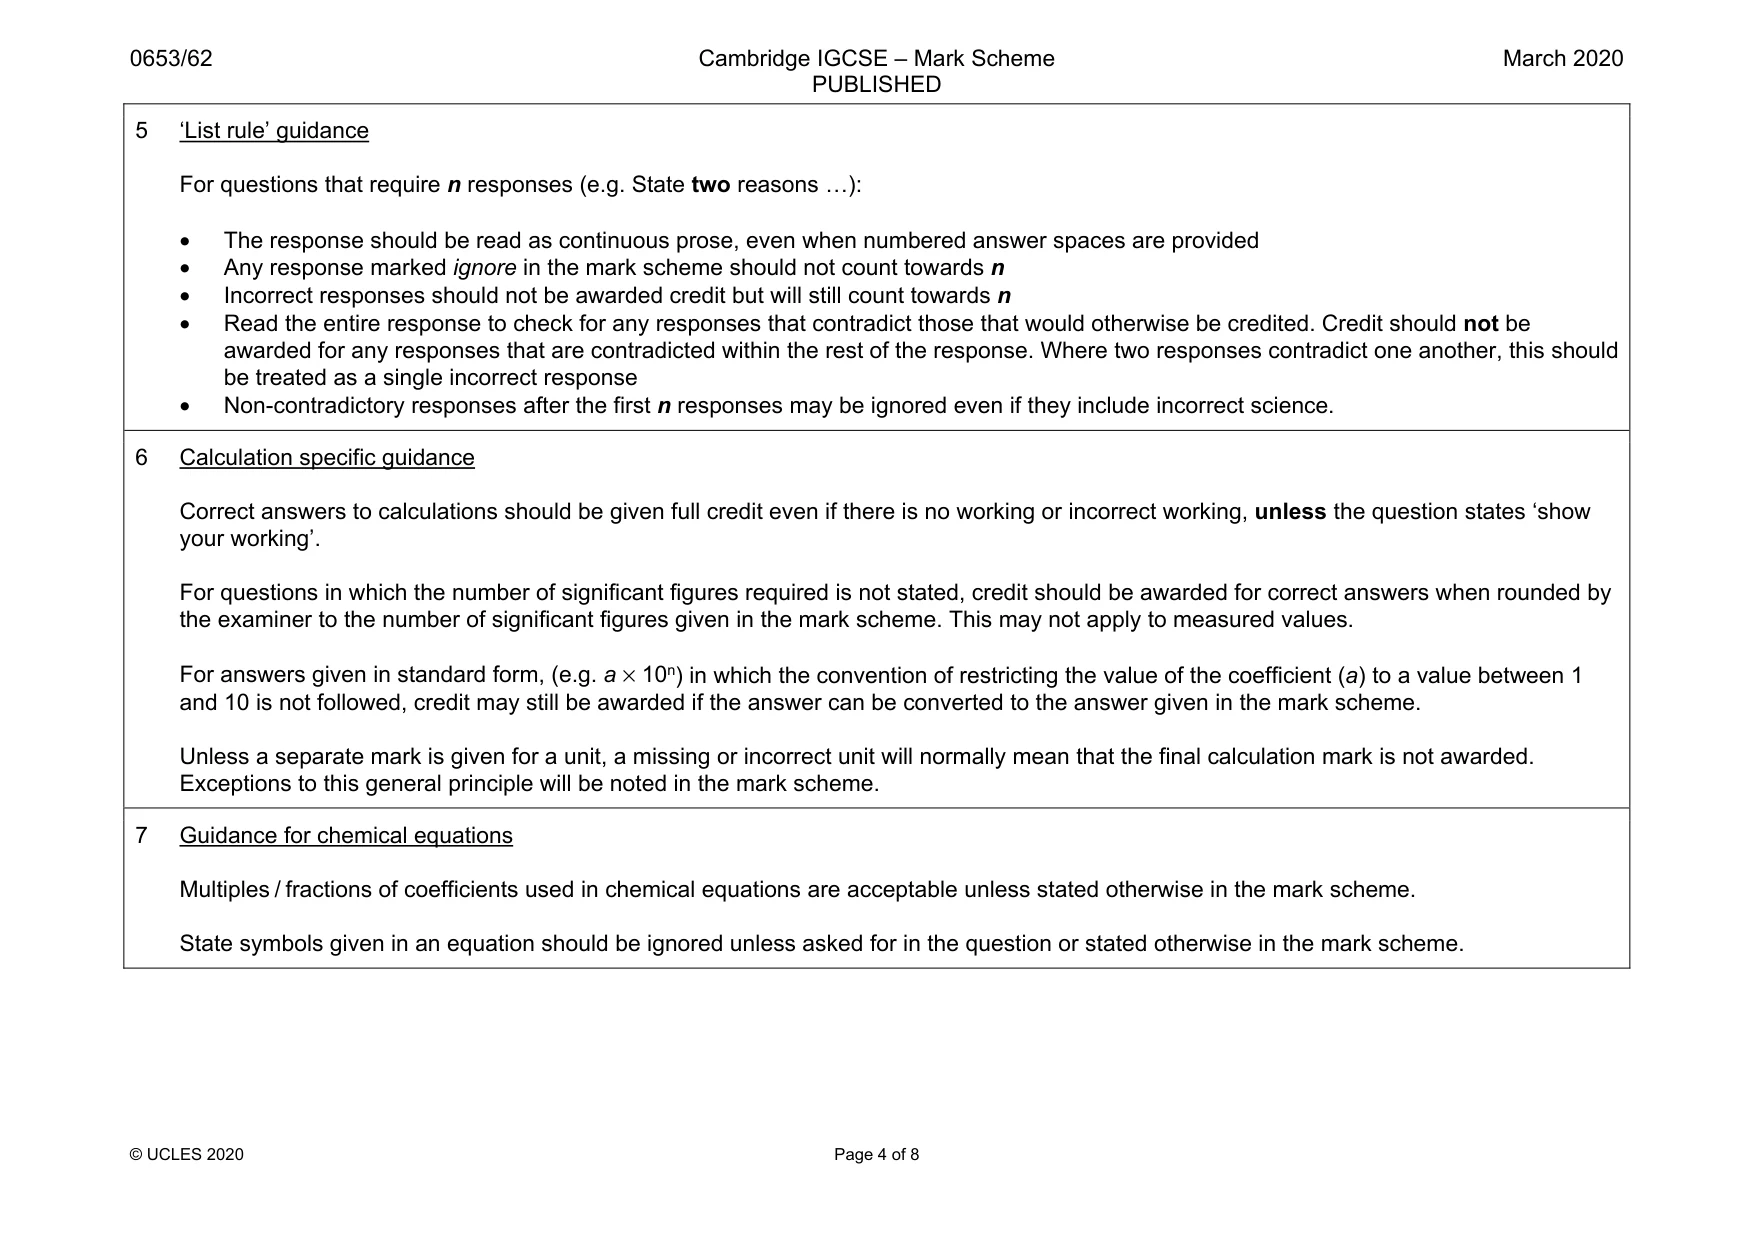
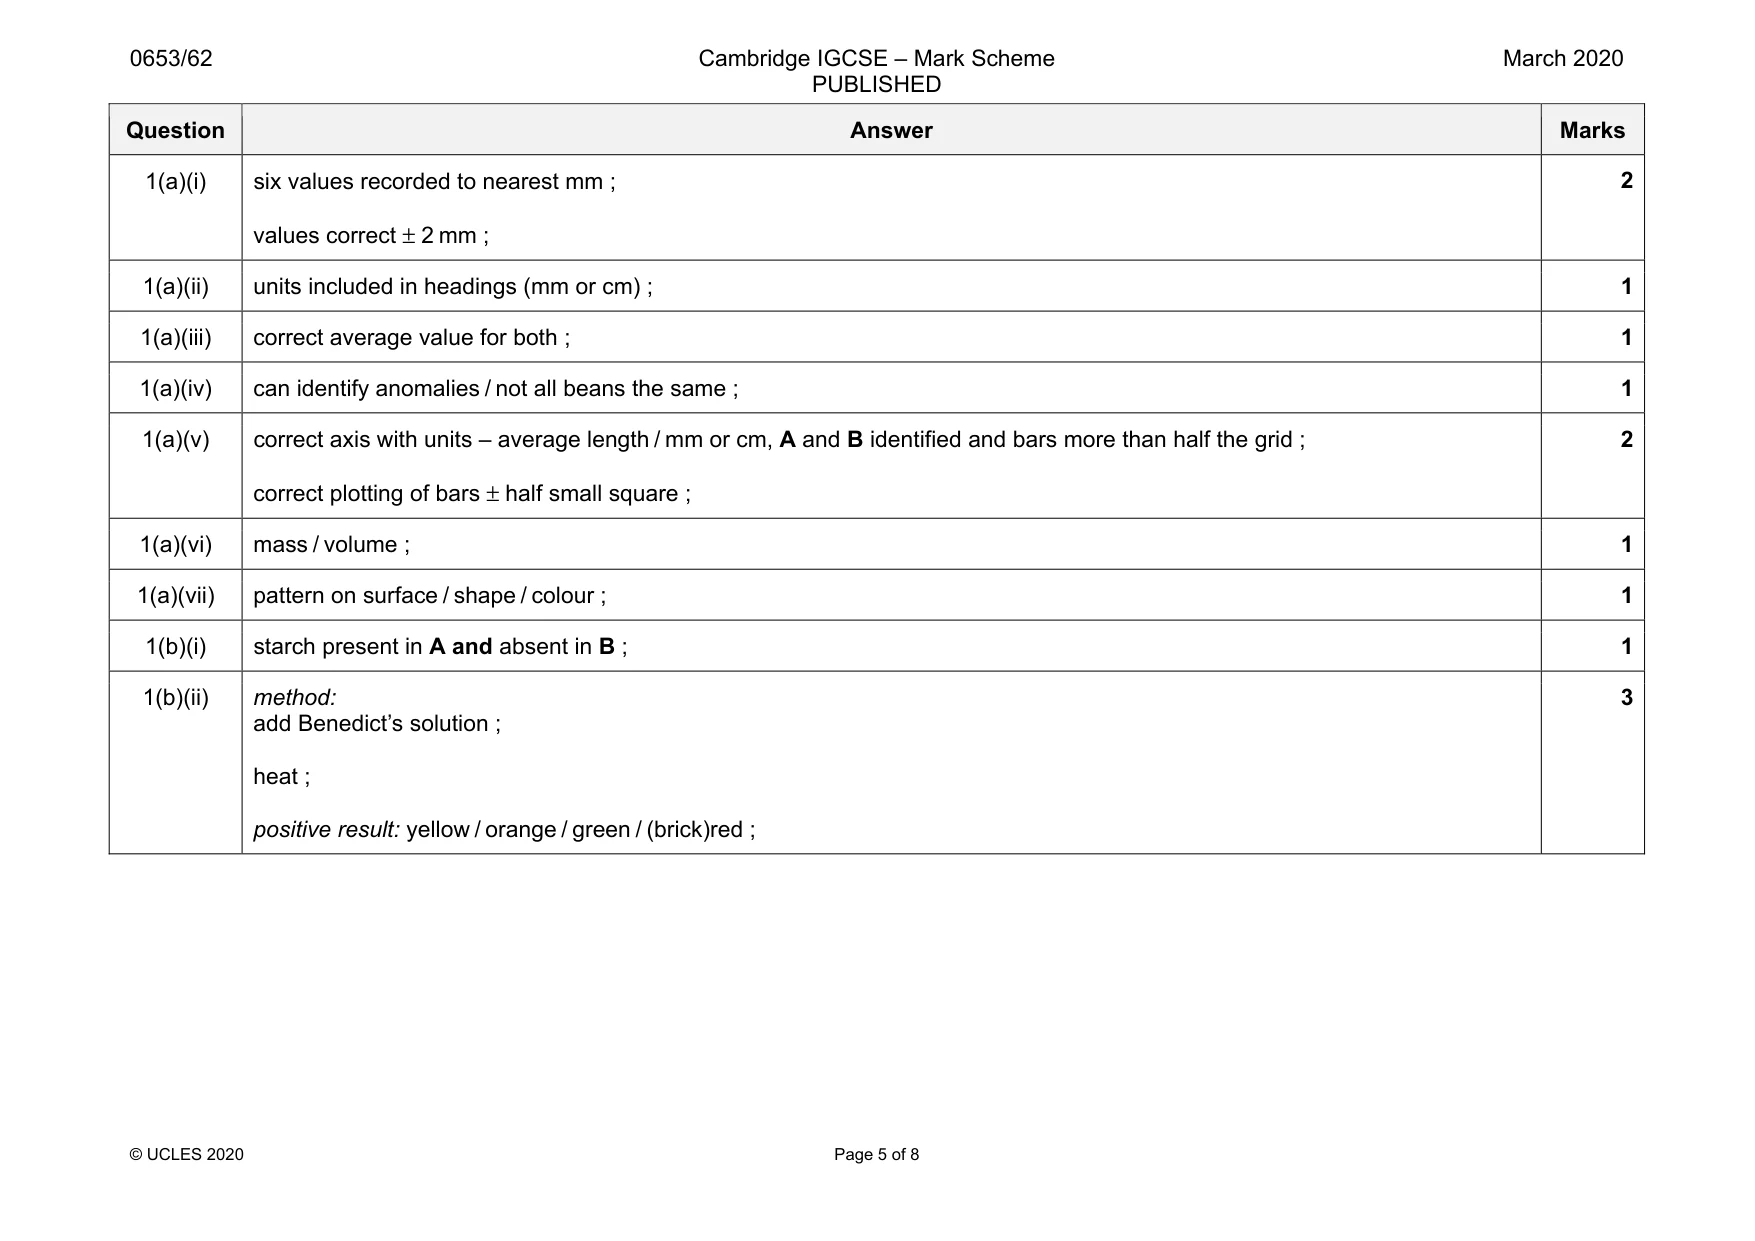
Mark scheme: 1(a)(i) six values recorded to nearest mm ; values correct ± 2 mm ; 1(a)(ii) units included in headings (mm or cm) ; 1 1(a)(iii) correct average value for both ; 1 1(a)(iv) can identify anomalies / not all beans the same ; 1 1(a)(v) correct axis with units – average length / mm or cm, A and B identified and bars more than half the grid ; correct plotting of bars ± half small square ; 2 1(a)(vi) mass / volume ; 1 1(a)(vii) pattern on surface / shape / colour ; 1 1(b)(i) starch present in A and absent in B ; 1 1(b)(ii) method: add Benedict’s solution ; heat ; positive result: yellow / orange / green / (brick)red ; 3
Q2 · A student investigates the reactivity of four metals G, H, J and L
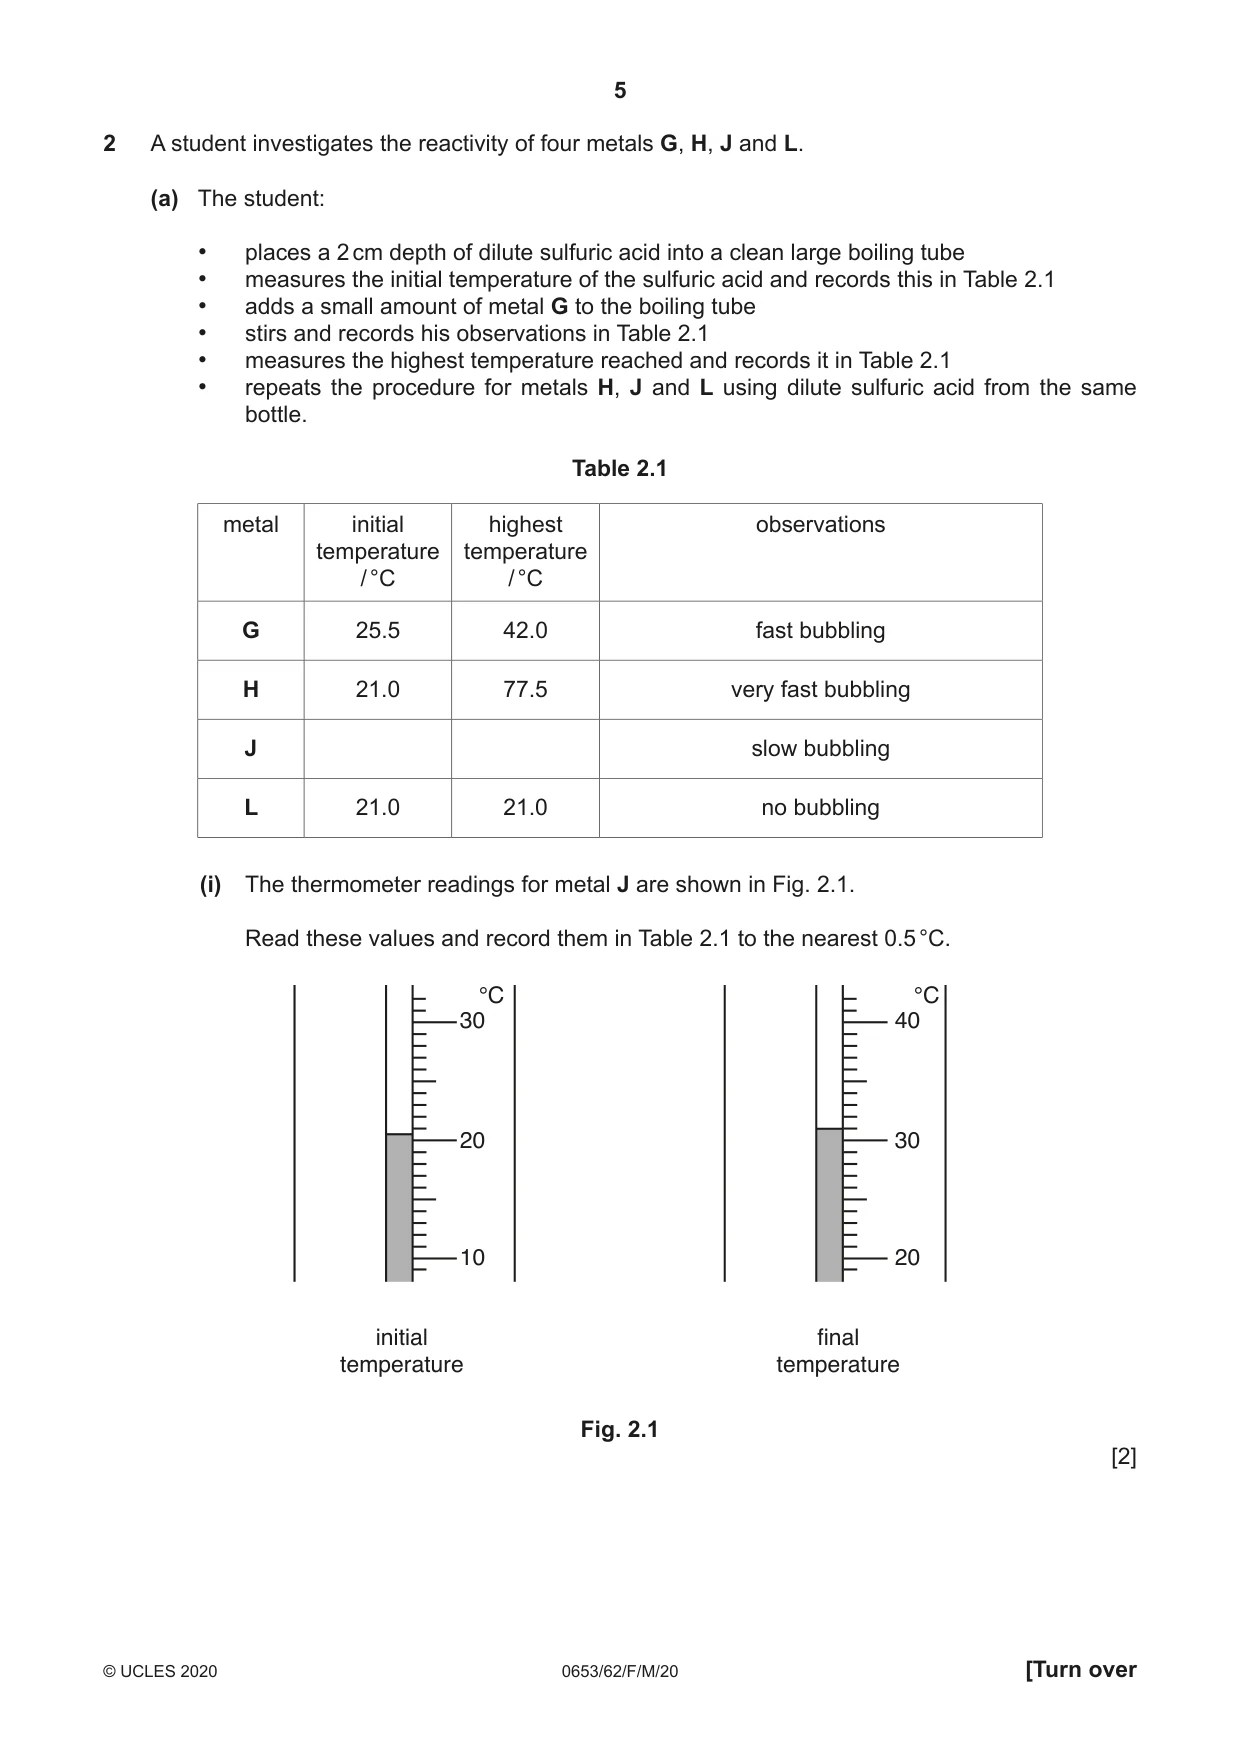
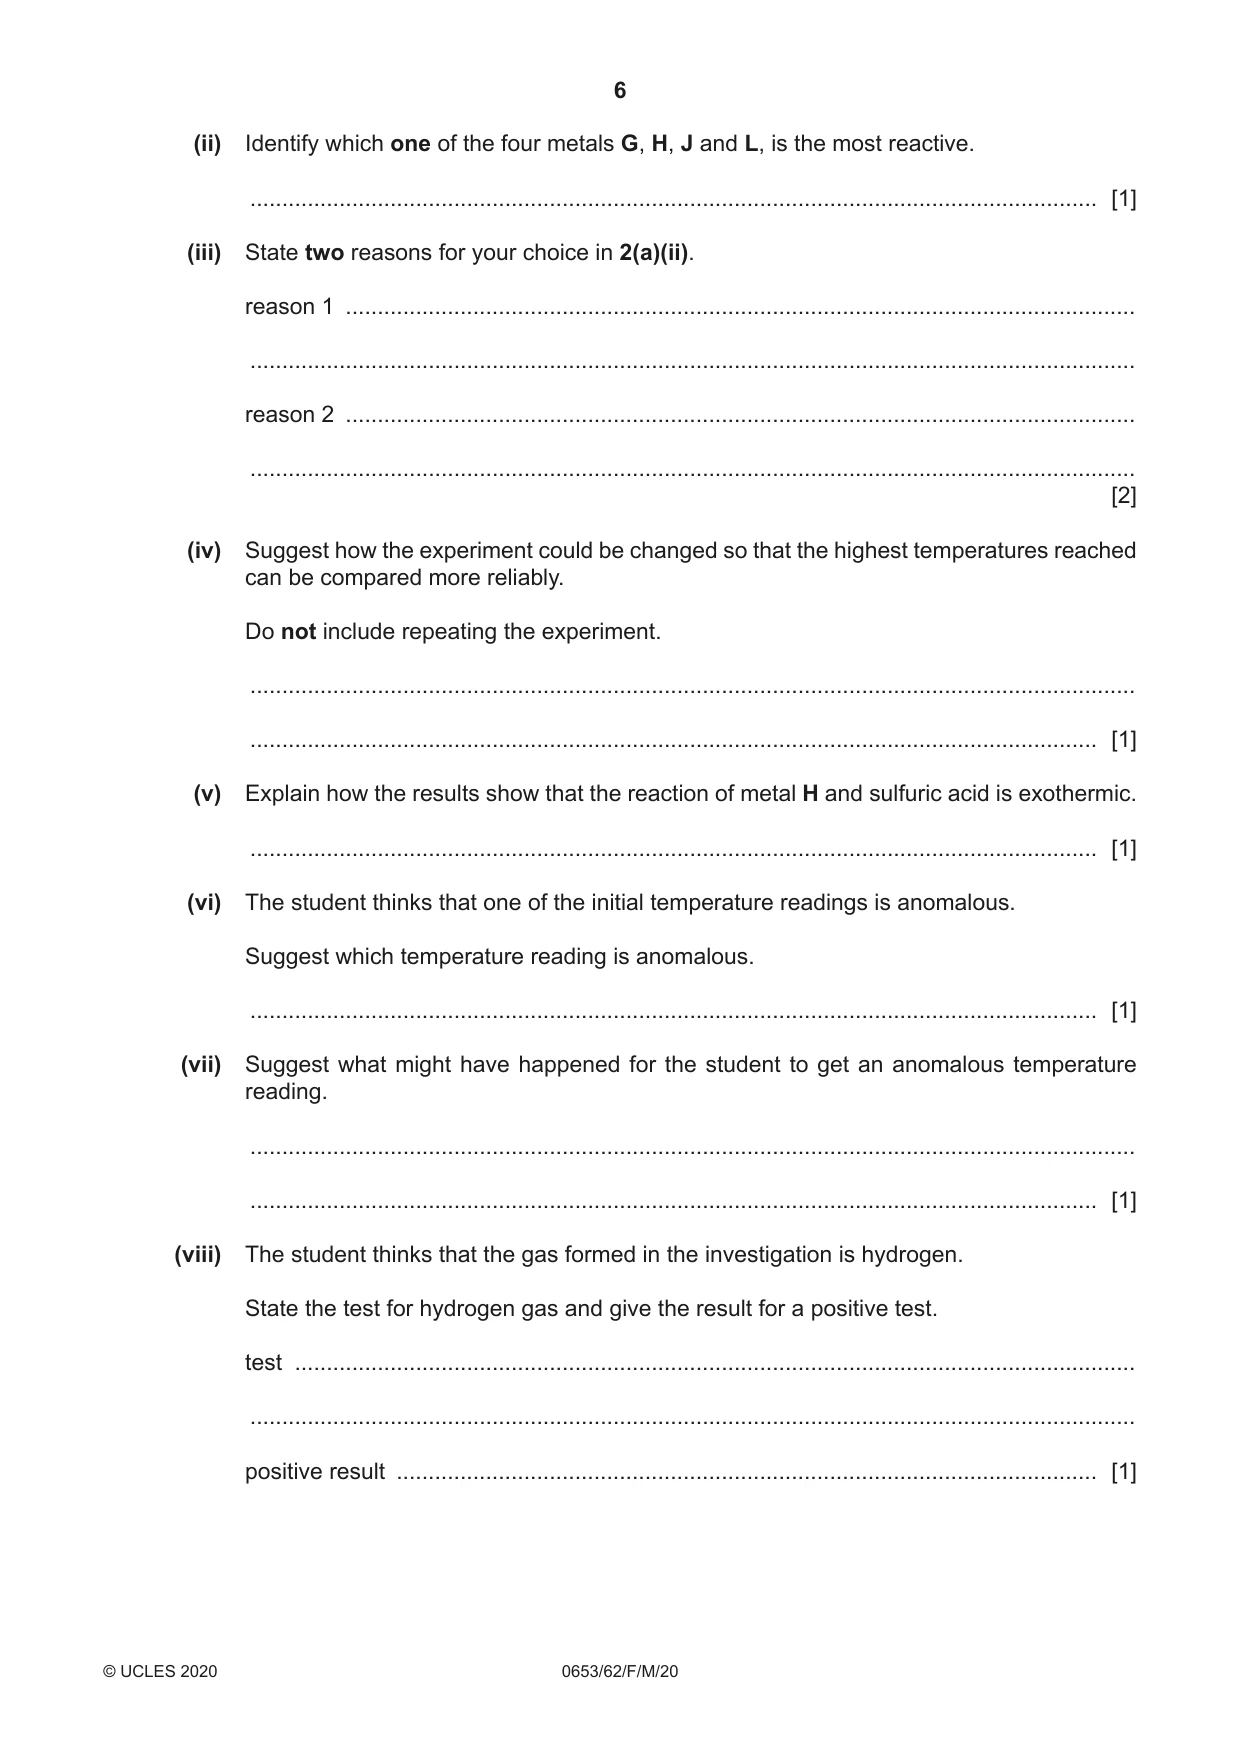
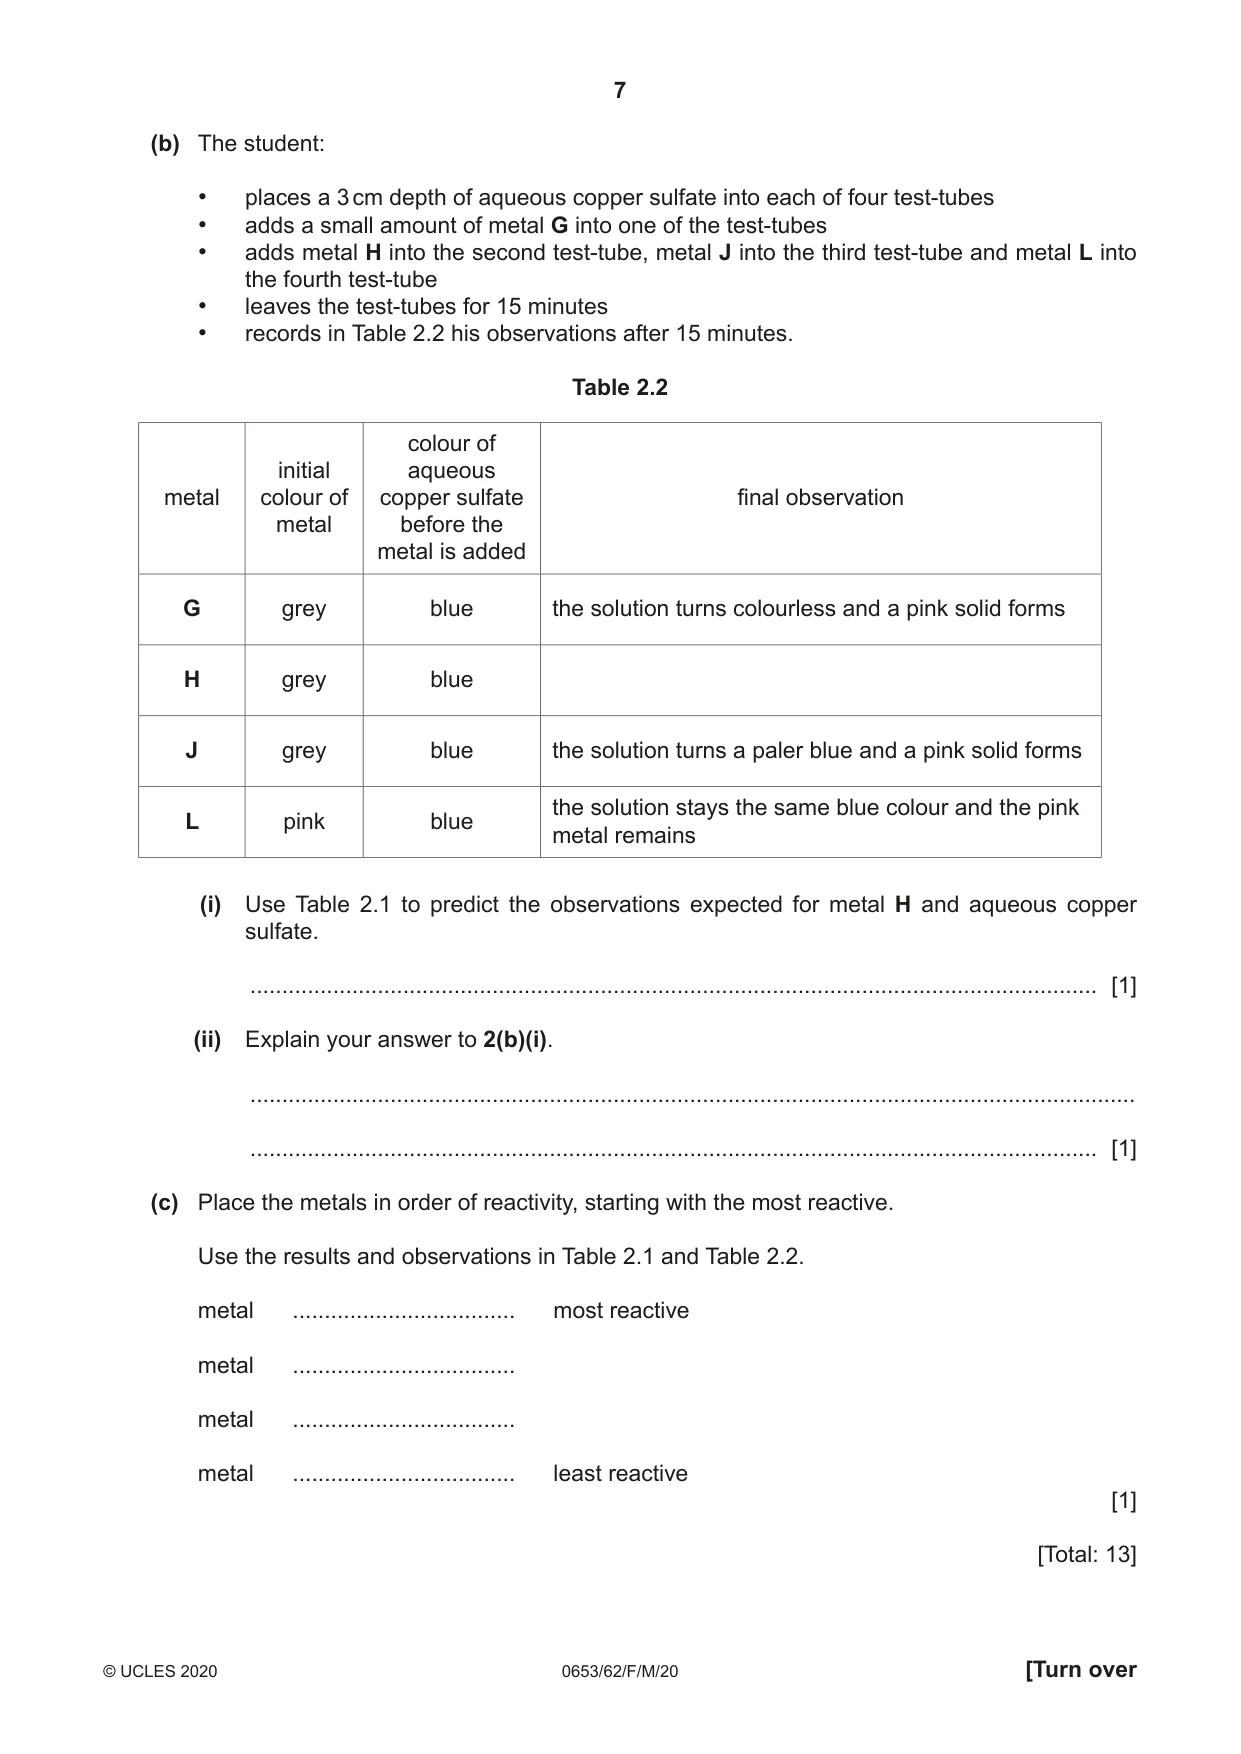
2 A student investigates the reactivity of four metals G, H, J and L. (a) The student: • places a 2 cm depth of dilute sulfuric acid into a clean large boiling tube • measures the initial temperature of the sulfuric acid and records this in Table 2.1 • adds a small amount of metal G to the boiling tube • stirs and records his observations in Table 2.1 • measures the highest temperature reached and records it in Table 2.1 • repeats the procedure for metals H, J and L using dilute sulfuric acid from the same bottle. Table 2.1 metal initial highest observations temperature temperature / °C / °C G 25.5 42.0 fast bubbling H 21.0 77.5 very fast bubbling J slow bubbling L 21.0 21.0 no bubbling (i) The thermometer readings for metal J are shown in Fig. 2.1. Read these values and record them in Table 2.1 to the nearest 0.5 °C. °C °C 30 40 20 30 10 20 initial final temperature temperature Fig. 2.1 [2] (ii) Identify which one of the four metals G, H, J and L, is the most reactive. ..................................................................................................................................... [1] (iii) State two reasons for your choice in 2(a)(ii). reason 1 ............................................................................................................................ ........................................................................................................................................... reason 2 ............................................................................................................................ ........................................................................................................................................... [2] (iv) Suggest how the experiment could be changed so that the highest temperatures reached can be compared more reliably. Do not include repeating the experiment. ........................................................................................................................................... ..................................................................................................................................... [1] (v) Explain how the results show that the reaction of metal H and sulfuric acid is exothermic. ..................................................................................................................................... [1] (vi) The student thinks that one of the initial temperature readings is anomalous. Suggest which temperature reading is anomalous. ..................................................................................................................................... [1] (vii) Suggest what might have happened for the student to get an anomalous temperature reading. ........................................................................................................................................... ..................................................................................................................................... [1] (viii) The student thinks that the gas formed in the investigation is hydrogen. State the test for hydrogen gas and give the result for a positive test. test .................................................................................................................................... ........................................................................................................................................... positive result .............................................................................................................. [1] (b) The student: • places a 3 cm depth of aqueous copper sulfate into each of four test‑tubes • adds a small amount of metal G into one of the test‑tubes • adds metal H into the second test‑tube, metal J into the third test‑tube and metal L into the fourth test‑tube • leaves the test‑tubes for 15 minutes • records in Table 2.2 his observations after 15 minutes. Table 2.2 colour of initial aqueous metal colour of copper sulfate final observation metal before the metal is added G grey blue the solution turns colourless and a pink solid forms H grey blue J grey blue the solution turns a paler blue and a pink solid forms the solution stays the same blue colour and the pink L pink blue metal remains (i) Use Table 2.1 to predict the observations expected for metal H and aqueous copper sulfate. ..................................................................................................................................... [1] (ii) Explain your answer to 2(b)(i). ........................................................................................................................................... ..................................................................................................................................... [1] (c) Place the metals in order of reactivity, starting with the most reactive. Use the results and observations in Table 2.1 and Table 2.2. metal ................................... most reactive metal ................................... metal ................................... metal ................................... least reactive [1] [Total: 13]
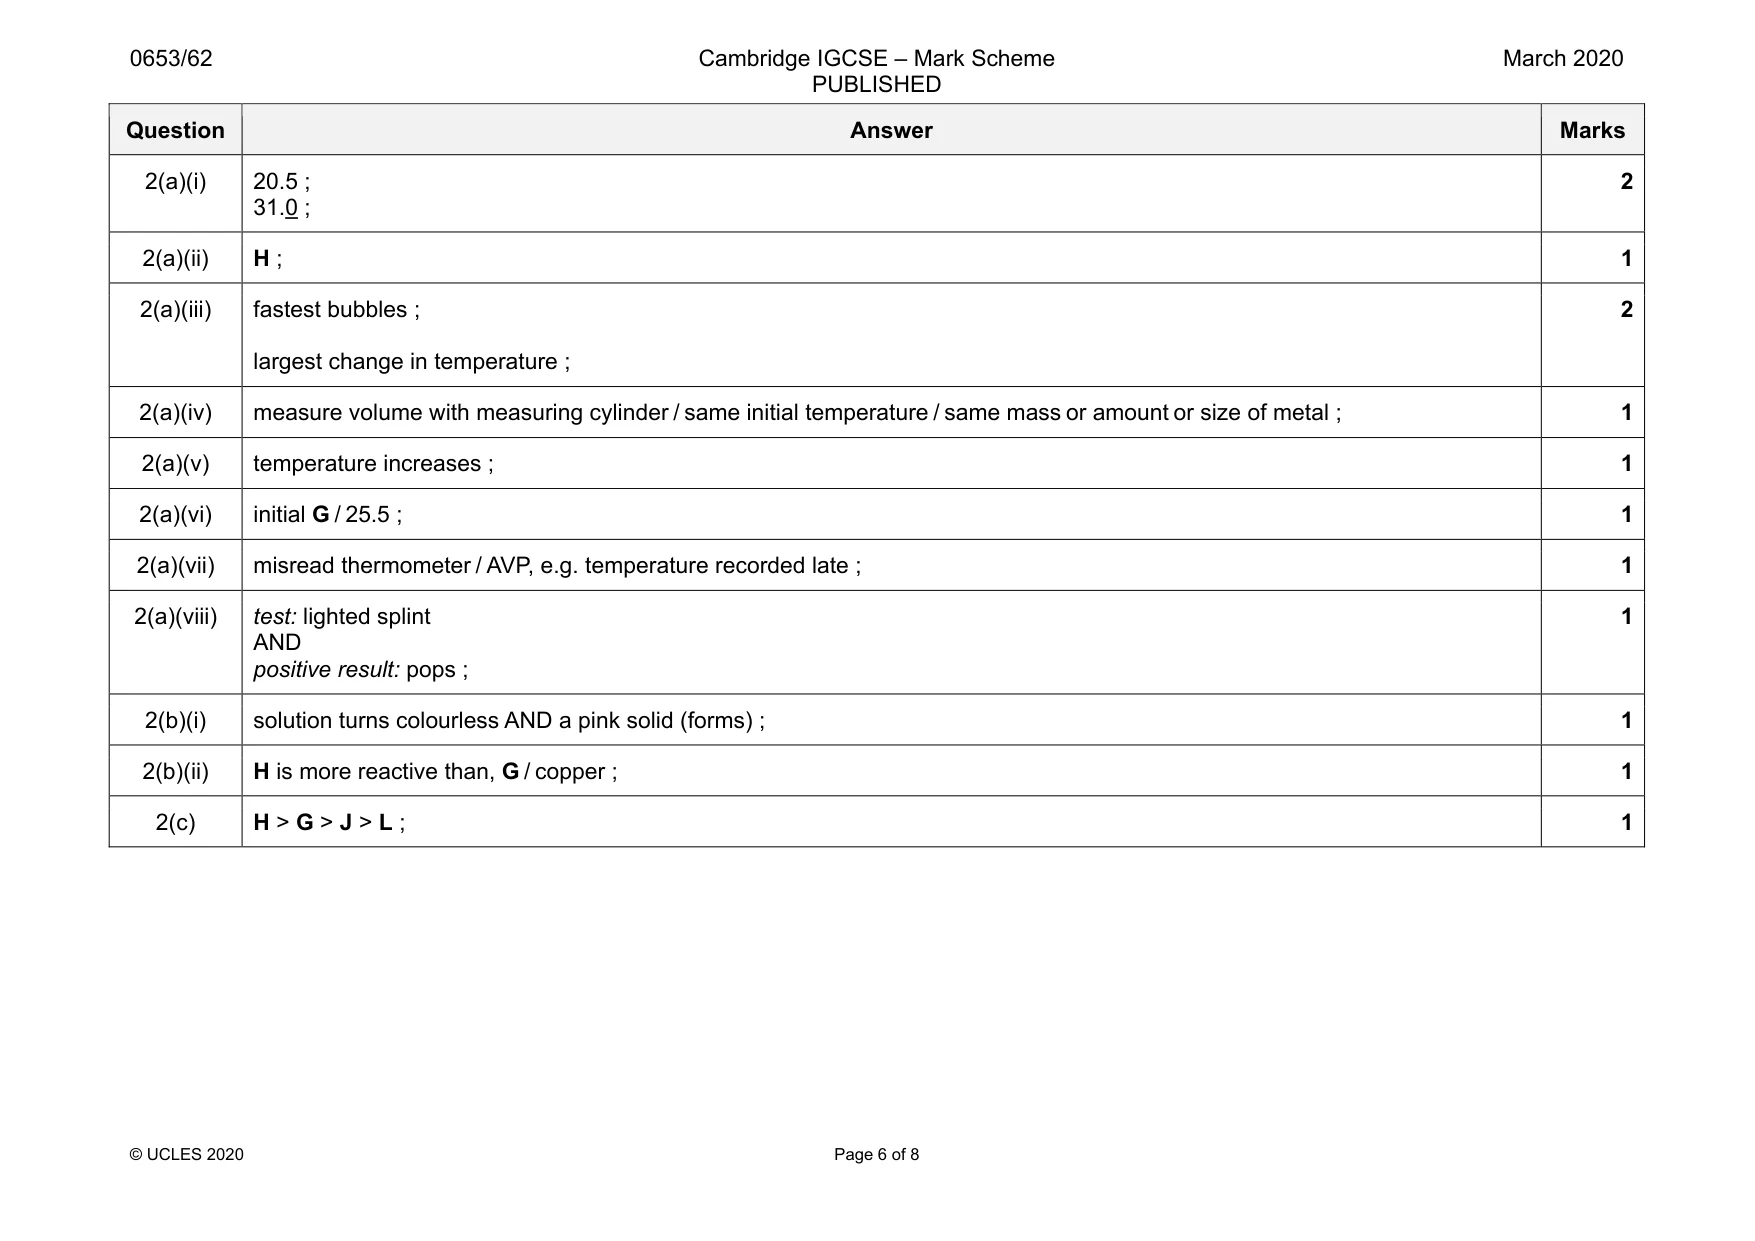
Mark scheme: 2(a)(i) 20.5 ; 31.0 ; 2 2(a)(ii) H ; 1 2(a)(iii) fastest bubbles ; largest change in temperature ; 2 2(a)(iv) measure volume with measuring cylinder / same initial temperature / same mass or amount or size of metal ; 1 2(a)(v) temperature increases ; 1 2(a)(vi) initial G / 25.5 ; 1 2(a)(vii) misread thermometer / AVP, e.g. temperature recorded late ; 1 2(a)(viii) test: lighted splint AND positive result: pops ; 1 2(b)(i) solution turns colourless AND a pink solid (forms) ; 1 2(b)(ii) H is more reactive than, G / copper ; 1 2(c) H > G > J > L ; 1
Q3 · A student determines the period T of a pendulum
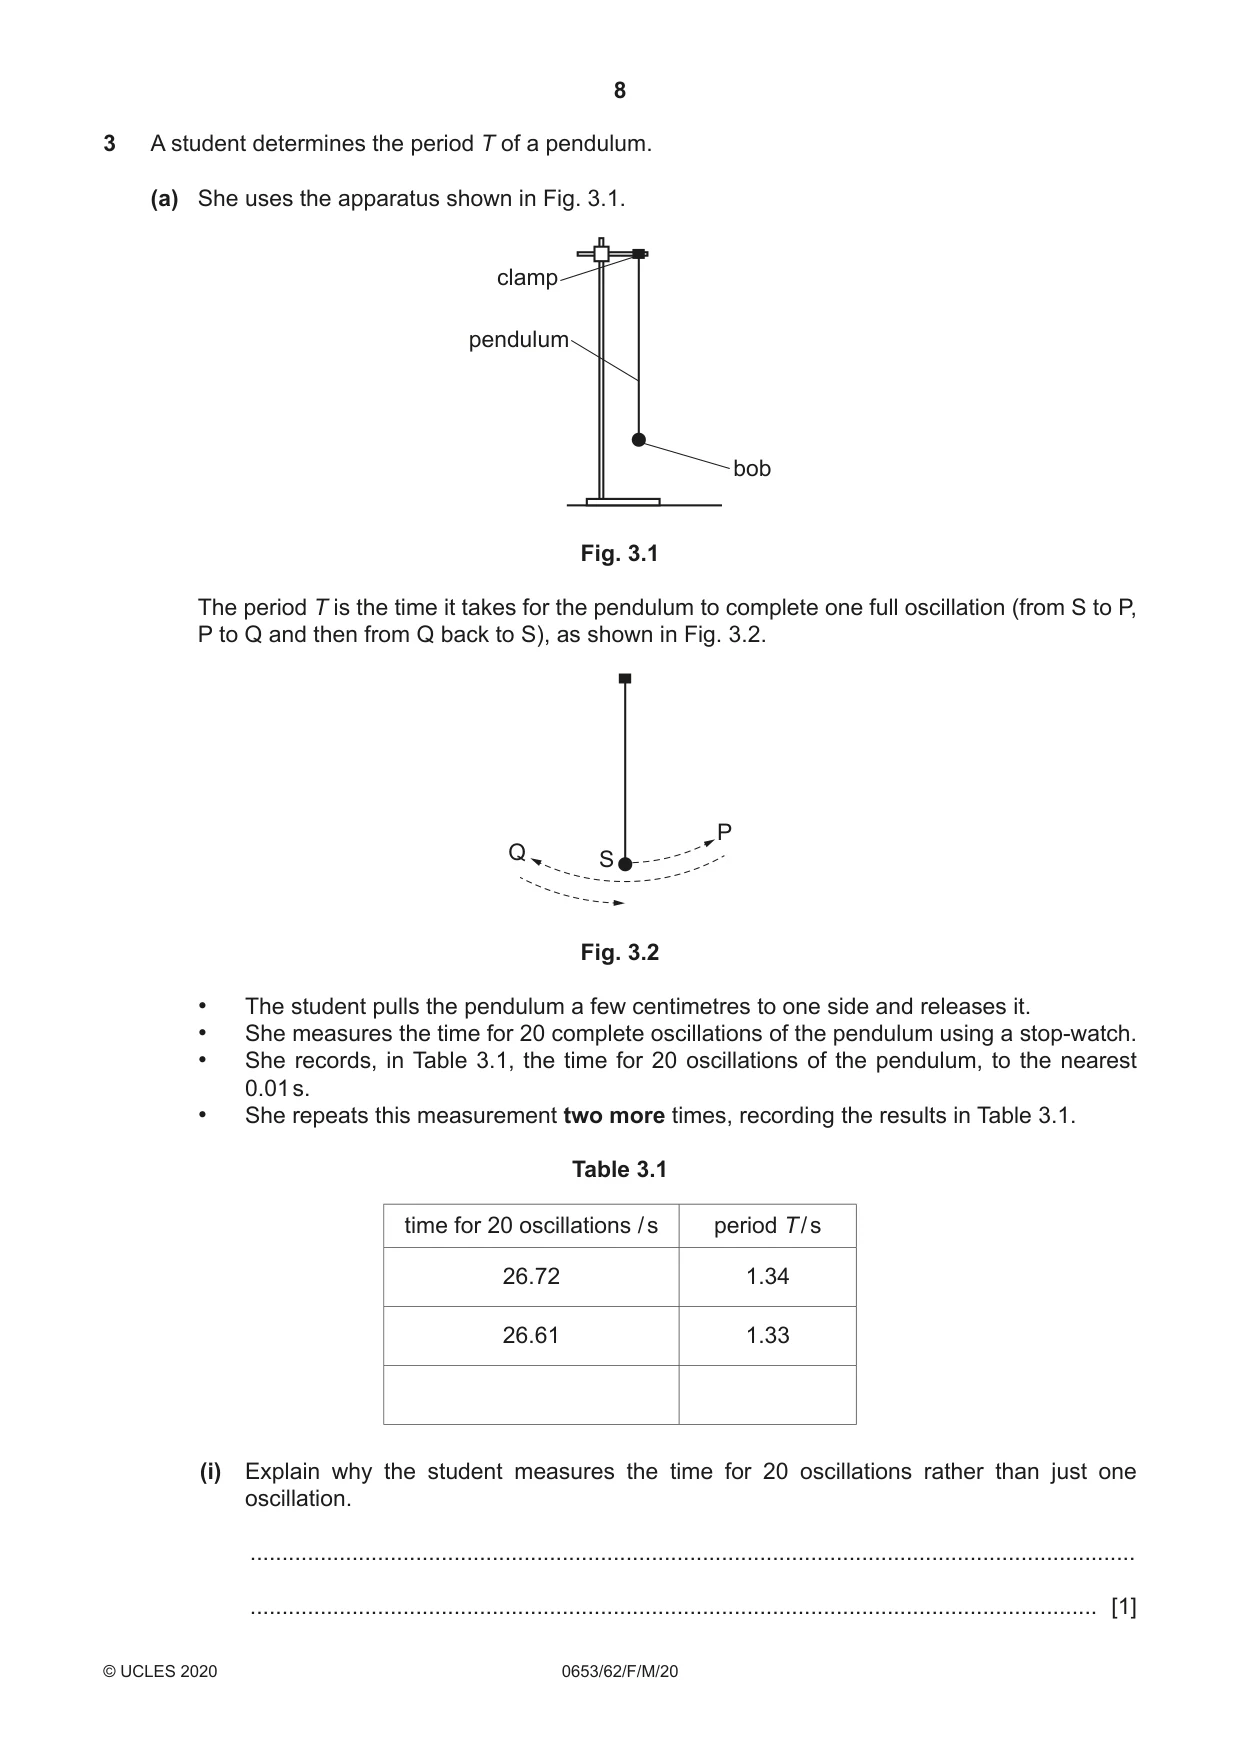
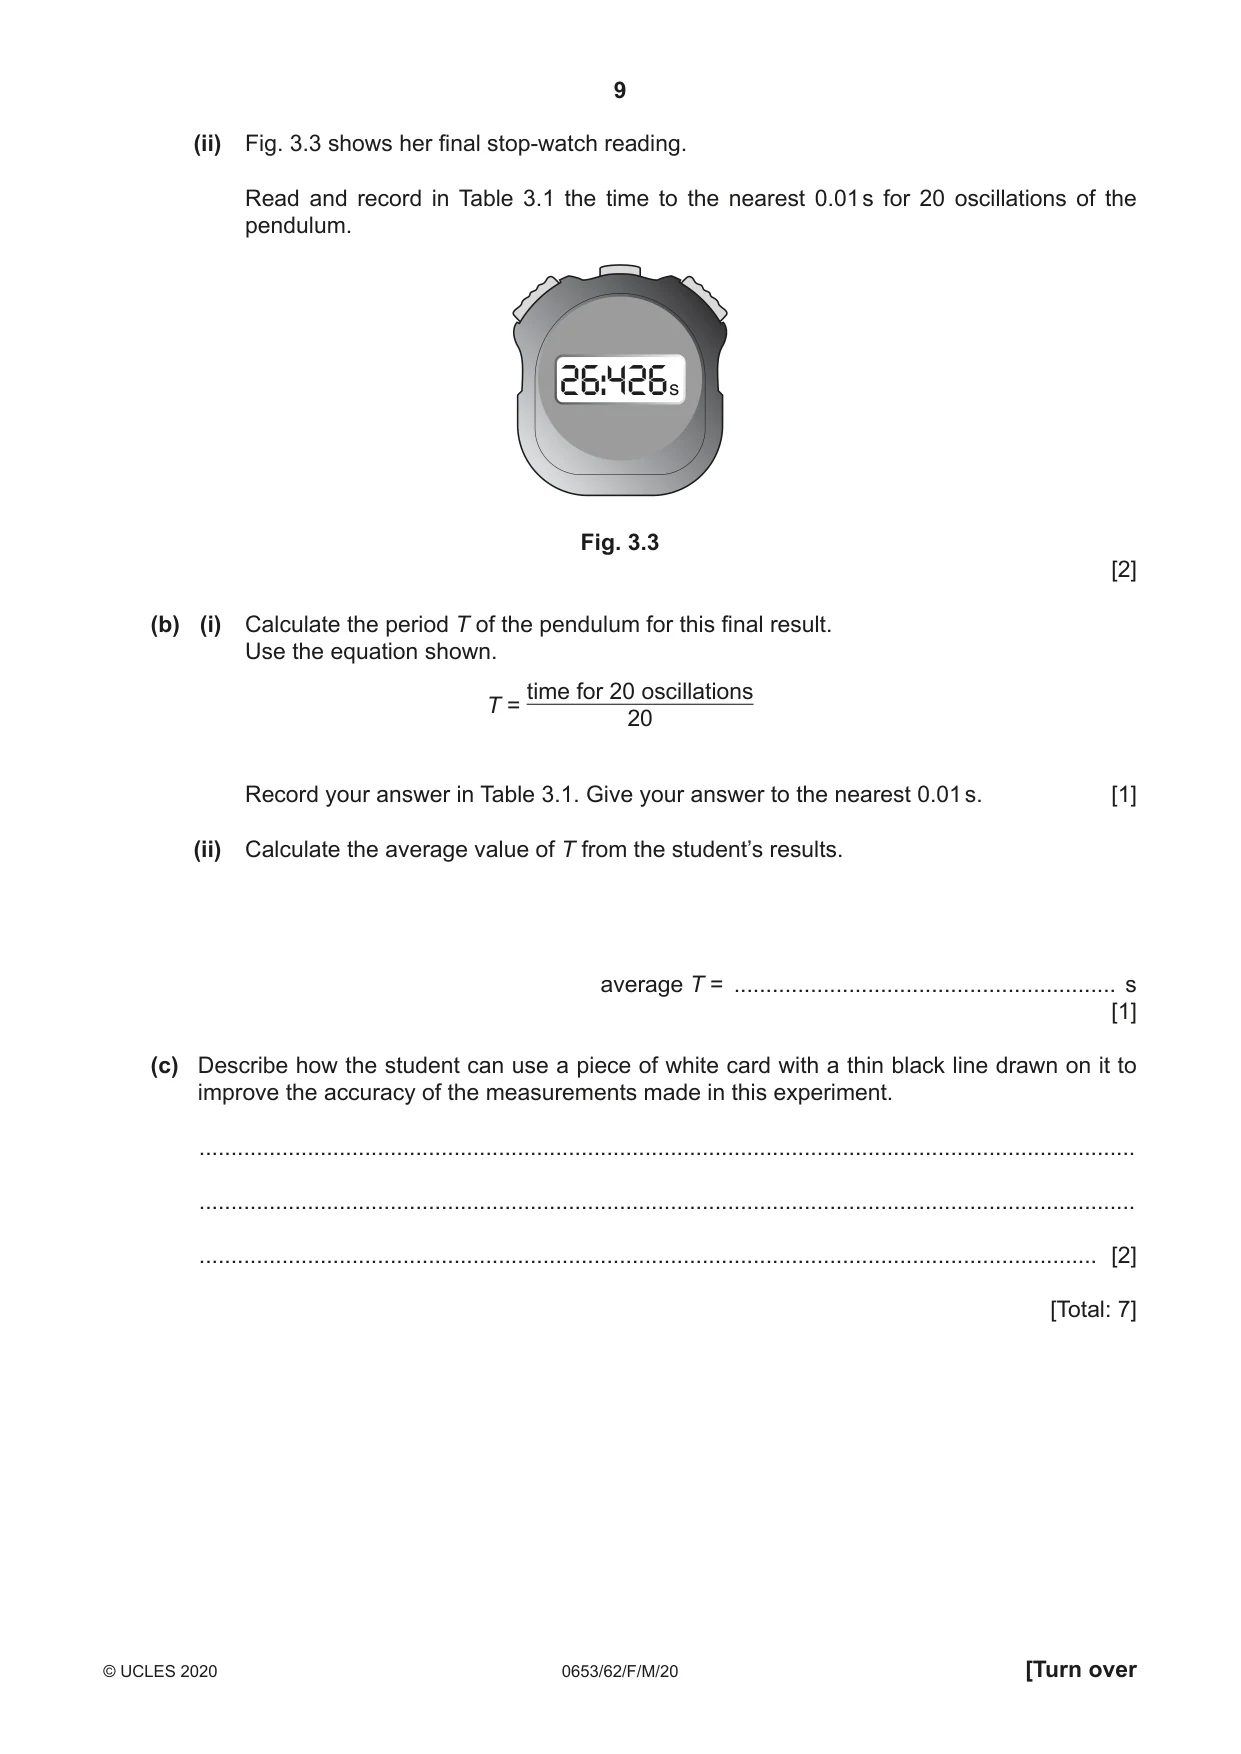
3 A student determines the period T of a pendulum. (a) She uses the apparatus shown in Fig. 3.1. clamp pendulum bob Fig. 3.1 The period T is the time it takes for the pendulum to complete one full oscillation (from S to P, P to Q and then from Q back to S), as shown in Fig. 3.2. P Q S Fig. 3.2 • The student pulls the pendulum a few centimetres to one side and releases it. • She measures the time for 20 complete oscillations of the pendulum using a stop‑watch. • She records, in Table 3.1, the time for 20 oscillations of the pendulum, to the nearest 0.01 s. • She repeats this measurement two more times, recording the results in Table 3.1. Table 3.1 time for 20 oscillations / s period T / s 26.72 1.34 26.61 1.33 (i) Explain why the student measures the time for 20 oscillations rather than just one oscillation. ........................................................................................................................................... ..................................................................................................................................... [1] (ii) Fig. 3.3 shows her final stop‑watch reading. Read and record in Table 3.1 the time to the nearest 0.01 s for 20 oscillations of the pendulum. 26:426 Fig. 3.3 [2] (b) (i) Calculate the period T of the pendulum for this final result. Use the equation shown. time for 20 oscillations T = 20 Record your answer in Table 3.1. Give your answer to the nearest 0.01 s. [1] (ii) Calculate the average value of T from the student’s results. average T = ............................................................ s [1] (c) Describe how the student can use a piece of white card with a thin black line drawn on it to improve the accuracy of the measurements made in this experiment. ................................................................................................................................................... ................................................................................................................................................... ............................................................................................................................................. [2] [Total: 7]
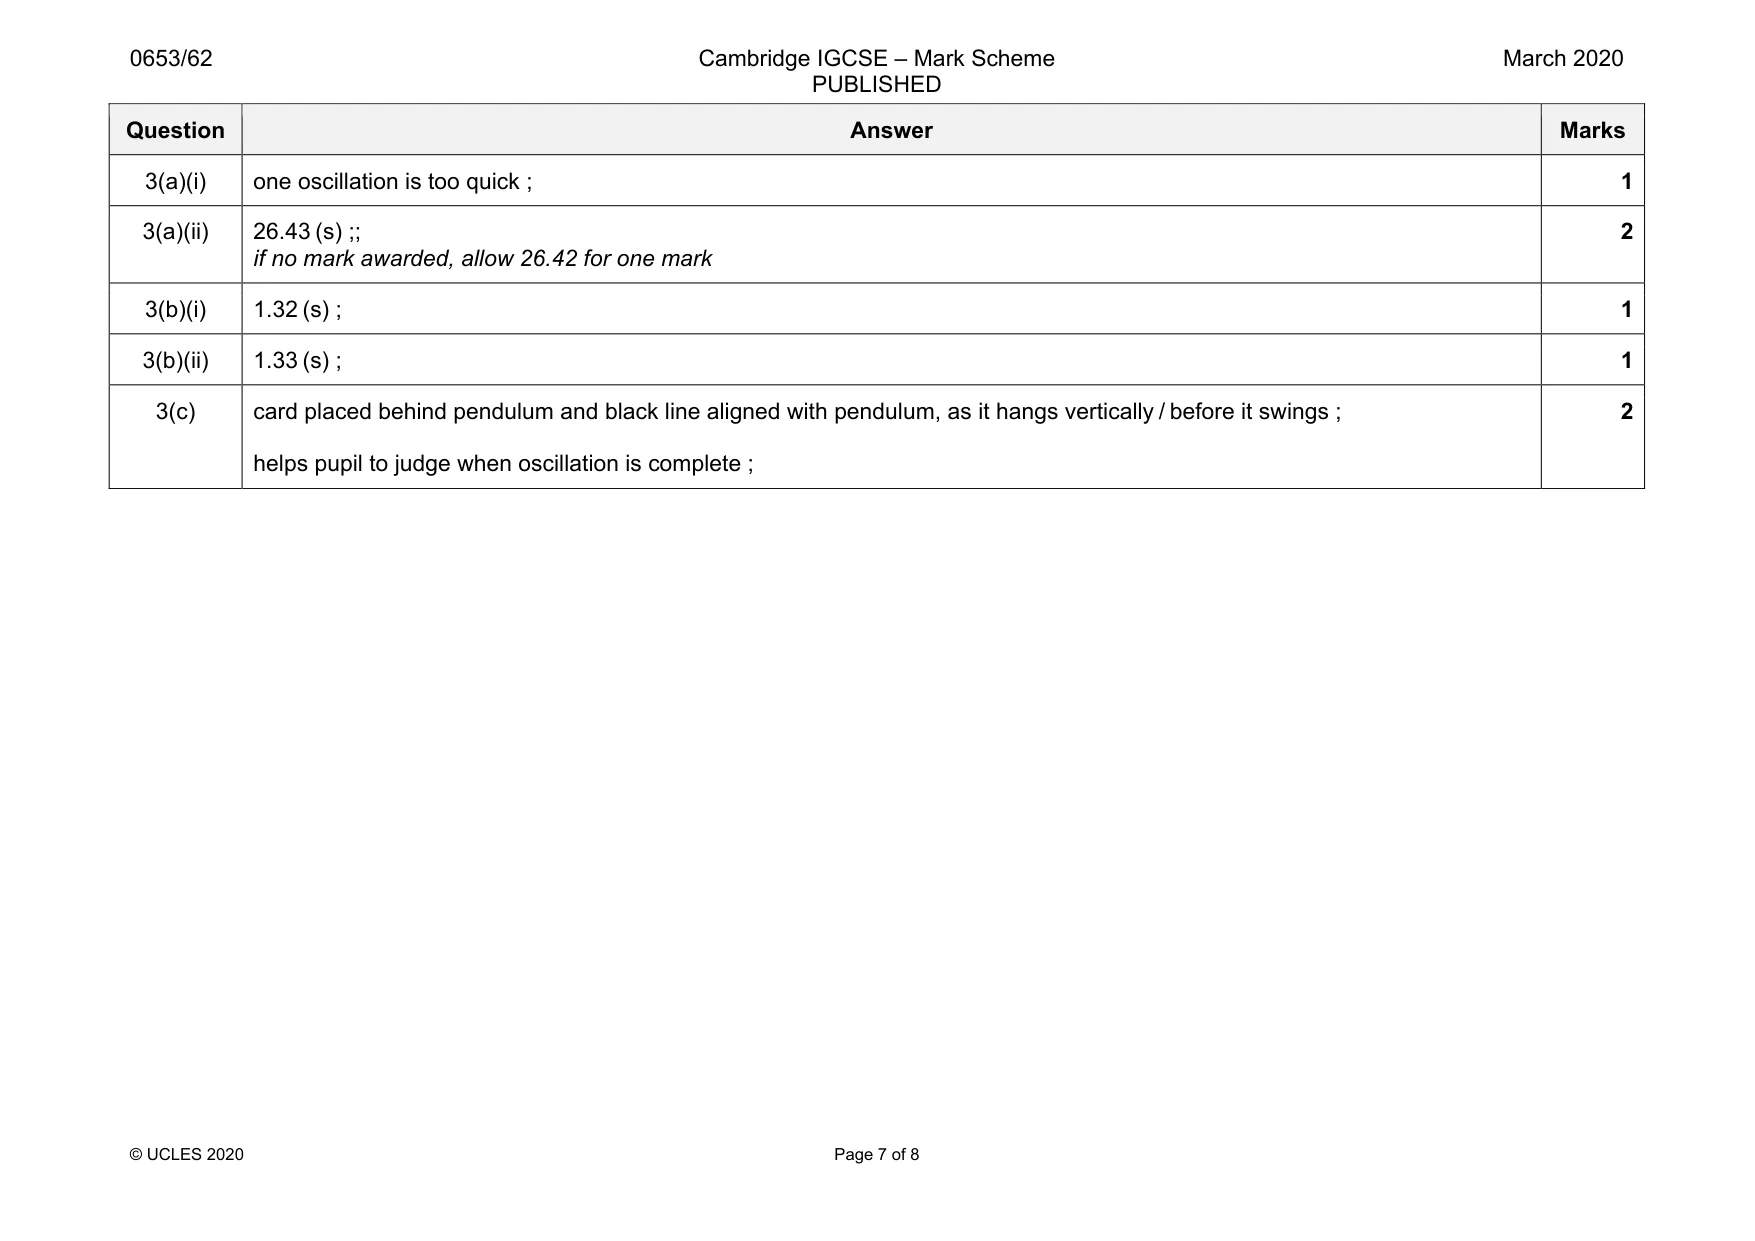
Mark scheme: 3(a)(i) one oscillation is too quick ; 1 3(a)(ii) 26.43 (s) ;; if no mark awarded, allow 26.42 for one mark 2 3(b)(i) 1.32 (s) ; 1 3(b)(ii) 1.33 (s) ; 1 3(c) card placed behind pendulum and black line aligned with pendulum, as it hangs vertically / before it swings ; helps pupil to judge when oscillation is complete ; 2
More questions on Physical quantities and measurement techniques
Q4 · A beam that is balanced by placing masses on opposite sides of a central pivot
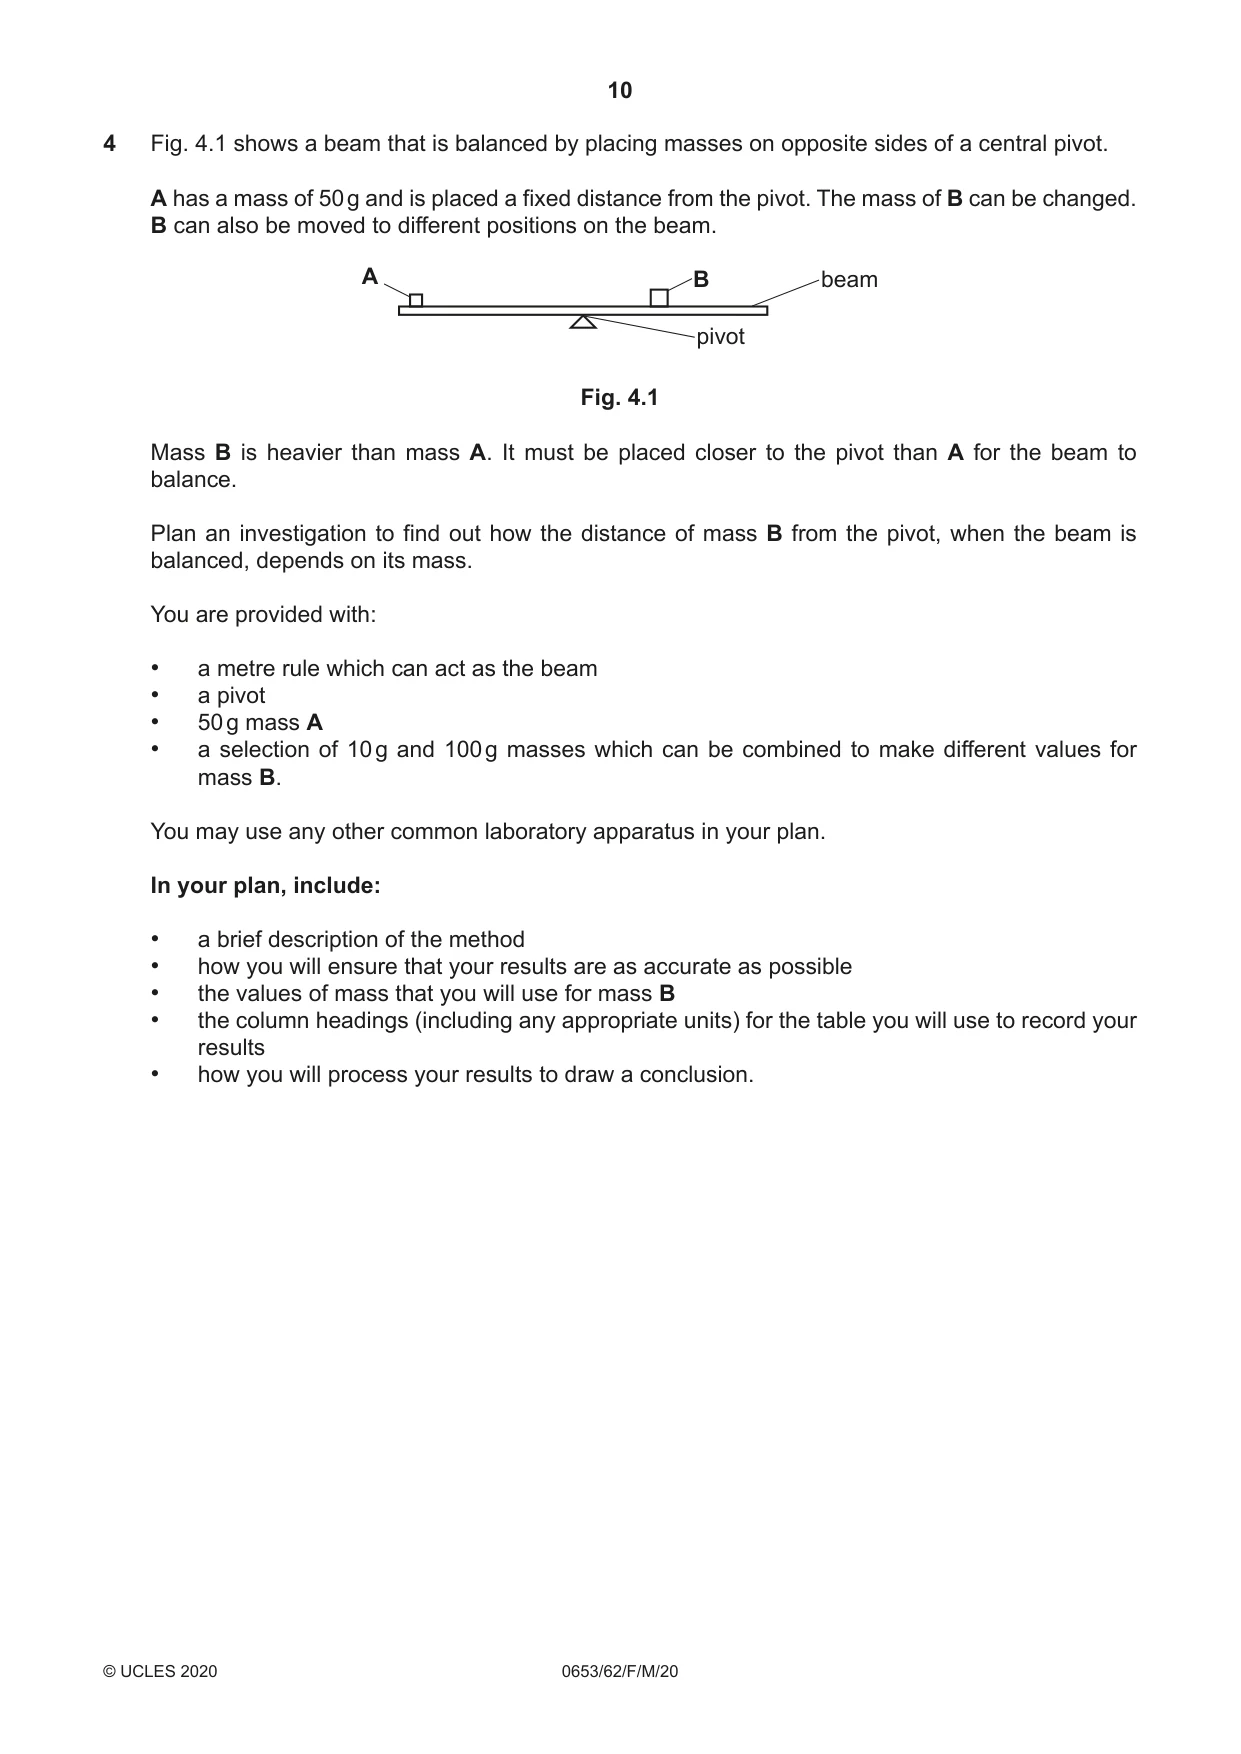
4 Fig. 4.1 shows a beam that is balanced by placing masses on opposite sides of a central pivot. A has a mass of 50 g and is placed a fixed distance from the pivot. The mass of B can be changed. B can also be moved to different positions on the beam. A B beam pivot Fig. 4.1 Mass B is heavier than mass A. It must be placed closer to the pivot than A for the beam to balance. Plan an investigation to find out how the distance of mass B from the pivot, when the beam is balanced, depends on its mass. You are provided with: • a metre rule which can act as the beam • a pivot • 50 g mass A • a selection of 10 g and 100 g masses which can be combined to make different values for mass B. You may use any other common laboratory apparatus in your plan. In your plan, include: • a brief description of the method • how you will ensure that your results are as accurate as possible • the values of mass that you will use for mass B • the column headings (including any appropriate units) for the table you will use to record your results • how you will process your results to draw a conclusion. .......................................................................................................................................................... .......................................................................................................................................................... .......................................................................................................................................................... .......................................................................................................................................................... .......................................................................................................................................................... .......................................................................................................................................................... .......................................................................................................................................................... .......................................................................................................................................................... .......................................................................................................................................................... .......................................................................................................................................................... .......................................................................................................................................................... .......................................................................................................................................................... .......................................................................................................................................................... .................................................................................................................................................... [7]
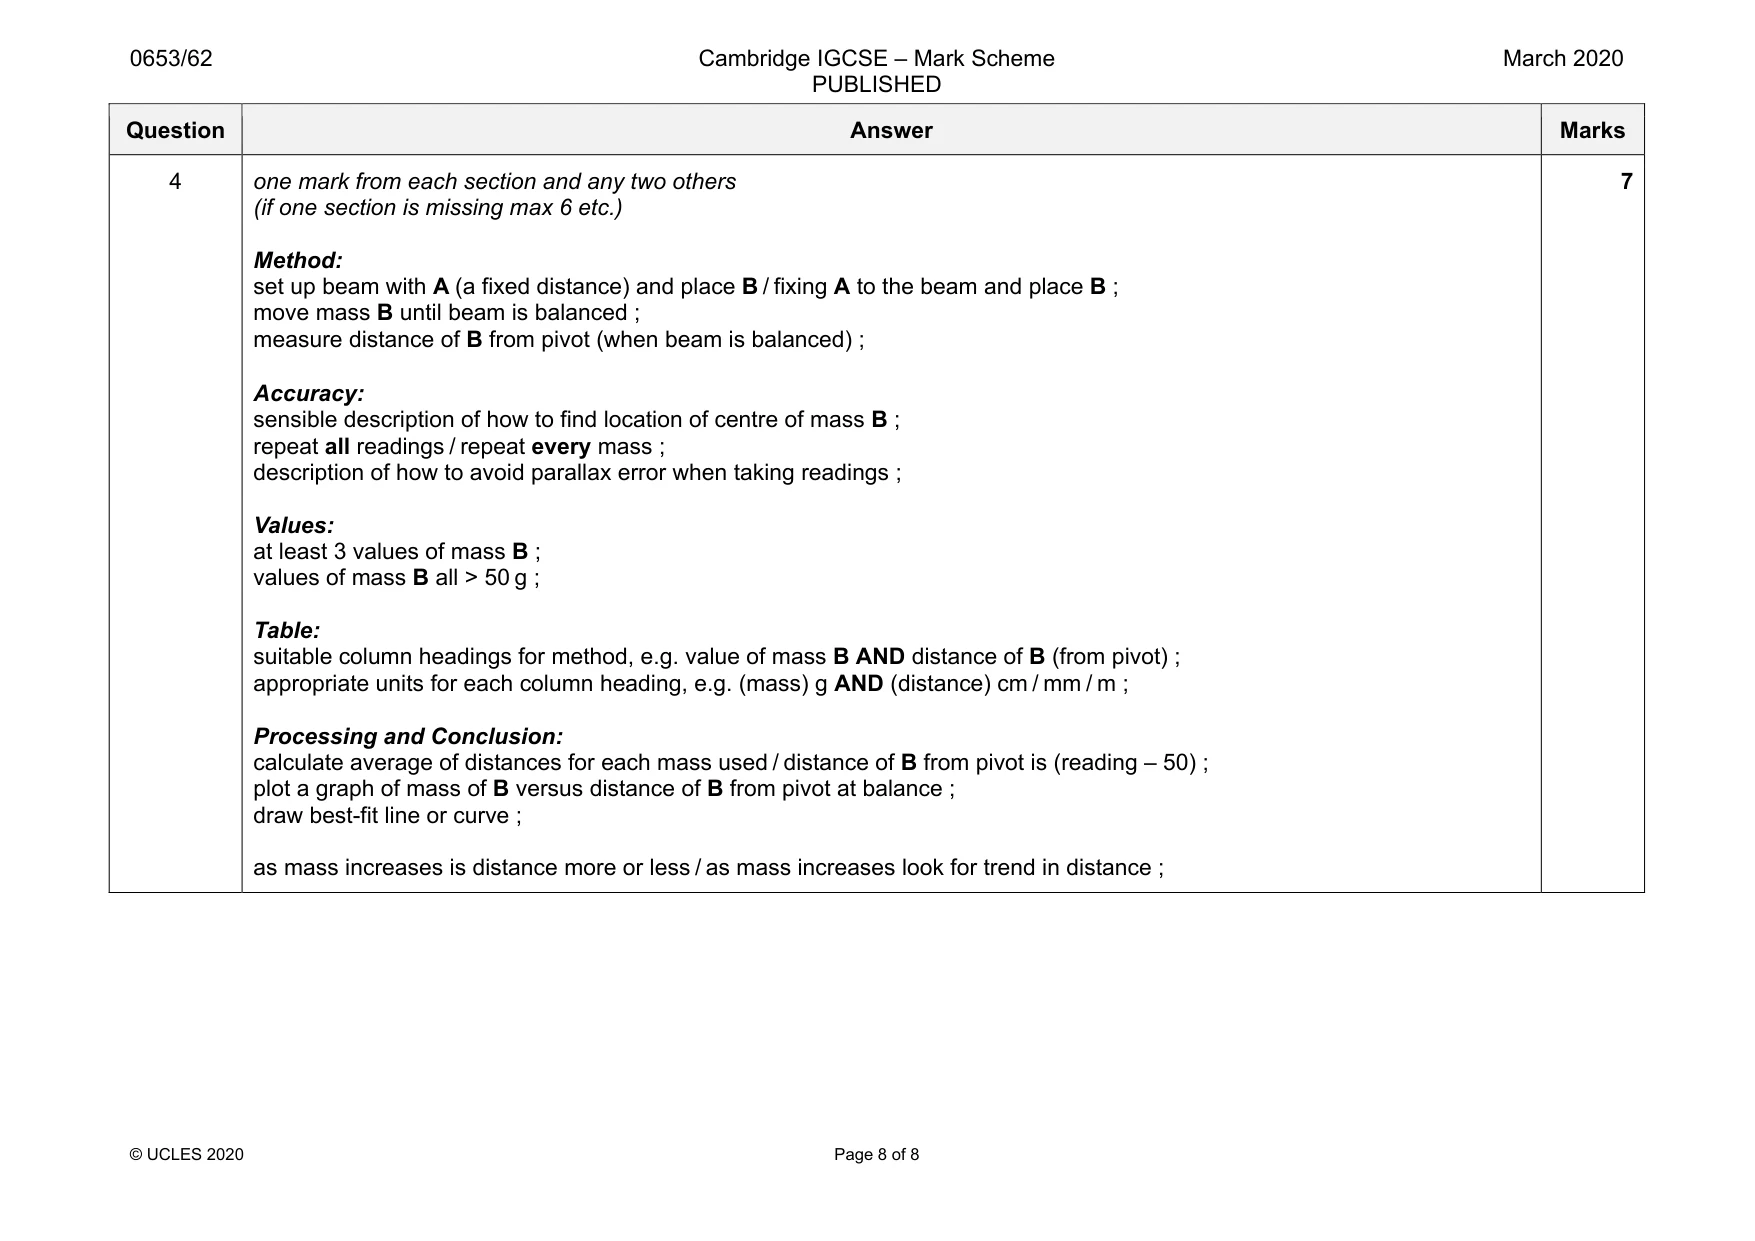
Mark scheme: 4 one mark from each section and any two others (if one section is missing max 6 etc.) Method: set up beam with A (a fixed distance) and place B / fixing A to the beam and place B ; move mass B until beam is balanced ; measure distance of B from pivot (when beam is balanced) ; Accuracy: sensible description of how to find location of centre of mass B ; repeat all readings / repeat every mass ; description of how to avoid parallax error when taking readings ; Values: at least 3 values of mass B ; values of mass B all > 50 g ; Table: suitable column headings for method, e.g. value of mass B AND distance of B (from pivot) ; appropriate units for each column heading, e.g. (mass) g AND (distance) cm / mm / m ; Processing and Conclusion: calculate average of distances for each mass used / distance of B from pivot is (reading – 50) ; plot a graph of mass of B versus distance of B from pivot at balance ; draw best-fit line or curve ; as mass increases is distance more or less / as mass increases look for trend in distance ; 7
What was in this paper
The subtopics covered by these 4 questions, and how many questions each got. Open one in a new tab to see every Cambridge question on it.
What you needed in this session
Cambridge’s own grade thresholds for 2020 Feb/March, Paper 6 · Variant 2. A higher threshold means an easier paper — the bar moves with how the cohort did.